advances in engineering...
TRANSCRIPT
SUMMER 2012 1
SUMMER 2012
Advances in Engineering Education
SENSE IT: Teaching STEM principles to middle and high school students through the design, construction and deployment of water quality sensors
LIESL HOTALING
College of Marine Science
University of South Florida
St. Petersburg, FL
SUSAN LOWES
Teachers College
Columbia University
New York, NY
RUSTAM STOLKIN
University of Birmingham
Birmingham, UK
PEIYI LIN
Teachers College
Columbia University
New York, NY
JAMES BONNER
WILLIAM KIRKEY
and
TEMITOPE OJO
Clarkson University
Potsdam, NY
ABSTRACT
This paper describes the structure and impact of an NSF-funded ITEST project designed to enrich
science, technology, engineering, and mathematics (STEM) education using educational modules
that teach students to construct, program, and test a series of sensors used to monitor water qual-
ity. During the two years of the SENSE IT project, over 30 teachers across New York State were
provided with equipment and professional development, and then implemented the modules in their
classrooms with over 1,700 middle and high school students. Project evaluation results indicate that
the curriculum was well received by teachers and students, could be integrated into several different
subject areas and types of courses, and was effective for a wide range of students.

2 SUMMER 2012
ADVANCES IN ENGINEERING EDUCATION
SENSE IT: Teaching STEM principles to middle and high school students through
the design, construction and deployment of water quality sensors
Key Words: STEM education, SENSE IT, water quality
INTRODUCTION
This paper describes the development and implementation of SENSE IT (Student Enabled Net-
work of Sensors for the Environment using Innovative Technology, http://senseit.org), a carefully
scaffolded set of curriculum modules tied to the New York State and national standards in science,
math, and technology, which integrate fundamental STEM principles while at the same time introduc-
ing students to the fi eld of sensors and sensor networks in the context of assessing water quality.
Over the course of two years, SENSE IT was implemented by over 30 teachers and 1,700 students
in schools in three regions in New York State (Potsdam, Troy, and Beacon) chosen to represent
three school environments—rural, urban, and suburban—along New York State’s two major rivers,
the Hudson and St. Lawrence.
Developing a sensor network for environmental monitoring creates a broad technology project
which can readily provide a motivating context for a variety of science, math and pre-engineering
classroom curricula. Sensors and sensor networks involve an information fl ow of the sensed quan-
tities from the natural environment through the physics of the transducer and the electric circuit
in which it is embedded, to a computer, to programs for data gathering and analysis and IT tools
for data sharing, storage and display. Using SENSE IT materials, students build, calibrate and test a
set of sensors and circuits in order to measure a variety of water quality parameters (temperature,
conductivity, turbidity and depth). To build and understand their sensors, students must use a wide
range of core knowledge of mathematics and physical science, as well as learn practical hands-on
technology skills such as soldering and debugging circuits. Students then interface their sensors
with computers, write programs to gather raw signals, implement calibration curves, and perform
data manipulation and data logging. In later modules, students program their own communications
protocols for wireless transmission of the sensor data and connect their computerized sensor stations
together to form a distributed wireless sensor network (Hotaling et al, 2011). Additional modules
explore the use and implications of this technology for biosciences and environmental research. All
of these stages require mathematical reasoning consistent with those typically addressed at the
high school level.
The set of SENSE IT modules gives students an opportunity to acquire and then use STEM skills
while at the same time providing a real world application of science (particularly environmental
science), technology (pre-engineering and computing) and mathematics, all tied in a holistic way
within the overarching theme of water quality. The project’s overarching goals were:

SUMMER 2012 3
ADVANCES IN ENGINEERING EDUCATION
SENSE IT: Teaching STEM principles to middle and high school students
through the design, construction and deployment of water quality sensors
• To develop a sensor technologies curriculum for the high school classroom.
• To use environmental sensors to teach technology, engineering, mathematics, science, and
critical workforce skills.
• To encourage learners to look at a local problem and local data with a global perspective.
• To promote awareness of sensor network-related careers and opportunities among high school
teachers, students and guidance counselors.
In what follows, we will fi rst address the question of why sensors are an excellent vehicle for
such a curriculum, describe the curriculum and its participants in some detail, and then examine its
impact on the students in terms of some of the specifi c skills and concepts that were embedded in
the curriculum modules. Changes in student career awareness are not discussed here but are the
subject of a separate paper.
WHY SENSORS?
Sensors are everywhere. From motion-sensing light switches to environmental observatories, we
are connected to our physical world in real time. The sensor revolution is, in effect, giving the world
its fi rst electronic nervous system (National Science Foundation, 2005). Sensors now play a par-
ticularly important role in environmental research. The education of the 21st century environmental
technology workforce therefore demands an understanding of sensor technology, as well as the
ability to resolve complex environmental issues and to communicate fi ndings to a broad audience.
Developing and maintaining such a workforce calls for innovative educational programs that prepare
future sensor technology professionals at a variety of levels and in a variety of environmental fi elds
(Ocean Commission Report, 2004). This type of multidisciplinary, technology-based approach is
not suffi ciently refl ected in our current educational programs.
The classroom integration of sensor development is therefore not only topical but offers highly
interdisciplinary subject matter, providing motivating scenarios for teaching a multitude of sci-
ence, technology, engineering and mathematics (STEM) subjects and skill sets. SENSE IT provides
students with the opportunity to learn about sensor technology through a hands-on, collabora-
tive process of designing, constructing, programming and testing a student-implemented water
monitoring network in the Hudson and St. Lawrence Rivers, which together span the state of New
York. Design-based activities such as SENSE IT provide a rich context for learning and lend them-
selves to sustained inquiry and revision. Application of learning is a worthy learning objective and
an effective route to greater retention of knowledge and depth of mastery. As Caine (1991) notes,
“Children learn best if they are immersed in complex experiences and are given the opportunity to
4 SUMMER 2012
ADVANCES IN ENGINEERING EDUCATION
SENSE IT: Teaching STEM principles to middle and high school students through
the design, construction and deployment of water quality sensors
actively process what they have learned.” This emphasis on application through design has been
informed by research on the use of design for learning complex and interrelated ideas (Brown,
1992; Blumenfeld et al., 1991; Harel & Papert, 1990, 1991; Perkins, 1986; Mishra & Koehler, 2006).
Design-based activities also bridge to many of the models of project-based learning (Blumenfeld,
Marx, Soloway & Krajcik, 1996; Blumenfeld et al., 1991; Dewey, 1934; Papert, 1991; Khardon & Roth,
1995; Roup, Gal, Drayton, & Pfi ster, 1992). In addition, SENSE IT refl ects the best practices for pro-
fessional development—extensive, iterative, ongoing, and in context (Fishman, 2003; Wenglinsky
& Silverstein, 2006; Mishra & Koehler, 2006)—as well as best practices for developing technical
talent as outlined in the BEST (Building Engineering and Science Talent) report, “What It Takes:
Pre-K-12 Design Principles to Broaden Participation in Science, Technology, Engineering and Math-
ematics”: (1) Defi ned outcomes; (2) Sustained commitment; (3) Personalization; (4) Challenging
content; and (5) Engaged adults.
THE PROJECT
The Curriculum
The SENSE IT curriculum is comprised of four educational modules (http://senseit.org/curricu-
lum.html). In Module 1, Sensor development, students learn about the principles of transducers and
then design, analyze and calibrate electronic circuits around their transducers in order to make
numerical measurements of environmental quantities in appropriate units. Initially students work
with thermistors and multimeters to begin to understand the relationship between temperature and
resistance (see Figure 1). A second resistor is then added to the circuit containing the thermistor
and multimeter, and through the data-gathering process students build a temperature sensor with
a linear calibration curve.
This module requires the use of mathematics skills (e.g., systems of equations, data plotting and
curve fi tting, rearranging formulae), science skills (understanding physical quantities, measurement
and error estimation, electrical components and circuits), pre-engineering skills (engineering design,
tool use, testing and debugging) and 21st century skills (teamwork, communication).
In Module 2, Sensor deployment and data gathering, students learn how to interface their cali-
brated temperature sensor with a microprocessor, the LEGO NXT microprocessor. Students use
mathematical skills to calibrate the outputs of the sensors and write computer programs to imple-
ment these calibration curves and display sensed quantities on a screen in appropriate units. Stu-
dents then learn how to write data-logging programs to log time-stamped data over a sustained
period of deployment.

SUMMER 2012 5
ADVANCES IN ENGINEERING EDUCATION
SENSE IT: Teaching STEM principles to middle and high school students
through the design, construction and deployment of water quality sensors
The balance of Module 2 leads students through the development of additional sensors, including
salinity, turbidity and depth sensors. The salinity sensor involves students passing a current between
two lengths of copper wire and measuring the voltage between the electrodes to calculate the re-
sistance, and then converting that measurement to a conductivity value. Students fi nish by writing
a NXT program to collect conductivity measurements and calibrate their sensors.
The turbidity sensor consists of two main components, a light source (light emitting diode or
LED lamp) and a light sensitive device (photo-resistor). The LED and the photo-resistor are fi xed a
short distance apart in such a way that water can fl ow between them. The more turbid the water,
the less light from the LED lamp will reach the photo-resistor. The photo-resistor is a device which
changes its resistance depending on how much light falls on it. Therefore, by measuring the resis-
tance of the photo-resistor, students can measure how much or how little light reached it from the
LED lamp, and therefore turbidity. Students construct and calibrate their turbidity sensor and write
a NXT program to display and collect turbidity measurements.
The fi nal sensor that students build is a pressure sensor to measure depth. Students fi gure out the
mathematical relationship between pressure and depth, calibrate the sensor, and then write a NXT
program to convert the signals from the pressure sensor into a depth measurement. The program
actually takes two measurements—it measures absolute ambient atmospheric pressure at the surface
and simultaneously measures the absolute underwater pressure at depth. An electronic circuit then
subtracts the atmospheric pressure from the underwater pressure reading to give a gauge pressure,
Figure 1. Equipment needed for Module 1, Lesson 4, Potential Dividers. The Lesson
demonstrates how potential divider circuits can be used to change the output characteristics
of a sensor.

6 SUMMER 2012
ADVANCES IN ENGINEERING EDUCATION
SENSE IT: Teaching STEM principles to middle and high school students through
the design, construction and deployment of water quality sensors
such that pressure at the surface is defi ned as zero. Because the sensor takes two measurements
and calculates the difference, it is known as a differential pressure sensor. Students calibrate the
depth sensor and write a program to record and display the depth measurements.
The deployment and data-gathering module requires students to use mathematics skills (systems
of equations, simple statistics, manipulation of formulae), science skills (hydrology, electrical circuits),
pre-engineering skills (design, testing and problem solving, tool use), technology skills (programming
and interfacing a microprocessor) and 21st century skills (teamwork, communication).
Module 3, Environmental science, puts the engineering activities in context by exploring environ-
mental science issues that provide a meaningful motivation for the development and deployment of
sensors. In this module, students work through a series of lessons which reveal water as a precious
resource and demonstrate the importance of everyone doing their part to protect and manage water
quality. Students investigate careers in environmental engineering that focus on the management
of water and explore the sensors and sensor network engineers are developing and deploying to
monitor, manage and protect our water resources.
The environmental science module requires the use of science skills (hydrology, chemistry associ-
ated with water quality tests, water science—specifi cally how parameters interact such as temperature
and dissolved oxygen), technology (using computers for data analysis and display and information
gathering) and 21st century skills (teamwork, communication).
In Module 4, Wireless sensor network, students learn about wireless communications and work
in teams to build and program their own wireless distributed sensor network. Each sensor network
consists of several remote sensor nodes, each node comprising temperature, salinity, turbidity and
depth sensors that have all been built by the students. The students then program their own wireless
communications protocols, so that each remote node transmits its sensed data back to a central
hub, where it can be time stamped and logged and uploaded to a PC for analysis.
The wireless sensor network module requires the use of mathematics skills (data analysis), science
skills (understanding of the physical quantities measured, hydrology, environmental science), technology
skills (internet research, programming) and 21st century skills (cyber-collaboration, communication).
Materials
Students construct their sensors from scratch using standard off-the-shelf electronics components.
They are led step by step through the physics principles, electric circuitry and mathematical analysis
required to build each sensor, with the aim of demystifying the “black box” effect associated with
using commercially available probes in classrooms. The hope is that by building their own sensors,
students will gain a better understanding not only of how sensors work, but also of the meaning of
the quantities that the sensors are used to measure.

SUMMER 2012 7
ADVANCES IN ENGINEERING EDUCATION
SENSE IT: Teaching STEM principles to middle and high school students
through the design, construction and deployment of water quality sensors
Once students have assembled a sensor, they connect it to a LEGO NXT microprocessor (see
Figure 2). Students write programs on a PC and then download them to the NXT, where the programs
are executed. SENSE IT uses the NXT-G programming language, a very simple icon-based program-
ming system that is easily assimilated by beginners with no previous programming experience but is
sophisticated enough that students can use it to take readings from D-to-A converters, encode the
equations of calibration curves using math blocks, write wireless communications programs using
Bluetooth, and write data-logging programs to store sequences of time-stamped sensor readings
in fi les (see Figure 3).
When deciding what kind of sensors the students would build, care was taken to create sen-
sor designs that were accurate enough for students to make meaningful measurements, but also
simple enough that high school students could understand what they were building and how it
worked.
Figure 3. A simple program in the NXT-G Mindstorms language. These programming
blocks read a voltage from a thermistor circuit via a D-to-A converter, use math blocks to
convert this into temperature °C by encoding the equation of a calibration curve, convert
this reading to a text string and display it on the screen, then repeat this process within a
continuous loop.
Figure 2. Connecting a thermistor to an NXT computer to measure water temperature.

8 SUMMER 2012
ADVANCES IN ENGINEERING EDUCATION
SENSE IT: Teaching STEM principles to middle and high school students through
the design, construction and deployment of water quality sensors
The Professional Development Model
The professional development model for the teachers planning to teach the SENSE IT curriculum
adopts the Technological Pedagogical Content Knowledge (TPACK) framework, which sees content
knowledge, technology, and pedagogy not in isolation but believes that good teaching requires
an understanding of how technology relates to both the pedagogy and the content, and how all
three are bound together (Mishra & Koehler, 2006). To be effective, professional development must
therefore be in-depth, take place continuously over time, and be in context (Fishman, 2003; Wenglin-
sky & Silverstein, 2006). SENSE IT teachers completed 120 hours of professional development by
participating in two summer institutes (two week institutes during two consecutive summers, the
second week with students), four professional development days (one each semester for two years),
and on-site classroom support visits during implementation.
During the fi rst week of the summer institute, the teachers learned the module content, with
enough time to work through all of the lessons and begin to devise implementation plans for their
own classrooms. During the second week, each teacher was invited to bring two students to par-
ticipate in a teaching laboratory, with the teachers teaching the modules in a highly supported envi-
ronment, surrounded by SENSE IT staff (see Figure 4). This opportunity to implement the materials
with students gave the teachers an opportunity to review the materials again and to see how they
worked with students. They found this a very effective approach, both in terms of the amount of
additional time they were able to spend with the curriculum and in terms of how seeing their own
students work through the modules increased their own confi dence in their ability to teach the
SENSE IT modules to entire classes.
Figure 4. Teachers and students during second week of summer workshop, Beacon.
SUMMER 2012 9
ADVANCES IN ENGINEERING EDUCATION
SENSE IT: Teaching STEM principles to middle and high school students
through the design, construction and deployment of water quality sensors
The professional development days, led by SENSE IT staff, were used to share successes and
challenges, as well as to develop additional sensors and discuss STEM career information and op-
portunities. During the classroom visits, SENSE IT staff offered support during implementation and
also experienced fi rst-hand any implementation issues.
In addition to the in-person professional development offered to SENSE IT teachers, a webinar
focused on Science, Technology, Engineering and Mathematics (STEM) career awareness was offered
to guidance counselors associated with the SENSE IT participating schools and to the parents and
students who attend the schools. The webinar participants discussed future employment opportu-
nities, career preparation pathways, and advice on what teachers and students should look for in
STEM programs when applying to schools.
And fi nally, all of the SENSE IT modules and developed support materials were made available
on the SENSE IT project web site (http://senseit.org).
The Participants
In Year 1, SENSE IT was implemented by 36 teachers in 41 courses, with over 900 students, most
of whom were in high school. In Year 2, it was implemented by 31 teachers in 32 courses, with about
800 students, this time about 75 percent high school and 25 percent middle school—the result of
teachers moving levels and wanting to continue with the project.
These were all experienced and stable teachers, with 87 percent having taught for more than
fi ve years and 80 percent having done so in the same school. All had undergraduate majors in a
STEM subject and all but one was also certifi ed in a STEM subject. However, a background survey
administered before the project began its Year 1 activities showed that they had much less experi-
ence teaching the actual material covered in the SENSE IT curriculum: less than half had taught
electricity or water quality (with different teachers having taught each), and less than half had used
sensors (or probes) in the classroom. Only a few were familiar with LEGO programmable bricks and
even fewer had taught simultaneous equations (necessary for calibrating the sensors); 20 percent
had taught none of these. Even integrating a problem-based learning project into the classroom
was not a common practice, with most saying they only did group projects occasionally, and having
students design open-ended investigations was even less common.
The subjects covered, and materials used in the SENSE IT curriculum were also not familiar to
most of the students. A student background survey, administered each year before the students
began the project, showed that although these were almost all college-bound students (almost 90
percent in both years expected to get at least a college degree), only half reported that they had
studied electrical circuits (mostly middle school students), only about one-quarter had ever used
probes or sensors, and about the same percentage reported past experience (in or out of school)

10 SUMMER 2012
ADVANCES IN ENGINEERING EDUCATION
SENSE IT: Teaching STEM principles to middle and high school students through
the design, construction and deployment of water quality sensors
with the LEGO programmable bricks. Eighty percent of the teachers in Year 1 and 66 percent in Year
2 reported that most or all of their students were not prepared for the math (in this case, algebra)
involved. This lack of experience was confi rmed by the students’ pre-test scores, which were poor
for both electricity and algebra, particularly at the middle school level.
In addition, only about one-third of the students in both years reported that they had designed
an investigation that collected and analyzed data (mostly science fair projects), while less than half
reported that they had studied water quality in school, although more had studied environmental
issues, primarily global warming and pollution. Not surprisingly, the two main environmental prob-
lems they saw in their own communities were pollution and littering. Only a few of the high school
students were able to describe what a sensor does. On the other hand, students at both levels were
reasonably disposed toward science, with about three-quarters in both years reporting that they
enjoyed science, although only about two-thirds said the same for math. However, when asked to
specify a future career or job, only one-third in Year 1 and one-half in Year 2 listed a STEM-related
career, with females twice as likely as males to list a science career and males fi ve times as likely as
females to list an engineering career.
Classroom Implementation
During the fi rst year, teachers were required to implement Modules 1 and 2, using the temperature
sensor. It came as a surprise to both the teachers and the SENSE IT team how many of the teachers
found that they needed to augment or simplify some of the lessons to meet their students’ needs
(for instance, by adding more detail, deconstructing the lessons for note-taking purposes, assigning
certain lessons as homework, restructuring worksheets make them easier to use). Others reported
having to repeatedly reinforce the students’ math skills. As a result, major modifi cations were made
for the second year, including a “fast-forward” version of Modules 1 and 2—with no algebra—that
was added as an option.
By the start of Year 2, the teachers had four sensors to choose from--temperature, conductivity,
turbidity and depth (see Figures 5 and 6). They were asked to build at least two sensors, but could
design their SENSE IT units using any of the lessons contained within all four modules. All reported
that their students built the temperature sensor, while 63 percent reported that they built the con-
ductivity sensor, 47 percent reported that they built the turbidity sensor, and 31 percent reported
that they built the depth sensor. The “fast-forward” version of Modules 1 and 2 was used by about
25 percent of the teachers.
Although it had not been an initial goal to test SENSE IT for fl exibility, in the end this proved to be
one of its strengths. Teachers were able to integrate the curriculum into a wide variety of courses and
subjects with a wide range of students. The teachers took advantage of the opportunity to mould

SUMMER 2012 11
ADVANCES IN ENGINEERING EDUCATION
SENSE IT: Teaching STEM principles to middle and high school students
through the design, construction and deployment of water quality sensors
the curriculum to fi t their classrooms. The courses in which the curriculum was taught covered a
wide range, in terms of broad academic area (mostly science but some math), in terms of specifi c
subject (from regular curriculum subjects to special SENSE IT courses), and by level (from general
science to AP and Honors). In both years, about one-quarter of the classes were Regents (the New
York State requirement for graduation).
In addition, the timing and structure of classroom implementation varied greatly from teacher to
teacher and course to course. Teachers used SENSE IT to introduce a key topic, generally electricity;
fi t it in as a unit on its own; or used it as an add-on, extension, or reinforcement.
Many teachers reported that it had been a challenge to fi nd the time to integrate such an extended
project into their curriculum, with the result that teachers met with their students anywhere from
Figure 5. Students working on assembling the circuit board required for the depth sensor.
Figure 6. Students deploying their water quality sensors in the Hudson River.
12 SUMMER 2012
ADVANCES IN ENGINEERING EDUCATION
SENSE IT: Teaching STEM principles to middle and high school students through
the design, construction and deployment of water quality sensors
two to ten times a week over anything from two to 40 weeks. In Year 1, the total number of minutes
spent on SENSE IT ranged from 270 to 1680, with an average of 700; in Year 2, the total number
ranged from 240 to 4200, with an average of 1138. The amount of time spent specifi cally on water
quality varied as well, with about half reporting that they spent a considerable amount of time on
it and the other half reporting that they spent a limited amount of time.
PROJECT IMPACT
The background surveys showed that the content covered by SENSE IT was new to both teach-
ers and students, while the pedagogy (group work, open-ended investigations) was not a common
practice among most of the teachers or common to the experience of most of the students. Imple-
menting a complex set of problem-based learning modules was therefore likely to be a challenge
for the teachers and learning the concepts and skills embedded in the curriculum was likely to be a
challenge for the students. This turned out to be particularly the case in Year 1, so it is not surprising
that the results improved considerably from the fi rst to the second year.
Teacher Ratings
The teachers responded to an end-of-implementation survey after each implementation—which
for teachers who were integrating SENSE IT into more than one course meant one survey for each
course. These end-of-implementation surveys asked questions about the implementation, including
the subjects covered in the class, the type of students, what had gone well, what the issues had been,
which sensors had been used, etc. (In addition, the evaluators visited all the teacher workshops and
selected teachers were interviewed at the end of Year 1.)
In the post-implementation survey, the teachers were asked to rate how SENSE IT had helped
their students in various academic areas, using a scale of 1 to 5, with 5 being the highest. The
overall ratings for both student learning and student enjoyment were high, with the few teachers
(2–3 each year) who gave lower ratings explaining them as being the result of their own failure
to teach well. In terms of specific ratings, in both years most teachers felt that the curriculum
had helped their students learn about sensors, but this was even more the case in Year 2 than
in Year 1—possibly because they themselves knew more and also because their students built
more sensors. They also rated it even more highly in Year 2 than in Year 1 for engaging students,
for helping their students learn about the environment, and for helping them learn the principles
of electricity, and about the same for all other items. Again, it is likely that this is because the
teachers felt better prepared for all of these. (see Table 1 below.) Fewer in both years felt that

SUMMER 2012 13
ADVANCES IN ENGINEERING EDUCATION
SENSE IT: Teaching STEM principles to middle and high school students
through the design, construction and deployment of water quality sensors
SENSE IT had helped their students with math—but this varied depending on the emphasis in
the class.
In addition, the teachers saw many other benefi ts in using the SENSE IT curriculum with their
students, ranging from the very specifi c to the more general. In part, their view of the benefi ts de-
pended on the course that SENSE IT was integrated into, but most wrote about the general benefi t
that came from giving their students an opportunity to engage in a hands-on project that was tied
to real-world problems. In fact, it was notable how many of their comments included the phrase
“hands-on.” They had comments such as these:
• “They were able to see how the material they have been learning in class could be used to
solve a real world problem.”
• “It was a hands-on experience for them. They truly enjoyed being able to create their own
sensors and see how they are used in the real world. They thought it was “cool” that they got
to record their own data.”
• “It provided hands-on learning which the majority of the students who take my class really
need to stay focused. Knowing that they would actually test what they had built in a real-life
situation, it provided motivation to learn additional material.”
They also liked how the project tied science and math together in a way that made them relevant
for their students:
Table 1: Percent of teachers who gave the highest ratings (4-5) for each course taught in
each year.
Year 1 (n=41) Year 2 (n=32)
Helped your students learn the role of sensors
85% 91%
Engaged your students 76% 84%
Helped your students understand how sensors work
76% 78%
Helped your students learn about the environment
56% 72%
Helped your students learn to work well in groups
71% 69%
Helped your students learn the prin-ciples of electricity
54% 66%
Reinforced your students’ existing math skills
61% 56%
Gave your students new math skills 32% 34%

14 SUMMER 2012
ADVANCES IN ENGINEERING EDUCATION
SENSE IT: Teaching STEM principles to middle and high school students through
the design, construction and deployment of water quality sensors
• “The greatest benefi ts of this SENSE IT curriculum include: applying math skills in a meaning-
ful context; seeing how Regents Physics content and skills are applied in the ‘real world’; and
connecting physics, math and technology to new content (water quality).”
• “It helped us connect science and math into real world problems. Our students do much better
when given hands-on experience.”
• “Students saw a real life application of linearizing data -- something I had introduced at the
beginning of the year.”
• “This curriculum was hugely benefi cial. One of the great challenges in any fi eld of teaching
is providing relevance (especially to 14 year olds who may not want to do math at 9:00AM!).
The relevance of this curriculum and project were strongly apparent to the students from day
one and they seemed to really enjoy it.”
Student Ratings
The students were also asked to respond to a post-implementation survey that asked about their
experience with SENSE IT. The fi rst question asked them to rate SENSE IT in terms of how much
they felt they had learned and how much they felt they had enjoyed it, in their case using a rating
scale from A to F, including + and -. The high school students’ ratings were high for both (85 percent
gave an A or B for enjoyment and about 75 percent gave it an A or B for learning), but the middle
school students’ ratings were higher (over 98 percent gave it an A or B for learning and 80 percent
for enjoyment). Males were slightly more enthusiastic than females.
When asked what they liked most about the project, the items mentioned most frequently by the
high school students in both years referred to the hands-on aspects—the building (mentioned by
60 percent of the students in Year 2), the soldering (mentioned by 59 percent), and the fact that it
was “hands-on” (also mentioned by 50 percent). The middle school students also liked the building
(mentioned by 63 percent) but their second highest choice was working in groups (mentioned by
57 percent) and their third was the fact that the project was hands-on (54 percent).
Their dislikes tell a great deal about why they like hands-on projects rather than more traditional
forms of learning. In Year 1, the high schools students’ complaints focused on the instructions, which
they thought were unclear, too diffi cult to read, or involved too much reading. In Year 2, after the
curriculum modules had been revised on the basis of the Year 1 experience, the most-mentioned
complaints were not related to the reading but to the math, which was mentioned by 45 percent of
the students, followed by analyzing data and using Excel (40 percent and 39 percent respectively).
The Year 2 middle school students also had the math, analyzing data, and using Excel at the top of
their “liked least” lists (50 percent, 44 percent, and 38 percent respectively), but for them, reading
the instructions came in second (mentioned by 46 percent).
SUMMER 2012 15
ADVANCES IN ENGINEERING EDUCATION
SENSE IT: Teaching STEM principles to middle and high school students
through the design, construction and deployment of water quality sensors
Student Learning
Assessing the impact of a complex and multi-part curriculum that is used in so many different
situations is a challenge. However, since a key goal of ITEST, and of STEM education projects in
general, is to reach all students, whether male or female, middle school or high school, academi-
cally higher or lower achieving, and in wealthy or poorer schools, the analysis will focus on these
groups in terms of changes in the key content knowledge and skills embedded in the curriculum
related to algebra, electricity, water quality, and understanding of sensors. The analysis will focus on
the Year 2 results, since that was the year in which there were pre- and post-test for both algebra
and electricity and the year in which assessments for water quality and understanding of sensors
were introduced, but comparisons with Year 1 will be mentioned where relevant.1 The algebra and
electricity tests consisted of fi ve multiple-choice questions for each area, some of which involved
calculations and some of which included interpretations of diagrams, while the water quality as-
sessment included questions designed to assess the students’ understanding of the relationship
between water quality and sensor-collected data (temperature, turbidity, etc.). Finally, a digital pile
sort activity was used to assess student understanding of sensors.2 In all instances, high school
and middle school are compared, since the middle school students’ scores on the pre-tests were
always considerably lower than the high school students’ scores. However, analysis showed that
there were few differences by region or by gender, so neither of these is considered. To determine
SES, we used the percent of students receiving free and reduced lunch, a common measure of the
socioeconomic status of students in a school in New York State. Since the state considers schools
that have over 39.15 percent of their students receiving free or reduced lunch as low SES schools,
all students in those schools were therefore considered to be lower SES—approximately 11 percent
of the high school students and 50 percent of the middle school students. Weaker students were
defi ned as those who scored below the mean on each pre-test—approximately 40 percent of high
school students and 55 percent of middle school students.
SES
There were 828 matched pairs of electricity tests in Year 1 and 721 in Year 2 (542 high school students
and 179 middle school students). There was no algebra pre-test in Year 1 but there were 727 matched
pairs of algebra assessments in Year 2 (557 high school students and 170 middle school students).
1 In Year 1, there was an algebra readiness (pre) assessment only and a pre- and post-electricity assessment, with three ques-
tions each. In Year 2, a post-assessment was added for algebra and the number of questions on each assessment increased to
fi ve, with each question mapped to a specifi c concept or skill.
2 Pile sorts are sets of cards that students are asked to sort into piles. In this case, the cards had pictures of objects and the
students were asked to sort them into piles of objects that they believed had sensors, did not have sensors, and that they were
not sure about. The pile sort was tested with printed cards and then digitized as an online Flash-based activity (see Figure 14).
Although the teachers had the option of using the printed cards, they all used the digital version.

16 SUMMER 2012
ADVANCES IN ENGINEERING EDUCATION
SENSE IT: Teaching STEM principles to middle and high school students through
the design, construction and deployment of water quality sensors
Although there was a signifi cant correlation between the students’ post-test scores for algebra and
electricity (r = .43, p < .01), they are analyzed separately because they call on very different skills and
background knowledge, raising the possibility that a student could do well in one but not the other.
As noted above, the teachers felt that the students struggled with the math needed for SENSE IT.
In Year 1, students in higher SES schools had higher algebra pre-test scores than students in lower
SES schools and this was the case in Year 2 as well. However, in Year 2 the results of an analysis of
covariance at the high school level indicated that there was a signifi cant interaction between SES
and the covariate (pre-test scores), F(1, 553) = 5.78, p = .02 (p < .05). Therefore, an analysis of co-
variance was not the appropriate test here. Instead, a one-way analysis of variance was performed.
The results show that although students in higher SES schools did signifi cantly better on the algebra
pre-test, F(1, 590) = 13.03, p = .000 (p < .001), this was not the case for the algebra post-test (p >
.05). As Figure 7 shows, the scores of students in higher SES schools declined while those in lower
SES schools increased, thus narrowing the gap. It should be noted that the reasons for the decline
are unclear, but may be related to a lack of focus for these students—most of whom were seniors—at
the end of the year. For electricity, on the other hand, the gap at the start, although narrower than
that for algebra, remained (p > .05). Note that all scores have been converted to a scale of 100 so
can be read as percents.
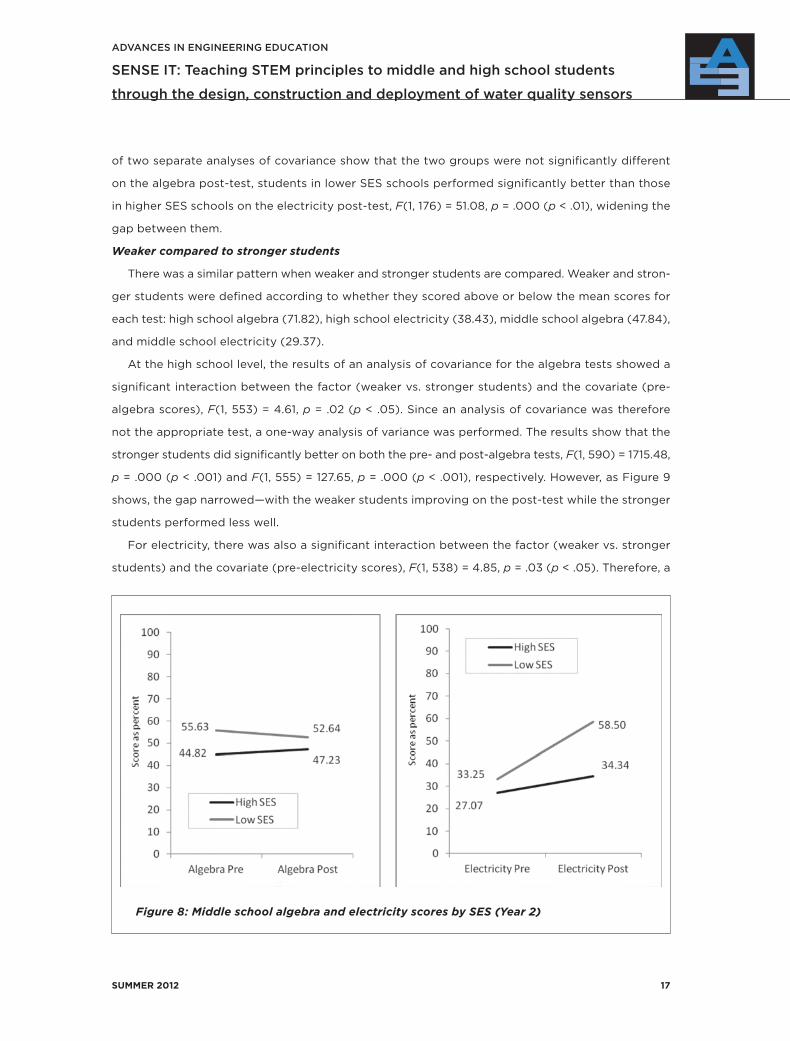
At the middle school level, in contrast, students in lower SES schools did better than students in
higher SES schools on the pre-tests for both assessments (see Figure 8). However, while the results
Figure 7. High school algebra and electricity scores by SES (Year 2).
SUMMER 2012 17
ADVANCES IN ENGINEERING EDUCATION
SENSE IT: Teaching STEM principles to middle and high school students
through the design, construction and deployment of water quality sensors
of two separate analyses of covariance show that the two groups were not signifi cantly different
on the algebra post-test, students in lower SES schools performed signifi cantly better than those
in higher SES schools on the electricity post-test, F(1, 176) = 51.08, p = .000 (p < .01), widening the
gap between them.
Weaker compared to stronger students
There was a similar pattern when weaker and stronger students are compared. Weaker and stron-
ger students were defi ned according to whether they scored above or below the mean scores for
each test: high school algebra (71.82), high school electricity (38.43), middle school algebra (47.84),
and middle school electricity (29.37).
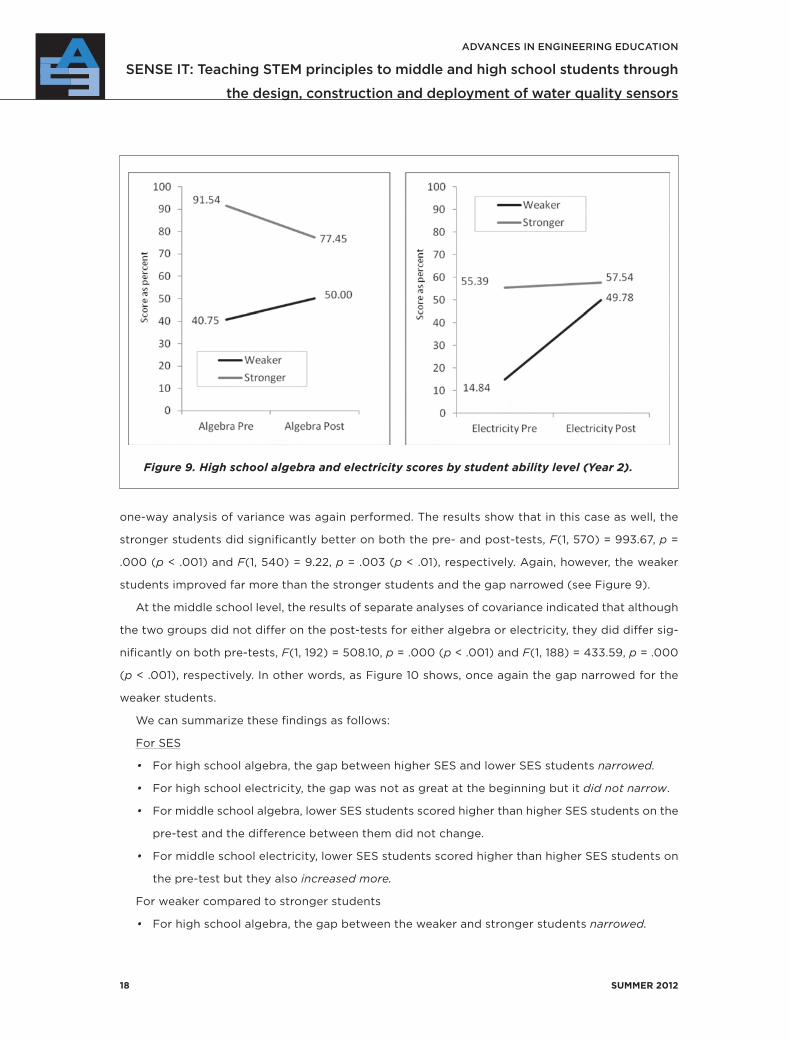
At the high school level, the results of an analysis of covariance for the algebra tests showed a
signifi cant interaction between the factor (weaker vs. stronger students) and the covariate (pre-
algebra scores), F(1, 553) = 4.61, p = .02 (p < .05). Since an analysis of covariance was therefore
not the appropriate test, a one-way analysis of variance was performed. The results show that the
stronger students did signifi cantly better on both the pre- and post-algebra tests, F(1, 590) = 1715.48,
p = .000 (p < .001) and F(1, 555) = 127.65, p = .000 (p < .001), respectively. However, as Figure 9
shows, the gap narrowed—with the weaker students improving on the post-test while the stronger
students performed less well.
For electricity, there was also a signifi cant interaction between the factor (weaker vs. stronger
students) and the covariate (pre-electricity scores), F(1, 538) = 4.85, p = .03 (p < .05). Therefore, a
Figure 8: Middle school algebra and electricity scores by SES (Year 2)
18 SUMMER 2012
ADVANCES IN ENGINEERING EDUCATION
SENSE IT: Teaching STEM principles to middle and high school students through
the design, construction and deployment of water quality sensors
one-way analysis of variance was again performed. The results show that in this case as well, the
stronger students did signifi cantly better on both the pre- and post-tests, F(1, 570) = 993.67, p =
.000 (p < .001) and F(1, 540) = 9.22, p = .003 (p < .01), respectively. Again, however, the weaker
students improved far more than the stronger students and the gap narrowed (see Figure 9).
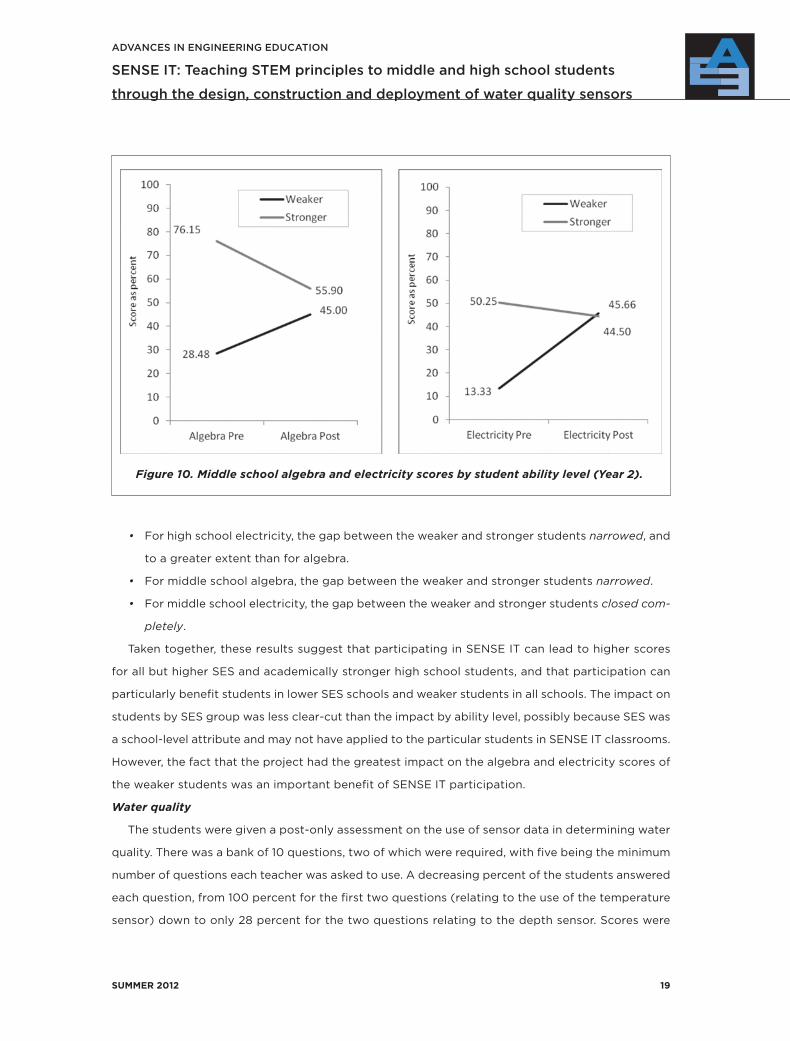
At the middle school level, the results of separate analyses of covariance indicated that although
the two groups did not differ on the post-tests for either algebra or electricity, they did differ sig-
nifi cantly on both pre-tests, F(1, 192) = 508.10, p = .000 (p < .001) and F(1, 188) = 433.59, p = .000
(p < .001), respectively. In other words, as Figure 10 shows, once again the gap narrowed for the
weaker students.
We can summarize these fi ndings as follows:
For SES
• For high school algebra, the gap between higher SES and lower SES students narrowed.
• For high school electricity, the gap was not as great at the beginning but it did not narrow.
• For middle school algebra, lower SES students scored higher than higher SES students on the
pre-test and the difference between them did not change.
• For middle school electricity, lower SES students scored higher than higher SES students on
the pre-test but they also increased more.
For weaker compared to stronger students
• For high school algebra, the gap between the weaker and stronger students narrowed.
Figure 9. High school algebra and electricity scores by student ability level (Year 2).
SUMMER 2012 19
ADVANCES IN ENGINEERING EDUCATION
SENSE IT: Teaching STEM principles to middle and high school students
through the design, construction and deployment of water quality sensors
• For high school electricity, the gap between the weaker and stronger students narrowed, and
to a greater extent than for algebra.
• For middle school algebra, the gap between the weaker and stronger students narrowed.
• For middle school electricity, the gap between the weaker and stronger students closed com-
pletely.
Taken together, these results suggest that participating in SENSE IT can lead to higher scores
for all but higher SES and academically stronger high school students, and that participation can
particularly benefi t students in lower SES schools and weaker students in all schools. The impact on
students by SES group was less clear-cut than the impact by ability level, possibly because SES was
a school-level attribute and may not have applied to the particular students in SENSE IT classrooms.
However, the fact that the project had the greatest impact on the algebra and electricity scores of
the weaker students was an important benefi t of SENSE IT participation.
Water quality
The students were given a post-only assessment on the use of sensor data in determining water
quality. There was a bank of 10 questions, two of which were required, with fi ve being the minimum
number of questions each teacher was asked to use. A decreasing percent of the students answered
each question, from 100 percent for the fi rst two questions (relating to the use of the temperature
sensor) down to only 28 percent for the two questions relating to the depth sensor. Scores were
Figure 10. Middle school algebra and electricity scores by student ability level (Year 2).
20 SUMMER 2012
ADVANCES IN ENGINEERING EDUCATION
SENSE IT: Teaching STEM principles to middle and high school students through
the design, construction and deployment of water quality sensors
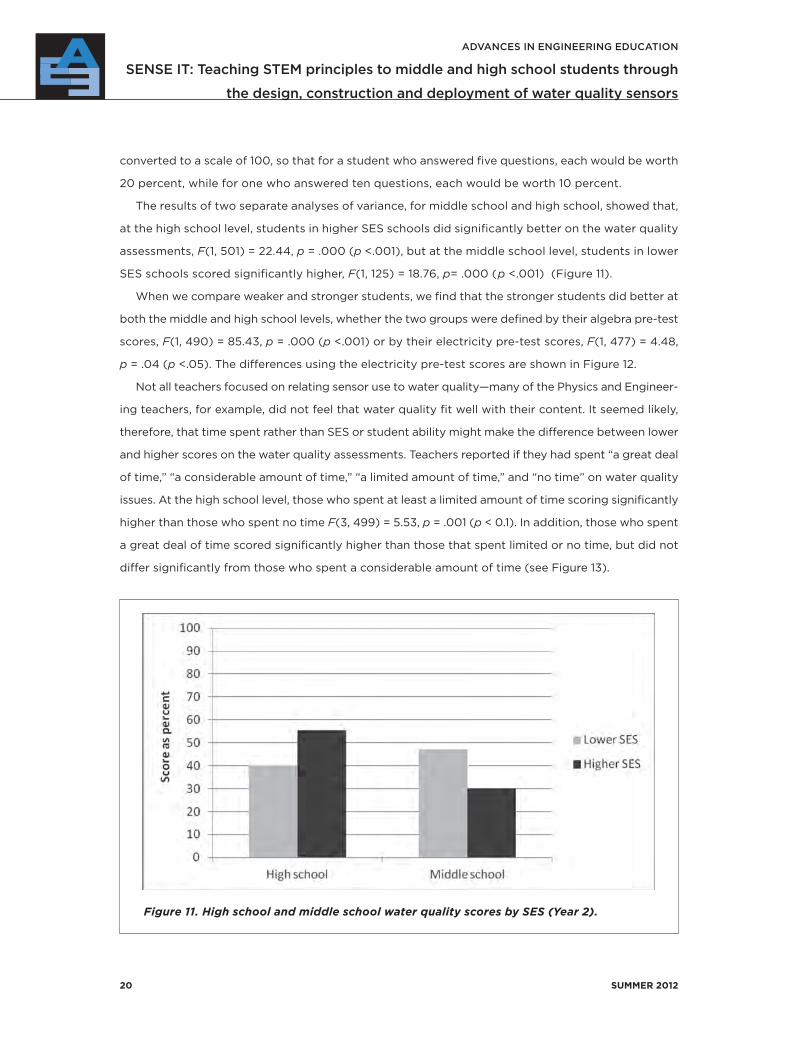
converted to a scale of 100, so that for a student who answered fi ve questions, each would be worth
20 percent, while for one who answered ten questions, each would be worth 10 percent.
The results of two separate analyses of variance, for middle school and high school, showed that,
at the high school level, students in higher SES schools did signifi cantly better on the water quality
assessments, F(1, 501) = 22.44, p = .000 (p <.001), but at the middle school level, students in lower
SES schools scored signifi cantly higher, F(1, 125) = 18.76, p= .000 (p <.001) (Figure 11).
When we compare weaker and stronger students, we fi nd that the stronger students did better at
both the middle and high school levels, whether the two groups were defi ned by their algebra pre-test
scores, F(1, 490) = 85.43, p = .000 (p <.001) or by their electricity pre-test scores, F(1, 477) = 4.48,
p = .04 (p <.05). The differences using the electricity pre-test scores are shown in Figure 12.
Not all teachers focused on relating sensor use to water quality—many of the Physics and Engineer-
ing teachers, for example, did not feel that water quality fi t well with their content. It seemed likely,
therefore, that time spent rather than SES or student ability might make the difference between lower
and higher scores on the water quality assessments. Teachers reported if they had spent “a great deal
of time,” “a considerable amount of time,” “a limited amount of time,” and “no time” on water quality
issues. At the high school level, those who spent at least a limited amount of time scoring signifi cantly
higher than those who spent no time F(3, 499) = 5.53, p = .001 (p < 0.1). In addition, those who spent
a great deal of time scored signifi cantly higher than those that spent limited or no time, but did not
differ signifi cantly from those who spent a considerable amount of time (see Figure 13).
Figure 11. High school and middle school water quality scores by SES (Year 2).

SUMMER 2012 21
ADVANCES IN ENGINEERING EDUCATION
SENSE IT: Teaching STEM principles to middle and high school students
through the design, construction and deployment of water quality sensors
There was also a more subtle impact in terms of student awareness of environmental issues, at
least for some students. In Year 1, the teachers had been unsure if their students’ awareness of envi-
ronmental issues had changed as a result of the project, with 46 percent saying yes and 49 percent
not sure. In Year 2, in contrast, 72 percent said yes and only 25 percent said they were not sure. The
response depended in part on the course that SENSE IT was taught in, with the Environmental Sci-
ence teachers being much more likely to make the connection than the Physics teachers. Here are
some of the ways they described how they did this:
• “My students are more aware of the problems with water quality and the ability to apply tech-
nology to help, identify, quantify, and in some cases help solve environmental problems.”
• “They are certainly more aware of issues near us and of how dangerous improper waste re-
moval is. In fact some students want to make a complaint about the red soot a factory near
them is emitting.”
• “Few were aware of the AuSable River Watershed, in which they all live. They became more
interested in how humans impact the quality of the AuSable River water.”
• “I don’t think they gave the Hudson River any thought at all. Also I don’t think they had any
idea how many factors affect the quality of the water. I hope they are more aware of some of
the issues affecting their water supply and the Hudson River estuary.”
Figure 12. High school and middle school water quality scores by student ability level
(Year 2).

22 SUMMER 2012
ADVANCES IN ENGINEERING EDUCATION
SENSE IT: Teaching STEM principles to middle and high school students through
the design, construction and deployment of water quality sensors
• “I would have not discussed environmental issues in my Physics classes. However, I found
that bringing these issues into the classroom was a great idea as it makes material we learn
relevant.”
This increased emphasis on the water quality aspect of the curriculum was also evident in the
student responses to a question that asked what environmental issues they saw in their communities.
As noted earlier, on the baseline survey their most common responses were pollution and littering.
This was again the case on the post-implementation surveys, but by then students were more than
twice as likely to list not just pollution, but water pollution in particular.
Understanding of sensors
The teachers reported that SENSE IT had helped the students understand the role of sen-
sors in monitoring the environment, but this appreciation did not translate immediately into the
students’ ability to define what a sensor does. After participating in SENSE IT, 50 percent of
high school students and over 80 percent of middle school students were unable to answer a
question on the post-implementation survey that asked them to describe what a sensor does—
and most of those who did answer only included the sensor’s ability to read or gather data, not
to convert it.
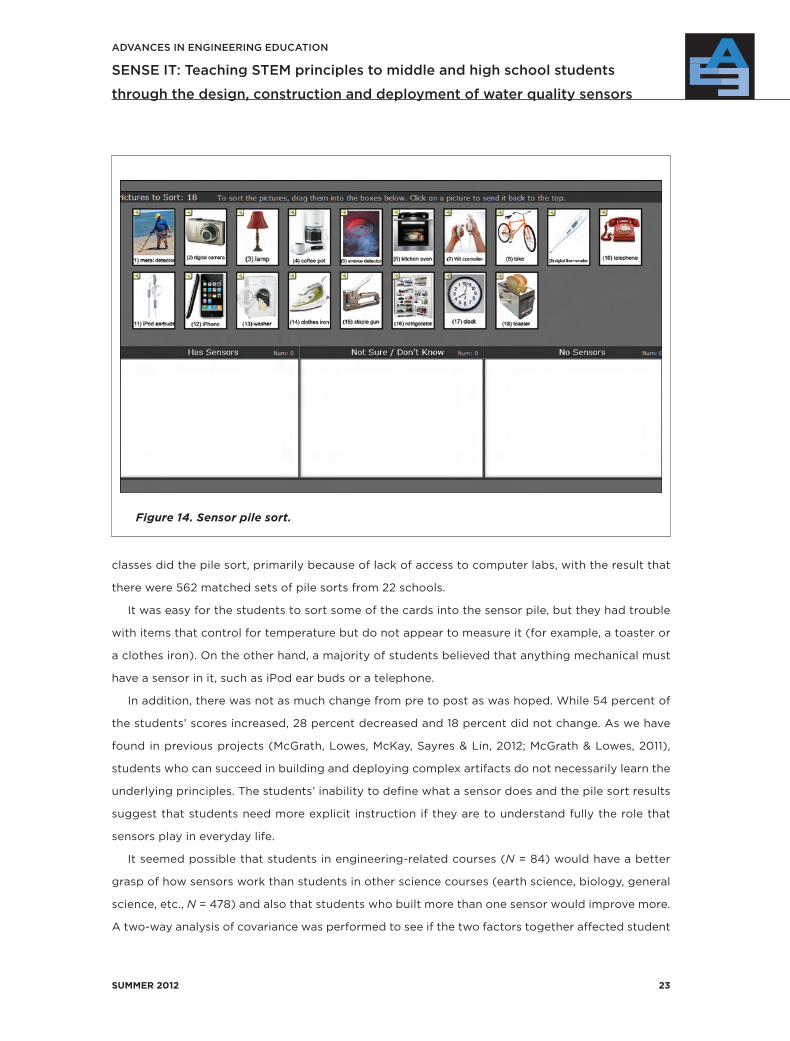
This fi nding was confi rmed by a second assessment of student understanding of sensors, intro-
duced in Year 2. This was a pile sort (Figure 14), an online Flash-based activity that asked the students
to sort (by dragging and dropping) eighteen cards, twelve of which had pictures (with captions)
of items that have sensors and six of which had pictures of items that do not have sensors. Not all
Figure 13. Student water quality scores as a function of time spent on topic (Year 2).
SUMMER 2012 23
ADVANCES IN ENGINEERING EDUCATION
SENSE IT: Teaching STEM principles to middle and high school students
through the design, construction and deployment of water quality sensors
classes did the pile sort, primarily because of lack of access to computer labs, with the result that
there were 562 matched sets of pile sorts from 22 schools.
It was easy for the students to sort some of the cards into the sensor pile, but they had trouble
with items that control for temperature but do not appear to measure it (for example, a toaster or
a clothes iron). On the other hand, a majority of students believed that anything mechanical must
have a sensor in it, such as iPod ear buds or a telephone.
In addition, there was not as much change from pre to post as was hoped. While 54 percent of
the students’ scores increased, 28 percent decreased and 18 percent did not change. As we have
found in previous projects (McGrath, Lowes, McKay, Sayres & Lin, 2012; McGrath & Lowes, 2011),
students who can succeed in building and deploying complex artifacts do not necessarily learn the
underlying principles. The students’ inability to defi ne what a sensor does and the pile sort results
suggest that students need more explicit instruction if they are to understand fully the role that
sensors play in everyday life.
It seemed possible that students in engineering-related courses (N = 84) would have a better
grasp of how sensors work than students in other science courses (earth science, biology, general
science, etc., N = 478) and also that students who built more than one sensor would improve more.
A two-way analysis of covariance was performed to see if the two factors together affected student
Figure 14. Sensor pile sort.
24 SUMMER 2012
ADVANCES IN ENGINEERING EDUCATION
SENSE IT: Teaching STEM principles to middle and high school students through
the design, construction and deployment of water quality sensors
scores on the post pile-sort activity. The results showed that while there was a signifi cant difference
for those in engineering-related classes between those who built one sensor and those who built
more than one, this was not the case for those in other types of classes, F(1, 557) = 6.40, (p < .05). In
other words, students in engineering-related classes better understood what a sensor was when they
built more than one sensor, but this did not make a difference for students in the other classes.
The Link Between Teacher Performance and Student Results
At the beginning of the Year 1 summer institute, the teachers took the electricity and algebra
pre-tests and the electricity post-test. This was partly to familiarize them with the process and
partly to assess their background knowledge. In Year 2, when there were both algebra and electric-
ity pre- and post-tests, the teachers did both. Since it seemed likely, based on fi ndings from other
projects (Macalalag, Tirthali, McGrath, McKay & Lowes, 2011; Macalalag, Lowes, Guo & McKay, 2010),
that teachers who knew the material well would be better able to teach it, we used these results to
explore the relationship between teacher and student performance.
In Year 1, when we had only post-test scores for electricity, we grouped the teachers into those
with high post-test scores and those with low post-test scores. We found that the post-test scores
of students whose teachers had high scores were signifi cantly higher than the post-test scores of
students whose teachers had low scores.
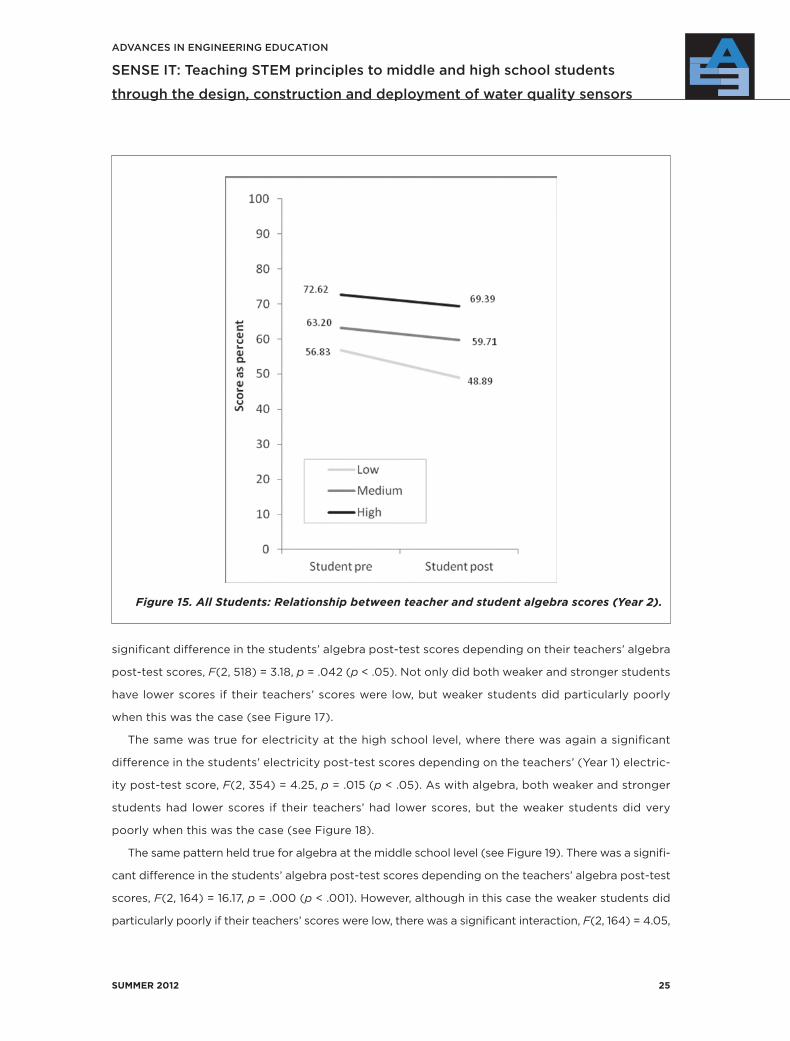
In Year 2, when we had both electricity and algebra pre- and post-test scores, we found a similar
relationship between student and teacher scores. To refi ne the analysis, we broke the teachers into
three groups (Low, Medium, High) based on their algebra post-scores. Although the student scores
declined, they declined most for the teachers in the Low group (see Figure 15).
To confi rm this, a linear regression was performed. It showed that the Year 2 teachers’ algebra
post-test scores were indeed a signifi cant predictor of their students’ Year 2 algebra post-test scores,
F(2, 688) = 7.06, p = .001 (p < .01).
For electricity, in Year 2 most of the teachers got all the answers correct on the pre- and post-
test—undoubtedly the result of their work in Year 1—so these scores were not useful as covariates.
However, the teachers’ Year 1 electricity post-test scores remained signifi cant predictors of their
students’ Year 2 post-test scores, with those having low scores in Year 1 being the only group whose
Year 2 students’ scores decreased (see Figure 16).
Again, the results of a linear regression showed that the teachers’ electricity post-test scores in
Year 1 were a signifi cant predictor of the students’ electricity post-test scores (in Year 2), F(2, 439)
= 4.46, p = .01 (p < .05).
The relationship between teacher and student scores is also evident when we look at the weaker
compared to the stronger students by school level. Thus for high school algebra, there was a
SUMMER 2012 25
ADVANCES IN ENGINEERING EDUCATION
SENSE IT: Teaching STEM principles to middle and high school students
through the design, construction and deployment of water quality sensors
signifi cant difference in the students’ algebra post-test scores depending on their teachers’ algebra
post-test scores, F(2, 518) = 3.18, p = .042 (p < .05). Not only did both weaker and stronger students
have lower scores if their teachers’ scores were low, but weaker students did particularly poorly
when this was the case (see Figure 17).
The same was true for electricity at the high school level, where there was again a signifi cant
difference in the students’ electricity post-test scores depending on the teachers’ (Year 1) electric-
ity post-test score, F(2, 354) = 4.25, p = .015 (p < .05). As with algebra, both weaker and stronger
students had lower scores if their teachers’ had lower scores, but the weaker students did very
poorly when this was the case (see Figure 18).
The same pattern held true for algebra at the middle school level (see Figure 19). There was a signifi -
cant difference in the students’ algebra post-test scores depending on the teachers’ algebra post-test
scores, F(2, 164) = 16.17, p = .000 (p < .001). However, although in this case the weaker students did
particularly poorly if their teachers’ scores were low, there was a signifi cant interaction, F(2, 164) = 4.05,
Figure 15. All Students: Relationship between teacher and student algebra scores (Year 2).

26 SUMMER 2012
ADVANCES IN ENGINEERING EDUCATION
SENSE IT: Teaching STEM principles to middle and high school students through
the design, construction and deployment of water quality sensors
p = .019 (p < .05), suggesting that the effect was not the same for all ability levels. No comparisons
could be made for electricity since all the teachers scored 100 on the Year 1 electricity post-test.
In summary, in all cases for which there was data, the teachers’ scores were signifi cant predic-
tors of their students’ scores. While for electricity, this equalized the results between weaker and
stronger students, for the more complicated concepts in algebra, it meant that the weaker students
did particularly poorly.
The Link Between Teacher Practices and Student Results
In both years, teachers were encouraged to discuss the pre-test results for algebra and electricity
with their students. In Year 1, however, the teachers would have had to analyze the results themselves
or enter them into an online system and few did this early enough to make it useful. In Year 2, the
tests themselves were put online, with each class’s results immediately available to be shared, in
graphical format (Figure 20). As a result, about half the teachers reported that they discussed the
results with their students.
Figure 16. All Students: Relationship between teacher and student electricity scores
(Year 2).
SUMMER 2012 27
ADVANCES IN ENGINEERING EDUCATION
SENSE IT: Teaching STEM principles to middle and high school students
through the design, construction and deployment of water quality sensors
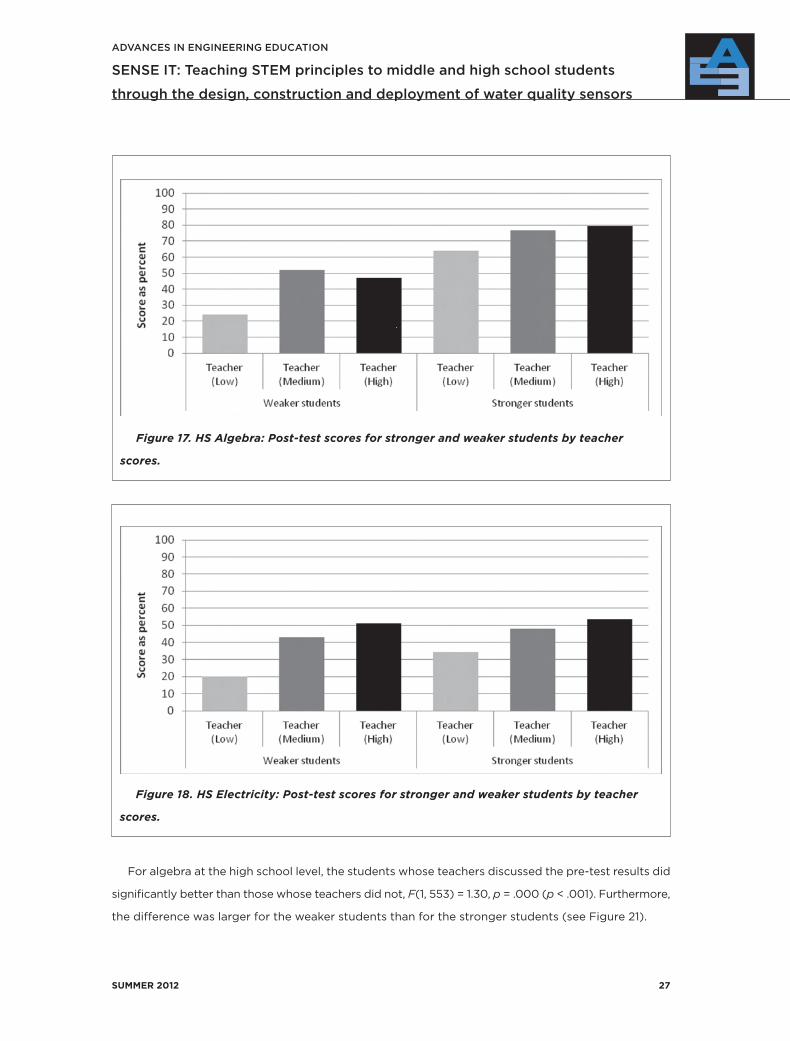
For algebra at the high school level, the students whose teachers discussed the pre-test results did
signifi cantly better than those whose teachers did not, F(1, 553) = 1.30, p = .000 (p < .001). Furthermore,
the difference was larger for the weaker students than for the stronger students (see Figure 21).
Figure 17. HS Algebra: Post-test scores for stronger and weaker students by teacher
scores.
Figure 18. HS Electricity: Post-test scores for stronger and weaker students by teacher
scores.

28 SUMMER 2012
ADVANCES IN ENGINEERING EDUCATION
SENSE IT: Teaching STEM principles to middle and high school students through
the design, construction and deployment of water quality sensors
Similarly for electricity at the high school level: The students whose teachers discussed the pre-test
results did signifi cantly better than those whose teachers did not, F(1, 539) = 12.62, p = .000 (p < .001),
although in this case the difference for the weaker students was not quite as large (Figure 22).
The same was the case for algebra but not for electricity at the middle school level. For algebra,
the students whose teachers discussed the pre-test results did signifi cantly better than those whose
teachers did not, F(1, 167) = 4.68, p = .032 (p < .05), but for electricity, there was no signifi cant dif-
ference between the two groups (p > .05).
Figure 19. MS Algebra: Post-test scores for stronger and weaker students by teacher
scores.
Figure 20. Graphical results page for algebra tests.
SUMMER 2012 29
ADVANCES IN ENGINEERING EDUCATION
SENSE IT: Teaching STEM principles to middle and high school students
through the design, construction and deployment of water quality sensors
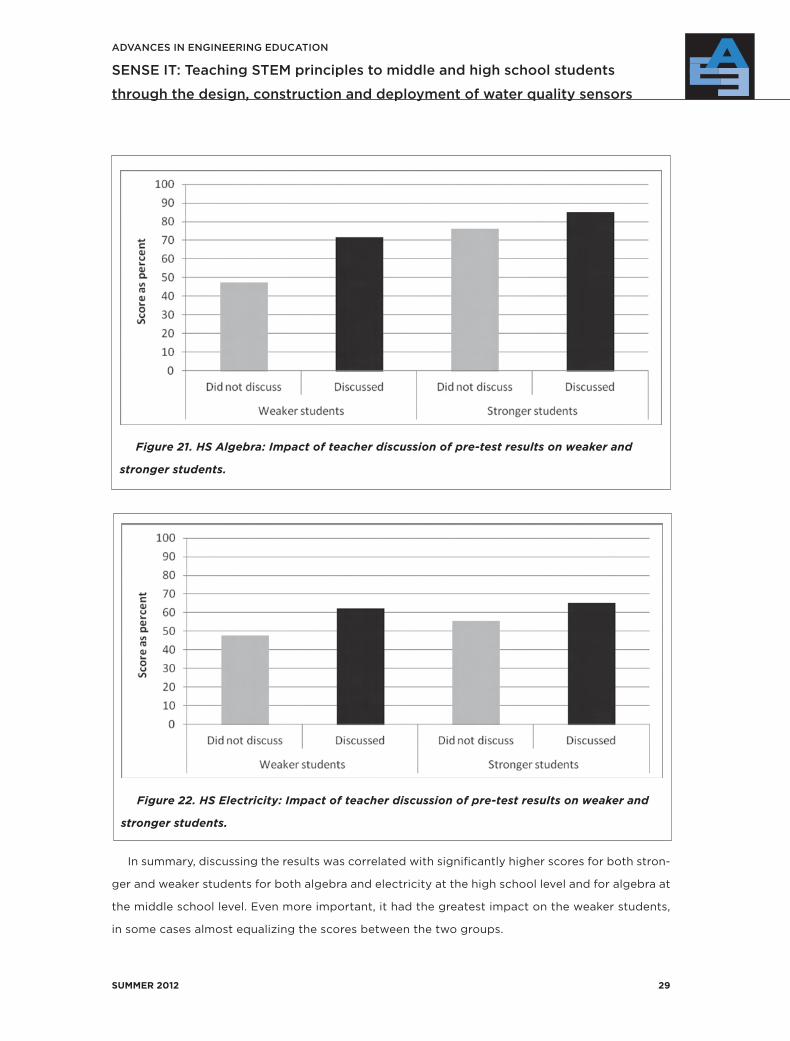
In summary, discussing the results was correlated with signifi cantly higher scores for both stron-
ger and weaker students for both algebra and electricity at the high school level and for algebra at
the middle school level. Even more important, it had the greatest impact on the weaker students,
in some cases almost equalizing the scores between the two groups.
Figure 21. HS Algebra: Impact of teacher discussion of pre-test results on weaker and
stronger students.
Figure 22. HS Electricity: Impact of teacher discussion of pre-test results on weaker and
stronger students.
30 SUMMER 2012
ADVANCES IN ENGINEERING EDUCATION
SENSE IT: Teaching STEM principles to middle and high school students through
the design, construction and deployment of water quality sensors
CONCLUSION
SENSE IT offers fully integrated STEM education modules, requiring students to learn and apply
principles within science, technology, pre-engineering, and mathematics to construct and deploy
water quality sensors. Tracked implementation of SENSE IT in classrooms demonstrates that it
is possible, although additional time and effort is required, to have students carry out complex
problem-based, hands-on projects within the scope of existing standard curricula and tied to state
and national education standards. The applied themes of environmental stewardship and sensor
networks provide: 1) a motivating and meaningful scenario for learning a wide range of core math,
science, and technology topics and workforce readiness skills, 2) an awareness of the ubiquity of
sensors in our world while demonstrating the link between biological, physical and social sciences,
3) a means to encourage learners to look at local water quality and environmental issues and data
from a global perspective, and 4) an opportunity to engage students in the use of sensors for envi-
ronmental monitoring and to learn about potential careers involved with environmental monitoring
and management.
Research results indicate that the participating teachers were positive about the benefi ts of the
SENSE IT curriculum for their students, both in terms of how it engaged them and in terms of what
they had learned. Teacher responses indicate that this success was in part because they were able to
adapt the curriculum to fi t into their existing courses and to meet their students’ academic levels. In
other words, a strength of the curriculum was its fl exibility—as shown by the integration of SENSE IT
into a wide range of courses with a wide range of students—from upper level high school students to
middle school students, from academically advanced students to academically challenged students,
from Advanced Placement courses to courses for those students who could not qualify for higher
level science. The research results suggest that participating in SENSE IT led to higher scores for
all but higher SES and academically stronger high school students, and that SENSE IT participation
particularly benefi ted students in low SES schools and weaker students in all schools.
Although SENSE IT can be taught by teachers in many subject areas, the strong correlation
between teacher and student results indicates that teacher preparation is necessary if strong stu-
dent results are desired. This means that fairly extensive professional development is necessary for
teachers not already well versed in the content knowledge and skills embedded in the SENSE IT
curriculum.
Based on research results, we hope to grow the SENSE IT program. However, we are also aware
that there are too many activities and lessons for the average teacher to use in the classroom and
that the two-week summer workshop model requires a time commitment that many teachers can-
not make. In order to reach more teachers, it will be necessary to condense and compress both

SUMMER 2012 31
ADVANCES IN ENGINEERING EDUCATION
SENSE IT: Teaching STEM principles to middle and high school students
through the design, construction and deployment of water quality sensors
the professional development experiences and the classroom materials. As we grow the program
and network of SENSE IT teachers, we also plan to administer similar evaluation tools to continue
understanding the impact of SENSE IT materials on students and teachers. The refi ned SENSE
IT materials will continue to ease classroom implementation issues and increase the numbers of
teachers and students exposed to hands-on learning experiences that revolve around the world of
sensors, as well as help them prepare students to handle the complex, multidisciplinary challenges
awaiting them in the 21st century, technology-focused workplace.
ACKNOWLEDGMENTS
This work was made possible through the National Science Foundation Innovative Technology
Experiences for Students and Teachers (ITEST) program (Award #0833440). The authors would
like to thank the teachers and students who participated in the SENSE IT project for their hard work
and collaboration, and thank the anonymous AEE reviewers for their careful readings and helpful
suggestions.
REFERENCES
Blumenfeld, P.C. et al. (1991). Motivating project-based learning: Sustaining the doing, supporting the learning. Edu-
cational Psychologist, 26, 369–398.
Blumenfeld, G., Marx, R., Soloway, E., & Krajcik, J. (1996). Learning with peers: From small group cooperation to col-
laborative communities. Educational Researcher, 25(8), 37–40.
Bransford, J, Brown, A., and Cocking, R. (1999). How People Learn. Washington, D.C.: National Academy Press.
Brown, A.L. (1992). Design experiments: Theoretical and methodological challenges in creating complex interventions
in classroom settings. Journal of the Learning Sciences, 2(2), 141–178.
Building Engineering and Science Talent (BEST). (2004). The Talent Imperative: Diversifying America’s Science and
Engineering Workforce. Accessed October 2, 2011. (http://www.bestworkforce.org/PDFdocs/BESTTalentImperativeFI-
NAL.pdf)
Caine, R.N., and Caine, G. (1991). Making Connections: Teaching and the Human Brain. Alexandria, VA: Association
for Supervision and Curriculum Development.
Conrath, J. (1986). Our other youth: handbook of guidelines for teachers and other adults who work with at risk kids
and discouraged or defeated learners. Gig Harbor, WA.
Dewey, J. (1934). Art as experience. New York: Pedigree.
Fishman, B. J., Marx, R.W., Best, S., & Tal, R.T. (2003). Linking teacher and student learning to improve professional
development in systemic reform. Teaching and Teacher Education, 19 (6), 643–658.
Harel, I, & Papert, S. (1991). Constructionism. Norwood, NJ: Ablex Publishing.

32 SUMMER 2012
ADVANCES IN ENGINEERING EDUCATION
SENSE IT: Teaching STEM principles to middle and high school students through
the design, construction and deployment of water quality sensors
Harel, I., & Papert, S. (1990). Software design as a learning environment. Interactive Learning Environments, 1(1),
1–32.
Hotaling, L., Stolkin, R., Lowes, S., Lin, P., Bonner, J., Kirkey, W., & Ojo, T. (2011). Student-Created Water Quality Sen-
sors. Paper presented at the ASEE 2011 Annual Conference & Exposition, Vancouver, Canada, July. (Best Paper Honorable
Mention.)
Khardon, R. & Roth, D. (1997). Learning to Reason. Journal of the ACM (JACM), 44 (5), 697–725.
Macalalag, A.Z., Tirthali, D., McGrath, E., McKay, M., & Lowes, S. (2011). Teacher Professional Development Programs in
Grades 3–8: Promoting Teachers’ and Students’ Content Knowledge in Science and Engineering. Paper presented at the
National Science Foundation’s Mathematics and Science Partnerships Learning Network Conference, Washington, D.C.
Macalalag, A., Lowes, S., Guo, K., & McKay, M. (2010). Teacher Professional Development in Grades 3–5: Fostering
Teachers’ and Students’ Content Knowledge in Science and Engineering. Paper presented at the American Society for
Engineering Education Annual Conference, Louisville, KY, June.
Mishra, P. & Koehler, M. (2006). “Technological Pedagogical Content Knowledge: A Framework for Teacher Knowledge.”
Teachers College Record 108 (6), 1017–1054.
McGrath, E., Lowes, S., McKay, M., Sayres, J., & Lin, P. (2012). “Robots Underwater! Learning Science, Engineering and
21st Century Skills: The Evolution of Curricula, Professional Development and Research in Formal and Informal Contexts.”
In B. Barker, G. Nugent, N. Grandgenett, and V.I., Adamchuk (Eds.), Robotics in K-12 Education. Hershey, PA: IGI Global.
McGrath, E. & Lowes, S. (2011). Infusing Non-Traditional Engineering Projects into Traditional Classrooms: Where Do
They Fit? How Are They Assessed?” Paper presented at the ASEE 2011 Annual Conference & Exposition, Vancouver,
Canada, July.
National Science Foundation. (2005). The Sensor Revolution: A Special Report. Online at http://www.nsf.gov/news/
special_reports/sensor/index.jsp.
Papert, S. (1991). Situating Constructionism. In I. Harel & S. Papert (Eds.), Constructionism. Ablex Publishing, Norwood,
NJ, 1991
Perkins, D. N. (1986). Knowledge as design. Hillsdale, N.J: Lawrence Erlbaum Associates.
Roup, R., Gal, S., Drayton, B., & Pfi ster, M. (1993). LabNet: Toward a community of practice. Hillsdale, NJ: Lawrence
Erlbaum Associates.
Stevenson, H.W., & Stigler, J.W. The learning gap: why our schools are failing and what we can learn from Japanese
and Chinese education. New York: Summit Books, 1992.
U.S. Commission on Ocean Policy (2004). An Ocean Blueprint for the 21st Century. Final Report. Washington, DC.
Wenglinsky, H., & Silverstein, S. C. (2006). The science training teachers need. Educational Leadership 64 (4),
24–29.

SUMMER 2012 33
ADVANCES IN ENGINEERING EDUCATION
SENSE IT: Teaching STEM principles to middle and high school students
through the design, construction and deployment of water quality sensors
AUTHORS
Liesl Hotaling, University of South Florida ([email protected].
edu) Ms. Hotaling specializes in real time data education projects and
hands-on STEM educational projects supporting environmental ob-
serving networks. She serves as a Co-PI and Project Manager for the
SENSE IT project.
Susan Lowes, Teachers College/Columbia University ([email protected])
Dr. Lowes, Director of Research and Evaluation at the Institute for Learn-
ing Technologies at Teachers College/Columbia University, serves as
project evaluator on SENSE IT. Dr. Lowes has conducted evaluations of
projects that develop, test, and the use of new technologies in STEM
learning at the university and K-12 levels, including multi-year projects
funded by the U.S. Dept. of Education and the National Science Founda-
tion, and has served on Dept. of Education and NSF Advisory and Review
panels. She is also Adjunct Professor in the Program in Computers, Communication, Technology,
and Education at Teachers College, teaching courses on methodologies for researching technology
and on online schools and schooling.
Rustam Stolkin, University of Birmingham ([email protected]).
Dr. Stolkin is a Senior Research Fellow with the School of Computer
Science, University of Birmingham in the U.K. He is an interdisciplinary
engineer with diverse research interests including sensor systems, robot-
ics, pattern recognition, and engineering education. In addition to his
engineering research, Dr. Stolkin has extensive experience developing
innovative STEM project-based curricula for K-12 classrooms.

34 SUMMER 2012
ADVANCES IN ENGINEERING EDUCATION
SENSE IT: Teaching STEM principles to middle and high school students through
the design, construction and deployment of water quality sensors
Peiyi Lin, Teachers College, Columbia University (pl2151@columbia.
edu). Ms. Lin is a graduate student at Columbia University and assists
Dr. Susan Lowes with the evaluation of SENSE IT. Her research interests
are the role of administrative support in teacher professional develop-
ment, and teacher and external factors that affect the implementation
of innovative curriculum in STEM professional development
James Bonner, Clarkson University ([email protected]).
Dr. Bonner is a Professor of Environmental Engineering at Clarkson Uni-
versity. He has developed new technologies that provide real-time con-
tinuous monitoring with in-situ sensing (“sensing in place”) to measure
important water parameters. With funding from the National Science
Foundation, he has contributed to a national effort to create a cyber-
collaboratory framework, enabling collection and circulation of real-time
data and data analysis in the study of oxygen depletion in water.
William Kirkey, Clarkson University ([email protected]). Mr.
Kirkey is a graduate student and research assistant at Clarkson Univer-
sity working with Dr. James Bonner on real-time continuous monitoring
systems.
Temitope Ojo, Clarkson University ([email protected]). Dr. Ojo is a
Research Assistant Professor in the Civil and Environmental Engineering
department at Clarkson University. Having worked extensively in the
upstream sector of the oil industry offshore West Africa, he developed
an interest in the impacts of crude oil exploration and production on
the marine environment. His research is focused on the application
of engineered systems health monitoring principles and methods to
natural systems.