advanced waveform simulation for seismic …advanced waveform simulation for seismic monitoring...
TRANSCRIPT
ADVANCED WAVEFORM SIMULATION FOR SEISMIC MONITORING EVENTS
Don V. Helmberger1, Jeroen Tromp1, and Arthur J. Rodgers2
California Institute of Technology1 and Lawrence Livermore National Laboratory2
Sponsored by National Nuclear Security Administration Office of Nonproliferation Research and Development
Office of Defense Nuclear Nonproliferation
Contract No. DE-FC52-06NA273191,2 ABSTRACT Comprehensive nuclear-test-ban monitoring in terms of location and discrimination has progressed significantly in recent years. However, the characterization of sources and the estimation of low yields remains a particular challenge. As the recent Korean shot demonstrated, we can probably expect to have a small set of teleseismic, far-regional and high-frequency regional data to analyze in estimating the yield of an event. Since stacking helps to bring signals out of the noise, it becomes useful to conduct comparable analyses on neighboring events, earthquakes in this case. If these auxiliary events have accurate moments and source descriptions, we have a means of directly comparing effective source strengths. Although we will rely on modeling codes, 1D, 2D, and 3D, we will also apply a broadband calibration procedure to use longer periods (P >5 s) of waveform data to calibrate short-period (P between 0.5 to 2 Hz) and high-frequency (P between 2 to 10 Hz) as path-specific station corrections from well-known regional sources. We have expanded our basic cut-and-paste (CAP) methodology to include not only timing shifts but also amplitude (f) corrections at recording sites. The name of this method was derived from source inversions that allow timing shifts between “waveform segments” (or cutting the seismogram up and re-assembling) to correct for crustal variation. For convenience, we will refer to these f-dependent refinements as CAP+ for (short period, SP) and CAP++ for still higher frequency. These methods allow the retrieval of source parameters using only P-waveforms where radiation patterns are obvious as demonstrated in this report and are well suited for explosion P-wave data. The method is easily extended to all distances because it uses Green’s function although there may be some changes required in t* to adjust for offsets between local vs. teleseismic distances. In short, we use a mixture of model-dependent and empirical corrections to tackle the path effects. Although we rely on the large TriNet array as a testbed for refining methods, we will present some preliminary results on Korea and Iran.
29th Monitoring Research Review: Ground-Based Nuclear Explosion Monitoring Technologies
80

Report Documentation Page Form ApprovedOMB No. 0704-0188
Public reporting burden for the collection of information is estimated to average 1 hour per response, including the time for reviewing instructions, searching existing data sources, gathering andmaintaining the data needed, and completing and reviewing the collection of information. Send comments regarding this burden estimate or any other aspect of this collection of information,including suggestions for reducing this burden, to Washington Headquarters Services, Directorate for Information Operations and Reports, 1215 Jefferson Davis Highway, Suite 1204, ArlingtonVA 22202-4302. Respondents should be aware that notwithstanding any other provision of law, no person shall be subject to a penalty for failing to comply with a collection of information if itdoes not display a currently valid OMB control number.
1. REPORT DATE SEP 2007 2. REPORT TYPE
3. DATES COVERED 00-00-2007 to 00-00-2007
4. TITLE AND SUBTITLE Advanced Waveform Simulation for Seismic Monitoring Events
5a. CONTRACT NUMBER
5b. GRANT NUMBER
5c. PROGRAM ELEMENT NUMBER
6. AUTHOR(S) 5d. PROJECT NUMBER
5e. TASK NUMBER
5f. WORK UNIT NUMBER
7. PERFORMING ORGANIZATION NAME(S) AND ADDRESS(ES) Lawrence Livermore National Laboratory,PO Box 808,Livermore,CA,94551-0808
8. PERFORMING ORGANIZATIONREPORT NUMBER
9. SPONSORING/MONITORING AGENCY NAME(S) AND ADDRESS(ES) 10. SPONSOR/MONITOR’S ACRONYM(S)
11. SPONSOR/MONITOR’S REPORT NUMBER(S)
12. DISTRIBUTION/AVAILABILITY STATEMENT Approved for public release; distribution unlimited
13. SUPPLEMENTARY NOTES Proceedings of the 29th Monitoring Research Review: Ground-Based Nuclear Explosion MonitoringTechnologies, 25-27 Sep 2007, Denver, CO sponsored by the National Nuclear Security Administration(NNSA) and the Air Force Research Laboratory (AFRL)
14. ABSTRACT see report
15. SUBJECT TERMS
16. SECURITY CLASSIFICATION OF: 17. LIMITATION OF ABSTRACT Same as
Report (SAR)
18. NUMBEROF PAGES
11
19a. NAME OFRESPONSIBLE PERSON
a. REPORT unclassified
b. ABSTRACT unclassified
c. THIS PAGE unclassified
Standard Form 298 (Rev. 8-98) Prescribed by ANSI Std Z39-18
OBJECTIVE Our main objective is to develop methods for locating and identifying seismic events, focusing primarily on earthquakes but including mining blasts and explosions. To advance methodologies, we want to use our computational resources to address both deterministic approaches as well as to develop a better physical understanding of scattering where frequency-dependent coda magnitudes prove so effective. While the latter is apparently source-reduction pattern free (above some cut-off frequency), the direct phases are not and thus the combination should be even more effective in discrimination. In this report, we concentrate on the direct phases and produce a very well recorded set of events (2 < M < 5) which can be used for calibration and scattering models. RESEARCH ACCOMPLISHED The primary objective of this research is to use earthquake data to model and calibrate paths so that more accurate estimates of explosion strengths can be established for regions of interest. The basic idea of using events (Mw > 4) to calibrate paths has been introduced earlier, i.e., Song and Helmberger (1998). They attempted to build on the empirical Green’s function method, Hartzell (1978), by generating pseudo Green’s functions that are less dependent on source excitation. The method uses the perturbation of individual generalized ray responses calculated from a 1D model where each layer is divided into blocks and allowed to vary in velocity. The small shifts produced by these tomographic changes are assembled to force 1D Green’s functions to fit data better using a simulated annealing algorithm. Application to a set of the Landers’ earthquake aftershocks is given in Helmberger et al. (2001) where the most variable velocities occur along the surface or just above the Moho. Several automated waveform modeling techniques are currently available for estimating source parameters based on fitting long-period (LP) data (periods > 5 s). Most methods rely on a library of 1D Green’s functions which are compared against observed records to deduce moment, mechanism, and depth for M > 3.5. A method we prefer uses a cut-and-paste procedure (CAP) which allows P-waves to be fit independent of the stronger surface waves, where timing shifts are allowed between phases. This approach is somewhat simpler than those discussed above. These shifts can be used to derive a new 3D model as demonstrated in this report or stored as a tomographic-type map to be used in extracting parameters for smaller events. An example of the CAP analysis is given in Figures 1 and 2 for a moderate magnitude event occurring in Iran. Note that the Pnl portions of the vertical and radial segments have been enhanced on the left and fit separately. The numbers below each trace indicates the cross-correlations (top) and shifts (lower). The header line states the model, the strike (59°), the dip (80°), and the slip direction (40°). The depth is estimated to be 4 km, and has a magnitude Mw of 5.2. The number after the station name indicates the distance in km. This event is well-recorded globally and becomes a natural starting place for using a combination of regional and teleseismic data to study events. A collection of this type of data is being assembled (Rodgers et al., 1999). However, we concentrate on the technique development using the Southern California Seismic Network as a testbed. We address five issues: (1) refining models and CAP validation, (2) two-station solutions, (3) extension of CAP to contain amplitude corrections, (4) directivity and cluster analysis, and (5) site characterization. 1. Refining Velocity Models and Validation Using the CAP method, we have avoided propagational complexities by allowing shifts in record segments. Here we will use these shifts to refine crustal structure. The procedure for refining the upper crust is displayed in Figure 3. We have obtained the shift required to align the 1D synthetics with the observed waveforms for about 200 events. The delays are given in terms of a spider diagram where the model produces early synthetics in general (red). The cross-correlations are displayed in similar fashion where most of the fits are good (blue). The delays for all of the events can be assembled and used to generate a tomography image (block-type) and slightly smoothed as displayed for Love waves. Earlier sensitivity studies indicate that the seismogenic layer containing the source controls the timing, Song et al. (1996).
29th Monitoring Research Review: Ground-Based Nuclear Explosion Monitoring Technologies
81
Synthetics (upper right) can then be generated with a fast (2D) FD routine assuming the mechanisms obtained from the CAP solutions, Helmberger and Vidale (1988). The bottom seismogram was generated with FK-1D, Saikia (1994). Comparisons for the 1D and 2D FD synthetics are also included for comparison with the data trace (top). These records are filtered to 5s which is the normal filter (LP) used in the CAP inversion. The spider diagram at the bottom (2D) indicates the improvement in timing of the new model although the fits remain unchanged. These calculations are fast, taking about 5 minutes per event on a desktop computer. Similar results are obtained for the other events and will be presented at the annual meeting. 2. Locating and Modeling Regional Earthquakes with Two Stations We have introduced a new technique to retrieve source parameters including location by using established shifts, either from measurements or 3D models, Tan et al. (2006). The method conducts a grid search in a cube centered over the source target comparing synthetics with shifts to observed records to determine location, depth, origin time, and mechanism that best fits the 3-component seismograms. The method was tested on 28 events beneath the Tibetan Plateau against a Program for the Array Seismic Studies of the Continental Lithosphere (PASSCAL) array solutions. Here we test over 160 events against a large station distribution, with a sample of the average fits and one of the poorest (Figure 4). 3. Extension of CAP to Shorter Periods The changeover from LP (> 5 s) to SP (< 0.5 s) waveform modeling is facing the inherent trade-offs between source complexity and structural heterogeneity. Under such circumstances, analyzing clustered events provides a practical way to “separate” the source from the structural effect. The feasibility is displayed in Figure 5, where we compare the records at the same station GSC from three clustered events of different sizes. The two smaller events are overwhelmed by noise in long-period (0.05-0.2 Hz) frequency band; however, they produce decent signals at higher frequencies, such as 0.5–2 Hz, or 2–8 Hz. In particular, at 0.5–2 Hz, the discrepancies between the records from the magnitude 4 (13938812) and magnitude 2 (13937632) events are mainly caused by their differences in size and focal mechanism, while the effects from the detailed rupture processes are considerably smaller. This suggests that short-period P-waves can be used for determining focal mechanisms of magnitude 2 events if we could calibrate the path effect using magnitude 4 events with known source mechanisms. The same is true when it comes to the magnitude 2 (13937632) and magnitude 1 (13939108) events at higher frequency (2–8 Hz). On the other hand, the smaller events can provide excellent empirical Green’s functions for studying the detailed rupture process of the magnitude 4 event. Such a “two way” calibration process is what we have demonstrated in our recent papers (Tan and Helmberger, 2007a and 2007b). The discrepancies between the observed P-waves and the synthetics are mainly manifested as amplitude differences. For a quantification purpose, we define the function of “amplitude amplification factor” (AAF) as
( )( )
2
2,
u t dtAAF
s t dt= ∫
∫ (1)
where u(t) and s(t) are the data and synthetics, respectively. The integration is over a 2 s window centered on the onset of the P-wave. It appears that the most anomalous AAFs occur for the stations in the basins. In particular, these stations are consistently characterized by large AAFs (> 1) on the vertical component, but small AAFs (< 1) on the radial component. This discrepancy between the vertical and radial components has been noted by many previous investigators (e.g., Savage and Helmberger, 2004) and is addressed later in this proposal. By comparing the AAFs derived from all the calibration events, particularly, the thrust and the strike-slip events, we found a large number (~70) of stations display stable and mechanism-independent AAFs, which suggests the amplitude discrepancy of the synthetic P-waves could be corrected to model the observations, hence determine the earthquake source parameters.
29th Monitoring Research Review: Ground-Based Nuclear Explosion Monitoring Technologies
82
We invert the short-period P waves with a similar grid-search approach as in the long-period inversion, where we minimize the L2 norm of the misfit between the data and synthetics:
( ) ( ). .e u t AAF s t= − (2)
The AAFs in equation (2) are taken as the averages of the AAFs derived from all the calibration events to account for the structural effect. The few stations that display rapid variations of the AAFs among the calibration events are discarded. The validation test with respect to the calibration events shows remarkable agreement between the results from short-period P-wave inversions and their LP solutions. The same strategy can be carried to higher-frequency bands, e.g., 2–8 Hz, and hence be applied to smaller events. To examine the AAFs at higher frequencies and their usefulness in determining smaller events’ focal mechanisms, we conducted an AAF calibration process at 2–8 Hz with 21 Mw ~ 2.5 events from the Big Bear cluster. Although the site deviations are generally larger, the AAFs still appear stable and mechanism-independent. More importantly, when we conducted P wave inversions with these AAF corrections for the calibration events, their resulted mechanisms agree with those determined at 0.5–2 Hz solutions. A few examples of the resultant waveform fits are given in Figure 6. Note the nodal behavior of the few stations, such as NBS, HEC, BEL, BLA, RVR, and SVD. This preliminary study suggests that the P-wave radiation pattern is still preserved for a large number of stations at 2–8 Hz. As the AAFs for these stations are calibrated, they can be used for studying source mechanisms of magnitude 1 events. Thus, these small events can be used to study the directivity of events 2.5 < Mw < 3.5 using the same procedure given by Eq. (4). Note at these frequencies, we can study small explosions. 4. Rupture Directivity and Cluster Analysis Most large events (M > 3.5) show considerable rupture directivity in terms of source duration variation with azimuth. Here we will take the magnitude 2 events as empirical Green’s functions (EGFs) to investigate the rupture processes of the 7 larger strike-slip events (Mw > 3.5) from the Big Bear sequence. Rather than deconvolution (e.g., McGuire, 2004) or estimating finite-moment tensors (FMTs), we propose an alternative approach of forward modeling to retrieve the relative source-time function (RSTFs). Let d(t) and g(t) be the records from a large event (Mw > 3.5) and the associated EGF event at the same station, which can be related by the relative source time function, RSTF(t) of the large event as:
( ) ( ) ( ).d t g t RSTF t= ∗ (3) Assuming a simple trapezoidal shape of RSTF(t) according to the 1D Haskell model (Haskell, 1964), where a RSTF(t) can be parameterized as the convolution of two boxcars, featuring the rise time τ1 and the rupture time τ2, we can solve for the RSTF(t) in a grid search manner by minimizing the misfit defined as
( ) ( ) ( )
( ) ( ) ( )0
1 2
,
.
e d t M g t RSTF t
where RSTF t t tτ τ
= − Δ ∗
= ∗ (4)
Here the parallels denote the L2 norm. ∆M0 is an amplitude scaling factor to account for the two events’ known difference in size and radiation patterns. We first use the event 13937492 to illustrate the whole process, which is also the smallest (Mw ~ 3.5) among our analyzed events (Figure 7). 5. Site Characterization Thus, it appears that the greatest barrier to modeling at short periods (< 2 s) or wavelengths less than 10 km is simply the scattering produced by the surface. This is no surprise to those researchers working with down-hole arrays, but it is surprising how well simple calibration works to correct for some of these complicated features. Although not discussed here, one of the greatest advantages of working with wavelengths less than a few km is that directivity effects are relatively obvious as displayed earlier. While the AAFs themselves are back-azimuth and distance-dependent, their ratios between the vertical and radial components appear constant and are possibly simple functions of site conditions
29th Monitoring Research Review: Ground-Based Nuclear Explosion Monitoring Technologies
83
(Figure 8). Note the clustering of the AAF(v)/AAF(r) ratios at the various stations from events at different locations. There is also good correlation between the AAF(v)/AAF(r) ratios and the surface geology; the relationship between this ratio and the site condition will be pursued as more measurements are made. RECOMMENDATIONS In summary, we are adjusting our research efforts to address one of the primary issues facing the Air Force Technical Applications Center (AFTAC )monitoring community, namely, discrimination at high frequency (HF) and yield estimation of small explosions. Since these events are P-wave rich, we have extended our regional modeling efforts to 8 Hz where the surface conditions at the recording station play a key role. To achieve this, we rely on empirical corrections of 1D Green’s functions stepping downward in magnitudes as the fault-dimensions become shorter and shorter, avoiding rupture properties, i.e., 4’s are used to study 3’s, 3’s to study 2’s, etc. This hybrid approach now appears to work for CAP (shifts only), CAP+ (corrected for amplitude, 2 to 0.5 Hz), and CAP++ (corrected for 2 to 8 Hz). These corrections are path-dependent and rely on earthquakes for calibration although the shifts can probably be obtained from tomography and site conditions from topography images. The next step is to apply these methods to explosions, including Nevada Test Site explosions, and compare with other methods, Coda magnitudes, etc. REFERENCES
Hartzell, S. H. (1978). Earthquake aftershocks as Green’s functions, Geophys Res. Lett. 5: 1–4.
Haskell, N. A. (1964). Total energy and energy spectra density of elastic waves from propagating faults, Bull. Seismol. Soc. Am. 54: 1811–1841.
Helmberger, D. V. and J. E. Vidale (1988). Modeling strong motions produced by earthquakes with 2D numerical codes, Seismol. Soc. Am. Bull. 78: 109–121.
Helmberger, D. V., X. J. Song, and L. Zhu (2001). Crustal complexity from regional waveform tomography: Aftershocks of the 1992 Landers earthquake, California, J. Geophys. Res. 106: 609–620.
Lin, G. and Peter Shearer (2007). Estimating local Vp/Vs ratios within similar earthquake clusters, Bull. Seismol. Soc. Am. 97: 379–388.
McGuire, J. J. (2004). Estimating finite source properties of small earthquake ruptures, Bull. Seismol. Soc. Am. 94: 377–393.
Rodgers, A. J., W. Walter, R. Mellors, A. M. S. Al-Amri, and Y.-S.Zhang (1999). Lithospheric structure of the Arabian Shield and Platform from complete regional waveform modeling and surface wave group velocities, Geophys. J. Int. 138: 871–78.
Saikia, C. K. (1994). Modified frequency-wavenumber algorithm for regional seismograms using Filon’s quadrature-modeling of Lg waves in North America, Geophys. J. Int. 118: 142–158.
Savage, B. and D. V. Helmberger (2004). Site response from incident Pnl waves, Bull. Seismol. Soc. Am. 94: 357–362.
Song, Xi J., D. V. Helmberger, and L. Zhao (1996). Broad-band modeling of regional seismograms: The basin and range crustal structure, Geophys. J. Int. 125: 15–19.
Song, Xi J. and D. V. Helmberger (1998). Pseudo Green’s functions and waveform tomography, Bull. Seismol. Soc. Am. 88: 304–312.
Tan, Ying (2006). Broadband waveform modeling over a dense seismic network, Ph.D. thesis, California Institute of Technology, Pasadena, California.
Tan, Ying, L. Zhu, D. V. Helmberger, and C. Saikia (2006). Locating and modeling regional earthquakes with two stations, J. Geophys. Res. 111: 306–320.
Tan, Ying and D. V. Helmberger (2007). A new method for determining small earthquake source parameters using short-period P waves, Bull. Seismol. Soc. Am. (in press).
Tan, Ying and D. V. Helmberger (2007). Rupture directivity of the 2003 Big Bear aftershocks, Bull. Seismol. Soc. Am. (in press).
Zhu, Lupei and D. V. Helmberger (1996). Advancement in Source Estimation Techniques Using Broadband Regional Seismograms, Bull. Seismol. Soc. Am. 86: 1634–1641.
29th Monitoring Research Review: Ground-Based Nuclear Explosion Monitoring Technologies
84

Figure 1. GSN (red square), KZ and KN (red triangles) and IIEES (black triangles) stations in and around Iran. Blue dots indicate earthquakes from the National earthquake Information Center (NEIC) catalog (big dots: earthquake > M5, small dots: < M5). The red star is the 060507 event modeled with the CAP algorithm for IIEES stations.
Figure 2. Application of CAP to the modeling of the 060507 event. This earthquake features a mostly strike-slip mechanism with some normal component. The focal depth is estimated to be around 4 km, as compared to 14 km from the IIEES catalog. The closest station is 90 km away, so depth ca not be well resolved just from first arrivals.
29th Monitoring Research Review: Ground-Based Nuclear Explosion Monitoring Technologies
85
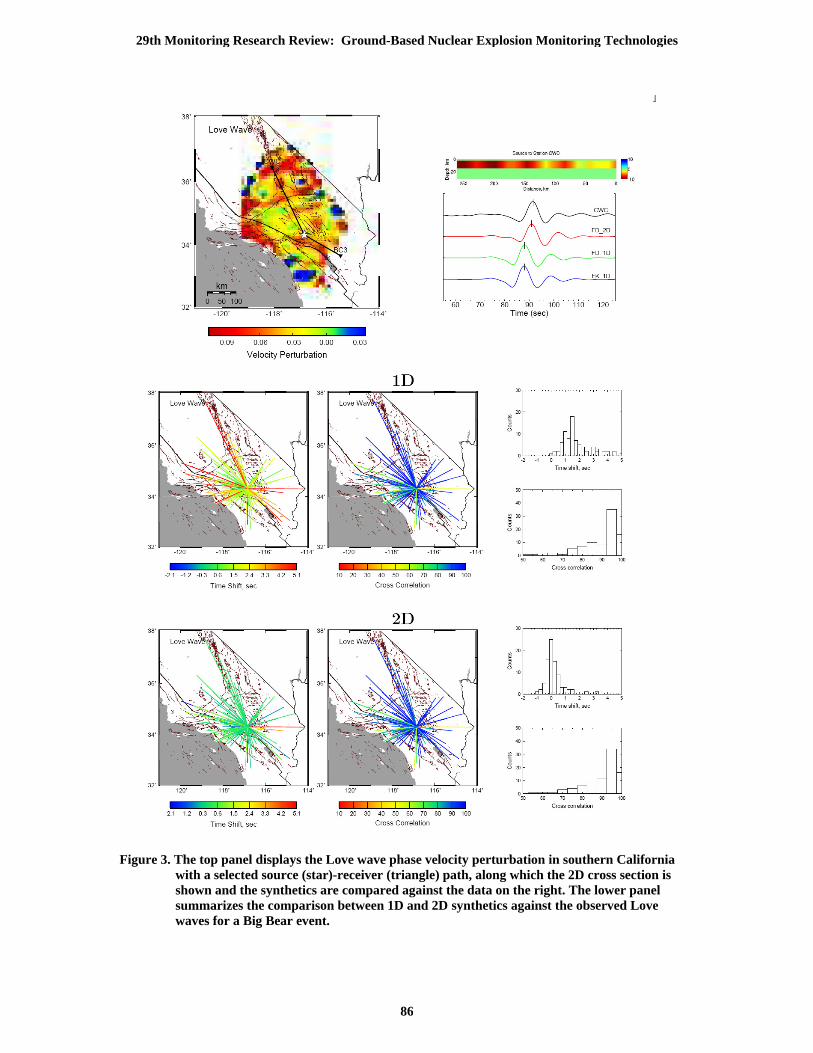
Figure 3. The top panel displays the Love wave phase velocity perturbation in southern California
with a selected source (star)-receiver (triangle) path, along which the 2D cross section is shown and the synthetics are compared against the data on the right. The lower panel summarizes the comparison between 1D and 2D synthetics against the observed Love waves for a Big Bear event.
29th Monitoring Research Review: Ground-Based Nuclear Explosion Monitoring Technologies
86
-116˚30' -116˚15'
34˚45'
35˚00'
1.5
1.51.5
2.5
2.5
2.5
2.5
2.5
3.5
3.5
3.5
3.5
3.5
1.2
1.2
1.2
1.2
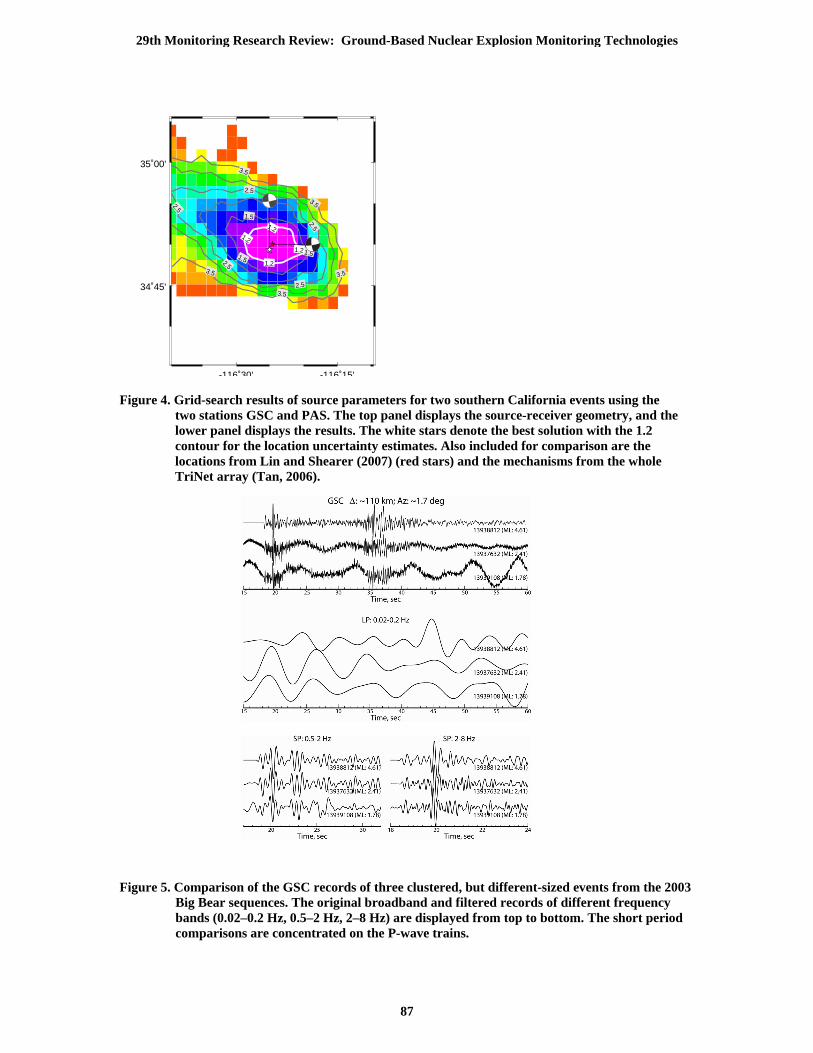
Figure 4. Grid-search results of source parameters for two southern California events using the
two stations GSC and PAS. The top panel displays the source-receiver geometry, and the lower panel displays the results. The white stars denote the best solution with the 1.2 contour for the location uncertainty estimates. Also included for comparison are the locations from Lin and Shearer (2007) (red stars) and the mechanisms from the whole TriNet array (Tan, 2006).
Figure 5. Comparison of the GSC records of three clustered, but different-sized events from the 2003
Big Bear sequences. The original broadband and filtered records of different frequency bands (0.02–0.2 Hz, 0.5–2 Hz, 2–8 Hz) are displayed from top to bottom. The short period comparisons are concentrated on the P-wave trains.
29th Monitoring Research Review: Ground-Based Nuclear Explosion Monitoring Technologies
87

Figure 6. Comparison of the P-wave waveform fits from the 2–8 Hz short-period inversions for three
events with different mechanisms.
29th Monitoring Research Review: Ground-Based Nuclear Explosion Monitoring Technologies
88

Figure 7a
Figure 7b Figure 7c Figure 7. (a) The selected waveform fits (vertical P-waves) between the records from event 13937492
(black) and the “synthetics”(red) constructed with EGFs from event 13937632. The RSTFs are given to the left. Plotted are the absolute amplitudes, except that a scaling factor of 1/4, 1/2 and 2 has been applied to the stations JVA, PDU, and PLS, respectively, for the display purposes. The obtained best RSTFs for the stations are circled. Note the apparent azimuthal pattern of the RSTFs. (b).The vertical P wave amplitude ratios between the event 13937492 (M ~ 3.5) and 13937632 (M ~ 2.5). The two events have similar strike slip focal mechanisms. The two gray lines display the strikes of their fault planes. Note the amplitude ratios for the southeastern stations are consistently larger than those for the northwestern stations, due to the rupture directivity effect of the bigger event. (c) The inferred rupture directivities from the Big Bear cluster. The arrows point to the rupture directions, while their lengths (for the solid ones) indicate the fault lengths. Note that the ruptured planes correlate well with the seismicity lineations, suggesting cross-over faults at depth.
29th Monitoring Research Review: Ground-Based Nuclear Explosion Monitoring Technologies
89

Figure 8. (top) The comparison of the ratios between the AAFs for the vertical and radial
components from six events vs. those from the 2003 Big Bear sequence. The stations are grouped and color-coded according to their site-conditions as shown in the bottom. (bottom) The source parameters of the events for comparison (from Tan (2006)) and the station locations are displayed on a geologically-determined site-condition map from Wills et al. (2000). Labeled is the representative Vs
30 of the top 30 m for each category, and the expected range of Vs.
29th Monitoring Research Review: Ground-Based Nuclear Explosion Monitoring Technologies
90