advanced radiometry measurements and earth science applications
TRANSCRIPT

Remote Sensing of Environment 158 (2015) 207–219
Contents lists available at ScienceDirect
Remote Sensing of Environment
j ourna l homepage: www.e lsev ie r .com/ locate / rse
Advanced radiometrymeasurements and Earth science applicationswiththe Airborne Prism Experiment (APEX)
Michael E. Schaepman a,⁎, Michael Jehle a, Andreas Hueni a, Petra D'Odorico a,1, Alexander Damm a,JürgWeyermann a, Fabian D. Schneider a, Valérie Laurent a,2, Christoph Popp b, Felix C. Seidel c, Karim Lenhard d,Peter Gege d, Christoph Küchler e, Jason Brazile f, Peter Kohler f, Lieve De Vos g, Koen Meuleman h,Roland Meynart i, Daniel Schläpfer j, Mathias Kneubühler a, Klaus I. Itten a,3
a Remote Sensing Laboratories, University of Zurich, Winterthurerstrasse 190, CH-8057 Zurich, Switzerlandb NMNH, Smithsonian Institution, Washington, DC 20013-7012, USAc Jet Propulsion Laboratory, California Institute of Technology, 4800 Oak Grove Drive, Pasadena, CA 91109, USAd Earth Observation Center, German Aerospace Center, Oberpfaffenhofen, 82234 Wessling, Germanye RUAG Schweiz AG, RUAG Aviation, Seetalstrasse 175, 6032 Emmen, CH, Switzerlandf Netcetera AG, Zypressenstrasse 71, 8004 Zurich, CH, Switzerlandg OIP Sensor Systems, Westerring 21, 9700 Oudenaarde, Belgiumh VITO, Boeretang 200, 2400 Mol, Belgiumi ESA-ESTEC, Keperlaan 1, 2201 AZ Noordwijk, Netherlandsj ReSe Applications Schläpfer, Langeggweg 3, 9500 Wil, CH, Switzerland
⁎ Corresponding author. Tel.: +41 44 635 51 60.E-mail address: [email protected] (M.E
1 Present address: Institute of Agricultural ScienceTechnology, Universitätsstrasse 2, 8092 Zurich, CH, Switze
2 Present address: Irstea—UMR Tetis, Maison de la Tél34093 Montpellier, France.
3 Permanent address: Hintere Rietstrasse 9, 8103 Unter
http://dx.doi.org/10.1016/j.rse.2014.11.0140034-4257/© 2014 The Authors. Published by Elsevier Inc
a b s t r a c t
a r t i c l e i n f oArticle history:Received 17 April 2014Received in revised form 15 September 2014Accepted 9 November 2014Available online xxxx
Keywords:Imaging spectroscopyEarth observationAPEXCalibrationProcessingValidationEarth science applications
Wepresent the Airborne Prism Experiment (APEX), its calibration and subsequent radiometric measurements aswell as Earth science applications derived from this data. APEX is a dispersive pushbroom imaging spectrometercovering the solar reflected wavelength range between 372 and 2540 nmwith nominal 312 (max. 532) spectralbands. APEX is calibrated using a combination of laboratory, in-flight and vicarious calibration approaches. Theseare complemented by using a forward and inverse radiative transfer modeling approach, suitable to further val-idate APEX data. We establish traceability of APEX radiances to a primary calibration standard, including uncer-tainty analysis. We also discuss the instrument simulation process ranging from initial specifications toperformance validation. In a second part, we present Earth science applications using APEX. They include geo-metric and atmospheric compensated as well as reflectance anisotropy minimized Level 2 data. Further, we dis-cuss retrieval of aerosol optical depth as well as vertical column density of NOx, a radiance data-based coupledcanopy–atmospheremodel, and finallymeasuring sun-induced chlorophyll fluorescence (Fs) and infer plant pig-ment content. The results report on all APEX specifications including validation. APEX radiances are traceable to aprimary standard with b4% uncertainty and with an average SNR of N625 for all spectral bands. Radiance basedvicarious calibration is traceable to a secondary standard with ≤6.5% uncertainty. Except for inferring plant pig-ment content, all applications are validated using in-situmeasurement approaches andmodeling. Even relativelybroad APEX bands (FWHM of 6 nm at 760 nm) can assess Fs with modeling agreements as high as R2 = 0.87(relative RMSE=27.76%).We conclude on the use of high resolution imaging spectrometers and suggest furtherdevelopment of imaging spectrometers supporting science grade spectroscopy measurements.
© 2014 The Authors. Published by Elsevier Inc. This is an open access article under the CC BY-NC-ND license(http://creativecommons.org/licenses/by-nc-nd/3.0/).
. Schaepman).s, Swiss Federal Institute ofrland.édétection, 500 rue J.F. Breton,
engstringen, CH, Switzerland.
. This is an open access article under
1. Introduction
Imaging spectroscopy has emerged as an extremely efficient obser-vational approach for mapping the Earth system (Schaepman et al.,2009a). The efficiency gain has its foundation in technical progressmade on one hand, and on the improved understanding and modelingof the molecular scattering and absorption mechanisms, on the other.Imaging spectrometers—particularly airborne instruments—are fre-quently available nowadays, either targeting specific applications, or
the CC BY-NC-ND license (http://creativecommons.org/licenses/by-nc-nd/3.0/).

208 M.E. Schaepman et al. / Remote Sensing of Environment 158 (2015) 207–219
serving as ‘general purpose’ instruments, covering a wide range of ap-plications (for a detailed review see Schaepman, 2009).
While the general procedure of constructing and operating airborneimaging spectrometers has reached a high level of maturity, require-ments on specific instrument aspects might challenge any componentof the full data acquisition chain, ranging from sensor modeling to cali-bration to product delivery. In particular, spectral fidelity (stability,Signal-to-Noise Ratio (SNR), etc.) was very early on identified as a keyperformance requirement for successful spectroscopy applications(Green et al., 1998).
Emerging satellite concepts utilizing principles of spectroscopy astheir prime observational approach led to the idea to build a next gen-eration airborne imaging spectrometer in Switzerland during the early1990s. In fact, the idea emerged following a successful joint NASA/ESAMultisensor Airborne Campaign (MAC-Europe) in July 1991 in Europe(Itten, Meyer, Staenz, Kellenberger, & Schaepman, 1992). The fundingsource identified for such an endeavorwas the European Space Agency'sPRODEX (PROgramme de Développement d'Expériences scientifiques)program, allowing small ESA member states to develop their own in-struments. A joint Swiss–Belgian team proposed to build an airborneimaging spectrometer termed ‘Airborne Prism Experiment’ (APEX),under the scientific lead of Klaus Itten at the University of Zurich. Heserved as APEX principal investigator from 1995 to 2009 and MichaelSchaepman from 2009 onwards. A potential APEX system was for thefirst time presented to a wider public in 1997 (Itten et al., 1997).
The scientific, industrial and operational consortium of APEX wassubsequently established as follows. The science lead iswith theUniver-sity of Zurich, tasked to perform model simulations, establish systemspecifications and validate instrument performance, develop a sciencegrade processing facility, and perform the project management. Theinstitutional partner and co-investigator VITO is responsible for the op-erational implementation of the APEX processor, APEX operationsand data distribution. The industrial consortium is composed of RUAGAerospace, Switzerland (integration, mechanical and electrical subsys-tems, navigation and control), OIP Sensor Systems, Belgium (opticalsubsystem), and Netcetera AG, Switzerland (readout electronics,software). In addition, ESA as overall project responsible establishedtwo further contracts, one with Sofradir, France (short-wave infrared(SWIR) detector) and the German Aerospace Center (DLR), Germany(calibration home base). APEX went into operations in 2009 and ac-quires science grade spectroscopy data since 2010. APEX is on lease byESA to the University of Zurich and VITO until 2015 and thereafterunder ownership of the latter two institutions.
In this contribution,we discuss the evolution of the APEX instrumentstarting with simulating its key performance indicators, and definitionof specifications, its optical, electronic and mechanical design. Wethen elaborate on the calibration procedure and finally demonstratenew Earth science applications allowing monitoring the Earth surfaceand atmosphere with unprecedented accuracy. We finally conclude bydiscussing emerging instrument capabilities and applications being ofrelevance for future, upcoming imaging spectrometers.
2. APEX advanced radiometry measurements
2.1. APEX specifications and performance modeling
The APEX system was specified to allow simulating spaceborne im-aging spectrometers, supporting mission calibration and validation ef-forts. The following specifications are outlined as boundary conditions(Schaepman, De Vos, & Itten, 1998):
• Pushbroom imagingwith≤1000 imaging pixels across track, coveringa swath width of 2.5–5 km, depending on flight altitude,
• Spectral wavelength range covering 450–2500 nm,• At least 200 programmable or 300 predefined spectral bands, adapt-able to specific application requirements,
• Spectral sampling interval b15 nm and a spectral sampling width ofb1.5 the sampling interval, and
• Ability to provide calibrated data and products to geocoded and cali-brated data.
Further on, the dispersive systemof APEX had to be based on prisms,given a requirement from European Space Agency. The initial idea wasdo demonstrate that the ENVISAT/MERIS design can be used in APEXas a demonstrator for a full spectral coverage mission (400–2500 nm)as well as precursor mission of a planned imaging spectrometer inspace (Menenti et al., 2002).
Using the above specifications, a performance modeling approachcould be initiated. First, a forwardmodel simulating 1D generic imagingspectrometers is implemented (Schaepman, Schläpfer, & Müller, 2002).Key science requirements from various applications are compiled as alist of 55 variables used to forward model the instrument performance.Application requirements are forward simulated using a reflectancemodel and then converted to at-sensor radiances using a radiancemodel and finally convolved using a sensor specific model. This leadsto the possibility to model (still noise free and in 1D space) pixel-wiserequirements for a given instrument. Subsequently, certain noise com-ponents are added (Schläpfer & Schaepman, 2002) as well as a spatialcomponent allowing to assess spatial noise as well (Börner et al.,2001). These activities finally lead to a set of performance requirementsfor APEX which are used as engineering specifications (Schaepman,Schläpfer, & Itten, 2000) (Table 1, Section 4.1). However, not all specifi-cations can be simulated using the above approach, such as stability re-quirements over time. These specifications are either taken over fromexisting publications (Green, 1998; Mouroulis, Green, & Chrien, 2000)or from engineering knowledge available through the support of ESA'sengineers.
2.2. APEX instrument description
APEX is composed of an optical system including two detector chan-nels (Fig. 1), a mechanical subsystem, an electrical subsystem, and anin-flight calibration assembly. External to the core APEX imager is a con-trol and storage unit (CSU), aswell as a processing and archiving facility(PAF) and a calibration home base (CHB).
The optical system is a dual prism dispersion pushbroom imagingspectrometer using a path-folding mirror followed by a ground imagerwith a slit in its image plane (Schaepman et al., 2003). The spectrometerconsists of a collimator that directs the light transmitted by the slittowards the prisms, where a dichroic coating applied to the firstprism separates the two spectrometer channels into a VNIR and SWIRchannel (Visible/Near Infrared 372–1015 nm; Shortwave Infrared904–2508 nm). The dispersed light is imaged on the detectors ofthese two channels. A commercial-off-the-shelf VNIR detector (CCD55-30, E2V Technologies) and a custom made SWIR detector(Nowicki-Bringuier & Chorier, 2009) are implemented. The SWIR focalplane array is a HgCdTe detecting module hybridized on a CMOSmultiplexer. It has 1000 × 256 pixels with a 30 μm pitch. Integrationtime is variable, but limited by the detector frame rate (34.5 ms). Stan-dard integration time is set to 29ms [22… 34.5ms], resulting in almostsquare pixels using the default aircraft (DO-228). Its spatial direction(1000 pixels) is parallel to the detector rows and its spectral direction(256 pixels) parallel to the detector columns, which is also the readoutdirection on the focal plane. The detector is implemented in a dewarwith a sapphirewindow coatedwith anti-reflectionmaterial (transmis-sion N0.96). A Stirling cycle cooler allows operating the SWIR detectorwith low dark current at 130 K detector temperature. The mount ofthe spectrometer is liquid cooled using a transfer line and cold finger(Ulbrich et al., 2004). The 1000 across-track spatial pixels are recordedfor both channels simultaneously. Both detectors are not fully illuminat-ed in spectral direction, allowing non-illuminated lines to be used asdark current reference. The VNIR and SWIR detectors are externally

Table 1APEX specifications and corresponding validated performances for each key instrument parameter.
Parameter Specification Performance Ref.
Field of view (FOV) ±14 … ±20°±244.35 … ±349.07 mrad
28.10° (±14.05°)490.44 mrad (±245.22 mrad)
Versluys, Van Vooren and De Vos (2008)
Instantaneous Field of View (IFOV) 0.0275 … 0.0401°0.48 … 0.70 mrad
0.028°0.489 mrad
Versluys et al. (2008)
Flight altitude 4000–10,000 m a.s.l. Onboard DO-228-101:60–7620 m a.s.l.
EUFAR (2014)
Spectral channels VNIR: approx. 140SWIR: approx. 145Total: approx. 285
VNIR: max. 334; nominal 114SWIR: nominal 198Total: max. 532; nominal 312
Jehle et al., in review (2010)
Spectral range 400–2500 nm 372–2540 nmVNIR: 372–1015 nmSWIR: 940–2540 nm(SWIR cutoff at 50% of the max.response)
Chorier and Martino (2004), Jehle et al. 2015 (in press)
Spectral sampling interval 400–1050 nm: b5 nm,1050–2500 nm: b10 nm
0.45–7.5 nm5–10 nm
Jehle et al. 2015 (in press)
Spectral sampling width b1.5 ∗ Spectral sampling interval VNIR: 0.86–15 nmSWIR: 7.4–12.3 nm
Dell'Endice and Alberti (2009)
Center wavelength accuracy b0.2 nm After laboratory calibration: b0.1 nmFor a single flight line knowledge is≤0.2 nm
Dell'Endice and Alberti (2009), Jehle et al. 2015 (in press)
Signal to noise (SNR) None specified 625 (average of a 50% reflecting target,sun zenith at 24.4°)
Hueni, Schlaepfer, Jehle and Schaepman (2014), Hueni,Wooliams and Schaepman (2014)
Noise Equivalent Delta Radiance(NeDL)
None specified 0.1 mW/m2/sr/nm Hueni, Schlaepfer, Jehle and Schaepman (2014), Hueni,Wooliams and Schaepman (2014)
PSF (Point Spread Function) ≤1.75 ∗ Sampling interval b1.5 ∗ Sampling interval Dell'Endice et al. (2009)Smile b0.2 pixel b0.16 pixel for 90% of all pixels
b0.35 pixel for 10% of all pixelsDell'Endice and Alberti (2009)
Frown (Keystone) b0.16 pixel b0.16 pixel for 80% of all pixelsb0.35 pixel for 20% of all pixels
Dell'Endice and Alberti (2009)
Co-registration b0.16 pixel Average b0.55 pixel Dell'Endice and Alberti (2009)Bad pixels VNIR: clusters of bad pixels b3
SWIR: not specifiedVNIR: no bad pixelsSWIR: b0.64%
Dell'Endice and Alberti (2009)
Scanning mechanism Pushbroom Pushbroom Jehle et al. (2010)Absolute radiometric calibrationuncertainty
≤2% VNIR: 372–1015 nm: 4.2%SWIR: 940–2540 nm: 6.6%(with uncalibrated sphere-filterreflections still to be removed)
Hueni, Schlaepfer, Jehle and Schaepman (2014), Hueni,Wooliams and Schaepman (2014)
Storage capacity on board(online/offline)
N60 GB/N150 GB 500 GB on SSD Jehle et al. (2010)
Dynamic Range 12 … 16 bit VNIR: 14 bitSWIR 13 bit
Jehle et al. (2010)
Positional knowledge 20% of the ground sampling distance 50% of ground sampling distance Jehle et al. (2010)Attitude knowledge 20% of IFOV After boresight calibration: better than
5 pixels (≪1% of FOV)Jehle et al. (2010)
Navigation system, flight linerepeatability
±5% of FOV After 3 years of operation: less than50 pixels (b±2.5% of FOV)
Jehle et al. (2010)
Positional and attitude data Recording of data onto ahousekeeping channel
Fully implemented and operational Jehle et al. (2010)
209M.E. Schaepman et al. / Remote Sensing of Environment 158 (2015) 207–219
synchronized (uncertainty ±0.5 ms) allowing us to acquire images si-multaneously, even under varying integration time settings. Users re-ceive a maximum of 334 (VNIR) + 198 (SWIR) = 532 spectral bands,which can be programmed to fit a variable band setting depending ontheir requirements (Dell'Endice, Nieke, Koetz, Schaepman, & Itten,2009).
Key to the mechanical subsystem is the optical compartment, in-cluding the optical base plate, on which all optical components aremounted. The optical base plate is isolated from the instrument housingand equippedwith a separate, closed-loop cooling system. The temper-ature of the base plate is kept constant at 19 °C± 1 °C, minimizing noisesources and temperature gradients. Most of the electronic boards andpower supplies aremounted on a remote position in the baffle compart-ment, situated below the optical base plate, optimizing the thermal iso-lation. The optical compartment is sealed and the instrument isoperated in a dryNitrogen atmospherewith partial differential pressurecontrol during data acquisition (ΔP b 250 mbar). The APEX instrumentis mounted on a stabilizing platform (Leica PAV-30) providing the linkbetween aircraft and instrument and enclosed in an environmental
control box to minimize temperature fluctuations and gradients asmuch as possible.
The electrical subsystem of APEX is composed of the frontend elec-tronics, supporting frame rates of up to 43.3 Hz. Following an analog–digital conversion and multiplexing the two detector channels, dataare processed in a Field Programmable Gate Array (FPGA) to stream16 bit words in a serialized fashion through an optical high-speed linkat 700 Mbit/s to the control rack. Ancillary information is transmittedin parallel over a serial RS422 link to the control and storage rack.
The final APEX instrument component contains a built-in in-flightcalibration facility (IFC). Before and after ground data acquisition, amir-ror mechanism allows imaging an internal stabilized Quartz TungstenHalogen lamp. The lamp is located near the baffle of the instrument,therefore it's light is transmitted through a fiber-bundle and a diffusor,followed by a set of spectral calibrationfilters fully illuminatingdiffuselythe ground imager in the optical path of APEX (Schläpfer, Schaepman,Bojinski, & Börner, 2000). A moveable and calibrated ground mirror isthe only optical element not seen by APEX during in-flight calibration.A filter wheel with six filter positions in this path holds four spectral

Fig. 1. Top: APEX optical system including two detector channels. Bottom: APEX optical system in production without cover.CAD drawing and photo: L. De Vos
210 M.E. Schaepman et al. / Remote Sensing of Environment 158 (2015) 207–219
filters used for instrument spectral stability monitoring. The filters arebandpass filters (Spectrogon) with transmission features at 700, 1000and 2218 nm, and a Standard Reference Material (SRM) filter from theNational Institute for Standards and Technology (NIST) with many dis-tinct absorption features throughout the VNIR and SWIR spectral range.A fifth slot holds a neutral density glass filter (Schott NG4) and is used toavoid saturation in the VNIR channel at (very rare) expected maximumradiance levels (e.g., above snow). The sixth slot is left empty for stan-dard Earth surface data acquisition. The APEX in-flight calibration capa-bilities are primarily used to assess spectral performance changesduring in-flight and serve as comparison baseline between laboratoryand in-flight conditions (D'Odorico, Alberti, & Schaepman, 2010).Simultaneous measurements of temperature and pressure ensuremonitoring of environmental conditions in the lab, during in-flight cali-bration and data acquisition. This information is used for stabilitymodel-ing and monitoring (Jehle, Hueni, Baumgartner, Lenhard & Schaepman,
in press). IFC data analysis relies on the use of a feature-fitting algorithmcomparing laboratory and in-flight shifts of particular filter absorptionlines. In addition, the same method is used on atmospheric absorptionlines during normal imaging, allowingmonitoring the instrument's spec-tral stability (D'Odorico, Guanter, Schaepman, & Schläpfer, 2011). Re-maining spectral and radiometric variations are mostly due to changingpressure/humidity/temperature affecting the prisms refraction proper-ties, and can be estimated using ancillary data recorded by the APEX in-strument (Jehle et al., in press).
2.3. Control and storage unit
The control and storage unit (CSU) hosts instrumentation to operateAPEX (Fig. 2). This includes the Inertial Navigation System (INS) withdGPS data processing capabilities (Applanix POS/AV 410 IMU/GPS).APEX optical and positional data are linked usingGPS based timestamps

Fig. 2. Top: APEX instrument as mounted in Dornier DO-228 aircraft with N2 pressure system (bottom left), APEX on stabilizing platform (middle) and climate control (top); bottom:operator rack (right) and upload of configuration and flight data (left). Legend: 1 APEX instrument, 2 stabilizing platform, 3 interface plate, 4 thermal control unit, 5 nitrogen supply, 6flight management computer, 7 inertial navigation system and GPS, 8 power distribution, 9 central storage unit, 10 aircraft bay.Photo: M. Jehle
211M.E. Schaepman et al. / Remote Sensing of Environment 158 (2015) 207–219
during processing by forming a smoothed, best-estimate trajectory foreach acquired imaging frame. Further components are the flight man-agement system with interfaces to the operator and pilot (TRACK'AIRXTrack), the APEX computer with its storage unit (Solid State Disks)and the power supply units.While largely everything in the CSU is avail-able as commercial-off-the-shelf, only a custom-made PCI card is need-ed to be developed in order to connect the optical link from theinstrument to the host system. Data originating from the PCI card usea multi-threaded shared memory architecture to ensure sufficient datathroughput to the solid-state-memory disks. All of the CSU is drivenby a tiered software approach. Low-level interfaces control disk read/write operations, while a middle tier level handles all logging andalerting. High-level software controls and enables configuring the sys-tem, its status and displays a waterfall image in real-time on screenfor the operator. Finally, the power distribution unit connects the air-craft power supply with all APEX instruments requiring power.
2.4. Calibration and validation approach
APEX calibration and validation invokes a full set of integrated activ-ities with the aim to producing high quality, reproducible radiometric
measurements for each pixel–spectral band combination (Fox et al.,2003; Nieke et al., 2004). Unique to the APEX overall calibration ap-proach is the use of a combination of laboratory, in-flight, and vicariouscalibration activities (Schläpfer et al., 2000) based on methods usingcombined in-flight, scene-based and atmospheric approaches (Brazileet al., 2006; D'Odorico et al., 2011). Vicarious calibration is methodolog-ically based on Kneubühler, Schaepman, Thome, and Schläpfer (2003),while in situ measurements (spectral radiance and reflectance usingfield spectrometers) are performed on standard targets (artificialsportgrounds, concrete) (Jehle et al., 2010), covering a limited rangeof radiances measured at sensor (Hueni et al., 2009a). The initial designforesees to assimilate calibration measurements into a coherent set ofradiancemeasurements (Kaiser et al., 2004). This results in the develop-ment of both, a calibration and validation approach and softwaresupporting in-situ measurements of field spectroradiometer measure-ments (Bojinski, Schaepman, Schläpfer, & Itten, 2002; Hueni et al.,2009a; Schaepman & Dangel, 2000) as well as handling calibrationdata (Hueni, Malthus, Kneubuehler, & Schaepman, 2011; Hueni et al.,2009a; Hueni, Lenhard, Baumgartner and Schaepman, 2013).
The laboratory calibration approach is based on a calibration homebase (CHB, located at the German Aerospace Center (DLR)), which is

212 M.E. Schaepman et al. / Remote Sensing of Environment 158 (2015) 207–219
particularly designed to calibrate APEX and other airborne imagingspectrometers with similar properties, as well as the spectrometersused for on-ground reference measurements (Gege et al., 2009). Thishas been demonstrated with a number of airborne and field spectrom-eters calibrated in the CHB (Lenhard, Baumgartner, & Schwarzmaier,2014 (in revision)). This traceable calibration approach facilitates theintercomparison of calibration data, and close cooperation with theGerman national metrology institute PTB (Physikalisch-TechnischeBundesanstalt) assures state-of-the-art accuracy and traceability. Byproviding light sources with fully characterized properties (Taubertet al., 2013), theCHB allows to determine the functional relationship be-tween at-sensor radiances and the signal measured by APEX (Niekeet al., 2008). The measurements can be classified in three categories:a) radiometric, allowing to convert raw sensor signals to physicalunits of radiance traceable to the système international (SI) (Taubertet al., 2013); b) spectral, allowing to assign centerwavelength and spec-tral resolution for each detector element; and c) geometric, allowing todetermine the view angles and angular resolution of each detector ele-ment. The latter two include the characterization of the optical distor-tions typical for pushbroom sensors known as smile and keystone. Inaddition, the CHB supports a multitude of auxiliary measurements re-quired to fully characterize an imaging spectrometer such as detectorlinearity, sensitivity to linearly polarized light, radiometric noise orpixel response non-uniformity.
Finally, vicarious calibration efforts are performed in every flightseason using selected reference targets on ground while the APEXinstrument is acquiring data. The approach used follows guidelines asdeveloped for other imaging spectrometer vicarious calibration(Kneubühler et al., 2003; Milton et al., 2009).
2.5. Processing and archiving facility
APEX data processing and archiving is split into the developmentof a science grade APEX processor, designed to produce calibratedradiances in a coherent observation geometry (i.e., Level 1), and an op-erational grade APEX processor and archiving facility, facilitating repro-ducible data processing and distribution (Hueni et al., 2009a). Allprocessing beyond Level 1 (e.g., orthorectification, atmospheric com-pensation, and higher level products) are discussed in the applicationdevelopment section.
The science grade APEX processor is designed to process large quan-tities of imaging spectrometer data, including calibration and house-keeping data (Schaepman, Schläpfer, Brazile, & Bojinski, 2002). Itsdesign is based on an iterative prototyping approach and from begin-ning on includes considerations to build look-up tables for atmosphericcompensation (Brazile et al., 2004), as well as optimized processingspeed requirements (Brazile, Richter, Schläpfer, Schaepman, & Itten,2008; Brazile et al., 2005).
The science grade APEX processor is developed to integrate calibra-tion data with actual measurements, allowing to reconstruct each geo-metrical position and each radiance of any given detector element(Fig. 4). Processing data from raw to Level 1 is a two-stage process.Raw data generated by the APEX CSU computer are first segregatedinto imaging, in-flight calibration and dark current data blocks basingon a finite-state machine (FSM) fed with sensor parameters. Level 1data processing is frame based, applying a sequence of algorithms com-prising true dark current correction based on a shutter mechanism infront of the ground imager, de-smearing of the VNIR channel, compen-sations of radiometric effects due to spectral shifts (Hueni et al., 2014),radiometric calibration by applying gains and offsets, bad pixel replace-ment by spatial interpolation and optional spectral/spatial resamplingto register the data within the nominal geometric and spectral coordi-nate space, thereby compensating for spectral and spatial mis-registration. All calibration data is contained in the ‘CalibrationParameters Cube’ (cf. Fig. 4) and available upon request. The raw toLevel 1 processor as well as the APEX Calibration Information System
are continuously improved to refine the sensor model (Hueni, Sterckx,& Jehle, 2013) and data calibration. (See Fig. 3.)
3. APEX Earth science applications
3.1. Introduction
Increasingly, imaging spectrometer data are delivered as calibratedradiance data (Level 1) as well as science products (Levels 2 & 3). Rea-sons to deliver a multitude of processing levels are based on modelingrequirements using radiance based approaches (Laurent, Verhoef,Clevers, & Schaepman, 2011a; Laurent, Verhoef, Clevers, & Schaepman,2011b; Laurent et al., 2010), or applications of narrow- and broad-band indices at surface reflectance or radiance levels (Verrelst,Schaepman, Kötz, & Kneubühler, 2008). Imaging spectrometer dataare used for many purposes nowadays and comprehensive overviewsare found in the scientific literature (cf., Ben-Dor et al., 2009; Dozier,Green, Nolin, & Painter, 2009; Gao, Montes, Davis, & Goetz, 2009;Jacquemoud et al., 2009; Kokaly, Asner, Ollinger, Martin, & Wessman,2009; Milton et al., 2009; Plaza et al., 2009; Schaepman et al., 2009b;Ustin et al., 2009).We concentrate here on describing a few key applica-tions, which are either unique to APEX or significantly advance the useof APEX-like data. APEX data itself are available as a general purposeAPEX data set, which can be downloaded (http://www.apex-esa.org)(Hueni et al., 2012). On the same site, APEX quick-looks are also listed.Many of those datasets can be obtained free of charge for scientific useby contacting the responsible person.
Although representative at regional scale, advanced APEX productshave also implications for environmental research at larger scales. Pro-cess models, for example dynamic global vegetation models (LPG-GUESS (Smith et al., 2001)), are unique tools to quantify the impact ofenvironmental change on ecosystem functioning. Their reliability ishowever limited due to static parameterization or model assumptions(Friedlingstein et al., 2006). APEX like EO-data at local and regionalscale face increasing attention to improve models (Plummer, 2000;Poulter et al., 2011). Long term environmental monitoring programsare usually based on modeling approaches and continuous satellitedata series (Scholes et al., 2009). Providing continuous series of satellitedata is non-trivial, especially in case of instrument replacement or sen-sor degradation, and can only be guaranteed by applying data harmoni-zation strategies (Teillet et al., 1997). APEX data are suited to simulatedata and products of current and future space missions (e.g., Sentinel-2; D'Odorico, Gonsamo, Damm, & Schaepman, 2013). Such simulationsprovide the base to define technical specifications of upcoming instru-ments or for identifying data harmonization needs and strategies(Steven et al., 2003). The traceability of EO data quality is of outstand-ing importance if data are intended to be assimilated in processmodels (Fox et al., 2003). The rigorous implementation of physicalbased algorithms for the APEX product retrieval (e.g., Bayesian opti-mization algorithm in combination with coupled atmosphere–cano-py models; Laurent et al., 2011b), and the comprehensive dataquality assessment of APEX (i.e., calibration in CHB, IFC monitoring)enables to trace uncertainties throughout the entire processingchain. Products following the above reasoning are discussed in thefollowing section.
3.2. Operational and science grade processing
APEX operational grade data processing is performed within theCentral Data Processing Centre (CDPC) at VITO. First, spectral misregis-tration is performed using a spectrum-matching technique (Gao,Montes, & Davis, 2004). Geometric processing is performed using directgeoreferencing, including the use of standard or user-provided DigitalElevationModels (DEM). Subsequently, a smile-aware atmospheric cor-rection is performed to retrieve hemispherical–conical reflectancefactors (HCRF) in combination with MODTRAN5. Finally coordinate

Fig. 3. Laboratory calibration of APEX. Top: APEX mounted on integrating sphere for radiance calibration. Bottom: APEX mounted on optical bench for spectral/geometric calibration.Photo: M. Jehle, Calibration Home Base at DLR, Oberpfaffenhofen (GER)
Fig. 4.High level processing scheme of the APEX processor. DIC=Dichroic Filter Correction (Hueni, Schlaepfer, Jehle, & Schaepman, 2014; Hueni,Wooliams, & Schaepman, 2014), NG4=Neutral density glass filter (Schott NG4), L1 = Level 1 Processor, BIL = Band Interleaved by Line format, Pol. = Polarization, VNIR = Visible/Near Infrared, SWIR = Shortwave Infrared.
213M.E. Schaepman et al. / Remote Sensing of Environment 158 (2015) 207–219

214 M.E. Schaepman et al. / Remote Sensing of Environment 158 (2015) 207–219
projection is performed using the General Cartographic TransformationPackage (GCTP) (USGS, 1998). For all reprojections, a seven parameterHelmert transformation is used. In a final step, HCRF data are resampledto the central wavelengths as calibrated in the CHB for the actual acqui-sition (Biesemans et al., 2007).
APEX science grade data processing is corrected to minimize the im-pact of atmospheric and topographic effects (Richter & Schläpfer, 2002;Schläpfer & Richter, 2002). The subsequent automated atmosphericcompensation process accounts for irradiance properties in complex ter-rain, atmospheric scattering and absorbers, as well as instrumentsmile effects (Richter, Schlapfer, & Muller, 2011). This combined geo-atmospheric processing is used for all situations, where userswish to ob-tain uniform geo-locatable bottom of atmosphere reflectance values. Inaddition, APEX data can be normalized to contain nadir-viewing geome-tries by applying a Li-Ross BRDF correction based on a continuous landcover classification (Weyermann, Damm, Kneubuhler, & Schaepman,2014). Using a spectral unmixing based approach, land cover typeswith substantial BRDFs are extracted from the APEX scene and expressedas linear combinations of three kernels (isotropic, geometric (Li-kernel),volumetric (Ross-kernel)). This approach allows seamless mosaicking ofseveral APEX flight lines, while minimizing angular effects dominatingflight patterns that are chosen to comply with minimal operational con-straints and not optimized for minimal directional illumination influ-ences (Laurent, Schaepman, Verhoef, Weyermann, & Chavez, 2014).
While operational APEX data processing is available to everyonebrowsing data in the CDPC archive of VITO, science grade data process-ing is highly experimental and only applied on request. However, theAPEX PAF is upgraded to include always latest developments of the sci-ence grade processing.
3.3. AOD and critical surface albedo
If able to directly retrieve aerosol optical depth (AOD) from APEXdata, it is possible to improve the atmospheric compensation procedureby generating a priori probability distribution functions. We suggest aforward model approach, identifying a SNR of ≥100 at 550 nm beingsufficient for AOD retrieval on surfaces with 10% reflectance or less(Seidel, Schläpfer, Nieke, & Itten, 2008). However, even if reflectancespectroscopy data are combinedwith dedicated aerosol remote sensinginstruments measuring at multiple angles including polarization sensi-tivity (Diner et al., 2013), aerosol optical and especially micro-physicalproperty retrieval remain challenging. Computationally extensive algo-rithms limit the AOD retrieval to far real-time data processing. We sug-gest a simple model for atmospheric radiative transfer (SMART),critically balancing computational speed and retrieval accuracy to thebenefit of AOD retrievals (Seidel, Kokhanovsky, & Schaepman, 2010)as well as simulations of Hemispherical–Conical Reflectance Factors(HCRF, following (Schaepman-Strub, Schaepman, Painter, Dangel, &Martonchik, 2006)) for space- and airborne sensors. SMART is used ina fast optimization scheme for the retrieval of AOD using APEX data(Seidel, Kokhanovsky, & Schaepman, 2012) avoiding the critical surfacealbedo regions (Seidel & Popp, 2012) to maximize the AOD retrievalsensitivity on radiance data at sensor level.
3.4. NO2 vertical column densities
Atmospheric trace gas retrievals using Earth looking airborne imag-ing spectrometers are of increasing interest and with increased instru-ment performance and spectral resolution become more feasible(Marion, Michel, & Faye, 2004; Thorpe, Frankenberg, & Roberts, 2014).Nitrogen dioxide (NO2) is a reactive trace gas in the troposphere,which acts as an ozone and aerosol precursor and can negatively affecthuman health and ecosystem functions. Anthropogenic emissions areamajor source of atmosphericNO2 andNO2 thresholds are still regularlyexceeded in many European countries. We take advantage of the APEXband binning/unbinning capability (Dell'Endice et al., 2009) to derive
vertical columndensities (VCD) of NO2 fromAPEX. A two-step approach(Popp et al., 2012) based on differential optical absorption spectroscopy(DOAS) is applied to unbinned APEXmeasurementswhose higher spec-tral sampling enables good coverage of the narrow absorption lines ofatmospheric gases. First, the number of NO2 molecules along the aver-age photon path through the atmosphere to the sensor (slant columndensities (SCD)) are computed by fitting absorption cross sections ofNO2 and other interfering gases (i.e., H2O, O2–O2, or O3) in the 470–510 nm spectral region to the differential optical depth calculatedfrom image-based reference spectra. Second, the resulting NO2-SCD isnormalized to NO2-VCD with a so-called air mass factor (AMF). TheAMF is computed by radiative transfer calculations including forwardmodel parameters such as surface reflectance retrieved from the APEXdata, a digital elevationmodel, a-priorimodel NO2 profiles, and an aero-sol extinction profile (Popp et al., 2012). The resulting two-dimensionalNO2-VCD maps now allow the quantification of the spatio-temporalhighly variable NO2 field as well as the detection of major NO2 sourcesat an unparalleled local scale and synoptic view.
3.5. Coupled canopy–atmosphere modeling
Imaging spectrometers are used to map dedicated absorption fea-tures present in Earth surface materials or in the atmosphere. This re-quires that spectral bands should be positioned at (or sufficiently closeto) the absorption features. Spectral instabilities will lead to detectionof unrelated phenomena and even render retrieval algorithms (suchas vegetation indices) instrument specific and/or dependent. In addi-tion, data are usually converted to surface reflectance. For this conver-sion to be successful, we must assume certain parameters at theinterface between canopy and atmosphere (i.e., topography, surface an-isotropy, adjacency effects, location of top-of-canopy). We thereforesuggest the use of a coupled canopy–atmosphere RT model combinedwith a Bayesian optimization algorithm for vegetation (Laurent,Verhoef, Damm, Schaepman, & Clevers, 2013). This approach does notinvoke atmospheric compensation before applying the inverse modeland is largely independent of the number of bands used (limitationsare related to larger uncertainties when using fewer bands). Using thehybrid canopy RT model Soil–Leaf–Canopy (SLC) (Verhoef & Bach,2007) and the atmosphere RT model MODTRAN5 (Berk et al., 2004),the canopy–atmosphere coupling is based on the 4-stream theory(Laurent et al., 2011b), making full use of the directional informationcontained in the four canopy reflectance components as modeled bySLC. Variable estimation is then performed using Bayesian optimizationof the coupled model (Tarantola, 2005).
3.6. Sun-induced chlorophyll fluorescence (Fs) retrieval
From the early APEX instrument development phase on, thepushbroom design allowed only one given wavelength to be chosenfor the adjustment between dispersing elements and detector(s).Once this wavelength is chosen, all the others are defined by geometricconstraints. This wavelength was set to be the 760 nm O2-A absorptionline in the VNIR detector since it has the advantage of being useful forin-flight calibration purposes. With the advent of having this line wellcalibrated, it became evident that APEX can be used for the retrieval ofsun-induced chlorophyll fluorescence (Fs) (Damm et al., 2011). In thenear infrared, emitted Fs contributes to about 2–5% to the reflected radi-anceflux of a vegetation canopy (R). Bothfluxes have to be decoupled toquantify the Fs emission signal. For medium resolution instruments, theFraunhofer Line Depth (FLD) approach introduced by Plascyk (1975)serves as de-facto standard for Fs retrieval using medium resolutioninstruments (Meroni et al., 2009). The Fs retrieval algorithm imple-mented for APEX data follows the approach proposed by Guanter et al.(2010) and is based on a constrained FLD approach exploiting thebroader O2-A absorption feature. Reference surfaces with known Fs

215M.E. Schaepman et al. / Remote Sensing of Environment 158 (2015) 207–219
emission (e.g., bare soil) are used to constrain the Fs retrieval (Dammet al., 2014; Guanter et al., 2010).
3.7. Pigment retrieval
Retrieval of plant pigments and pigment systems has seen substan-tial progress paralleled with increased performance of imaging spec-trometers (Kokaly et al., 2009; Ustin et al., 2009). Pigments are notonly relevant to determine leaf functioning (Carvalho, Takaki, &Azevedo, 2011), but are used as proxies for light use efficiency inmodelsof net primary productivity (Coops, Hilker, Hall, Nichol, & Drolet, 2010)or assessing functional traits (Homolova, Malenovsky, Clevers, Garcia-Santos, & Schaepman, 2013). However, high accurate retrieval of func-tional traits is highly dependent on narrow and stable bands in a spec-trometer system. Finally, as photoacclimation and time kinetics(Hallik, Niinemets, & Kull, 2012) becomemore feasible to be measured,accurate pigment estimates will steadily gain in importance. We useindex based approaches for combined retrieval of chlorophyll, caroten-oids and anthocyanins from APEX data (Gitelson, Keydan, & Merzlyak,2006). The original band positions are adapted to match specific APEXbands, which are smaller in bandwidth than the sensor used for theoriginal development of the retrievals.
4. Results
4.1. APEX advanced radiometry measurements
Following acceptance testing in 2009, APEX was transferred to theUniversity of Zurich and VITO in spring 2010 for regular operations.Since summer 2010, APEX is producing science grade spectrometrymeasurements and has acquired N3 Terabytes of data correspondingto N3 Mio. scan-lines (approx. 30,000 km2) and several factors morein calibration and product data until the end of 2013. APEX has receivedairworthiness certification for two of DLR's research aircraft (DornierDO-228-101 (D-CODE), Dornier DO-228-212 (D-CFFU)) with VITO
Fig. 5. Comparison of four APEX validation approaches. A) traceable, calibrated laboratory meas2014); B) radiance based vicarious calibration effort using in-situ spectroradiometric measuremtion (Laurent et al., 2013); and D) forward simulated at-sensor-radiances using 3D modeling (
and the University of Zurich providing instrument operators for dataflights. In parallel, updates to the instrument, CHB, and PAF have beenmade to further improve the instruments measurements. We presentthe following table (Table 1) summarizing the initial specificationsused to design the instrument and list validated performances for allspecifications aswell as other relevant instrument parameters includingassociated references following upgrades and calibration efforts.
APEX radiometric performance is validated using a four-fold ap-proach. Following calibration in the CHB, APEX is calibrated traceableto a primary calibration standard with less than 4% uncertainty(Fig. 5A). Second, APEX is calibrated using radiance based vicarious cal-ibration approaches with in-situ measurements performed using a fieldspectroradiometer (ASD FieldSpec Pro FR) and a sunphotometer(CIMEL) (Fig. 5B). Uncertainties are in the range of ≤6.5%, but lowerspectral resolution of the field spectroradiometer as compared toAPEX are limiting the calibration effort. Also with a spatial resolutionof 1–2m, identifying homogeneous areas on ground is very challenging.At this spatial scale, sports fields, concrete or other artificial targets areusually not homogeneous enough to serve as calibration surfaces.Therefore, validation efforts are also put in place using spatially dis-tributed data and inverse (Fig. 5C) aswell as forward (Fig. 5D)modelingapproaches. The latter two still show deviations from the APEX mea-surements, largely due to simplified model approaches.
In-flight calibration information is used in combination with atmo-spheric measurements allowing to monitor (D'Odorico et al., 2011)and model instrument stability (Jehle et al., in press) and can thereforenot be used in addition as independent calibration source.
4.2. APEX Earth science applications development
APEX Earth science applications span a wide range of products.While calibrated radiances are a standard product for many sciencegrade instruments, we have developed individual and joint approachesfor atmospheric correction and allowing minimizing the impact of sur-face anisotropy effects. These products are of high operational use,
urements (Hueni, Schlaepfer, Jehle, & Schaepman, 2014; Hueni, Wooliams, & Schaepman,ents (Damm, pers. comm.); C) radiance level based comparison from Bayesian optimiza-Schneider et al., 2014 (in revision)).
216 M.E. Schaepman et al. / Remote Sensing of Environment 158 (2015) 207–219
since increasingly well corrected surface reflectance data are requiredform amore operational or stakeholder oriented user community. How-ever, a complete physically based surface anisotropy correction remainschallenging. Instruments like APEX are limited in angular data acquisi-tion as well as by having a relatively small FOV. Additional efforts areneeded to constrain the BRDF correction, likely with the support of apriori information.
We report on a second class of Earth science applications, namely re-trieving information from the atmosphere (VCD of NO2 as well as AOD),and deriving the concept of critical surface albedo, allowing to decoupleatmospheric and land surface based products, further increasing the re-trieval quality of the atmospheric products. Columnar retrievals of NO2
using airborne instruments cannot be comparedwith in-situ pointmea-suring networks. However, current existing in situ measurements canbe complemented by columnar NO2 information, allowing policy vali-dation with a higher level of process understanding in the coupled sur-face–atmosphere system (Popp et al., 2012). Finally AOD retrievals areoptimized using simplified approaches, carefully balancing retrieval ac-curacy and computational requirements. The AOD information can belater used as prior information in an atmospheric compensation proce-dure in an iterative fashion.
Many of the current retrieval schemes used in spectroscopy rely onretrieving surface reflectance and subsequently infer biochemical orbiophysical information. We demonstrate with APEX a new retrievalscheme by coupling a canopy–atmosphere model and invert thecoupledmodel. This allows us to avoid two separate steps of atmospher-ic correction and invoking an inverse canopy model in a second step.The coupled model approach clearly shows advantages by minimizinginterfacing complexity between these two models at the cost of in-creased inversion complexity. The particular model combination (SLCand MODTRAN) shows excellent performance in vegetation corre-sponding closest turbid media scattering, which is the physical founda-tion of the SLC model. Validation of this process is performed using aradiance based vicarious calibration procedure, ensuring consistencywhen comparing in-situ and airborne measurements (see Fig. 4B).
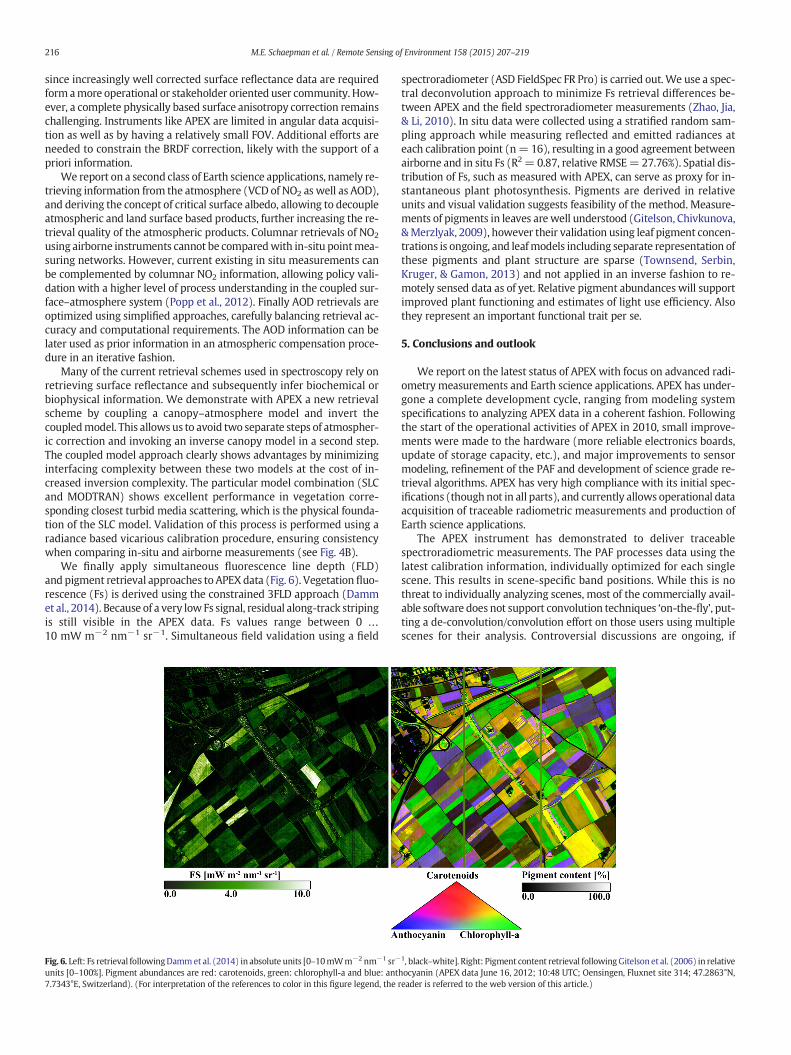
We finally apply simultaneous fluorescence line depth (FLD)and pigment retrieval approaches to APEXdata (Fig. 6). Vegetation fluo-rescence (Fs) is derived using the constrained 3FLD approach (Dammet al., 2014). Because of a very lowFs signal, residual along-track stripingis still visible in the APEX data. Fs values range between 0 …
10 mW m−2 nm−1 sr−1. Simultaneous field validation using a field
Fig. 6. Left: Fs retrieval followingDammet al. (2014) in absolute units [0–10mWm−2 nm−1 sr−
units [0–100%]. Pigment abundances are red: carotenoids, green: chlorophyll-a and blue: ant7.7343°E, Switzerland). (For interpretation of the references to color in this figure legend, the
spectroradiometer (ASD FieldSpec FR Pro) is carried out.We use a spec-tral deconvolution approach to minimize Fs retrieval differences be-tween APEX and the field spectroradiometer measurements (Zhao, Jia,& Li, 2010). In situ data were collected using a stratified random sam-pling approach while measuring reflected and emitted radiances ateach calibration point (n= 16), resulting in a good agreement betweenairborne and in situ Fs (R2= 0.87, relative RMSE=27.76%). Spatial dis-tribution of Fs, such as measured with APEX, can serve as proxy for in-stantaneous plant photosynthesis. Pigments are derived in relativeunits and visual validation suggests feasibility of the method. Measure-ments of pigments in leaves arewell understood (Gitelson, Chivkunova,&Merzlyak, 2009), however their validation using leaf pigment concen-trations is ongoing, and leafmodels including separate representation ofthese pigments and plant structure are sparse (Townsend, Serbin,Kruger, & Gamon, 2013) and not applied in an inverse fashion to re-motely sensed data as of yet. Relative pigment abundances will supportimproved plant functioning and estimates of light use efficiency. Alsothey represent an important functional trait per se.
5. Conclusions and outlook
We report on the latest status of APEX with focus on advanced radi-ometry measurements and Earth science applications. APEX has under-gone a complete development cycle, ranging from modeling systemspecifications to analyzing APEX data in a coherent fashion. Followingthe start of the operational activities of APEX in 2010, small improve-ments were made to the hardware (more reliable electronics boards,update of storage capacity, etc.), and major improvements to sensormodeling, refinement of the PAF and development of science grade re-trieval algorithms. APEX has very high compliance with its initial spec-ifications (though not in all parts), and currently allows operational dataacquisition of traceable radiometric measurements and production ofEarth science applications.
The APEX instrument has demonstrated to deliver traceablespectroradiometric measurements. The PAF processes data using thelatest calibration information, individually optimized for each singlescene. This results in scene-specific band positions. While this is nothreat to individually analyzing scenes, most of the commercially avail-able software does not support convolution techniques ‘on-the-fly’, put-ting a de-convolution/convolution effort on those users using multiplescenes for their analysis. Controversial discussions are ongoing, if
1, black–white]. Right: Pigment content retrieval followingGitelson et al. (2006) in relativehocyanin (APEX data June 16, 2012; 10:48 UTC; Oensingen, Fluxnet site 314; 47.2863°N,reader is referred to the web version of this article.)
217M.E. Schaepman et al. / Remote Sensing of Environment 158 (2015) 207–219
APEX band settings should be resampled to a ‘common band set’, orleaving the original measurements unaltered. Currently, the latter isthe case.
APEX was designed using a robust approach to sensor modeling.Even though the instrument model was updated on a regular basis, akey challenge remains to develop a sensor independentmodel, allowingfor forward and inverse modeling approaches. Currently, the APEX PAFcontains substantial APEX specific correction algorithms, being inherentto the functioning and performance of this specific instrument (Hueniet al., 2009). A more generic and generally applicable instrument andapplication model would serve all of the spectroscopy communitymuch better, allowing for instrument and product cross-comparisonin a much more coherent fashion.
While APEX, with its very high spectral resolution, is capable of simu-lating existing and future missions at very high accuracy, it can also beused to ensure consistency of indices-based approaches. Many of theexisting narrow- (and broad-) band indices are developed using a specificinstrument. High spectral resolution instruments can easily be convolvedto fit original band settings, but can in addition be used as a model inter-mediate to ensure continuity and uncertainty estimates of different in-struments (D'Odorico et al., 2013) in combination with in situmeasurements. Availability of spatial and temporal discontinuous dataof high spectral resolution is of key importance to fulfilling this goal.
APEX product development has shown key important developmentof band-specific products for advanced indices and combined indices forsimultaneous retrieval of regional scale pigments and chlorophyll fluo-rescence. Equally, it was shown that inversion of coupled models sub-stantially profit from high dimensional spectral data. Other, emergingapplications using APEX will further demonstrate the usefulness ofhigh dimensional data for applications (cf., Demarchi, Canters, Cariou,Licciardi, & Chan, 2014; Kneubühler et al., 2014; Schepers et al., 2014;Schweiger et al., 2014). Key to all approaches is a continuing require-ment for higher spectral resolution instruments with higher SNR andtherefore higher dimensionality. This will further foster the develop-ment of new models or retrieval algorithms—both empirical andphysical—allowing a new generation of spectroscopy instruments andscience professionals to be trained and developing new ideas.
With APEXwe still explore only a tiny fraction ofwhat could actuallybe explored with Earth related imaging spectroscopy. Key to the suc-cessful application of spectroscopy is still acquisition of a coherent setof independent and simultaneous retrievals of the Earth system spheres.We encourage everyone to make the best use of these data to furthertackle these plentiful opportunities much better in the near future!
Acknowledgments
We thank the University of Zurich for continued funding and sup-port to APEX. APEX is further supported through ESA, ESA PRODEX(16298/02/NL/US and 15449/01/NL/Sfe), the Swiss National ScienceFoundation (SNSF), the Belgian Science Policy Office (BELSPO), theSwiss University Conference (SUK, KIP-SEON), the University of ZurichResearch Priority Program on ‘Global Change and Biodiversity’ (URPPGCB), the Swiss Space Office (SSO), the European Metrology ResearchProgramme (EMRP, which is jointly funded by the EMRP participatingcountries within EURAMET and the European Union), and the GermanAerospace Center (DLR). We thank former UZH APEX project managersJens Nieke and Edoardo Alberti and former ESA APEX project managersGerd Ulbrich, Jose Gaviras, and Hilde Schroeven-Deceuninck for theirsupport. We thank the reviewers for helpful comments, allowing us toimprove the manuscript.
References
Ben-Dor, E., Chabrillat, S., Demattê, J.A.M., Taylor, G.R., Hill, J., Whiting, M.L., et al. (2009).Using imaging spectroscopy to study soil properties. Remote Sensing of Environment,113(Suppl. 1), S38–S55.
Berk, A., Anderson, G. P., Acharya, P. K., Bernstein, L. S., Muratov, L., Lee, J., Fox, M., Adler-Golden, S. M., Chetwynd, J. H., Hoke, M. L., Lockwood, R. B., Gardner, J. A., Cooley, T. W., & Lewis, P. E. (2004). MODTRAN5: A reformulated atmospheric band model withauxiliary species and practical multiple scattering options. Proceedings of SPIE - TheInternational Society for Optical Engineering, 5425, 341–347.
Biesemans, J., Sterckx, S., Knaeps, E., Vreys, K., Adriaensen, S., Hooyberghs, J., et al. (2007).Image processing workflows for airborne remote sensing. 5th EARSeL workshop onimaging spectroscopy. Bruges, B: EARSeL.
Bojinski, S., Schaepman, M.E., Schläpfer, D., & Itten, K. (2002). SPECCHIO: A web-accessible database for the administration and storage of heterogeneous spectraldata. ISPRS Journal of Photogrammetry and Remote Sensing, 57, 204–211.
Börner, A., Wiest, L., Keller, P., Reulke, R., Richter, R., Schaepman, M.E., et al. (2001).SENSOR: A tool for the simulation of hyperspectral remote sensing systems. ISPRSJournal of Photogrammetry and Remote Sensing, 55, 299–312.
Brazile, J., Kaiser, J.W., Schläpfer, D., Nieke, J., Schaepman, M.E., & Itten, K.I. (2005).Parallelization of APEX airborne imaging spectrometer product generation. In B.Zagajewski, &M. Sobczak (Eds.), Imaging spectroscopy— New quality in environmentalstudies (pp. 109–117). Warsaw (Pl): EARSeL.
Brazile, J., Neville, R.A., Staenz, K., Schlapfer, D., Lixin, S., & Itten, K.I. (2006). Scene-basedspectral response function shape discernibility for the APEX imaging spectrometer.IEEE Geoscience and Remote Sensing Letters, 3, 414–418.
Brazile, J., Richter, R., Schläpfer, D., Schaepman, M.E., & Itten, K.I. (2008). Cluster versusgrid for operational generation of ATCOR's MODTRAN-based look up tables. ParallelComputing, 34, 32–46.
Brazile, J., Schaepman, M.E., Schläpfer, D., Kaiser, J.W., Nieke, J., & Itten, K.I. (2004). Clusterversus grid for large-volume hyperspectral image preprocessing. In H.A. Huang, & H.J.Bloom (Eds.), Proceedings of SPIE Vol. 5548, Atmospheric and environmental remotesensing data processing and utilization: An end-to-end system perspective (pp. 48–58).
Carvalho, R.F., Takaki, M., & Azevedo, R.A. (2011). Plant pigments: The many faces of lightperception. Acta Physiologiae Plantarum, 33, 241–248.
Chorier, P., & Martino, F. (2004). APEX detector IDM08102 acceptance test. In A.A. Test(Ed.), Grenoble, F: Sofradir.
Coops, N.C., Hilker, T., Hall, F.G., Nichol, C.J., & Drolet, G.G. (2010). Estimation of light-useefficiency of terrestrial ecosystems from space: A status report. BioScience, 60,788–797.
D'Odorico, P., Guanter, L., Schaepman, M.E., & Schläpfer, D. (2011). Performance assess-ment of onboard and scene-based methods for Airborne Prism Experiment spectralcharacterization. Applied Optics, 50, 4755–4764.
Damm, A., Erler, A., Hillen, W., Meroni, M., Schaepman, M.E., Verhoef, W., et al. (2011).Modeling the impact of spectral sensor configurations on the FLD retrieval accuracyof sun-induced chlorophyll fluorescence. Remote Sensing of Environment, 115,1882–1892.
Damm, A., Guanter, L., Laurent, V.C.E., Schaepman, M.E., Schickling, A., & Rascher, U.(2014). FLD-based retrieval of sun-induced chlorophyll fluorescence from mediumspectral resolution airborne spectroscopy data. Remote Sensing of Environment, 147,256–266.
Dell'Endice, F., & Alberti, E. (2009). InM.E. Schaepman (Ed.), APEX characterisation at CHB:Campaign report (pp. 65). Zurich, CH: University of Zurich.
Dell'Endice, F., Nieke, J., Koetz, B., Schaepman, M.E., & Itten, K. (2009). Improving radiom-etry of imaging spectrometers by using programmable spectral regions of interest.ISPRS Journal of Photogrammetry and Remote Sensing, 64, 632–639.
Demarchi, L., Canters, F., Cariou, C., Licciardi, G., & Chan, J.C.W. (2014). Assessing the per-formance of two unsupervised dimensionality reduction techniques on hyperspectralAPEX data for high resolution urban land-cover mapping. ISPRS Journal ofPhotogrammetry and Remote Sensing, 87, 166–179.
Diner, D.J., Xu, F., Garay, M.J., Martonchik, J.V., Rheingans, B.E., Geier, S., et al. (2013). TheAirborne Multiangle SpectroPolarimetric Imager (AirMSPI): A new tool for aerosoland cloud remote sensing. Atmospheric Measurement Techniques, 6, 2007–2025.
D'Odorico, P., Alberti, E., & Schaepman, M.E. (2010). In-flight spectral performance mon-itoring of the Airborne Prism Experiment. Applied Optics, 49, 3082–3091.
D'Odorico, P., Gonsamo, A., Damm, A., & Schaepman, M.E. (2013). Experimental evalua-tion of Sentinel-2 spectral response functions for NDVI time-series continuity. IEEETransactions on Geoscience and Remote Sensing, 51, 1336–1348.
Dozier, J., Green, R.O., Nolin, A.W., & Painter, T.H. (2009). Interpretation of snow proper-ties from imaging spectrometry. Remote Sensing of Environment, 113(Suppl. 1),S25–S37.
EUFAR (2014). DO228/D-CODE — DLRIn http://www.eufar.net/experiment/aircraft/specaircraft2.php?num=73 (Ed.), .
Fox, N., Aiken, J., Barnett, J.J., Briottet, X., Carvell, R., Frohlich, C., et al. (2003). Traceable ra-diometry underpinning terrestrial- and helio-studies (TRUTHS). Advances in SpaceResearch, 32, 2253–2261.
Friedlingstein, P., Cox, P., Betts, R., Bopp, L., von Bloh, W., Brovkin, V., Cadule, P., Doney, S.,Eby, M., Fung, I., Bala, G., John, J., Jones, C., Joos, F., Kato, T., Kawamiya, M., Knorr, W.,Lindsay, K., Matthews, H. D., Raddatz, T., Rayner, P., Reick, C., Roeckner, E., Schnitzler,K. -G., Schnur, R., Strassmann, K., Weaver, A. J., Yoshikawa, C., & Zeng, N. (2006). Cli-mate-carbon cycle feedback analysis: Results from the C4MIP model intercompari-son. Journal of Climate, 19(14), 3337–3353.
Gao, B.C., Montes, M.J., & Davis, C.O. (2004). Refinement of wavelength calibrations ofhyperspectral imaging data using a spectrum-matching technique. Remote Sensingof Environment, 90, 424–433.
Gao, B. -C., Montes, M.J., Davis, C.O., & Goetz, A.F.H. (2009). Atmospheric correction algo-rithms for hyperspectral remote sensing data of land and ocean. Remote Sensing ofEnvironment, 113(Suppl. 1), S17–S24.
Gege, P., Fries, J., Haschberger, P., Schötz, P., Schwarzer, H., Strobl, P., et al. (2009). Calibrationfacility for airborne imaging spectrometers. ISPRS Journal of Photogrammetry andRemote Sensing, 64, 387–397.

218 M.E. Schaepman et al. / Remote Sensing of Environment 158 (2015) 207–219
Gitelson, A.A., Chivkunova, O.B., & Merzlyak, M.N. (2009). Nondestructive estimation ofanthocyanins and chlorophylls in anthocyanic leaves. American Journal of Botany,96, 1861–1868.
Gitelson, A.A., Keydan, G.P., & Merzlyak, M.N. (2006). Three-band model for noninvasiveestimation of chlorophyll, carotenoids, and anthocyanin contents in higher plantleaves. Geophysical Research Letters, 33.
Guanter, L., Alonso, L., Gómez-Chova, L., Meroni, M., Preusker, R., Fischer, J., & Moreno, J.(2010). Developments for vegetation fluorescence retrieval from spaceborne high-resolution spectrometry in the O2-A and O2-B absorption bands. Journal ofGeophysical Research: Atmospheres, 115(19) art. no. D19303.
Green, R.O. (1998). Spectral calibration requirement for Earth-looking imaging spectrom-eters in the solar-reflected spectrum. Applied Optics, 37, 683–690.
Green, R.O., Eastwood, M.L., Sarture, C.M., Chrien, T.G., Aronsson, M., Chippendale, B.J.,et al. (1998). Imaging spectroscopy and the Airborne Visible/Infrared Imaging Spec-trometer (AVIRIS). Remote Sensing of Environment, 65, 227–248.
Hallik, L., Niinemets, U., & Kull, O. (2012). Photosynthetic acclimation to light in woodyand herbaceous species: A comparison of leaf structure, pigment content andchlorophyll fluorescence characteristics measured in the field. Plant Biology, 14,88–99.
Homolova, L., Malenovsky, Z., Clevers, J.G.P.W., Garcia-Santos, G., & Schaepman, M.E.(2013). Review of optical-based remote sensing for plant trait mapping. EcologicalComplexity, 15, 1–16.
Hueni, A., Biesemans, J., Dell'Endice, F., Alberti, E., Meuleman, K., & Schaepman, M.E.(2009a). The structure of the APEX (Airborne Prism Experiment) processingand archiving facility. In J. Chanussot (Ed.), WHISPERS — First workshop onhyperspectral image and signal processing: Evolution in remote sensing (pp. 4).Grenoble (F): IEEE.
Hueni, A., Biesemans, J., Meuleman, K., Dell'Endice, F., Schlapfer, D., Odermatt, D., et al.(2009b). Structure, components, and interfaces of the airborne prism experiment(APEX) processing and archiving facility. IEEE Transactions on Geoscience andRemote Sensing, 47, 29–43.
Hueni, A., Lenhard, K., Baumgartner, A., & Schaepman, M.E. (2013). Airborne prism exper-iment calibration information system. IEEE Transactions on Geoscience and RemoteSensing, 51, 5169–5180.
Hueni, A., Malthus, T., Kneubuehler, M., & Schaepman, M.E. (2011). Data exchange be-tween distributed spectral databases. Computers & Geosciences, 37, 861–873.
Hueni, A., Nieke, J., Schopfer, J., Kneubühler, M., & Itten, K.I. (2009). The spectral databaseSPECCHIO for improved long-term usability and data sharing. Computers andGeosciences, 35, 557–565.
Hueni, A., Schlaepfer, D., Jehle, M., & Schaepman, M. (2014). Impacts of dichroic prismcoatings on radiometry of the airborne imaging spectrometer APEX. Applied Optics,53, 5344–5352.
Hueni, A., Sterckx, S., & Jehle, M. (2013). Operational calibration of APEX. Geoscienceand remote sensing symposium (IGARSS), 2013 IEEE International(pp. 4423–4426).
Hueni, A., Sterckx, S., Jehle, M., D'Odorico, P., Vreys, K., Bomans, B., et al. (2012). Op-erational status of APEX and characteristics of the APEX open science data set.Geoscience and remote sensing symposium (IGARSS), 2012 IEEE International(pp. 5009–5012).
Hueni, A., Wooliams, E., & Schaepman, M.E. (2014). APEX radiometric uncertainty.European metrology research programme/EURAMET (pp. 48). Zurich, CH: Universityof Zurich.
Itten, K.I., Meyer, P., Staenz, K., Kellenberger, T., & Schaepman, M.E. (1992). Evaluation ofthe AVIRISwiss '91 campaign data. In R. Green (Ed.), Summaries of the third annual JPLairborne geoscience workshop (pp. 108–110). Pasadena, CA: NASA.
Itten, K.I., Schaepman, M.E., De Vos, L., Hermans, L., Schlaepfer, H., & Droz, F. (1997). APEX— Airborne PRISM Experiment: A new concept for an airborne imaging spectrometer.Third international airborne remote sensing conference and exhibition (pp. 181–188).Copenhagen: ERIM.
Jacquemoud, S., Verhoef, W., Baret, F., Bacour, C., Zarco-Tejada, P.J., Asner, G.P., et al.(2009). PROSPECT & SAIL models: A review of use for vegetation characterization.Remote Sensing of Environment, 113(Suppl. 1), S56–S66.
Jehle, M., Hueni, A., Baumgartner, A., Lenhard, K., & Schaepman, M.E. (2015). Detectionand correction of radiance variations during spectral calibration of APEX. IEEEGeoscience and Remote Sensing Letters (in press).
Jehle, M., Schaepman, M., Hueni, A., Damm, A., D'Odorico, P., Weyermann, J., et al. (2010).APEX — current status, performance and validation concept. Sensors, 2010 IEEE(pp. 533–537). Waikoloa, HI, USA: IEEE Sensors.
Kaiser, J.W., Schläpfer, D., Brazile, J., Strobl, P., Schaepman, M.E., & Itten, K.I. (2004).Assimilation of heterogeneous calibration measurements for the APEX spectrometer.In R. Meynart (Ed.), Proceedings of SPIE: Sensors, systems, and next-generation satellitesVII (pp. 211–220).
Kneubühler, M., Damm, A., Schweiger, A.K., Risch, A.C., Schütz, M., & Schaepman, M.E.(2014). Continuous fields from imaging spectrometer data for ecosystem parametermapping and their potential for animal habitat assessment in alpine regions. IEEEJournal of Selected Topics in Applied Earth Observations and Remote Sensing, 7,2600–2610.
Kneubühler, M., Schaepman, M.E., Thome, K.J., & Schläpfer, D.R. (2003). MERIS/ENVISATvicarious calibration over land. In R. Meynart, S.P. Neeck, H. Shimoda, J.B. Lurie, &M.L. Aten (Eds.), Sensors, systems, and next-generation satellites VII (pp. 614–623).Barcelona: SPIE.
Kokaly, R.F., Asner, G.P., Ollinger, S.V., Martin, M.E., & Wessman, C.A. (2009). Characteriz-ing canopy biochemistry from imaging spectroscopy and its application to ecosystemstudies. Remote Sensing of Environment, 113(Suppl. 1), S78–S91.
Laurent, V.C.E., Schaepman, M.E., Verhoef, W., Weyermann, J., & Chavez, R.O. (2014).Bayesian object-based estimation of LAI and chlorophyll from a simulated
Sentinel-2 top-of-atmosphere radiance image. Remote Sensing of Environment,140, 318–329.
Laurent, V., Verhoef, W., Clevers, J.G.P.W., & Schaepman, M.E. (2010). Estimating forestparameters from top-of-atmosphere radiance measurements using coupled radiativetransfer models. In H. Lacoste-Francis (Ed.), Proceedings of the hyperspectral workshop2010 (pp. 1–8). Frascati (It): ESA.
Laurent, V.C.E., Verhoef, W., Clevers, J.G.P.W., & Schaepman, M.E. (2011a). Inversion of acoupled canopy–atmospheremodel using multi-angular top-of-atmosphere radiancedata: A forest case study. Remote Sensing of Environment, 115, 2603–2612.
Laurent, V.C.E., Verhoef, W., Clevers, J.G.P.W., & Schaepman, M.E. (2011b). Estimating for-est variables from top-of-atmosphere radiance satellite measurements using coupledradiative transfer models. Remote Sensing of Environment, 115, 1043–1052.
Laurent, V.C.E., Verhoef, W., Damm, A., Schaepman, M.E., & Clevers, J.G.P.W. (2013). ABayesian object-based approach for estimating vegetation biophysical and biochem-ical variables from APEX at-sensor radiance data. Remote Sensing of Environment, 139,6–17.
Lenhard, K., Baumgartner, A., & Schwarzmaier, T. (2014). Independent laboratory charac-terization of NEO HySpex imaging spectrometers VNIR-1600 and SWIR-320M-E. IEEETransactions on Geoscience and Remote Sensing, http://dx.doi.org/10.1109/TGRS.2014.2349737 (in revision).
Marion, R., Michel, R., & Faye, C. (2004). Measuring trace gases in plumes fromhyperspectral remotely sensed data. IEEE Transactions on Geoscience and RemoteSensing, 42, 854–864.
Menenti, M., Rast, M., Baret, F., Mauser, W., Miller, J., Schaepman, M., et al. (2002).Understanding vegetation response to climate variability from space: the scientificobjectives, the approach and the concept of the SPECTRA mission. IGARSS 2002:IEEE International geoscience and remote sensing symposium and 24th Canadian sympo-sium on remote sensing, Vols I–VI, proceedings (pp. 964–966).
Meroni, M., Rossini, M., Guanter, L., Alonso, L., Rascher, U., Colombo, R., & Moreno, J.(2009). Remote sensing of solar-induced chlorophyll fluorescence: Review ofmethods and applications. Remote Sensing of Environment, 113(10), 2037–2051.
Milton, E.J., Schaepman, M.E., Anderson, K., Kneubühler, M., & Fox, N. (2009). Progress infield spectroscopy. Remote Sensing of Environment, 113(Suppl. 1), S92–S109.
Mouroulis, P., Green, R.O., & Chrien, T.G. (2000). Design of pushbroom imaging spectrom-eters for optimum recovery of spectroscopic and spatial information. Applied Optics,39, 2210–2220.
Nieke, J., Itten, K.I., Meuleman, K., Gege, P., Dell'Endice, F., Hueni, A., et al. (2008).Supporting facilities of the airborne imaging spectrometer APEX, V502–V505.
Nieke, J., Kaiser, J., Schläpfer, D., Brazile, J., Itten, K., Strobl, P., et al. (2004). Calibrationmethodology for the airborne dispersive pushbroom imaging spectrometer (APEX).In R. Meynart, S.P. Neeck, & H. Shimoda (Eds.), Sensors, systems, and next-generationsatellites VIII (pp. 445–452). Maspalomas: SPIE.
Nowicki-Bringuier, Y.R., & Chorier, P. (2009). Sofradir SWIR hyperspectral detectors forspace applications. Sensors, systems, and next-generation satellites XIII (pp. 12). Berlin:SPIE.
Plascyk, James A. (1975). MK II Fraunhofer Line Discriminator (FLD-II) for Airborne andOrbital Remote Sensing of Solar-Stimulated Luminescence. Optical Engineering,14(4), 339–346.
Plaza, A., Benediktsson, J.A., Boardman, J.W., Brazile, J., Bruzzone, L., Camps-Valls, G., et al.(2009). Recent advances in techniques for hyperspectral image processing. RemoteSensing of Environment, 113(Suppl. 1), S110–S122.
Plummer, S. E. (2000). Perspectives on combining ecological process models and remote-ly sensed data. Ecological Modelling, 129(2–3), 169–186.
Poulter, B., Frank, D. C., Hodson, E. L., & Zimmermann, N. E. (2011). Impacts of land coverand climate data selection on understanding terrestrial carbon dynamics and the CO2 airborne fraction. Biogeosciences, 8(8), 2027–2036.
Popp, C., Brunner, D., Damm, A., Van Roozendael, M., Fayt, C., & Buchmann, B.(2012). High-resolution NO2 remote sensing from the Airborne Prism EXperi-ment (APEX) imaging spectrometer. Atmospheric Measurement Techniques, 5,2211–2225.
Richter, R., & Schläpfer, D. (2002). Geo-atmospheric processing of airborne imaging spec-trometry data. Part 2: Atmospheric/topographic correction. International Journal ofRemote Sensing, 23, 2631–2649.
Richter, R., Schlapfer, D., & Muller, A. (2011). Operational atmospheric correction for im-aging spectrometers accounting for the smile effect. IEEE Transactions on Geoscienceand Remote Sensing, 49, 1772–1780.
Schaepman, M.E. (2009). Imaging spectrometers. In T.A. Warner, M. Duane Nellis, & G.Foody (Eds.), The SAGE handbook of remote sensing (pp. 166–178). London (UK):SAGE.
Schaepman, M.E., & Dangel, S. (2000). Solid laboratory calibration of a nonimagingspectroradiometer. Applied Optics, 39, 3754–3764.
Schaepman, M.E., De Vos, L., & Itten, K.I. (1998). APEX — Airborne PRISM Experiment:Hyperspectral radiometric performance analysis for the simulation of the futureESA land surface processes earth explorer mission. In M.R. Descour, & S.S. Shen(Eds.), Imaging spectrometry IV (pp. 253–262). San Diego: SPIE.
Schaepman, M.E., Itten, K.I., Schläpfer, D., Kaiser, J.W., Brazile, J., Debruyn,W., et al. (2003).Status of the airborne dispersive pushbroom imaging spectrometer APEX (AirbornePrism Experiment). International geoscience and remote sensing symposium (IGARSS)(pp. 4304–4306). Toulouse: IEEE.
Schaepman, M.E., Schläpfer, D., Brazile, J., & Bojinski, S. (2002). Processing of large-volumeairborne imaging spectrometer data: The APEX approach. In S.S. Shen (Ed.), Imagingspectrometry VIII (pp. 72–79). Seattle: SPIE.
Schaepman, M.E., Schläpfer, D., & Itten, K.I. (2000). APEX — A new pushbroom imagingspectrometer for imaging spectroscopy applications: Current design and status.International geoscience and remote sensing symposium (IGARSS) (pp. 828–830).Hawaii: IEEE.
219M.E. Schaepman et al. / Remote Sensing of Environment 158 (2015) 207–219
Schaepman, M.E., Schläpfer, D., & Müller, A. (2002). Performance requirements for air-borne imaging spectrometers. In M.R. Descour, & S.S. Shen (Eds.), Imaging spectrom-etry VII (pp. 23–31). San Diego: SPIE.
Schaepman, M.E., Ustin, S.L., Plaza, A.J., Painter, T.H., Verrelst, J., & Liang, S. (2009a). Earthsystem science related imaging spectroscopy—An assessment. Remote Sensing ofEnvironment, 113, S123–S137.
Schaepman, M.E., Ustin, S.L., Plaza, A.J., Painter, T.H., Verrelst, J., & Liang, S. (2009b). Earthsystem science related imaging spectroscopy—An assessment. Remote Sensing ofEnvironment, 113(Suppl. 1), S123–S137.
Schaepman-Strub, G., Schaepman, M.E., Painter, T.H., Dangel, S., & Martonchik, J.V. (2006).Reflectance quantities in optical remote sensing — Definitions and case studies.Remote Sensing of Environment, 103, 27–42.
Schepers, L., Haest, B., Veraverbeke, S., Spanhove, T., Vanden Borre, J., & Goossens, R.(2014). Burned area detection and burn severity assessment of a heathland fire inBelgium using Airborne Imaging Spectroscopy (APEX). Remote Sensing, 6, 1803–1826.
Schläpfer, D., & Richter, R. (2002). Geo-atmospheric processing of airborne imaging spec-trometry data. Part 1: Parametric orthorectification. International Journal of RemoteSensing, 23, 2609–2630.
Schläpfer, D., & Schaepman, M.E. (2002). Modeling the noise equivalent radiance require-ments of imaging spectrometers based on scientific applications. Applied Optics, 41,5691–5701.
Schläpfer, D., Schaepman, M.E., Bojinski, S., & Börner, A. (2000). Calibration and validationconcept for the airborne PRISM experiment (APEX). Canadian Journal of RemoteSensing, 26, 455–465.
Schneider, F.D., Leiterer, R., Morsdorf, F., Gastellu-Etchegorry, J. -P., Lauret, N., Pfeifer, N.,et al. (2014). Simulating imaging spectrometer data: 3D forest modeling based onLiDAR and in situ data. Remote Sensing of Environment, 152, 235–250.
Scholes, R. J., Monteiro, P. M. S., Sabine, C. L., & Canadell, J. G. (2009). Systematic long-termobservations of the global carbon cycle. Trends in Ecology and Evolution, 24(8),427–430.
Schweiger, A.K., Risch, A.C., Damm, A., Kneubühler, M., Haller, R., Schaepman, M.E., et al.(2014). Using imaging spectroscopy to predict above-ground plant biomass in alpinegrasslands grazed by large ungulates. Journal of Vegetation Science (n/a-n/a) http://onlinelibrary.wiley.com/doi/10.1111/jvs.12214/abstract.
Seidel, F.C., Kokhanovsky, A.A., & Schaepman, M.E. (2010). Fast and simple model for at-mospheric radiative transfer. Atmospheric Measurement Techniques, 3, 1129–1141.
Seidel, F.C., Kokhanovsky, A.A., & Schaepman, M.E. (2012). Fast retrieval of aerosol opticaldepth and its sensitivity to surface albedo using remote sensing data. AtmosphericResearch, 116, 22–32.
Seidel, F.C., & Popp, C. (2012). Critical surface albedo and its implications to aerosol re-mote sensing. Atmospheric Measurement Techniques, 5, 1653–1665.
Seidel, F., Schläpfer, D., Nieke, J., & Itten, K.I. (2008). Sensor performance requirements forthe retrieval of atmospheric aerosols by airborne optical remote sensing. Sensors, 8,1901–1914.
Steven, M. D., Malthus, T. J., Baret, F., Xu, H., & Chopping, M. J. (2003). Intercalibration ofvegetation indices from different sensor systems. Remote Sensing of Environment,88(4), 412–422.
Smith, B., Prentice, I. C., & Sykes, M. T. (2001). Representation of vegetation dynamics inthe modelling of terrestrial ecosystems: Comparing two contrasting approacheswithin European climate space. Global Ecology and Biogeography, 10(6), 621–637.
Tarantola, A. (2005). Inverse problem theory and methods for model parameter estimation.SIAM.
Taubert, D.R., Hollandt, J., Sperfeld, P., Pape, S., Höpe, A., Hauer, K.O., et al. (2013). Providingradiometric traceability for the calibration home base of DLR by PTB. AIP ConferenceProceedings (pp. 376–379).
Teillet, P. M., Horler, D. N. H., & O'Neill, N. T. (1997). Calibration, validation, and quality as-surance in remote sensing: A new paradigm. Canadian Journal of Remote Sensing,23(4), 401–414.
Thorpe, A.K., Frankenberg, C., & Roberts, D.A. (2014). Retrieval techniques for airborne im-aging ofmethane concentrations using high spatial andmoderate spectral resolution:Application to AVIRIS. Atmospheric Measurement Techniques, 7, 491–506.
Townsend, P.A., Serbin, S.P., Kruger, E.L., & Gamon, J.A. (2013). Disentangling the contribu-tion of biological and physical properties of leaves and canopies in imaging spectros-copy data. Proceedings of the National Academy of Sciences of the United States ofAmerica, 110.
Ulbrich, G.J., Meynart, R., Nieke, J., Itten, K.I., Kaiser, J.W., Schläpfer, D., et al. (2004). APEX—
Airborne Prism Experiment: The realization phase of an airborne imaging spec-trometer. Proc. SPIE Vol. 5570, sensors, systems, and next-generation satellites VIII(pp. 453–459).
USGS (1998). General cartographic transformation package (GCTP). (p. ftp://edcftp.cr.usgs.gov/software/gctpc/).
Ustin, S.L., Gitelson, A.A., Jacquemoud, S., Schaepman, M., Asner, G.P., Gamon, J.A., et al.(2009). Retrieval of foliar information about plant pigment systems from high reso-lution spectroscopy. Remote Sensing of Environment, 113(Suppl. 1), S67–S77.
Verhoef,W., & Bach, H. (2007). Coupled soil–leaf–canopy and atmosphere radiative trans-fer modeling to simulate hyperspectral multi-angular surface reflectance and TOA ra-diance data. Remote Sensing of Environment, 109, 166–182.
Verrelst, J., Schaepman, M.E., Kötz, B., & Kneubühler, M. (2008). Angular sensitivity of veg-etation indices derived from CHRIS/PROBA data. Remote Sensing of Environment, 112,2341–2353.
Versluys, J., Van Vooren, N., & De Vos, L. (2008). APEX optical test report. APEX acceptancereporting (pp. 39). Oudenaarde, BE: OIP Sensor Systems.
Weyermann, J., Damm, A., Kneubuhler, M., & Schaepman, M.E. (2014). Correction of re-flectance anisotropy effects of vegetation on airborne spectroscopy data and derivedproducts. IEEE Transactions on Geoscience and Remote Sensing, 52, 616–627.
Zhao, H.J., Jia, G.R., & Li, N. (2010). Transformation from hyperspectral radiance data todata of other sensors based on spectral superresolution. IEEE Transactions onGeoscience and Remote Sensing, 48, 3903–3912.