advanced non-invasive geophysical monitoring techniques - citeseer
TRANSCRIPT

CWP-564
Advanced non-invasive geophysical monitoringtechniques
Roel Snieder1, Susan Hubbard2, Matthew Haney3, Gerald Bawden,
Paul Hatchell, Andre Revil & DOE Geophysical Monitoring Working Group4
1Center for Wave Phenomena and Department of Geophysics, Colorado School of Mines, Golden CO 804012Earth Science Division, Lawrence Berkeley National Laboratory, Berkeley, CA 947203Geophysics Department, Sandia National Laboratories, Albuquerque NM 87185-07504DOE Geophysical Monitoring working group: R. Calvert, A. Curtis, M. Fehler, P. Gerstoft, B. Hornby, M. Landrø,D. Lesmes, K. Mehta, M. Mooney, C. Pacheco, S. Prejean, H. Sato, J. Schuster, K. Wapenaar, M. Wilt
ABSTRACTGeophysical methods can be used to create images of the Earth’s interior thatconstitute snapshots at the moment of data acquisition. In many applications,it is important to measure the temporal change in the subsurface, becausethe change is associated with deformation, fluid flow, temperature changes,or changes in material properties. We present an overview how noninvasivegeophysical methods can be used for this purpose. We focus on monitoring me-chanical properties, fluid transport, and biogeochemical processes, and presentcase studies that illustrate the use of geophysical method for detecting time-lapse changes in associated properties. The examples include: measuring upliftof the Earth’s surface, compaction near a producing hydrocarbon reservoir, theseismic detection of stress changes, monitoring buildings, the detection of fluidflow along a fault zone, electrical monitoring of fluid infiltration and redox po-tential, and electrical and seismic monitoring of microbially mediated processes.An overlying research question in geophysical monitoring concerns the use ofthese time-lapse changes, notably the assesment of uncertainty, the combinationof disparate data, and the interface with those who make decisions based ontime-lapse information.
Key words: time-lapse, monitoring, deformation, fluid flow, biogeochemicalprocesses
1 INTRODUCTION
Monitoring structures and processes in the subsurfaceis of increasing importance. The focus of the petroleumindustry has shifted from exploration to monitoring pro-duction. When tackling environmental problems, espe-cially those associated with contaminant remediation,it is essential to monitor the processes in the subsur-face. Monitoring is routinly performed to assess waterresources quality and quantity. An important compo-nent in climate change studies is to monitor environ-mental parameters. Monitoring can be achieved mosteasily if it can be carried out in-situ by direct samplingof the properties of interest. However, for the earth’s
subsurface this is often not feasible because of techni-cal or economic limitations. Moreover, in-situ measure-ments often have a much smaller support scale than thevolume of interest, and the presence of measurementdevices used for in-situ measurements may disturb theproperties that one seeks to measure. For these reasonsnon-invasive monitoring techniques are increasingly im-portant.
In this work we present recent developments inthe field of non-invasive geophyiscal monitoring of thesubsurface. Although incomplete, this overview aims todescribe ongoing work in research areas of increasingcomplexity. In section 2, we discuss monitoring of me-

48 R. Snieder, et. al.
chanical properties of the earth, presenting an exampleof monitoring the deformation of the earth’s surface.In principle, this is a simple, non-invasive, monitoringproblem, but the required accuracy makes it a challeng-ing problem. Monitoring the mechanical properties ofthe subsurface can be achieved with seismic waves. Re-cent research has shown that one can carry out seismicimaging with random noise, rather than controlled seis-mic sources as the source. This offers the opportunityto continuously monitor the subsurface using ambientnoise. The next level of complexity is to monitor fluidflow in the subsurface. In section 3 we show evidence of afluid pulse that propagates along a fault zone, as inferredfrom seismic data, and give an example of monitoringinfiltration processes using the self-potential. Anotherchallenge is that of monitoring biogeochemical processesremotely. We treat this problem in section 4, and showan example how the redox potential in the subsurfacecan be inferred from measurements of the self-potential.We also show an example of a controlled laboratory ex-periment wherein chemical changes caused by microbialactivity can be monitored with seismic fields and withinduced polarization measurements.
Together, these case studies highlight the potentialthat geophysical methods hold for monitoring mechani-cal, fluid, and biogeochemical processes. Although muchof this reseach is in an early stage of development, theadvances illustrated by these case studies suggest thatfurther research is warrented.
2 MONITORING MECHANICALPROPERTIES
2.1 Monitoring vertical ground motion
The simplest way to monitor changes in the subsurfaceis to detect deformation of the earth’s free surface. Al-though conceptually straightforward, this is technicallychallenging because in many applications to be usefulthe deformation must be measured with an accuracysmaller than a centimeter. Geodetic techniques are thetool of choice. Recent developments in the use of theGlobal Positioning System (GPS) (Dixon 1991; Engeand Misra 1999) and Interferometric Synthetic Aper-ture Radar (InSAR) (Massonnet and Feigl 1998, Bamlerand Hartl 1998, Burgmann et al. 2000) make it possibleto measure the deformation of the earth’s surface withsuch an accuracy.
InSAR relies on coherent reflections of a radar beamfrom a satellite to the earth’s surface and back. Thephase difference of these reflections recorded during sub-sequent passes of the satellite can be used to create amap of the deformation of the earth’s surface in thedirection of the reflecting radar beam (Massonnet andFeigl 1998, Bamler and Hartl 1998, Burgmann et al.2000). The phase difference between the backscatteredwaves measured in the two passes of the satellite is based
Figure 1. InSAR observed subsidence north of BakersfieldCalifornia associated with hydrocarbon extraction betweenAugust 1997 and July 1998. The color-scale gives the phase-wrapped vertical displacement with one cycle of color corre-sponding to 28.3 mm.
on an interferometric technique that quantifies to whichdegree the two waves are on phase or out of phase foreach pixel on the ground surface. The used pixel sizeusually is 30 meters. Adding an integer number of cy-cles to one of the waves does not change the interfer-ence of these two waves. The phase difference can thusbe measured only modulo 2π, where deformation corre-sponding to a phase difference greater than 2π is shownin color images of the deformation as a repeat in thecolor pallet. The magnitude of the surface deformationsmeasured in one fringe (a phase difference between 0 to2π) is governed by the satellite radar wavelength (Eu-ropean Space Agency ERS1, ERS2, and ENVISAT andthe Canadian Space RADARSAT-1 and RADARSAT2all use 5.6 cm C-band) and is calculated by dividingthe wavelength in half to account for the two-way travelpath of the radar pulse. Therefore, if the land surfacesubsidence by 85 mm it would be seen as three repeatingcolor cycles of 28.3 mm in the interferogram.
An example of the vertical ground deformationmeasured with InSAR, in Figure 1, shows the observedsubsidence north of Bakersfield, California, associatedwith hydrocarbon extraction between August 1997 andJuly 1998. The figure shows two distinct regions of sub-sidence. The northwest region subsides about 3 cm, andthe southeastern region has an overall pattern with 3cm of subsidence over an area about 5 km wide with asmuch as 5 cm of subsidence in two localized features onthe western margin of the subsidence trough. The north-western region of subsidence is limited by faults on boththe eastern and southern margins. Since the faults de-limit the subsidence associated with the hydrocarbonextraction, this implies that these faults likely act asbarriers for the fluid flow. In this example, InSAR mea-

Non-invasive geophysical monitoring techniques 49
Figure 2. Top panel: the change in the two-way travel timeover a chalk reservoir in Norway as obtained from stackedseismic data. Bottom panel: the change in the travel com-puted from a geomechanical model of the reservoir and itssurroundings using equation (3) with the value R = 5.
surements can thus be used to make inferences about thefluid flow in the subsurface, and the sealing propertiesof faults. InSAR has been used to monitor co-seismicand tectonic deformation (Massonnet and Feigl 1998),to monitor the deformation associated with the extrac-tion of water or hydrocarbons (Bawden et al. 2001), andto monitor the heaving of the surface caused by cyclicsteam injection in the recovery of heavy oil (Stancliffeand van der Kooij 2001).
2.2 Monitoring compaction
It is also important to monitor the deformation withinthe earth. The compaction of hydrocarbon reservoirsduring production leads to mechanical changes in thesubsurface in the vicinity of the reservoir. The regionsabove and below a reservoir usually are in a state of anextension in order to accommodate the compaction inthe reservoir. This leads to detectable changes in the P-wave velocity above and below the reservoir that can beretrieved by a comparison of the reflections in time-lapseseismic data.
The top panel of Figure 2 shows the change in ar-rival time of reflected waves in a North Sea Chalk Reser-voir obtained from a comparison of time-lapse stackedfield data. The top of the reservoir is marked with thesolid line in that figure. Note that the change in thearrival time is not confined to the reservoir (two-waytravel time larger than 2600 ms) and that waves re-flected above the reservoir are slowed down appreciably.
The change in the arrival time caused by the ex-tension arises from two factors. First, an extension ofthe subsurface produces a longer path length from the
surface down to a reflector and back. For a verticallypropagating wave, this geometric factor changes a depthinterval dz into (1 + εzz) dz. Using that the travel timeis related to the seismic velocity v by t =
Rv−1dz, this
gives the following geometric contribution to the traveltime change δt:
δtgeometric =
Zεzz
vdz . (1)
The strain also introduces changes in the material prop-erties, and the relative velocity change due to the strainis given by δv/v = −Rεzz. The proportionality con-stant R depends on the rock properties. For a variety ofdifferent rocks, this dimensionless constant has valuesusually between 1 and 5 (Hatchell and Bourne 2005).The associated travel time is given by
δtproperties =
ZR
εzz
vdz , (2)
This travel time change could have been expressed inthe stress-change rather than the strain, but the corre-sponding value for R then would be much more variablefor different rock types. Combining these expressionsgives
δt =
Z(1 + R)
εzz
vdz . (3)
For the North Sea Chalk reservoir, the travel-timechange computed using equation (3) and a geomechani-cal model of this reservoir is shown in the bottom panelof Figure 2. Note that the travel-time change measuredfrom stacked seismic data (top panel) agrees well withthe travel time change computed from a geomechan-ical model (bottom panel). Such a comparison can beused to validate geomechanical models of the subsurface(Hatchell and Bourne 2005), especially when in addi-tion to changes in the travel time, changes in reflectionstrength are also taken into account (Tura et al. 2005).
2.3 Seismic interferometry
Interferometry is a sensitive method for detectingminute changes by using waves that bounce repeat-edly within the medium that is probed (Lauterborn etal. 1995). This principle is widely used in optics andnow also finds application for monitoring purposes inthe geosciences. Coda wave interferometry uses the sen-sitivity of waves that have bounced repeatedly in themedium thus enabling monitoring of minute changes inthe medium (Snieder et al. 2002, Snieder 2004a, Snieder2006b). This technique has been used to monitor volca-noes (Ratdomopurbo and Poupinet 1995, Gret et al.2005, Pandolfi et al. 2006, Wegler et al. 2006) andfault-zone properties (Poupinet et al. 1984), for the thedetection of velocity changes related to earhthquakes(Nishimura et al. 2000, Nishimura et al. 2005) or sec-ular changes in tectonic stress (Furumoto et al. 2001),

50 R. Snieder, et. al.
Phone
B−RIGHT
R−190
R−180
B−R
2nd
B−RIG
HT STRAIGHTB−R
IGHT SPUR
C−RIGHT STRAIGHT
R−170
BRRTEMP
R90
VOL TAGEHIG
H
R90−1
R30−3
HIGH
VOL TAGE
TP−1
R30−2A
Slot with Flat Jacks
Scale, m0 10 20 30
Slot with pressure cell(3.04 m into rib,
1.83 m high,7.62 cm wide)
Hammer source
Geophone
Figure 3. Geometry of the experiment in the Edgar Mine.Geophone and hammer source locations are labeled in theplan. The pressure cell in the slot is indicated by the smallline between geophone and source location. The inset (topright) sketches the pressure cell installed in the pillar.
0 0.05 0.1 0.15Time (s)
-0.03
-0.02
-0.01
0
0.01
0.02
0.086 0.087 0.088 0.089 0.09
-0.0010
0.001
-0.001 0 0.001 0.002 0.003
-0.010
0.01
Figure 4. Waveforms measured at 4.14 MPa of pressure(blue) applied by the jack (blue) and measured at a pressurefrom the jack of 12.41 MPa (red). The upper panel showsthe waveforms in the early time window and the lower panelthose in a later window.
and for the detection of changes in materials using ul-trasound (Roberts et al. 1992, Gret et al. 2006a).
We illustrate the principle of coda wave interferom-etry with a controlled experiment wherein the stress in amine pillar was changed using a hydraulic jack (Gret etal. 2006b). The experiment was carried out in the EdgarMine in Idaho Springs, Colorado, an experimental mineowned by the Colorado School of Mines. The geome-try of experiment is shown in Figure 3. The mine pillarshown in this figure is surrounded by tunnels that areabout 3-m high. The stress-state in the pillar is changedby jacks that load two plates with a surface area of about1 m2 placed in a slit cut into the pillar (inset in Figure3). Seismic waves generated with a hammer source arerecorded on a accelerometer mounted on the tunnel wall;see Figure 3. The waveforms for two pressure-states ofthe jack are shown in Figure 4: the waves recorded fora pressure applied by the jack of 4.14 MPA are shownin blue, while the red line shows the waves recorded fora pressure of 12.41 MPa.
The early arriving waves are shown in the panel inthe top-right. These first-arriving waves are so repeat-able that based on these first arrivals it is impossible tomake any statements about the change in the seismicvelocity associated with the change in stress. The panelin the bottom right shows a portion of the later-arrivingwaves. These later-arriving waves show a clear changein the phase with changing pressure. This phase changecan be quantified using a time-shifted cross-correlationand used to estimate the change in seismic velocity(Snieder 2006b). Several non-overlapping time windowsprovide independent estimates of the velocity changethat can be used as a consistency check on the employedmethod and can also be used to estimate the uncertaintyin the estimated change in the velocity (Snieder et al.2002, Gret et al. 2006a). For a change in pressure from 0MPa to 8 MPa, the estimated velocity change is 0.25%with an uncertainty of 0.02% (Gret et al. 2006b). Thehigh sensitivity of this technique is due to the samplingof the region where the stress is changed by the later-arriving waves that bounce back and forth repeatedlywithin the mine pillar.
Another active area of research in seismic interfer-ometry is the extraction of the response of a system fromthe measurement of incoherent signals in the system.By cross-correlating, or deconvolving, noise recorded attwo receivers, it is possible to retrieve the impulse re-sponse associated with the wave propagation betweenthese receivers. (In mathematical jargon, the responseof the system to an impulsive loading is referred toas the Green’s function.) Derivations of this principlehave been presented based on normal modes (Lobkisand Weaver 2001), on representation theorems (Wape-naar 2004, Weaver and Lobkis 2004, Wapenaar et al.2005), on time-reversal invariance (Derode et al. 2003a,Derode et al. 2003b), and on the principle of station-ary phase (Snieder 2004b, Roux et al. 2005b, Snieder

Non-invasive geophysical monitoring techniques 51
0 5 10 15 20 25 30 35 40time (s)
B12345678910
Figure 5. The Robert A. Millikan Library in Pasadena(left panel) and locations of the accelerometers (red circles).Right panel: the North-South component of the accelerationrecorded at the west side of the building after the YorbaLinda earthquake of 03 Sep 2002 (ML=4.8, Time: 02:08:51PDT, 33.917N 117.776W Depth 3.9km).
Figure 6. The waveforms of Figure 5 after deconvolutionwith the waves recorded at the top floor.
et al. 2006b). This technique has found applications inultrasound (Weaver and Lobkis 2001, Malcolm et al.2004, Larose et al. 2006), crustal seismology (Campilloand Paul 2003, Shapiro et al. 2005, Roux et al. 2005a,Sabra et al. 2005), exploration seismology (Calvert et al.2004, Bakulin and Calvert 2004), structural engineering(Snieder and Safak 2006, Snieder et al. 2006a) , andnumerical modeling (van Manen et al. 2005). Snieder(2006a) showed theoretically that the Green’s functionfor the diffusion equation can be extracted by correlat-ing pressure fluctuations recorded at different locationswithin reservoir. This makes it possible to retrieve theimpulse response for fluid transport from ambient pres-sure fluctuations.
As an example, we show in Figure 5 the horizontalmotion recorded in the basement and the 10 floors of the
Robert A. Millikan library of Caltech (Pasadena) afterthe Yorba Linda earthquake of 03 Sep 2002 (ML=4.8,Time: 02:08:51 PDT, 33.917N 117.776W Depth 3.9km).The excitation of the building by the earthquake is in-coherent. The waveforms of Figure 5 are the result ofa combination of (i) the incoherent excitation, (ii) themechanical properties of the building, and (iii) the cou-pling of the building with the subsurface. In order to un-ravel these different physical factors, Snieder and Safak(2006) deconvolved the motion at different levels withrespect to the motion at a target level. The motion atall levels, after deconvolution with the motion at the10th floor is shown in Figure 6. In contrast to the in-coherent waveforms of Figure 5, the deconvolved wavesare simple: they consist of one upgoing wave and onedowngoing wave. These upgoing and downgoing wavescan be used to estimate the shear velocity and attenu-ation in the Millikan library. This method can also beapplied to sensors placed in the subsurface. Mehta et al.(2006) extract coherent P- and S-waves, as well as P toS converted waves, propagating along a borehole fromincoherent waveforms. Snieder and Safak (2006) showthat the deconvolved waveforms depend neither on thespecific excitation on the building, nor on the couplingof the building to the subsurface (with the associated ra-diation loss). In fact, in seismic interferometry one caneven create coherent wave states of the system underdifferent boundary conditions than those of the physi-cal system in which the waves are recorded (Snieder etal. 2006a).
The advantages of seismic interferometry in thegeosciences are twofold. First, the receiver whose sig-nal is used as a reference for the deconvolution, playsthe role of a (virtual) source. This means that it is pos-sible to diagnose the subsurface as if there were sub-surface sources, although in reality only receivers arepresent in the subsurface. Second, since this techniqueis based on recordings of incoherent waves, it can beused to continuously monitor the subsurface using con-tinuous noise recordings. One can combine this methodwith coda wave interferometry for continuous monitor-ing using ambient noise. This has been used to mon-itor daily variations in the seismic velocity associatedwith rainfall (Sens-Schonfelder and Wegler 2006) andwith stress-changes caused by an earthquake (Weglerand Sens-Schonfelder 2006). For the Millikan library, forexample, one can use subsequent earthquakes to mon-itor temporal changes in the building. This techniquecan be extended to other structures (e.g., drilling rigs,bridges, aircraft) and is of particular interest for detect-ing changes in structures caused by traumatic eventssuch as explosions, hurricanes, fire, and earthquakes.

52 R. Snieder, et. al.
2.4 Challenges and future Directions inMonitoring Mechanical Properties
While the measurement of mechanical properties, suchas seismic velocity, is fairly well-developed, the connec-tion of these mechanical properties with micostructureis often unclear. An example is seismic anisotropy. Thetheory of seismic wave propagation in anisotropic mediais advanced (Tsvankin 2001), but the relation betweentemporal changes in seismic anisotropy and associatedmicrostructure (such rock formation, deformation, andfluid migration) is not nearly as well established.
Seismic attenuation is another physical propertythat can be measured, but whose connection with lo-cal material properties is often not clear. Because of thedependence of seismic attenuation on the presence of flu-ids, this quantity might be useful for diagnosing fluids inthe subsurface. Attenuation can be attributed both tointrinsic attenuation and to scattering attenuation. (In-trinsic attenuation is the transfer of mechanical energyof wave propagation to other forms of energy, such asheat or squirt-flow, while scattering attenuation is theconversion of energy of a propagating wave to energyof scattered waves.) The separation of these differentmechanisms of attenuation needs further research, aswell as does the relation between instrinsic attenuationand properties of fluid-filled porous media (Pride et al.2003).
Seismic interferometry has much potential for pas-sively monitoring the mechanical properties of the sub-surface and of structures such as buildings, bridges,pipelines, and drilling rigs. For these structures the de-tection of incipient change is of special importance be-cause it could lead to remediation of damage that isabout to develop. This technique can also be importantfor assessing damage to structures caused by traumaticevents such as hurricances or explosions. One hurdle inthe application of new monitoring techniques is thatlegislation often is slow to take advantage of new tech-nological developments.
Real-time diagnostics would be useful in a numberof applications for monitoring the subsurface, which in-clude monitoring reservoirs, remediation, and monitor-ing in civil engineering projects and construction. Thedevelopment and utilization of permanent sensors canplay an important role in permanent monitoring.
Temporal variations caused by natural sources canoffer new ways to diagnose the subsurface. For example,the imprint of ocean tides on pore pressure has beenmeasured in reservoirs (Furnes et al. 1991, Smit andSayers 2005), and changes in P-wave velocity associatedwith the solid earth tides have been measured as well(Yamamura et al. 2003). Micro-seismic events have beenobserved during the passage of Rayleigh waves excitedby large earthquakes (Miyazawa and Mori 2006). Theearth response to these variations might carry impor-tant information about the mechanical properties andmicrostructure of rocks and their interaction with fluids.
3 MONITORING FLUID TRANSPORT
Geophysicists often exploit the sensitivity of theirrecorded signals to the presence of fluids in orderto address questions concerning subsurface fluid dis-tributions. For instance, exploration seismologists in-voke the Gassmann equation to interpret if reflectedwaveforms bear the imprint of fluid saturation. TheGassmann equation relates the elastic properties of aporous medium to the properties of the rock matrix andthose of the pore fluid (Gassmann 1951, Wang 2000).Similarly, since pore pressures modify seismic velocities,reflection tomography can be used to predict pore pres-sures (Sayers et al. 2002). Though much is known aboutthe fluid sensitivity of geophysical signals, the interac-tion of rocks and fluids continues to be an active researcharea. Current topics in rock/fluid properties are widen-ing the scope of geophysical knowledge by studying fluideffects on poorly-understood rock types, such as carbon-ates, fault gouge, and marine sediments containing gashydrates (Chand and Minshull 2003). In addition, long-standing questions persist concerning the precise role offluids in seismic wave attenuation (Pride et al. 2003).
With periodic time-lapse or even continuous mon-itoring techniques becoming more widespread, charac-teristic fluid signatures can be further exploited to studydynamic flow processes and mechanisms of fluid trans-port. Applications of these techniques with societal im-pact include the long-term sequestration (storage) ofCO2 in subsurface traps, delineation of the water ta-ble, and detection of fluid transport near radioactive-waste depositories (Long and Ewing 2004). Whether thecause of subsurface fluid flow is natural or induced, ad-vanced monitoring techniques provide a more completepicture of various flow phenomena, such as pore pres-sure fronts, microseismicity, the interactions of fluidsand fractures, flow-related interface phenomena, fluidmigration, and pathways for flow in the presence of mul-tiple fluid phases.
Fluid transport in the subsurface can arise fromnatural processes such as tides, earthquakes, and fluidmigration. Several recent studies utilize monitoringtechniques to reveal the dynamics of these events.Teanby et al. (2004) report temporal variations in seis-mic anisotropy caused by fluctuations of the stressfield in response to ocean tides. A monitoring tech-nique proposed by Silver et al. (2004) exploits this phe-nomenon to calibrate stress sensitivity of transmittedwaves. Unusual earthquakes in the Long Valley Caldera,as observed by Hill et al. (2003), are attributed tofluid migration of magma or hydrothermal brine. Theseearthquakes are enriched in low frequencies and havenon double-couple source radiation patterns. Hill et al.(2003) make the case that understanding the earthquakesource in these instances is a necessary part of effec-tively alerting the public to impending volcanic erup-tion. Crampin et al. (2003) observe water-level fluctu-ations in wells close to the Husavık-Flately Fault in
Non-invasive geophysical monitoring techniques 53
Iceland, where the water level is continuously moni-tored during times of increased seismicity. The theoryof anisotropic poroelasticity is able to accurately ex-plain these changes. Similar earthquake-related water-level fluctuations are described by Roeloffs et al. (2003).
Use of time-lapse radar and electrical tomographicmethods for monitoring infiltration pathways and mois-ture variations in the near-subsurface is now fairly welldeveloped (e.g., Hubbard et al. 1997, Binley et al. 2002,Alumbaugh et al. 2002, Kowalsky et al. 2004). Monitor-ing techniques have been applied to problems concern-ing flow induced by reservoir production, pumping, anddrilling operations (Calvert 2005). For instance, abso-lute gravity measurements have been acquired in bothpetroleum and groundwater applications (Brown et al.2002, Cogbill et al. 2005). In the case of groundwater,Cogbill et al. (2005) have observed positive changes inabsolute gravity in a region surrounding a water wellthat are believed to be associated with nearby aquiferrecharge. In contrast, no gravity changes were recordedin the immediate vicinity of wells being pumped eventhough significant changes in the surface elevation hadoccurred, as measured by GPS. The lack of a gravity sig-nal during a time of surface deformation can be used toconstrain models for how the fracture system has beenmodified by the pumping of water. As an example of apetroleum application of absolute gravity, Brown et al.(2002) have observed a clear and widespread change inabsolute gravity and have mapped it to indicate wherepumped saline water has replaced oil at Prudhoe Bay.
Landrø and Stronen (2003) have demonstrated thatwhen more than two time-lapse surveys are available,waterfronts in a reservoir can be tracked in differenced4D seismic images. They showed the use of CO2 as atracer to aid structural interpretation. The CO2 in thiscase was not injected for the specific purpose of seques-tration or enhanced oil recovery - it was simply used tohighlight the permeable pathways in the reservoir. Suchinformation can prove invaluable for planning drillingprograms to optimally produce reservoirs. Time-lapseseismic techniques continue to be improved for the mon-itoring of CO2 sequestration. At the West Pearl Queenfield, a DOE test site for CO2 sequestration, Benson andDavis (2005) have reported on the detection of injectedCO2 from two high-quality, highly-repeatable seismicsurveys. Below, we review two examples of the noveluse of geophyiscal data for monitoring fluid transport.
3.1 Detection of a fluid pulse migrating alonga fault zone
Recently, Haney et al. (2005) investigated the mech-anism of strong fault-plane reflections from a growthfault at the South Eugene Island field in the Gulf ofMexico. Fault-plane reflections, unlike reflections fromsedimentary layers, might not be primarily associatedwith lithological differences. Since faults often act as ei-
ther fluid seals or conduits (Hooper 1991), strong pore-pressure differences in and around faults can give riseto fault-plane reflectivity (Haney et al. 2006). By ex-amining two seismic images, one from 1985 and anotherfrom 1992, Haney et al. (2005) observed that an areaof strong fault-plane reflectivity associated with a faultknown as the B-fault appeared to move 1 km along thefault-plane in the up-dip direction. This up-dip move-ment is depicted in the two reflectivity maps of Figure 7.
Fluid movement up the fault-plane is particularlynoteworthy at South Eugene Island since several linesof evidence exist suggesting that natural fluid migrationis presently occurring in the mini-basin petroleum sys-tem (Anderson et al. 1991, Anderson et al. 1994, Loshet al. 1999, Whelan et al. 2001, Revil and Cathles 2002,Haney et al. 2005). The pulsing of fluid up a permeablefault zone is also consistent with a nonlinear perme-ability model first introduced by Rice (1992) and laterproposed by Revil and Cathles (2002) to be directly ap-plicable at South Eugene Island. In this model, the fluidpulse is a pore-pressure shock wave that moves along thefault with velocity that is predicted from theory. Milleret al. (2004) use the same shock-wave model to explainthe migration of fluid-related earthquake hypocentersalong an active fault in Italy. The existence of thesepore-pressure shock waves is due to the deformationof the porous media pore-pressure variations. The ex-istence of the shock-wave thus provides direct evidenceof a coupling between the fluid flow and deformation ofthe host rock (Minkoff et al. 2004).
3.2 Direct measurement of fluid flow with theself-potential
Through combined numerical, laboratory, and field ex-periments, Suski et al. (2006) have made significantprogress toward showing how to successfully monitorthe water table using self-potential (SP) methods. Self-potential signals originate from a variety of mecha-nisms, including electro-kinetic (the so-called stream-ing potential) and electro-redox effects (which are dis-cussed in a section 4.1 of this work) (Nyquist and Corry2002). Electro-kinetic effects (Revil and Linde 2006) arethe same phenomena responsible for coupling seismicand electromagnetic fields in the field of electroseismics(Pride and Morgan 1991).
Shown in Figure 8 are details of the infiltration ex-periment conducted by Suski et al. (2006). The experi-ment is based on the idea that groundwater flow in soilproduces a self-potential signal that can be measuredat the surface. Hence, the self-potential method detectsand maps out the effects of dynamic flow. The upperleft panel of Figure 8 is a map view of the field layoutused by Suski et al. (2006) consisting of 18 piezome-ters and 41 (Pb/PbCL2) non-polarizable electrodes. Tomonitor the changes in the piezometric surface causedby fluid infiltration, the ditch, shown in the upper left

54 R. Snieder, et. al.
Ahigh
lowNorth North
relativereflectivity
A10ST
updip
1985 1992
B600 m 600 m
Figure 7. Evidence of fluid transport along a fault in the Gulf of Mexico inferred from seismic images constructed from seismicdata recorded in 1985 and 1992. (A) Map view of fault-plane reflectivity from a growth fault known as the B-fault in 1985. Thearea of highest fault-plane reflectivity is circled in gold. (B) Map view of the B-fault reflectivity, as in (A), but from 1992. Thedata extend over a slightly larger area than in (A); however, the spatial perspective is identical. The area of highest reflectivity,circled in gold, is shifted roughly 1 km NE in the updip direction relative to its location in 1985, as is expected for a fluid pulseascending the B-fault (Revil and Cathles 2002). This movement is represented by the arrow in (A). Also shown is the locationof the A10ST well intersection, where exceptionally high fluid pressures were encountered while drilling into the B-fault zonein 1993, a year after the 1992 seismic survey (Losh et al. 1999).
panel of Figure 8, is filled with water. The filling of theditch comprises the short time-duration Phase I of theinfiltration experiment pictured in the upper right panelof Figure 8. The other two phases cover the episodes ofconstant water level in the ditch (Phase II) and relax-ation, or drainage, of the head (Phase III). The dataplotted in the upper right panel of Figure 8 include thewater level in the ditch, the depth to the piezometricsurface measured at several piezometers, and the cor-responding self-potential signal measured at the elec-trodes. The trend of the self-potential signal correlateswell with the latter two phases of fluid infiltration.
The lower panel in Figure 8 compares the mea-sured self-potential signals to changes in piezometrichead. The self-potential signal depends more or less lin-early on the piezometric level, with a slope of -5.5 ± 0.9mV/m. From soil samples taken at the test site, Suski etal. (2006) independently find in the laboratory that theslope can be between -4.0 mV/m and -5.9 mV/m, de-pending on the type of fluid saturating the pore space ofthe soil. Finally, the solid line in the lower panel in Fig-ure 8 is the result of a finite-difference numerical model(Titov et al. 2005). The agreement with the field datashows that the hydrological and self-potential properties
of the subsurface are modeled well. With these results,Suski et al. (2006) demonstrate the ability of the self-potential method to non-invasively monitor groundwa-ter flow. An important property of these self-potentialmeasurements for the purposes of continuous monitor-ing is that they are inexpensive to acquire (Nyquist andCorry 2002) in contrast to 3D seismic data acquisition.In addition, the self-potential method is applicable tothe problem of monitoring of CO2 injection (Moore etal. 2004).
3.3 Challenges in monitoring fluid flow
Many challenges lie ahead for the advanced monitoringof fluid transport. The sensitivity of advanced moni-toring techniques aiming to track fluid transport mustbe maximized with respect to fluid saturation, pressure,and flow. Crampin (2003) argues that certain techniques(e.g., shear-wave splitting) inherently are extremely sen-sitive because they probe a critical system (e.g., cracksand fractures). In geophysics, the concept of critical-ity is often invoked when describing the stress state offault systems in the crust (Zoback and Townend 2000).Extreme sensitivity and criticality are linked to nonlin-

Non-invasive geophysical monitoring techniques 55
Figure 8. Experimental setup and results of a fluid infiltration test by Suski et al. (2006). The upper left panel shows an arrayof 18 piezometers and 41 non-polarizable electrodes arranged in and around a rectangular ditch (blue). The soil at the site iscomprised of clay and silt with porosity that varies between 0.2 and 0.3. The upper right panel shows three quantities: the waterlevel in the ditch (thick solid line), depths to the piezometric surface (thin solid, dotted, and dashed lines), and self-potentialsignals (black filled circles). The measurements capture three different stages of infiltration: (I) beginning of infiltration, (II)maintenance of constant head in the ditch, and (III) relaxation of the head. The lower panel is a comparison between measuredself-potential signals versus the isometric head change (solid points with error bars) and the results of a finite difference numericalmodel (solid line).
earity, and nonlinear rock moduli have recently beenimplicated by Gomberg and Johnson (2005) as a causeof dynamic triggering - a phenomenon in which mi-croearthquakes are initiated on critically-stressed faultsby passing seismic waves from earthquakes over 1000km away (Freed 2005). The dynamic strains in thesecases are on the order of only a few microstrains (10−6)(Gomberg and Johnson 2005). In addition to criticality,enhanced sensitivity can also be achieved with meth-
ods based on monitoring seismic waves by exploitingthe multiply-scattered coda (e.g., coda wave interfer-ometry, as discussed in section 2.3). Perhaps the mostdaunting challenge is that in order to move in the fu-ture from periodic time-lapse measurements to contin-uous monitoring, the methods used for monitoring can-not be costly. It is worth emphasizing again that theself-potential method employed by Suski et al. (2006) isrelatively inexpensive. In contrast, the method of using
56 R. Snieder, et. al.
injected CO2 as a structural tracer to find permeablepathways, although promising, is currently vastly moreexpensive.
Advanced monitoring plays a prime role in thegrowing field of CO2 sequestration. To make sequestra-tion successful, it is necessary to determine whether theinjected CO2 is sequestered or is leaking to the surface.Leakage to the surface can occur via fracture systemsand fault zones, or simply through the casing of injectionwells. Finally, it remains a challenge to fully understandthe hydraulic properties of a field area. The methoddescribed by Shapiro et al. (2002), which uses micro-seismicity triggering fronts to measure the (possiblyanisotropic) permeability tensor, is one way to achievethis goal through advanced monitoring. Other examples,which focus on the development of approaches to jointlyinvert time-lapse tomographic radar data and hydro-logical data (such as wellbore measurements or tracertests) have illustrated the utility of geophysical meth-ods for providing high resolution estimates of hydrualicconduductivity (e.g., Kowalsky et al. 2005).
4 MONITORING BIOGEOCHEMICALPROCESSES
Successful management of subsurface systems often re-quires information about biogeochemical properties andprocesses, such as the type and concentration of porefluids or sediment geochemistry, redox zonation, andthe transformation of and interactions between speciesas a system is being manipulated. In addition to usinggeophyiscal methods to track fluid distribution as wasdescribed in the previous section, there is also a needto track the onset and characteristics of geochemicalchanges that occur in response to fluid introduction orreplacement. For example, the potential of using geo-physical techniques to monitor CO2 distribution associ-ated with petroleum and sequestration applications waspreviously discussed. In addition to the fluid migration,introduction of the CO2 can cause dissolution of min-erals or can mobilize trace metals (e.g., Kharaka et al.2006). A current challenge is to use geophysical methodsto monitor these geochemical changes. Although manystudies have focused on investigating the geophysicalsignatures of pore fluid substitutions associated withinfiltrating soil water, hydrocarbon extraction, or salt-water intrusion, few studies have explored the impactof other types of (bio)geochemical alterations on the ef-fective geophysical signature.
Recent investigations have explored the use of dif-ferent types of geophysical methods for monitoring bio-geochemical changes, some of which are microbiallymediated. Several studies have revealed anomalouslyhigher electrcal conductivity signatures associated withhydrocarbon contaminated sites, which has been at-tributed to altered fluid chemistry associated with bi-ological degradation (e.g., Atekwana et al. 2005). Abdel
Aal et al. (2004) explored the effects of microbial pro-cesses on electrolytic and interfacial electrical proper-ties Ntarlagiannis et al. (2005b) explored how inducedpolarization measurements changed as a function of mi-crobial cell concentration and grain surface coating. Theuse of self-potential methods to map large-scale varia-tions in redox conditions was described by Naudet etal. (2004). Chen et al. (2004) illustrated how GroundPenetrating Radar (GPR) amplitudes could be used toestimate sediment geochemistry. Williams et al. (2005)and Ntarlagiannis et al. (2005a) describe seismic andInduced Polarization (Fink et al. 1990) responses tobiomineralization under controlled column conditions.The results from these and other recent studies high-light the potential that geophysical methods have formonitoring complex biogeochemical processes, which isa prerequisite for successful management of subsurfaceproblems or resources. Two of these studies are brieflydescribed below.
4.1 Characterization of Redox Potential
The observed distribution of redox processes is an im-portant factor in the design of remedial strategies forcontaminated groundwater systems. Redox potential, orEh, indicates the tendency for oxidation-reduction re-actions to occur. A series of redox gradients often isestablished adjacent to contaminant plumes (e.g., Love-ley et al. 1994). Understanding redox zonation is a par-ticularly important factor in designing an optimal re-mediation approach. Under equilibrium conditions, in-situ measurements of redox potential can be obtainedthrough well-bore measurements, although disturbanceand contamination associcated with drilling often cor-rupt these measurements. The distribution of the ki-netic redox processes can also be deduced by observingpatterns of electron acceptor consumption, final prod-uct production, and concentrations of dissolved hydro-gen based on measurements retrieved from well-bores.However, many studies suggest that inference of redoxprocesses using such approaches is not straightforward.
A recent study assessed redox potentials associ-ated with a landfill contaminant plume using the self-potential technique (Naudet et al. 2004). Self-potentialsignals measure the potential difference between a fixedreference non polarizable electrode and a roving elec-trode using a high input impedance voltmeter. In near-surface systems, the self-potential response depends onthe groundwater flow (electro-kinetic contribution) andredox conditions (electro-redox contribution). Naudet etal. (2004) used the variation in hydraulic head mea-surements in an aquifer near a landfill to estimatethe electro-kinetic contribution (Figures. 9a and 9b),which was subsequently removed from the effective self-potential signal. The residual self-potential signal corre-lated well with redox potential measurements collectedin well-bores, and was used to provide spatially exten-

Non-invasive geophysical monitoring techniques 57
Figure 9. The streaming potential component of the self-potential signals is calibrated outside the contaminant plumeby plotting the kriged self-potential signals and the hydraulicheads. The arrows provide the direction of ground waterflow and are proportional to the hydraulic head gradient (b).The streaming potential component is then estimated ev-erywhere using the kriged hydraulic heads (a). The residualself-potential signals are obtained by removing the streamingpotential component from the measured self-potential signals(c). This residual self-potential map is proportional to the re-dox potentials measured in the aquifer in a set of piezometers(d).
sive estimates of redox potential (Figure 9c and 9d).This study illustrates the value of an inexpensive geo-physical technique to provide information about redoxpotential over field-relevant spatial scales and in a noninvasive manner. Such information can be used to de-sign remediation treatments or to choose the locationsof monitoring wells.
4.2 Monitoring biogeochemical dynamicsusing seismic and induced polarizationmethods
Remediation treatments may induce dynamic trans-formations in biogeochemical and hydrological prop-erties in the subsurface. Potential alterations due toremediation treatments include, for example, dissolu-tion and precipitation of minerals, surface complexa-tion, gas evolution, changes in soil water and oxygen
levels, sorption, attachment/detachment, oxidation andreduction, biofilm generation, and changes in perme-ability and porosity. Although understanding and ul-timately manipulating these transformations is criticalfor sustainable in-situ remediation, developing such anunderstanding is hindered by our inability to observebiogeochemical dynamics in-situ over a spatial scale rel-evant for investigating the macroscopic behavior of asystem, in the presence of natural heterogeneity.
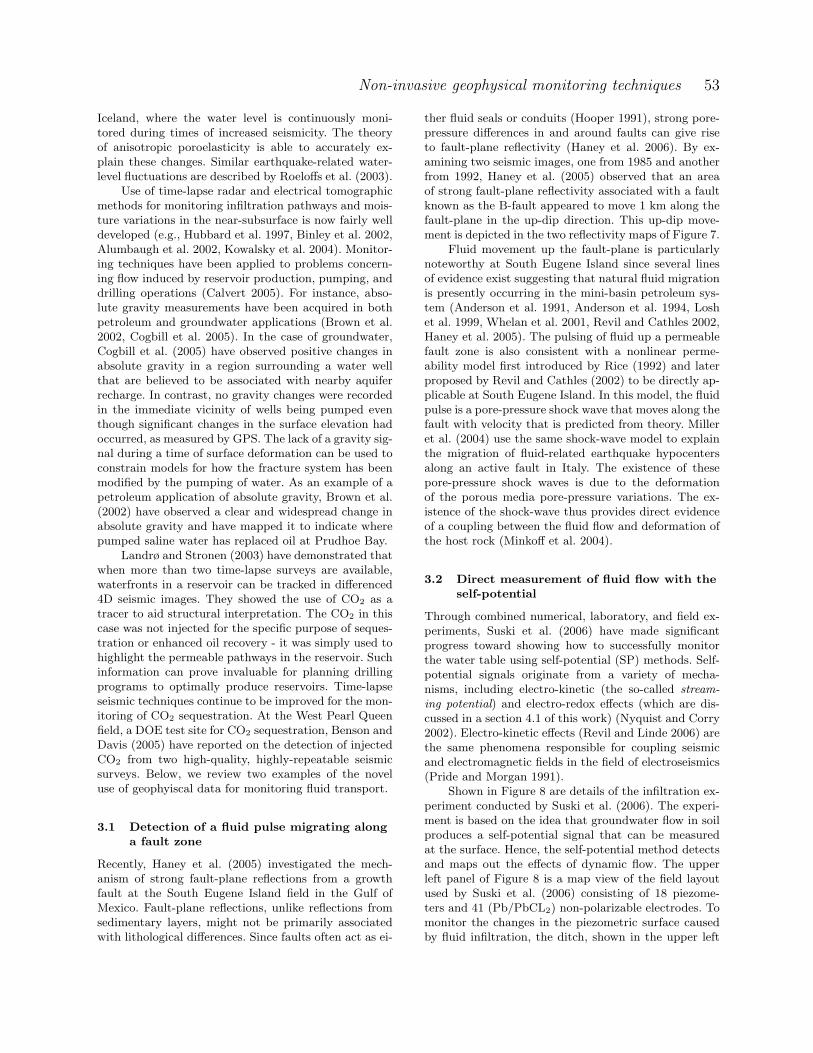
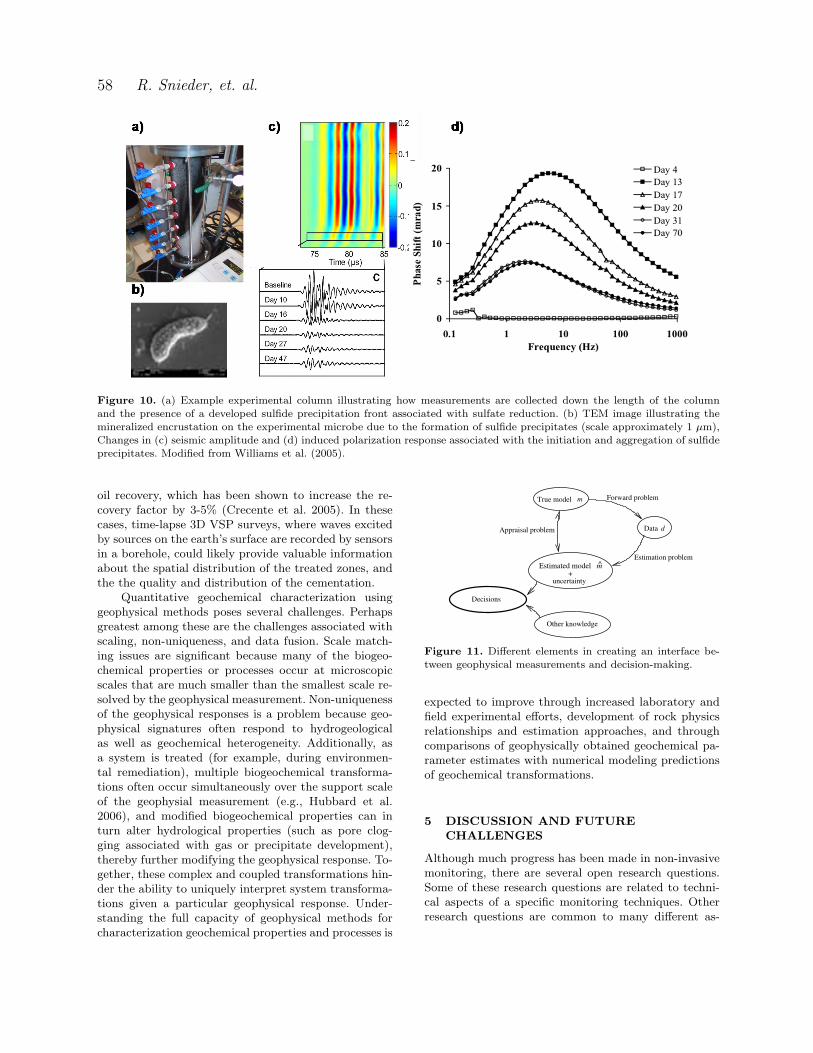
Recent research has explored the use of time-lapseseismic and induced polarization methods for detect-ing the evolution of gasses, biofilms, and precipitatesassociated with processes that commonly occur dur-ing biostimulation, such as during denitrification andsulfate reduction. Biostimulation involves the additionof carbon sources, nutrients, and electron acceptors ordonors into the subsurface to increase, or ’stimulate’the activity and growth of naturally occuring microor-ganisms. Once stimulated, these organisms can mediateprocesses that benifially change the toxicity and mobil-ity of contaminants (Office of Biological and Environ-mental Research of the Department of Energy 2003).Williams et al. (2005) conducted laboratory biostimu-lation experiments under saturated flow conditions tomonitor the biogeochemical, hydrological, and geophys-ical responses associated with sulfate reduction usinga suite of columns having vertically distributed sam-plers and geophysical sensors (Figure 10a). This studyindicated how microbe-mediated zinc and iron sulfides,which developed along grain surfaces within the porespace, were attached to microbial cells (Figure 10b).The acoustic amplitude and induced polarization signa-tures were altered as the nanocrystals formed, attachedto the migrating microbes, and eventually aggregated(Figure 10c and 10d). These results illustrate the poten-tial that geophysical methods have for elucidating im-portant biogeochemical processes over space and time,such as those that often accompany bioremediation ofmetal-contaminated aquifers.
4.3 Challenges and Future Directions inMonitoring Biogeochemical Processes
Advances in monitoring changes in biogeochemicalproperties have to date primarily been applied to envi-ronmental problems, where there is a significant interestin manipulating biogeochemical processes to render con-taminants less mobile or less toxic. However, these ap-proaches could also be used to assist in petroleum reser-voir investigations, such as to monitor reservoir stimu-lation or well-bore completion procedures. For example,a new chemical injection treatment has recently beendeveloped to increase sand consolidation and cementa-tion in the near vicinity of the borehole, thereby signif-icantly decreasing sand production (Kotlar et al. 2005),and injection of bacterial suspensions following waterflooding has been explored as a technique to enhance
58 R. Snieder, et. al.
Figure 10. (a) Example experimental column illustrating how measurements are collected down the length of the columnand the presence of a developed sulfide precipitation front associated with sulfate reduction. (b) TEM image illustrating themineralized encrustation on the experimental microbe due to the formation of sulfide precipitates (scale approximately 1 µm),Changes in (c) seismic amplitude and (d) induced polarization response associated with the initiation and aggregation of sulfideprecipitates. Modified from Williams et al. (2005).
oil recovery, which has been shown to increase the re-covery factor by 3-5% (Crecente et al. 2005). In thesecases, time-lapse 3D VSP surveys, where waves excitedby sources on the earth’s surface are recorded by sensorsin a borehole, could likely provide valuable informationabout the spatial distribution of the treated zones, andthe the quality and distribution of the cementation.
Quantitative geochemical characterization usinggeophysical methods poses several challenges. Perhapsgreatest among these are the challenges associated withscaling, non-uniqueness, and data fusion. Scale match-ing issues are significant because many of the biogeo-chemical properties or processes occur at microscopicscales that are much smaller than the smallest scale re-solved by the geophysical measurement. Non-uniquenessof the geophysical responses is a problem because geo-physical signatures often respond to hydrogeologicalas well as geochemical heterogeneity. Additionally, asa system is treated (for example, during environmen-tal remediation), multiple biogeochemical transforma-tions often occur simultaneously over the support scaleof the geophysial measurement (e.g., Hubbard et al.2006), and modified biogeochemical properties can inturn alter hydrological properties (such as pore clog-ging associated with gas or precipitate development),thereby further modifying the geophysical response. To-gether, these complex and coupled transformations hin-der the ability to uniquely interpret system transforma-tions given a particular geophysical response. Under-standing the full capacity of geophysical methods forcharacterization geochemical properties and processes is
Data d
True model m
mEstimated model
Decisions
Other knowledge
Forward problem
Estimation problem
Appraisal problem
+uncertainty
Figure 11. Different elements in creating an interface be-tween geophysical measurements and decision-making.
expected to improve through increased laboratory andfield experimental efforts, development of rock physicsrelationships and estimation approaches, and throughcomparisons of geophysically obtained geochemical pa-rameter estimates with numerical modeling predictionsof geochemical transformations.
5 DISCUSSION AND FUTURECHALLENGES
Although much progress has been made in non-invasivemonitoring, there are several open research questions.Some of these research questions are related to techni-cal aspects of a specific monitoring techniques. Otherresearch questions are common to many different as-

Non-invasive geophysical monitoring techniques 59
pects of non-invasive monitoring. We introduce theseover-riding research questions using Figure 11.
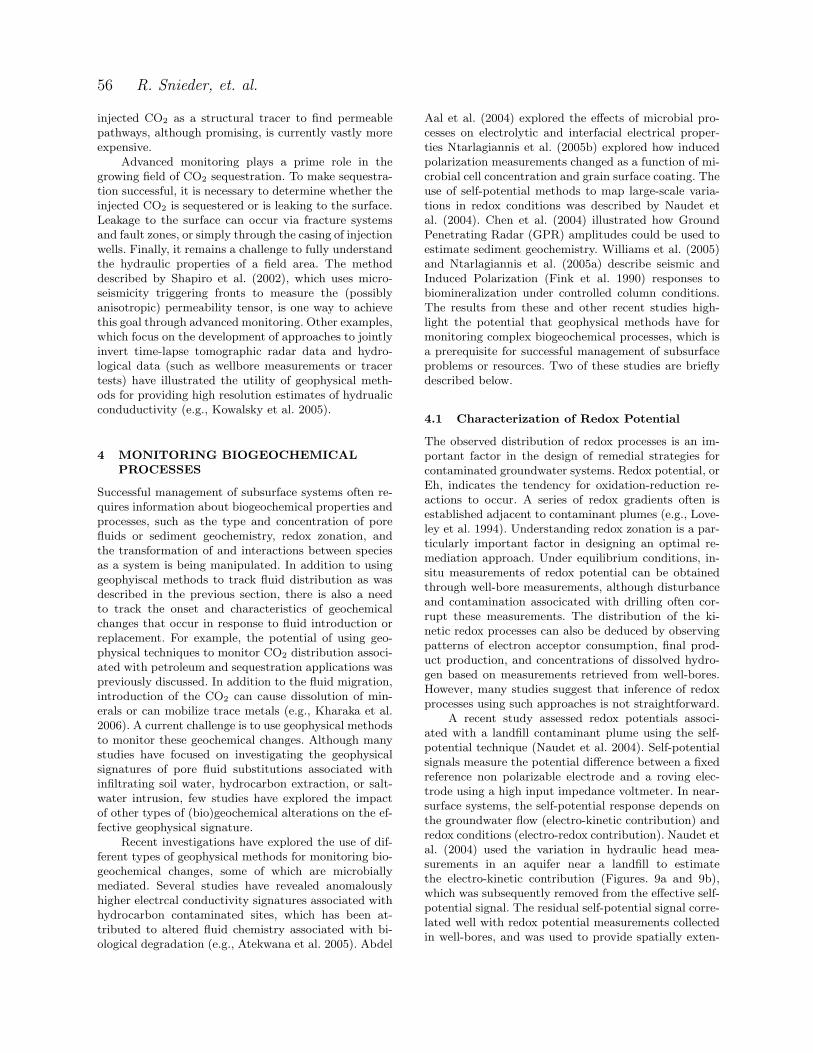
In a physical experiment data are collected. Thesedata are determined by the true earth model throughthe physics of the forward problem (geomechanical, hy-drological, biogeochemical). From the data one can es-timate an earth model, or in the case of monitoring,changes in the the earth model. Because the data arelimited, contaminated with noise, and often sampled atdisparate scales, these model estimates differ from thetrue model. Quantifying these differences and associateduncertianty is the appraisal problem. In practical im-plementations of monitoring techniques, measuring thechanges in geophysical attributes or even estimating thechange in subsurface properties using the geophysicaldata is not sufficient. Instead, these data must be inte-grated with other information to ascertain the impactthat the estimated changes have on how a system shouldbe managed or treated to solve problems of scientific,economic, or other societal relevance.
Figure 11 illustrates several research challenges inoptimally using non-invasive monitoring. The forwardproblem, that gives the data for a given model often issometimes well-known, as in the case of InSAR wherethe change in the phase of the radar waves is connectedby well-known physics to the deformation of the earth’ssurface. In other applications, the forward problem isnot well known. Examples include the relation betweencompaction and seismic velocity (section 2.2, or betweenvarious geophysical attributes and biogeochemical prop-erties (section 4),
Data collection is changing because of new devel-opents of instrumention and the capability to handle in-creasingly larger continuous data streams. Cheap micro-instrumentation, such as smart dust (Kahn et al. 2000)as well as Micro Electro Mechanical Systems, or MEMS(Gibson et al. 2005) make it possible to carry out mea-surements at an unprecedented scale. This has led tothe concept of the instrumented oilfield (Tura and Cam-bois 2001). Research challenges in this area include thetransmission of information of large amounts of sub-surface instruments to the surface, and handling thedata streams of large networks of sensors that operatecontinuously.
The estimation of uncertainty is a long-standingproblem in model estimation, and the same holds formonitoring techniques. For linear inverse problem, theassessment of uncertainty is well-developed (e.g., Taran-tola 1987, Parker 1994, Aster et al. 2004). The ap-plication to current large-scale estimation problem isstill problematic (e.g., how does one visualize a corre-lation matrix for 106 parameters?). For nonlinear esti-mation problems, there is no general theory to estimatethe uncertainty (Snieder 1998). In this case, numericaltechniques are presently the only available tool (e.g.,Mosegaard and Tarantola 1995, Sambridge 1998, Sam-
bridge et al. 2006), but the computational cost for manyproblems is prohibitive.
In many practical problems, different kinds of dataare collected. Combining these disparate data streams isa challenge. Data fusion, where different data are com-bined, and data assimilation, where new data are usedto update existing models for the subsurface, still arechallenging issues when it concerns the implementationin practical monitoring problems.
As indicated in figure 11, decisions are often basedon the outcome of monitoring experiments and otherknowledge. The integration of these different pieces ofinformation is often achieved by the expertise of thedecision-makers and their advisers. There is a lack oftechniques to integrate the a-priori knowledge of theproblem effectively in the mathematical formulation,and numerical implementation, of the estimation prob-lem. For example, model parameterization and estima-tion of uncertainty are often more driven by mathe-matical and/or numerical considerations, than by thegeological reality of the subsurface. Geologically realis-tic information is often difficult to glean from expertsdue to standard, human cognitive biases (Baddeley etal. 2004), and real-world knowledge is often difficult toparameterize. Nevertheless, it is critical that such infor-mation is introduced correctly as it directly affects notonly model estimates but their associated uncertainties.Consequently, research into methods to include reliableinformation in monitoring-type problems has begun ina variety of fields (e.g., Thore et al. 2002, Wood andCurtis, 2004).
The interface with the decision-makes is often notoptimal. The outcome of the monitoring experiment asa change in the model parameters plus its uncertainty,is often not in the form that is useful for the decision-maker. Knopman (2006) described the importance ofscientists engaging with decision-makers during the re-search stage, rather than first focusing on understand-ing or predicting processes and subsequently inform-ing decision makers after completion of the research.He suggests that with early inclusion, scientific experi-ments and decision-making tools can be designed thatoptimally guide the choices about the level of complex-ity that is needed to guide decisions about large en-vironmental problems, such as climate change, nuclearwaste storage, or sustainable water management. An-other problem in using monitoring techniques effectivelyis the gap in the time-scale with which the decision-maker needs results, and the time-scale on which a mon-itoring experiment can be carried out. In this contextit is also important that monitoring techniques can becarried out economically, because this allows the moni-toring to be carried out more frequently.
Much progress has been made in non-invasivegeophysical monitoring of the subsurface, but as shownhere, there are numerous open research questions. Re-solving these research questions is crucial for optimally

60 R. Snieder, et. al.
exploiting our technological capabilities for monitoringthe subsurface.
Acknowledgments: We thank Ken Larner andRaymond Jeanloz for their comments. This workresulted from the workshop “Advanced non-invasivemonitoring techniques” that was financially supportedby the office of Basic Energy Science of the Departmentof Energy. We are grateful for their financial support,and by the support and advice of David Lesmes, NickWoodward, and Sophia Kitts.
Note: This paper has been submitted to the AnnualReview of Earth and Planetary Sciences.
REFERENCES
G.Z. Abdel Aal, E. Atekwana, Slater L.D., and E.A.Atckwana. Effects of microbial processes on elec-trolytic and interfacial electrical properties of unconsol-idated sediments. Geophys. Res. Lett., 31:L12505, doi:10.1029/2004GL020030, 2004.
D. Alumbaugh, R.P. Chang, L. Paprocki, J. Brainard, R.J.Glass, and C.A. Rautman. Estimating moisture contentsin the vadose zone using cross-borehole ground penetrat-ing radar: a study of accuracy and repeatability. WaterResources Res., page 1309, 2002.
R. N. Anderson, P. Flemings, S. Losh, J. Austin, andR. Woodhams. Gulf of Mexico growth fault drilled, seenas oil, gas migration pathway. Oil & Gas Journal, 92:97–103, 1994.
R. N. Anderson, W. He, M. A. Hobart, C. R. Wilkinson, andH. R. Roice. Active fluid flow in the Eugene Island area,offshore Louisiana. The Leading Edge, 10:12–17, 1991.
R. Aster, B. Borchers, and C.H. Thurber. Parameter Estima-tion and Inverse Problems. Academic Press, San Diego,2004.
E.A. Atekwana, E. Atekwana, F.D. Legall, and R.V. Krish-namurthy. Biodegredation and mineral weathering con-trols on bulk electrical conductivity in a shallow hydro-carbon contaminated aquifer. J. of Contaminant Hydrol-ogy, 80:149–167, 2005.
M. Baddeley, A. Curtis, and R. Wood. An introduction toprior information derived from probabilistic judgements:elicitation of knowledge, cognitive bias and herding. InWood R. and A. Curtis, editors, Geological Prior Infor-mation, number 239 in Geol. Soc. Lond. Special Publi-cation, pages 15–27. 2004.
A. Bakulin and R. Calvert. Virtual source: new method forimaging and 4D below complex overburden. Expandedabstracts of the 2004 SEG-meeting, pages 2477–2480,2004.
R. Bamler and P. Hartl. Synthetic aperture radar interfer-ometry. Inverse Problems, 14:R1–R54, 1998.
G.W. Bawden, W. Thatcher, R.S. Stein, K.W. Hudnut, andG. Peltzer. Tectonic contraction across Los Angeles af-ter removal of groundwater pumping effects. Nature,412:812–815, 2001.
R. D. Benson and T. L. Davis. CO2 Sequestration in a De-pleted Oil Reservoir - West Pearl Queen Field. In 67th
EAGE Conference and Exhibition, page P137, 2005.
A. Binley, G. Cassiani, R. Middleton, and P. Winship. Va-dose zone model parameterisation using cross-boreholeradar and resistivity imaging. J. Hydrology, 267:147–159,2002.
J. Brown, F. Klopping, D. van Westrum, T. Niebauer, R. Bil-son, J. Brady, J. Ferguson, T. Chen, and J. Siebert. Pre-liminary absolute gravity survey results from water injec-tion monitoring program at Prudhoe Bay. In 72nd Ann.Internat. Mtg., Society of Exploration Geophysicists, Ex-panded Abstracts, pages 791–793, 2002.
R. Burgmann, P.A. Rosen, and E.J. Fielding. Synthetic aper-ture radar interferometry to measure earth’s surface to-pography and its deformation. volume 28 of Ann. Rev.Earth Planet. Sci., pages 169–209. 2000.
R. Calvert. Insights and methods of 4D reservoir monitoringand characterization, volume 8 of Distinguished instruc-tor series. Society of Exploration Geohysicists, Tulsa,OK, 2005.
R.W. Calvert, A. Bakulin, and T.C. Joners. Virtual sources,a new way to remove overburden problems. Expandedabstracts of the 2004 EAEG-meeting, 2004.
M. Campillo and A. Paul. Long-range correlations in thediffuse seismic coda. Science, 299:547–549, 2003.
S. Chand and Minshull. T. A. Seismic constraints on theeffects of gas hydrate on sediment physical properties andfluid flow: a review. Geofluids, 3:275–289, 2003.
J. Chen, S. Hubbard, Y. Rubin, E. Murray, C. andRoden,and E. Majer. Geochemical characterization using geo-physical data and Markov Chain Monte Carlo methods:A case study at the South Oyste bacterial transport sitein Virginia. Water Resources Res., pages W12412, doi:1029/2003WR002883, 2004.
A. Cogbill, F. Ferguson, and E. Keating. Use of AbsoluteGravity Measurements to Monitor Groundwater in theEspanola Basin, New Mexico. In EOS Trans., AGU,86(18), Jt. Assem. Suppl., Abstract GP23A–03, 2005.
S. Crampin. The new geophysics: Shear-wave splitting pro-vides a window into the crack-critical rock mass. TheLeading Edge, 22:536–549, 2003.
S. Crampin, S. Chastin, and Y. Guo. Shear-wave splitting ina critical crust: III - preliminary report of multi-variablemeasurements in active tectonics. J. of Appl. Geophys.,54:265–277, 2003.
C. Crecente, K. Rasmussen, O. Torsaeter, A. Strom, andE. Kowalewski. An experimental study of microbial im-proved oil recovery by using Rhodococcus SP. 094. Soc.of Core Analysts, pages CA2005–45, 2005.
A. Derode, E. Larose, M. Campillo, and M. Fink. How to es-timate the Green’s function for a heterogeneous mediumbetween two passive sensors? Application to acousticwaves. Appl. Phys. Lett., 83:3054–3056, 2003a.
A. Derode, E. Larose, M. Tanter, J. de Rosny, A. Tourin,M. Campillo, and M. Fink. Recovering the Green’sfunction from far-field correlations in an open scatteringmedium. J. Acoust. Soc. Am., 113:2973–2976, 2003b.
T.H. Dixon. An introduction to the Global Positioning Sys-tem and some geological applications. Rev. of Geophys.,29:249–276, 1991.
P. Enge and P. Misra. Special issue on global positioningsystem. Proc. IEEE, 87:3–15, 1999.
J.B. Fink, B.K. Sternberg, E.O. McAlister, W.G. Wieduwilt,and S.H. Ward, editors. Induced polarization, applica-tions and case histories. Number 4 in Investigations in

Non-invasive geophysical monitoring techniques 61
geophysics. Society of Exploration Geophysicitst, Tulsa,OK, 1990.
A.M. Freed. Earthquake triggering by static, dynamic, andpostseismic stress transfer. In R. Jeanloz, A.L. Albee,and K.C. Burke, editors, Ann. Rev. Earth Planet. Sci.,volume 33, pages 335–367. 2005.
G.K. Furnes, O.B. Kvamme, and O. Nygaard. Tidal responseon the reservoir pressure at the Gulfaks oil field. PureAppl. Geoph., 135:425–445, 1991.
M. Furumoto, Y. Ichimori, N. Hayashi, and Y. Hiramutsu.Seismic wave velocity changes and stress build-up in thecrust of the Kanto-Tokai region. Geophys. Res. Lett.,28:3737–3730, 2001.
F. Gassmann. Uber die Elastizitat poroser Medien.Vierteljahrsschrift der Naturforschenden Gesellschaft inZurich, 96:1–23, 1951.
J. Gibson, R. Burnett, S. Ronen, and H. Watt. MEMS sen-sors: Some issues for consideration. The Leading Edge,24:786–790, 2005.
J. Gomberg and P. Johnson. Dynamic triggering of earth-quakes. Nature, 437:830, 2005.
A. Gret, R. Snieder, R.C. Aster, and P.R. Kyle. Moni-toring rapid temporal changes in a volcano with codawave interferometry. Geophys. Res. Lett., 32:L06304,10.1029/2004GL021143, 2005.
A. Gret, R. Snieder, and J. Scales. Time-lapse monitoringof rock properties with coda wave interferometry. J.Geophys. Res., 111:B03305, doi:10.1029/2004JB003354,2006a.
A. Gret, R. Snieder and U. Ozbay. Monitoring in-situ stresschanges in a mining environment with coda wave inter-ferometry. Geophys. J. Int., in press, 2006b.
M. Haney, R. Snieder, J.P. Ampuero, and R. Hofmann. Spec-tral element modelling of fault-plane reflections arisingfrom fluid presssure distributions. submitted to Geophys.J. Int., 2006.
M. Haney, R. Snieder, J. Sheiman, and S. Losh. A movingfluid pulse in a fault zone. Nature, 437:46, 2005.
P. Hatchell and S. Bourne. Rocks under stain: Strain-inducedtime-lapse time shifts are observed for depleting reser-voirs. The Leading Edge, 24:1222–1225, 2005.
D. P. Hill, J. O. Langbein, and S. Prejean. Relations be-tween seismicity and deformation during unrest in LongValley Caldera, California, from 1995 through 1999. J.of Volcanology and Geothermal Res., 127:175–193, 2003.
E. C. D. Hooper. Fluid migration along growth faults incompacting sediments. J. of Pet. Geology, 14:161–180,1991.
S. Hubbard, J. Chen, Y. Fang, K. Williams, S. Mukhopad-hyay, E. Sonnenthal, K. McFarlane, N. Linde, andT. Scheibe. Improved parameterization of hydrologicalmodels and reduction of geophysical monitoring data am-biguity through joint use of geophysical and numericalmodeling methods. In Extended proceedings, CWMRXVI-Computational Methods in Water Resources, 2006.
S.S. Hubbard, J.E. Peterson Jr, E.L. Majer, P.T. Zawislanski,K.H. Williams, J. Roberts, and F. Wobber. Estimationof permeable pathways and water content using tomo-graphic radar data. The Leading Edge, 16:1623–1630,1997.
J.M. Kahn, R.H. Katz, and K.S.J. Pister. Emerging chal-lenges: Mobile networking for ”smart dust”. J. of Comm.and Networks, 2:188–196, 2000.
Y.K. Kharaka, R.D. Cole, S.D. Hovorka, W.D. Gunter, K.G.Knauss, and B.M. Freifeld. Gas-water-rock interactionsin Frio formation following co2 injection: Implications forthe storage of greenhouse gases in sedimentary basins.Geology, 34(7):577–580, doi:10.1130/G22357.1, 2006.
D.S. Knopman. Success matters: recasting the relation-ship among geophysical, biological, and behavioral scien-tists to support decision making on major environmen-tal challenges. Water Resources Res., 42:W03S09, doi:10.1029/2005WR004333, 2006.
H.K. Kotlar, F. Haavind, M. Springer, S.S. Bekkelund, andO. Torsaeter. A new concept of chemical sand consol-idation: From idea and laboratory qualification to fieldapplication. SPE, page 95723, 2005.
M.B. Kowalsky, S. Finsterle, J. Peterson, S. Hubbard, Y. Ru-bin, E. Majer, A. Ward, and G. Gee. Estimation of field-scale soil hydraulic and dielectric parameters throughjoint inversion of GPR and hydrological data. WaterResources Res., 41:doi: 10.1029/2005WR004237, 2005.
M.B. Kowalsky, S. Finsterle, and Y. Rubin. Estimating flowparameter distributions using ground-penetrating radarand hydrological measurements during transient flow inthe vadose zone. Adv. in Water Res., 27(6):583–599,2004.
M. Landrø and L. K. Stronen. 4d study of fluid effects onseismic data in the Gullfaks Field, North Sea. Geofluids,3:233–244, 2003.
E. Larose, G. Montaldo, A. Derode, and M. Campillo. Pas-sive imaging of localized reflectors and interfaces in openmedia. Appl. Phys. Lett., 88:104103, 2006.
W. Lauterborn, T. Kurz, and M. Wiesenfeldt. Coherent Op-tics, Fundamentals and Applications. Springer-Verlag,Berlin, 1995.
O.I. Lobkis and R.L. Weaver. On the emergence of theGreen’s function in the correlations of a diffuse field. J.Acoust. Soc. Am., 110:3011–3017, 2001.
J.N.S. Long and R.C. Ewing. Yucca Mountain: Earth-scienceissues at a geological repository for high-level nuclearwaste. In R. Jeanloz, editor, Ann. Rev. Earth Planet.Sci., volume 32, pages 363–401, 2004.
S. Losh, L. Eglinton, M. Schoell, and J. Wood. Vertical andlateral fluid flow related to a large growth fault. AAPGBulletin, 83:244–276, 1999.
D.R. Loveley, F.H. Chapelle, and J.C. Woodward. Use ofdissolved H2 concentrations to determine distribution ofmicrobially catalyzed redox reactions in anoxic ground-water. Env. Science and Techn., 21:1210–1255, 1994.
Miyazawa M. and J. Mori. Evidence suggesting fluid flowbeneath Japan due to periodic seismic triggering fromthe 2004 Sumatra-Andaman earthquake. Geophys. Res.Lett., 33:L05303, doi:10.1029/2005GL025087, 2006.
A. Malcolm, J. Scales, and B.A. van Tiggelen. Extractingthe Green’s function from diffuse, equipartitioned waves.Phys. Rev. E, 70:015601, 2004.
D. Massonnet and K.L. Feigl. Radar interferometry and itsapplication to changes in the earth’s surface. Rev. Geo-phys., 36:441–500, 1998.
K. Mehta, R. Snieder, and V. Graizer. Extraction of near-surface properties for lossy layered medium using propa-gator matrix. Submitted to Geophys. J. Int., 2006.
S. A. Miller, C. Collettini, L. Chiaraluce, M. Cocco,M. Barchi, and B. J. P. Kaus. Aftershocks driven by ahigh-pressure CO2 source at depth. Nature, 427:724–727,

62 R. Snieder, et. al.
2004.S. E. Minkoff, C. M. Stone, S. Bryant, and M. Peszynska.
Coupled geomechanics and flow simulation for time-lapseseismic modeling. Geophysics, 69:200–211, 2004.
J. R. Moore, S. D. Glaser, H. F. Morrison, and G. M. Hover-sten. The streaming potential of liquid carbon dioxide inBerea sandstone. Geophys. Res. Lett., 31:L17610, 2004.
K. Mosegaard and A. Tarantola. Monte Carlo sampling of so-lutions to inverse problems. J. Geophys. Res., 100:12431–12447, 1995.
V. Naudet, A. Revil, E. Rizzo, J.-Y. Bottero, andP. Begassat. Groundwater redox conditions and conduc-tivity in a contaminant plume from geoelectrical inves-tigations, hydrology and earth system. Hydrology andEarth System Sciences, 8(1):8–22, 2004.
T. Nishimura, S. Tanaka, H. Yamamoto, T. Sano, M. Sato,H. Nakahara, N. Uchida, S. Hori, and H. Sato. Tempo-ral changes in seismic velocity of the crust around Iwatevolcano, Japan as inferred from analyses of repeated ac-tive seismic experiment data from 1998 to 2003. EarthPlanets Space, 57:491–505, 2005.
T. Nishimura, N. Uchida, H. Sato, M. Ohtake, S. Tanaka, andH. Hamaguchi. Temporal changes of the crustal structureassociated with the M6.1 earthquake on September 3,1998, and the volcanic activity of Mount Iwate, Japan.Geophys. Res. Lett., 27:269–272, 2000.
D. Ntarlagiannis, K.H. Williams, Slater L., and S. Hub-bard. The low frequency response to microbial inducedsulfide precipitation. J. Geophys. Res., 110:G02009,10.1029/2005JG000024, 2005.
J. E. Nyquist and C. E. Corry. Self-potential: The uglyduckling of environmental geophysics. The Leading Edge,21:446–451, 2002.
Office of Biological and Environmental Research of the De-partment of Energy. Bioremediation of metals and ra-dionuclides. 2003.
D. Pandolfi, C.J. Bean, and G. Saccorotti. Coda wave in-terferometric detection of seismic velocity changes asso-ciated with the 1999 M=3.6 event at Mt. Vesuvius. Geo-phys. Res. Lett., 33:L06306, doi:10.1029/2005GL025355,2006.
R.L. Parker. Geophysical Inverse Theory. Princeton Univ.Press, Princeton NJ, 1994.
G. Poupinet, W.L. Ellsworth, and J. Frechet. Monitoring ve-locity variations in the crust using earthquake doublets:an application to the Calaveras Fault, California. J. Geo-phys. Res., 89:5719–5731, 1984.
S. R. Pride, J. M. Harris, D. L. Johnson, A. Mateeva, K. T.Nihei, R. L. Nowack, J. W. Rector, H. Spetzler, R. Wu,T. Yamomoto, J. G. Berryman, and M. Fehler. Perme-ability dependence of seismic amplitudes. The LeadingEdge, 22:518–525, 2003.
S. R. Pride and F. D. Morgan. Electrokinetic dissipationinduced by seismic waves. Geophysics, 56:914–925, 1991.
A. Ratdomopurbo and G. Poupinet. Monitoring a temporalchange of seismic velocity in a volcano: Application tothe 1992 eruption of Mt. Merapi (Indonesia). Geophys.Res. Lett., 22:775–778, 1995.
A. Revil and L. M. Cathles. Fluid transport by solitary wavesalong growing faults: A field example from the SouthEugene Island Basin, Gulf of Mexico. Earth and Planet.Sci. Lett., 202:321–335, 2002.
A. Revil and N. Linde. Chemico-electromechanical coupling
in microporous media. J. of Colloid and Interface Sci.,in press, 2006.
J. R. Rice. Fault stress states, pore pressure distributions,and the weakness of the San Andreas fault. In B. Evansand T.-F. Wong, editors, Fault Mechanics and TransportProperties of Rocks, pages 475–503. Academic Press, SanDiego, 1992.
P.M. Roberts, W. Scott Phillips, and M.C. Fehler. Develop-ment of the active doublet method for measuring smallvelocity and attenuation changes in solids. J. Acoust.Soc. Am., 91:3291–3302, 1992.
E. Roeloffs, M. Sneed, D. L. Galloway, M. L. Sorey, C. D.Farrar, J. F. Howie, and J. Hughs. Water level changesinduced by local and distant earthquakes at Long ValleyCaldera, California. J. of Volc. and Geoth. Res., 127:175–193, 2003.
P. Roux, K.G. Sabra, P. Gerstoft, and W.A. Kuperman.P-waves from cross correlation of seismic noise. Geo-phys. Res. Lett., 32:L19303, doi: 10.1029/2005GL023803,2005a.
P. Roux, K.G. Sabra, W.A. Kuperman, and A. Roux. Am-bient noise cross correlation in free space: Theoreticalapproach. J. Acoust. Soc. Am., 117:79–84, 2005b.
K.G. Sabra, P. Gerstoft, P. Roux, W.A. Kuperman, and M.C.Fehler. Extracting time-domain Green’s function esti-mates from ambient seismic noise. Geophys. Res. Lett.,32:L03310, doi: 10.1029/2004GL021862, 2005.
M. Sambridge. Exploring mutidimensional landsapes with-out a map. Inverse Problems, 14:427–440, 1998.
M. Sambridge, C. Beghein, F. Simons, and R. Snieder. Howdo we understand and visualize uncertainty? The LeadingEdge, 25:542–546, 2006.
C. M. Sayers, M. J. Woodward, and R. C. Bartman. Seismicpore pressure prediction using reflection tomography and4-C seismic data. The Leading Edge, 21:188–192, 2002.
C. Sens-Schonfelder and U. Wegler. Passive image interfer-ometry snd seasonal variations at Merapi volcano, In-donesia. Submitted to Geophys. Res. Lett., 2006.
N.M. Shapiro, M. Campillo, L. Stehly, and M.H. Ritzwoller.High-resolution surface-wave tomography from ambientseismic noise. Science, 307:1615–1618, 2005.
S. A. Shapiro, E. Rothert, V. Rath, and J. Rindschwentner.Characterization of fluid transport properties of reser-voirs using induced seismicity. Geophysics, 67:212–220,2002.
P. G. Silver, F. Niu, T. M. Daley, and E. L. Majer. Devel-oping a Methodology for Measuring Stress Transients atSeismogenic Depths. In EOS Trans., AGU, 85(47), FallMeet. Suppl., pages Abstract S13E–01, 2004.
D. Smit and C.M. Sayers. Can tidal-driven pressure changesreveal reservoir properties for use in 4D monitoring?World oil, pages 37–43, March 2005.
R. Snieder. The role of nonlinearity in inverse problems.Inverse Problems, 14:387–404, 1998.
R. Snieder. Coda wave interferometry. In 2004 McGraw-Hillyearbook of science & technology, pages 54–56. McGraw-Hill, New York, 2004a.
R. Snieder. Extracting the Green’s function from the cor-relation of coda waves: A derivation based on stationaryphase. Phys. Rev. E, 69:046610, 2004b.
R. Snieder. Retrieving the Green’s function of the diffusionequation from the response to a random forcing. Submit-ted to Phys. Rev. E, 2006a.

Non-invasive geophysical monitoring techniques 63
R. Snieder. The theory of coda wave interferometry. Pureand Appl. Geophys., 163:455–473, 2006b.
R. Snieder and E. Safak. Extracting the building responseusing seismic interferometry; theory and application tothe Millikan library in Pasadena, California. Bull. Seis-mol. Soc. Am., 96:586–598, 2006.
R. Snieder, A. Gret, H. Douma, and J. Scales. Coda wave in-terferometry for estimating nonlinear behavior in seismicvelocity. Science, 295:2253–2255, 2002.
R. Snieder, J. Sheiman, and R. Calvert. Equivalence of thevirtual source method and wavefield deconvolution inseismic interferometry. Phys. Rev. E, 73:066620, 2006a.
R. Snieder, K. Wapenaar, and K. Larner. Spurious multiplesin seismic interferometry of primaries. Geophysics, inpress, 2006b.
R.P.W. Stancliffe and W.A. van der Kooij. The use ofsatellite-based radar interferometry to monitor produc-tion activity at the Cold Lake heavy oil field, Alberta,Canada. AAPG Bulletin, 85:781–793, 2001.
B. Suski, A. Revil, A. Boleve, K. Titov, P. Konosavsky,M. Voltz, C. Dages, and O. Huttel. Monitoring of anInfiltration Experiment Using the Self-Potential Method.submitted to Water Resources Res., 2006.
A. Tarantola. Inverse Problem Theory. Elsevier, Amster-dam, 1987.
N. Teanby, J.-M. Kendall, R. H. Jones, and O. Barkved.Stress-induced temporal variations in seismic anisotropyobserved in microseismic data. Geophys. J. Int., 156:459–466, 2004.
P. Thore, A. Shtuka, M. Lecour, T. Ait-Ettajer, and R. Cog-not. Structural uncertainties: Determination, manage-ment, and applications. Geophysics, 67:840–852, 2002.
K. Titov, A. Revil, P. Konosavsky, S. Straface, and S. Troisi.Numerical modelling of self-potential signals associatedwith a pumping test experiment. Geophys. J. Int.,162:641–650, 2005.
I. Tsvankin. Seismic signatures and analysis of reflectiondata in anisotropic media. Pergamon, 2001.
A. Tura, T. Barker, P. Cattermole, C. Collins, J. Davis,P. Hatchell, K. Koster, P. Schutjens, and P. Wills. Moni-toring primary depletion reservoirs using amplitudes andtime shifts from high-repeat seismic surveys. The LeadingEdge, 24:1214–1221, 2005.
A. Tura and G. Cambois. Instrumented oil fields, an in-troduction to this special section. The Leading Edge,20(6):613, 2001.
D.J. van Manen, J.O.A. Robertson, and A. Curtis. Modellingof wave propagation in inhomogeneous media. Phys. Rev.Lett., 94:164301, 2005.
H.F. Wang. Theory of linear poroelasticity, with applica-tions to geomechanics and hydrogeology. Princeton Univ.Press, Princeton, 2000.
K. Wapenaar. Retrieving the elastodynamic Green’s functionof an arbitrary inhomogeneous medium by cross correla-tion. Phys. Rev. Lett., 93:254301, 2004.
K. Wapenaar, J. Fokkema, and R. Snieder. Retrieving theGreen’s function by cross-correlation: a comparison ofapproaches. J. Acoust. Soc. Am., 118:2783–2786, 2005.
R.L. Weaver and O.I. Lobkis. Ultrasonics without a source:Thermal fluctuation correlations and MHz frequencies.Phys. Rev. Lett., 87:134301, 2001.
R.L. Weaver and O.I. Lobkis. Diffuse fields in open systemsand the emergence of the Green’s function. J. Acoust.
Soc. Am., 116:2731–2734, 2004.U. Wegler, B.-G. Luhr, R. Snieder, and A. Ratdomop-
urbo. Increase of shear velocity before the 1998 erup-tion of Merapi volcano Indonesia. Geophys. Res. Lett.,33:L09303, doi:10.1029/2006GL025928, 2006.
U. Wegler and C. Sens-Schonfelder. Fault zone monitoringwith passive image interferometry. Submitted to Geophys.J. Int., 2006.
J. K. Whelan, L. Eglinton, M. C. Kennicutt, II, and Y. Qian.Short-time-scale (year) variations of petroleum fluidsfrom the U. S. Gulf Coast. Geochim. Cosmochim. Acta,65:3529–3555, 2001.
K.H. Williams, D. Ntarlagiannis, L.D. Slater, A. Dohnalkova,Hubbard S.S., and J.F. Banfield. Geophysical imagingof stimulated microbial biomineralization. Environ. Sci.Technol., 39(19):7592–7600; DOI: 10.1021/es0504035,2005.
R. Wood and A. Curtis. Geological prior information, and itsapplications to solving geoscientific problems. In WoodR. and A. Curtis, editors, Geological Prior Information,number 239 in Geol. Soc. Lond. Special Publication,pages 1–14. 2004.
K. Yamamura, O. Sano, H. Utada, Y. Takei, S. Nakao,and Y. Fukao. Long-term observations of in situseismic velocity and attenuation. J. Geophys. Res.,108(B6):doi:10.1029/2002JB002005, 2003.
M. D. Zoback and J. Townend. How faulting keeps the cruststrong. Geology, 28:399–402, 2000.

64 R. Snieder, et. al.