advanced mri of articular cartilage - open access · pdf fileadvanced mri of articular...
TRANSCRIPT
541ISSN 1755-519110.2217/IIM.11.43 © 2011 Future Medicine Ltd Imaging Med. (2011) 3(5), 541–555
Advanced MRI of articular cartilage
review
Multiple imaging modalities have been used to study articular cartilage in health and disease. Conventional radiography provides an indirect measure of articular cartilage through evaluation of joint space but is unable to detect early chondral damage. Arthrography combined with either x‑ray or CT is used to assess cartilage surface contour [1], but does not provide soft tissue information. While the US FDA still considers radiographic evaluation of joint space narrowing to be the gold standard modality for evaluating osteoarthritis (OA), many recent studies including the Osteoarthritis Initiative (OAI) utilize MRI for cartilage examination, as it provides exquisite contrast and enables both morphologic and physiologic imaging techniques.
MRI provides a highly sensitive means to evaluate musculoskeletal tissues, such as articular cartilage [2,3]. In light of the high incidence of OA [4–8], the rise of total joint arthroplasty procedures [9], and the increase in knee studies in patients worldwide [10], MRI has become a premier technique for imaging of cartilage and adjacent bone due to its superb tissue contrast [11–15].
An ideal MRI study for cartilage would evaluate thickness, volume, and integrity, provide details about cartilage and underlying bone morphology, and assess cartilage biochemistry and physiology including collagen and proteoglycan matrices. To date, multiple techniques must be used to obtain such a comprehensive picture. Major techniques in morphological imaging of cartilage include spin echo (SE) and gradient‑recalled echo (GRE) sequences, fast SE (FSE), and 3D SE and GRE. Physiological imaging techniques such as transverse
relaxation time (T2) mapping, delayed gadolinium
enhanced MRI of cartilage (dGEMRIC), T1rho
mapping, sodium MRI, and diffusion‑weighted imaging (DWI), provide insight into the molecular composition of cartilage.
Advances in MR software & hardwareMRI manipulates image contrast to highlight different tissue types. Common contrast methods include 2D or multislice longitudinal relaxation (T
1)‑weighted, proton density, and T
2‑weighted
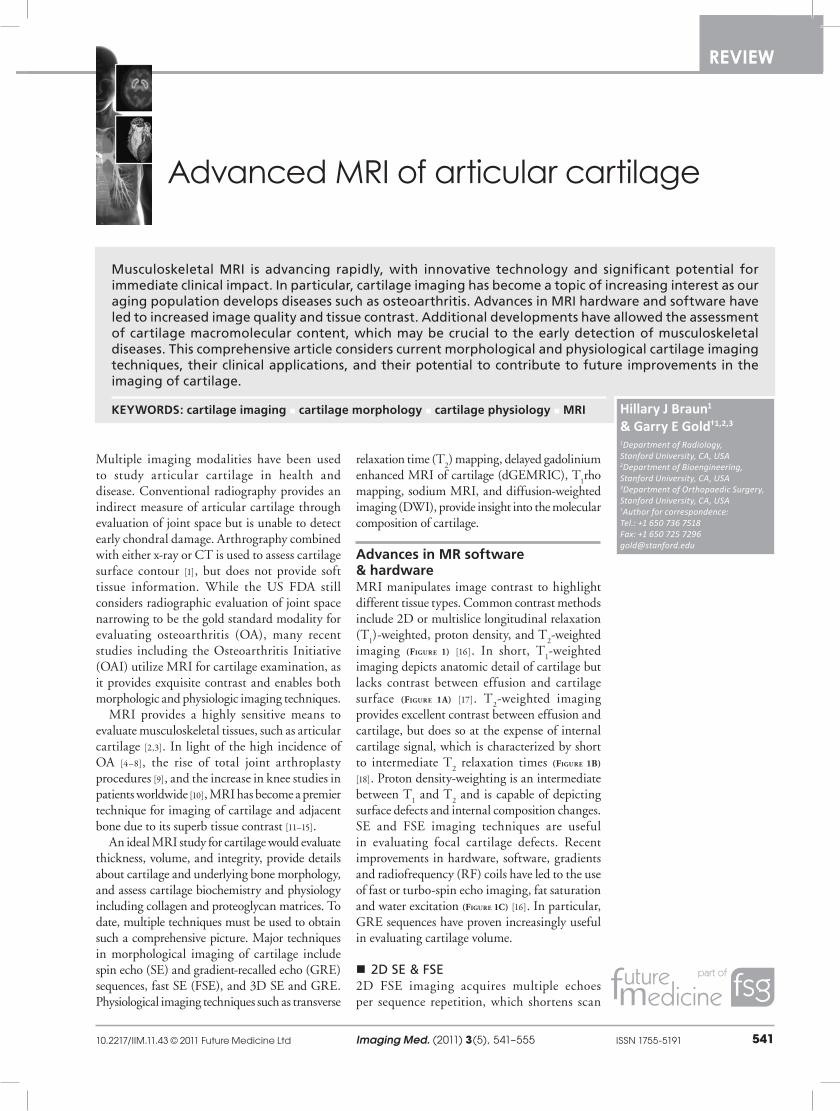
imaging (Figure 1) [16]. In short, T1‑weighted
imaging depicts anatomic detail of cartilage but lacks contrast between effusion and cartilage surface (Figure 1A) [17]. T
2‑weighted imaging
provides excellent contrast between effusion and cartilage, but does so at the expense of internal cartilage signal, which is characterized by short to intermediate T
2 relaxation times (Figure 1B)
[18]. Proton density‑weighting is an intermediate between T
1 and T
2 and is capable of depicting
surface defects and internal composition changes. SE and FSE imaging techniques are useful in evaluating focal cartilage defects. Recent improvements in hardware, software, gradients and radiofrequency (RF) coils have led to the use of fast or turbo‑spin echo imaging, fat saturation and water excitation (Figure 1C) [16]. In particular, GRE sequences have proven increasingly useful in evaluating cartilage volume.
�� 2D�SE�&�FSE2D FSE imaging acquires multiple echoes per sequence repetition, which shortens scan
Musculoskeletal�MRI� is� advancing� rapidly,�with� innovative� technology�and� significant�potential� for�immediate�clinical�impact.�In�particular,�cartilage�imaging�has�become�a�topic�of�increasing�interest�as�our�aging�population�develops�diseases�such�as�osteoarthritis.�Advances�in�MRI�hardware�and�software�have�led�to�increased�image�quality�and�tissue�contrast.�Additional�developments�have�allowed�the�assessment�of�cartilage�macromolecular�content,�which�may�be�crucial�to�the�early�detection�of�musculoskeletal�diseases.�This�comprehensive�article�considers�current�morphological�and�physiological�cartilage�imaging�techniques,�their�clinical�applications,�and�their�potential�to�contribute�to�future�improvements�in�the�imaging�of�cartilage.
keywoRds: cartilage imaging � cartilage morphology � cartilage physiology � MRI Hillary J Braun1 & Garry E Gold†1,2,3
1Department of Radiology, Stanford University, CA, USA 2Department of Bioengineering, Stanford University, CA, USA 3Department of Orthopaedic Surgery, Stanford University, CA, USA †Author for correspondence: Tel.: +1 650 736 7518 Fax: +1 650 725 7296 [email protected]
Imaging Med. (2011) 3(5)542 future science group
review Braun & Gold
time and provides excellent signal‑to‑noise ratio (SNR) and exquisite tissue contrast. Accordingly, FSE is part of the International Cartilage Repair Society’s cartilage evaluation protocol [19]. Despite its advantages, 2D FSE requires image acquisition in multiple planes and is susceptible to section gaps, partial volume effects and anisotropic voxels.
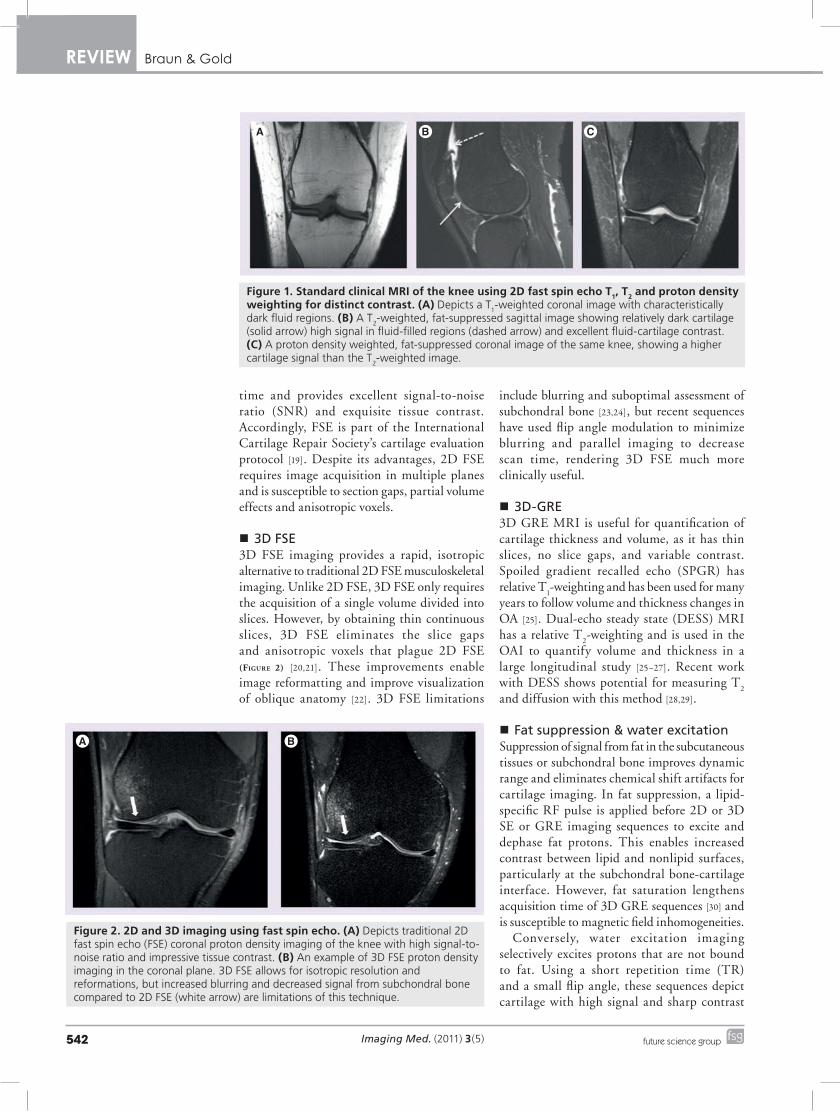
�� 3D�FSE3D FSE imaging provides a rapid, isotropic alternative to traditional 2D FSE musculoskeletal imaging. Unlike 2D FSE, 3D FSE only requires the acquisition of a single volume divided into slices. However, by obtaining thin continuous slices, 3D FSE eliminates the slice gaps and anisotropic voxels that plague 2D FSE (Figure 2) [20,21]. These improvements enable image reformatting and improve visualization of oblique anatomy [22]. 3D FSE limitations
include blurring and suboptimal assessment of subchondral bone [23,24], but recent sequences have used flip angle modulation to minimize blurring and parallel imaging to decrease scan time, rendering 3D FSE much more clinically useful.
�� 3D-GRE3D GRE MRI is useful for quantification of cartilage thickness and volume, as it has thin slices, no slice gaps, and variable contrast. Spoiled gradient recalled echo (SPGR) has relative T
1‑weighting and has been used for many
years to follow volume and thickness changes in OA [25]. Dual‑echo steady state (DESS) MRI has a relative T
2‑weighting and is used in the
OAI to quantify volume and thickness in a large longitudinal study [25–27]. Recent work with DESS shows potential for measuring T
2
and diffusion with this method [28,29].
�� Fat�suppression�&�water�excitationSuppression of signal from fat in the subcutaneous tissues or subchondral bone improves dynamic range and eliminates chemical shift artifacts for cartilage imaging. In fat suppression, a lipid‑specific RF pulse is applied before 2D or 3D SE or GRE imaging sequences to excite and dephase fat protons. This enables increased contrast between lipid and nonlipid surfaces, particularly at the subchondral bone‑cartilage interface. However, fat saturation lengthens acquisition time of 3D GRE sequences [30] and is susceptible to magnetic field inhomogeneities.
Conversely, water excitation imaging selectively excites protons that are not bound to fat. Using a short repetition time (TR) and a small flip angle, these sequences depict cartilage with high signal and sharp contrast
Figure 1. standard clinical MRI of the knee using 2d fast spin echo T1, T2 and proton density weighting for distinct contrast. (A) Depicts a T
1-weighted coronal image with characteristically
dark fluid regions. (B) A T2-weighted, fat-suppressed sagittal image showing relatively dark cartilage
(solid arrow) high signal in fluid-filled regions (dashed arrow) and excellent fluid-cartilage contrast. (C) A proton density weighted, fat-suppressed coronal image of the same knee, showing a higher cartilage signal than the T
2-weighted image.
Figure 2. 2d and 3d imaging using fast spin echo. (A) Depicts traditional 2D fast spin echo (FSE) coronal proton density imaging of the knee with high signal-to-noise ratio and impressive tissue contrast. (B) An example of 3D FSE proton density imaging in the coronal plane. 3D FSE allows for isotropic resolution and reformations, but increased blurring and decreased signal from subchondral bone compared to 2D FSE (white arrow) are limitations of this technique.
www.futuremedicine.com 543future science group
Advanced MRI of articular cartilage review
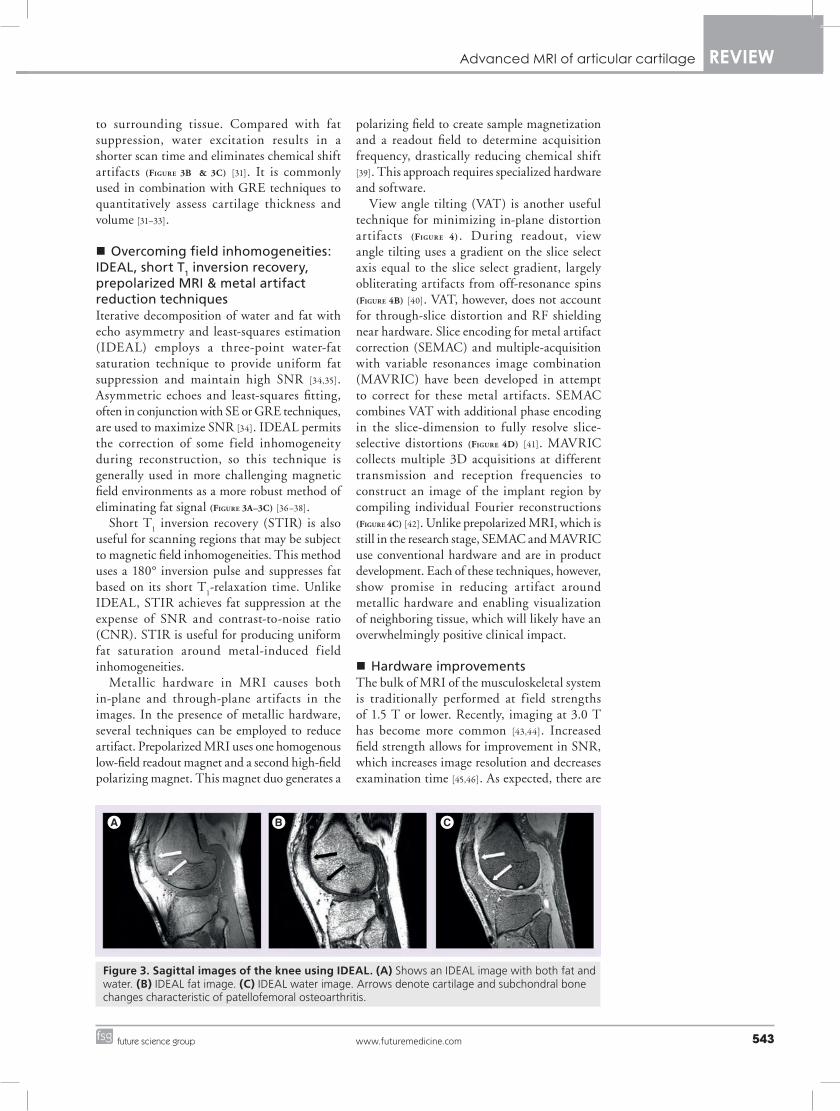
to surrounding tissue. Compared with fat suppression, water excitation results in a shorter scan time and eliminates chemical shift artifacts (Figure 3B & 3C) [31]. It is commonly used in combination with GRE techniques to quantitatively assess cartilage thickness and volume [31–33].
�� Overcoming�field�inhomogeneities:�IDEAL,�short�T1�inversion�recovery,�prepolarized�MRI�&�metal�artifact�reduction�techniquesIterative decomposition of water and fat with echo asymmetry and least‑squares estimation (IDEAL) employs a three‑point water‑fat saturation technique to provide uniform fat suppression and maintain high SNR [34,35]. Asymmetric echoes and least‑squares fitting, often in conjunction with SE or GRE techniques, are used to maximize SNR [34]. IDEAL permits the correction of some field inhomogeneity during reconstruction, so this technique is generally used in more challenging magnetic field environments as a more robust method of eliminating fat signal (Figure 3A–3C) [36–38].
Short T1 inversion recovery (STIR) is also
useful for scanning regions that may be subject to magnetic field inhomogeneities. This method uses a 180° inversion pulse and suppresses fat based on its short T
1‑relaxation time. Unlike
IDEAL, STIR achieves fat suppression at the expense of SNR and contrast‑to‑noise ratio (CNR). STIR is useful for producing uniform fat saturation around metal‑induced f ield inhomogeneities.
Metallic hardware in MRI causes both in‑plane and through‑plane artifacts in the images. In the presence of metallic hardware, several techniques can be employed to reduce artifact. Prepolarized MRI uses one homogenous low‑field readout magnet and a second high‑field polarizing magnet. This magnet duo generates a
polarizing field to create sample magnetization and a readout field to determine acquisition frequency, drastically reducing chemical shift [39]. This approach requires specialized hardware and software.
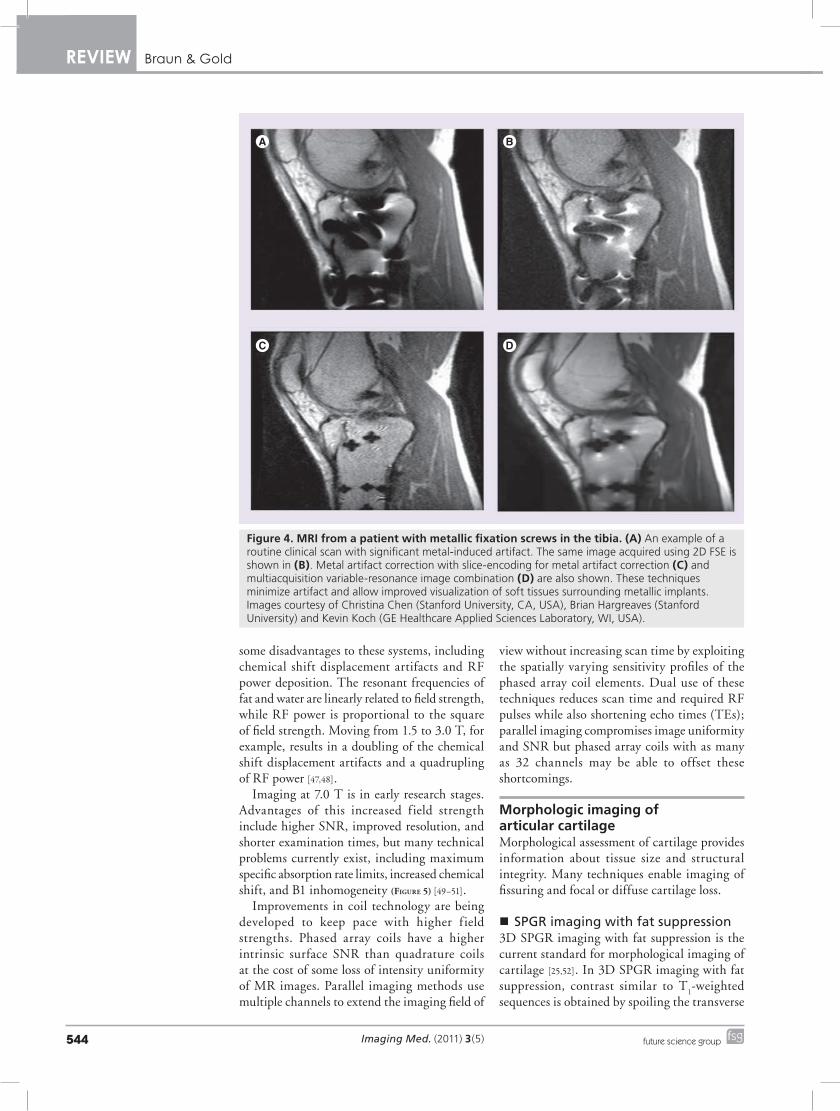
View angle tilting (VAT) is another useful technique for minimizing in‑plane distortion artifacts (Figur e 4). During readout, view angle tilting uses a gradient on the slice select axis equal to the slice select gradient, largely obliterating artifacts from off‑resonance spins (Figure 4B) [40]. VAT, however, does not account for through‑slice distortion and RF shielding near hardware. Slice encoding for metal artifact correction (SEMAC) and multiple‑acquisition with variable resonances image combination (MAVRIC) have been developed in attempt to correct for these metal artifacts. SEMAC combines VAT with additional phase encoding in the slice‑dimension to fully resolve slice‑selective distortions (Figure 4D) [41]. MAVRIC collects multiple 3D acquisitions at different transmission and reception frequencies to construct an image of the implant region by compiling individual Fourier reconstructions (Figure 4C) [42]. Unlike prepolarized MRI, which is still in the research stage, SEMAC and MAVRIC use conventional hardware and are in product development. Each of these techniques, however, show promise in reducing artifact around metallic hardware and enabling visualization of neighboring tissue, which will likely have an overwhelmingly positive clinical impact.
�� Hardware�improvementsThe bulk of MRI of the musculoskeletal system is traditionally performed at field strengths of 1.5 T or lower. Recently, imaging at 3.0 T has become more common [43,44]. Increased field strength allows for improvement in SNR, which increases image resolution and decreases examination time [45,46]. As expected, there are
Figure 3. sagittal images of the knee using IdeAL. (A) Shows an IDEAL image with both fat and water. (B) IDEAL fat image. (C) IDEAL water image. Arrows denote cartilage and subchondral bone changes characteristic of patellofemoral osteoarthritis.
Imaging Med. (2011) 3(5)544 future science group
review Braun & Gold
some disadvantages to these systems, including chemical shift displacement artifacts and RF power deposition. The resonant frequencies of fat and water are linearly related to field strength, while RF power is proportional to the square of field strength. Moving from 1.5 to 3.0 T, for example, results in a doubling of the chemical shift displacement artifacts and a quadrupling of RF power [47,48].
Imaging at 7.0 T is in early research stages. Advantages of this increased field strength include higher SNR, improved resolution, and shorter examination times, but many technical problems currently exist, including maximum specific absorption rate limits, increased chemical shift, and B1 inhomogeneity (Figure 5) [49–51].
Improvements in coil technology are being developed to keep pace with higher f ield strengths. Phased array coils have a higher intrinsic surface SNR than quadrature coils at the cost of some loss of intensity uniformity of MR images. Parallel imaging methods use multiple channels to extend the imaging field of
view without increasing scan time by exploiting the spatially varying sensitivity profiles of the phased array coil elements. Dual use of these techniques reduces scan time and required RF pulses while also shortening echo times (TEs); parallel imaging compromises image uniformity and SNR but phased array coils with as many as 32 channels may be able to offset these shortcomings.
Morphologic imaging of articular cartilageMorphological assessment of cartilage provides information about tissue size and structural integrity. Many techniques enable imaging of fissuring and focal or diffuse cartilage loss.
�� SPGR�imaging�with�fat�suppression3D SPGR imaging with fat suppression is the current standard for morphological imaging of cartilage [25,52]. In 3D SPGR imaging with fat suppression, contrast similar to T
1‑weighted
sequences is obtained by spoiling the transverse
Figure 4. MRI from a patient with metallic fixation screws in the tibia. (A) An example of a routine clinical scan with significant metal-induced artifact. The same image acquired using 2D FSE is shown in (B). Metal artifact correction with slice-encoding for metal artifact correction (C) and multiacquisition variable-resonance image combination (d) are also shown. These techniques minimize artifact and allow improved visualization of soft tissues surrounding metallic implants. Images courtesy of Christina Chen (Stanford University, CA, USA), Brian Hargreaves (Stanford University) and Kevin Koch (GE Healthcare Applied Sciences Laboratory, WI, USA).

www.futuremedicine.com 545future science group
Advanced MRI of articular cartilage review
steady state with semi‑random RF phase alterations. SPGR can acquire nearly isotropic voxels, producing excellent resolution images with high cartilage signal and low signal from adjacent joint fluid. Unfortunately, this technique requires lengthy acquisition times and does not show reliable differences in signal between cartilage and surrounding f luid. Combining SPGR and IDEAL sequences has been shown to improve SNR and acquisition times [53]. A variant of SPGR, fast low‑angle shot, also uses a random gradient to produce a phase shift and spoil the steady state. Fast low‑angle shot produces high cartilage signal and permits the acquisition of high‑spatial‑resolution images, but like traditional SPGR, it requires long acquisition times that render it vulnerable to motion and susceptibility artifacts.
�� Driven�equilibrium�Fourier�transform�Driven equilibrium Fourier transform (DEFT) imaging generates contrast by exploiting the T
2:T
1 ratio of tissues. DEFT returns
magnetization to the z‑axis with a 90° pulse
which results in enhanced signal in tissues with long T
1‑relaxation times. In cartilage imaging,
DEFT heightens synovial f luid signal and preserves cartilage signal, resulting in bright synovial fluid at a short TR, high cartilage SNR and improved imaging of full cartilage thickness [54]. The disadvantages of DEFT are increased artifact and inferior fat saturation when compared with T
2‑FSE imaging [54].
�� DESS3D DESS imaging acquires two or more gradient echoes, separating each pair of echoes with a refocusing pulse, and combines image data to obtain higher T
2* weighting. This technique
results in high signal intensity in both cartilage and synovial fluid, which enables morphological assessment of cartilage. Simultaneously, high signal in both tissues can wash out tissue contrast and obscure smaller defects. This can be remedied by increasing the flip angle, which increases the contrast between cartilage and synovial fluid and enables differentiation of subtle cartilage lesions [55]. 3D‑DESS has been validated for
Figure 5. Imaging differences at 3 and 7 T. (A & B) Show sagittal and axial images acquired at 7 T using a 28-channel coil. Markedly increased SNR is observed. (C & d) Representative of the same images acquired at 3 T. Increased field strength and improvements in coil technology allow for improved SNR and shorter scan times. SNR: Signal-to-noise ratio. Images courtesy of Ravinder Regatte (New York University, NY, USA).
50
20
40
60
80
100
120
140
160
180
20
40
60
80
100
120
140
160
180
50
100
100
150
150
200
200250
250
(78,
53)
50
100
150
200
250
(129
, 7)
SNR at location (7, 9) = 4.5
50 100 150 200 250
SNR at location (7, 9) = 4.5
50
20
40
60
80
100
120
140
160
180
20
40
60
80
100
120
140
160
180
50
100
100
150
150
200
200250
250
(119
, 1)
50
100
150
200
250
(127
, 3)
SNR at location (128, 128) = 23.850 100 150 200 250SNR at location (9, 13) = 2.5
Imaging Med. (2011) 3(5)546 future science group
review Braun & Gold
clinical use [26,32] and affords advantages, such as high SNR, high cartilage‑to‑fluid contrast, near‑isotropic sections and reduced scan time when compared with 3D‑SPGR.
�� Steady-state�free�precession�Steady‑state free precession (SSFP) MRI techniques are hallmarked by excellent synovial fluid‑cartilage contrast. Balanced SSFP (bSSFP) is otherwise known as true fast imaging with steady‑state precession, fast imaging employing steady‑state acquisition and balanced fast field echo imaging. In all of these techniques, fluid is depicted with increased signal, while cartilage signal intensity is preserved, resulting in excellent contrast and diagnostic utility. All of these techniques are vulnerable to off‑resonance artifacts secondary to field inhomogeneity, a susceptibility that has been recently combated by advances in coil technology enabling shorter TEs.
Several derivatives of SSFP exist. Fluctuating equilibrium MR (FEMR) is particularly useful for morphological assessment of cartilage of the knee [56]. FEMR generates contrast based on the ratio of T
1:T
2 in tissues. In the case of the knee,
FEMR produces bright synovial fluid signal while maintaining high signal in cartilage and high SNR. Like bSSFP, FEMR is also susceptible to off‑resonance artifacts. This vulnerability can be corrected with shimming technology or by combining FEMR sequences with fat‑water separating techniques like IDEAL [35]. Another SSFP derivative, vastly undersampled isotropic projection (VIPR) imaging, combines bSSFP imaging with 3D radial k‑space acquisition using isotropic spatial resolution and T
2/
T1‑weighted contrast [23]. In VIPR, two radial
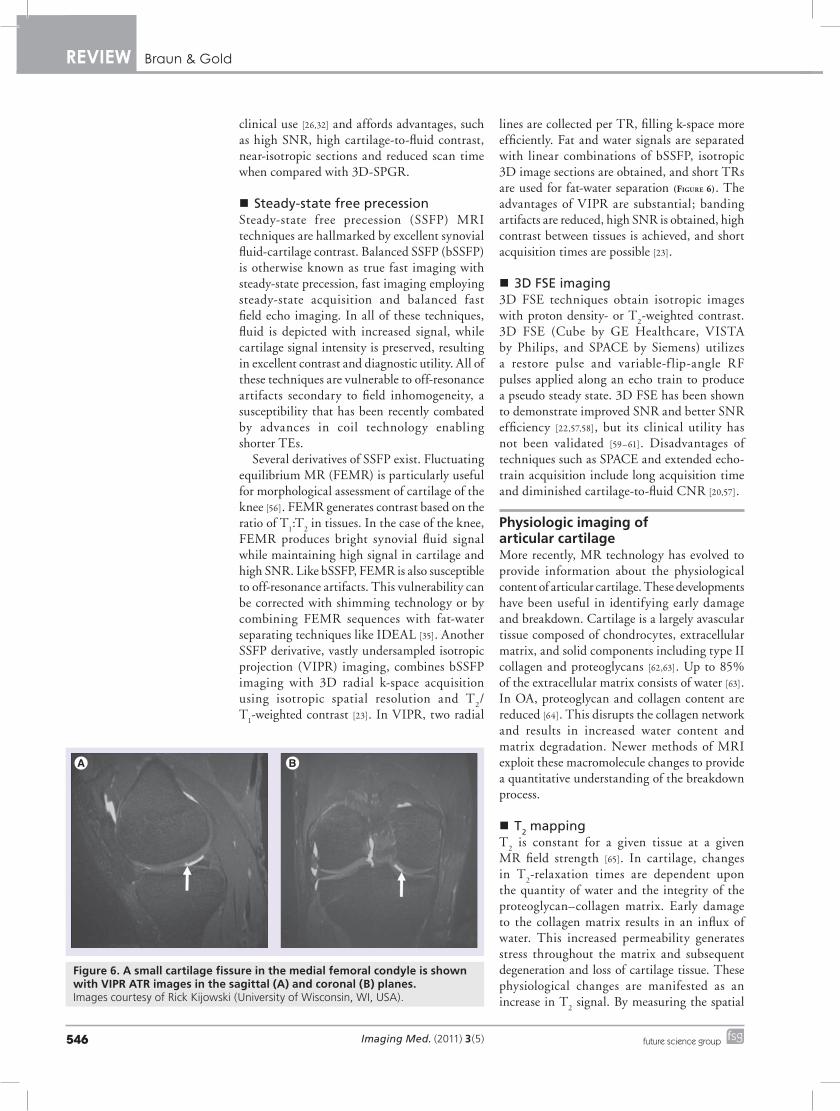
lines are collected per TR, filling k‑space more efficiently. Fat and water signals are separated with linear combinations of bSSFP, isotropic 3D image sections are obtained, and short TRs are used for fat‑water separation (Figure 6). The advantages of VIPR are substantial; banding artifacts are reduced, high SNR is obtained, high contrast between tissues is achieved, and short acquisition times are possible [23].
�� 3D�FSE�imaging�3D FSE techniques obtain isotropic images with proton density‑ or T
2‑weighted contrast.
3D FSE (Cube by GE Healthcare, VISTA by Philips, and SPACE by Siemens) utilizes a restore pulse and variable‑f lip‑angle RF pulses applied along an echo train to produce a pseudo steady state. 3D FSE has been shown to demonstrate improved SNR and better SNR efficiency [22,57,58], but its clinical utility has not been validated [59–61]. Disadvantages of techniques such as SPACE and extended echo‑train acquisition include long acquisition time and diminished cartilage‑to‑fluid CNR [20,57].
Physiologic imaging of articular cartilageMore recently, MR technology has evolved to provide information about the physiological content of articular cartilage. These developments have been useful in identifying early damage and breakdown. Cartilage is a largely avascular tissue composed of chondrocytes, extracellular matrix, and solid components including type II collagen and proteoglycans [62,63]. Up to 85% of the extracellular matrix consists of water [63]. In OA, proteoglycan and collagen content are reduced [64]. This disrupts the collagen network and results in increased water content and matrix degradation. Newer methods of MRI exploit these macromolecule changes to provide a quantitative understanding of the breakdown process.
�� T2�mapping�T
2 is constant for a given tissue at a given
MR field strength [65]. In cartilage, changes in T
2‑relaxation times are dependent upon
the quantity of water and the integrity of the proteoglycan–collagen matrix. Early damage to the collagen matrix results in an influx of water. This increased permeability generates stress throughout the matrix and subsequent degeneration and loss of cartilage tissue. These physiological changes are manifested as an increase in T
2 signal. By measuring the spatial
Figure 6. A small cartilage fissure in the medial femoral condyle is shown with VIPR ATR images in the sagittal (A) and coronal (B) planes.Images courtesy of Rick Kijowski (University of Wisconsin, WI, USA).
www.futuremedicine.com 547future science group
Advanced MRI of articular cartilage review
distribution of T2‑relaxation times throughout
articular cartilage, areas of increased or decreased water content (which generally correlate with cartilage damage) can be identified. In these studies, technique is particularly important [66,67]. Generally, a multiecho SE is used to shorten scan time and signal levels are fitted to one or more decaying exponentials, depending upon whether more than one T
2 distribution is anticipated in
the tissue [67]. However, imperfect refocusing pulses may skew T
2 measurements, resulting in
regional variation. Following regional assessment, an image of T
2‑relaxation times is generated
with either a color or grayscale map (Figure 7). T
2 mapping software is currently commercially
available, allowing for simple implementation on most imaging systems.
Several in vivo studies have shown T2‑relaxation
times to correlate with collagen matrix and water changes [66,68–70]. As collagen degradation occurs, water molecule content and motion increases. This results in high signal intensity on T
2‑weighted images [71,72] and elevated
T2‑relaxation times [73,74]. These results have
been mimicked in animal models, where strong correlations between T
2 elevation and histological
indicators of cartilage degeneration have been observed [75–82].
�� T1rho�mappingT
1rho mapping is sensitive to the macromolecule
content of tissue and therefore very effective in visualizing early changes in OA [83,84]. In T
1rho,
magnetization is tipped into the transverse plane and ‘spin‑locked’ by a constant RF field. When proteoglycan depletion occurs in the earliest phases of OA, the physiochemical interactions in the macromolecule environment are disrupted and T
1rho allows measurement
of the interaction between motion‑restricted water molecules and their extracellular environment [85]. Elevated T
1rho relaxation
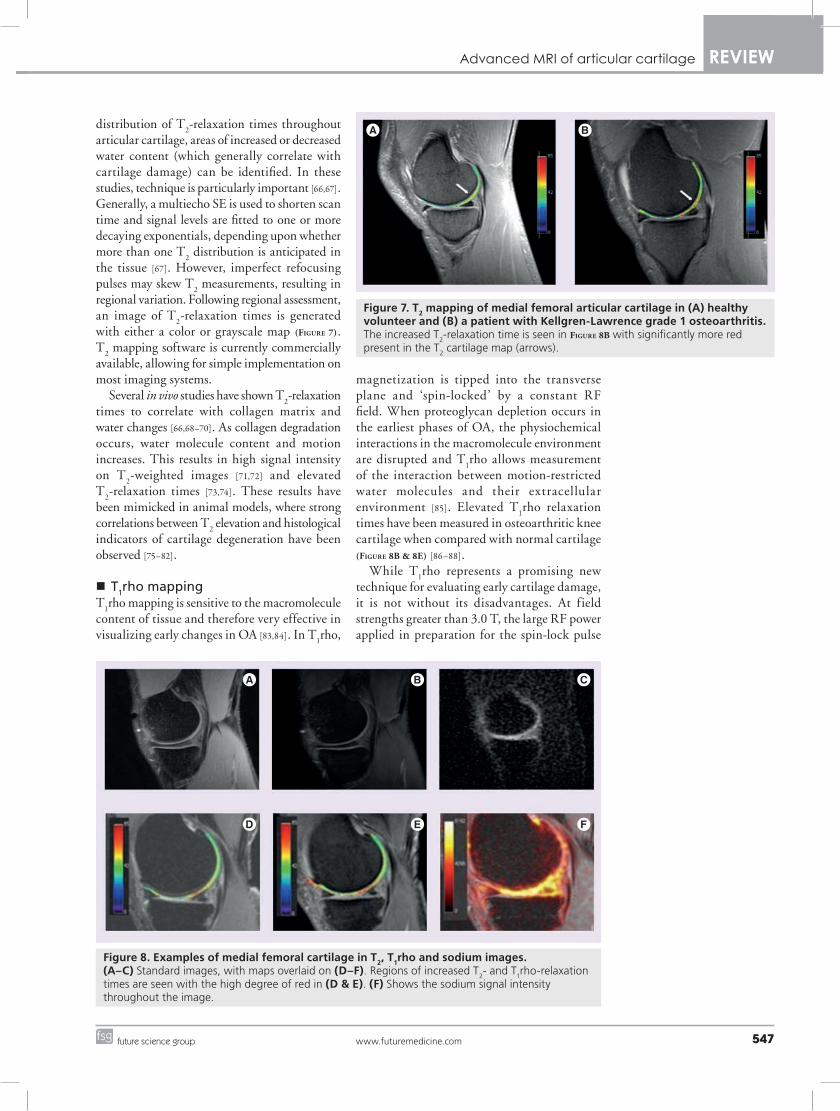
times have been measured in osteoarthritic knee cartilage when compared with normal cartilage (Figure 8B & 8e) [86–88].
While T1rho represents a promising new
technique for evaluating early cartilage damage, it is not without its disadvantages. At field strengths greater than 3.0 T, the large RF power applied in preparation for the spin‑lock pulse
Figure 8. examples of medial femoral cartilage in T2, T1rho and sodium images. (A–C) Standard images, with maps overlaid on (d–F). Regions of increased T
2- and T
1rho-relaxation
times are seen with the high degree of red in (d & e). (F) Shows the sodium signal intensity throughout the image.
Figure 7. T2 mapping of medial femoral articular cartilage in (A) healthy volunteer and (B) a patient with kellgren-Lawrence grade 1 osteoarthritis. The increased T
2-relaxation time is seen in Figure 8B with significantly more red
present in the T2 cartilage map (arrows).
Imaging Med. (2011) 3(5)548 future science group
review Braun & Gold
may result in heating of tissues and problems with specific absorption rate [16]. Lowering the spin lock frequency can lower the RF power deposition, but reduce the effectiveness of the spin lock [89]. There is some controversy as to the specificity of T
1rho for proteoglycan
in vivo [90], but it remains a promising technique for detection of early cartilage matrix change.
�� Sodium�imagingSodium MRI exploits the concept of negative fixed charged density within the extracellular matrix of cartilage. Like 1H, 23Na has an odd number of protons or neutrons and therefore possesses a net nuclear spin. Unlike 1H, the Larmor frequency of 23Na is much lower (11.262 vs 42.575 MHz/T) [91] as is the concentration in the human body (320 µM). T
2‑relaxation times
are also lower, and range from 2 to 10 ms for 23Na [92]. Despite these differences, 23Na imaging is a promising technique for cartilage evaluation. In healthy cartilage, high concentrations of positively charged 23Na are associated with the negatively charged glycosaminoglycan (GAG) side chains, which contain a plethora of negatively charged carboxyl and sulfate groups. When proteoglycan depletion occurs in cartilage damage, GAGs are damaged and sodium signals decline [93–95]. As such, 23Na imaging represents a potentially useful means of differentiating early stage degenerated cartilage and normal tissue [93].
Sodium imaging is quite promising, but limitations exist. Spatial variation of sodium occurs in healthy cartilage [93] and the relatively low concentration of 23Na in vivo results in an
overall lower signal intensity. Consequently, either increased field strengths or increased imaging time is necessary to generate adequate SNR [96]. In addition, special transmit and receive coils are required to accommodate the lower concentration, lower resonant frequency and shorter T
2‑relaxation times of 23Na
(Figure 8C & 8F).
�� dGEMRICDelayed gadolinium enhanced MRI of cartilage, like sodium imaging, also relies on the principle of fixed charge density. Ions in the extracellular fluid are distributed in relation to the concentration of negatively charged GAGs, which is a reflection of the quantity of proteoglycan content in cartilage. Accordingly, extracellular fluid has a lower concentration of anions and higher concentration of cations than are present in blood or synovial fluid. The difference between anion and cation concentrations in extracellular fluid is equal to the fixed charge density [97]. Gd(DTPA)2‑ is a clinically approved contrast agent that can be used to indirectly measure fixed charge density. Following intravenous injection of Gd(DTPA)2‑, the patient typically exercises the joint for 10 min to ensure adequate distribution and penetration of cartilage. Depending on location, images are obtained between 30 and 180 min following injection [98] to allow for cartilage penetration; hence the term ‘delayed’ [99]. The negatively charged Gd(DTPA)2‑ molecules accumulate in high concentration in areas lacking in GAG and in low concentrations in GAG‑rich regions. Subsequent imaging using 3D SPGR pulse sequences with variable flip angles [100], bSSFP, or T
1 generates a GAG distribution. This T
1
measurement is referred to as the dGEMRIC index; regions with low T
1 signal correspond to
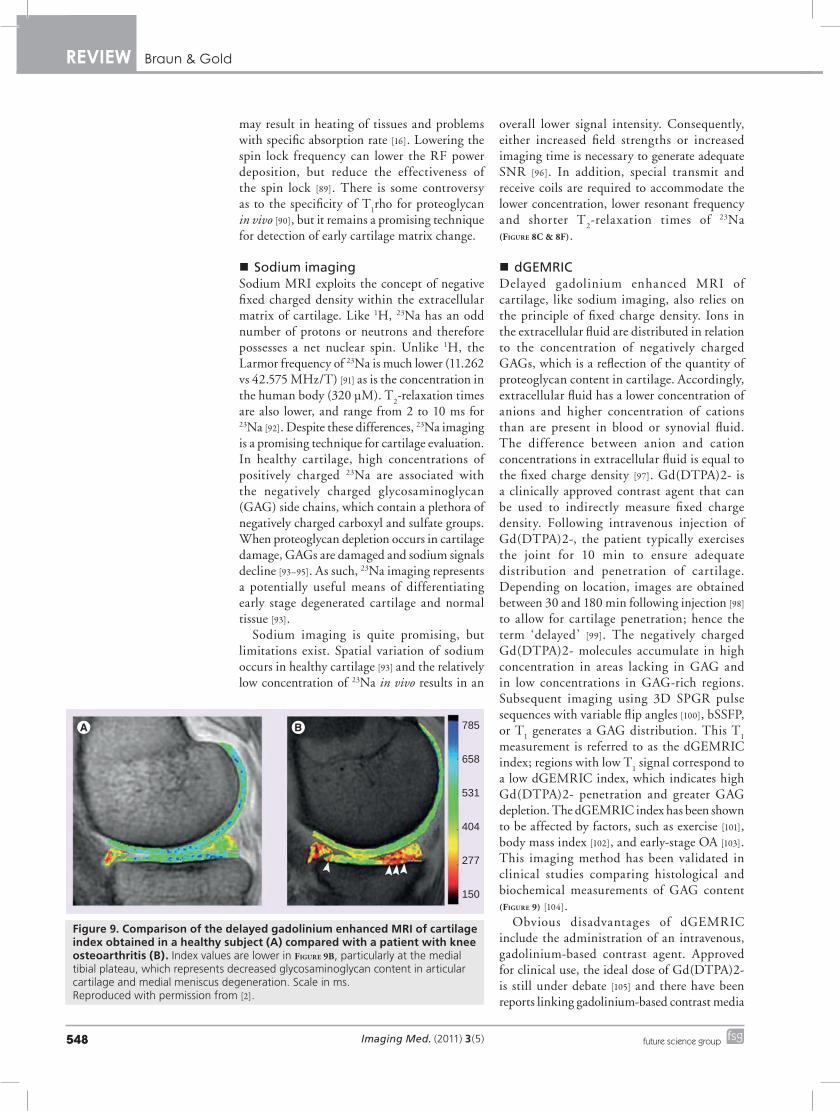
a low dGEMRIC index, which indicates high Gd(DTPA)2‑ penetration and greater GAG depletion. The dGEMRIC index has been shown to be affected by factors, such as exercise [101], body mass index [102], and early‑stage OA [103]. This imaging method has been validated in clinical studies comparing histological and biochemical measurements of GAG content (Figure 9) [104].
Obvious disadvantages of dGEMRIC include the administration of an intravenous, gadolinium‑based contrast agent. Approved for clinical use, the ideal dose of Gd(DTPA)2‑ is still under debate [105] and there have been reports linking gadolinium‑based contrast media
785
658
531
404
277
150
Figure 9. Comparison of the delayed gadolinium enhanced MRI of cartilage index obtained in a healthy subject (A) compared with a patient with knee osteoarthritis (B). Index values are lower in Figure 9B, particularly at the medial tibial plateau, which represents decreased glycosaminoglycan content in articular cartilage and medial meniscus degeneration. Scale in ms. Reproduced with permission from [2].
www.futuremedicine.com 549future science group
Advanced MRI of articular cartilage review
to nephrogenic systemic fibrosis in patients with moderate to severe renal impairment [106–111]. In addition, both the delay between injection and image acquisition are an inconvenience to the patient and may necessitate correction for motion artifacts [16]. Finally, dGEMRIC relies on the underlying assumption that cartilage is fully penetrated by the contrast agent, which may vary with the conversion of T
1 to Gd(DTPA)2‑
concentration and tissue cellularity in young or engineered tissue samples. In spite of these limitations, dGEMRIC offers a valuable and validated approach in investigating cartilage health and pathology.
�� Ultrashort�TE�imagingUltrashort TE (uTE) imaging takes advantage of the range of T
2 values characteristic of
different human tissues. Conventional MR scanners generally use TEs greater than 10 ms to obtain T
2‑weighted imaging. This protocol
is appropriate for tissues having long T2 values,
such as the liver or white matter. Musculoskeletal tissues such as ligaments, tendons, menisci, cortical bone and periostium have significantly shorter T
2 values, ranging from hundreds of
microseconds to tens of milliseconds [13,112]. Consequently, this rapid decay results in little or no signal when traditional T
2‑weighted imaging
is performed. uTE imaging sequences use TEs that are 20–50‑times shorter than conventional T
2 sequences [12,113,114]. The advantages here are
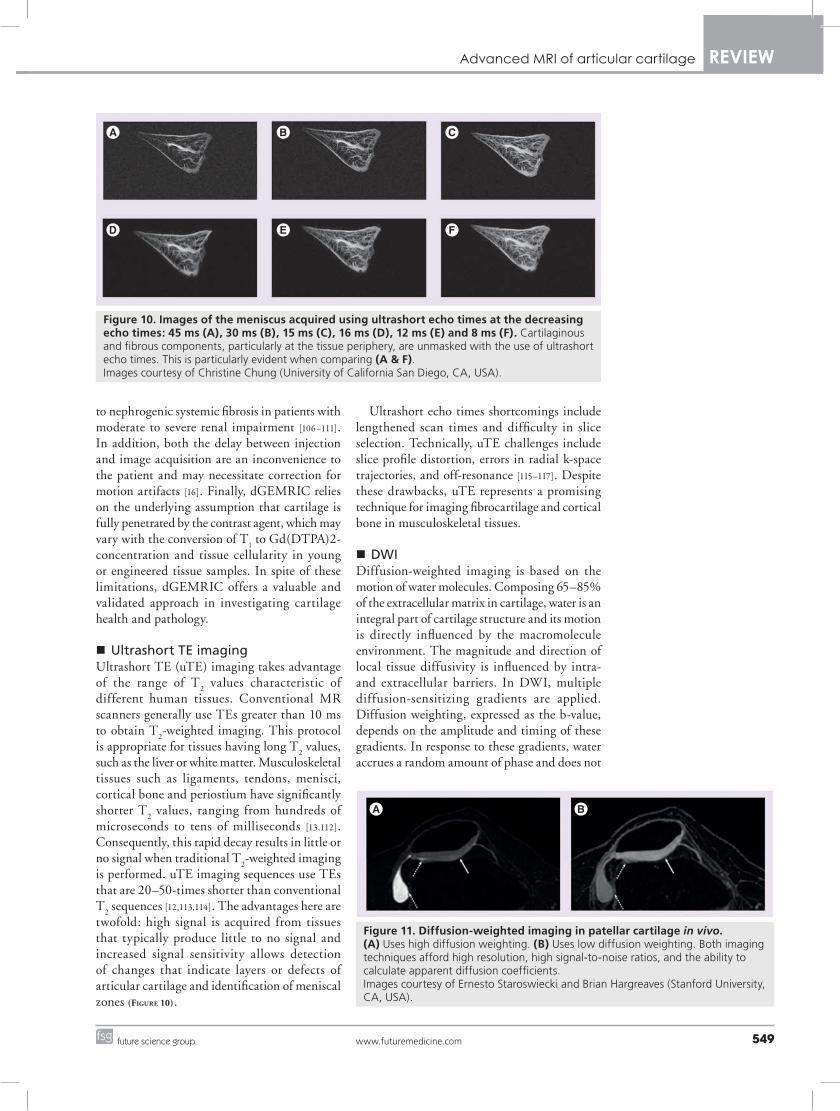
twofold: high signal is acquired from tissues that typically produce little to no signal and increased signal sensitivity allows detection of changes that indicate layers or defects of articular cartilage and identification of meniscal zones (Figure 10).
Ultrashort echo times shortcomings include lengthened scan times and difficulty in slice selection. Technically, uTE challenges include slice profile distortion, errors in radial k‑space trajectories, and off‑resonance [115–117]. Despite these drawbacks, uTE represents a promising technique for imaging fibrocartilage and cortical bone in musculoskeletal tissues.
�� DWIDiffusion‑weighted imaging is based on the motion of water molecules. Composing 65–85% of the extracellular matrix in cartilage, water is an integral part of cartilage structure and its motion is directly influenced by the macromolecule environment. The magnitude and direction of local tissue diffusivity is influenced by intra‑ and extracellular barriers. In DWI, multiple diffusion‑sensitizing gradients are applied. Diffusion weighting, expressed as the b‑value, depends on the amplitude and timing of these gradients. In response to these gradients, water accrues a random amount of phase and does not
Figure 10. Images of the meniscus acquired using ultrashort echo times at the decreasing echo times: 45 ms (A), 30 ms (B), 15 ms (C), 16 ms (d), 12 ms (e) and 8 ms (F). Cartilaginous and fibrous components, particularly at the tissue periphery, are unmasked with the use of ultrashort echo times. This is particularly evident when comparing (A & F).Images courtesy of Christine Chung (University of California San Diego, CA, USA).
Figure 11. diffusion-weighted imaging in patellar cartilage in vivo. (A) Uses high diffusion weighting. (B) Uses low diffusion weighting. Both imaging techniques afford high resolution, high signal-to-noise ratios, and the ability to calculate apparent diffusion coefficients. Images courtesy of Ernesto Staroswiecki and Brian Hargreaves (Stanford University, CA, USA).
Imaging Med. (2011) 3(5)550 future science group
review Braun & Gold
refocus, resulting in signal loss in tissues where diffusion occurs [99]. In healthy cartilage, the apparent diffusion coefficient (ADC) is low and diffusion times are long because intact cartilage components restrict the motion of water. When the matrix is disrupted, however, water molecules move more freely, increasing the ADC of cartilage [118]. Following acquisition, an ADC map is generated. It is important to note that the term ‘apparent’ is used because these values reflect only the bulk water and do not account for the water protons restricted by tissue membranes (Figure 11) [99].
Recently, diffusion tensor imaging (DTI) has emerged as a more advanced form of DWI capable of obtaining directionality and magnitude measurements of water diffusion. In DTI, diffusion anisotropy effects are obtained, characterized, and employed to provide information about tissue microstructure; in musculoskeletal MRI to date, this has been particularly useful in determining muscle fiber orientation [119,120] and articular cartilage degeneration [121].
Diffusion‑weighted imaging and DTI offer unique insight into cartilage structure and orientation. However, these techniques can be difficult in vivo, as cartilage signal is maximized at short TEs and diffusion‑sensitizing gradients increase TE and motion sensitivity [99] . Additionally, single‑shot techniques are limited by low SNR and spatial resolution [99]; multiple acquisitions partially remedy these challenges but necessitate motion correction (TABle 1) [122].
Future perspectiveMany variables are important to weigh when considering the development and trajectory of future MR technology and research. Ideally, a single MR cartilage examination could provide information about morphological structure and physiological content. However, in reality this understanding arises from a composite of imaging techniques. From a patient perspective, reducing scan time, limiting the use of contrast agents, and improving both feasibility and affordability of MR exams is paramount. In the research realm, priorities include improving SNR, minimizing artifacts, and overcoming field inhomogeneities. Future progress in clinical MR technology will hinge on the marriage of these agendas. Growth in postimage processing techniques could enhance the utility of existing sequences. Developments in physiological imaging may include improvements in 23Na coil sensitivity, new methods for detection of cartilage macromolecules, such as chemical exchange saturation transfer [123], or improved imaging of short T
2 tissues, such as the meniscus.
Morphologically, developing techniques like SEMAC or MAVRIC to image patients with metallic implants will improve depiction near these structures. Given the promise of increased SNR, improved image resolution and decreased scan times at high magnetic fields, MRI of articular cartilage will continue to improve in detail and sensitivity. Eventually, MRI may provide the basis for detec tion of cartilage damage at an early, perhaps reversible stage.
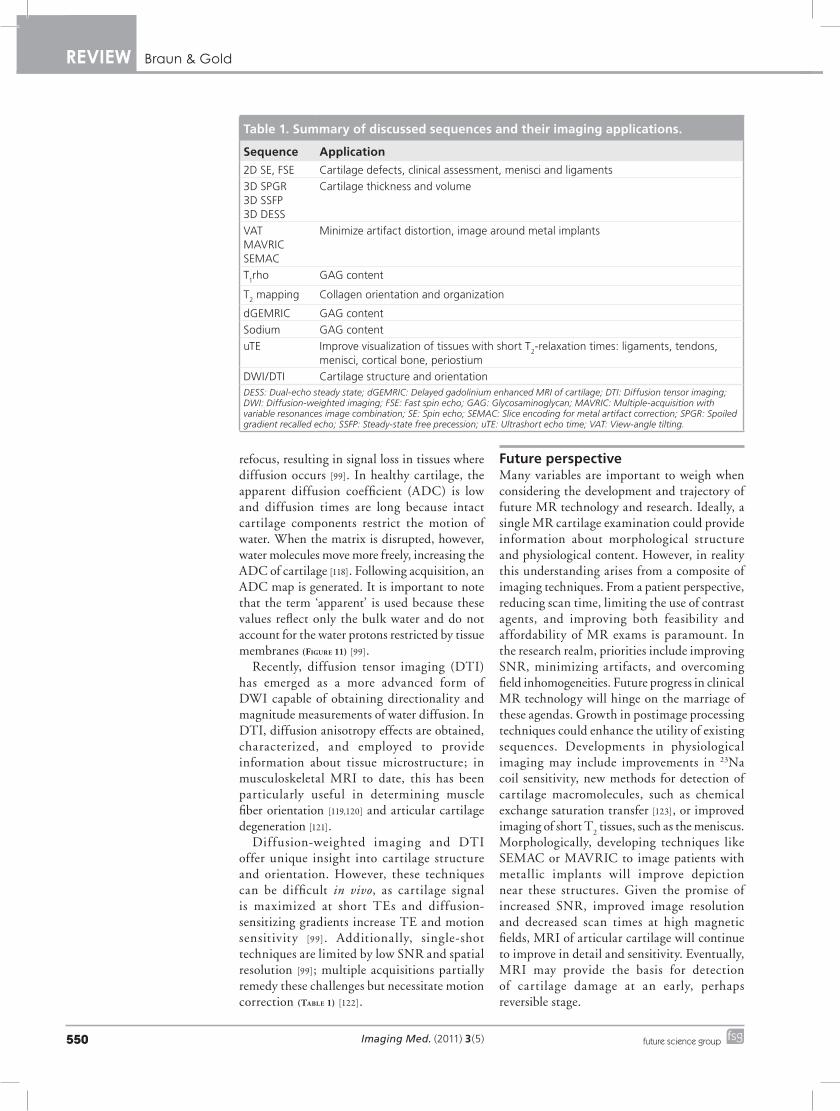
Table 1. summary of discussed sequences and their imaging applications.
sequence Application
2D SE, FSE Cartilage defects, clinical assessment, menisci and ligaments
3D SPGR3D SSFP3D DESS
Cartilage thickness and volume
VATMAVRICSEMAC
Minimize artifact distortion, image around metal implants
T1rho GAG content
T2 mapping Collagen orientation and organization
dGEMRIC GAG content
Sodium GAG content
uTE Improve visualization of tissues with short T2-relaxation times: ligaments, tendons,
menisci, cortical bone, periostium
DWI/DTI Cartilage structure and orientationDESS: Dual-echo steady state; dGEMRIC: Delayed gadolinium enhanced MRI of cartilage; DTI: Diffusion tensor imaging; DWI: Diffusion-weighted imaging; FSE: Fast spin echo; GAG: Glycosaminoglycan; MAVRIC: Multiple-acquisition with variable resonances image combination; SE: Spin echo; SEMAC: Slice encoding for metal artifact correction; SPGR: Spoiled gradient recalled echo; SSFP: Steady-state free precession; uTE: Ultrashort echo time; VAT: View-angle tilting.
www.futuremedicine.com 551future science group
Advanced MRI of articular cartilage review
ConclusionMRI is a powerful tool for imaging and understanding cartilage structure, integrity, and pathology. Existing technology is roughly divided into techniques intended for evaluating cartilage morphology and those intended for measuring cartilage physiology and macromolecule content. A comprehensive understanding of both of these components is essential for clinical diagnosis and treatment of many musculoskeletal disorders.
Financial & competing interests disclosureThis work is supported by Arthritis Foundation, NIH EB 002524, SCBT-MR and GE Healthcare. GE Gold receives research support from GE Healthcare, and is a consultant for Zimmer, Arthrocare and Isto Inc. The authors have no other relevant affiliations or financial involvement with any organization or entity with a financial interest in or financial conflict with the subject matter or materials d iscussed in the manuscript apart from those disclosed.
No writing assistance was utilized in the production of this manuscript.
executive summary
Conventional MR � T
1-weighted, T
2-weighted and proton density imaging techniques provide contrast by exploiting tissue-specific relaxation times.
� Current standard for cartilage imaging is 2D spin echo or fast spin echo. � Recent improvements have focused on increasing signal-to-noise ratio and diminishing artifact. � 3D FSE eliminates slice gaps and anisotropic voxels by obtaining thin, isotropic slices. � Fat suppression and water excitation allow the selective removal of certain proton signals to enhance contrast in surrounding tissues. � Iterative decomposition of water and fat with echo asymmetry and least-squares estimation, short T
1 inversion recovery time inversion
recovery, prepolarized MRI and metal artifact reduction techniques such as view angle tilting, slice, encoding for metal artifact correction and multiple acquisition with variable resonances image combination are used to overcome field inhomogeneities.
� Imaging at higher field strengths such as 3 T or 7 T increases image resolution and decreases scan time.
Morphologic imaging of cartilage � Morphological imaging assesses structure integrity. Currently, the gold standard is 3D spoiled gradient recalled echo imaging with fat
suppression. This technique acquires near-isotropic voxels and dramatically improves resolution. � Several other techniques are used to improve structural evaluation of cartilage. � Driven equilibrium Fourier transform heightens synovial fluid signal and diminishes cartilage signal, providing excellent contrast. � Dual-echo steady state imaging heightens cartilage and synovial fluid signals, which improves morphological assessment. � Steady-state free procession imaging techniques like balanced steady-state free precession, true fast imaging with steady-state
precession, fast imaging employing steady-state acquisition, fluctuating equilibrium MR and vastly undersampled isotropic projection are used to increase contrast between fluid and cartilage signals.
� 3D FSE obtains isotropic voxels, which improves signal-to-noise ratio and signal-to-noise ratio efficiency.
Physiological imaging of cartilage � Newer MRI methods probe the macromolecule content of cartilage in an attempt to quantitatively assess early tissue damage. � T
2 mapping identifies areas of high or low water content by measuring T
2-relaxation times throughout a tissue. Increased water content
has been correlated with damage to the collagen matrix. � T
1rho imaging measures transverse plane magnetization and the interaction between motion-restricted water molecules and their
surrounding environment. Increases in these values have been shown to correlate with osteoarthritis. � Sodium and delayed gadolinium enhanced MRI of cartilage imaging techniques use the principle of fixed charge density to measure
proteoglycan depletion in cartilage. � Ultrashort echo time imaging dramatically shortens echo times to enhance the signal from tissues with short T
2-relaxation times.
� Diffusion-weighted and diffusion-tensor imaging techniques provide insight into cartilage health by evaluation the movement of water molecules within the tissue.
Future perspective � While it would be ideal to design an imaging technique capable of simultaneously assessing cartilage morphology and physiology,
current limitations require a composite of imaging techniques to obtain this information. Decreases in scan time and improvements in detail and sensitivity will likely remain the primary objectives of further advancements in musculoskeletal MRI.
BibliographyPapers of special note have been highlighted as:� of interest
1 Coumas JM, Palmer WE. Knee arthrography. Evolution and current status. Radiol. Clin. North Am. 36(4), 703–728 (1998).
2 Crema MD, Roemer FW, Marra MD et al. Articular cartilage in the knee: current MR
imaging techniques and applications in clinical practice and research. Radiographics 31(1), 37–61(2011).
� Provides complementary overview of current state of articular cartilage imaging.
3 Guermazi A. Imaging of osteoarthritis. Preface. Radiol. Clin. North Am. 47(4), xiii–xvii (2009).
4 Brandt KD. Osteoarthritis. Clin. Geriatr. Med. 4(2), 279–293 (1988).
5 Davis MA. Epidemiology of osteoarthritis. Clin. Geriatr. Med. 4(2), 241–255 (1988).
6 Peyron JG. Epidemiological aspects of osteoarthritis. Scand. J. Rheumatol. (Suppl. 77), 29–33 (1988).

Imaging Med. (2011) 3(5)552 future science group
review Braun & Gold
7 Sangha O. Epidemiology of rheumatic diseases. Rheumatology (Oxford) 39(Suppl. 2), 3–12 (2000).
8 Swedberg JA, Steinbauer JR. Osteoarthritis. Am. Fam. Physician 45(2), 557–568 (1992).
9 Kurtz S, Mowat F, Ong K, Chan N, Lau E, Halpern M. Prevalence of primary and revision total hip and knee arthroplasty in the United States from 1990 through 2002. J. Bone Joint Surg. Am. 87(7), 1487–1497 (2005).
10 Solomon DH, Katz JN, Carrino JA et al. Trends in knee magnetic resonance imaging. Med. Care 41(5), 687–692 (2003).
11 Disler DG, Recht MP, McCauley TR. MR imaging of articular cartilage. Skeletal Radiol. 29(7), 367–377 (2000).
12 Gold GE, Bergman AG, Pauly JM et al. Magnetic resonance imaging of knee cartilage repair. Top. Magn. Reson. Imaging 9(6), 377–392 (1998).
13 Hodler J, Resnick D. Current status of imaging of articular cartilage. Skeletal Radiol. 25(8), 703–709 (1996).
14 McCauley TR, Disler DG. Magnetic resonance imaging of articular cartilage of the knee. J. Am. Acad. Orthop. Surg. 9(1), 2–8 (2001).
15 Recht MP, Resnick D. Magnetic resonance imaging of articular cartilage: an overview. Top. Magn. Reson. Imaging 9(6), 328–336 (1998).
16 Gold GE, Mosher TJ. Arthritis In Color: Advanced Imaging of Arthritis. Elsevier Saunders, Philadelphia, USA, 153–192 (2009).
17 Vallotton JA, Meuli RA, Leyvraz PF, Landry M. Comparison between magnetic resonance imaging and arthroscopy in the diagnosis of patellar cartilage lesions: a prospective study. Knee Surg. Sports Traumatol. Arthrosc. 3(3), 157–162 (1995).
18 Freeman DM, Bergman G, Glover G. Short TE MR microscopy: accurate measurement and zonal differentiation of normal hyaline cartilage. Magn. Reson. Med. 38(1), 72–81 (1997).
19 Bobic V; ICRS articular cartilage imaging committee. ICRS MR imaging protocol for knee articular cartilage. 12, (2000).
20 Gold GE, Busse RF, Beehler C et al. Isotropic MRI of the knee with 3D fast spin‑echo extended echo‑train acquisition (XETA): initial experience. AJR Am. J. Roentgenol. 188(5), 1287–1293 (2007).
21 Lichy MP, Wietek BM, Mugler JP 3rd et al. Magnetic resonance imaging of the body trunk using a single‑slab, 3‑dimensional, T
2‑weighted turbo‑spin‑echo sequence with
high sampling efficiency (SPACE) for high spatial resolution imaging: initial clinical experiences. Invest. Radiol. 40(12), 754–760 (2005).
22 Stevens KJ, Busse RF, Han E et al. Ankle: isotropic MR imaging with 3D‑FSE‑cube – initial experience in healthy volunteers. Radiology 249(3), 1026–1033 (2008).
23 Kijowski R, Blankenbaker DG, Klaers JL, Shinki K, De Smet AA, Block WF. Vastly undersampled isotropic projection steady‑state free precession imaging of the knee: diagnostic performance compared with conventional MR. Radiology 251(1), 185–194 (2009).
24 Roemer FW, Hunter DJ, Guermazi A. MRI‑based semiquantitative assessment of subchondral bone marrow lesions in osteoarthritis research. Osteoarthritis Cartilage 17(3), 414–415; author reply 416–417 (2009).
25 Eckstein F, Westhoff J, Sittek H et al. In vivo reproducibility of three‑dimensional cartilage volume and thickness measurements with MR imaging. AJR Am. J. Roentgenol. 170(3), 593–597 (1998).
26 Eckstein F, Hudelmaier M, Wirth W et al. Double echo steady state magnetic resonance imaging of knee articular cartilage at 3 Tesla: a pilot study for the Osteoarthritis Initiative. Ann. Rheum. Dis. 65(4), 433–441 (2006).
27 Wirth W, Larroque S, Davies RY et al. Comparison of 1‑year vs 2‑year change in regional cartilage thickness in osteoarthritis results from 346 participants from the Osteoarthritis Initiative. Osteoarthritis Cartilage 19(1), 74–83
28 Staroswiecki E GK, Alley MT, Gold GE, Hargreaves BA. Simultaneous estimation of T2 and ADC in human articular cartilage in vivo with a modified 3D DESS sequence at 3 T. 19th Annual Meeting of the International Society for Magnetic Resonance in Medicine. 7–13 May, Montreal,Canada, 500 (2011).
29 Staroswiecki E GK, Alley MT, Gold GE, Hargreaves BA. T2 maps and diffusion‑weighted imaging of knee cartilage with a DESS sequence at 3 T. 18th Annual Meeting of the International Society for Magnetic Resonance in Medicine. Stockholm, Sweden, 824 (2010).
30 Disler DG, McCauley TR, Kelman CG et al. Fat‑suppressed three‑dimensional spoiled gradient‑echo MR imaging of hyaline cartilage defects in the knee: comparison with standard MR imaging and arthroscopy. AJR Am. J. Roentgenol. 167(1), 127–132 (1996).
31 Mohr A, Priebe M, Taouli B, Grimm J, Heller M, Brossmann J. Selective water excitation for faster MR imaging of articular cartilage defects: initial clinical results. Eur. Radiol. 13(4), 686–689 (2003).
32 Duc SR, Pfirrmann CW, Schmid MR et al. Articular cartilage defects detected with 3D water‑excitation true FISP: prospective comparison with sequences commonly used for knee imaging. Radiology 245(1), 216–223 (2007).
33 Graichen H, Springer V, Flaman T et al. Validation of high‑resolution water‑excitation magnetic resonance imaging for quantitative assessment of thin cartilage layers. Osteoarthritis Cartilage 8(2), 106–114 (2000).
34 Gerdes CM, Kijowski R, Reeder SB. IDEAL imaging of the musculoskeletal system: robust water fat separation for uniform fat suppression, marrow evaluation, and cartilage imaging. AJR Am. J. Roentgenol. 189(5), W284–W291 (2007).
35 Reeder SB, Pelc NJ, Alley MT, Gold GE. Rapid MR imaging of articular cartilage with steady‑state free precession and multipoint fat‑water separation. AJR Am. J. Roentgenol. 180(2), 357–362 (2003).
36 Chen CA, Lu W, John CT et al. Multiecho IDEAL gradient‑echo water‑fat separation for rapid assessment of cartilage volume at 1.5 T: initial experience. Radiology 252(2), 561–567 (2009).
37 Gold GE, Reeder SB, Yu H et al. Articular cartilage of the knee: rapid three‑dimensional MR imaging at 3.0 T with IDEAL balanced steady‑state free precession ‑ initial experience. Radiology 240(2), 546–551 (2006).
� IDEAL balanced steady-state free procession can improve signal-to-noise, contrast-to-noise, and image quality.
38 Kijowski R, Blankenbaker DG, Woods MA, Shinki K, De Smet AA, Reeder SB. 3.0‑T evaluation of knee cartilage by using three‑dimensional IDEAL GRASS imaging: comparison with fast spin‑echo imaging. Radiology 255(1), 117–127
39 Morgan P, Conolly S, Scott G, Macovski A. A readout magnet for prepolarized MRI. Magn. Reson. Med. 36(4), 527–536 (1996).
40 Butts K, Pauly JM, Gold GE. Reduction of blurring in view angle tilting MRI. Magn. Reson. Med. 53(2), 418–424 (2005).
41 Lu W, Pauly KB, Gold GE, Pauly JM, Hargreaves BA. SEMAC: Slice Encoding for Metal Artifact Correction in MRI. Magn. Reson. Med. 62(1), 66–76 (2009).
42 Koch KM, Lorbiecki JE, Hinks RS, King KF. A multispectral three‑dimensional acquisition technique for imaging near metal implants. Magn. Reson. Med. 61(2), 381–390 (2009).
43 Kuo R, Panchal M, Tanenbaum L, Crues JV 3rd. 3.0 Tesla imaging of the musculoskeletal system. J. Magn. Reson. Imaging 25(2), 245–261 (2007).
www.futuremedicine.com 553future science group
Advanced MRI of articular cartilage review
44 Meyer JS, Jaramillo D. Musculoskeletal MR imaging at 3 T. Magn. Reson. Imaging Clin. N. Am. 16(3), 533–545, (2008).
45 Gold GE, Suh B, Sawyer‑Glover A, Beaulieu C. Musculoskeletal MRI at 3.0 T: initial clinical experience. AJR Am. J. Roentgenol. 183(5), 1479–1486 (2004).
46 Gold GE, Han E, Stainsby J, Wright G, Brittain J, Beaulieu C. Musculoskeletal MRI at 3.0 T: relaxation times and image contrast. AJR Am. J. Roentgenol. 183(2), 343–351 (2004).
47 Brix G, Seebass M, Hellwig G, Griebel J. Estimation of heat transfer and temperature rise in partial‑body regions during MR procedures: an analytical approach with respect to safety considerations. Magn. Reson. Imaging 20(1), 65–76 (2002).
48 Shellock FG, Shields CL Jr. Radiofrequency energy‑induced heating of bovine articular cartilage using a bipolar radiofrequency electrode. Am. J. Sports Med. 28(5), 720–724 (2000).
49 Banerjee S, Krug R, Carballido‑Gamio J et al. Rapid in vivo musculoskeletal MR with parallel imaging at 7T. Magn. Reson. Med. 59(3), 655–660 (2008).
50 Chang G, Friedrich KM, Wang L et al. MRI of the wrist at 7 tesla using an eight‑channel array coil combined with parallel imaging: preliminary results. J. Magn. Reson. Imaging 31(3), 740–746
51 Regatte RR, Schweitzer ME. Ultra‑high‑field MRI of the musculoskeletal system at 7.0T. J. Magn. Reson. Imaging 25(2), 262–269 (2007).
52 Cicuttini F, Forbes A, Asbeutah A, Morris K, Stuckey S. Comparison and reproducibility of fast and conventional spoiled gradient‑echo magnetic resonance sequences in the determination of knee cartilage volume. J. Orthop. Res. 18(4), 580–584 (2000).
53 Siepmann DB, McGovern J, Brittain JH, Reeder SB. High‑resolution 3D cartilage imaging with IDEAL SPGR at 3 T. AJR Am. J. Roentgenol. 189(6), 1510–1515 (2007).
54 Gold GE, Fuller SE, Hargreaves BA, Stevens KJ, Beaulieu CF. Driven equilibrium magnetic resonance imaging of articular cartilage: initial clinical experience. J. Magn. Reson. Imaging 21(4), 476–481 (2005).
55 Moriya S, Miki Y, Yokobayashi T, Ishikawa M. Three‑dimensional double‑echo steady‑state (3D‑DESS) magnetic resonance imaging of the knee: contrast optimization by adjusting flip angle. Acta Radiol. 50(5), 507–511 (2009).
56 Vasanawala SS, Pauly JM, Nishimura DG. Fluctuating equilibrium MRI. Magn. Reson. Med. 42(5), 876–883 (1999).
57 Friedrich KM, Reiter G, Kaiser B et al. High‑resolution cartilage imaging of the knee at 3T: basic evaluation of modern isotropic 3D MR‑sequences. Eur. J. Radiol. 78(3), 398–405 (2011).
58 Stevens KJ, Wallace CG, Chen W, Rosenberg JK, Gold GE. Imaging of the wrist at 1.5 Tesla using isotropic three‑dimensional fast spin echo cube. J. Magn. Reson. Imaging 33(4), 908–915 (2011).
59 Schaefer FK, Kurz B, Schaefer PJ et al. Accuracy and precision in the detection of articular cartilage lesions using magnetic resonance imaging at 1.5 Tesla in an in vitro study with orthopedic and histopathologic correlation. Acta Radiol. 48(10), 1131–1137 (2007).
60 Kijowski R, Davis KW, Woods MA et al. Knee joint: comprehensive assessment with 3D isotropic resolution fast spin‑echo MR imaging – diagnostic performance compared with that of conventional MR imaging at 3.0 T. Radiology 252(2), 486–495 (2009).
� At 3.0T, FSE CUBE performs similarly to routine clinical imaging protocol for detecting knee pathologies.
61 Kijowski R, Davis KW, Blankenbaker DG, Woods MA, Del Rio AM, De Smet AA. Evaluation of the menisci of the knee joint using three‑dimensional isotropic resolution fast spin‑echo imaging: diagnostic performance in 250 patients with surgical correlation. Skeletal Radiol. doi: 10.1007/s00256‑011‑1140‑4 (2011) (Epub ahead of print).
62 Venn M, Maroudas A. Chemical composition and swelling of normal and osteoarthrotic femoral head cartilage. I. Chemical composition. Ann. Rheum. Dis. 36(2), 121–129 (1977).
63 Mosher TJ. In: Arthritis In Color: Advanced Imaging of Arthritis. Elsevier Saunders, Philadelphia, USA, 23–32 (2009).
64 Dijkgraaf LC, de Bont LG, Boering G, Liem RS. The structure, biochemistry, and metabolism of osteoarthritic cartilage: a review of the literature. J. Oral Maxillofac. Surg. 53(10), 1182–1192 (1995).
65 Gold GE, Chen CA, Koo S, Hargreaves BA, Bangerter NK. Recent advances in MRI of articular cartilage. AJR Am. J. Roentgenol. 193(3), 628–638 (2009).
66 Poon CS, Henkelman RM. Practical T2
quantitation for clinical applications. J. Magn. Reson. Imaging 2(5), 541–553 (1992).
67 Smith HE, Mosher TJ, Dardzinski BJ et al. Spatial variation in cartilage T2 of the knee. J. Magn. Reson. Imaging 14(1), 50–55 (2001).
68 Dardzinski BJ, Mosher TJ, Li S, Van Slyke MA, Smith MB. Spatial variation
of T2 in human articular cartilage. Radiology
205(2), 546–550 (1997).
69 Mosher TJ, Dardzinski BJ, Smith MB. Human articular cartilage: influence of aging and early symptomatic degeneration on the spatial variation of T
2 – preliminary findings
at 3 T. Radiology 214(1), 259–266 (2000).
70 Mosher TJ, Smith H, Dardzinski BJ, Schmithorst VJ, Smith MB. MR imaging and T
2 mapping of femoral cartilage: in vivo
determination of the magic angle effect. AJR Am. J. Roentgenol. 177(3), 665–669 (2001).
71 Konig H, Sauter R, Deimling M, Vogt M. Cartilage disorders: comparison of spin‑echo, CHESS, and FLASH sequence MR images. Radiology 164(3), 753–758 (1987).
72 Lehner KB, Rechl HP, Gmeinwieser JK, Heuck AF, Lukas HP, Kohl HP. Structure, function, and degeneration of bovine hyaline cartilage: assessment with MR imaging in vitro. Radiology 170(2), 495–499 (1989).
73 Broderick LS, Turner DA, Renfrew DL, Schnitzer TJ, Huff JP, Harris C. Severity of articular cartilage abnormality in patients with osteoarthritis: evaluation with fast spin‑echo MR vs arthroscopy. AJR Am. J. Roentgenol. 162(1), 99–103 (1994).
74 Peterfy CG. Imaging of the disease process. Curr. Opin. Rheumatol. 14(5), 590–596 (2002).
75 David‑Vaudey E, Ghosh S, Ries M, Majumdar S. T
2 relaxation time
measurements in osteoarthritis. Magn. Reson. Imaging 22(5), 673–682 (2004).
76 Gahunia HK, Babyn P, Lemaire C, Kessler MJ, Pritzker KP. Osteoarthritis staging: comparison between magnetic resonance imaging, gross pathology and histopathology in the rhesus macaque. Osteoarthritis Cartilage 3(3), 169–180 (1995).
77 Gahunia HK, Lemaire C, Cross AR, Babyn P, Kessler MJ, Pritzker KP. Osteoarthritis in rhesus macaques: assessment of cartilage matrix quality by quantitative magnetic resonance imaging. Agents Actions (Suppl. 39), 255–259 (1993).
78 Mlynarik V, Trattnig S, Huber M, Zembsch A, Imhof H. The role of relaxation times in monitoring proteoglycan depletion in articular cartilage. J. Magn. Reson. Imaging 10(4), 497–502 (1999).
79 Nissi MJ, Toyras J, Laasanen MS et al. Proteoglycan and collagen sensitive MRI evaluation of normal and degenerated articular cartilage. J. Orthop. Res. 22(3), 557–564 (2004).
80 Spandonis Y, Heese FP, Hall LD. High resolution MRI relaxation measurements of water in the articular cartilage of the meniscectomized rat knee at 4.7 T. Magn. Reson. Imaging 22(7), 943–951 (2004).
Imaging Med. (2011) 3(5)554 future science group
review Braun & Gold
81 Watrin‑Pinzano A, Ruaud JP, Cheli Y et al. Evaluation of cartilage repair tissue after biomaterial implantation in rat patella by using T2 mapping. MAGMA 17(3–6), 219–228 (2004).
82 Watrin‑Pinzano A, Ruaud JP, Cheli Y et al. T
2 mapping: an efficient MR quantitative
technique to evaluate spontaneous cartilage repair in rat patella. Osteoarthritis Cartilage 12(3), 191–200 (2004).
83 Mosher TJ, Zhang Z, Reddy R et al. Knee articular cartilage damage in osteoarthritis: analysis of MR image biomarker reproducibility in ACRIN‑PA 4001 multicenter trial. Radiology 258(3), 832–842
84 Wheaton AJ, Casey FL, Gougoutas AJ et al. Correlation of T
1rho with fixed charge density
in cartilage. J. Magn. Reson. Imaging 20(3), 519–525 (2004).
� Early description of T1rho as a correlate to
fixed charge density and potential tool for imaging proteoglycan changes in early stages of osteoarthritis.
85 Blumenkrantz G, Majumdar S. Quantitative magnetic resonance imaging of articular cartilage in osteoarthritis. Eur. Cell. Mater. 13, 76–86 (2007).
86 Regatte RR, Akella SV, Wheaton AJ et al. 3D‑T
1rho‑relaxation mapping of articular
cartilage: in vivo assessment of early degenerative changes in symptomatic osteoarthritic subjects. Acad. Radiol. 11(7), 741–749 (2004).
87 Stahl R, Luke A, Li X et al. T1rho, T
2 and
focal knee cartilage abnormalities in physically active and sedentary healthy subjects versus early OA patients ‑ a 3.0‑Tesla MRI study. Eur. Radiol. 19(1), 132–143 (2009).
88 Li X, Han ET, Crane JC. Development of in vivo multi‑slice spiral T
1 rho mapping in
cartilage at 3T and its application to osteoarthritis. Presented at: Annual Meeting International Society of Magnetic Resonance in Medicine. Miami, FL, USA (2005).
89 Santyr GE, Fairbanks EJ, Kelcz F, Sorenson JA. Off‑resonance spin locking for MR imaging. Magn. Reson. Med. 32(1), 43–51 (1994).
90 Menezes NM, Gray ML, Hartke JR, Burstein D. T
2 and T
1rho MRI in articular
cartilage systems. Magn. Reson. Med. 51(3), 503–509 (2004).
91 Gold GE, Hargreaves BA, Stevens KJ, Beaulieu CF. Advanced magnetic resonance imaging of articular cartilage. Orthop. Clin. North Am. 37(3), 331–347, (2006).
92 Shapiro EM, Borthakur A, Dandora R, Kriss A, Leigh JS, Reddy R. Sodium visibility and quantitation in intact bovine articular
cartilage using high field (23)Na MRI and MRS. J. Magn. Reson. 142(1), 24–31 (2000).
93 Borthakur A, Shapiro EM, Beers J, Kudchodkar S, Kneeland JB, Reddy R. Sensitivity of MRI to proteoglycan depletion in cartilage: comparison of sodium and proton MRI. Osteoarthritis Cartilage 8(4), 288–293 (2000).
� Demonstrated that sodium MRI can more specifically and sensitively detect small changes in proteoglycan concentrations than proton MRI.
94 Wang L, Wu Y, Chang G et al. Rapid isotropic 3D‑sodium MRI of the knee joint in vivo at 7T. J. Magn. Reson. Imaging 30(3), 606–614 (2009).
95 Wheaton AJ, Borthakur A, Shapiro EM et al. Proteoglycan loss in human knee cartilage: quantitation with sodium MR imaging ‑ feasibility study. Radiology 231(3), 900–905 (2004).
96 Staroswiecki E, Bangerter NK, Gurney PT, Grafendorfer T, Gold GE, Hargreaves BA. In vivo sodium imaging of human patellar cartilage with a 3D cones sequence at 3 T and 7 T. J. Magn. Reson. Imaging 32(2), 446–451
97 Gray ML, Burstein D, Kim YJ, Maroudas A. 2007 Elizabeth Winston Lanier Award Winner. Magnetic resonance imaging of cartilage glycosaminoglycan: basic principles, imaging technique, and clinical applications. J. Orthop. Res. 26(3), 281–291 (2008).
98 Burstein D, Velyvis J, Scott KT et al. Protocol issues for delayed Gd(DTPA)(2‑)‑enhanced MRI (dGEMRIC) for clinical evaluation of articular cartilage. Magn. Reson. Med. 45(1), 36–41 (2001).
99 Gold GE, Burstein D, Dardzinski B, Lang P, Boada F, Mosher T. MRI of articular cartilage in OA: novel pulse sequences and compositional/functional markers. Osteoarthritis Cartilage 14(Suppl. A), A76–A86 (2006).
100 McKenzie CA, Williams A, Prasad PV, Burstein D. Three‑dimensional delayed gadolinium‑enhanced MRI of cartilage (dGEMRIC) at 1.5T and 3.0T. J. Magn. Reson. Imaging 24(4), 928–933 (2006).
101 Tiderius CJ, Svensson J, Leander P, Ola T, Dahlberg L. dGEMRIC (delayed gadolinium‑enhanced MRI of cartilage) indicates adaptive capacity of human knee cartilage. Magn. Reson. Med. 51(2), 286–290 (2004).
102 Anandacoomarasamy A, Giuffre BM, Leibman S et al. Delayed gadolinium‑enhanced magnetic resonance imaging of cartilage: clinical associations in obese adults. J. Rheumatol. 36(5), 1056–1062 (2009).
103 Williams A, Sharma L, McKenzie CA, Prasad PV, Burstein D. Delayed gadolinium‑
enhanced magnetic resonance imaging of cartilage in knee osteoarthritis: findings at different radiographic stages of disease and relationship to malalignment. Arthritis Rheum. 52(11), 3528–3535 (2005).
104 Bashir A, Gray ML, Hartke J, Burstein D. Nondestructive imaging of human cartilage glycosaminoglycan concentration by MRI. Magn. Reson. Med. 41(5), 857–865 (1999).
105 Gray ML, Burstein D, Xia Y. Biochemical (and functional) imaging of articular cartilage. Semin. Musculoskelet. Radiol. 5(4), 329–343 (2001).
106 Bellin MF, Van Der Molen AJ. Extracellular gadolinium‑based contrast media: an overview. Eur. J. Radiol. 66(2), 160–167 (2008).
107 Idee JM, Port M, Medina C et al. Possible involvement of gadolinium chelates in the pathophysiology of nephrogenic systemic fibrosis: a critical review. Toxicology 248(2–3), 77–88 (2008).
108 Kallen AJ, Jhung MA, Cheng S et al. Gadolinium‑containing magnetic resonance imaging contrast and nephrogenic systemic fibrosis: a case‑control study. Am. J. Kidney Dis. 51(6), 966–975 (2008).
109 Marckmann P, Skov L, Rossen K et al. Nephrogenic systemic fibrosis: suspected causative role of gadodiamide used for contrast‑enhanced magnetic resonance imaging. J. Am. Soc. Nephrol. 17(9), 2359–2362 (2006).
110 Nainani N, Panesar M. Nephrogenic systemic fibrosis. Am. J. Nephrol. 29(1), 1–9 (2009).
111 Wiginton CD, Kelly B, Oto A et al. Gadolinium‑based contrast exposure, nephrogenic systemic fibrosis, and gadolinium detection in tissue. AJR Am. J. Roentgenol. 190(4), 1060–1068 (2008).
112 Gold GE, Pauly JM, Macovski A, Herfkens RJ. MR spectroscopic imaging of collagen: tendons and knee menisci. Magn. Reson. Med. 34(5), 647–654 (1995).
113 Gatehouse PD, He T, Puri BK, Thomas RD, Resnick D, Bydder GM. Contrast‑enhanced MRI of the menisci of the knee using ultrashort echo time (UTE) pulse sequences: imaging of the red and white zones. Br. J. Radiol. 77(920), 641–647 (2004).
114 Robson MD, Gatehouse PD, Bydder M, Bydder GM. Magnetic resonance: an introduction to ultrashort TE (UTE) imaging. J. Comput. Assist. Tomogr. 27(6), 825–846 (2003).
115 Noll DC, Pauly JM, Meyer CH, Nishimura DG, Macovski A. Deblurring for non‑2D Fourier transform magnetic resonance imaging. Magn. Reson. Med. 25(2), 319–333 (1992).
www.futuremedicine.com 555future science group
Advanced MRI of articular cartilage review
116 Wansapura JP, Daniel BL, Pauly J, Butts K. Temperature mapping of frozen tissue using eddy current compensated half excitation RF pulses. Magn. Reson. Med. 46(5), 985–992 (2001).
117 Lu A, Daniel BL, Pauly KB. Improved slice excitation for ultrashort TE imaging with B0 and linear eddy current correction [abstr]. In: Fourteenth Meeting of the International Society for Magnetic Resonance in Medicine. Berkeley, CA, USA (2006).
118 Burstein D, Gray ML, Hartman AL, Gipe R, Foy BD. Diffusion of small solutes in cartilage as measured by nuclear magnetic resonance (NMR) spectroscopy and imaging. J. Orthop. Res. 11(4), 465–478 (1993).
119 Blemker SS, Asakawa DS, Gold GE, Delp SL. Image‑based musculoskeletal modeling: applications, advances, and future opportunities. J. Magn. Reson. Imaging 25(2), 441–451 (2007).
120 Zaraiskaya T, Kumbhare D, Noseworthy MD. Diffusion tensor imaging in evaluation of human skeletal muscle injury. J. Magn. Reson. Imaging 24(2), 402–408 (2006).
121 Filidoro L, Dietrich O, Weber J et al. High‑resolution diffusion tensor imaging of human patellar cartilage: feasibility and preliminary findings. Magn. Reson. Med. 53(5), 993–998 (2005).
122 Butts K, Pauly J, de Crespigny A, Moseley M. Isotropic diffusion‑weighted and spiral‑navigated interleaved EPI for routine imaging of acute stroke. Magn. Reson. Med. 38(5), 741–749 (1997).
123 Ling W, Regatte RR, Navon G, Jerschow A. Assessment of glycosaminoglycan concentration in vivo by chemical exchange‑dependent saturation transfer (gagCEST). Proc. Natl Acad. Sci. USA 105(7), 2266–2270 (2008).
� Describes highly sensitive method of measuring localized glycosaminoglycan concentrations in vivo.