advanced modeling and simulation of vehicle active
TRANSCRIPT
Research ArticleAdvanced Modeling and Simulation of Vehicle ActiveAerodynamic Safety
Krzysztof Kurec ,1 MichaB Remer ,1 Jakub Broniszewski ,1 PrzemysBaw Bibik ,1
Sylwester Tudruj,2 and Janusz Piechna 1
1Warsaw University of Technology, Institute of Aeronautics and Applied Mechanics, Warsaw 00-665, Poland2Warsaw University of Technology, Institute of Micromechanics and Photonics, Warsaw 02-525, Poland
Correspondence should be addressed to Janusz Piechna; [email protected]
Received 3 August 2018; Accepted 6 January 2019; Published 3 February 2019
Guest Editor: Mihai Dimian
Copyright © 2019 Krzysztof Kurec et al.This is an open access article distributed under the Creative Commons Attribution License,which permits unrestricted use, distribution, and reproduction in any medium, provided the original work is properly cited.
The aim of this study was to extend the safety limits of fast moving cars by the application, in a controlled way, of aerodynamicforces which increase as the square of a car’s velocity and, if left uncontrolled, dramatically reduce car safety.This paper presents themethods, assumptions, and results of numerical and experimental investigations by modeling and simulation of the aerodynamiccharacteristics and dynamics of a small sports car equipped with movable aerodynamic elements operated by an electronicsubsystem for data acquisition and aerodynamics active automatic control.
1. Introduction
Currently, the trend to minimize emissions by limitingfossil fuel consumption leads to lighter cars with a lowdrag coefficient. This situation introduces new challengesfor car designers. They need to ensure that stability will begood enough to allow safe driving in all road conditions(wind gusts, moving obstacles, etc.). Studies found in theliterature mainly focus on sensitivity to lateral wind. Thesemethods attempt to reproduce the test procedure accordingto the ISO 12021:2010 standard [1]. However, it is ratherrare to take into account the coupling of car dynamics andaerodynamics. Very often, it is assumed that car movementwill not affect aerodynamic forces.The study presented in [2]is in contrast to this assumption. The authors have shownthat the inclusion of a bidirectional fluid structure interac-tion can lead to a significant change in the aerodynamicsforces.
The development of the quality of highways together withthe increase in the potential maximum speed of cars hasturned the attention of car designers towards the dynamicfeatures of cars at high speeds. The external shapes of cars aretypically optimized for low aerodynamic drag. Unfortunately,
such action has drawbacks in the form of car bodies gener-ating aerodynamic lift forces at high speed, together with adecrease in a car’s directional stability and reduction of safetylimits during fast cornering. The frailty of the car body shapeis typically compensated by fixed or movable aerodynamicelements activated at high speed. Typically, such aerodynamicelements have the form of a wing, generating downforcewhich compensates the lift force generated by the car body.The additional aerodynamic elements generate additionaldrag, so it is desirable to activate the movable elements onlywhen necessary. Some sports cars such as, for example, thePorsche 918 Spyder [3], have predefined aerodynamic settingsfor a specific range of speeds which make it possible to eitherminimize drag or maximize downforce, while the activeaerodynamics of the McLaren Senna additionally enables itto shift the aerodynamics balance towards the rear of the carto enhance braking. These two examples relate to a case whenthe active aerodynamics is used to support the maneuversperformed by the driver.However, with the increased numberof different types of sensors [4] that can be mounted on a car,it is possible to design a driver assistance system that is ableto evaluate the current road conditions [5] and automaticallymodify the aerodynamic properties. One example where
HindawiJournal of Advanced TransportationVolume 2019, Article ID 7308590, 17 pageshttps://doi.org/10.1155/2019/7308590

2 Journal of Advanced Transportation
CAD WindTunnel
CFD
DynamicModel
One-way FSI
FSI
Elastic FSI
Field TestFully Coupled FSI
Control
Geometry Preparation Single Physics Coupled Analysis Road Tests
Analysis Evolution
Figure 1: Scheme of the data flow in the project of vehicle active aerodynamic safety, where CAD is computer aided design, CFD is computerfluid dynamics, and FSI is fluid structure interaction.
a driver can be assisted during a rapid maneuver couldbe the use of machine vision technology to estimate theroad curvature [6] and utilize the driving assistance systemto assess not only whether the speed is within the safetymargin but also whether the vehicle’s aerodynamic setup isthe most appropriate for the car’s safety. This could also givethe time essential to perform more significant movementsof the active aerodynamic surfaces so that a higher valueof the aerodynamic forces can be utilized, even before thedriver realizes that some kind of action needs to be taken.The introduction of autonomous driving itself can make itpossible to increase safety limits during rapid maneuvers [7].The development of such systems needs to rely on modelbased validation due to the costs and complexity, whichwas emphasized by researchers developing a highway pilotassisting the driver [8].
An aerodynamic active control system requires infor-mation about the actual state of the car, the position ofthe movable aerodynamic elements located on the car bodyand the steering algorithms. This paper presents informationabout the methods used for modeling and simulation todevelop an active system extending the safety limits of afast moving car. The electronic control system is the key tothe integration of many aspects of scientific and technicalactivity.
It was considered that information can be collected fromsensors located inside the car and that a set of movableaerodynamic elements would be attached to the car bodyto form a control loop. The control part of the system wasassumed to be open for programming taking into accountinformation about the characteristics of the sensors, theactuators and the aerodynamic characteristics of the addedaerodynamic elements. The general scheme of data flow inthe project is presented in Figure 1.
2. System of Data Acquisition and ActiveControl of Movable Aerodynamic Elements
Ameasurement and control system was developed to achievethe project goals. It was decided that, for research purposes,the system should be flexible and easy to modify. The otherrequirement for the hardware was immunity to vibrationsand an ability to work in a broad range of environmentalconditions. For those reasons, an industrial real-time con-troller was selected as the core of the system. The controllerwas fitted with a set of different types of communicationinterfaces, which enabled the connection of different sensorsand devices.The general architecture of the developed systemis presented in Figure 2. The whole system is divided intothree subsystems: the measurement subsystem, the actuation(control) subsystem, and the user interface.
The measurement subsystem consists of several sensorstogether with their interfaces. In the current configuration,all the sensors were connected to the system controllervia RS-232C interfaces. The main sensor is an integratedGPS (Global Positioning System) and AHRS (Attitude andHeading Reference System) sensor. This sensor providesnavigation and vehicle state data: linear acceleration, linearvelocity components, inertial position, angular rates, andattitude angles in three perpendicular axes. All the data wascollected at a frequency of 200Hz. The next sensor is thevehicle control measurement sensor. This sensor providesdata of the vehicle steering wheel angle and the throttleand brake pedal positions at a frequency of 100Hz. Thesetwo sensors are sufficient for the control of the vehicleaerodynamic surfaces. For some parts of this research, thesystem may also use suspension deflection sensors which uselinear potentiometer sensors in each of the vehicle shockabsorbers.

Journal of Advanced Transportation 3
Navigation sensorGPS+AHRS
Vehicle controlmeasurement
Steering wheelangle
Throttle pedalposition
Brakes
RS-485PWM
converter
Servomechanism
Servomechanism
RS-485PWM
converter
Servomechanism
Servomechanism
RS-485PWM
converter
Servomechanism
Servomechanism
RS-485PWM
converter
Servomechanism
Servomechanism
Suspensionmeasure and
controlRS-232
RS-232
RS-232
Real-Timeindustrialcontroller
RS-485
Measurement SystemActuation SystemUser Interface
Control PanelNotebook
Ethernet
Figure 2: Hardware architecture of the measurement and control system.
The actuation subsystem consists of two parts, actua-tion of aerodynamic elements and suspension control. Theaerodynamic surfaces are fitted with PWM (Pulse WidthModulation) signal controlled servomechanisms. An RS-485interface is used to control those servomechanisms and allservomechanisms are connected to the RS-485 control linevia signals converters. All servomechanisms are controlled ata frequency of 20Hz.
The third subsystem is the user interface. The GUI isinstalled on the notebook connected to the system controllervia an Ethernet interface. The GUI allows the operatorto observe the measurement data, configure the controller(different modes of operation are possible), and manuallycontrol the aerodynamic surfaces.The RT controller may alsobe configured to operate in a fully automatic way without theuser control interface panel connected.
The system software was developed using NationalInstruments LabVIEW software. The main objective of theapplication was to ensure real-time operation of the system.Several parallel modules are defined in the architecture ofthe software (see Figure 3). The system processes moduleis responsible for governing the operation of the system.The user interface communication module exchanges datawith the user control panel by sending sensor readings andreceiving commands and instructions from the user. Thedata acquisition module ensures communication with thesensors and is responsible for the synchronous reading of
System processes User interfacecommunication Data acquisition
Control algorithms Actuation Logger
Figure 3: System software modules.
data from all sensors.The control algorithms module receivesdata from the data acquisition module and processes the dataaccording to defined control laws and sends commands tothe actuation module which then sends the commands to allcontrol elements. The logger module records both data fromall sensors and all control commands during operation of thesystem.
3. Models and Simulations
The aim of the presented study was to extend the safety limitof a fast moving vehicle in conditions of strong changes tothe atmospheric and physical environment and the rapidreactions of the driver. Widely used ESP systems for vehiclestabilization use forces generated during braking of selected

4 Journal of Advanced Transportation
CFD
Road tests
1:2.5 scale wind tunnel tests
0 4 9 13 18 22 26 31
35
[m s^-1]Velocity
Figure 4: The three different types of aerodynamic study.
vehicle wheels. In this analysis, it is proposed to use aero-dynamic forces for this purpose. The results of the activeactions of moving aerodynamic elements aimed at stabilizingvehicle motion are discussed below. During the developmentof a new aerodynamic solution, it is necessary to identify theproblems to be solved and the tools needed to achieve thegoal. The final solution should be tested in real life on a testcar; however, a wide range of modeling techniques can beutilized to aid development.
3.1. The Use of a Variety of Different Modeling Techniques.In the analyzed case, the objective is to actively control theaerodynamic properties of a light sports car such as theHonda CRX del Sol. It was recognized that the conclusionsresulting from the flow analysis of this car could be extendedtomany other high-speed designs. The geometry of this car ispresented in Figure 4 which shows the car used during tracktests together with its wind tunnel model and CAD modelincorporated into the CFD calculations.
The most important data was recorded during the testrides and gave the answer to the question of which aero-dynamic setups were the most efficient to control the car’sdynamics, while the results from the CFD calculations wereused to complement the data acquired during wind tunneltests andwere used to gain additional knowledge of the natureof the flow around the car body. Each of the described actionsis shown in Figure 4 to emphasize the fact that a very widerange of data can be obtained by employing them all together.The use of modeling techniques makes it possible to studymany different scenarios, including scenarios that could bedangerous to test on a real car.
Below, a brief review of the modeling techniques used ispresented, starting with the wind tunnel tests through to thedifferent kinds of modeling based on CFD calculations. Ineach consecutive case, the CFD calculations were expandedby additional elements. In most cases of traditional auto-motive aerodynamics, stationary and solid bodies are being
investigated. This paper describes more advanced techniquesthat are essential to accurately predict the behavior of a carsubjected to active control by moving aerodynamic surfaces.This includes studies of such cases as the movement of therear wing, the behavior and influence of deformable surfacesattached to the car body, as well as a complete simulation ofa moving car. Apart from the simulations, the developmentof an algorithm enabling the control of moving aerodynamicelements is presented as well.
To carry out the proposed activities, the following soft-ware was selected:
(1) to construct the 3D geometry of a vehicle and mov-ing aerodynamic elements installed on its body; itwas assumed that SolidWorks, Unigraphics software,and software included in the ANSYS-Fluent packagewould be used;
(2) for vehicle body flow analysis; it was assumed thatCFD ANSYS-Fluent commercial software would beused together with the freely available OpenFOAMsoftware;
(3) for vehicle dynamics; it was assumed thatMCS.Adams/Car would be used alongside Matlab/Simulink as an interface between MCS.Adams andANSYS-Fluent;
(4) in-house software for analyzing the motion ofdeformable elastic car body parts and simulating thedynamics of vehicle body motion.
Taking into account the multidisciplinary problems accom-panied by the main and general problem, some new ideas oftransferring expert knowledge to the engineering level canbe applied. An example is the SORCER software [9] used bysome team members for the solution of other problems. Theidea of preparing software blocks by experts to solve separatedetailed problems and integrating individual solutions intoa bigger and wider problem consideration is the basis of theSORCER software. Due to the personal limitation of the team
Journal of Advanced Transportation 5
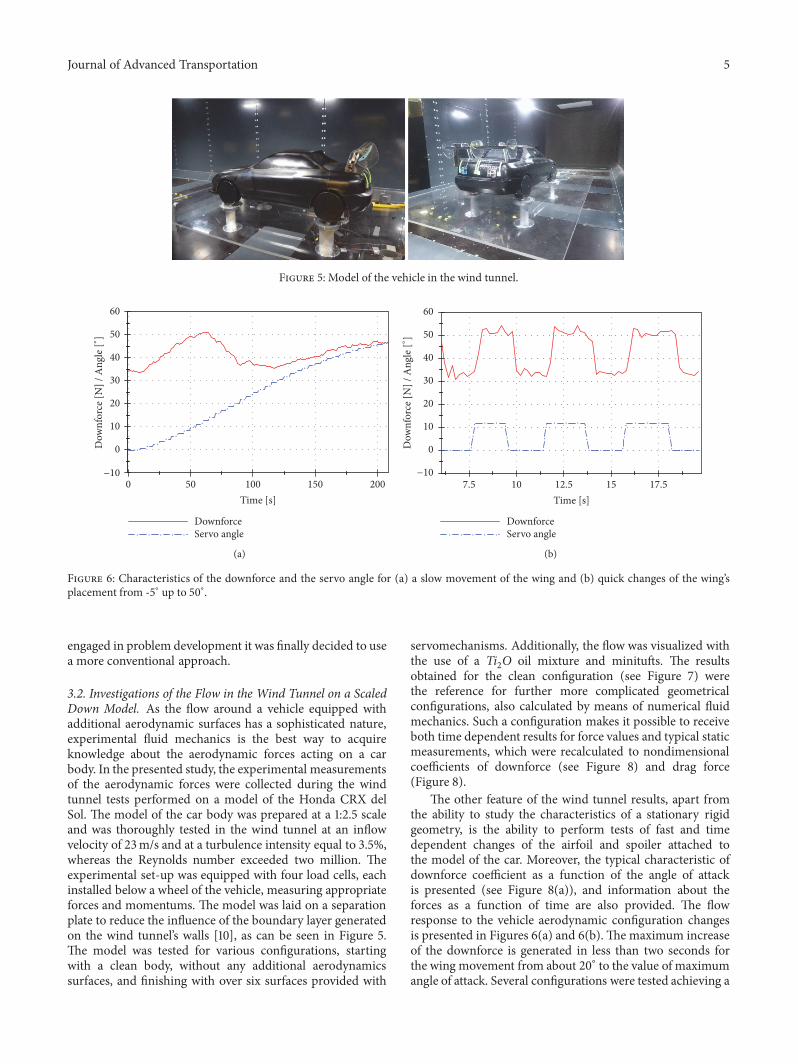
Figure 5: Model of the vehicle in the wind tunnel.
DownforceServo angle
0 100 150 20050Time [s]
0
10
20
30
40
50
60
−10
Dow
nfor
ce [N
] / A
ngle
[∘]
(a)
DownforceServo angle
10 12.5 15 17.57.5Time [s]
−10
0
10
20
30
40
50
60
Dow
nfor
ce [N
] / A
ngle
[∘]
(b)
Figure 6: Characteristics of the downforce and the servo angle for (a) a slow movement of the wing and (b) quick changes of the wing’splacement from -5∘ up to 50∘.
engaged in problem development it was finally decided to usea more conventional approach.
3.2. Investigations of the Flow in the Wind Tunnel on a ScaledDown Model. As the flow around a vehicle equipped withadditional aerodynamic surfaces has a sophisticated nature,experimental fluid mechanics is the best way to acquireknowledge about the aerodynamic forces acting on a carbody. In the presented study, the experimental measurementsof the aerodynamic forces were collected during the windtunnel tests performed on a model of the Honda CRX delSol. The model of the car body was prepared at a 1:2.5 scaleand was thoroughly tested in the wind tunnel at an inflowvelocity of 23m/s and at a turbulence intensity equal to 3.5%,whereas the Reynolds number exceeded two million. Theexperimental set-up was equipped with four load cells, eachinstalled below a wheel of the vehicle, measuring appropriateforces and momentums. The model was laid on a separationplate to reduce the influence of the boundary layer generatedon the wind tunnel’s walls [10], as can be seen in Figure 5.The model was tested for various configurations, startingwith a clean body, without any additional aerodynamicssurfaces, and finishing with over six surfaces provided with
servomechanisms. Additionally, the flow was visualized withthe use of a Ti
2O oil mixture and minitufts. The results
obtained for the clean configuration (see Figure 7) werethe reference for further more complicated geometricalconfigurations, also calculated by means of numerical fluidmechanics. Such a configuration makes it possible to receiveboth time dependent results for force values and typical staticmeasurements, which were recalculated to nondimensionalcoefficients of downforce (see Figure 8) and drag force(Figure 8).
The other feature of the wind tunnel results, apart fromthe ability to study the characteristics of a stationary rigidgeometry, is the ability to perform tests of fast and timedependent changes of the airfoil and spoiler attached tothe model of the car. Moreover, the typical characteristic ofdownforce coefficient as a function of the angle of attackis presented (see Figure 8(a)), and information about theforces as a function of time are also provided. The flowresponse to the vehicle aerodynamic configuration changesis presented in Figures 6(a) and 6(b).The maximum increaseof the downforce is generated in less than two seconds forthe wing movement from about 20∘ to the value of maximumangle of attack. Several configurations were tested achieving a

6 Journal of Advanced Transportation
Figure 7: Comparison of the experimental visualization of the oil flow over a clean configuration of the car body (left) and from the CFDcalculations (right).
ExperimentCFD
0.4
0.5
0.6
0.7
0.8
0.9
1.0
1.1
Dow
nfor
ce co
effici
ent
10 20 30 40 500Angle of attack [∘]
(a)
ExperimentCFD
0.4
0.5
0.6
0.7
0.8
0.9
1.0
1.1
Dra
g co
effici
ent
10 20 30 40 500Angle of attack [∘]
(b)
Figure 8: Characteristics of (a) the downforce coefficient and (b) the drag coefficient obtained during the wind tunnel measurements of acar with a mounted rear wing and a spoiler, compared with the CFD results acquired for a wide range of angles of attack.
minimum time to reachmaximum increase of the downforcein around 0.6 seconds by the movement of a special spoiler.
3.3. Validation of the CFD Calculations. The values of theaerodynamic forces, as well as some of the flow featuresrecorded during wind tunnel testing, were used to performvalidation of the CFD methods. A comparison of the flowfeatures on the surface of the car body is presented inFigure 7, whereas in Figure 8 the values of the downforcecoefficient together with the drag coefficient obtained duringthe experiments and the CFD calculations are presentedtogether. It was established that, for a wide range of studiedcases, the SST k-𝜔 turbulence model [11] makes it possibleto achieve CFD results close to the experimental data. Ascan be observed in Figures 7 and 8, a good agreement withthe wind tunnel tests was achieved. The SST k-𝜔 turbulencemodel is one of the most commonly used turbulence modelsin the field of automotive aerodynamics [12], however, it isbest practice to check it for every specific case being studied.
3.4. The Unsteady Aerodynamics: The Search for the FlowResponse Time to the Movement of the Active Aerodynamic
Elements. One of the most commonly used active aerody-namic elements in the field of the automotive design is arear wing [13]. The main advantage of such a device is itshigh efficiency, which makes it possible to achieve a highdownforce in a trade-off for a relatively low increase of drag.The rear wing is mounted near the trunk at such a distancefrom the rest of the car body so that it should not create anynegative aerodynamic interferences with the car’s silhouette.The area of the wing is proportional to the forces that itcan generate, so the larger the wing the higher the values ofdownforce that can be achieved. Unfortunately, the additionof the rear wing can be seen as a disturbance of a car’saesthetics which leads designers to reduce its size, or to createa mechanism to enable the wing to hide within the car’ssilhouette or even to completely remove it. Currently, mostsports cars have some sort of rear wing, which is used toenhance the car’s handling at high speeds. In the case ofsome cars, for example, the Bugatti Veyron, the rear wing alsoworks in braking mode, by rotating to a high angle of attack,creating additional drag that slows the car down.
If the rear wing is designed to be an active aerodynamicelement, apart from its aerodynamic characteristics, it is veryimportant to know how it will be controlled and adjusted to

Journal of Advanced Transportation 7
(a) (b) (c)
Figure 9: The car body with the rear wing set to the three different angles of attack: (a) 0∘, (b) 20∘, and (c) 50∘.
Boundary conditions: velocity inlet pressure outlet symmetry wall interface
(b)(a)
Figure 10: (a) Geometry of the computational domain. (b) Close-up on the car body with mesh on the symmetry plane.
the desired angle of attack or moved to a specific locationrelative to the car’s silhouette. For this purpose, in thisresearch, it was decided to use electric servomechanismsdue to their ability to perform fast movements that allowadjustments of the car’s aerodynamic properties in a shorttime.
The aim of the study presented in this section was toshow the unsteady flow features developing over time dueto a change of the rear wing’s angle of attack (see Figure 9).This research was performed by means of CFD calculationsin ANSYS Fluent. Due to the analysis of the unsteadyphenomena, a transient solver was utilized together with theSST k-𝜔 turbulence model. Two cases were studied. The firstcase was for the change of the rear wing’s angle of attackfrom 0∘ to 20∘, which corresponds to a scenario in whichan additional downforce needs to be generated by the carbody to improve the car’s handling. The second case wasfor the change of the angle of attack from 0∘ to 50∘, whichsignificantly increases not only the downforce but also thedrag force by raising the frontal area of the car by 14%, whichis beneficial during braking maneuvers. The most importantdifference between those two cases is that for the change of theangle of attack to 20∘, the flow only slightly adjusts to the neworientation of the rear wing, whereas for the case in which theangle of attack is changed to 50∘, the flow separates from the
wing right at its tip, which creates a separation zone behindit.
The 1:1 scale model of the Honda del Sol was studiedwithin the flow field of the velocity equal to 40m/s. Thedomain used in the CFD calculations is presented in Fig-ure 10(a), whereas a close-up of the car itself can be seenin Figure 10(b). The mesh consisted of 11 million tetrahedralelements.The use of the symmetry boundary condition madeit possible to perform the calculations only on half of thegeometry and thus reduce the total number of elements. Tomake it possible to change the rear wing’s angle of attack, thewhole wing together with the side plate was placed insidea cylinder. The cylinder was connected with the rest of thecomputational domain via a sliding interface. To enable theuse of this kind of interface, the rear wing could not includeany elements directly connected with the car body. For thisreason, the rear wing’s mounting was not included in themodel. However, the mountings designed for the test carhad a “swan shape”, which minimized their influence on thedownforce generated on the wing, and their omission fromthe CFD model should not lead to significant discrepancies.
The change of the rear wing’s angle of attack over timeis depicted in Figures 11(a) and 11(b), the angular velocity ofthe wing’s rotation is the same for both studied cases, whichresults in the wing reaching an angle equal to 20∘ in 0.1 s

8 Journal of Advanced Transportation
(a) (b)
(c) (d)
0
20
40
60
Ang
le o
f atta
ck[∘]
0.0 0.2 0.4 0.6 0.8Time [s]
wing moved to 50∘
wing moved to 20∘
−1.15
−0.90
−0.65
−0.40
Lift
coeffi
cien
t
0.2 0.4 0.6 0.80.0Time [s]
0
20
40
60
Ang
le o
f atta
ck[∘]
0.0 0.2 0.4 0.6 0.8Time [s]
0.30
0.55
0.80
1.05
Dra
g co
effici
ent
0.2 0.4 0.6 0.80.0Time [s]
wing moved to 50∘
wing moved to 20∘
Figure 11: (a), (b) Plots of the rear wing’s angle of attack. (c) The characteristics of the lift coefficient over time. (d) The characteristics of thedrag coefficient over time.
0 40 79
(a)
0 40 79
(b)
0 40 79
(c)
0 40 79
(d)
Figure 12: Contours of the velocity in the symmetry plane while the wing is moved to 20∘ at the following time frames: (a) 0.25 s, (b) 0.35 s,(c) 0.40 s, and (d) 0.45 s.
whereas it takes another 0.15 s for it to rotate up to 50∘. Thecharacteristics of the lift coefficient and the drag coefficient(see Figures 11(c) and 11(d)) are the same until 0.35 s, which isthe time frame when the wing which was rotated to 20∘ stopsmoving and the flow conditions for this case stops changing,whereas for the other case, the wing stops rotating at 0.50s. In both cases, it takes approximately 0.5 s after the wingstops moving for the flow to fully adapt. It should be notedthat, due to the unsteady phenomena, the peak of the absolutevalues of the lift coefficient as well as the drag coefficient arehigher than when the flow settles down, which means thatwith the fast movement of the active aerodynamic elementsit is possible to generate an additional aerodynamic force,although only for a very short duration.
The flow features during the different time frames forboth of the studied cases are presented in Figures 12 and 13,where it can be seen that the flow only needs to slightly adaptwhen the wing is set to 20∘, whereas after rotation to 50∘ arecirculation zone is formed behind it and the flow featureschange significantly. It should also be noticed that there isa spoiler underneath the wing which is redirecting the flowtowards it and makes it possible for the air to “stick” to it athigher angles of attack reaching up to 20∘.
The data presented above proves that the unsteadyphenomena must be taken into account in the controlmechanism of the active aerodynamic elements to accuratelypredict the aerodynamic load that the car body is subjectedto.

Journal of Advanced Transportation 9
0 40 79
(a)
0 40 79
(b)
0 40 79
(c)
0 40 79
(d)
Figure 13: Contours of the velocity in the symmetry plane while the wing is moved to 50∘ at the following time frames: (a) 0.25 s, (b) 0.50 s,(c) 0.55 s, and (d) 0.60 s.
Table 1: A comparison of the aerodynamic coefficient values for different variants of the tested car model.
Drag coefficient Lift coefficientBase model 0.506 −0.101Model with an active airbag 0.557 −0.212Model with an active airbag and side curtains 0.572 −0.312
3.5. Untypical Movable Add-Ons: Elastic Type of the ActiveAerodynamic Elements. Typically, rigid elements are usedas movable elements. The motion of such an element isachieved by electric servomechanisms with complicatedmechanical elements. A pneumatic system of actuation offlexible movable aerodynamic elements was considered. Onesuch solution is presented below.
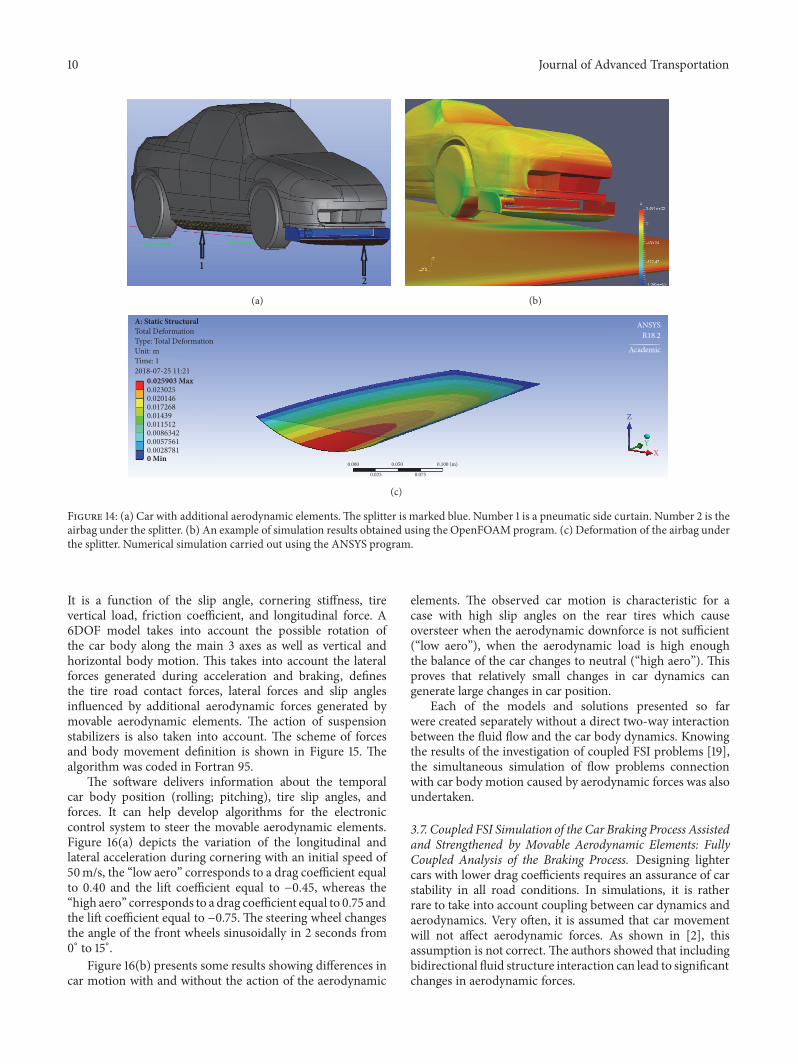
As described in previous sections of this paper, a rearwing can be used to generate aerodynamic forces, whereas thevalue of the force is dependent on the wing’s angle of attack. Adifferent kind of solution is also proposed in this study, whichincorporates the use of flexible deformable surfaces placed invarious locations on the vehicle. These deformable surfacescan have the form of airbags, which in an inactive state adhereclosely to the body of the vehicle, whereas in an active state(inflated) change their shape and at the same time modify theshape of the vehicle. Such a change in shape would changethe value of the aerodynamic forces acting on the car whiledriving. Controlling the shape of such surfaces consists ofsupplying compressed air to their interior, and so the materialof the airbag stretches and bulges. Once the air is released theelastic resilientmaterial returns to its original shape, adheringto the car’s body.The vehicle model tested was equipped witha splitter partially blocking the inflow of air under the car.Themain deformable element used was an airbag placed underthe splitter. Additionally, to increase its efficiency, deformableside curtains were used [14], whose task was to block theinflow of air under the car from the outside, i.e., from theexternal environment (see Figure 14(a)).
It was assumed that compressed air would be used tocontrol the shape of the flexible aerodynamic elements witha much higher pressure when compared with the ambientpressure. Thanks to this, these elements would have a fixedshape, regardless of the speed at which the car moves. Todetermine the shape that the inflated pneumatic side curtainsand the airbag under the splitter would take, FEM numericsimulation was performed using the ANSYS software. Thesurface of the deformable elements was loaded with air at
constant pressure, under which they assumed the targetshape (see Figure 14(b)). It was assumed that the shapechanges associated with the dynamic pressure acting on theseelements are negligibly small. The values of the forces andaerodynamic coefficients acting on the car were obtained bymeans of CFD based numerical simulation using the Open-FOAM software (see Figure 14(c)). The results obtained (seeTable 1) confirm the possibility of using flexible deformableelements attached to the car to control the value of thedownforce acting on it.
To prepare an appropriate algorithm to control theposition of aerodynamic movable elements, it is necessary topredict the way these elements change the motion of a carequipped with such elements. To perform such tests, separatesoftware modeling the dynamics of the car influenced byadditional aerodynamic elements was designed.
3.6. Numerical Simulation of Car Dynamics Influenced by theActive Aerodynamic Elements. On the one hand, road testdata are the deciding data but, on the other hand, the cardynamics are influenced by a lot of unpredictable factorssuch as tire pressure and temperature, mistakes in suspensiongeometry, side wind, road inclination, predisposition of thedriver, etc. Therefore, independent software for car dynamicanalysis was developed and validated by comparison withknown solutions [15–17].
Information about the aerodynamic characteristics ofthe car body had to be transferred to the car dynamicanalysis software to check the influence of the proposedmodifications. The intention was to have the model with allmechanical coefficients precisely defined and check the car’sreaction only for the chosen parameters.
The 6DOF (six degrees of freedom) car dynamic modelthat was developed employed the Segel model of lateral forcesgenerated by the tire [17, 18]. This model is relatively old(it was developed in the early 1970s). However, the Segelmodel is fairly easy to use and useful for the planned tests.
10 Journal of Advanced Transportation
(a) (b)
A: Static StructuralTotal DeformationType: Total DeformationUnit: mTime: 12018-07-25 11:21
0.000
0.025
0.050
0.075
0.100 (m)
ANSYSR18.2
Academic
0.025903 Max0.0230250.0201460.0172680.014390.0115120.00863420.00575610.00287810 Min
Z
YX
(c)
Figure 14: (a) Car with additional aerodynamic elements.The splitter is marked blue. Number 1 is a pneumatic side curtain. Number 2 is theairbag under the splitter. (b) An example of simulation results obtained using the OpenFOAMprogram. (c) Deformation of the airbag underthe splitter. Numerical simulation carried out using the ANSYS program.
It is a function of the slip angle, cornering stiffness, tirevertical load, friction coefficient, and longitudinal force. A6DOF model takes into account the possible rotation ofthe car body along the main 3 axes as well as vertical andhorizontal body motion. This takes into account the lateralforces generated during acceleration and braking, definesthe tire road contact forces, lateral forces and slip anglesinfluenced by additional aerodynamic forces generated bymovable aerodynamic elements. The action of suspensionstabilizers is also taken into account. The scheme of forcesand body movement definition is shown in Figure 15. Thealgorithm was coded in Fortran 95.
The software delivers information about the temporalcar body position (rolling; pitching), tire slip angles, andforces. It can help develop algorithms for the electroniccontrol system to steer the movable aerodynamic elements.Figure 16(a) depicts the variation of the longitudinal andlateral acceleration during cornering with an initial speed of50m/s, the “low aero” corresponds to a drag coefficient equalto 0.40 and the lift coefficient equal to −0.45, whereas the“high aero” corresponds to a drag coefficient equal to 0.75 andthe lift coefficient equal to −0.75. The steering wheel changesthe angle of the front wheels sinusoidally in 2 seconds from0∘ to 15∘.
Figure 16(b) presents some results showing differences incar motion with and without the action of the aerodynamic
elements. The observed car motion is characteristic for acase with high slip angles on the rear tires which causeoversteer when the aerodynamic downforce is not sufficient(“low aero”), when the aerodynamic load is high enoughthe balance of the car changes to neutral (“high aero”). Thisproves that relatively small changes in car dynamics cangenerate large changes in car position.
Each of the models and solutions presented so farwere created separately without a direct two-way interactionbetween the fluid flow and the car body dynamics. Knowingthe results of the investigation of coupled FSI problems [19],the simultaneous simulation of flow problems connectionwith car body motion caused by aerodynamic forces was alsoundertaken.
3.7. Coupled FSI Simulation of the Car Braking Process Assistedand Strengthened by Movable Aerodynamic Elements: FullyCoupled Analysis of the Braking Process. Designing lightercars with lower drag coefficients requires an assurance of carstability in all road conditions. In simulations, it is ratherrare to take into account coupling between car dynamics andaerodynamics. Very often, it is assumed that car movementwill not affect aerodynamic forces. As shown in [2], thisassumption is not correct. The authors showed that includingbidirectional fluid structure interaction can lead to significantchanges in aerodynamic forces.

Journal of Advanced Transportation 11
z
y
y
x
x
FL
Ff:F
:L
:f
Ef
Er
Er
Ef0fF
4fF
.fF
0fL
4fL
.fL
0LL
0LF
4LL .LL
0fF=E@ TfF
0fL=E@ T@L0LL=EL TLL0LF=EL TLF
4LF
.LF
B=AB/2
!?LI z!?LI x
!?LI y
Figure 15: Scheme of forces and body movement definition.
Longitudinal and lateral acceleration
−7.5
−5
−2.5
0
2.5
5
7.5
Acce
lera
tion[G
/M2]
2 4 6 8 100Time [s]
lat. high aerolat. low aero
long. high aerolong. low aero
(a)
Car position
50 100 150 200 250 3000x [m]
0
50
100
150
200
250
y [m
]
high aerolow aero
(b)
Figure 16: (a) Variation of the longitudinal and lateral acceleration during cornering. (b) Car position influenced by the aerodynamic forces.
Thephysics is complicated during the car braking process.A braking car generates a transfer of load to the front axis (seeFigure 17), pressing the suspension springs and changing theinclination of the body resulting in a change of aerodynamicforces. During braking, the car slows down and this reducesthe aerodynamic forces again thus changing the car bodyposition. This is a fully coupled FSI process which had to bemodeled and simulated.
In the case of braking (or accelerating), the car bodypitches due to the elastic suspension system and the actinginertia forces. The pitch angle can be treated as an angleof attack for the car body. At the same time, the clearance
between the car and the ground also changes. Figure 17illustrates the possible configurations. This situation causesa change in the pressure distribution over the entire body.Furthermore, a change in pressure distribution affects thepitch angle and clearance. In other words, there is a strongcoupling between the car behavior and the aerodynamicforces.
In this research, fully coupled analyses were performedto check if it is possible to predict car dynamic behaviorduring braking. The obtained results were validated againsta full car experiment as described in Section 3.3. Currently,very few of the published papers refer to a fully coupled

12 Journal of Advanced Transportation
Figure 17: Pitching of the car body due to the elastic suspension system during braking or acceleration.
Matlab
Fluent
Matlab
MSC.Adams
Start
Velocities
CG position
Run one time stepAero Forces
& Moments
Run one time step
Figure 18: Scheme of the connections of the programs and exchange of data.
car analysis in which the vehicle speed significantly variesover time (such as during the acceleration/braking pro-cess). The method presented in this study to simulate thebraking process utilizes a combination of high-end softwarefor CFD modeling (Ansys� FLUENT�), vehicle dynamics(MSC.ADAMS/Car�), and a block diagram environment formultidomain simulation (MATLAB/Simulink�) which actsas an interface to exchange data between the first two tools. Toallow communication with FLUENT�, it is launched in “as-a-server” mode.This option creates a COMport which enablesremote connection to and control of FLUENT� sessions froman external application. Connection to MSC.ADAMS� isachieved via the “Adams Plant” option. On the Matlab side,dedicated Level 2 S-Functions were created. These functionsare responsible for driving the CFD and dynamics analyses.The data workflow is presented in Figure 18.
The coupling procedure was validated against the windtunnel experimental data. In this case self-excited vibrationof square beam in crossflow was used. The set-up of the teststand is presented in Figure 11(a). Corresponding modelswere built for CFD and dynamic analyses (Figure 11(b)). Theobtained results show that frequency and amplitude werecaptured with a high level of accuracy. With a validatedcoupling mechanism and the selected turbulence model – k-𝜔 SST – which assures a good correlation to the wind tunnel
(see Section 3.3), a coupled analysis of the full car dynamicswas performed.
During the research, it was concluded that the referenceframe needed to be changed to simulate velocity changein the CFD analysis. Instead of a classical reference framewith an observer at rest, the reference frame with a movingobserver was used. In this case, the whole computationaldomain was moved during the analysis with velocity whichvaries over time. The car instantaneous speed is calculatedusing MSC.Adams/Car�. The overset mesh was used to allowthe movement of the car body and additional aerodynamicssurfaces.The split into subdomains was performed accordingto elements which can be moved independently (car body,wheels, and rear airfoil). Based on the grid convergence study,for the steady state case, the hybrid hexa/polyhedra meshused contained 7.7 million elements. Flow symmetry wasassumed and a half car model was used. The analysis wasperformed in double precision, and the second-order spatialdiscretization schemes were used. The full car MSC.Adams�dynamic model (Figure 19) was fed with the measured data:suspension stiffness and damping nonlinear characteristics.
Mass properties were estimated based on “Measuredvehicle inertial parameters” by NHTSA [20]. Friction coef-ficient between the tires and the road was set to 0.71 whichcorresponds to dry road conditions and is in line with the

Journal of Advanced Transportation 13
Table 2: A comparison of the numerical and experimental data.
Value Unit Experiment Analysis Difference %Traveled Distance m 111 112 1 0.90Time to Stop s 5.34 5.29 0.05 −0.94Max Deceleration g 1.0 0.95 0.05 −5
post_brake Time= 0.4200 Frame=030
zxy
Figure 19: MSC.Adams/Car model used in the analysis.
Jones and Childers report [21].The initial velocity for brakingwas 40.31m/s (145 km/h). Based on [15], it was assumed that0.5 s is needed to achieve full braking torque after the decisionfor emergency braking. The rear airfoil in the investigatedconfiguration was in position “zero”. Figure 20(a) shows thepressure distribution on the car body and the isosurface ofQ-Criterion colored with velocity magnitude at the startingpoint for braking.
The obtained braking characteristics presented in Fig-ure 21 show a good agreement between the numericalprediction and the experimental data. The discrepancy inthe traveled distance and time to stop is less than 1%.The mismatch in maximum deceleration is 5%. However,this value can be affected by the irregular shape of theexperimental characteristic. A summary of the results ispresented in Table 2.
The current research activities also focused on corneringanalysis. The aim of this part of the study was to check theimpact of aerodynamic configuration on cornering criticalspeed. It was necessary to switch the reference frame to amoving observer. With such an approach it was possible tosimulate cornering and take into account all car movementsassociated with this maneuver. Figure 20(b) presents theinitial CFD solution for quasi steady condition. It is clearlyvisible that flow symmetry is broken, especially on the rearpart of the car body.
4. Road Tests
The final part of the presented study includes real vehicleroad tests performed on a Honda CRX del Sol with somecustom modifications. The test took place on a trainingtrack which was suitable for evaluating how the designedactive control system can enhance emergency car maneuversthat sometimes need to be performed while driving on cityroads. The radius of the curves and the length of the longeststraight were insufficient to test the scenarios of emergencymaneuvers during a very high-speed drive which could occur
on a highway. It should be noted that the aerodynamic forcesaiding the drive were limited by the fact that lower rangesof speed were achieved during the tests. The test car wasdriven by an experienced rally driver, Arkadiusz Nowikow,whose driving technique made it possible to complete alltest scenarios in a highly repetitive manner. He also gaveinvaluable insight about the car’s handling and its changewith different aerodynamics and suspension settings. Thepassenger of the car who was also the operator of the controlsystem when it was tested in semiautomatic mode was asource of information about the driving comfort. In this way,the data acquired by the sensors was enriched by subjectivehuman experiences.
The active aerodynamic elements mounted on the rearside of the test car can be seen in Figure 22. They includea pair of moving wings and spoilers which can work inde-pendently and enable an asymmetrical configuration to beset. The active suspension and the aerodynamics play animportant role in the distribution of force while the vehicleis moving. The system described in Section 2 was developedand thoroughly tested. Part of the data acquired is presentedbelow.
With known values of the aerodynamic forces, whichdepend on the flow around the vehicle and knowledge ofthe vehicle dynamics, a set of track tests was conducted.The control and acquisition system was tested by means ofactive aerodynamic and suspension control for predefinedscenarios, as well as being controlled, in a dynamic way,by software algorithms. Several different scenarios wereexecuted during the track tests which included rapid braking,slalom and tight turns. For a braking scenario, detection ofthe braking pedal being pushed was the onset value of theaerodynamic brake activation, the rear wing and spoilerswere set to the maximum angle of attack to maximize dragproduced by the car body. Slalom involved slight adjustmentsof the rear wings that could be undertaken in split secondsbefore the turning direction was changed to the other side.For the scenario of driving into a tight curve, the systemwas activated when the values of the side (Y component)acceleration (see Figure 23) as well as the angular positionof the steering wheel exceeded predetermined values. In thiscase, the active aerodynamic elements were configured tomaximize the downforce on the car’s side closer to the insideof the curve, whereas the aerodynamic properties of the otherside of the car remained neutral. Additionally, the suspensionon the outer side was stiffened to limit the negative effectscaused by body roll.
A comparison of two configurations is presented inFigure 24 and Figure S1. The red color is data for the con-figuration with active aerodynamics and active suspensionturned on, whereas the blue data is for static positions of the

14 Journal of Advanced Transportation
0 1 (m)
(a) (b)
Figure 20: (a) Starting point for braking analysis. Car body colored with static pressure and iso-surface of Q-Criterion colored with velocitymagnitude. (b) Initial CFD results for cornering analysis. Streamlines colored with velocity magnitude (upper) and static.
Velocity & Traveled Distance
ExperimentAnalysis
AccelerationDist
ance
Velocity
−1.2
−1.0
−0.8
−0.6
−0.4
−0.2
0.0
0.2
Acc
eler
atio
n [g
]
0.2 0.4 0.6 0.8 1.0 1.2 1.40.0Time [s]
05
1015202530354045
Velo
city
[m/s
]
1 2 3 4 5 60Time [s]
0153045607590105120135
Trav
eled
Dist
ance
[m]
ExperimentAnalysis
Figure 21: A comparison of the data from the simulations and the road tests.
RwLw
Ls Rs
Figure 22: Snapshot from a test drive with the active aerodynamics deployed, where Lw/Rw – active left/right wing, Ls/Rs – active left/rightspoiler.

Journal of Advanced Transportation 15
Time [s]
10
7.5
5
2.5
0
−2.5
−5
−7.5
−1020 30 40 50 60
X component of acceleration
Y component of acceleration
Z component of acceleration
Acce
lera
tion
[m/(M2
)]
Figure 23: Set of data obtained from acquisition system, vehicle acceleration plot.
aerodynamic surfaces. Selected data, such as speed, lateralacceleration, steering wheel position and suspension deflec-tion is presented in Figure 24, whereas the data presented inFigure S1 is supplemented by the GPS position noted on themap. Moreover, the gathered data also included informationabout throttle, braking, pitch, yaw and roll angles, as wellas settings of the suspension stiffness and the aerodynamicsurfaces configurations.
The data obtained from the tests made it possible toverify all of the preceding stages of the work. The track testcan specify those points where, for example, the theoreticalassumptions, the road conditions (roughness) and wind tun-nel results were not enough to maintain a steady equilibriumand the assumed conditions. In Figure 24(b), it can be seenthat, for the red line, the Y component of acceleration changeshave an oscillatory character, which means that the car’ssuspension is at its limit. In other words, the car is moving inthemanner of small jumps in a direction perpendicular to thedriving direction. Moreover, it is clearly noticeable that thereis a difference in the velocity reached at the fastest corner,with the configuration using active aerodynamics having thehighest velocity.
5. Conclusions
The realization of the optimal design of the geometry andcontrol system of movable aerodynamic devices increasingthe safety of fast moving cars requires multidisciplinarysynchronized action correlating the weak and strong pointsof the considered solutions.
This paper presented a range of methods of modeling andsimulating different aspects of controlling car aerodynamiccharacteristics by actuating movable aerodynamic adds-onon the car body to increase the traction, braking and lateralforce in road conditions requiring such action. The reaction
time required by the flow structure to change after a changeof the car body geometry is an important factor. On theone hand, mechanical elements require fast movement buton the other hand the flow around the car body needs timeto accommodate the new flow conditions. Different physicalprocesses exist simultaneously in the considered problemand, especially, FSI problems required the use of differentsoftware for modeling and simulation.
The synchronized action of specialists in unsteady flowsimulations, flexible material FSI simulations, car dynamicsimulations, coupled FSI car aerodynamics and car dynamics,experimental tests in wind tunnel, and road tests can lead toa solution of electronically controlled movable aerodynamicelements activated and controlled in a manner to extend thedriving limits of fast cars.
Data Availability
Data in the formof figures and tables that support the findingsof the numerical calculations presented in this study areincluded within the article. Data acquired during the tracktests are included within the article as well as within thesupplementary information files.
Conflicts of Interest
The authors declare that they have no conflicts of interest.
Acknowledgments
Theproject was financed by the National Center for Researchand Development (Narodowe Centrum Badan i Rozwoju) aspart of the project entitled “The Active System of Car BodyOscillation Damping”, Grant no. PBS3/B6/34/2015.

16 Journal of Advanced Transportation
0 10 20 30 40 50Time [s]
0
5
10
15
20
25
30Sp
eed
[m/s
]
Active aerodynamics and active damping turned onActive aerodynamics and active damping turned off
(a)
20 30 40 50Time [s]
−10
−7.5
−5
−2.5
0
2.5
5
7.5
10
Active aerodynamics and active damping turned onActive aerodynamics and active damping turned off
Y ac
cele
ratio
n [m
/(M2
)]
(b)
20 30 40 50Time [s]
−1
−0.75
−0.5
−0.25
0
0.25
0.5
Nor
mal
ized
stee
ring
whe
el p
ositi
on
Active aerodynamics and active damping turned onActive aerodynamics and active damping turned off
(c)
20 30 40 50Time [s]
−60
−40
−20
0
20
40
60
Rear
righ
t sus
pens
ion
defle
ctio
n [m
m]
Active aerodynamics and active damping turned onActive aerodynamics and active damping turned off
(d)
Figure 24: (a) Speed. (b) Lateral acceleration.The suspension instability is marked with a circled area. (c) Steering wheel position. (d) Rearright suspension deflection. The differences in the deflections are marked with a circled area.
Supplementary Materials
The supplementary material consists of a movie called“track test data.mp4” which is sample data acquired duringthe track test drive; one time frame from this movie ispresented in Figure S1. The movie contains plots of such dataas speed, lateral acceleration, steering wheel position, andsuspension deflection, matched with the car’s position on thetest track. (Supplementary Materials)
References
[1] ISO 12021:2010, Road Vehicles – Sensitivity to Lateral Wind– Open-Loop Test Method Using Wind Generator Input, 2010,https://www.iso.org/standard/53602.html.
[2] D. C. Forbes, G. J. Page, M. A. Passmore, and A. P. Gaylard, “AFully Coupled, 6 Degree-of-Freedom, Aerodynamic and Vehi-cle Handling Crosswind Simulation using the DrivAer Model,”SAE International Journal of Passenger Cars—Mechanical Sys-tems, vol. 9, no. 2, 2016.
[3] G. Wahl, “918 Spyder – the impulse source for future sports carconcepts,” in Proceedings of the 5th International MunichChassisSymposium 2014, pp. 35–56, Springer Fachmedien, Wiesbaden,Germany, 2014.
[4] A. Eskandarian, Handbook of Intelligent Vehicles, Springer,2012, https://scholar.google.pl/scholar?hl=pl&as sdt=0%2C5&q=%22Handbook+of+Intelligent+Vehicles%22+Azim+Eskan-darian&btnG=.
[5] W. Jarisa, “FUTURE TECHNOLOGY – Road condition clas-sification using information fusion,” in Proceedings of the 7thInternational Munich Chassis Symposium 2016, pp. 939–957,Springer Fachmedien, Wiesbaden, Germany, 2017.
[6] X. Qu, F. Yu, and S. Zhao, “Research on Curve Safety SpeedWarning for Vehicle with Risk Prediction,” in Proceedings ofSAE-China Congress 2016: Selected Papers, vol. 418 of LectureNotes in Electrical Engineering, pp. 431–445, Springer, Singapore,2017.
[7] M. Fainello, “Optimizing passive vehicle dynamics for activesafety and autonomous driving,” in Proceedings of the 8thInternational Munich Chassis Symposium 2017, pp. 243–251,Springer Fachmedien, Wiesbaden, Germany, 2017.

Journal of Advanced Transportation 17
[8] H. Beglerovic, A. Ravi, N. Wikstrom, H. Koegeler, A. Leitner,and J. Holzinger, “Model-based safety validation of the auto-mated driving functio highway pilot,” in Proceedings of the 8thInternational Munich Chassis Symposium 2017, pp. 309–329,Springer Fachmedien, Wiesbaden, 2017.
[9] M. Abramowicz, K. Kamieniecki, A. Piechna, and P. Rubach,“Using ANSYS and SORCER Modeling Framework for theOptimization of the Design of a Flapping Wing Bionic Object,”Mach. Dyn. Res, vol. 39, pp. 21–36, 2015.
[10] J. Katz, Race Car Aerodynamics: Designing for Speed, Bentley(Robert) Inc, Cambridge, UK, 2nd edition, 1996.
[11] F. R. Menter, “Two-equation eddy-viscosity turbulence modelsfor engineering applications,” AIAA Journal, vol. 32, no. 8, pp.1598–1605, 1994.
[12] C. Fu, M. Uddin, and A. C. Robinson, “Turbulence modelingeffects on the CFD predictions of flow over a NASCAR Gen 6racecar,” Journal of Wind Engineering & Industrial Aerodynam-ics, vol. 176, pp. 98–111, 2018.
[13] J. Katz, Automotive Aerodynamics, Wiley, 2016.[14] J. Piechna, T. Janson, P. Sadowski, S. Tudruj, A. Piechna, and
L. Rudniak, “Numerical study of aerodynamic characteristicsof sports car with movable flaps and deformable airbags,” inProceedings of the Automotive Simulation World Congress, 2013.
[15] M. Mitschke, Car Dynamics, Transport and CommunicationPublishers, 1st edition, 1977.
[16] M. Guiggiani,The Science of Vehicle Dynamics: Handling, Brak-ing, and Ride of Road and Race Cars, Springer, the Netherlands,2014.
[17] G. Genta, Motor vehicle dynamics: modeling and simulation,World Scientific, 1997.
[18] R. Rajamani, Vehicle Dynamics and Control, Springer US,Boston, Mass, USA, 2012.
[19] T. Janson and J. Piechna, “Numerical Analysis of AerodynamicCharacteristics of a of High-Speed Car With Movable Body-work Elements,” Archive of Mechanical Engineering, vol. 62, no.4, pp. 451–476, 2015.
[20] G. J. Heydinger, R. A. Bixel, W. R. Garrott, M. Pyne, J. G. Howe,and D. A. Guenther, “Measured Vehicle Inertial Parameters-NHTSA’s Data Through November 1998,” in Proceedings of theInternational Congress & Exposition, pp. 10–4271, 1999.
[21] E. R. Jones and R. L. Childers, Contemporary College Physics,McGraw Hill, 2001.

International Journal of
AerospaceEngineeringHindawiwww.hindawi.com Volume 2018
RoboticsJournal of
Hindawiwww.hindawi.com Volume 2018
Hindawiwww.hindawi.com Volume 2018
Active and Passive Electronic Components
VLSI Design
Hindawiwww.hindawi.com Volume 2018
Hindawiwww.hindawi.com Volume 2018
Shock and Vibration
Hindawiwww.hindawi.com Volume 2018
Civil EngineeringAdvances in
Acoustics and VibrationAdvances in
Hindawiwww.hindawi.com Volume 2018
Hindawiwww.hindawi.com Volume 2018
Electrical and Computer Engineering
Journal of
Advances inOptoElectronics
Hindawiwww.hindawi.com
Volume 2018
Hindawi Publishing Corporation http://www.hindawi.com Volume 2013Hindawiwww.hindawi.com
The Scientific World Journal
Volume 2018
Control Scienceand Engineering
Journal of
Hindawiwww.hindawi.com Volume 2018
Hindawiwww.hindawi.com
Journal ofEngineeringVolume 2018
SensorsJournal of
Hindawiwww.hindawi.com Volume 2018
International Journal of
RotatingMachinery
Hindawiwww.hindawi.com Volume 2018
Modelling &Simulationin EngineeringHindawiwww.hindawi.com Volume 2018
Hindawiwww.hindawi.com Volume 2018
Chemical EngineeringInternational Journal of Antennas and
Propagation
International Journal of
Hindawiwww.hindawi.com Volume 2018
Hindawiwww.hindawi.com Volume 2018
Navigation and Observation
International Journal of
Hindawi
www.hindawi.com Volume 2018
Advances in
Multimedia
Submit your manuscripts atwww.hindawi.com