advanced micro-grid energy management coupled … needed, and completing and reviewing this...
TRANSCRIPT

(EW-201147)
Advanced Micro-Grid Energy Management Coupled with Integrated Volt/VAR Control for Improved Energy Efficiency, Energy Security, and Power Quality at DoD Installations October 2016
This document has been cleared for public release; Distribution Statement A

Page Intentionally Left Blank

This report was prepared under contract to the Department of Defense Environmental Security Technology Certification Program (ESTCP). The publication of this report does not indicate endorsement by the Department of Defense, nor should the contents be construed as reflecting the official policy or position of the Department of Defense. Reference herein to any specific commercial product, process, or service by trade name, trademark, manufacturer, or otherwise, does not necessarily constitute or imply its endorsement, recommendation, or favoring by the Department of Defense.

Page Intentionally Left Blank

REPORT DOCUMENTATION PAGE Form Approved OMB No. 0704-0188
Public reporting burden for this collection of information is estimated to average 1 hour per response, including the time for reviewing instructions, searching existing data sources, gathering and maintaining the data needed, and completing and reviewing this collection of information. Send comments regarding this burden estimate or any other aspect of this collection of information, including suggestions for reducing this burden to Department of Defense, Washington Headquarters Services, Directorate for Information Operations and Reports (0704-0188), 1215 Jefferson Davis Highway, Suite 1204, Arlington, VA 22202-4302. Respondents should be aware that notwithstanding any other provision of law, no person shall be subject to any penalty for failing to comply with a collection of information if it does not display a currently valid OMB control number. PLEASE DO NOT RETURN YOUR FORM TO THE ABOVE ADDRESS. 1. REPORT DATE (DD-MM-YYYY)10-28-2016
2. REPORT TYPECost and Performance Report
3. DATES COVERED (From - To)2012 to Oct 2016
4. TITLE AND SUBTITLE 5a. CONTRACT NUMBER W912HQ-12-C-0002 5b. GRANT NUMBER
Advanced Micro-Grid Energy Management Coupled with Integrated Volt/VAR Control for Improved Energy Efficiency, Energy Security, and Power Quality at DoD Installations
5c. PROGRAM ELEMENT NUMBER
6. AUTHOR(S)
5d. PROJECT NUMBER ESTCP EW-201147
Herman Wiegman Styliani Ioanna Kampezidou
5e. TASK NUMBER
Matthias Nikolakopulos
5f. WORK UNIT NUMBER
7. PERFORMING ORGANIZATION NAME(S) AND ADDRESS(ES)
8. PERFORMING ORGANIZATION REPORTNUMBER
GE Global Research 1 Research Cir Niskayuna NY 12309
232524 – Final Report
9. SPONSORING / MONITORING AGENCY NAME(S) AND ADDRESS(ES) 10. SPONSOR/MONITOR’S ACRONYM(S)ESTCP
ESTCP Energy & Water Program 11. SPONSOR/MONITOR’S REPORT4800 Mark Center Drive NUMBER(S)Alexandria, VA 22305-3605 12. DISTRIBUTION / AVAILABILITY STATEMENT
Available for public release; distribution unlimited
13. SUPPLEMENTARY NOTES
14. ABSTRACTThis demonstration program focused on methods to reduce peak electric power and electric energy consumption through Conservation Voltage Reduction (CVR) techniques. The first 2 years of efforts focused on advancing the IVVC technology. The later years of the project focused on building level voltage control, via Electronic Voltage Regulators (EVR’s). The process of confirming peak power reductions and energy savings from voltage adjustments was tedious and resulted in less than expected savings. The building level voltage control equipment was not financially viable, and the alternative of manual adjustment of existing transformer tap settings was determined to be more cost effective than EVR technology. Additional observations about the migration of most electrical loads toward constant power characteristics also erodes savings potentials.
15. SUBJECT TERMSConservation Voltage Reduction, Energy Conservation, Peak Power Reduction, Voltage Control
16. SECURITY CLASSIFICATION OF: 17. LIMITATIONOF ABSTRACT
18. NUMBEROF PAGES
19a. NAME OF RESPONSIBLE PERSON Herman Wiegman
a. REPORT b. ABSTRACT c. THIS PAGE 19b. TELEPHONE NUMBER (include areacode)518-387-7527 Standard Form 298 (Rev. 8-98)
Prescribed by ANSI Std. Z39.18
48

i
COST & PERFORMANCE REPORT Project: EW-201147
TABLE OF CONTENTS
Page
EXECUTIVE SUMMARY ...................................................................................................... ES-1 1.0 INTRODUCTION ................................................................................................................. 1
1.1 BACKGROUND ............................................................................................................ 1 1.2 OBJECTIVE OF THE DEMONSTRATION ................................................................ 1 1.3 REGULATORY DRIVERS ........................................................................................... 2
2.0 TECHNOLOGY DESCRIPTION ......................................................................................... 3 2.1 TECHNOLOGY OVERVIEW ...................................................................................... 3
2.1.1 Electrical Load Modeling ................................................................................................ 3 2.1.2 Conservation Voltage Reduction ..................................................................................... 3 2.1.3 Building Level Voltage control ....................................................................................... 5
2.2 ADVANTAGES AND LIMITATIONS OF THE TECHNOLOGY ............................. 5 3.0 PERFORMANCE OBJECTIVES ......................................................................................... 7
3.1.1 Optional Quantitative Performance Objectives ............................................................... 7 4.0 FACILITY/SITE DESCRIPTION ......................................................................................... 9
4.1 FACILITY/SITE LOCATION AND OPERATIONS ................................................... 9 4.2 FACILITY/SITE CONDITIONS ................................................................................. 10
5.0 TEST DESIGN .................................................................................................................... 13 5.1 CONCEPTUAL TEST DESIGN ................................................................................. 13
5.1.1 Peak Power Reduction Experiments .............................................................................. 13 5.1.2 Energy Consumption Reduction Experiments ............................................................... 13
5.2 BASELINE CHARACTERIZATION ......................................................................... 13 5.2.1 Peak Power Reduction Experiments .............................................................................. 13 5.2.2 Energy Consumption Reduction Experiments ............................................................... 14 5.2.3 Energy-CVR Model Performance ................................................................................. 14 5.2.4 Results Explanation ....................................................................................................... 16
5.3 DESIGN AND LAYOUT OF TECHNOLOGY COMPONENTS .............................. 16 5.4 OPERATIONAL TESTING ........................................................................................ 18 5.5 SAMPLING PROTOCOL ........................................................................................... 18 5.6 SAMPLING RESULTS ............................................................................................... 18
6.0 PERFORMANCE ASSESSMENT ..................................................................................... 21 6.1 PEAK POWER REDUCTION .................................................................................... 21 6.2 ENERGY CONSUMPTION REDUCTION ................................................................ 23
7.0 COST ASSESSMENT ......................................................................................................... 25 7.1 COST MODEL ............................................................................................................. 25

TABLE OF CONTENTS (Continued)
Page
ii
7.2 COST ANALYSIS AND COMPARISON .................................................................. 26 7.2.1 COST ASSESSMENT .................................................................................................. 26 7.2.2 Benefit Assessment ........................................................................................................ 27
8.0 IMPLEMENTATION ISSUES ........................................................................................... 29 9.0 REFERENCES .................................................................................................................... 31 APPENDIX A POINTS OF CONTACT ................................................................................ A-1

iii
LIST OF FIGURES
Page
Figure 1. Lamp Type Power-Voltage Profiles from EPRI Report [6] ........................................ 3 Figure 2. Peak Load Reduction from CVR for Two Conditions [10] ........................................ 4 Figure 3. Example Electrical Loads and Their Power and Energy Characteristics vs. Applied
Voltage, Dependent upon Load Type and Control Methodology. .............................. 4 Figure 4. Two Examples Where a Building Level EVR Regulates the Voltage, Given Two
Different MV Distribution Circuit Conditions. ........................................................... 5 Figure 5. Photo of Equipment Garages with Rooftop Solar Installations at MCAGCC in Twenty–
nine Palms, CA Showing Pole Mounted 12.5kV AC Distribution Network. ............. 9 Figure 6. Photo of the Selected Building at the MCAGCC in CMU Twenty–nine Palms. ...... 10 Figure 7. Photo Inside of the Electrical Room at Building B1588, Showing a 480-208V
Transformer Mounted to the Floor, and Electric Load Panels Mounted to the Wall. 11 Figure 8. Daily Normalized Average Energy Over 89 Days in 208V Circuit .......................... 15 Figure 9. Normalized Daily Average Energy Over 89 Days in 480V Circuit .......................... 16 Figure 10. Basic One-line Diagram for the Layout of the EVR in the Building. ....................... 17 Figure 11. The EVR device installed in the building, and the meter panel display. .................. 17 Figure 12. Installed Meters and Cellular Router for Data Retrieval. .......................................... 18 Figure 13. The Potentials in Both Circuits of the Building Over Five Months in 2016. ............ 19 Figure 14. EVR Output Voltage Settings During the Load Characterization Experiments on June
22, 2016. .................................................................................................................... 19 Figure 15. Plot of Delta-Power vs. Delta-Potential Data Points from the Load Characterization
Experiment. ............................................................................................................... 21 Figure 16. Plot of all Power vs. Potential Sampled Points Over the 1-Hour Load Characterization
Experiment Showing a 480V Circuit with CVR-Power Slope of 0.22, and a 208V Circuit with a CVR-Power Slope of 0.7. ................................................................... 22
Figure 17. Response of Power over Time Due to a Voltage Rise Applied to Three Types of Resistive Loads, Showing the Probable Closed Loop Response with Slow Feedback Loads within B1588. ................................................................................................. 23

iv
LIST OF TABLES
Page
Table 1. Comparison of Various Voltage Level Technologies ................................................... 6 Table 2. Performance Objectives ................................................................................................ 7 Table 3. 208V Circuit Model Coefficients and Error Performance for Normalized Model
Predictors from Equation (6). ..................................................................................... 14 Table 4. 208V Model Coefficients Significance Based on Standardized Model Predictors .... 14 Table 5. 480V Circuit Model Coefficients and Error Performance for Normalized Model
Predictors from Equation (7). ..................................................................................... 14 Table 6. 480V Model Coefficients Significance Based on Standardized Model Predictors .... 15 Table 7. CVR Power Factors for B1588 by Two Estimation Methods. ................................... 22 Table 8. CVR Energy Factor for B1588 (from normalized data) ............................................. 23 Table 9. Cost Model for Adding an EVR to a Brownfield Site. ............................................... 25 Table 10. Two Configuration Options for Achieving Voltage Adjustment. .............................. 26 Table 11. Two configuration options with equipment and labor cost estimates......................... 26 Table 12. Simple Cost and Benefit Assessment for Two Voltage Setting Strategies Applied to a
Building with 75kW Peak Power Consumption. ........................................................ 27

v
ACRONYMS AND ABBREVIATIONS
ANSI American Nation Standard Institute AVR Automatic Voltage Regulation CMU Concrete Masonry Unit CVR Conservation Voltage Reduction, a reduction in peak load and energy
consumption with reduced voltages based upon the load type DoD Department of Defense EPRI Electric Power Research Institute ESTCP Environmental Security Technology Certification Program EVR Electronic Voltage Regulator, a solid state tap changing device which can
regulate the output voltage to a set value HP Horse Power HV High Voltage, transmission level circuits at >69 kV IVVC Integrated Volt/VAR Control, the control of several VAR sources based on
their voltage measurements and knowledge of DER’s in the feeder network LTC Load Tap Changer, a transformer with load sensitive tap position MAPE Mean Absolute Percentage Error MCAGCC Marine Corps Air Ground Combat Center MV Medium Voltage, distribution circuits in the range of 1~ 69 kV RMS Root-Mean-Square SCE Sothern California Edison SCR Silicon Controlled Rectifier, used in AC circuits to commutate current VA Volt-Amp, units for apparent power VAR Volt-Amp Reactive, reactive power flow, either leading or lagging. VSF Variable spreading factor VVC Volt/VAR Control, the control of a switched VAR source (typically a
capacitor) based on local voltage measurements from the feeder. W Watts, units for real power

vi
Page Intentionally Left Blank

vii
ACKNOWLEDGEMENTS
The authors want to recognize John Comparetto, Gary Morrissett, and Clovis Vaughn at the Marine Corps Air Ground Combat Center for their valuable input, guidance and access to their facilities.
The authors want to thank Nicholas Judson at MIT Lincoln Laboratories for his keen insights and technical acumen during the review and assessment of this body of work.
The authors thank, Sumit Bose & David Wardwell at GE Global Research for their support.

viii
Page Intentionally Left Blank

ES-1
EXECUTIVE SUMMARY
This demonstration program focused on methods to reduce peak electric power and electric energy consumption through Conservation Voltage Reduction (CVR) techniques, specifically, through the application of building voltage regulating equipment.
OBJECTIVES
The demonstration project had two main objectives:
Reduce peak building power by >4% by reducing voltage from 1.0 to 0.95 per unit
Reduce daily energy consumption by >2% by reducing voltage from 1.0 to 0.95 per unit
TECHNOLOGY
The initial project assessed two types of technology:
Integrated Volt-Amp reactive (VAR) Control which optimally dispatches VAR sources (switched capacitors) and tap changing transformers to shape the feeder voltage profile for base-wide CVR savings.
Building level electronic voltage regulator which regulates the building voltage level independent of the feeder input voltage, for building-wide CVR savings.
The first two years of efforts focused on advancing the Integrated Volt/VAR Control technology which attempted to incorporate an electrical distribution model with known solar energy sources to shape the voltage profiles of the distribution feeders. This effort was terminated as the voltage profiles were not easily reduced with conventional, low cost switched capacitor banks on the distribution network, and the base did not control the settings of the feeder-head tap changing transformer.
The later years of the project focused on building level voltage control, via existing technology in the form of Electronic Voltage Regulators (EVRs), leveraged from an adjacent market (voltage support to buildings in poor power quality sites).
PERFORMANCE AND COST ASSESSMENT
The net result from the demonstration of CVR at Building 1588 resulted in:
Peak load reduction of 1.9–5.6% which is within range of the goal of 4–5%.
Energy consumption reduction of 1.5%, which is less than the goal of 3–4%. EVR also had an internal loss of 2% which was not accounted for in the above 1.5% energy
savings, thus nullifying any benefit. Note: the voltage reduction is assumed to be set to 95% of rated.
Additional challenges and concerns on applying the technology are listed below.

ES-2
The above performances were only applicable to the target building, which had some significant resistive loads, such as electric laundry dryers, and an electrically heated sauna.
The assessment of CVR impact and savings was very difficult, it required several months of data collection and non-trivial statistical analysis to determine the precise effect.
The trend for electrical loads is toward constant power loads with closed loop controls. As a base adopts energy conservation measures, the benefits to CVR methods will erode.
The cost effectiveness of the demonstration of EVR technology was zero due to the additional losses in the EVR device, eroding any peak power or energy savings benefit. An alternative method for achieving CVR through manual tap changes on existing transformers proves to be cost effective (as manual tap changes only requires moderate amount of skilled labor applied once, assuming the feeder voltage profile is reasonably constant over time.).
The benefit of CVR methods, at either the distribution feeder level or the building level, is eroding over time as loads become more electronically controlled and behave in a constant power and constant energy manner. Alternatively, energy efficiency efforts should first focus on updating loads which behave in a resistive, un-controlled manner (e.g., the electric laundry dryers with simple run time controller should be replaced with units that have “dryness” or humidity controlled turn off, or be updated with modern gas-fired dryers).

1
1.0 INTRODUCTION
The original project proposed by GE Global Research in 2010, had an overall technical objective of implementing a centralized, campus-wide voltage management scheme which accounted for distributed energy resources (such as combined heat & power, as well as solar power) in order to provide Conservation Voltage Reduction (CVR) benefits and ensure voltage quality compliance. The original objective proposed is shown below: 1
The operational conditions at the target base, the Marine Corps Air Ground Combat Center (MCAGCC) in Twenty-nine Palms, changed over the time frame of the project as the base upgraded its electrical connection to the local utility, Southern California Edison (SCE). With the new infrastructure, in combination with the fact that the Load Tap Changer (LTC) at the key substations were not controlled by the base, but were seasonally changed by SCE, reduced the feasibility of the proposed Integrated Colt/VAR Control (IVVC) strategy.
Due to the difficulty of showing benefit at the base level, the team pivoted and chose to demonstrate a different technology, which would have measurable benefit at the building load level, rather than at the feeder level. This building level voltage control device could impact the CVR of the building, independent of the feeder voltage level (whether it was too high or too low).
1.1 BACKGROUND
The intent of this demonstration is to evaluate the peak electric power reduction and electric energy consumption reduction effects from building level voltage control devices. The impact on building operations is expected to be minimal as these building level voltage control devices generally give consistent quality voltage, but at any programmable level between the American Nation Standard Institute (ANSI) suggested minimum and maximum values. Also the voltage control devices have a by-pass switch that can disable and return the building to normal operations if necessary. Current practices at military bases do not often tackle the issue of either distribution feeder level or building level voltage control.
This document will also include items to enhance the basic demonstration trends; in the nature of electrical loads, typical Department of Defense (DoD) installation electrical load characteristics, and the overall effectiveness of voltage conservation methods.
1.2 OBJECTIVE OF THE DEMONSTRATION
The project’s objective is to assess the impact and cost benefit of building level voltage control devices on both the peak electric power and energy consumption. The technology that was studied in detail was an Electronic Voltage Regulator (EVR), which is a transformer-based device with multiple taps that are electronically controlled with silicon-controlled rectifiers.
1 EW 201147 Fact Sheet from the ESTCP website: https://www.serdp-estcp.org/Program-Areas/Energy-and-Water/Energy/Microgrids-and-Storage/EW-201147

2
1.3 REGULATORY DRIVERS
The primary DoD directive, which motivated this study, was the Environmental Security Technology Certification Program (ESTCP) focus on energy consumption reduction and reduced energy costs for DoD installations.

3
2.0 TECHNOLOGY DESCRIPTION
This section of the report describes the underlying theory behind CVR and how it can be achieved at military bases.
2.1 TECHNOLOGY OVERVIEW
CVR methods are based upon the characteristics of electrical loads and how they respond to voltage changes over time. This section gives the theory behind the method and how it can be applied at either the distribution feeder or building level.
2.1.1 Electrical Load Modeling
To define the effect of voltage changes on load consumption, the power system society categorizes load behavior according to their voltage response in the following classes: constant impedance (Z), constant current (I) and constant power (P). Since some loads might preserve more than one of the following properties, a load can be fully characterized with the combination of all the previous three. The figure below represents a ZIP model.
The following figures from Electric Power Research Institute (EPRI’s) report [6], show lighting examples of an incandescence lamp which is a constant impedance load and a fluorescent lamp which is an almost constant power load.
Figure 1. Lamp Type Power-Voltage Profiles from EPRI Report [6]
2.1.2 Conservation Voltage Reduction
The term CVR is normally applied to the energy savings aspects of reducing the voltage applied to loadsit can also be used to describe the peak power reductions from reduced voltages. The below sections describe these two sub-objectives.
2.1.2.1 Peak Power Reduction
In the case of peak load reduction, the CVR factor is defined as the ratio of percentage of power consumption reduction over the percentage in voltage reduction.
%
% (3)
The effects of CVR implementation on peak load reduction can be simplified and summarized in Figure 2. The peak load is reduced after applying voltage reduction [10].

4
Figure 2. Peak Load Reduction from CVR for Two Conditions [10]
2.1.2.2 Energy Consumption Reduction
The effect of voltage on energy consumption over the long term requires insight into the load’s operation [7]. In the case of energy consumption reduction, the CVR factor is defined as the ratio of percentage energy change over percentage voltage change [10].
%
% (5)
Normally, one would expect constant impedance loads (resistive) to consume much less energy as voltage is reduced. However, this depends upon how the constant impedance load is operated over the course of the day.
Two forms of control which have opposite impacts on the energy consumption are; “constant time” controls, and “closed loop” controls. If the load is controlled with a simple timer or runs a fixed number of hour per day, then voltage level can impact the total energy consumption. If the load is controlled by a separate productivity parameter, such as temperature, light output, or other independent parameter, then the total energy consumed may not be a function of voltage.
Figure 3 below show three examples of loads with different ZIP characteristics and control methods. The example shows how peak power and energy consumption results vary across these loads.
Figure 3. Example Electrical Loads and Their Power and Energy Characteristics vs.
Applied Voltage, Dependent upon Load Type and Control Methodology.

5
2.1.3 Building Level Voltage control
Building level voltage control is performed with the assistance of EVR technology. The EVR technology can regulate the Root-Mean-Square (RMS) potential in the building level even when the distribution system voltage is varying, due to the electronically controlled taps which span a broad range. Figure 4 below shows, two examples of voltage control on a building using EVR, in example #1 the EVR bucks the potential down to the ANSI limit, in example #2 the EVR boosts the potential of a deeply depressed feeder back to acceptable limits.
ANSI
Vol
tage
[per
uni
t]
Distance from feeder head [m]
Step down transformer drop
LV circuit voltage drop
EVR output voltage level
1.00
ECO VOLT (TM)
+/- 10% range1.5% steps
Out
put V
olta
ge R
ange
[p
er u
nit]
Input Voltage (V)1.03
0.970.940.91
1.061.09
Example #1 normal conditions
Step down transformer
LV Ckt
EVR Building
Loads
MV Ckt
ANSI
Distance from feeder head [m]
Step down transformer drop
LV circuit voltage drop
EVR output voltage level
Example #2 deeply depressed feederEVR raises building voltage to ANSI acceptable level
EVR lowers building voltage to ANSI acceptable level
by-pass
0.95 0.95
MV Ckt
MV Ckt
1.0 1.0
Figure 4. Two Examples Where a Building Level EVR Regulates the Voltage, Given
Two Different MV Distribution Circuit Conditions.
Note: the examples in Figure 4 include a potential drop due to the leakage impedance of the Medium Voltage (MV) to Low Voltage (LV) step down transformer. This potential drop can be as much as 5% for a fully loaded distribution transformer.
2.2 ADVANTAGES AND LIMITATIONS OF THE TECHNOLOGY
There are several available technologies available to influence or set voltage levels on distribution feeders and at the building load level. Below is a listing of the considered technologies and their relative merits.

6
Table 1. Comparison of Various Voltage Level Technologies
Technology Main Advantage Main Disadvantage Cost ($/kVA) 2
Load Tap Changing Transformer
efficiently changes the voltage at the head of a feeder as a function of feeder load
does not account for DER’s or VAR sources down the feeder. moderately expensive technology
100-200
Switched Capacitor Banks with local control
can economically raise local feeder voltage when droop becomes an issue (near end of line).
does not address non-local voltage issues, limited switching events per day. can only raise voltages.
50-60
Centralized Control of Switched Capacitor Banks
can optimize voltage profile based on knowledge of feeder and DER’s
requires data and communications, more expensive than local control, can only raise voltages
80-100
Building Level VAR injection (Smart inverters)
can dynamically inject +/- VARs to smooth or adjust building level voltage. may be integrated into future solar inverters
can force large power factor changes at building level. expensive if not integrated with other functions (solar inverter)
200-300*
Building Level Tap Changer (EVR)
can accurately regulate voltage at the building loads
no ability to impact feeder voltage (only load side), moderately expensive
150-200
In general, the advantage of an EVR is that it can dynamically maintain the voltage level to a LV circuit, even as the feeder voltage may vary wildly (as is the case for United States Embassies in foreign lands). The disadvantage of an EVR is that it is relatively expensive and it incorporates its own multi-tap transformer, as well as the dynamic electronic tap changing device.
2 Capacitor Application Issues, Eaton Corporation, Thomas Bloomberg, Daniel Carnovale, whitepaper on www.eaton.com * the cost of smart inverters can be associated with the primary function, like solar power, so no additional cost for VAr injection
7
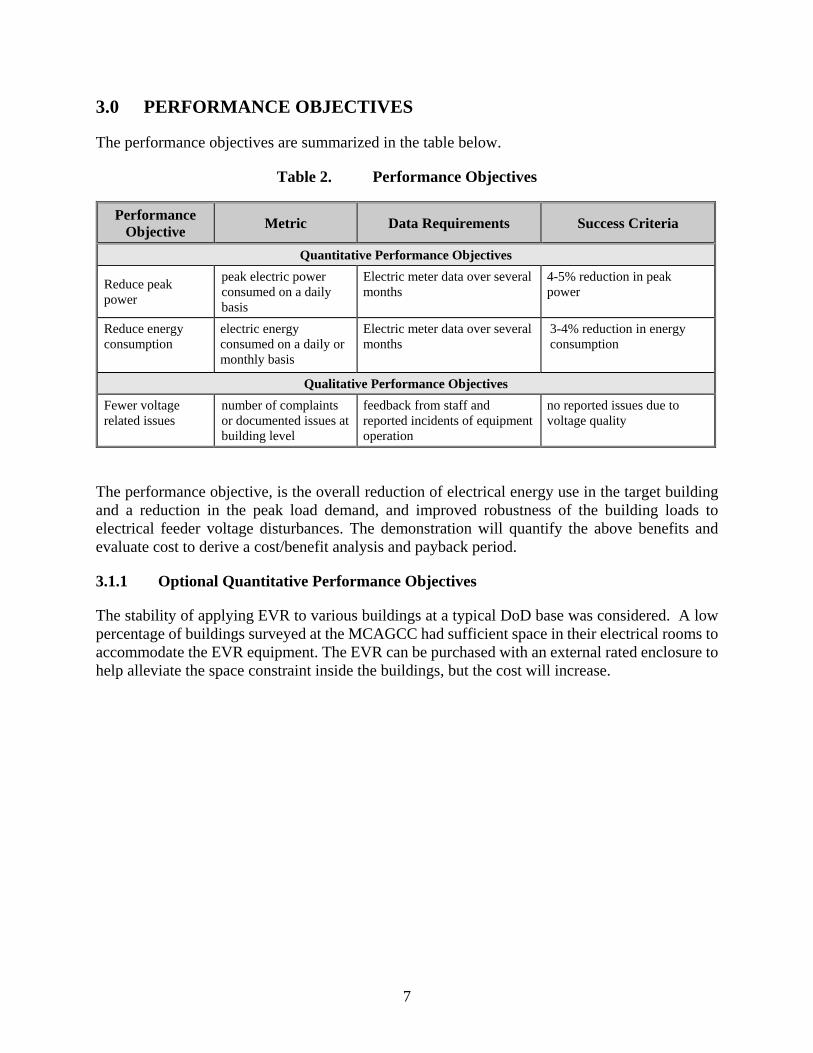
3.0 PERFORMANCE OBJECTIVES
The performance objectives are summarized in the table below.
Table 2. Performance Objectives
Performance Objective
Metric Data Requirements Success Criteria
Quantitative Performance Objectives
Reduce peak power
peak electric power consumed on a daily basis
Electric meter data over several months
4-5% reduction in peak power
Reduce energy consumption
electric energy consumed on a daily or monthly basis
Electric meter data over several months
3-4% reduction in energy consumption
Qualitative Performance Objectives Fewer voltage related issues
number of complaints or documented issues at building level
feedback from staff and reported incidents of equipment operation
no reported issues due to voltage quality
The performance objective, is the overall reduction of electrical energy use in the target building and a reduction in the peak load demand, and improved robustness of the building loads to electrical feeder voltage disturbances. The demonstration will quantify the above benefits and evaluate cost to derive a cost/benefit analysis and payback period.
3.1.1 Optional Quantitative Performance Objectives
The stability of applying EVR to various buildings at a typical DoD base was considered. A low percentage of buildings surveyed at the MCAGCC had sufficient space in their electrical rooms to accommodate the EVR equipment. The EVR can be purchased with an external rated enclosure to help alleviate the space constraint inside the buildings, but the cost will increase.

8
Page Intentionally Left Blank

9
4.0 FACILITY/SITE DESCRIPTION
The MCAGCC in Twenty–nine Palms has been an aggressive adopter of renewable energy and is located 120 miles East of Los Angeles, California (CA). The base boasts more than 8MW of solar power, >30MW of total load, and >10 MW of natural gas fired co-generation. The recently updated electrical feed from SCE now gives the base a redundant electrical feed and a reliable source of power.
Figure 5. Photo of Equipment Garages with Rooftop Solar Installations at MCAGCC in Twenty–nine Palms, CA Showing Pole Mounted 12.5kV AC Distribution Network.
4.1 FACILITY/SITE LOCATION AND OPERATIONS
The selected location of the EVR demonstration will be at building B1588 (East Gymnasium) – which satisfies most of the below requirements:
This building experiences voltage variation, harmonics, and P.F. issues (0.1 on CØ).
The building contains a mixture of load types, both 480/277, and 208/120 voltages – which can be separately adjusted.
It is fed by a 225kVA pad-mount transformer located outside, just east of the Electrical Room – which has the requisite space for the EVR to be located indoors.
As one of (2) gymnasium facilities located within a half-mile of each other, the load is not only non-critical, but also the facility does have some redundancy.
The ongoing demand load should be sufficient to generate quantifiable savings –as it is a newly operated 24-hour facility.

10
Figure 6. Photo of the Selected Building at the MCAGCC in CMU Twenty–nine Palms.
4.2 FACILITY/SITE CONDITIONS
The selected building, B1588 has the following function: East Gym & Fitness Center
~30-yr. old 22,300 SF single-story Concrete Masonry Unit (CMU) building - located at the far east end of 4th Street, approximately in the middle of Main side. Added to the project P641.
As B1588 is located at the dead end of 4th Street, there are no key military operations occurring near the site. EVR monitoring and demonstration should have no impact.
Building managerial personnel are fully aware of the operation, and are cooperative: easy, willing, and able to accommodate the installation and demonstration.
An important advantage of this candidate building was the fact that it had space within its Elec. Rm. (albeit w/ some re-configuration) to allow the Automatic Voltage Regulation (AVR) to be installed indoors: critical in this environment - due to the extreme heat, and sandy conditions, outdoors.
This also allowed for metering, tap-changing, and AVR setting to take place in a relatively clean, controlled environment, and within close proximity to each other.
Unfortunately, the Elec. Rm. doubles as the Mech. Rm., and the AVR is relatively large (barely fitting through the door), but adequate space was created to accommodate it properly. All this was preformed while maintaining proper clearances to all equipment, and secure the cellular router.
Although the Elec. Rm. can get relatively warm inside, a ½ Horse Power (HP) exhaust fan maintains indoor air temperature to below ±100°F. (indoor air temp is monitored in 24-hr. cycles).
Existing switchboard wire way facilitated connecting the AVR feeders to the incoming section. The selected buildings do not have any key military operations taking place in them.

11
Figure 7. Photo Inside of the Electrical Room at Building B1588, Showing a 480-208V Transformer Mounted to the Floor, and Electric Load Panels Mounted to the Wall.

12
Page Intentionally Left Blank

13
5.0 TEST DESIGN
5.1 CONCEPTUAL TEST DESIGN
The basic concept of the test plan is based upon two types of experiments: one which quickly measures the changes in power consumption with step changes in voltage, the second observes many days of energy consumption at each voltage setting.
5.1.1 Peak Power Reduction Experiments
These experiments involved changing the EVR output setting several times over the course of an hour. During each step change in EVR voltage output, the power consumption was recorded (1-min averages) and assessed for a similar step change.
These experiments were applied twice, once in January and once in June in order to capture a broad range of ambient temperatures.
Noise factors included loads within the building which happened to switch on or off during the 1-minute averaging of power.
Note: data from two separate meters was used to differentiate the 480V and 208V circuits within the building.
5.1.2 Energy Consumption Reduction Experiments
These experiments involved changing the EVR output setting several times over the course of months. During each step change in EVR voltage output, the daily average energy consumption was recorded and assessed for a step change.
Secondary factors included environmental and weather data from National Oceanic and Atmospheric over the time period of interest. The testing was scheduled over a time period from January to June to cover a broad range of ambient temperatures.
Noise factors included human occupancy rates, building equipment breakdowns, holidays, and transfer of laundry services from one gym to another based on equipment failures.
Note: data from three separate meters was used to differentiate the 480V and 208V circuits within the building, and the inefficiency of the EVR itself.
5.2 BASELINE CHARACTERIZATION
5.2.1 Peak Power Reduction Experiments
These experiments do not require any baseline data or modeling. Rather, after the data is collected, the voltage and power response data can be normalized to nominal or average values, so that just the sensitivity of power is evaluated against changes in applied voltage.

14
5.2.2 Energy Consumption Reduction Experiments
These experiments do not require any baseline data or modeling before the application of the EVR. Rather, the experimental data is correlated with the primary and secondary factors using statistical tools. So the primary effect of CVR can be extracted without a baseline model for the building.
Later efforts by the team focused on the characterization of B1588’s daily average energy consumption as a function of several factors. These factors included; daily average RMS voltage, daily average ambient temperature, daily average humidity. The energy consumption tests were applied over a period of 89 days from January 28th until April 7th and from June 8th to June 19nd, 2016.
5.2.3 Energy-CVR Model Performance
The error of fitting the data over the given linear models (6) and (7) is due to special nonlinearities in the data. The MAPE (Mean Absolute Percentage Error) from in-sample model validation along with the model coefficients are provided in the table below. The CVR factor is also calculated using formula (4). All data was normalized.
Table 3. 208V Circuit Model Coefficients and Error Performance for Normalized Model Predictors from Equation (6).
208V Circuit MAPE
Coefficients 35.74 -70.41 35.66 6.62%
95% Confidence Interval (10.083, 61.831) (-122.543, -19.151) (10.056, 61.724)
Table 4. 208V Model Coefficients Significance Based on Standardized Model Predictors
208V Circuit
t-value 0 -2.708 2.745
P-Value (Pr>|t|) 1 0.008 0.007
Standard Error 0.101 4.807 4.807
95% Confidence Interval (2.5%-97.5%)
(-0.20, 0.20) (-22.57, -3.45) (3.63, 22.75)
Table 5. 480V Circuit Model Coefficients and Error Performance for Normalized Model Predictors from Equation (7).
480V Circuit MAPE
Coefficients 0.63 0.46 -0.10 6.13%
95% Confidence Interval (0.485, 0.786) (0.351, 0.579) (-0.153, -0.050)

15
Table 6. 480V Model Coefficients Significance Based on Standardized Model Predictors
480V Circuit
t-value 2.33 0.612 -0.295
P-Value (Pr>|t|) 1 3.03 *10-12 0.0001
Standard Error 0.061 0.075 0.075
95% Confidence Interval (2.5%-97.5%)
(-0.12, 0.12) (0.46, 0.76) (-0.44, -0.14)
The CVR factor of the 208V circuit is estimated with low confidence due to the large variance of voltage and voltage squared coefficients. The large variance in the estimation of those coefficients is an outcome of the lack of other predictors that might affect the energy consumption in that circuit other than the voltage reduction/increase. Due to the large variance, it is not possible to provide a confidence interval for the CVR factor of the 208 V circuit. In other words, it is not possible to define with high confidence upper and lower limits of the CVR factor in the 208V circuit.
The model performance over the complete 89 days of measurements is shown below:
Figure 8. Daily Normalized Average Energy Over 89 Days in 208V Circuit

16
Figure 9. Normalized Daily Average Energy Over 89 Days in 480V Circuit
5.2.4 Results Explanation
The CVR factor on the 208V circuit was found to be between a constant power and a constant current load behavior. The CVR in circuit 480V is zero because this circuit contains significant closed loop loads which are not affected by the voltage changes. The statistical analysis produced insignificant effect of voltage variation on energy consumption (the voltage and voltage squared coefficients were statistically insignificant and thus excluded from the model resulting in a zero CVR factor according to definition in (4)). In conclusion, the 208V circuit can provide energy savings but the 480V circuit cannot provide a constant rate of savings because of the nature of the motor loads (constant energy consumption regardless the voltage level - knowledge of the operation point can possibly provide power CVR savings for peak load consumption).
Similar results are provided by the DoD of the United Kingdom, which performed a very similar study on CVR for energy savings purposes [21]. Unregulated motors provide potential energy savings if they are operated within a certain region as mentioned in [21]. The experimental results showed a zero CVR in the case of the 408V circuit, which mostly contains regulated motor load and near-constant power lighting technology. The UK DoD study [21] agrees with the same conclusions and provides a table with the potential savings from different load types which is along with the EPRI study [14] and DoE study [3], the main sources of verification of our results.
5.3 DESIGN AND LAYOUT OF TECHNOLOGY COMPONENTS
The CVR experiment was performed with the assistance of an EVR device connected as shown in the figure below. The device was introduced between the pre-existing MV to LV transformer and the building circuits. The EVR and the taps of the 208V circuit in the building were the two degrees of freedom (points where voltage can be controlled) in this experiment. A picture of the installed EVR equipment is also provided.

17
Figure 10. Basic One-line Diagram for the Layout of the EVR in the Building.
Note: to resolve the 480V circuit load separate from the 208V circuit load, data from both Meter #2 and #3 are necessary and the difference was used to calculate the 480V circuit load.
Figure 11. The EVR device installed in the building, and the meter panel display.

18
Figure 12. Installed Meters and Cellular Router for Data Retrieval.
5.4 OPERATIONAL TESTING
The EVR settings can be easily set by programming the voltage level on the device. The taps on the 208V circuit transformer require a de-energization of the transformer, changing the tap and then re-energizing the circuit. No other actions were required to perform this experiment.
5.5 SAMPLING PROTOCOL
Calibration of equipment. None was needed. The power quality meters were sufficient in accuracy and came pre-calibrated.
Quality assurance sampling. None was made. The data over the several months were the sampling that fed the analysis.
5.6 SAMPLING RESULTS
The experiments performed are summarized in the table below:
Several months of data recordings while the EVR output and 208V transformer taps were adjusted to various settings
Two days of rapid EVR voltage level changes (each 5 minutes). Below an overview of the data collected from the meters is given in several plots:

19
Figure 13. The Potentials in Both Circuits of the Building Over Five Months in 2016.
Figure 14. EVR Output Voltage Settings During the Load Characterization Experiments on June 22, 2016.

20
Page Intentionally Left Blank

21
6.0 PERFORMANCE ASSESSMENT
The proposed demonstration will document the energy and peak power reductions of the proposed technology. The demonstration also addresses the question of relative installation costs for a brown field site with typical issues. The combinations of these two give the benefit to cost ratio and a scalability assessment to estimate the total impact to the DoD.
6.1 PEAK POWER REDUCTION
The original hypothesis was that the EVR device will reduce the peak power of the building by 4~5%, when the voltage is dropped from 1.0 to 0.95 power unit. The collected data from the building load characterization shows that the 208V circuits have a much more resistive characteristic than the 480V circuit, which is nearly constant power. The Variable spreading factor (VSF) for B1588 is summarized below in Table 7, and the performance for B1588 is summarized below.
Figure 15. Plot of Delta-Power vs. Delta-Potential Data Points from the Load Characterization Experiment.

22
Figure 16. Plot of all Power vs. Potential Sampled Points Over the 1-Hour Load Characterization Experiment Showing a 480V Circuit with CVR-Power Slope of 0.22, and
a 208V Circuit with a CVR-Power Slope of 0.7.
Table 7. CVR Power Factors for B1588 by Two Estimation Methods.
dP/dV
(11 delta steps)
1-min response
2*Kz + Ki
(all 60 recordings)
5-min response
Power Split (weighting)
208V circuit 2.0 0.7 33%
480V circuit 0.26 0.22 66%
Aggregated 0.83 0.38 100%
Response to -5% voltage
-4.1% -1.9%
The VSF results show that for a 5% voltage reduction, the building can achieve a 4-10% peak power reduction on the 208V circuit, and a 1-3.5% peak power reduction on the 480V circuit. The net division of energy consumption for B1588 is approximately 33% on the 208V circuit, 66% on the 480V circuit, and resulting in a total building level peak load reduction of 1.9-5.6%.
This result falls partially in the range of the claim of a 4-5% reduction in peak power from a 5% drop in building voltage level. The findings fall short of the claim as longer response times are considered due to the load in B1588 having more closed loop control, which adjusts power consumption based on voltage perturbations.

23
Figure 17. Response of Power over Time Due to a Voltage Rise Applied to Three Types of Resistive Loads, Showing the Probable Closed Loop Response with Slow Feedback
Loads within B1588.
6.2 ENERGY CONSUMPTION REDUCTION
The original hypothesis was that the EVR device will reduce the energy consumption of the building by 3~4%, when the voltage is dropped from 1.0 to 0.95 pu. The collected data from the building daily energy characterization shows that the 208V circuits has an equal mix of open and closed loop controls, and the 480V circuit is nearly constant energy. The CVR for B1588 is summarized in Table 8 and the performance for B1588 is summarized below.
Table 8. CVR Energy Factor for B1588 (from normalized data)
Circuit CVR Factor Energy Split
208V 0.91 33%
480V 0 66%
Aggregated 0.3 100%
Response to -5% voltage
-1.5%

24
From the CVR factor estimation in the Energy Consumption analysis, it is concluded that a 5% voltage reduction leads to a 4.55% energy consumption reduction in the 208V circuit. For the 480V circuit the analysis could not reach a high confidence conclusion due to the near zero CVR factor. The net result from an energy split of 33%/66% between 208V and 480V circuits is a total building level energy consumption reduction of 1.5%, which is less than the originally projected outcome due to the load in B1588 being less resistive and more constant power than originally anticipated.

25
7.0 COST ASSESSMENT
This section estimates the capital and operational costs of operating the EVR technology at the building level, and assess the financial benefit of operating the EVR technology.
The “current approach” is to operate all transformer equipment at the nominal or “100%” potential taps. The “proposed approach” is split into two methods;
1) use an EVR to reduce the voltage to the building loads in order to achieve CVR, a. This method was demonstrated and can be used to dynamically set the voltage at the
building level to lowest acceptable level for maximum CVR benefit. 2) manually set the building transformers to a lower tap, where applicable, to induce lower
applied voltages, without the use of an EVR. a. This method was not demonstrated, but can be used to set the voltage at the building to
a reasonably low level based on seasonal or annual estimates of the bases voltage levels, which will return most the CVR benefit for essentially no cost.
Site Description:
This cost analysis is being applied to the measured benefits of Building 1588 (East Gym). This industrial building probably does not represent the base as it is dominated by residential loads.
7.1 COST MODEL
The cost model in Table 9 is for adding a 480V/480V EVR to an existing building, as was done in this Environmental Security Technology Certification Program (ESTCP) funded project.
Table 9. Cost Model for Adding an EVR to a Brownfield Site.
Cost Element Data Tracked Estimated Cost
CapEx Quotes for hardware 150 – 200 [$/kVA] Installation Professional installation 3,000 [$/install]
Consumables operation over 6 months. none expected OpEx cost of electricity to cover losses and inefficiency 700 [$/kVA/year]
(2% of full rating as loss) Lifetime projected based on similar equipment 15 ~20 years
Misc training or other costs none

26
7.2 COST ANALYSIS AND COMPARISON
7.2.1 COST ASSESSMENT
The Cost Assessment for the EVR technology was based on a simple return-on-investment model, and was compared with a secondary method to achieve similar performance with lower investments.
Two configurations were used in this analysis, the first one which could dynamically adjust voltage to a pre-defined setting which gives maximum benefit, and a second method that was much lower cost but would not achieve as high a benefit.
Note: the table below do not consider other EVR implementation strategies where only the 208V circuit has an EVR applied. (as was introduced in Section 7.3).
Table 10. Two Configuration Options for Achieving Voltage Adjustment.
Manually set taps EVR dynamically set taps
MV to 480V MV to 480V isolation transformer (pre-existing)
480V adjustment Manual selection of taps on MV transformer for reduced voltages
Separate 480V to 480V transformer with multiple output taps & EVR equipment
480 to 208V 480V to 208V isolation transformer with high side taps (pre-existing)
208V adjustment Manually selected taps on “high side” of transformer for reduced voltages
Manually selected taps on high side of transformer
Table 11. Two configuration options with equipment and labor cost estimates.
Manually set taps EVR dynamically set taps
MV to 480V Pre-existing, no new costs (0 $/kVA)
480V adjustment No equipment costs, $600 Labor (de-energize & set taps) 150 $/kVA + $3k labor
480 to 208V Pre-existing, no new costs (0 $/kVA)
208V adjustment No equipment costs, $600 Labor (de-energize & set taps) EVR lowers voltage for both circuits

27
7.2.2 Benefit Assessment
The benefit of applying lower voltages to building used the below assumptions.
List of Assumptions:
Price of electrical energy: $0.07/kWh flat rate for energy at the base Price of peak power: $15/MW peak power charge per 28-day billing period Building average power 50 kW Building peak power 75 kW CVR energy savings: -1.5% energy savings (without EVR losses) CVR peak power reductions: -1.9% peak power reductions from 5% voltage drop EVR energy/power losses: 1.5% thus nullifying any energy or power savings benefit
Table 12. Simple Cost and Benefit Assessment for Two Voltage Setting Strategies Applied to a Building with 75kW Peak Power Consumption.
Manually set taps EVR dynamically set taps
Initial Costs (Equipment + Labor)
$600 $14,250
Recurring costs (over the 20 year life)
None none
Energy Savings -1.2%
(80% of observed) 0%
(EVR losses erode benefit)
Peak Power Reduction -1.5%
(80% of observed) 0%
(EVR losses erode benefit)
Energy bill savings $222 / year $0 / year
Demand Charge reductions $368 / year $ 0 / year
Table 12 shows that the EVR has no measurable benefit in the example building. This is due to the EVR having a separate transformer inside with multiple taps. Rather a simpler method of manually adjusting the taps of the pre-existing transformers were 80% of the claimed performance benefit can be had at near zero cost.

28
Page Intentionally Left Blank

29
8.0 IMPLEMENTATION ISSUES
Below is a summary of implementation issues.
Lesson Learned:
Internal to building electrical equipment rooms are not often well suited or able to house an EVR unit, due space constraints and wire routing issues.
Outside sites have more space, but require outdoor rated equipment (National Electrical Manufacturers Association outdoor rated…) and more maintenance due to dirt and debris issues.
Manual tap changes by electricians requires the equipment to be de-energized.
De-Energized Tap Changers or “dial tap” changers on a pad mount and clam-shell residential transformers is an easy way to turn down voltages. These devices are normally always set to the “100%” or “nominal” position.
Potential Regulations:
No significant regulations are predicted that affect the application of voltage regulating devices.
New Smart Inverter requirements may help support voltage regulation strategies, but it is unclear whether these devices will encompass voltage reduction strategies.
Decision Making Factors:
A decision to reduce a building’s voltage level should be based upon knowledge of the loads within that building. Even then, a decision to elect for voltage reduction for energy or peak power reduction needs to be compared with other efforts to modernize the loads and apply alternative control strategies (closed loop controls).
Distributed solar power has an impact on local voltage profiles. An EVR can help mitigate voltage swings and their impact on sensitive equipment. But the application of an EVR must be weighed against modernizing the equipment which is sensitive to voltage perturbations.
Procurement Issues:
No significant procurement issues. EVR technology is generally available and often applied to United States Embassies in developing nations where poor voltage quality is an issue.

30
Page Intentionally Left Blank

31
9.0 REFERENCES
1. EW 201147 Fact Sheet from the ESTCP website: https://www.serdp-estcp.org/Program-Areas/Energy-and-Water/Energy/Microgrids-and-Storage/EW-201147
2. Conservation Voltage Reduction, Phillip Anderson, Idaho Power, 2013 https://www.idahopower.com/pdfs/AboutUs/PlanningForFuture/irp/2013/DecMtgMaterials/ConservatioVoltageReduction.pdf
3. PNNL 19596, July 2010 http://www.pnl.gov/main/publications/external/technical_reports/PNNL-19596.pdf
4. R. Comfort , A. Mansoor and A. Sundaram "Power quality impact of distributed generation: effect on steady state voltage regulation", PQA 2001 North America Conf., 2001 http://citeseerx.ist.psu.edu/viewdoc/download?doi=10.1.1.202.5283&rep=rep1&type=pdf
5. Capacitor Application Issues, Eaton Corporation, Thomas Bloomberg, Daniel Carnovale, whitepaper on www.eaton.com
6. EPRI, 2011, Volt/Var Control and Optimization Concepts and Issues. [Online]. Available: http://cialab.ee.washington.edu/nwess/2012/talks/uluski.pdf
7. Evaluation of Conservation Voltage Reduction (CVR) on a National Level, US. Department of Energy, July 2010, Report.
8. Kirshner D., “Implementation of Conservation Voltage Reduction at Commonwealth Edison”, IEEE Transactions on Power Systems, vol. 5, pp. 1178-1182, 1990.
9. Begovic M., Novosel D., Milosevic B. and Kostic M.,: Impact of Distribution Efficiency on Generation and Voltage Stability, presented in Proc. 33rd Annual Hawaii Int. Conf. System Sciences, 2000, 2000, p.7 pp.
10. Wang Z., and Wang J. “Review on Implementation and Assessment of Conservation Voltage Reduction”, IEEE Transactions on Power Systems, vol. 29, no. 3, pp. 1306-1315, May 2014.
11. ANSI, “ANSI Standard C84.1-1995 Electric Power Systems and Equipment Voltage Ratings (60 Hz),” 1995.
12. Kennedy B. and Fletcher R., “Conservation Voltage Reduction (CVR) at Snohomish County PUD”, IEEE Transactions on Power Systems, vol. 6, pp. 986-998, 1991.
13. Scalley B. L. and Kasten D. G., “The Effectws of Distribution Voltage Reduction on Power and Energy Consumption”, IEEE Transactions on Power Systems, vol. E2-4, No. 3, pp. 210-216, 1981.
14. EPRI, 2001, PQ Commentary. [Online]. Available: http://www.smartgridnews.com/artman/uploads/1/sgnr_2007_1208.pdf

32
15. Chen M., Shoults R. and Fitzer J., “Effects of Reduced Voltage on the Operation and Efficiency of Electric Loads”, in EPRI, Arlington: University of Texas, EL-2036 Volumes, 1981, vol. 1, p. 1419-1.
16. Wilson T., 2003, AdaptiVolt Based CVR in Industrial Applications Technical Synopsis. [Online]. Available: http://utilidata.com/as-sets/docs/white_papers/UtiliData_Technical_Synopsis_Industry_.pdf
17. Schneider J. F., Tuffiner F. and Singh R., 2010, Evaluation of Conservation Voltage Reduction (CVR) on a National Level. [Online]. Available: http://www.pnl.gov/main/publications/external/tech-nical_reports/PNNL-19596.pdf
18. Wilson T. L., “Measurement and Verification of Distribution Voltage Optimization Results”, in Proc. 2010 IEEE Power and Energy Society General Meeting, 2010, pp. 1-9.
19. RTF NWCouncil, 2011, Standard Protocol #1 for Automated CVR. [Online]. Available: http://rtf.nwcouncil.org/subcommittees/cvr/
20. RTF NWCouncil, 2012, CVR Standard M&V Protocol #1. [Online]. Available: http://rtf.nwcouncil.org/subcommittees/cvr/
21. Justifying and Delivering Voltage Optimization on the Mod Estate, UK Department of Defense Estate Management, January 2010. Practitioner Guide.

A-1
APPENDIX A POINTS OF CONTACT
Point of Contact Name
Organization Name
Address
Phone Fax
Email Role in Project
Herman Wiegman GE-Global Research 518-387-7527 [email protected]
Principal Investigator
Matthias Nikolakopulos
Nikolakopulos & Associates Inc
(310) 530-7277 [email protected]
Sub-Contractor, Installer, Operator
Clovis Vaughn MCAGCC, EIC, EngrBr, PWD, G4
760-830-7795 [email protected]
Facility Manager
