advanced metering and energy information systems -...
TRANSCRIPT

P.O. Box 2349 White Salmon, Washington 98672
Phone: (509) 493-4468 Fax: (509) 493-4078
www.newbuildings.org
Advanced Metering and Energy Information Systems Grant 83378201 Report – July 3, 2009
Prepared for:
US Environmental Protection Agency Karen Butler
1200 Pennsylvania Avenue NW MS 6202J
Washington DC 20460

Advanced Metering and Energy Information Systems
- i -
EXECUTIVE SUMMARY .......................................................................................................................... 1 1 INTRODUCTION............................................................................................................................... 5
1.1 ADVANCED METERING AND ENERGY INFORMATION SYSTEMS .................................................... 5 1.2 OWNERSHIP STRUCTURE .............................................................................................................. 6
1.2.1 Utility Installed Advanced Meters vs. Owner Installed Advanced Metering .......................... 6 1.3 WHAT IS THE STATUS OF OWNER-INSTALLED EIS TECHNOLOGY? ............................................... 7
2 ENERGY INFORMATION SYSTEM COMPONENTS ................................................................ 8 2.1 METERING TECHNOLOGY ............................................................................................................. 9
2.1.1 Electric Meters ....................................................................................................................... 9 2.1.2 Natural Gas Meters ................................................................................................................ 9 2.1.3 Additional Meters and Sensors ..............................................................................................10
2.2 UTILITY METERS: UPGRADES AND ADVANCED METERING INFRASTRUCTURE............................11 2.2.1 Meter Dial Reader .................................................................................................................11 2.2.2 Pulse Output Upgrade ...........................................................................................................11 2.2.3 Utility AMI and AMR Meters: ...............................................................................................11
2.3 DATA ACQUISITION, COMMUNICATION, AND STORAGE ..............................................................13 2.3.1 Data Acquisition System ........................................................................................................13 2.3.2 Building Automation Systems, Integrated Platforms, and Middleware .................................13 2.3.3 Gateway and Communications Service .................................................................................14 2.3.4 Database and Data Storage ...................................................................................................15
2.4 SOFTWARE TOOLS .......................................................................................................................16 2.4.1 Basic Software Tool Features ................................................................................................17 2.4.2 Intermediate Software Tool Features ....................................................................................17 2.4.3 Advanced Software Tool Features .........................................................................................17
3 COSTS FOR BASIC EIS TECHNOLOGY.....................................................................................18 4 DATA USAGE ANALYSIS METHODS .........................................................................................19
4.1 PORTFOLIO ENERGY TRACKING ..................................................................................................19 4.2 WHOLE BUILDING ENERGY BENCHMARKING AND BASELINING .................................................19
4.2.1 Temperature Normalization and Temperature Independent Analysis ...................................20 4.2.2 Additional Normalization, Energy Informatics and Energy Signatures ................................21
4.3 TIME SERIES VISUALIZATION TOOLS ..........................................................................................21 4.4 KEY PERFORMANCE INDICATORS ................................................................................................22
5 AREAS OF EIS UTILIZATION AND RESEARCH IN COMMERCIAL BUILDINGS ...........23 5.1 LARGE COMMERCIAL BUILDINGS ...............................................................................................23 5.2 CHAIN COMMERCIAL BUILDINGS ................................................................................................24 5.3 CAMPUSES AND GOVERNMENT FACILITIES .................................................................................24
6 ADVANCED METERING AND EIS PENETRATION ................................................................25 6.1 DRIVERS FOR INCREASED ADVANCED METERING AND EIS INSTALLATION ................................25 6.2 IMPEDIMENTS TO INCREASED ADVANCED METERING AND EIS INSTALLATION ..........................26
7 CONCLUSIONS AND RECOMMENDATIONS ...........................................................................27 REFERENCES ..............................................................................................................................................28 INTERVIEWS ..............................................................................................................................................29
APPENDIX A ADVANCED METERING, EIS, AND SERVICE VENDORS .....................................30 Basic Owner-Installed EIS Vendors.....................................................................................................30 Additional Advanced Metering Vendors ..............................................................................................30 Integrated Platform (Middleware) Vendors .........................................................................................30 Third-Party Software Tools .................................................................................................................30 Energy Monitoring Service Providers: ................................................................................................31
APPENDIX B GLOSSARY .......................................................................................................................32
Advanced Metering and Energy Information Systems
New Buildings Institute July 3, 2009 1
Executive Summary This paper is designed to help regulators, program managers and other interested parties understand the new trends and technologies available in advanced metering as used in energy information systems (EIS) in North America. An “advanced meter” is commonly considered an energy meter that provides short interval measurements and can be read remotely. The term “smart meter” is also used but generally refers to meters with the capability to send and receive messages regarding pricing, along with other sophisticated utility functions. EIS refers to a feedback system where advanced meters, remote database storage and software tools are employed to monitor and maintain energy performance in a building. The EIS collects energy performance data on a continuous basis to provide feedback to building designers and operators who maintain and improve performance through equipment or operational changes. Advanced meters and sensors are deployed at different levels (i.e. whole building, system or component) depending on the size and complexity of the building. Significant advantages over reliance on utility bills for performance feedback include:
• Much easier and more reliable access to energy usage information for portfolio managers, designers, energy efficiency programs and energy service consultants.
• Immediacy of information, compared to waiting for bills to arrive at fixed intervals. • Additional detail (daily, hourly, sub-metering where desired), facilitating further
investigation into problems and tenant usage allocations. This paper provides an overview of advanced metering and EIS, descriptions of where advanced meters and EIS are providing value, perspectives regarding their utilization and pathways that address impediments to advanced metering and EIS market penetration. Only advanced meters and EIS used for permanent installation are considered. Data was gathered through literature reviews and interviews with key industry personnel. Motivations for Increased Advanced Metering and EIS Utilization Persistence in Building Efficiency: Achieving and maintaining the performance of highly efficient buildings will require effective monitoring with owner/operator feedback. Evidentiary Design: There is little hard evidence of verified building performance; a 2007 study of LEED buildings1
carried out by New Buildings Institute showed wide variation in predicted versus actual energy usage. For future buildings to improve, simpler and faster data collection methods are needed to acquire this critical feedback and proof of performance
Advancing Building Performance Metrics: It’s likely that the next generation of energy codes and building programs like LEED will call for performance requirements. Building Performance Review and labeling programs will necessitate separation between tenant activity-driven loads (such as plugs) and processes and the core and shell loads (such as HVAC and common area lights) and require flexible metering and data acquisition.
1 Turner, C. and Frankel, F., 2008, Energy Performance of LEED New Construction Buildings, NBI Final Report to USGBC.

Advanced Metering and Energy Information Systems
New Buildings Institute July 3, 2009 2
Components and Costs of Advanced Metering and EIS An EIS is comprised of a set of advanced meters and sensors, a data acquisition system (DAS), which collects the meter and sensor data, a gateway that transfers the data into a remote database and software tools that display or analyze the data. Meters: Advanced meter functionality and interval data can come from owner-installed equipment or utility company meters or upgrades.
Owner-installed Advanced Meters - Owner-installed advanced meters are readily available for electric, gas and water measurements. Electricity and natural gas are the most common fuels in commercial buildings. The installed cost can be estimated to $800 per meter for electric and $950 per meter for natural gas.
Utility Advanced Meters - Utility Advanced Metering Infrastructure (AMI) and Automated Meter Reading (AMR) installations, which may provide EIS functionality to an owner, are limited in availability. Estimates are that only 4.2% of all nonresidential installed electric utility meters are capable of providing interval data. Costs for AMI meters for utilities, much lower than owner-installed due to the economies of scale, range from $150 to $200 per meter.
Utility Meter Upgrades - An owner can gain building-level interval data by requesting the utility upgrade their meter to a version with a standard local data output which can be read by standard owner-installed EIS data acquisition hardware. Costs for an upgrade vary by utility, anywhere from free to $2,000 or more; procedures for upgrading may be cumbersome. Natural gas upgrades are not always available.
Basic EIS Cost Summary: Based on vendor estimates and assumptions regarding installation costs, an owner can install a basic EIS to measure whole building usage of electric and natural gas usage for $2,500 to $4,000, with an annual charge for communications, data storage and software hosting of $0 to $240. This does not estimate any owner-related expenses such as staff training, analysis labor or meter maintenance. Data Analysis Methods EIS software tools are available to analyze energy usage or interval data, or a combination of both. Methods of analysis include:
• Portfolio energy tracking – Enterprise Energy Management • Benchmarking and Baselining • Direct interval data analysis • Key Performance Indicators
Where are Advanced Metering and EIS Working? In large commercial buildings, the energy expenditure is often sufficiently large enough to justify installation of an EIS based on expected savings alone. One report estimates a minimum of $40,000 of annual energy expenditure (or approximately 28,000 ft2 of floor space using average expenditure numbers2
2 Commercial Buildings Energy Consumption Survey (CBECS), Table C.4, US DOE, 2003
) as the minimum needed to justify installation of an EIS. The building automation system (BAS) in these larger buildings may be able to collect and store trend logs for
Advanced Metering and Energy Information Systems
New Buildings Institute July 3, 2009 3
energy use. These EIS are often called Integrated Platforms, Middleware or Energy Management Control Systems. Vendors of integrated platforms which serve larger buildings reported that client buildings must have a minimum annual fuel expenditure of $700,000 to $1 million. For large buildings, two programs - Monitoring-based commissioning, MBCx (developed by LBNL and the University of California system) and Continuous Commissioning® process developed at Texas A&M university - demonstrate the effectiveness of using meter data on an ongoing basis to assist and maintain commissioning projects These programs have been shown to increase the persistence, magnitude and cost effectiveness of commissioning new and existing buildings. There is little data for the cost effectiveness of advanced metering and EIS for smaller commercial buildings, i.e., those below the 28,000 ft2 estimate. According to CBECS 2003, Table B22, 90% of buildings and 38% of commercial building floor space are smaller than 25,000 ft2. Examples of small commercial buildings that do use advanced metering and EIS are chain commercial properties, retail and hospitality where a single owner controls many stores. Also federal, state and municipal government buildings to mitigate government energy expenditures as well as comply with legislation. Drivers for Increased Advanced Metering and EIS Installation Availability: EIS hardware is well developed and current technology well suited to basic performance monitoring and benchmarking. Costs have decreased in the last 10 years as hardware, software, communications and data storage costs fall. EPACT 2005 and EISA 2007: Section 103 of the Energy Policy Act of 2005 is requiring managers of government facilities to install advanced metering at the whole building level “…subject to determination of practicability.” As an example, the Government Services Administration installed an EIS in 100 buildings nationwide as of 2009. California AB1103: The State of California is requiring benchmarking, via EPA Portfolio Manager, for all state buildings and eventually all buildings sold in California. Benchmarking by the EPA can be automated through web services provided by EIS vendors. Submetering: Owner-installed metering systems used for utility bill allocation (often called submetering) to tenants use the same technology as EIS. Additional meters to enable whole building or system Baselining and Benchmarking have a low marginal cost when a tenant sub-metering system already exists.
Demand Response: High value demand-response programs require interval meter data to verify performance. Similar to submetering, the marginal cost of adding additional meters and analysis functionality is reduced.
Carbon Accounting and Green Motivations: Advanced metering provides a building owner an easy way to gather the information needed to calculate and report emissions. Impediments to Increased Advanced Metering and EIS Installation Awareness and Cost: Advanced metering is not often considered a basic element of new construction or major renovation. The cost of advanced metering/EIS packages is sometimes hard to accurately estimate, and potential benefits are not well understood. In interviews, the

Advanced Metering and Energy Information Systems
New Buildings Institute July 3, 2009 4
often-estimated savings potential for advanced metering and an EIS in commercial buildings is 5%, but as building size decreases there is less data regarding the expected savings percentage. Marketplace separations between those who would purchase the equipment and those who would benefit from it further complicate the decision making. Shortage of Trained Personnel: Key performance indicators and benchmarking tools can be automated to some degree, but the necessity for human interaction to monitor and interpret results can never be eliminated. Smaller buildings tend to use fixed service contracts with HVAC technicians to reduce costs. Even in larger buildings these technicians are typically not trained in using energy consumption and interval data to make assessments or do not have the time to employ interval data effectively. Conclusions and Recommendations Advanced metering and EIS hardware is well developed, and current technology is well suited to basic performance monitoring and benchmarking. In light of the above discussion of drivers and impediments, the following actions could increase the potential for achieving that objective:
• Efficiency programs should consider automated metering options as a way to acquire better and faster feedback on program results, while also providing the benefit of better feedback to participants. Advanced metering and EIS equipment costs may decrease with increased volumes, and general requirements or bulk purchasing for a widely used program could provide an opportunity to reduce costs. The USGBC has announced its intention to require performance data for LEED-NC buildings after 2010. Similar requirements in efficiency programs, or in other state and local codes, would provide similar benefits.
• National benchmarking tools provide a simple number assessing building performance
relative to like-type buildings. Advanced metering and EIS provide opportunity to enhance benchmarking immediacy and the potential to allow for expanded sophistication of analysis in Benchmarking and Baselining.
• A policy at the national level standardizing the cost to upgrade utility meters to pulse output would provide clarity regarding costs to owners and allow for local interval measurement of fuels without requiring owners to maintain the meters or the utility to provide data from a secure database.
• A simple and convenient software tool for the management of data is needed to permit
smaller building owners and their contractors to achieve the benefits of feedback from advanced metering and EIS.
• EIS hardware is capable of multiple measurements within a facility that can support the
isolation of energy systems to make more advanced forms of energy analysis, such as Energy Infometrics and system-level benchmarking, possible. EPA may want to develop tools to support certification of buildings based on these enhanced methods.

Advanced Metering and Energy Information Systems
New Buildings Institute July 3, 2009 5
1 Introduction
1.1 Advanced Metering and Energy Information Systems Advanced metering is often mentioned as a component of a high performance building without much description given to the nature or usage of the meter(s) or data collected. The generally accepted definition3
is a meter that provides fuel usage measurements frequently (typically every hour or less). The information is regularly gathered in a database where it can be analyzed with software tools.
In commercial buildings, advanced meters form a core component of what is increasingly being referred to as an Energy Information System4 (EIS), also referred to as an Advanced Metering System5
. The EIS is a package consisting of advanced metering and other sensors, data collection with remote communications and data storage and some form of software tool which the owner (or designated representative) uses to analyze and monitor building performance. This definition can include feedback displays for occupants and may provide design or financial feedback to different elements of the owner’s staff.
The advanced meters that form the EIS can be installed to monitor any fuel used in commercial buildings including natural gas, electric, fuel oil, heated or chilled water, or steam. The most common fuels for commercial buildings6
are electricity (99.8% of all commercial buildings) and natural gas (54.2%), with the next closest being propane (10.2%).
The installation and use of an EIS can involve measurements at different levels of the building, referring to what energy end-uses are captured in the measurement.
Whole Building, premises or site -The advanced meter measures usage for the whole site including all systems, components and auxiliary loads. Installation may be by the owner or the utility.
System or Subsystem - The meter measures the energy usage of a certain type of equipment installed in the building (e.g. lighting, elevators, heating, cooling, core and shell, tenant submetering). submetering installed to allocate the utility bill among tenants is considered system-level metering in this report.
Component or Equipment - The owner-installed meter measures the input to a single piece of building equipment, such as a boiler or chiller. Often this metering is combined with other sensors that measure the output of such equipment in order to monitor the relative input-to-output ratio.
There are more formal and complete taxonomies7,8
3 Assessment of Demand Response and Advanced Metering, FERC, August 2006, Docket No. AD-06-2-000, page vi
that present order and definition of what building systems consume with recommendations over calculations and trending.
4 Motegi, Piette, Web-Based Energy Information Systems for Large Commercial Buildings, LBNL-4997, May 2002, Lawrence Berkeley National Labs 5 Sullivan, Hunt, Pugh, Metering Best Practices, Federal Energy Management Program, US DOE, October 2007, page 2.1 6 Commercial Buildings Energy Consumption Survey (CBECS), Table B.22, US DOE, 2003 7 Bareley, Deru, Pless, Torcellini, Procedure for Measuring and Reporting Commercial Building Energy Performance, NREL, October 2005

Advanced Metering and Energy Information Systems
New Buildings Institute July 3, 2009 6
The installation of an EIS, at whatever scale, involves costs and provides benefits that create an overall value proposition for the owner. Some costs are relatively fixed (hardware, software, data storage, maintenance). Others depend on building specifics (installation, tenants, integration with existing building systems, maintenance procedures). In addition to the hard and soft costs, owners must be able to act upon the new information either through their own building staff or via the energy service consultant or service technician for the building and its systems. Benefits of an EIS system come in the form of cost avoidance, either in early detection of operating problems, feedback on cost trends, leveraging time-of-use (TOU) rates in areas that apply, or adherence to regulatory/policy requirements.
1.2 Ownership Structure The advanced meters that comprise an EIS may be installed by the owner, a third-party energy monitoring service provider, or the utility. Building Owner/Manager: Owners own and maintain the meters and analyzes the data themselves. This is most common when the owner plans active utilization and has a capable staff. Data storage is usually leased and software tools are third-party or supplied by the vendor. Energy Monitoring Service Provider: An owner-selected third-party Energy Monitoring Service Provider that offers a full-service package of equipment, installation, periodic status reports, enhanced tools and perhaps even efficiency consulting and contracting services. Utility Entity: The serving utility installs advanced electric, gas or water metering, perhaps as part of an AMI. The owner, or an energy service provider retained by the owner, can access data through a web portal and use the analysis tools provided or manually download interval data into a third-party software tool.
1.2.1 Utility Installed Advanced Meters vs. Owner Installed Advanced Metering
When a utility installs an advanced meter as part of an AMI, as discussed in Section 2.2, the only meters affected are those for the building service accounts. For electric and gas, there may be more than one account (and meter) servicing the facility, and the electric and gas utilities are likely to be different companies. Thus the utility company installation of advanced metering for gas may not occur simultaneously with an installation for electricity, and the data may reside in different databases. In addition, utilities, for logical reasons, are concerned with data security; however, the security measures, combined with the reasons above, often deter owners and energy monitoring companies from using the utilities’ advanced meter data. Owner-installed advanced meters provide an EIS with more flexible and consistent control over the meter data and allow installation at any level of the building, with one database for all data collection and, in most cases, more sophisticated tools for data analysis. This comes at a higher per-site cost, presenting challenges for the owner wanting to justify initial costs on the basis of anticipated, directly-related savings.
8 Gilespie et. al, A Specification for Performance Monitoring, Specifications Guide Version 1, LBNL, March 2007.

Advanced Metering and Energy Information Systems
New Buildings Institute July 3, 2009 7
An important distinction between utility-installed and owner-installed advanced metering is that owner installations can’t be used to support alternative rate structures. An often mentioned benefit of advanced metering and EIS is the ability to respond to price signals9 to reduce costs. In order to participate in alternative rate structures, the utility must install a meter that can monitor these time periods. This meter may or may not provide the interval data according to definitions10 of advanced metering, but owner-installed metering cannot be used for settlement of the transaction11
. Owner-installed metering may be used to “shadow” utility metering (i.e., installed just downstream from the utility meter) and used as a proxy to change control settings to achieve the desired effect at the utility meter.
The technologies used by utilities for metering, data collection and storage in an advanced metering system are similar to technologies used in owner-installed systems. In general, electric, gas and water meter technology is standard for all systems. The difference comes with the method for data acquisition, which for utilities is on such a large scale that AMI installations can employ more specialized methods that are amenable to mass installations. Owner-installed metering is typically a site-by-site installation that must accomplish all the tasks of measuring, data collection and storage individually. This paper focuses on owner-installed EIS and discusses utility-installed advanced metering in terms of availability and how the owner must work with the utility to acquire interval data from utility advanced meters.
1.3 What is the Status of Owner-Installed EIS technology? This paper provides an overview to the current technologies and descriptions of EIS components and cost quotes from vendors for owner-installed hardware and included software, with some basic clarifications of software capabilities. This is followed by a discussion of some of the current and emerging analysis methods used in conjunction with EIS equipment. Finally, the paper discusses motivations and impediments toward greater market penetration for advanced meters and EIS. Data was gathered from interviews with key personnel in the field of performance monitoring, meter and energy management system vendors, utility energy managers and regulatory officials.
9 E.g. Time-of-Use Pricing, Real-Time Pricing, or Critical Peak Pricing. 10 Advanced Utility Metering, Architectural Energy Corporation, NREL SR-710-3359, 2003 11 Settlement refers to the process of establishing the amount and price of energy bought and sold. The utility will only allow settlement with the utility-installed meter. As an exception direct load control demand response programs often allow interval data from an owner-installed meter to be used for settlement.

Advanced Metering and Energy Information Systems
New Buildings Institute July 3, 2009 8
2 Energy Information System Components An Energy Information System for performance monitoring is comprised of a package of advanced meters, data collection with remote communications and data storage, and software tools which make it possible to collect and analyze energy usage data in nearly real time. More detailed information can be found in the Metering Best Practices12, the Advanced Utility Metering report13
, and several references from Lawrence Berkeley National Laboratory (LBNL). This section briefly examines standard technologies and costs that are most common in practice, with notable new product entrants, to provide a sense of typical costs.
The five basic components, illustrated in Figure 1, are: 1) Meter and sensors. The meter gathers energy use data from current or flow sensors and
transfers the data to the second element, a data acquisition system (DAS). There may or may not be a display for site personnel to read. Other sensors which track conditions in the building, such as temperature, light levels or on/off status, may also connect to the DAS. Meters may automatically output data or be polled for data by the DAS at regular intervals - thus the term interval data.
2) Data Acquisition System. The DAS coordinates collection of data from multiple
meters/sensors using a wired or wireless communications network. The DAS may be standalone or part of a building automation system capable of data recording, with the data typically stored as “trend logs.” Data is transferred from the DAS to the remote database via the Gateway.
3) Gateway and Communications Service. A device that sends the meter and sensor interval
data from the DAS to the Remote Database at pre-selected times via a communications service such as an internet connection, cellular, wireless, etc. The Gateway and DAS are often combined into a single unit. The pre-selected time ranges from “instantly” to once daily; communication costs vary depending on the frequency and amount of data collected.
4) Remote Database. A remote database server for data storage and processing, usually a web-
based data repository provided by the vendor of the EIS equipment. Once in the remote database, data is viewable using the fifth element, software tools.
5) Software Tools for Energy and Data Analysis. A web-based (or web-accessing) software
program that allows the user to access the Remote Database and review the data, use analysis tools and set up reports. The predominant model in the industry is Application Service Provider (ASP) where a web-based software tool accesses the remote database.
12 Sullivan, Hunt, Pugh, Metering Best Practices, Federal Energy Management Program, US DOE, October 2007 13 Advanced Utility Metering, Architectural Energy Corporation, NREL SR-710-3359, 2003

Advanced Metering and Energy Information Systems
New Buildings Institute July 3, 2009 9
Figure 1. The process diagram for data collection from meters to software tools
These five data collection functions are not always contained in separate pieces of equipment; frequently the same vendor offers all the components from the DAS to the software tools. Advanced meters are more interchangeable and can be purchased from individual vendors as long as they conform to the DAS communication method of the EIS.
2.1 Metering Technology This section provides basic descriptions of advanced meters as background for the later description of components needed to implement an EIS. Prices are given as a range typical for the most common equipment and for a retail purchase by an individual owner, as of winter 2008.
2.1.1 Electric Meters Basic electric meters measure energy over time, much the same way a car’s odometer measures miles traveled. Total energy flow past the meter is tracked through one or more wires, or phases, by measuring the current and voltage for each phase. Advanced electrical meters with display and a data port cost $200 - $300; sensors are sold separately for $40 - $80 per phase with separate voltage sensors. Cost of installation will vary and requires an electrician or trained facility personnel. Newer products may not look like a classic “meter” with a display. A new low-form factor meter combines the sensing and signal processing in a single enclosure with a simple industry standard data output. The devices are installed in electrical panels and cost between $400 - $700.
2.1.2 Natural Gas Meters Natural gas meters measure a volumetric flow of gas, which represents a certain amount of energy content. Ambient temperature and pressure affect the measurements, so most meters are installed downstream of pressure regulators and use a temperature compensation adjustment to ensure accuracy. The two most common types of gas meter are diaphragm and rotary.

Advanced Metering and Energy Information Systems
New Buildings Institute July 3, 2009 10
Diaphragm meters measure gas flow using a volumetric bellows and are used frequently by utilities and often by owners as performance or sub-metering meters. They are inexpensive and don’t require frequent calibration; however, as gas flow rate increases, they can become quite large in size. The cost is $150 - $500 dollars depending on size and output data to a display or data port, or both. A rotary meter uses a rotating propeller to indicate volumetric flow and is typically smaller than a diaphragm meter. They are calibrated for temperature and pressure and output usage information to a display or data port. These meters cost $300 - $500 depending on flow capacity. They are better suited to higher volume flow rates where the diaphragm meter may be too large. Rotary meters require more frequent calibration.
2.1.3 Additional Meters and Sensors To enhance their monitoring packages, many vendors offer additional sensors which are compliant with the DAS communications. Additional sensors include temperature, humidity, occupancy sensing, light levels, on/off, etc. While not directly addressed in this paper, they may be useful in addressing specific operational problems or to augment the meter data in diagnosing operation problems. Buildings in the northeastern U.S. and campus/district buildings may use fuel oil, steam or heated/chilled water as a primary fuel. As mentioned in the Introduction, they are much less prevalent in commercial buildings than electricity and natural gas, so are not detailed here. Meters14
14 Sullivan, Hunt, Pugh, Metering Best Practices, Federal Energy Management Program, US DOE, October 2007
can be purchased for these fuels that use standard data output signals to incorporate into a Data Acquisition System.

Advanced Metering and Energy Information Systems
New Buildings Institute July 3, 2009 11
2.2 Utility Meters: Upgrades and Advanced Metering Infrastructure
Most facilities already have utility meters at the whole building level which an owner can leverage to gather site-level interval data. In some cases this can be less expensive than an owner-installed meter. The type and functionality of a utility meter installed in or planned for a building determines the options for how that meter can be interfaced to gather the desired data.
• If the meter is a conventional water, gas or electric mechanical or solid-state device with no data collecting capability, either:
o Install a Meter Dial Reader that electronically reads the dials off the display, or o Request a utility upgrade to a version that provides a pulse output15
• If the meter is already an AMI or AMR meter capable of collecting interval data:
proportional to the metered use and can be read by an owner-installed EIS.
o Retrieve the data directly from the utility database, or o Request a replacement AMI/AMR meter with a local pulse output.
2.2.1 Meter Dial Reader Attached to conventional dial meters, these monitor the physical turning of the disk or dial that indicates usage on a gas, electric or water meter. This type costs approximately $200 and typically uses a pulse output to indicate usage. Some industry practitioners do not consider this a robust solution due to the impermanent nature of the attachment and a relatively higher error rate.
2.2.2 Pulse Output Upgrade The total cost of a utility pulse-output upgrade varies from $0 – $2,00016
or more for electric meters, depending on utility. Some charge a monthly fee for the pulse output in addition to the one-time upgrade charge. The variation in upgrade policy and price reflects the wide variation in business practices from utility to utility. Upgrades from gas meter to pulse output are generally not as available from utilities as electric meter upgrades. In addition, some meters are not suitable for upgrade due to the nature of the dial display.
The time between a request for a meter upgrade and the installation may be weeks or months and may require an application process.
2.2.3 Utility AMI and AMR Meters: The utility industry is now discussing establishment of a “smart grid.” Part of the smart grid concept relies on detailed energy use data at all customer meters. The data are provided via an AMI17 for all customers in a service territory, leveraging it to improve customer service and reduce operating among other stated goals18
. AMI installation may also communicate bi-directionally to send price signals and other information to the meter. Benefits to the commercial building owner are:
15 A pulse output is a very common meter data communication method. The electric or gas meter will provide an electronic pulse when it measures a certain amount of usage. 16 Various interviews. 17 Assessment of Demand Response and Advanced Metering, FERC, December 2008 18 Ibid, page 12

Advanced Metering and Energy Information Systems
New Buildings Institute July 3, 2009 12
• Utility meter data at intervals of one hour or less and the ability to retrieve data to a central storage point at least daily.
• The potential for daily access of meter data in a utility database and some graphical energy tracking tool.
The term Automated Meter Reading, an earlier technology than AMI, only moves information in one direction - from the meter to the utility.
Some utilities with AMI/AMR systems offer basic web-based analysis of data and trends for account holders, typically at no charge. The capabilities and analysis methods differ, but all offer access to raw hourly interval data. Some utilities are incorporating advanced functions such as benchmarking through Energy Star’s portfolio manager, but often the AMI meter only measures gas or electricity individually. The utility can provide management and forecasting functions but will not represent total facility usage information.
Relatively few AMI meters are currently installed. A recent report19
noted market penetration of nonresidential meters at 4.2%. This defines the percentage of meters providing hourly data each day. Older technology and AMR systems may provide interval data less frequently, which can still be useful in facility analysis. The lowest technology meter, with no communication or interval capabilities, still comprises 85 million out of 145 million electric utility meters in North America though 52 million AMI meter installations are now reported to be announced.
Table 1 summarizes the penetration of both residential and non-residential utility meters in the U.S. Table 1. Electric AMI penetration by state for residential and non-residential customers20
.
State Advanced Metering Penetration (%)
Pennsylvania 23.9 Idaho 13.8 Arkansas 11.3 North Dakota 8.9 South Dakota 8.7 Oklahoma 8.6 Texas 8.0 Florida 8.0 Georgia 7.6 Missouri 6.6
19 Assessment of Demand Response and Advanced Metering, FERC, December 2008 20 Ibid, page 30

Advanced Metering and Energy Information Systems
New Buildings Institute July 3, 2009 13
2.3 Data Acquisition, Communication, and Storage The data acquisition process collects data from meters and sensors and sends it to a remote database via a gateway. Meters and sensors output a signal at a data port to indicate the quantity measured. The signal is some form of industry standard which may be as simple as a pulse output (a simple voltage pulse that indicates a certain quantity of commodity has passed the meter) or as complicated as a formal data protocol like TCP/IP or ModBUS21
2.3.1 Data Acquisition System
. The meter is purchased to be compliant with the chosen DAS.
The simplest method of DAS communications is direct wiring: a set of current or flow sensor outputs are directly wired to the DAS/Gateway. This means no “meter” in the sense of a display with dials or a digital screen. This type of DAS/Gateway is usually designed to handle a small number of inputs, typically fewer than 16. When multiple meters and sensors are used or if the distance between meters and the DAS is large, a networked DAS communication method (either wired or wireless) is needed. In general, wired communication22
is better for situations with fewer meters that are in close proximity or if there is an existing building automation system or local area network (LAN) that can be used to gather the data.
Wireless communications are recommended when larger numbers of meters must be installed and there is no easy access for wiring. Installing long runs of data cable can rapidly become more expensive than the EIS components themselves. There is a trade-off, however, between cost and communications reliability, which can be a problem with a wireless network. One notable communications method gaining in popularity is wireless-mesh, which is relatively robust compared to ordinary point-to-point wireless. Each component in a wireless mesh system communicates with its neighbors to form a network, creating a flexible set of sensors and meter points that can be easily moved around. Some meters have a wireless communication system built into the meter itself, while some use components that serve as an interface which inputs a meter output signal and communicates it wirelessly to the DAS. As of 2008, standards are still in development, though no clear standard is widely available allowing vendors to interchange wireless mesh components. Notably, some owner-installed meters are equipped with a web server23
2.3.3
that connects to a LAN and provides data via a firewall to the remote database. This method removes the extraneous DAS equipment but does not alleviate the management issues that arise with utilizing the LAN for communication with the remote database, as discussed in .
2.3.2 Building Automation Systems, Integrated Platforms, and Middleware Larger buildings are often outfitted with a Building Automation System which controls equipment to maintain comfort and schedule operations in the building. Some BAS are capable of collecting, storing and outputting data from meters and sensors, often called trend logs, like a
21 MODBUS is the most common electrical meter communication protocol 22 This can be misleading as direct wiring of meters often uses one or two individual wires but networked protocol-based DAS some form of data cable. 23 Energy Advantage
Advanced Metering and Energy Information Systems
New Buildings Institute July 3, 2009 14
Data Acquisition System. These BAS are sometimes leveraged24
to provide the EIS functionality without the costly installation of meters, sensors and a DAS.
Since larger buildings have higher fuel costs, they are often good cost/benefit candidates for EIS and performance monitoring. A number of vendors have emerged to serve this market. Some energy monitoring service providers can reprogram the BAS computers to provide an automated data transfer to the remote database via a standard data format. Comma-separated value (CSV) files are a standard, but increasingly the BAS industry is experiencing a dramatic convergence25
with IT-based technology, and XML is becoming the standard.
Other vendors of products called integrated platforms, or middleware, create an overlay for the BAS that extracts data and changes control settings using web-based tools in a more sophisticated fashion than the original BAS designer intended. Middleware vendors usually focus on very large buildings26 and sell hardware and software that utilize the latest in IT technology to enhance the often older technology BAS. Recently several acquisitions27
underscored the converging nature of this and the BAS industry in general. This convergence may allow for smaller buildings to merge IT needs with energy management, reducing costs to just the marginal equipment cost.
The presence of an existing BAS does not guarantee its suitability or that it is the best choice for performance monitoring. Retrieval of trend logs for transfer into a remote database can be difficult; meter measurements can be non-totalizing, which does not provide meaningful usage data. An independent meter reading DAS can allow for sophisticated analysis without getting into the murky details of BAS operations (which can be proprietary). Costs for middleware technologies are highly specific and usually packaged with a sophisticated software tool and sometimes full-time energy monitoring; the costs are therefore not stated here. Some vendors28
2.3.3 Gateway and Communications Service
are increasingly offering control system products that may be attractive to owners of small commercial buildings. This may encourage participation in demand-response programs, perhaps improving the value proposition enough to prompt installation of a system that includes advanced meters and regular performance monitoring.
In computing, the term “gateway” refers to a device which interfaces two systems that use differing communications protocols. For an advanced meter or EIS package, we use the term to refer to the device that transmits data collected by a DAS to a remote database, usually via a telephone modem or LAN, although satellite and cellular data service is becoming increasingly affordable. The gateway and DAS are frequently combined in a single unit.
24 Kiliccote, Piette, Advanced Control Technologies and Strategies Linking Demand Response and Energy Efficiency, ICEBO Conference Paper, September 2005 25 McGowan, Convergence, Energy User News, November 2003 26 A minimum of $700,000 and $1 million in annual energy expenditure per site was estimated by two vendors 27 Press releases: Cisco Acquires Richards-Zeta Building Intelligence, Inc. – January 27, 2009 ; Johnson Controls Acquires Software company Gridlogix – October 20, 2008 28 Demand Response Enabling Technologies for Small-Medium Businesses, Prepared by Lockheed Martin for Southern California Edison, April 2006

Advanced Metering and Energy Information Systems
New Buildings Institute July 3, 2009 15
Table 2 describes available communication options and estimated monthly pricing. Costs vary depending on amount of data retrieved and frequency of retrieval. All vendors can accommodate at least phone and LAN communications. Many vendors will package the monthly communication costs with data storage and analysis software, so communications costs may not be expressly quoted. Note that using an existing LAN at the building is technically free (the marginal cost for the data transfer is zero), but there may be a labor component by the owner’s IT department or ISP. At times, utilizing LAN communications has resulted in IT issues with firewalls and protections, though vendors have become more adept at dealing with these issues. Some vendors use only cellular communications, which are more expensive but eliminate firewall concerns. Table 2. Gateway Communications Typical Service Cost Estimates
Service Typical Monthly Cost
Comment
Dedicated telephone modem 30
Dedicated and hardwired phone line monthly cost. Limited data capacity. Phasing out in favor of LAN/cellular.
Local Area Network (LAN) 0 Using exiting LAN with modem. May
have firewall problems. Dedicated
Cable/DSL Modem 60 + Connect a modem directly to Gateway. Expensive but reliable.
Cellular (GSM/GPRS or
CDMA)
30 – 250
Expensive but eliminates wiring and LAN issues. Costs depend on data interval and upload frequency.
Wi-Max No cost information Emerging technology. Initial prices are comparable to cellular.
Wi-Fi 0 – 30
Need existing Wi-Fi network. Costs depend on data interval and upload frequency.
2.3.4 Database and Data Storage It is often most cost effective to use the vendor of the DAS/Gateway equipment to provide secure web-based data storage. Storage, as well as an analysis package, is often included in the initial or monthly price. The data may also be stored with a third-party software provider. Storage costs are often not mentioned as a cost component. Vendors may not store data for long periods, i.e. more than a few years, in order to reduce the burden of data storage.
Advanced Metering and Energy Information Systems
New Buildings Institute July 3, 2009 16
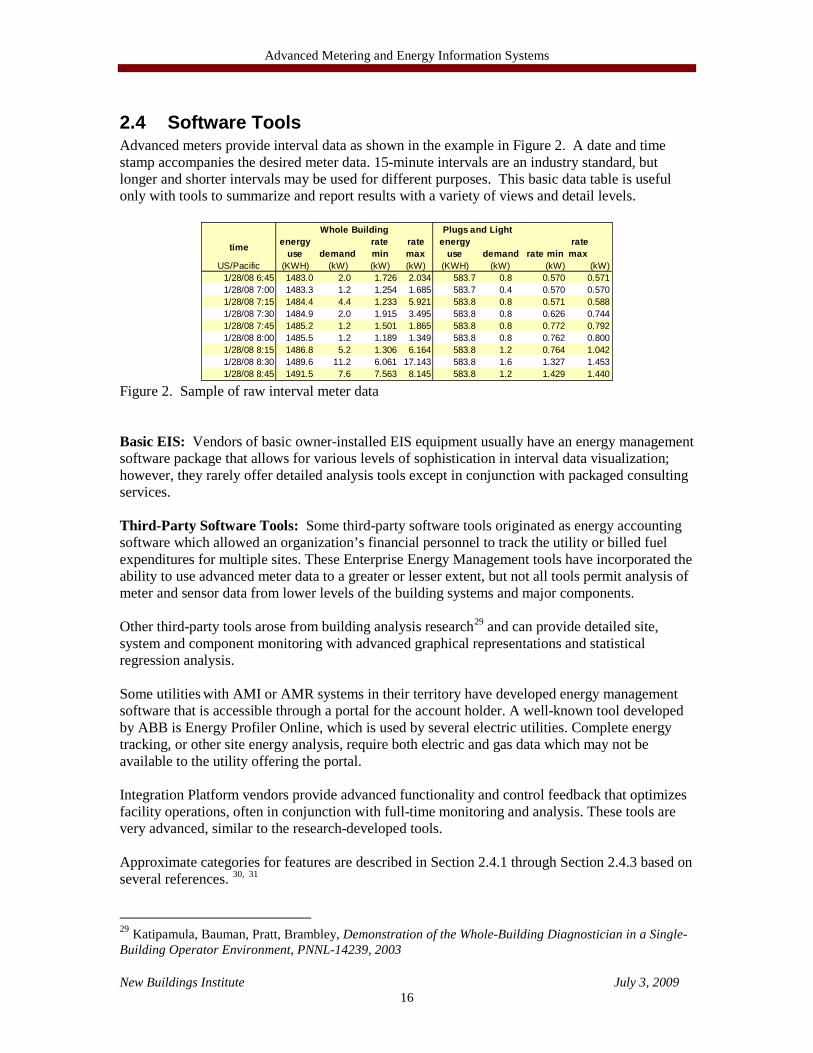
2.4 Software Tools Advanced meters provide interval data as shown in the example in Figure 2. A date and time stamp accompanies the desired meter data. 15-minute intervals are an industry standard, but longer and shorter intervals may be used for different purposes. This basic data table is useful only with tools to summarize and report results with a variety of views and detail levels.
Figure 2. Sample of raw interval meter data Basic EIS: Vendors of basic owner-installed EIS equipment usually have an energy management software package that allows for various levels of sophistication in interval data visualization; however, they rarely offer detailed analysis tools except in conjunction with packaged consulting services. Third-Party Software Tools: Some third-party software tools originated as energy accounting software which allowed an organization’s financial personnel to track the utility or billed fuel expenditures for multiple sites. These Enterprise Energy Management tools have incorporated the ability to use advanced meter data to a greater or lesser extent, but not all tools permit analysis of meter and sensor data from lower levels of the building systems and major components. Other third-party tools arose from building analysis research29
and can provide detailed site, system and component monitoring with advanced graphical representations and statistical regression analysis.
Some utilities with AMI or AMR systems in their territory have developed energy management software that is accessible through a portal for the account holder. A well-known tool developed by ABB is Energy Profiler Online, which is used by several electric utilities. Complete energy tracking, or other site energy analysis, require both electric and gas data which may not be available to the utility offering the portal. Integration Platform vendors provide advanced functionality and control feedback that optimizes facility operations, often in conjunction with full-time monitoring and analysis. These tools are very advanced, similar to the research-developed tools. Approximate categories for features are described in Section 2.4.1 through Section 2.4.3 based on several references. 30, 31
29 Katipamula, Bauman, Pratt, Brambley, Demonstration of the Whole-Building Diagnostician in a Single-Building Operator Environment, PNNL-14239, 2003
Whole Building Plugs and Light
time energy use demand
rate min
rate max
energy use demand rate min
rate max
US/Pacific (KWH) (kW) (kW) (kW) (KWH) (kW) (kW) (kW)1/28/08 6:45 1483.0 2.0 1.726 2.034 583.7 0.8 0.570 0.5711/28/08 7:00 1483.3 1.2 1.254 1.685 583.7 0.4 0.570 0.5701/28/08 7:15 1484.4 4.4 1.233 5.921 583.8 0.8 0.571 0.5881/28/08 7:30 1484.9 2.0 1.915 3.495 583.8 0.8 0.626 0.7441/28/08 7:45 1485.2 1.2 1.501 1.865 583.8 0.8 0.772 0.7921/28/08 8:00 1485.5 1.2 1.189 1.349 583.8 0.8 0.762 0.8001/28/08 8:15 1486.8 5.2 1.306 6.164 583.8 1.2 0.764 1.0421/28/08 8:30 1489.6 11.2 6.061 17.143 583.8 1.6 1.327 1.4531/28/08 8:45 1491.5 7.6 7.563 8.145 583.8 1.2 1.429 1.440

Advanced Metering and Energy Information Systems
New Buildings Institute July 3, 2009 17
2.4.1 Basic Software Tool Features A basic web-based tool provides:
• Tabular and graphic summaries of total energy use by month and year, for each fuel and the total of all fuels
• Tabular and graphic displays of daily demand profiles • Capable of downloading data sets to spreadsheet
2.4.2 Intermediate Software Tool Features Advanced software packages provide a higher technical level of analysis and allow for incorporation of meter data from all levels including whole building, subsystem and component. Accounting-focused software may not allow for system or component level data but will track performance metrics and EPA’s Portfolio Manager score and may be capable of basic predictive analysis.
• Automated calculation and tracking of energy use index (EUI) and automated benchmarking through the EPA Portfolio Manager or other tool
• Modest statistical analysis to identify unusual trends • Weather normalizing capability, with options to combine other normalizing metrics • Multiple options for time series visualization, overlapping and trending • Adroit management of data from multiple meters including performance indicator
analysis for each component
2.4.3 Advanced Software Tool Features The most advanced software packages incorporate most of the above attributes and offer further analysis, often requiring multiple meters at different levels and some customization.
• Neural network-based analysis of trends • Sophisticated statistical regression analysis • Detailed equipment performance monitoring for HVAC components. • Automated and detailed building energy modeling to compare with interval data • Detailed time block-differentiated predictive algorithms and display techniques • Separated financial asset management, facility management, and design feedback
performance indicators • Multiple time series visualization tools
Researchers at LBNL will be releasing a more detailed study in 2009 regarding available software tools, their capabilities and costs.
30 Motegi, Piette, Web-Based Energy Information Systems for Large Commercial Buildings, LBNL-49977, May 2002, Lawrence Berkeley National Labs 31 Better Bricks website: http://www.betterbricks.com/DetailPage.aspx?ID=518, accessed 3/2009

Advanced Metering and Energy Information Systems
New Buildings Institute July 3, 2009 18
3 Costs for Basic EIS Technology This section describes the costs for a “basic” owner-installed EIS consisting of whole building electric and gas service. The costs in Table 3 reflect the estimates of selected vendors in 2008 to provide the DAS/Gateway, remote communications, data storage and default software tool capable of measuring site electricity and natural gas for a building. Advanced metering costs are not included in Table 3 but are estimated in Table 4 so total capital cost may be estimated. Many circumstances can affect the cost of a system, and any installation should identify organizational goals and limitations before pricing systems. Integrated platforms, BAS-based and utility-installed EIS are not cost estimated. Table 3. Estimated Costs for DAS/Gateway, Storage, and Software Tools for Selected Vendors
Vendor DAS and Gateway
($)
Extra Costs Annual
( + One-time Set-up)
DAS Communications
Type
Number of Hardwired Points per unit (N)
Software Analysis
Capability Level
Additional Comments
A 800 0 (+90) hardwired 16 Basic LAN gateway
communications included
B 700 60 wireless mesh 0 Basic LAN gateway
communications included
C 1650 200 (+200) hardwired 4 Basic Software has data
viewing and download only
D 500 250 hardwired 16 Intermediate Monitoring and
Reporting included
E 750 1200 hardwired n/a Advanced Monitoring and Reporting and
cellular gateway included
F 800 0 hardwired 4 Intermediate
Full Service Mechanical
Consulting And Monitoring Required
Installation costs also vary by many factors. For general information purposes the time required for site-level advanced meter installations is shown in Table 4. Table 4. Estimated labor requirements for whole building level meter installations32
Type
Description Typical Hours to Complete Labor Type
Estimated Total Installed
Cost ($) Electric Sensor Installation 2 – 4 Electrician 800
Gas Meter install with Service Interruption > 4 Tradesperson 950
The total cost range for an owner-installed basic EIS with electric and natural gas metering is $2,500 - $4,000.
32 Source: NHT Technologies
Advanced Metering and Energy Information Systems
New Buildings Institute July 3, 2009 19
4 Data Usage Analysis Methods Ideally, advanced meter data is analyzed using software tools to simplify building operation and management. The intricacy of analysis increases with the complexity of major systems and methods of heating and cooling distribution. While discussion of all methods is outside this paper’s scope, certain methods have become popular for buildings at different levels, including:
• Portfolio energy tracking – Enterprise Energy Management • Benchmarking and Baselining • Interval data analysis • Key Performance Indicators (KPI)
As advanced metering and EIS hardware costs decrease, there are opportunities to apply more advanced automated diagnostic tools to these standard analysis methods.
4.1 Portfolio Energy Tracking Energy use comparisons between different sites must be normalized for area. By comparing the energy use per square foot (energy use index, or EUI), a portfolio of buildings can be tracked. EUI is calculated monthly or annually, and buildings within a portfolio are compared against each other. Financial metrics and utility bill verification are often features of tools that perform energy tracking and enterprise energy management (EEM). Some EEM software tools can accommodate advanced meter data; others only use utility account, or billing, data. Tracking this basic EUI information, at the level of the whole building and combination of all fuels, can help identify major changes over time and the best and worst performing buildings in the portfolio. To understand more about what is driving those differences, it is essential to view data in at a more detailed level.
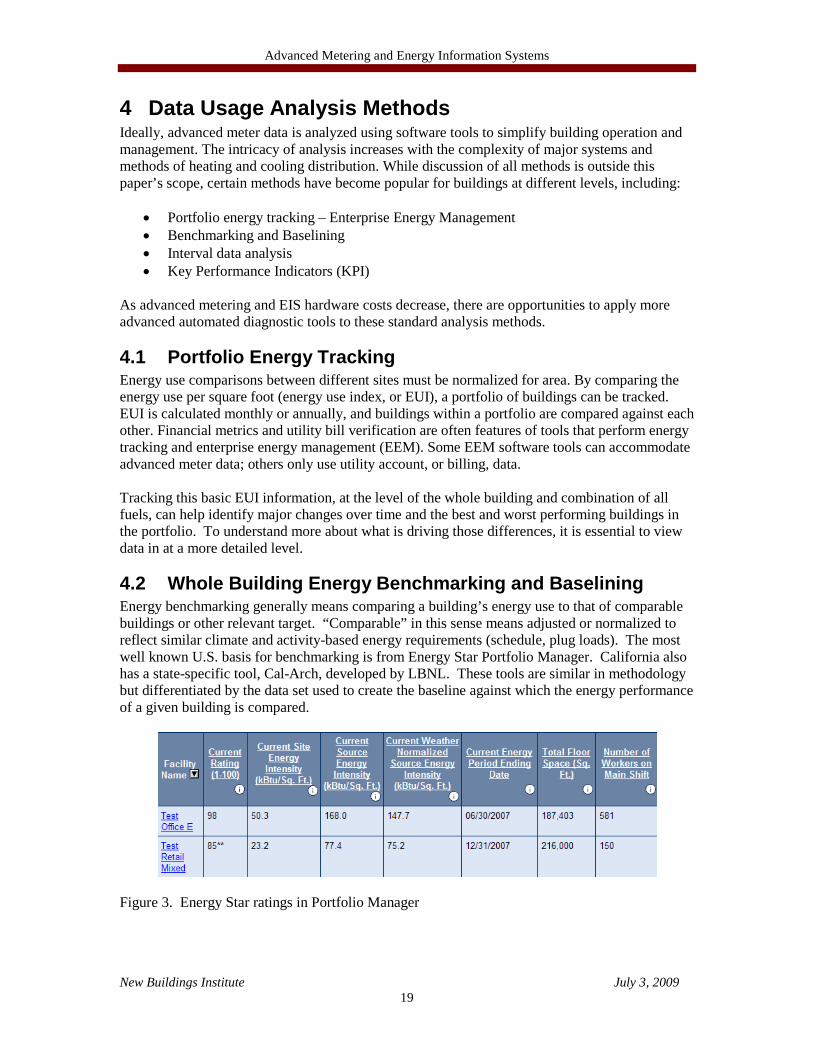
4.2 Whole Building Energy Benchmarking and Baselining Energy benchmarking generally means comparing a building’s energy use to that of comparable buildings or other relevant target. “Comparable” in this sense means adjusted or normalized to reflect similar climate and activity-based energy requirements (schedule, plug loads). The most well known U.S. basis for benchmarking is from Energy Star Portfolio Manager. California also has a state-specific tool, Cal-Arch, developed by LBNL. These tools are similar in methodology but differentiated by the data set used to create the baseline against which the energy performance of a given building is compared.
Figure 3. Energy Star ratings in Portfolio Manager

Advanced Metering and Energy Information Systems
New Buildings Institute July 3, 2009 20
The Portfolio Manager tool normalizes results for building activity type, temperature, occupancy and location by comparing a building’s EUI for a year with like-type buildings created from a linear regression of the US Department of Energy CBECS data set. Some energy management software tools incorporate automated upload of data to Portfolio Manager, using EPA’s XML web services capability, which eliminates the user’s need to separately enter information in that tool. Monitoring service practitioners report33
this is a motivator for building owners to install advanced metering and EIS. Automated ratings provide a convenient way to establish benchmarked evidentiary data on high performance buildings.
Energy Baselining refers to comparing energy performance in a period to a base period, typically one year, to monitor for deviations or evaluate achievements of implemented changes. Baselining may be applied at the whole building, system or equipment level. Examining the change in the Portfolio Manager score over time is a method of Baselining. Baselining becomes more valuable as the metrics are normalized, i.e. applying statistical analysis to remove variations due to weather, occupancy, and other variables.
4.2.1 Temperature Normalization and Temperature Independent Analysis Temperature or weather normalization usually refers to adjusting measured energy data for particularly high or low temperatures during the period, relative to an average weather year. The normalized results permit year-to-year comparisons that show changes in building efficiency or occupant requirements, not distorted by weather-related differences in heating or cooling needs. Weather-based differences in full-year heating and cooling energy of a commercial building are not typically large in relation to total annual energy use, but normalizing for these variations is essential in comparing an individual month’s energy use or to quantify changes from efficiency programs. Isolating the impact of temperature differences can be accomplished by explicitly plotting EUI for a given period (such as a billing period) against average temperature or a degree-day calculation. Figure 4 shows one example of relating energy use to temperatures, which much more clearly displays that current year heating use (green squares and dotted line) has been higher than the base year in cold weather (here expressed in degree days rather than °F).
Figure 4. Temperature-normalized savings (Utility Manager)
33 Various interviews
Advanced Metering and Energy Information Systems
New Buildings Institute July 3, 2009 21
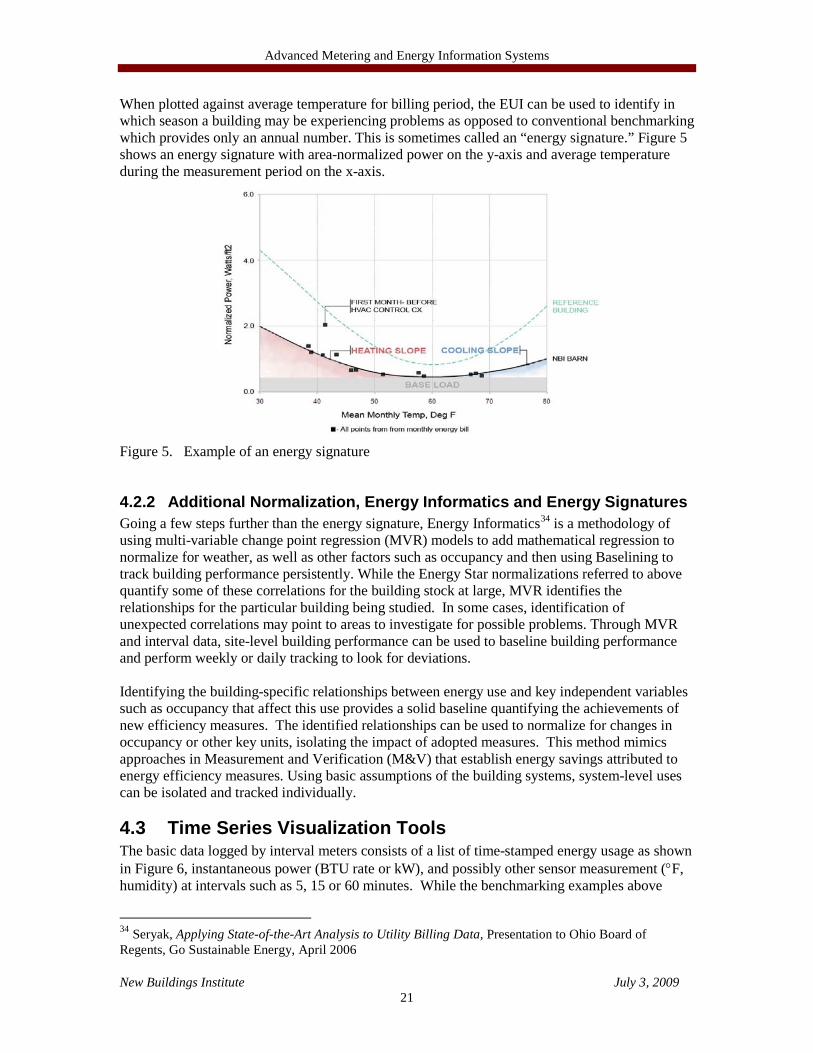
When plotted against average temperature for billing period, the EUI can be used to identify in which season a building may be experiencing problems as opposed to conventional benchmarking which provides only an annual number. This is sometimes called an “energy signature.” Figure 5 shows an energy signature with area-normalized power on the y-axis and average temperature during the measurement period on the x-axis.
Figure 5. Example of an energy signature
4.2.2 Additional Normalization, Energy Informatics and Energy Signatures Going a few steps further than the energy signature, Energy Informatics34
is a methodology of using multi-variable change point regression (MVR) models to add mathematical regression to normalize for weather, as well as other factors such as occupancy and then using Baselining to track building performance persistently. While the Energy Star normalizations referred to above quantify some of these correlations for the building stock at large, MVR identifies the relationships for the particular building being studied. In some cases, identification of unexpected correlations may point to areas to investigate for possible problems. Through MVR and interval data, site-level building performance can be used to baseline building performance and perform weekly or daily tracking to look for deviations.
Identifying the building-specific relationships between energy use and key independent variables such as occupancy that affect this use provides a solid baseline quantifying the achievements of new efficiency measures. The identified relationships can be used to normalize for changes in occupancy or other key units, isolating the impact of adopted measures. This method mimics approaches in Measurement and Verification (M&V) that establish energy savings attributed to energy efficiency measures. Using basic assumptions of the building systems, system-level uses can be isolated and tracked individually.
4.3 Time Series Visualization Tools The basic data logged by interval meters consists of a list of time-stamped energy usage as shown in Figure 6, instantaneous power (BTU rate or kW), and possibly other sensor measurement (°F, humidity) at intervals such as 5, 15 or 60 minutes. While the benchmarking examples above
34 Seryak, Applying State-of-the-Art Analysis to Utility Billing Data, Presentation to Ohio Board of Regents, Go Sustainable Energy, April 2006
Advanced Metering and Energy Information Systems
New Buildings Institute July 3, 2009 22
come from viewing usage on an annual or monthly basis, interval data load profiles can identify whether equipment is left “on” during off hours or if there is a potential benefit to shifting loads to off-peak hours for reduced costs from a time-of-use rate plan. Monthly utility bills cannot provide this level of detail. Advanced interval data trending tools use graphical representations to simplify spotting irregularities. These tools include three-dimensional plotting, overlaying similar day types. Graphical trending methods can simplify the identification of aberrant behavior. Research is continuing into rule- and modeling-based approaches to automating detection of aberrant behavior, reducing the burden of analysis on energy managers. A simple standardized tool combining common time series analysis methods with common performance metrics like benchmarking may increase utilization of meter data by the owner or owner’s service contractor.
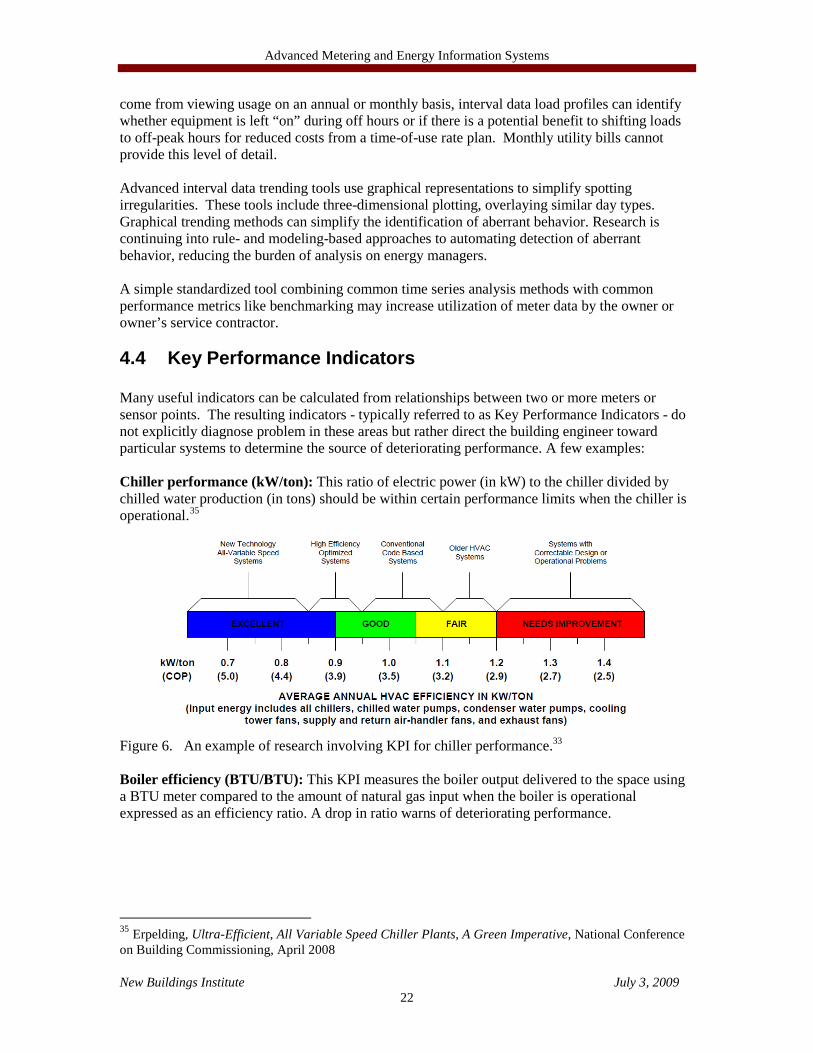
4.4 Key Performance Indicators Many useful indicators can be calculated from relationships between two or more meters or sensor points. The resulting indicators - typically referred to as Key Performance Indicators - do not explicitly diagnose problem in these areas but rather direct the building engineer toward particular systems to determine the source of deteriorating performance. A few examples: Chiller performance (kW/ton): This ratio of electric power (in kW) to the chiller divided by chilled water production (in tons) should be within certain performance limits when the chiller is operational.35
Figure 6. An example of research involving KPI for chiller performance.33 Boiler efficiency (BTU/BTU): This KPI measures the boiler output delivered to the space using a BTU meter compared to the amount of natural gas input when the boiler is operational expressed as an efficiency ratio. A drop in ratio warns of deteriorating performance.
35 Erpelding, Ultra-Efficient, All Variable Speed Chiller Plants, A Green Imperative, National Conference on Building Commissioning, April 2008

Advanced Metering and Energy Information Systems
New Buildings Institute July 3, 2009 23
5 Areas of EIS Utilization and Research in Commercial Buildings
Analysis of buildings using EIS has been occurring in several sectors of commercial buildings where either the cost effectiveness is well established or other research or regulatory/policy motivators have incentivized the buildings.
5.1 Large Commercial Buildings In large commercial buildings, the size of the energy expenditure is often great enough to justify installation of an EIS. A recent FEMP training session estimated an annual energy expenditure of $40,000 was necessary to justify installation of “advanced metering.” CBECS 2003 estimates an average of $1.43/ft2 in fuel expenditures; this approximately defines a “large” building as 28,000 ft2 or larger. According to CBECS 2003, this represents 90% of buildings and 38% of total, non-mall, commercial floor space. Another energy efficiency practitioner gives an estimate in terms of square footage of building space with 100,000 ft2 as a rule-of-thumb minimum for installation of a basic EIS monitoring electric and gas usage. Two vendors of middleware solutions, which target larger buildings, placed the minimum building annual energy expenditure at $700,000 and $1,000,000 respectively for cost-effective consideration. CBECS evidence points out the lack of energy management equipment by noting that only 4% of buildings under 50,000 ft2 have an “Energy Management Control System36
.” Unfortunately, buildings under 50,000 ft2 represent 50% of all non-mall commercial floor space.
Interviews with energy monitoring service providers reinforce the focus on larger buildings for profitable application of an EIS, though the metrics are varying and subjective. Further, service providers report that advanced metering is less useful for natural gas monitoring than for electricity. The cost effectiveness of EIS in large commercial buildings is generally agreed to be high, as shown by several efforts in research:
• Monitoring-based commissioning (MBCx) programs, where meter data is used on an ongoing basis to assist and maintain commissioning projects has been shown to dramatically increase the persistence, magnitude and cost effectiveness of commissioning new and existing buildings37
. The savings in total commissioning programs is reported as 15% with a 0.7 year payback, suggesting that permanent monitoring via EIS can improve savings even more dramatically. So far these programs are limited to college campuses but are now offered as a service by energy monitoring companies.
• The Continuous Commissioning process developed at the Texas A&M Energy Systems Laboratory is a similar approach to building energy management where
36 Energy Management and Control System (EMCS): An energy management feature that uses mini/microcomputers, instrumentation, control equipment, and software to manage a building’s use of energy for heating, ventilation, air conditioning, lighting, and/or business-related processes. These systems may also manage fire control, safety, and security. Not included as an EMCS are time-clock thermostats. CBECS 2003, Table B6. Building Size, Number of Buildings for Non-Mall Buildings, 2003 37 Criscione, What’s Working with Existing Building Commissioning Programs, E-Source, ERDP-F-23, 2008

Advanced Metering and Energy Information Systems
New Buildings Institute July 3, 2009 24
monitoring via an EIS provides constant feedback to maintain performance in improved efficiency systems. Energy savings and cost data exist for more than 130 buildings that show an average payback of 0.7 years.
Some areas where advanced meters and EIS have made inroads are situations where economies of scale or regulatory mandates exist.
5.2 Chain Commercial Buildings Some vendors of EIS equipment are focusing on chain store applications where economies of scale permit installation of metering in what would not otherwise be a cost-effective situation. This is done for the purposes of portfolio management and cost tracking. Hotels and retail outlets also present a good opportunity for energy monitoring and tracking.
5.3 Campuses and Government Facilities University campuses and government facilities are installing EIS to allocate utility costs and improve energy performance. Despite additional regulatory drivers described below, campus and government-owned buildings represent a situation where a single decision-maker is managing a portfolio and the value proposition is improved.

Advanced Metering and Energy Information Systems
New Buildings Institute July 3, 2009 25
6 Advanced Metering and EIS Penetration EIS not only provide information to the owner but also provide data that can be used to gather information regarding building performance. Persistence in Building Efficiency: The path to achieving net-zero energy buildings will typically require buildings which are 70% to 80% more efficient than standard practice. These buildings, both new and renovated, must continue to perform at these high levels of efficiency for their entire useful life; real-time performance monitoring with owner/operator feedback becomes critical.
Evidentiary Design: Surprisingly, there is little hard evidence correlating design and verified building performance. An initial 2007 study of LEED buildings carried out by New Buildings Institute showed little correlation between design and performance. Proof of performance is critical, both for proving out winning design elements and for continuous improvement that can lead to net-zero buildings. Advancing Building Performance Metrics: The next generation of energy codes and building programs may call for a departure from standard practice with regard to building performance reporting. Individual systems may have performance requirements to separate out effects from discretionary loads like plugs, tenant lights and processes from the core and shell loads like HVAC and common area lights.
6.1 Drivers for Increased Advanced Metering and EIS Installation
Availability – EIS hardware is well developed, and current technology is well suited to basic performance monitoring and benchmarking. It can also be scalable to use with more advanced methods of analysis. Costs have decreased in the last 10 years as hardware, software and data storage costs are decreasing. Wireless communications, whether from meter to DAS or from Gateway to database, assist in reducing the cost of advanced meter installations at system and component levels and are used frequently in sub-metering applications. Regulatory – Section 103 of the Energy Policy Act of 2005 is requiring managers of government facilities to install advanced metering, at the whole building level “…subject to determination of practicability.” As an example the Government Services Administration installed an EIS in 100 buildings nationwide as of 2009. EPA Portfolio Manager Interface and Automated Updates – One of the most often perceived advantages to owners for energy management is the ability to automate Portfolio Manager Benchmarking. A basic EIS is capable of automatic updates via XML transfer using the Portfolio Manager system.
Advanced Metering and Energy Information Systems
New Buildings Institute July 3, 2009 26
Small Building Control Systems – Emerging companies designing wireless communicating control systems38
for smaller buildings. Enabling energy management or demand response in smaller building may provide the value to justify the cost of advanced meter installation.
AMI/AMR installations – AMI/AMR systems provide the hardware side of an EIS, providing a cost savings to the owner. Ideally these can be used by the owner to track energy performance. Data Use Innovators Entering Marketplace – New companies are developing software and software/hardware solutions to address the energy analysis needs of the marketplace. Energy feedback through building displays and web tools is gaining popularity. California AB1103 - The State of California is requiring benchmarking, via EPA Portfolio Manager, for all state buildings and eventually all buildings sold in California. The utilities and state are working together to upload billing and AMI data when available, while maintaining confidentiality. This legislative requirement may drive owners to purchase advanced metering and EIS to automate compliance. Submetering – Owner-installed metering systems used for utility bill allocation (often called submetering) to tenants use the same technology as EIS. Additional meters to enable whole building or system Baselining and Benchmarking have a low marginal cost when a tenant sub-metering system already exists.
Demand Response – High value demand-response programs require interval meter data to verify performance. Similar to sub-metering, the marginal cost of adding additional meters and analysis functionality is reduced.
Carbon Accounting and Green Motivations – Advanced metering provides a building owner an easy method to gather the information needed to calculate and report these emissions.
6.2 Impediments to Increased Advanced Metering and EIS Installation
Awareness and Cost – Advanced metering is not often considered as a basic part of new construction or major renovation. The cost of advanced metering/EIS packages is sometimes hard to estimate with certainty, and potential benefits are not well understood. A common savings level39
for advanced metering and an EIS in commercial buildings is a minimum of 5%. As building size decreases, there is less data regarding the expected savings percentage. Marketplace separations between those who would purchase the equipment and those who would benefit from it further complicate decision making. Those separations may include developer/future owner, owner/tenant or owner/energy incentive program manager.
Shortage of Trained Personnel – Key performance indicators and benchmarking tools can be automated to some degree, but the necessity for human interaction to monitor and interpret results can never be eliminated. Smaller buildings tend to use fixed service contracts with HVAC technicians to reduce costs. These technicians are typically not trained in using energy consumption and interval data to make assessments.
38 Demand Response Enabling Technologies for Small-Medium Businesses, Prepared by Lockheed Martin for Southern California Edison, April 2006 39 Various interviews

Advanced Metering and Energy Information Systems
New Buildings Institute July 3, 2009 27
7 Conclusions and Recommendations Advanced metering and EIS hardware is well developed, and current technology is well suited to basic performance monitoring and benchmarking. The technology’s ultimate objective is more accessible and usable feedback on building energy performance for owners, program sponsors and policymakers. In light of the above discussion of drivers and impediments, the following actions could increase the potential for achieving that objective:
• Efficiency programs should consider automated metering options as a way to acquire better and faster feedback on program results, while also providing the benefit of better feedback to participants. Advanced metering and EIS equipment costs may decrease with increased volumes, and general requirements or bulk purchasing for a widely used program could provide an opportunity to reduce costs. The USGBC has announced its intention to require performance data for LEED-NC buildings after 2010. Similar requirements in efficiency programs, or in other state and local codes, would provide similar benefits.
• National benchmarking tools provide a simple number assessing building performance
relative to like-type buildings. Advanced metering and EIS provide opportunity to enhance benchmarking immediacy and the potential to allow for expanded detail in Benchmarking and Baselining.
• A policy at the national level standardizing the cost to upgrade utility meters to pulse output would provide clarity regarding costs to owners and allow for local interval measurement of fuels without requiring owners to maintain the meters or the utility to provide data from a secure database.
• A simple and convenient software tool for the acquisition and management of data is
needed to permit smaller building owners in particular to achieve the benefits of feedback from advanced metering and EIS.
• EIS hardware is capable of multiple measurements within a facility that can support the
isolation of energy systems to make more advanced forms of energy analysis, such as Energy Infometrics and system-level benchmarking, possible. EPA may want to develop tools to support certification of buildings based on these enhanced methods.

Advanced Metering and Energy Information Systems
New Buildings Institute July 3, 2009 28
References Motegi et al, Web-Based Energy Information systems for Energy Management and Demand Response, LBNL-52510, CEC PIER Project, April 2003 Motegi, Piette, Web-Based Energy Information Systems for Large Commercial Buildings, LBNL-4997, May 2002, Lawrence Berkeley National Labs Sullivan, Hunt, Pugh, Metering Best Practices, Federal Energy Management Program, US DOE, October 2007, page 2.1 Bareley, Deru, Pless, Torcellini, Procedure for Measuring and Reporting Commercial Building Energy Performance, NREL TP-550-38601, October 2005 Gilespie et. al, A Specification for Performance Monitoring, Specifications Guide Version 1, LBNL, March 2007. Advanced Utility Metering, Architectural Energy Corporation, NREL SR-710-3359, 2003 Assessment of Demand Response and Advanced Metering, FERC, December 2008 C&I 2008 Energy Efficiency Program Summary - Whole Building Approaches, CEE website, 2008 Energy Sources, Number of Buildings for Non-Mall Buildings, 2003, Commercial Buildings Energy Consumption Survey (CBECS), Table B22, US DOE, 2006 Kiliccote, Piette, Advanced Control Technologies and Strategies Linking Demand Response and Energy Efficiency, ICEBO Conference Paper, September 2005 Cisco Acquires Richards-Zeta Building Intelligence, Inc., press release, January 27, 2009 Johnson Controls Acquires Software company Gridlogix, press release, October 20, 2008 Erpelding, Ultra-Efficient, All Variable Speed Chiller Plants, A Green Imperative, National Conference on Building Commissioning, April 2008 Demand Response Enabling Technologies for Small-Medium Businesses, Prepared by Lockheed Martin for Southern California Edison, April 2006 Energy Star instructions for automated data loading, www.energystar.gov Website: www.automatedbuildings.com Seryak, Applying State-of-the-Art Analysis to Utility Billing Data, Presentation to Ohio Board of Regents, Go Sustainable Energy, April 2006 Towards a Framework for Reporting the Energy Use of Buildings and Associated Emissions, Presentation to Lawrence Berkeley National Labs, April 2008

Advanced Metering and Energy Information Systems
New Buildings Institute July 3, 2009 29
Google website: http://www.google.org/powermeter/, as of 3/2009 Criscione, What’s Working with Existing Building Commissioning Programs, E-Source, ERDP-F-23, 2008 Continuous Commissioning Guidebook for Federal Energy Managers, Prepared for FEMP by Energy Systems Laboratory and University of Nebraska, US DOE, October 2002 Turner, C. and Frankel, F., 2008, Energy Performance of LEED New Construction Buildings, NBI Final Report to USGBC. Commercial Buildings Energy Consumption Survey (CBECS), Tables C.4, B.22, US DOE, 2003
Interviews EnergyICT, Northwrite, Inc., Powermand, Trendpoint, Obvius, Veris, Cimetrics, GridLogix, Automated Energy, E-Source, Lucid, Green Touch Screen, SBW Partners, Heschong Mahone Group, EPA, RLW Analytics, Mad Dash, Inc., NHT Technologies, Energaurd, Portland General Electric, BC Hydro, Puget Sound Energy, We Energies, Oncor.

Advanced Metering and Energy Information Systems
New Buildings Institute July 3, 2009 30
Appendix A Advanced Metering, EIS, and Service Vendors
Basic Owner-Installed EIS Vendors Company Website
Energy ICT www.energyict.com Obvius www.obvius.com Onset Computer www.onsetcomp.com Veris Industries www.veris.com E-Mon www.e-mon.com Powermand www.powermand.com NH Technologies www.newhorizontech.com Northwrite www.northwrite.com Itron www.itron.com Innovonics www.innovonics.com
Additional Advanced Metering Vendors Company Website
Schneider/Square D/ Power Logic www.powerlogic.com
Itron www.itron.com
GE http://www.gepower.com/prod_serv/products/metering/en/index.htm
Siemens http://www2.sea.siemens.com/ Various www.powermeterstore.com
Integrated Platform (Middleware) Vendors Company Website
Cimetrics www.cimetrics.com GridLogix (now Johnson Controls) www.gridlogix.com Wonderware www.wonderware.com Richards-Zeta Building Intelligence (now Cisco) www.richards-zeta.com
Tridium www.tridium.com
Third-Party Software Tools Software Name Company Website
EnergyCAP Abraxas www.abraxas.com Metrix Abraxas www.abraxas.com Utility Manager Pro Utility Management Services www.utilityaccounting.com Energy Profiler Online ABB n/a Facility IQ Advantage IQ www.advantageiq.com Enterprise Energy Management Suite Itron www.itron.com
Energy Watch Ei3 www.ei3.com Pulse Energy Small Energy Group www.smallenergy.com

Advanced Metering and Energy Information Systems
New Buildings Institute July 3, 2009 31
Energy Monitoring Service Providers:
Company Website Mad Dash www.maddash.com Enovity www.enovity.com NH Technologies www.newhorizontech.com EnerNOC www.enernoc.com Small Energy Group www.smallenergy.com Legacy Energy Group www.legacyenergy.com Go Sustainable Energy www.gosustainableenergy.com Energy Advantage www.energyadvantage.com Professional Systems Development
www.psdsystems.com

Advanced Metering and Energy Information Systems
New Buildings Institute July 3, 2009 32
Appendix B Glossary Advanced Meter – A meter that measures electrical, gas, or water usage at short intervals (e.g. 15 minutes, one hour), with data typically retrieved frequently by a remote system for monitoring purposes. The meter is connected to an acquisition system that reads the meter at the desired frequency or process the regular stream of data coming from the meter. Advanced Metering Infrastructure (AMI) – A method of managing energy use information for a utility where advanced meters are enabled with one-way or two-way communications to automate the retrieval of interval data from each meter. The utility that has an AMI system often makes interval data and a basic software tool available to the customer through a web portal. Alternating Current (AC) – A type of electric distribution typified by a wave of alternating polarity. Used for all normal building power distribution. ASHRAE – American Society of Heating, Refrigerating and Air-Conditioning Engineers Automated Meter Reading (AMR) – An earlier form of AMI that automated one-way meter reading and often provides interval data similar to an AMI system. Application Service Provider (ASP) – A business that provides computer-based services to customers over a network. Building Automation System (BAS) – A control system comprised of meters, sensors, and actuators that operates building equipment to maintain space temperatures and lighting schedules. British Thermal Unit (BTU) – A unit of energy or heat content commonly accounted in units of the therm representing 100,000 BTU. One kWh is equivalent to 3414 BTU. Commercial Building Energy Consumption Survey (CBECS) – A quadrennial survey of the energy use and building characteristics of the existing national building stock, performed by DOE’s Energy Information Agency. Gateway Communications Service – The method for transmitting data from the Gateway to the Remote Database. Current Transformer (CT) – A device placed on an electrical wire to measure the current. Data Acquisition System (DAS) – A generic term for the method that an EIS uses to collect data from multiple meters and transmit it to the Gateway. Often combined in the same package as the Gateway. DAS/Gateway – A combined unit that houses both the functions of the DAS and the Gateway. Domestic Hot Water (DHW) – The heated water used for bathrooms and kitchens. Electric Utility – Any entity that generates, transmits, or distributes electricity and recovers the cost of its generation, transmission or distribution assets and operations, either directly or indirectly, through cost-based rates set by a separate regulatory authority (e.g., State Public Service Commission), or is owned by a governmental unit or the consumers that the entity

Advanced Metering and Energy Information Systems
New Buildings Institute July 3, 2009 33
serves. Examples of these entities include: investor-owned entities, public power districts, public utility districts, municipalities, rural electric cooperatives, and State and Federal agencies. Energy Informatics – Extracting useful information from energy data sets Energy Information System (EIS) – Software, data acquisition hardware, and communications systems administered by a company, partnership, or collective to provide energy information to commercial building energy manager, facility managers, financial managers and electric utilities. (Motegi et al 2003) Energy Monitoring Service Provider – An entity that uses EIS data to make reports and provide guidance to a building owner for a regular fee or arranged service contract. Also called, Energy service provider. Energy Signatures – A term from energy informatics referring to a graphical representation of building’s historical energy performance data that has been normalized by multiple variables. Energy Use Intensity (EUI) – A performance metric used to normalize energy use between different buildings. Found by dividing energy use for a period of time (typically one year) by the total square footage of the building. Gateway – A piece of hardware that transfers DAS data to the remote database. Degree-Days (DD) – A metric for weather-normalizing energy usage that represents the deviation of the average temperature from the DD base temperature, often 65 Integration Platform - A combination of hardware and software used to augment a BAS to gather data in a database and apply analysis tools. Inverse Modeling – A method of creating a mathematical model for building energy performance using empirical performance data and basic knowledge of the building physical attributes. Interval Data – Data recorded by an advanced meter and stored as a measurement with a time stamp. Often the interval is one hour or less between measurements. Key Performance Indicator (KPI) – A ratio of two or more quantities used to assess the continuing performance of a building, system or piece of equipment. Meter Interface – A device that converts a meter output, such as a pulse output, into a signal for a DAS. Middleware – Another name for an integration platform. A combination of hardware and software used to augment a BAS to gather data in a database and apply analysis tools. Pulse Output – An output signal commonly found in metering where an electrical pulse, or contact closure, indicates a certain quantity of the measured substance has passed the meter. By measuring the number of pulses and the time they occur both the total amount and the rate of change can be determined.

Advanced Metering and Energy Information Systems
New Buildings Institute July 3, 2009 34
Pulse Output Upgrade – When a utility replaces the utility service meter in a facility so that there is a pulse output that the owner may use to monitor energy use. Phase – A component of the electrical service that can be monitored using a CT. Portfolio Manager – The EPA’s tool for energy benchmarking of buildings. Remote Database – Any data storage database located on the web used to house EIS data. Settlement - The process of financial settlement for products and services purchased and sold. Each settlement involves a price and quantity. For energy distribution the electric and gas utility must install the settlement meter that is used to determine the charges for a customer. Site Energy – A method of energy accounting where only energy consumed at the site is “counted” in the evaluation of the building as opposed to Source Energy – A method of energy accounting where the energy consumed by a building is modified to account for all energy required to provide the service from the power plant or gas well, through distribution, to the final end use. Time Series Data – Equivalent to interval data. Weather Normalization – A method of adjusting for weather variations using heating or cooling degree days when evaluating a building’s energy performance.