advanced features in cmost
TRANSCRIPT
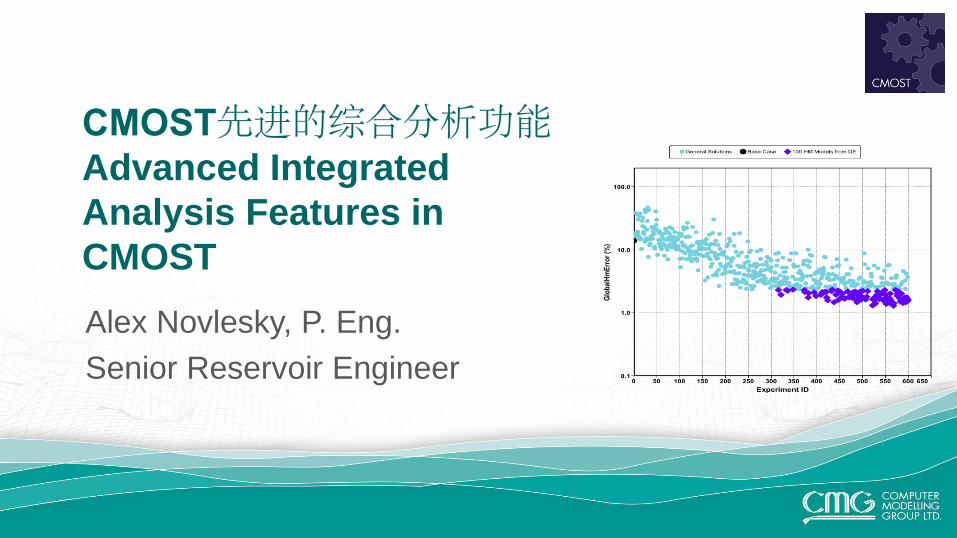
CMOST先进的综合分析功能Advanced Integrated
Analysis Features in
CMOST
Alex Novlesky, P. Eng.
Senior Reservoir Engineer

What is CMOST? CMOST is CMG software that works in conjunction with
CMG reservoir simulators to perform the following tasks: Sensitivity Analysis
• Better understanding of a simulation model
• Identify important parameters
History Matching
• Calibrate simulation model with field data
• Obtain multiple history-matched models
Optimization
• Improve NPV, Recovery, …
• Reduce cost
Uncertainty Analysis
• Quantify uncertainty
• Understand and reduce risk

Redesigned CMOST

Advanced Features in CMOST
• Proxy Modelling
• Complex Objective Functions
• Advanced Parameterization
• Optimization Options
• Data Visualization
• Upcoming Features
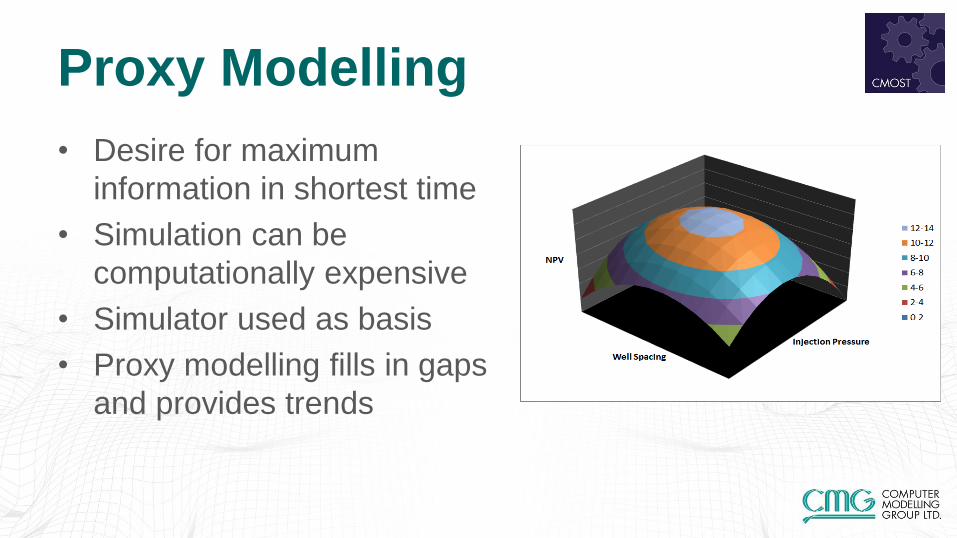
Proxy Modelling
• Desire for maximum
information in shortest time
• Simulation can be
computationally expensive
• Simulator used as basis
• Proxy modelling fills in gaps
and provides trends

Proxy Modelling in CMOST
• Determine sensitivity of parameters
• Make predictions without needing additional simulation
• Proxy based optimization algorithms
• Export proxy model for predictions outside of CMOST

Proxy Dashboard
• Interactive prediction
tool
• Real-time results
using proxy models
• Quickly investigate
impact of parameter
inputs on simulation
results

Sobol and Morris Analysis
• Reservoir response often non-
linear or dependent on multiple
parameters
• Difficult to describe with simple
trends or polynomial equations
• Sobol and Morris Analysis presents
complex relationships in a
simplified manner

Sobol Analysis
Sensitivity analysis tool for determining parameters’
proportional effect
Most Sensitive
Sobol Analysis Tornado Plot

Morris Analysis
More Sensitive
More Interaction
or Non-Linear
Response
Determine
average effect
and variability
of parameter
sensitivity
Most
Sensitive

CMOST Objective Functions
Objective functions are functions used to assess the results of the simulation
• Raw Simulation Results
• History Match Error
• NPV
• Etc.
Built-in functions can’t cover all possibilities
• Tax and Royalty Regimes vary depending on region
• Emerging areas of R&D

Objective Functions using Excel
• Link CMOST to Excel to calculate results
• Incorporate complex royalty and tax regimes
• Add variable cost and price forecasts
• Use advanced functions in excel such as VBA
• Write simulation results and parameter values to spreadsheet
0
10
20
30
40
50
60
-1000000
-500000
0
500000
1000000
1500000
2000000
2500000
3000000
3500000
0 5 10 15
Pri
ce (
$/b
bl)
Pro
du
cti
on
Vo
lum
e (
bb
l) &
Cash
Flo
w (
$)
Year
OilProduced (bbl) WaterProduced (bbl)
SteamInjected (bbl) CashFlow ($)
DiscCashFlow ($) BitumenPrice ($/bbl)
WaterTreatment ($/bbl) SteamCost ($/bbl)

Jscript and Python Scripts
Create advanced objective functions or parameters
• 4D Seismic Chamber Matching Function
• Calculation of NPV or other Economic Indicator
• Calculation of parameter values using logical statements or loops

User Defined Formula
• Create advanced plots
• E.g. NPV vs. Time
• Numerical Integration
or Differentiation
• Jscript or Python
Scripting

Parameterization
• Any value in the dataset can be set as a
parameter
• Modification of arrays or tables of data can be
more challenging
• Property Changes Based on Facies Type
• Relative Permeability Tables
• Changing property distributions (realizations)

Include File Substitution
Parameterize sections of the dataset
• Geological Realizations
• Relative Permeability Tables
• Other Tabular Input • Viscosity vs. Temperature
• Compaction Tables
• Etc.
R1
R2
R3

Pre-Simulation Commands
• Couple CMOST to external programs to generate datasets • Geological software
• Builder
• User Defined
• Create new geological realizations
• Recalculate builder formulas
• Generate Relative Permeability Tables
• Adjust hydraulic fracture spacing

Coupling with Geological Software
H Pair
Geological model Simulation model
Simulation model

Multi-Objective Optimization
Often multiple objective functions when optimizing or History Matching
• Reduce Costs and Increase Revenue
• Matching multiple wells or data types
Traditional approach:
Optimize an aggregated global objective function
• Total NPV
• Weighted Average for History Match

Multi-Objective Optimization
Weighting not always know beforehand
• Uncertainty about costs or prices
• Weighting for HM can be arbitrary
• Sometimes optimize unrelated functions • E.g. Numerical tuning: Runtime & Material Balance Error
Multi-Objective Optimization approach:
• Find a set of alternative optimal solutions
• Trade-off between multiple objective functions

How Multi-Objective Optimization
Works Domination: “Better” in every objective function
Leader: A non-dominated solution
Pareto front: The ensemble of leaders
Leader
Dominated solution
Pareto front
f1
f2
a b a dominates b

Road Trip Example Goal: Shortest route with fastest time
Time
Distance
Route A
Route B
Route C
Route B is shorter and faster than Route A • Route B is always better than Route A
There is no route that is both shorter AND
faster than Route B • Route C is a longer distance but faster
than Route B
• Route C is an alternative to Route B
depending on weighting
• Pareto front gives ensemble of
alternatives

Numerical Tuning Example
Multi-Objective vs. Single Objective
2500
2600
2700
2800
2900
3000
3100
3200
3300
3400
3500
0 0.01 0.02 0.03 0.04
MOPSO
SPSO
Ru
n T
ime (
s)
Material Balance Error (%) 27
Multi-Objective
Optimization gives
wider range of possible
solutions with fewer
simulations
Multi-Objective: 500 runs
Single Objective: 1000 runs

Optimization Customization
New CMOST optimization algorithms added regularly • CMG DECE
• Particle Swarm Optimization (PSO)
• Random Search
• Latin Hypercube + Proxy Optimization
• Differential Evolution
• CMG Bayesian Engine (Coming 2016)
Multitude of other options in literature & new algorithms in development • External Engine allows users to create their own methods that links
to CMOST

External Engine
• Run CMOST using your
own algorithms
• External Engine decides
what experiments to run
• CMOST creates & runs
experiments
External Optimizer

CMOST
Setup a study. Define Parameters,
objective functions etc.
Add, then run experiments
Start Engine
Previous
generation
experiments
table file
User-Defined
Optimizer
(Executable)
New
experiments
table file
Experiment verification
Parameter
table
Max No.
generation?
Stop

Data and Trend Visualization
• Large amounts of data analyzed by CMOST
• Very large amount of combinations of
parameters and objective function to assess for
trends
• Interactive Data Visualization Tool allows quick
overview of large amounts of information

Interactive Data Visualizer
Interactive plots allow for visualization of data trends
• Scatter Plots
• Scatter Matrix

Interactive Data Visualizer
Interactive plots allow for visualization of data trends
• Parallel Coordinates
• Data Histograms

Licensing Multiplier
• CMOST uses only partial licenses when runningsimulations
• E.g. Run 2 STARS simulations while using only 1STARS license
• Applies to other license types (Parallel, Dynagrid, etc.)
• IMEX 4:1
• GEM 2:1
• STARS 2:1
x 4
x 2
x 2

Coming in 2016.10
Brand new features in CMOST
• CMG PAR
• Probabilistic Forecasts
• Robust Optimization
Cu
mu
lati
ve O
il
(bb
l)
Cu
mu
lati
ve O
il
(bb
l)

Conclusions
• Complete more in depth analysis more efficiently
• CMOST tools allow for customization of workflows
• Proxy modelling allows for quick estimation without
needing additional simulations