advanced excel demo
TRANSCRIPT
Why Advanced Excel
Do you want to learnAdvance Excel?

Good move.
By the end of this presentation, you can:
identify the major features of the Excel window
recognise the purpose of each tab in the Excel Ribbon
Understand pivot table concept and significance.
Now What is Advanced Excel??
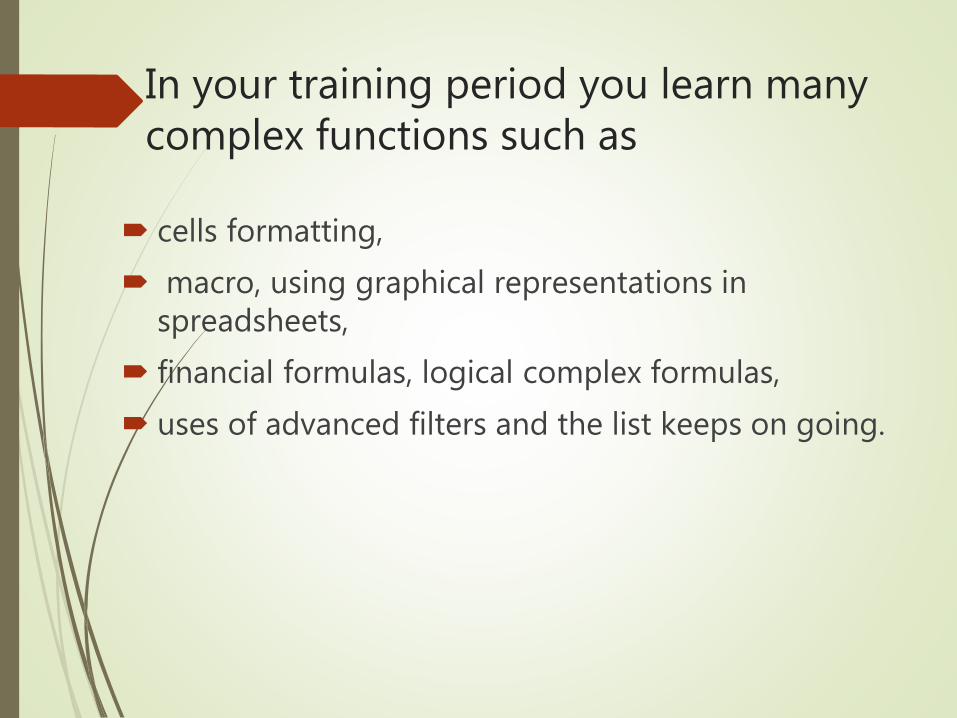
In your training period you learn many complex functions such as
cells formatting,
macro, using graphical representations in spreadsheets,
financial formulas, logical complex formulas,
uses of advanced filters and the list keeps on going.
An expert professional in advanced excel is good at organizing and analyzing data.

Excel is the industry standard spreadsheet
application in government and business.

It’s widely used for home and personal use as well.
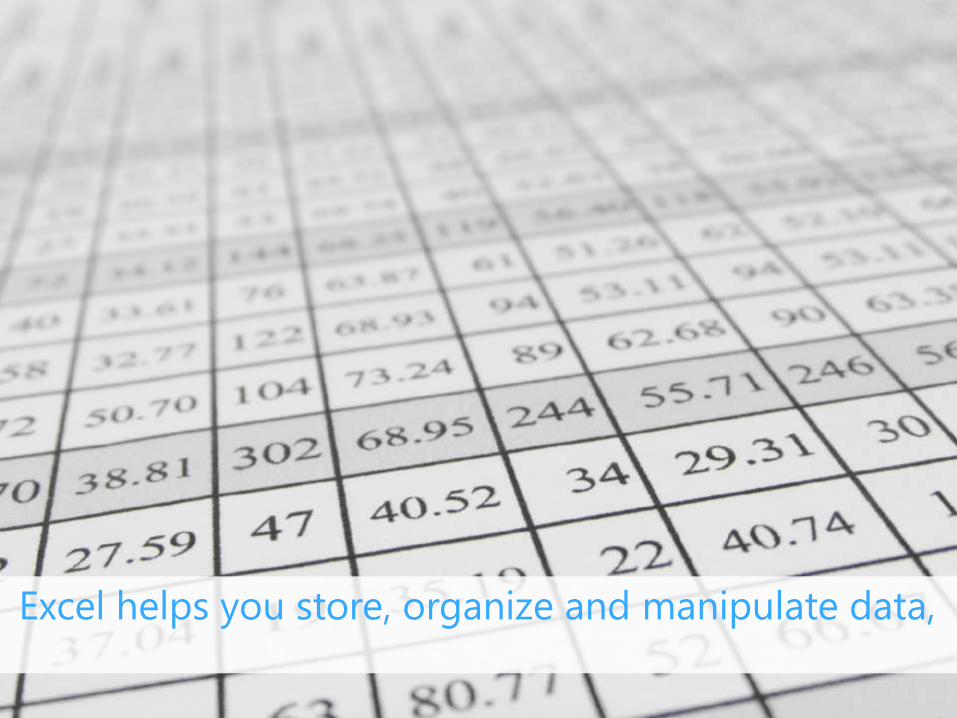
Excel helps you store, organize and manipulate data,

perform calculations & analysis,
present results with graphical & statistical tools,

and lots of other stuff too.

What does this mean?
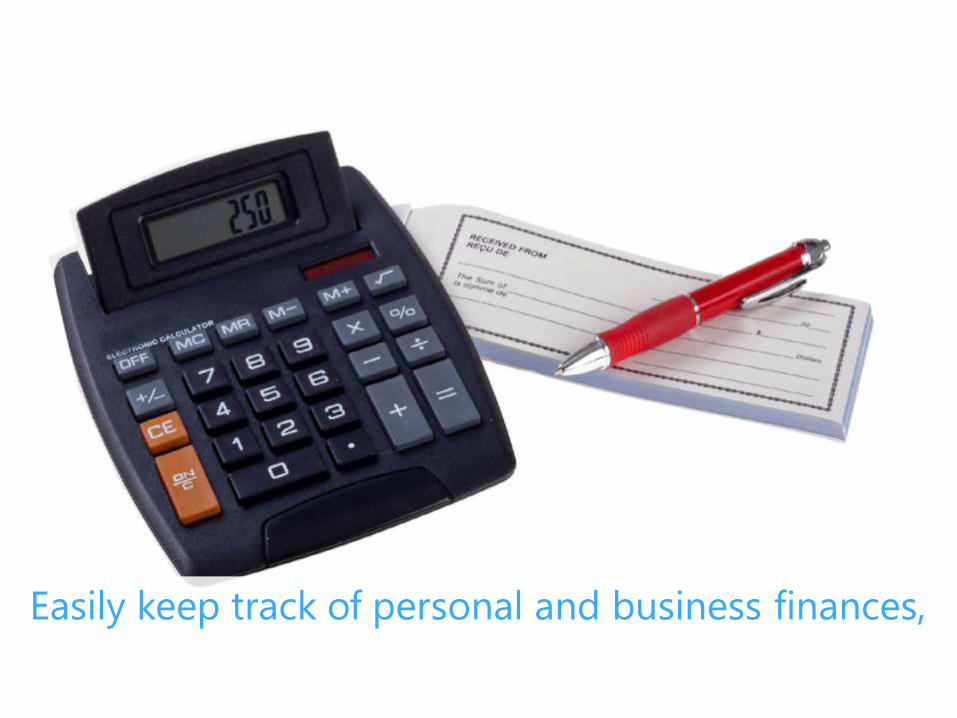
Easily keep track of personal and business finances,
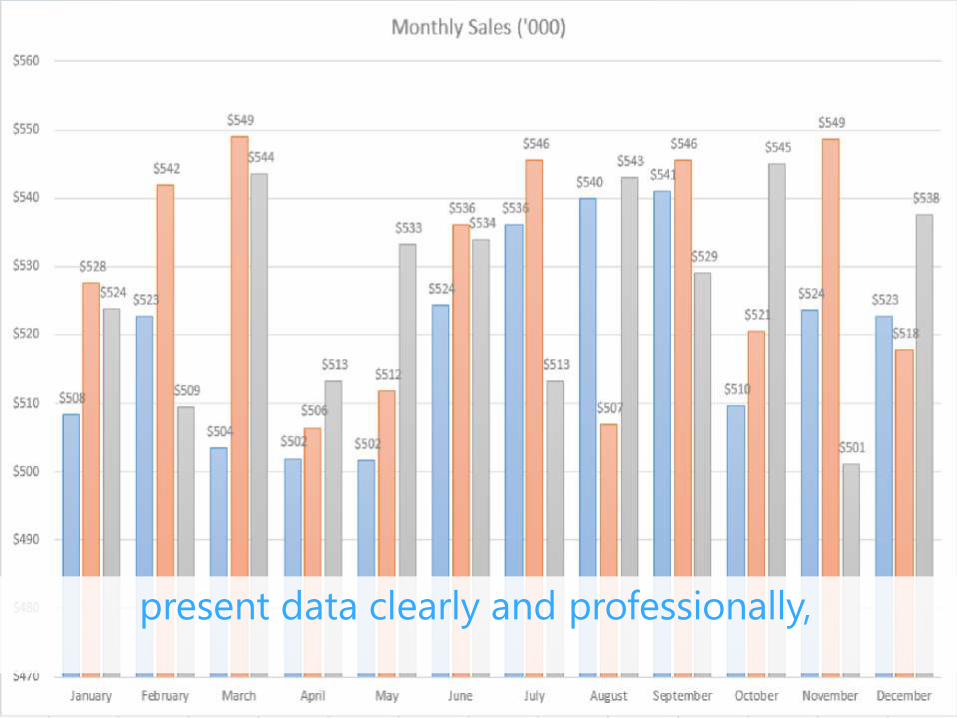
present data clearly and professionally,

save time on record keeping,

and improve productivity & efficiency at work.
Excel is a powerful application for advanced users.

But it’s also simple and intuitive for beginners.

Let’s start by introducing the Excel program window.

SPREADSHEETTRAINER.COM
This is the Excel 2013 Program Window.This is the Excel 2013 Program Window.
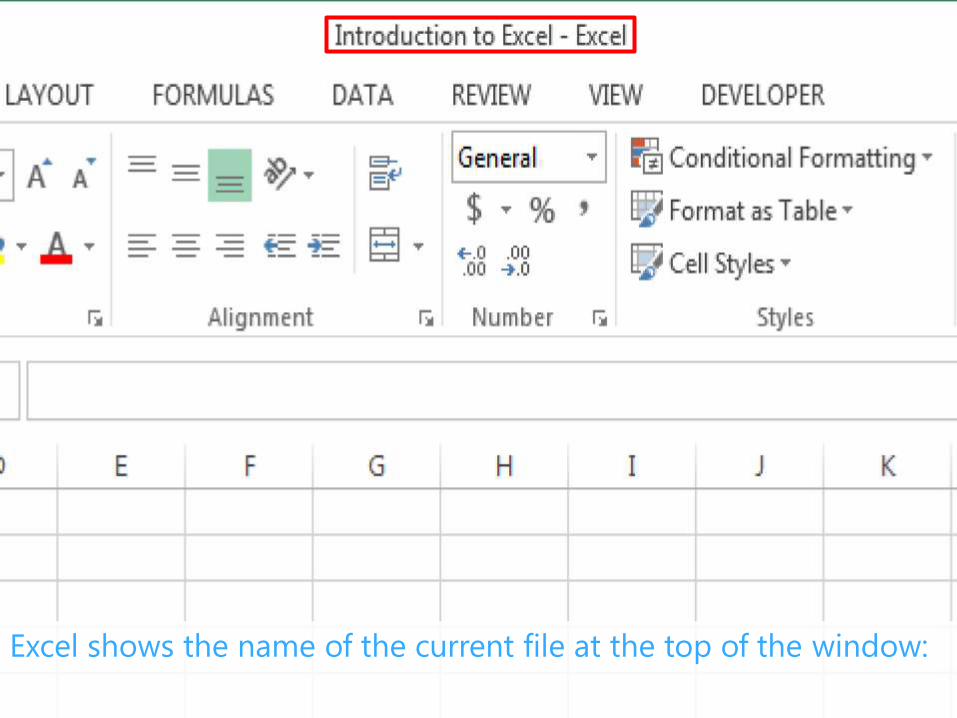
Excel shows the name of the current file at the top of the window:
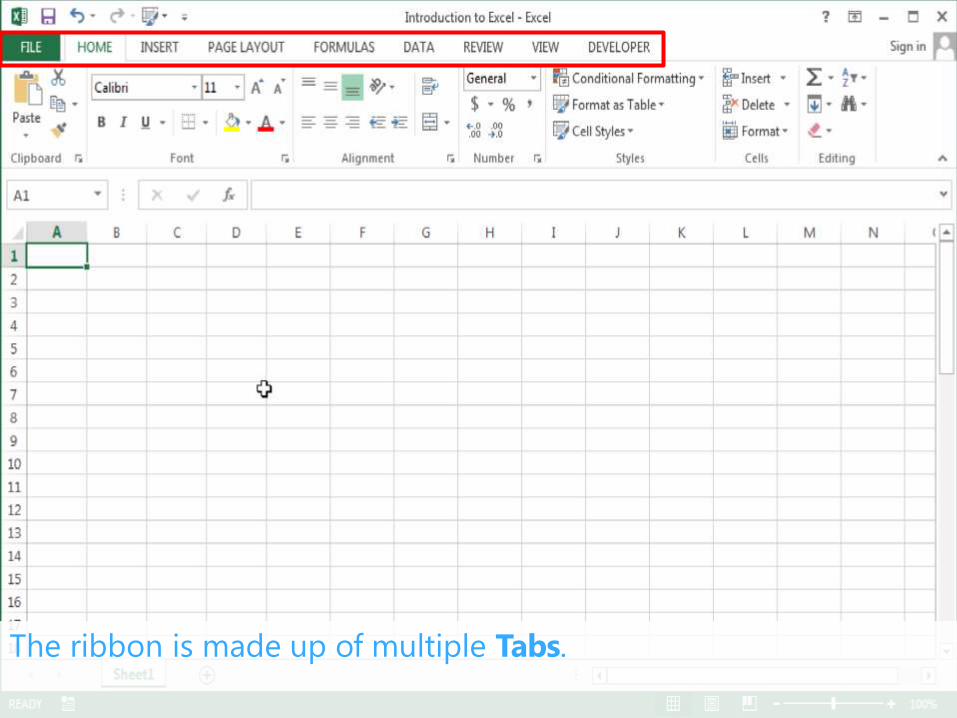
The ribbon is made up of multiple Tabs.

The Home Tab includes common tasks for editing and formatting
data.
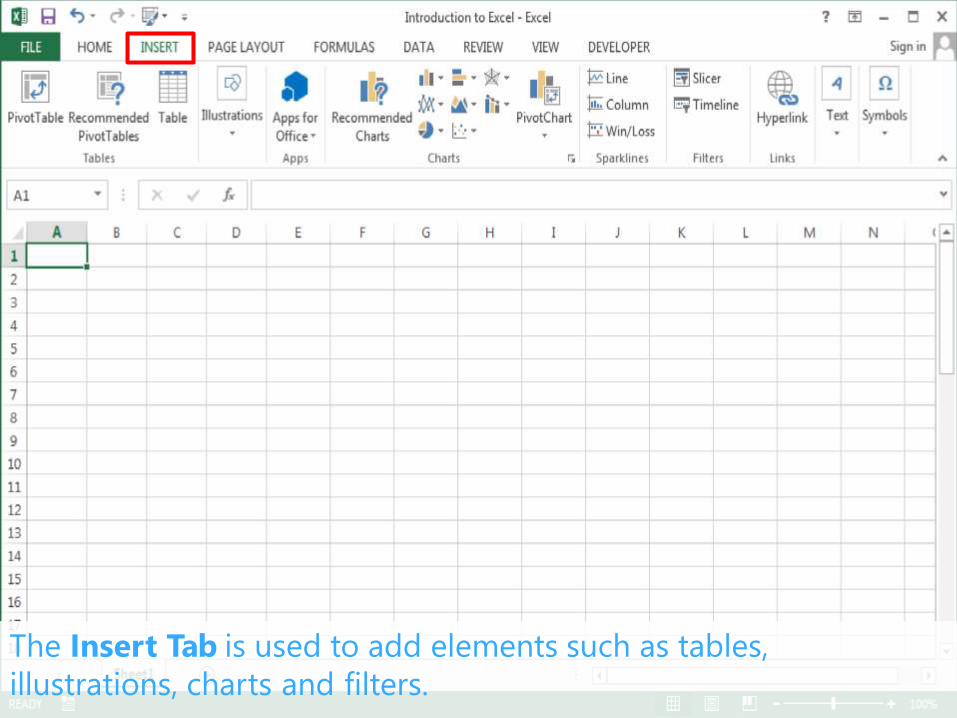
The Insert Tab is used to add elements such as tables,
illustrations, charts and filters.
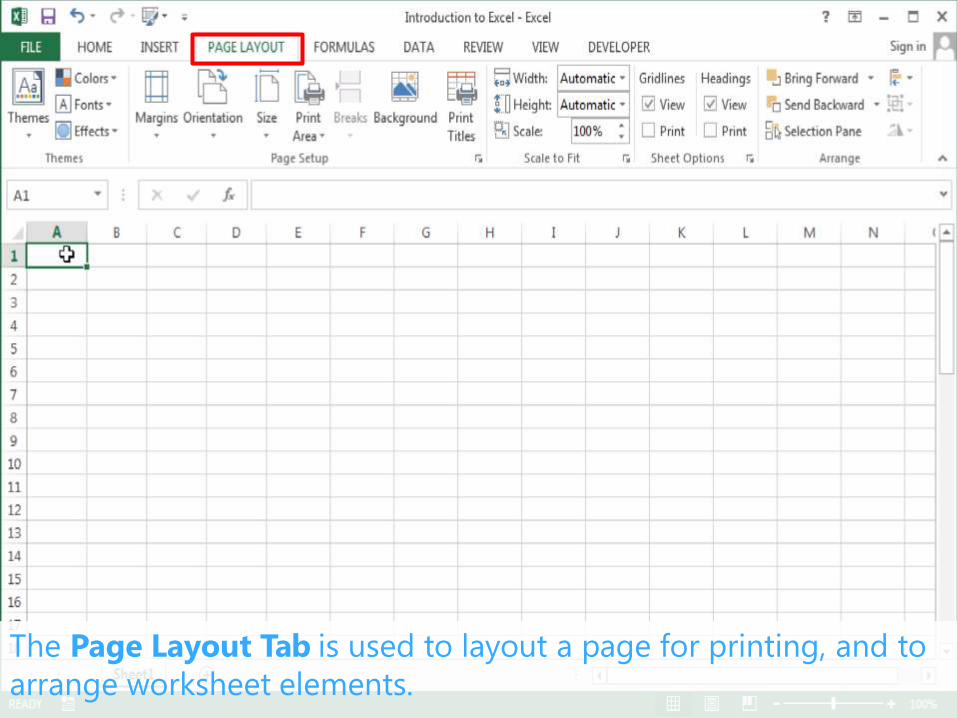
The Page Layout Tab is used to layout a page for printing, and to
arrange worksheet elements.
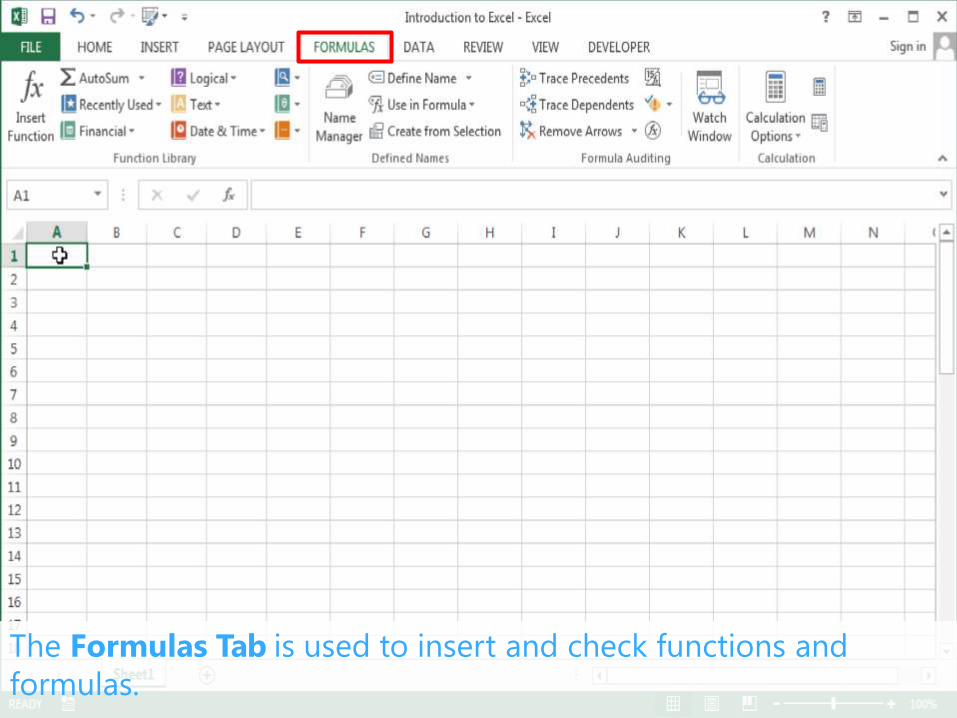
The Formulas Tab is used to insert and check functions and
formulas.
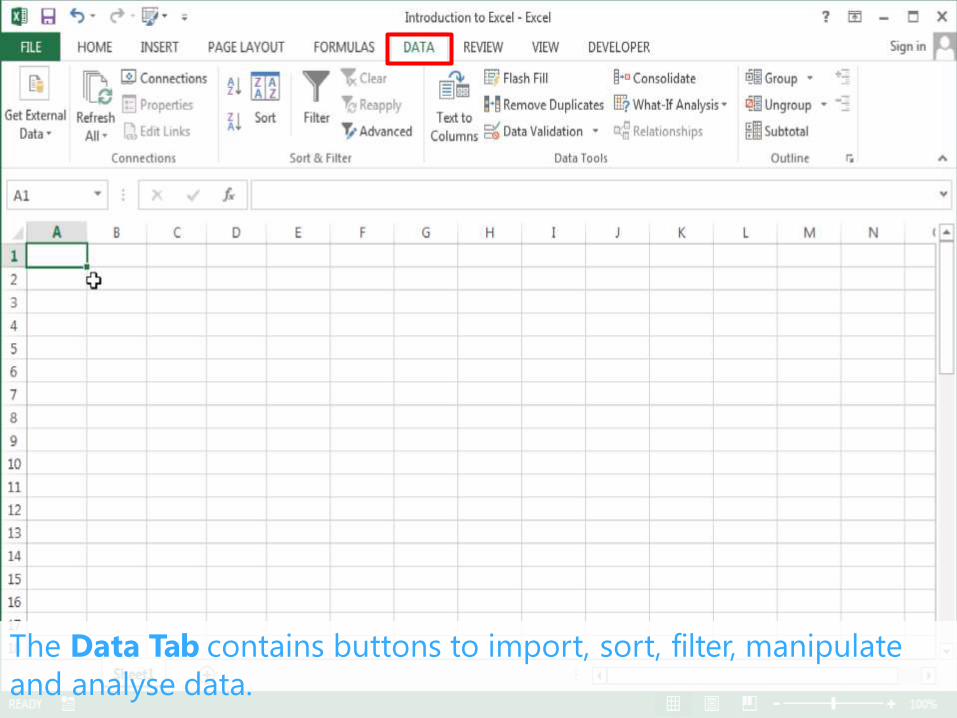
The Data Tab contains buttons to import, sort, filter, manipulate
and analyse data.
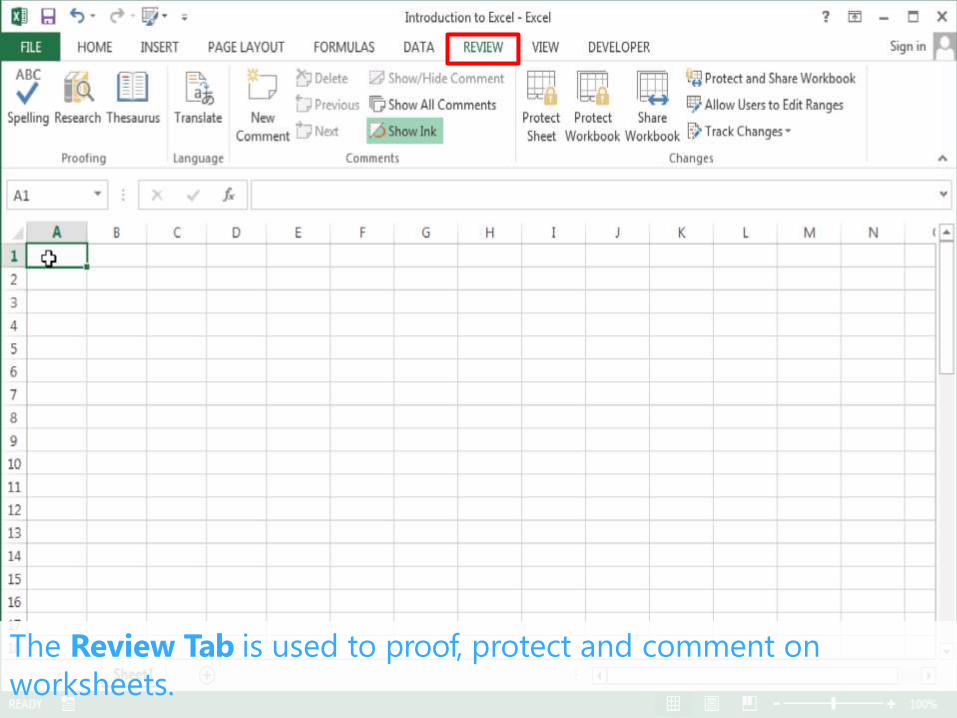
The Review Tab is used to proof, protect and comment on
worksheets.
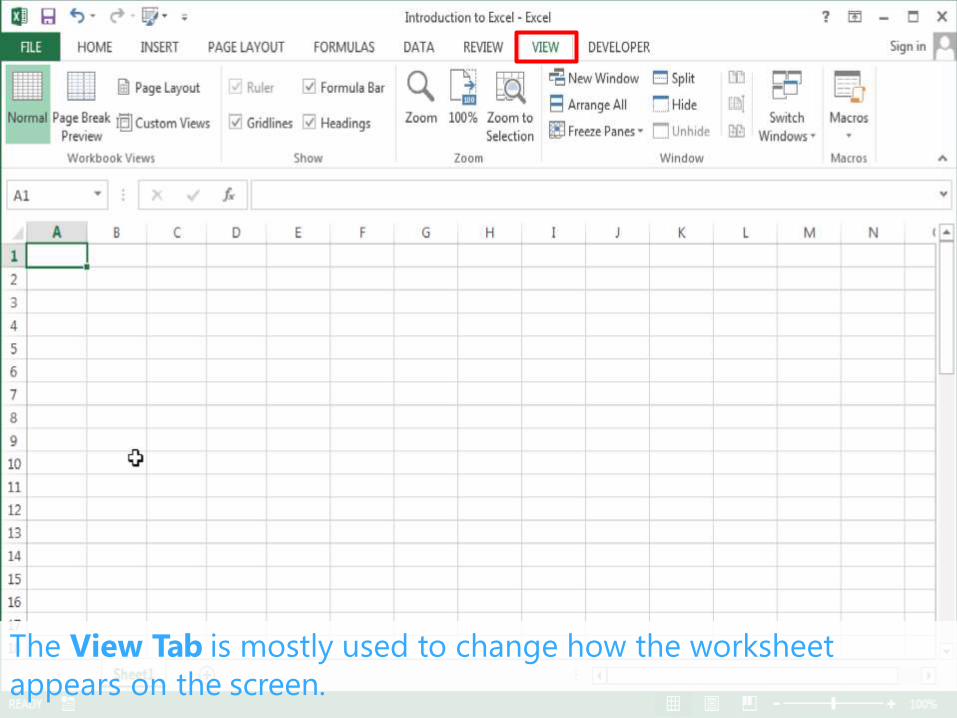
The View Tab is mostly used to change how the worksheet
appears on the screen.

The Name Box displays the address of the current cell selection.

The Formula Bar is where you can enter text, numbers, formulas or
functions to the selected cells.
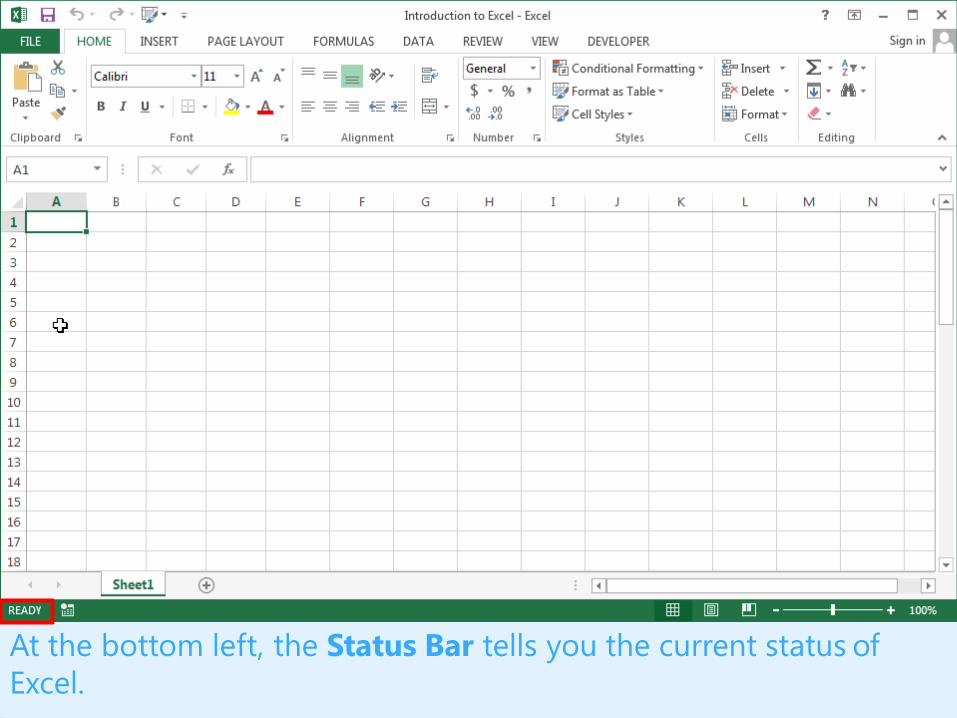
At the bottom left, the Status Bar tells you the current status of
Excel.
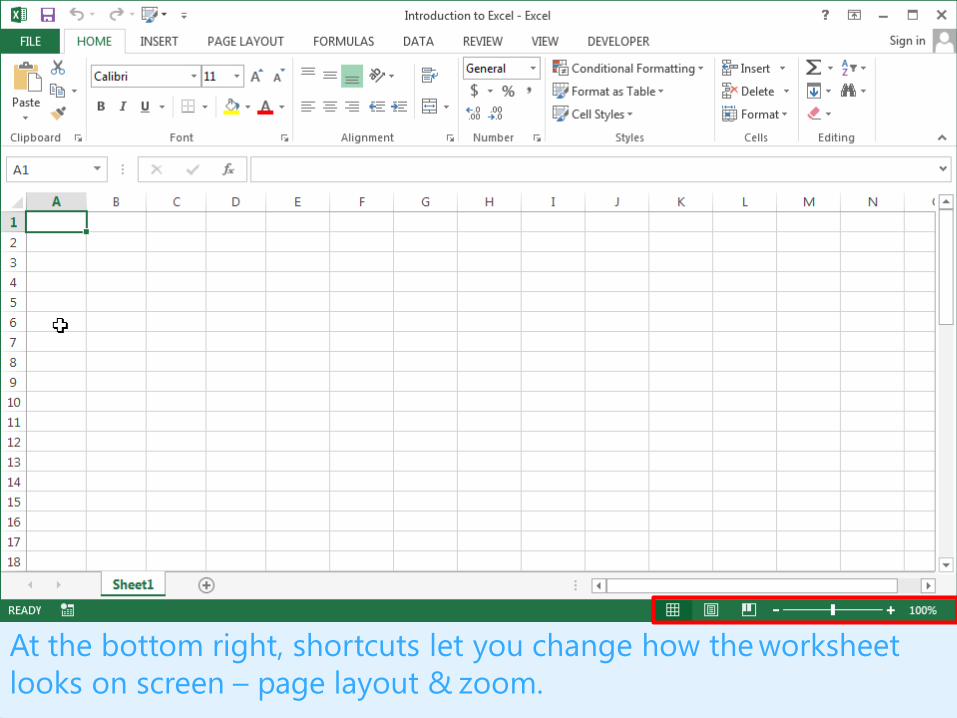
At the bottom right, shortcuts let you change how the worksheet
looks on screen – page layout & zoom.
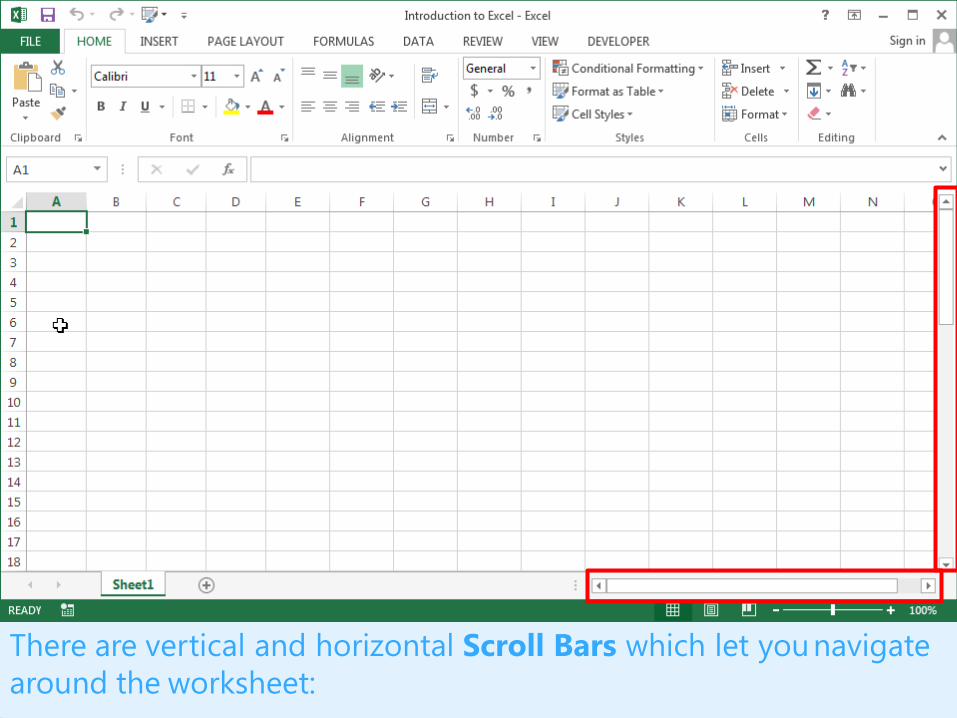
There are vertical and horizontal Scroll Bars which let younavigate
around the worksheet:
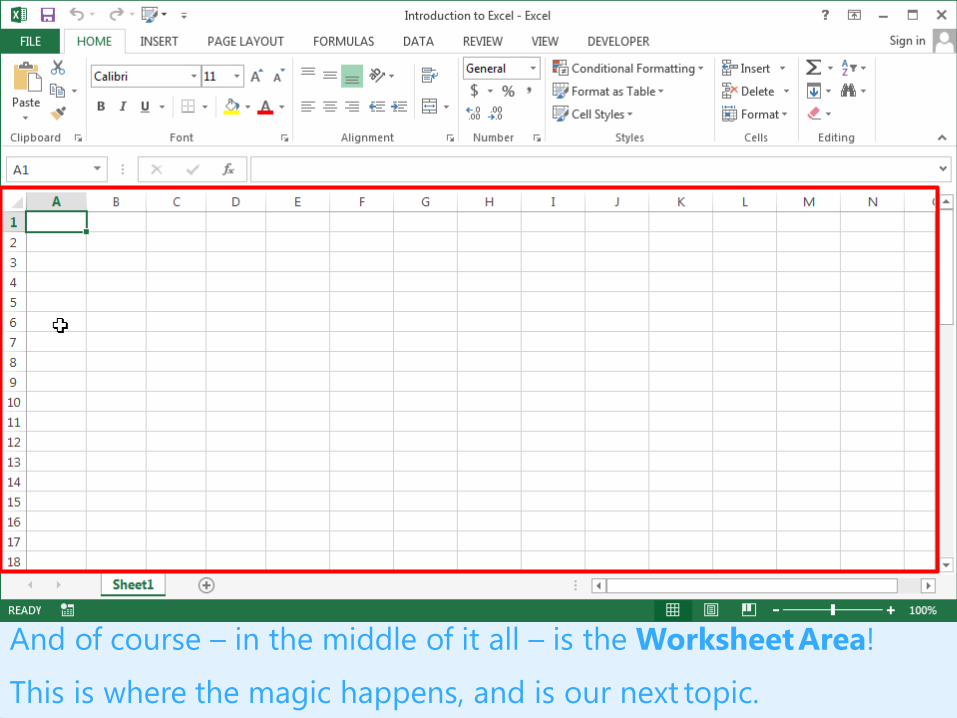
And of course – in the middle of it all – is the WorksheetArea!
This is where the magic happens, and is our next topic.
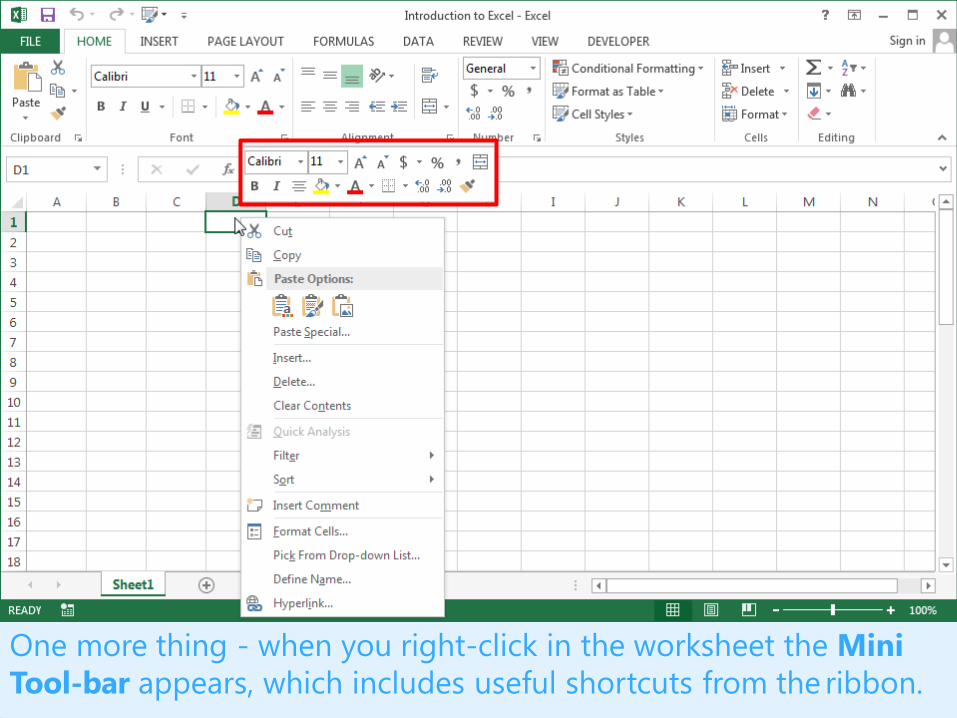
One more thing - when you right-click in the worksheet the Mini
Tool-bar appears, which includes useful shortcuts from the ribbon.
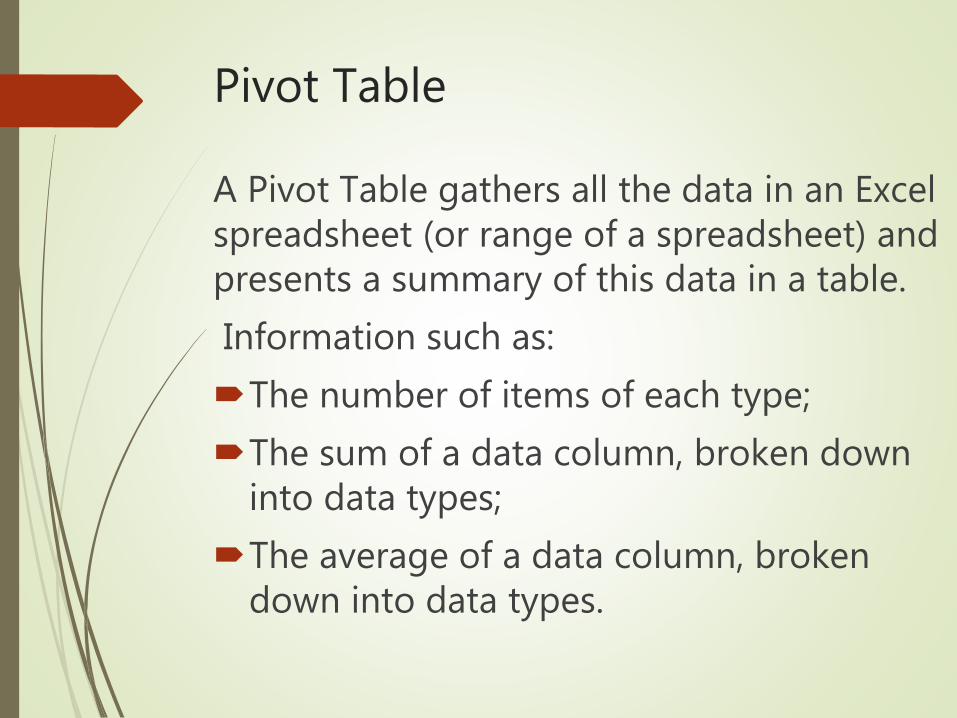
Pivot Table
A Pivot Table gathers all the data in an Excel spreadsheet (or range of a spreadsheet) and presents a summary of this data in a table.
Information such as:
The number of items of each type;
The sum of a data column, broken down into data types;
The average of a data column, broken down into data types.
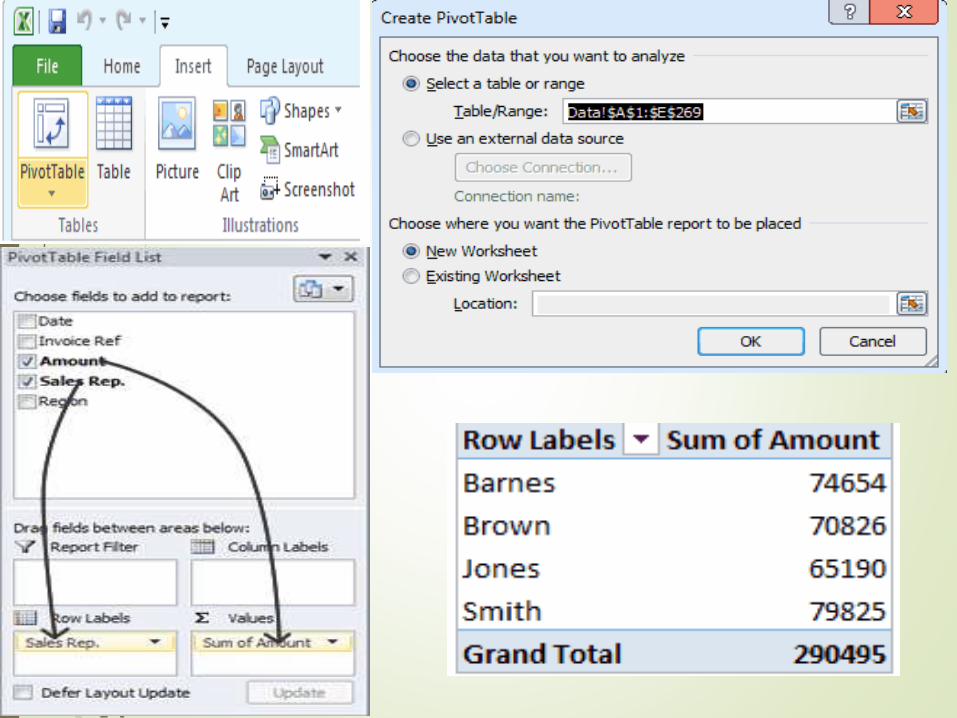
Create a basic Pivot Table
Every sale that was made by a company
during the first quarter of 2016. The
spreadsheet records the sale date, the
invoice reference, the invoice total, the
name of the sales representative, and the
sales region.
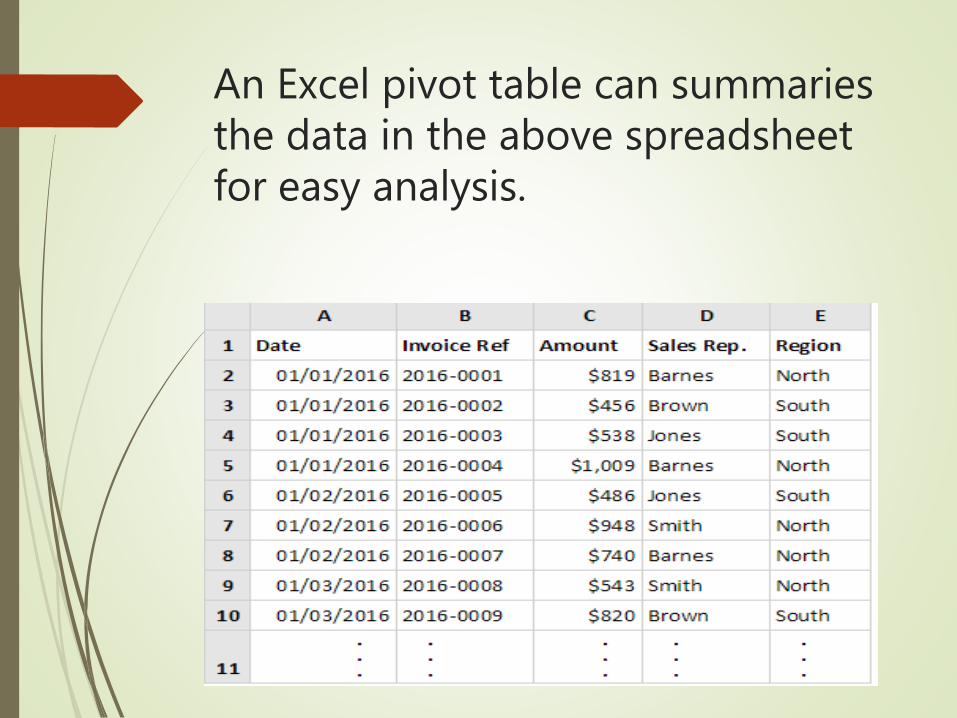
An Excel pivot table can summaries the data in the above spreadsheet for easy analysis.
Advanced Pivot Table
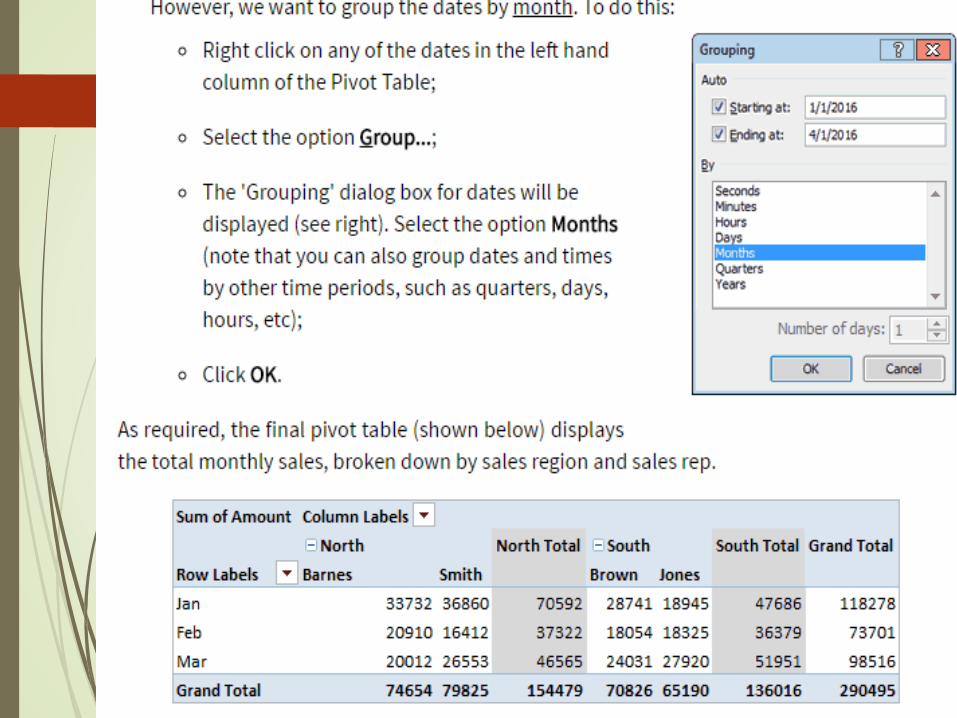

Pivot table Report Filters
Scopes
Excel For HR.
Excel For Marketing.
Excel For Finance.
Excel For BPO’s/KPO’s
Excel For MIS.
Excel For top executives.
Excel as Audit Tool.
Excel For management Professionals(CA’s, MBA’s etc.)
Excel For Entrepreneurs.
Job Profiles
MIS Executive/Analyst/coordinator/Officer.
Finance Executive/Associates/Payroll Executive
VBA Developer
Application service Desk Executive
Reporting Analyst
Practice Lead Analytics in IIM/IIT/NIT

Top Companies
Dell EMC
Infosys BPO/KPO
Flip Kart
Amazon
Accenture
AppsTech ERP Solution
And many More………………
Required Skills
In this advanced course students learn how
to automate information based on the skills
they have developed in the basic and
intermediate module.

Fee Structure