advanced design™ of columns - liberty onesteel · advanced design of reinforced-concrete column...
TRANSCRIPT
1
ADVANCED DESIGN™ OFCOLUMNS
Professor Russell BridgeDr Andrew Wheeler
Centre for Construction Technology and ResearchUniversity of Western Sydney
SEMINARS Sept. 2001
The Centre for Construction Technology and Research at the University ofWestern Sydney is progressively developing new design rules for OneSteelReinforcing’s Guide to Reinforced Concrete Design.Top-tier design rules that meet the requirements for design by refinedcalculation defined in AS 3600-2001 are being released under the trademark ofAdvanced Design™. This presentation concerns rules being developed foradvanced design of reinforced-concrete column cross-sections for strength.The design rules are proprietary and should only be used when OneSteelReinforcing’s products are specified.
OneSteel Reinforcing OSR491
2
ADVANCED DESIGN™ OF COLUMNS
500PLUS-CCS
SOFTWARE
COLUMNCROSSSECTIONDESIGN
The advanced design rules have been incorporated in a new software packagecalled 500PLUS-CCS, “CCS” standing for “Column Cross-Section” whichwill be demonstrated during the presentation.
The new design rules and software will provide the user with a betterdetermination of cross-section strength and allowing the safe and economicaluse of higher strength materials.
The presentation looks at the design principles used in the determination of thecross-sectional strength of a conventionally reinforced column.
Also presented are the principles used in advanced analysis which was used inthe development of the software package 500PLUS-CCS.
3
φ Nu
φ Muφ Muo
φ Nu0
Moment
Lo
ad
(M*, N*)(Unsafe)
(φ Mub, φ Nub)
Locus ofφ Mu, φ Nu
values
(M*, N*) (Safe)
M*
N*
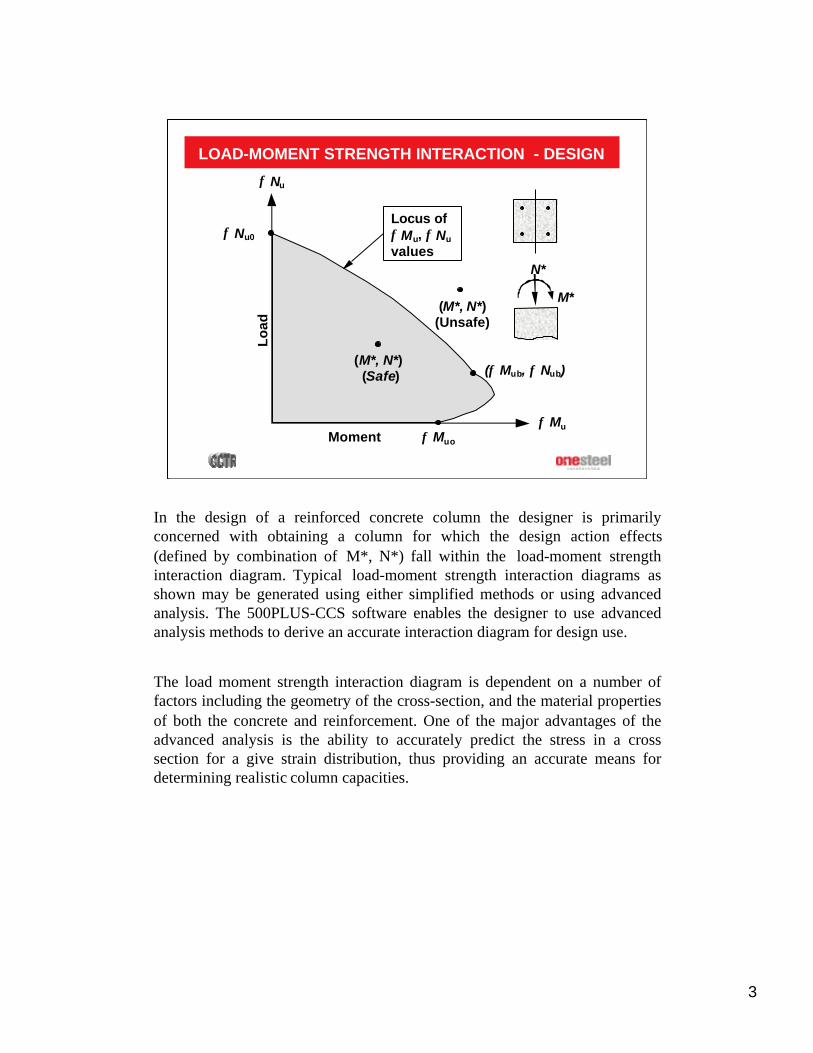
LOAD-MOMENT STRENGTH INTERACTION - DESIGN
In the design of a reinforced concrete column the designer is primarilyconcerned with obtaining a column for which the design action effects(defined by combination of M*, N*) fall within the load-moment strengthinteraction diagram. Typical load-moment strength interaction diagrams asshown may be generated using either simplified methods or using advancedanalysis. The 500PLUS-CCS software enables the designer to use advancedanalysis methods to derive an accurate interaction diagram for design use.
The load moment strength interaction diagram is dependent on a number offactors including the geometry of the cross-section, and the material propertiesof both the concrete and reinforcement. One of the major advantages of theadvanced analysis is the ability to accurately predict the stress in a crosssection for a give strain distribution, thus providing an accurate means fordetermining realistic column capacities.

4
Concrete• Four original Grades; new Grade; high strength• f′c = 25, 32, 40, 50 MPa; 65 MPa; up to 90 MPa• Maximum Strength = 0.85 f′c
Steel• 500N grade - 500PLUS (fsy = 500MPa)
CONCRETE AND STEEL MATERIALS
The Australian concrete structures code AS 3600 has previously limited themaximum concrete strength of the concrete to 50 MPa, and an upper limit of400 MPa on the nominal yield strength of the reinforcement. However, thecurrent standard AS 3600-2001 has increased the maximum concrete strengthto 65 MPa and allows the use of 500N grade reinforcement (yield stress500MPa). In recognition of the industry need and based on current research,the advanced analysis software also enables the use of high strength concreteup to 90 MPa.

5
CONCRETE STRESS-STRAIN CURVE (CEB)
0
10
20
30
40
50
60
0 0.001 0.002 0.003 0.004 0.005 0.006 0.007 0.008
Strain εa
Str
ess
σ c (
MP
a)
f' c = 50 MPa
f' c = 40 MPa
f' c = 32 MPa
f' c = 25 MPa
εo = 0.0022
σc = f (εa)f' c = 65 MPa
AS3600-2001
To define the concrete stress-strain relationship, the current commentary to thestandard recommends the use of the CEB curve when using advanced analysismethods.
One key factor of the CEB curves is that the peak stress occurs at a strain of0.002 and is independent of the concrete cylinder strength. The unloadingbehaviour of the varying grades of concrete also differ significantly.
The standard also limits the maximum concrete stress of 85% of the cylinderstrength.

6
CONCRETE STRESS-STRAIN CURVE (COLLINS)
0
10
20
30
40
50
60
70
80
0 0.001 0.002 0.003 0.004 0.005 0.006 0.007 0.008
Strain εa
Str
ess
σc (
MP
a)
f' c = 85 MPa (Collins et al)
f' c = 50 MPa (CEB)
f' c = 25 MPa (CEB)
εo = 0.0022
σc = f (εa)
While the CEB curve is considered to be adequate for normal grades ofconcrete, the authors recommend the use of the Collin’s concrete stress-straincurve for high strength concretes.
Unlike the CEB curves, the strain at peak concrete stress is dependent on theconcrete cylinder strength.
As detailed previously, the maximum concrete stress is limited to 85 % of thecylinder strength

7
εsy = 0.0020 for 400Y Grade
εsy = 0.0025 for 500Plus
STEEL STRESS-STRAIN CURVE
0.0
0.2
0.4
0.6
0.8
1.0
1.2
1.4
0 10 20 30 40 50 60
Relative Strain ε s /ε sy
Rel
ativ
e S
tres
s σ
s/f s
y
Design Assumption
Strain Hardening
Slope = E s = 200,000 MPa
1.0
The definition used for the material properties of the steel is the bi-linearelastic plastic stress strain relationship with a linear elastic region to the yieldpoint. The modulus of elasticity for the steel is assumed to be constant at200,000 MPa. Consequently, the strain at this yield point is assumed to be0.002 for the 400Y Grade steel and 0.0025 for the 500PLUS® reinforcement.The effects of the strain hardening of the steel are ignored for the advancedanalysis of columns.

8
Stress Resultants
NM
Concrete StressDistributionA
xis
Neu
tral
Steel StressDistribution
Strain Distributionεa
Curvature ρ = 1/R C
entr
e
Cross-section
Axi
s
AXIAL FORCE AND MOMENT AT A CROSS-SECTION
To determine the capacity of a column the assumption that plane sectionsremain plane is utilised. An assumed strain distribution is applied to the cross-section, defined by the curvature and axial strain at the centroid. From theapplied strain distribution and the pre-defined material properties, the stressdistribution in the concrete may be determined. The same method is use todetermine the stress distribution in the reinforcement. Once the stressdistribution is determined, integration is utilised to determine the axial load (N)and the moment (M) for the given strain distribution.

9
LOAD-MOMENT-CURVATURE DIAGRAM
5000
4000
3000
2000
1000
0 100 200 300
Moment M (kNm)
Axi
al L
oad
N (
kN)
400 x 40050 cover8C24 barsfsy = 410 MPaf′c = 30 MPa
4 812 16 24 32
4060
80
120160
8N24 Bars
The load-moment strength interaction diagram is determined by selecting acurvature and varying the applied axial strain. For each value of axial strain, anaxial load (N) and moment (M) is determined and the curve of load-momentvalues for a given curvature derived. This procedure is repeated for varyingvalues of curvature. Plotting values of load and moment for a constant value ofcurvature results in the contour chart shown in the slide above. A 3D model ofthis behaviour shown in next slide, where load (N) is on the y axis, moment (M)on the x axis and curvature (ρ) on the z axis. Viewing the x-y axis, then theenvelope of (N, M) values defines the load-moment strength interactiondiagram.

10
LOAD-MOMENT-CURVATURE DIAGRAM
A 3D model of the load-moment-curvature behaviour of a typical columncross-section is shown above. This was constructed using the contour diagramshown in the previous slide. The lines marked on the model are lines ofconstant curvature, the vertical axis is the load axis and the horizontal axis isthe moment axis.

11
ddo
εcu
kud
Muo
εcu
kuodoεsy
Mub , Nub
Mul , Nul
do
εcu
Nuo
Moment
Axi
al L
oad
KEY POINTS ON LOAD-MOMENT INTERACTION CURVE
When using simplified methods or advanced analysis, a number of key pointsare defined on the load moment strength interaction diagram. These points areused in the determination of the appropriate capacity reduction factors, andinclude the axial capacity (Nuo), the bending capacity (Muo) and the balancepoint (Mub, Nub).
The axial capacity (Nuo) is the capacity of the section when a constant strain isapplied across the cross-section. For 400Y Grade reinforcement this pointwould always corresponds with the strain at which the peak concrete stress isreached. The pure moment capacity (Muo) is the maximum bending capacity ofthe column with zero axial load. The depth to the neutral axis (koud) at thispoint is needed, as it is used as a measure of ductility of the cross-section. Thecapacity reduction factor (φ) at pure moment is dependent on the value of kuo.As the axial load applied to a column is increased from zero, the momentcapacity will increase as applied axial strains relieve some of the tensile strainsresulting from the bending. As these compressive strains increase, they willreach a point at which they begin to decrease the bending capacity of thecolumn. This transition point is considered to be the balance point (Mub, Nub).For rectangular sections, and particularly those that are singly reinforced, thispoint occurs when the steel on the extreme tensile face begins to yield. Whenthe cross-section is non-rectangular or has multiple layers of reinforcement,the peak moment may not always occur when the reinforcement on theextreme tensile face begins to yield. Using advanced analysis methods, thetransition point between applied axial load contributing or degrading the axialcapacity is determined accurately.

12
0.60.8 or0.8uo
ud ≥==MM
00 φφ
Pure Bending where Nu = 0
Combined Bending and Compression where Nu < Nub
−−+= ))((
ub
u0 N
N10.60.6 φφ
Combined Bending and Compression where Nu > Nub
0.6=φ
CAPACITY REDUCTION FACTOR φ
Capacity reduction factors (φ), as defined by AS 3600, are dependent on theapplied axial load (N). When the applied load (N) is greater that the axial loadat the balance point (Nub), the column is considered to be predominantly underaxial loading and a reduction factor (φ) of 0.6 is applied. When the axial load(N) is below the balance point (Nub), bending is considered to be critical soproviding kuo is less than 0.4 the reduction factor (φ) is varied linearly from 0.6at the balance point to 0.8 for pure moment.
13
0
100
200
300
400
500
600
700
800
900
0 1 2 3 4 5 6 7 8 9 10
Percentage Steel %
Mo
men
t S
tren
gth
- P
ure
Ben
din
g (
kNm
)
Cap
acit
y F
acto
r φ
0.8
0.7
0.6
0.5
0.4
0.3
0.2
0.1
M ud
ku = 0.4 M uo
φ M uo
400 x 40050 coverf sy = 500 MPaf' c = 32 MPaφ
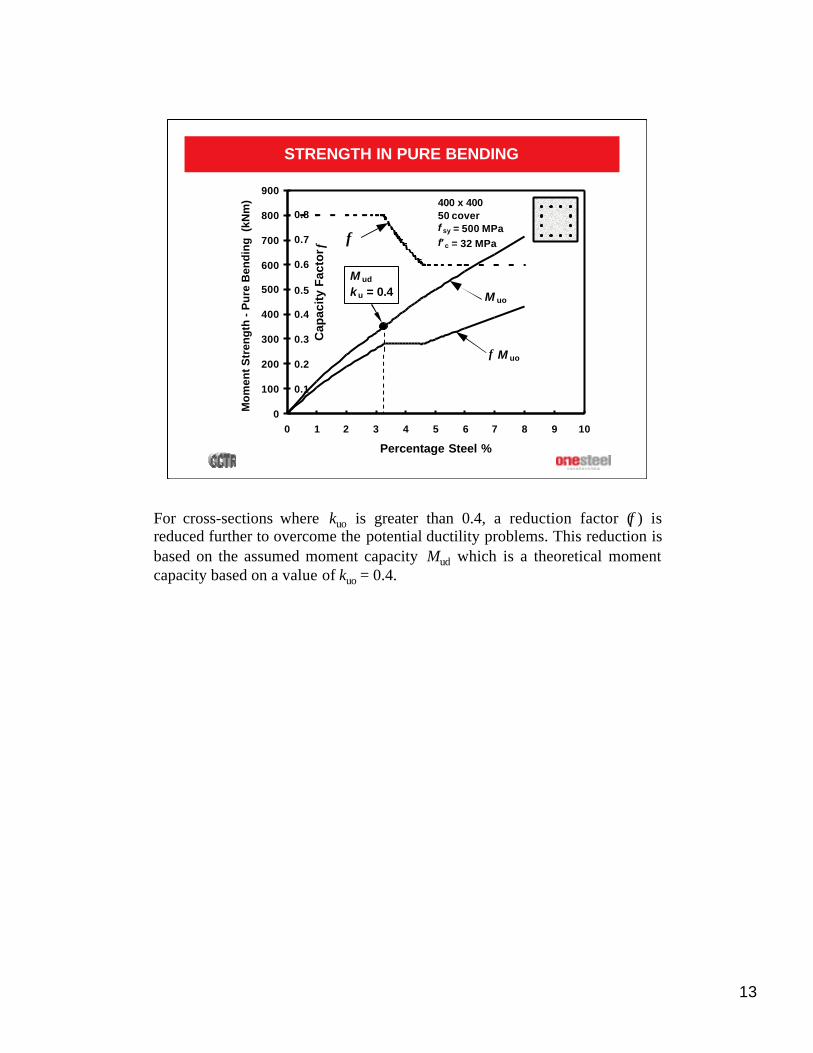
STRENGTH IN PURE BENDING
For cross-sections where kuo is greater than 0.4, a reduction factor (φ) isreduced further to overcome the potential ductility problems. This reduction isbased on the assumed moment capacity Mud which is a theoretical momentcapacity based on a value of kuo = 0.4.
14
0
2000
4000
6000
8000
0 100 200 300 400 500
Moment (kNm)
Load
(k
N)
Locus φ M u, φ N u
values
Locus Mu, N u
valuesφ N uo
N uo
400 x 40050 coverf sy = 500 MPaf' c = 32 MPa
Mu
o
Rectangular StressAnalytical Method
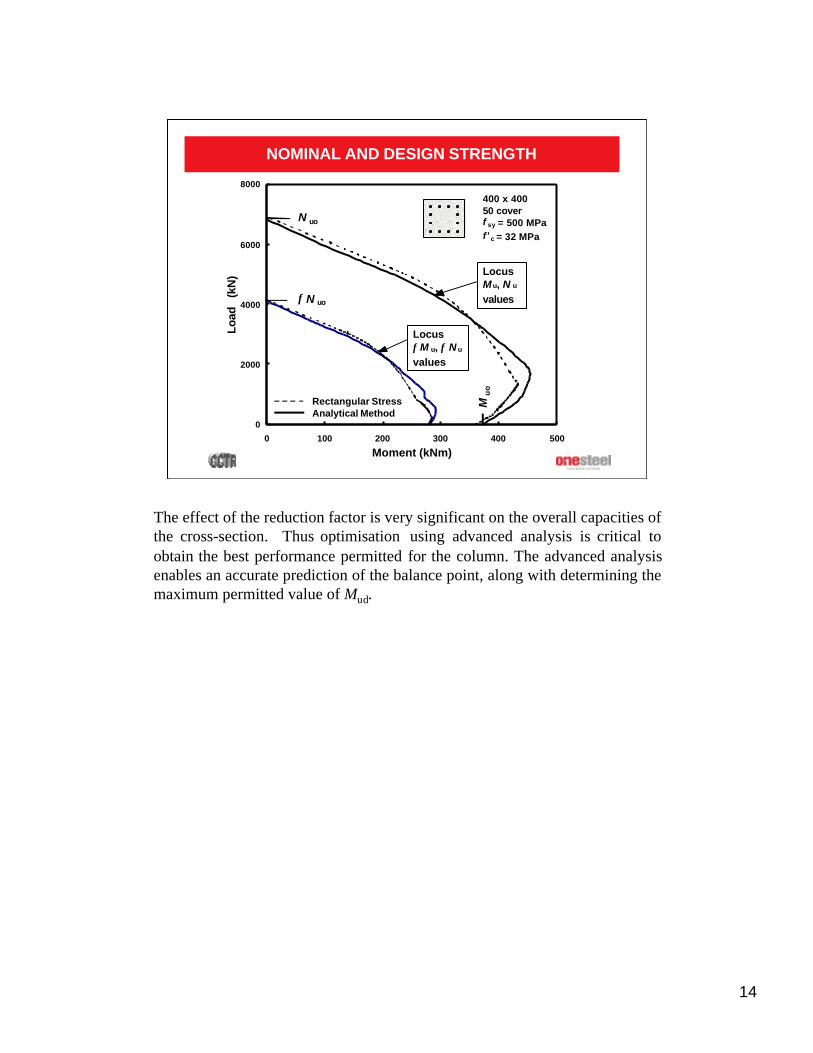
NOMINAL AND DESIGN STRENGTH
The effect of the reduction factor is very significant on the overall capacities ofthe cross-section. Thus optimisation using advanced analysis is critical toobtain the best performance permitted for the column. The advanced analysisenables an accurate prediction of the balance point, along with determining themaximum permitted value of Mud.

15
SLENDER CONCRETE COLUMN
When looking at slender columns, AS 3600 allows the use of momentmagnification factors to take into account the effects of slenderness. Thesoftware included is only for determining the cross-sectional strength, and thusdoes not consider slender columns.

16
MINIMUM REINFORCEMENT IN COLUMN
Min. 1% steel400Y Grade
0.8% steel500 PLUS
εsh shrinkage strain = 850 µstrain
φccb creep factor = 7.5
Loading = 0.4φNuo = 40% squash load
Stresses in steel with time
The minimum steel requirements for columns governed by strength asspecified by AS 3600 is 1 percent. The commentary to the concrete standardsuggests that this limit "guards against yielding of the reinforcement due toshrinkage and to creep under sustained service loading".

17
CREEP AND SHRINKAGE STRESSES IN STEEL
0
100
200
300
400
500
Time after Loading
Ste
el S
tres
s (M
Pa)
1.0% 400Y Rebar
0.8% 500PLUS Rebar
1 3 10 30 30100 1 3 10Days Years
Studies have shown that for a column with 1 percent 400Y Gradereinforcement, when compared with an similar column with 0.8 percent500PLUS® reinforcement and subjected to identical shrinkage strains, thesame creep coefficient and supporting the same sustained service load (seeprevious slide) the stresses in the reinforcement of each column are verysimilar. Consequently, the advanced analysis will allow the design of columnswith less that 1 percent reinforcement for 500PLUS® reinforcement.

18
COVER SPALLING IN HIGH STRENGTH CONCRETE
Spalled concrete cover
Confined concrete
Nuo = kf´c Ac + fsy As
For f´c ≤ 65 MPa, k = 0.85
The use of concrete grades above those specified in AS 3600 introduce anumber of additional problems. A primary consideration is the effect ofspalling of the concrete cover on the axial strength of columns.
19
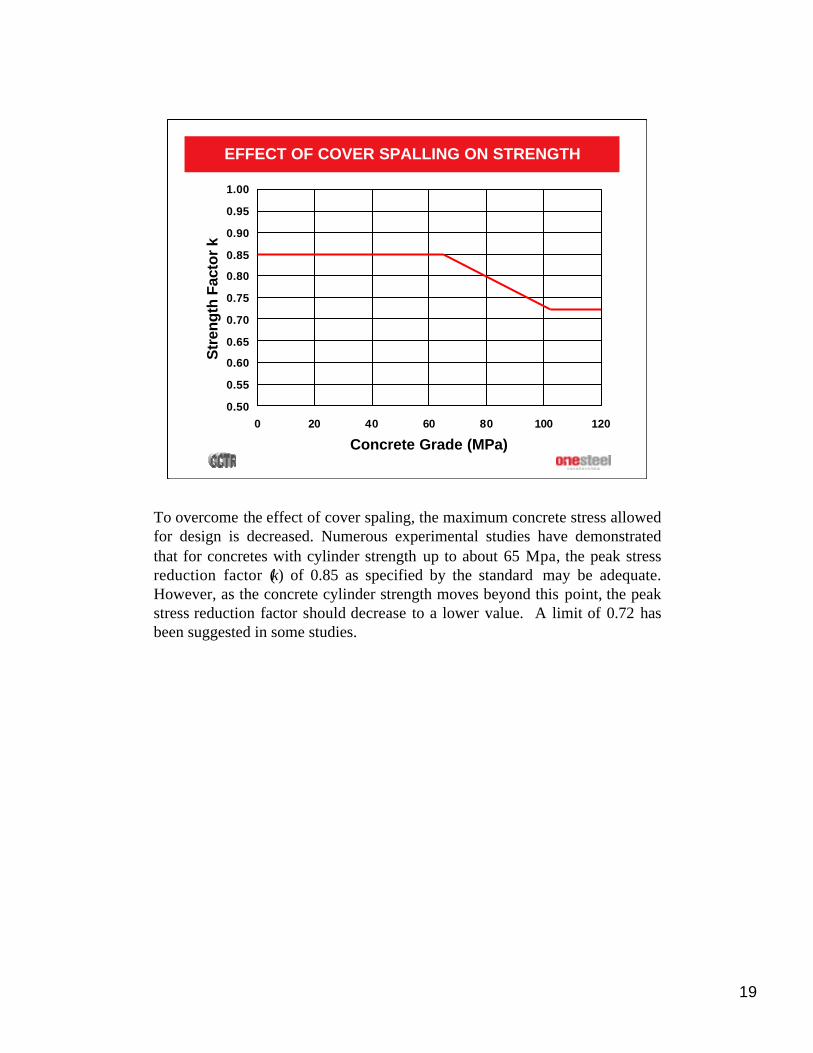
EFFECT OF COVER SPALLING ON STRENGTH
0.50
0.55
0.60
0.65
0.70
0.75
0.80
0.85
0.90
0.95
1.00
0 20 40 60 80 100 120
Concrete Grade (MPa)
Str
engt
h Fa
ctor
k
To overcome the effect of cover spaling, the maximum concrete stress allowedfor design is decreased. Numerous experimental studies have demonstratedthat for concretes with cylinder strength up to about 65 Mpa, the peak stressreduction factor (k) of 0.85 as specified by the standard may be adequate.However, as the concrete cylinder strength moves beyond this point, the peakstress reduction factor should decrease to a lower value. A limit of 0.72 hasbeen suggested in some studies.

20
COMPARISON OF HIGH STRENGTH CONCRETE
0
1000
2000
3000
4000
5000
6000
7000
0 100 200 300 400
Moment Capacity φ M u (kN/m)
Axi
al L
oad
Cap
acit
y φ
Nu
(kN
)
50 MPa
85 MPa
High strength concretes, for a given cross-section, result in an increase in axialload capacity, including the effects of cover spalling, but have an insignificanteffect on the pure moment capacity.
When using the high strength concrete the designer should also ensure that thespacing and layout of the confinement reinforcement meet the desiredrequirements.

21
ADVANTAGES OF ADVANCED DESIGN™ FOR COLUMNS
• Full non-linear material properties
• Numerical integration of stresses for accuracy
• No assumptions for concrete strain at ultimate strength
• High strength concrete HSC included (up to 90 MPa)
• Proper definition of load (Nub) balanced point
• Calculation of maximum value of reduced moment Mud
• Use of maximum values of capacity reduction factor φ
• Reduction in value of minimum reinforcement
• Inclusion of effect of spalling of concrete cover for HSC

22
USE 20% LESS STEEL WITH 500 PLUS REBAR
0
10
20
30
40
0 1 2 3 4 5 6M u /A gD (MPa)
Nu
/Ag
(M
Pa)
0.0% steel 1.0% steel 400Y 0.8% steel 500PLUS 2.0% steel 400Y 1.6% steel 500PLUS
450
700
f'c = 32 MPa
Comparisons between 400Y grade reinforcement and 500PLUS®
reinforcement are demonstrated here.
In the cases shown, a simple replacement of 20 percent less reinforcementresults in a similar column behaviour.

23
0
10
20
30
40
0 1 2 3 4 5 6M u/A gD (MPa)
Nu/
Ag (
MP
a)
0% steel 1% steel 400Y 1% steel 500PLUS 2% steel 400Y 2% steel 500PLUS
450
700f' c = 32 MPa
500PLUS REBAR AS DIRECT REPLACEMENT
Further comparisons between 400Y grade reinforcement and 500PLUS®
reinforcement are demonstrated here.
In the cases shown, a simple substitution of the higher grade reinforcementresults in an increase in both axial load and moment capacity.

24
• Practice based on supporting research
• Advanced analysis of concrete cross-sections
• Use of high strength concrete
• Advantages of 500PLUS® Rebar
• Accurate software for design
• Ongoing development and research
CONCLUSIONS