advanced analytics: back to basics?
TRANSCRIPT

©2017 Dimensional Insight, Inc.
George Dealy
Vice President, Healthcare Solutions
Dimensional Insight, Inc.
HIMSS Regional Conference, Portland, Maine
November 21, 2019
Advanced Analytics: Back to Basics?Data Driven Decision Making
in the 21st Century
©2017 Dimensional Insight, Inc.
Data Driven Decision Making

©2017 Dimensional Insight, Inc.
Data Driven Decision Making is Pervasive

©2017 Dimensional Insight, Inc.
Impact of Data Driven Decisions in Healthcare
Globally, the infant mortality rate has decreased from an estimated rate of 63 deaths per 1000 live births in 1990 to 32 deaths per 1000 live births in 2015. Annual infant deaths have declined from 8.9 million in 1990 to 4.5 million in 2015.
• Breastfeed for at least the first six months
• Deliver antibiotics immediately if a baby becomes ill.
• Use hand-pumped oxygen masks and basic resuscitation training.
• Increase skin-to-skin contact with the baby
• Keep the baby warm and dry.
• Keep the umbilical cord clean to prevent infection.
The under-five mortality rate has fallen by more than half since
1990. That represents 4.4 million children who didn’t die!
Source: unicef

©2017 Dimensional Insight, Inc.
John Urschel
Former NFL Lineman, Baltimore Ravens
PhD Candidate in Mathematics, MIT

©2017 Dimensional Insight, Inc.
John Urschel
“Being mathematically illiterate is quite a dangerous thing.”
Former NFL Lineman, Baltimore Ravens
PhD Candidate in Mathematics, MIT

©2017 Dimensional Insight, Inc.
P (A | B) = P (B | A) P (A) *
P (B)

©2017 Dimensional Insight, Inc.
P (H | E) = P (E |H ) P (H) *
P (E)
Bayes Theorem
H = HypothesisE = Evidence

©2017 Dimensional Insight, Inc.
P (H | E) = P (E |H ) P (H) *
P (E)
Bayes Theorem
H = HypothesisE = Evidence
Posterior
Prior

©2017 Dimensional Insight, Inc.
A Long Standing Precedent in Healthcare
Picture of Florence
Nightingale
Florence Nightingale• Founder of Nursing
• Public Health Pioneer
• Statistician
“Rose Chart” – shows the impact of poor sanitation and infectious disease on mortality rate among British soldiers during the Crimean War 1854-1856.

©2017 Dimensional Insight, Inc.
Need an image of baseball
Our National Pastime

©2017 Dimensional Insight, Inc.
Baseball’s New Frontier: Analytics

©2017 Dimensional Insight, Inc.
Focusing on Outcomes
Baseball
• Runs Scored / Prevented
• Games Won / Lost
ii

©2017 Dimensional Insight, Inc.
Focusing on Outcomes
Baseball Healthcare
• Runs Scored / Prevented
• Games Won / Lost
Population▪ Years of Potential Life Lost
▪ Disease Incidence
Quality & Safety▪ Medical Errors
▪ Preventable Admissions
Cost▪ Per Person per Month
▪ Lifetime
Patient Experience▪ Patient Centered Outcomes
▪ Self Perceived Wellness
ii

©2017 Dimensional Insight, Inc.
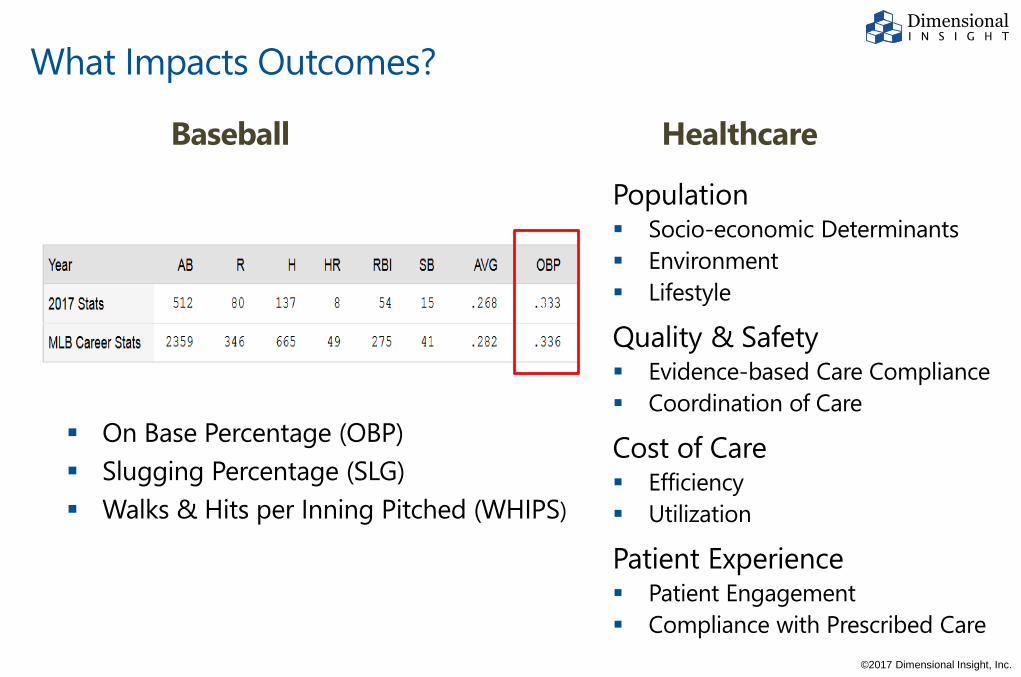
What Impacts Outcomes?
Baseball
▪ On Base Percentage (OBP)
▪ Slugging Percentage (SLG)
▪ Walks & Hits per Inning Pitched (WHIPS)
ii
©2017 Dimensional Insight, Inc.
What Impacts Outcomes?
Baseball Healthcare
Population▪ Socio-economic Determinants
▪ Environment
▪ Lifestyle
Quality & Safety▪ Evidence-based Care Compliance
▪ Coordination of Care
Cost of Care▪ Efficiency
▪ Utilization
Patient Experience▪ Patient Engagement
▪ Compliance with Prescribed Care
▪ On Base Percentage (OBP)
▪ Slugging Percentage (SLG)
▪ Walks & Hits per Inning Pitched (WHIPS)
ii

©2017 Dimensional Insight, Inc.
Getting to Data Driven Decisions . . .
Moneyball Clip
. . . Isn’t Easy.

©2017 Dimensional Insight, Inc.
Data Driven Baseball
Old Wives Tales
▪ Hot & Cold Streaks: Batting
▪ Hot & Cold Streaks: Pitching
Evidence-based Practice
▪ Batting Order
▪ Pitcher’s Days Rest
▪ Designated & Pinch Hitters

©2017 Dimensional Insight, Inc.
World Series Away Game Winners Analysis
The 2019 World Series was the first in history in which the
Away team always won.
▪ How unusual is this -- really?
▪ How significant is the home field advantage?
©2017 Dimensional Insight, Inc.
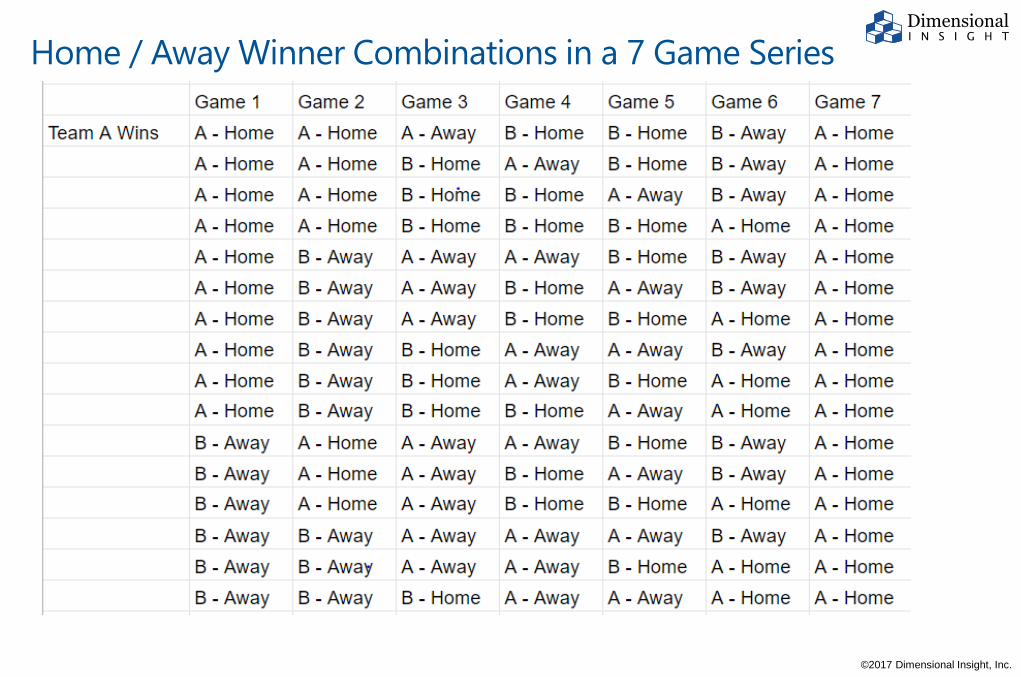
Home / Away Winner Combinations in a 7 Game Series

©2017 Dimensional Insight, Inc.
Home / Away Winner Combinations in a 7 Game Series

©2017 Dimensional Insight, Inc.
World Series Away Game Winners Analysis
Number of combinations in a Best of 7 series
that goes to the full 7 games
Combinations where Away team always wins
Probability of Away team always winning
32
1
1 in 323.1%

©2017 Dimensional Insight, Inc.
World Series Away Game Winners Analysis
Number of World Series Games 1903 - 2019
Series that went to 7 Games
Times the Away team always won
Historical probability that Away team always wins
115
40
1 in 402.5%
1

©2017 Dimensional Insight, Inc.
Example from the Real World of Healthcare
CMS Comprehensive Joint Replacement Bundle Program (CJR)
▪ Objective: Aims to support better and more efficient care for beneficiaries
undergoing the most common inpatient surgeries for Medicare beneficiaries:
hip and knee replacements.
▪ Outcome Measures
– 90 Day Episode Cost vs. Target
– Patient Experience
• HCAHPS Survey
• Patient Centered Outcomes (optional)
– Complications of Care
How can we impact these?

©2017 Dimensional Insight, Inc.
Monitoring Performance on CJR Bundle Program
Year-to-Date Performance from Jan 1st to August 30th
90 Day Episode Cost
$25,198Median
Unplanned Readmissions
4.5%Rate
Complications of Care
1.2%Rate
Patient Exp: HCAHPS
85Percentile
Pat. Centered Outcomes
75Normalized Score
Provider Experience
90Composite Score
What can you do with this?

©2017 Dimensional Insight, Inc.
Numeracy: Basic Concepts & Tools
▪ Central Tendency: ”The Middle”– Mean (Average)
– Median
▪ Variation– Standard Deviation
– Interquartile Range
– Over Time
▪ Distribution– Normal
– Something other than Normal

©2017 Dimensional Insight, Inc.
Normal Distribution & Standard Deviation
Beyond +/- 2 SD’s: < 5% probability of value occurring in a the actual population.
The underlying assumption for many statistical techniques

©2017 Dimensional Insight, Inc.
Normal Distribution & Standard Deviation
But often the assumption doesn’t hold up!
Median = 3
14.2%
17.9%18.6%
12.5%
8.9%
6.5%
4.9%
3.5%
2.5%1.9%
1.5% 1.1%
0.0%
2.0%
4.0%
6.0%
8.0%
10.0%
12.0%
14.0%
16.0%
18.0%
20.0%
1 2 3 4 5 6 7 8 9 10 11 12
% IN
PATI
ENT
VIS
ITS
LOS DAYS
Distribution of Hospital LOS Days
Mean = 4.95

©2017 Dimensional Insight, Inc.
Box Plot & Interquartile Range
Five Number Summary
Min 1st Quartile Median 3rd Quartile Max
5 11 25 30 42
Mean = 22.6
Boxplot
5 42
11 25 3022.6
John Tukey
Working with skewed distributions using rank & relative standing
IQR
19
19
The Future of Data Analysis, 1962Exploratory Data Analysis, 1977

©2017 Dimensional Insight, Inc.
Applying Numeracy to the CJR Bundle Program
Our Median CMS Target +/- % +/-
$25,149 $22,905 +2,290 +10.0%
DRG 470 w/o Fracture 90 Day Episode Cost Summary
$18.4K $50.2K
$25.2K / $25.7K
Min 1st Quartile Target Median Mean 3rd Quartile Max$18,430 $22,506 $22,905 $25,198 $25,698 $27,482 $50,196
7 Number Summary
Box Plot
IQR
$4,975
$5.0K
Population: N = 589 procedures

©2017 Dimensional Insight, Inc.
Looking for Patterns of Influence: Performing Surgeons
Opportunities:
Highest Costs?
Lowest Costs?
Least Variation?
Most Variation?
Best Practices?
Inefficiencies?
* Top 25 (of 53) surgeons by procedure volume account for 97% + of total volume.

©2017 Dimensional Insight, Inc.
Detecting Significant Trends over Time
Statistical process control run charts can help detect whether change over time (such as an apparent improvement) is meaningful or just random, normal, expected variation.

©2017 Dimensional Insight, Inc.
Monitoring Performance on CJR Bundle Program
Year-to-Date Performance from Jan 1st to August 30th
CJR 90 Bundle Day Episode Cost
$25,149Median
What can you do with this now?
Cur YTD vs. Target
+2,290 10.0%vs. Prev YTD
+963 4.0%
Trends & Significance
12 Mo Trendv +
$24,235
Significance
i

©2017 Dimensional Insight, Inc.
Monitoring Performance on CJR Bundle Program
CJR 90 Bundle Day Episode Cost
$25,198Median
Definitions for Interpretation
Cur YTD vs. Target
+2,793 10.0%vs. Prev YTD
+963 4.0%
Trends & Significance
12 Mo Trendv +
$24,235
Significance
i 90 Episode Cost
Definition:Includes all payments made beginning 3 days before the procedure and ending 90 calendar days later. This includes all setting of care for which Medicare reimburses services.
Logic: CJR Episode Costs / Episodes
Reference: CMS Comprehensive Joint Replacement Bundle Program Specifications

©2017 Dimensional Insight, Inc.
Monitoring Performance on CJR Bundle Program
CJR 90 Bundle Day Episode Cost
$25,198Median
Distribution for Perspective
Cur YTD vs. Target
+2,290 10.0%vs. Prev YTD
+963 4.0%
Trends & Significance
12 Mo Trendv +
$24,235
Significance
i
$18.4K $50.2K
$25.2K / $25.7K

©2017 Dimensional Insight, Inc.
Monitoring Performance on CJR Bundle Program
CJR 90 Bundle Day Episode Cost
$25,198MedianTrends for Context
Cur YTD vs. Target
+2,290 10.0%vs. Prev YTD
+963 4.0%
Trends & Significance
12 Mo Trendv +
$24,235
Significance
i

©2017 Dimensional Insight, Inc.
Monitoring Performance on CJR Bundle Program
CJR 90 Bundle Day Episode Cost
$25,198Median
Cur YTD vs. Target
+2,290 10.0%vs. Prev YTD
+963 4.0%
Trends & Significance
12 Mo Trendv +
$24,235
Significance
iDetails for Analysis

©2017 Dimensional Insight, Inc.
A Few Words about Governance

©2017 Dimensional Insight, Inc.
More on Numeracy
See my Practical Analysis Blog!
▪ on LinkedIn (Connect with George Dealy)
▪ Analysis
▪ Interpretation
▪ Visualization
▪ Communication

©2017 Dimensional Insight, Inc.
Use Cases for Advanced Analytics
A glimpse into the future . . .
▪ Genetic Data & Personalized Medicine
▪ Artificial Intelligence (AI)-Supported Diagnostics
▪ Pattern Recognition in Comprehensive Population
Datasets
▪ Better Opportunities to Understand & Impact Outcomes

©2017 Dimensional Insight, Inc.
Analysis in the 21st Century
▪ Big Data
▪ Machine Learning
▪ Pervasive Computing
▪ Artificial Intelligence
▪ Curiosity
▪ Passion
▪ Numeracy
▪ Communication

©2017 Dimensional Insight, Inc.
Think
Don’t be afraid to

©2017 Dimensional Insight, Inc.
George Dealy
Vice President, Healthcare Solutions
Dimensional Insight, Inc.
HIMSS Regional Conference, Portland, Maine
November 21, 2019
Advanced Analytics: Back to Basics?
Data Driven Decision Making
in the 21st Century