adoption of chickpea cultivars in karnataka: pattern, trends and
TRANSCRIPT
1
Adoption of Chickpea Cultivars in Karnataka: Pattern, Trends
and Constraints
Kiresur VR, GN Kulkarni, MCS Bantilan and VS Kulkarni
INTRODUCTION
Chickpea is one of the most important pulse crops grown in India. It has been well
recognized as a valuable source of protein particularly in India, where a majority of the population is
vegetarian and depends on the low priced food for meeting its dietary requirements. It is consumed
as a dry pulse, after cooking, germination, soaking or fermentation or as a green vegetable. It is also
used for the preparation of various sweets and spicy dishes where the split grains or flour are used
besides dhal.
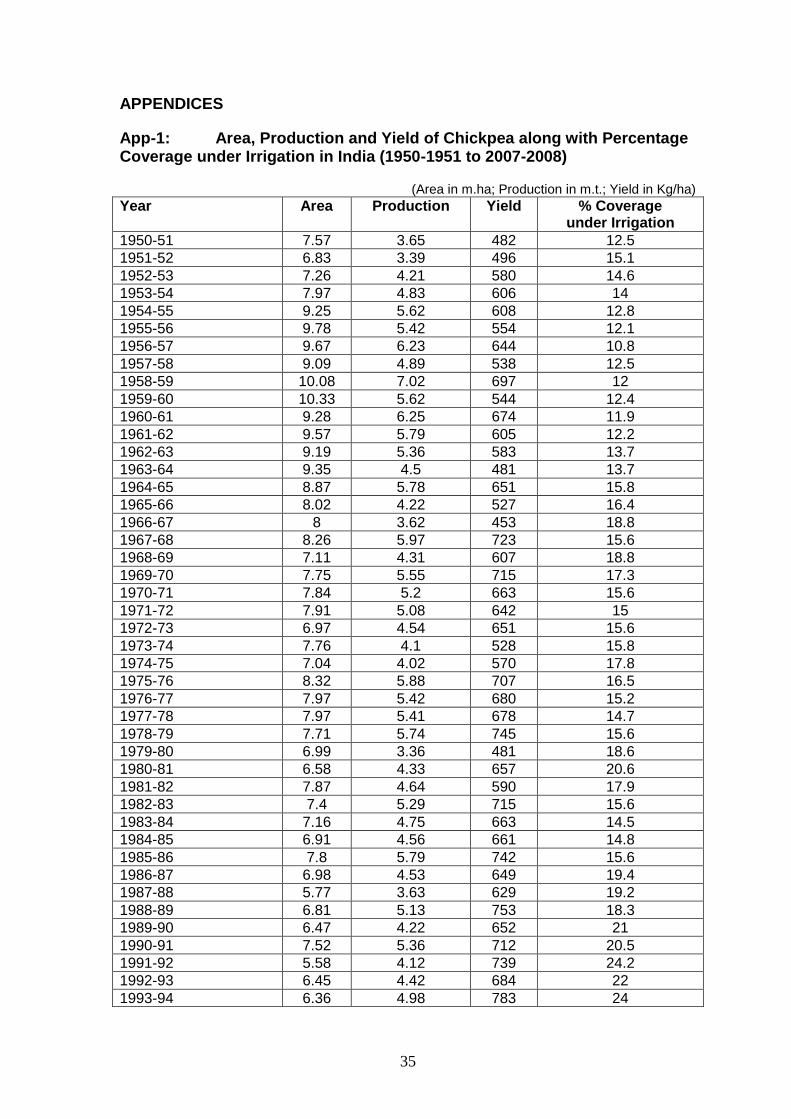
India occupies the first position in the world in terms of chickpea area (6.93 m.ha.) and
production (5.60 m.t.) during 2005-06 accounting for nearly 31 per cent and 40 per cent of total
pulses area and production respectively, with a productivity of 808 kg/ha (Appendix-1). The largest
chickpea producing state in the country is Madhya Pradesh followed by Uttar Pradesh, Rajasthan,
Maharashtra, Andhra Pradesh and Karnataka (Appendix-2). Karnataka ranks fifth in the cultivation
of chickpea with an area of 4.49 lakh ha, 2.08 lakh tonnes of production and 464 kg/ha of
productivity (TE 2005-06).
In Karnataka, Gulbarga occupies the first position in chickpea area (1.24 lakh ha), production
(8.63 lakh tonnes) and productivity (733 kg/ha) accounting for 30 per cent and 37 per cent of the
total chickpea area and production in the State (Appendix-3), followed by Bijapur (11.88% and
11.02%, respectively), Belgaum (9.91% and 8.81%), Bidar(9.69% and 9.06%), Dharwad (9.35% and
7.55%) and Gadag (9.33% and 10.71%).
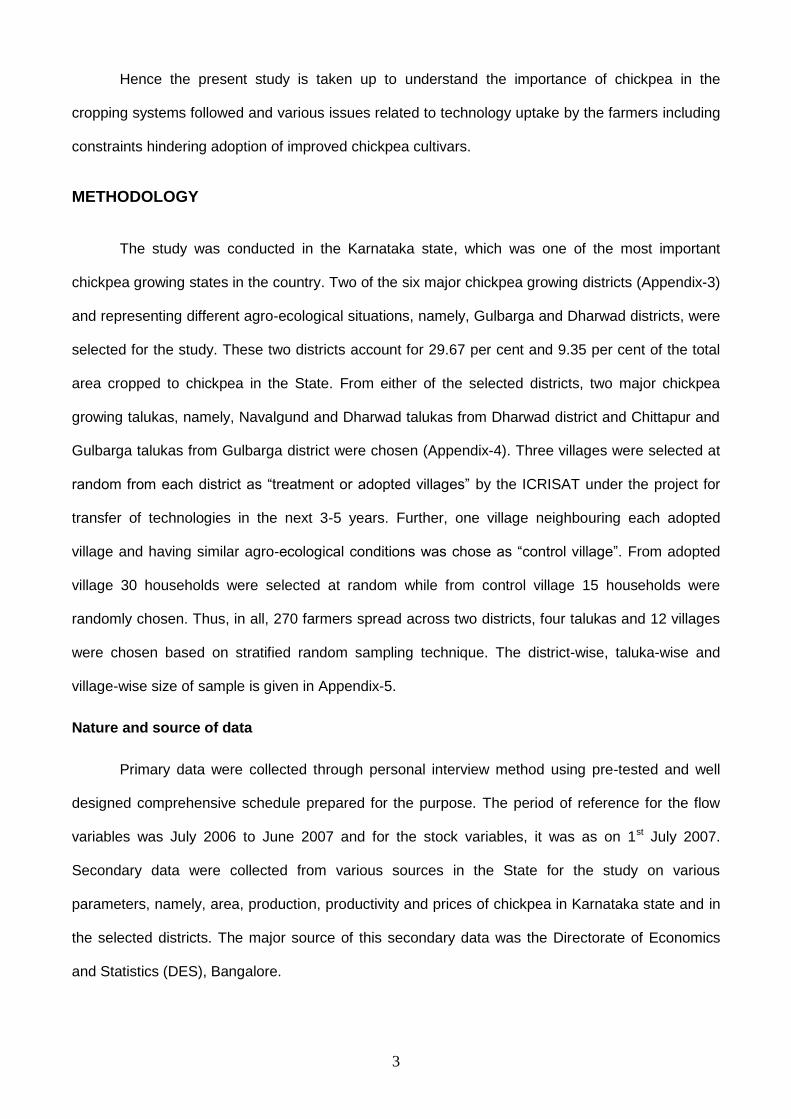
The Karnataka State has been divided into 10 agro-climatic zones. In each zone different
chickpea based cropping systems exist which are listed below.
SN Agro-climatic Zone Cropping Systems
1 North Eastern Transitional Zone Sorghum-Chickpea
2
Greengram/Blackgram-Chickpea Sesamum-Chickpea
2 North Eastern Dry Zone Bajra-Chickpea Sesamum-Chickpea Kharif Fallow-Chickpea Sunflower-Chickpea
3 Northern Dry Zone Sunflower-Chickpea Bajra-Chickpea Kharif Fallow-Chickpea Maize-Chickpea
4 Central Dry Zone Groundnut-Chickpea Ragi-Chickpea
5 South Eastern Dry Zone Groundnut-Chickpea
6 Southern Dry Zone Ragi-Chickpea
7 Southern Transitional Zone Ragi-Chickpea Sunflower-Chickpea
8 Northern Transitional Zone Maize-Chickpea Sorghum-Chickpea Soybean-Chickpea
9 Hilly Zone Negligible area under paddy fallows
10 Coastal Zone Negligible area under paddy fallows
Chickpea is the major pulse crop in Karnataka state. However its area and production are
fluctuating year after year due to high incidence of pest and diseases, rainfed condition and
fluctuating market prices. Farmers do not get remunerative price for their produce on the one hand
and incur high cost of cultivation on the other. The farmers take their produce to the other states
hoping for better prices and marketing facilities. The lower productivity of chickpea is due to non-
availability of improved cultivars, non-adoption of proper production technologies, severe incidence
of pests and diseases, non-remunerative market prices, lack of area under irrigation and its
cultivation mainly as a mixed crop. Marketing facilities available to this crop are reportedly not
efficient. Thus both production and marketing of chickpea are associated with the various
technological and economic constraints, thus hindering the adoption of chickpea production
technologies.
3
Hence the present study is taken up to understand the importance of chickpea in the
cropping systems followed and various issues related to technology uptake by the farmers including
constraints hindering adoption of improved chickpea cultivars.
METHODOLOGY
The study was conducted in the Karnataka state, which was one of the most important
chickpea growing states in the country. Two of the six major chickpea growing districts (Appendix-3)
and representing different agro-ecological situations, namely, Gulbarga and Dharwad districts, were
selected for the study. These two districts account for 29.67 per cent and 9.35 per cent of the total
area cropped to chickpea in the State. From either of the selected districts, two major chickpea
growing talukas, namely, Navalgund and Dharwad talukas from Dharwad district and Chittapur and
Gulbarga talukas from Gulbarga district were chosen (Appendix-4). Three villages were selected at
random from each district as “treatment or adopted villages” by the ICRISAT under the project for
transfer of technologies in the next 3-5 years. Further, one village neighbouring each adopted
village and having similar agro-ecological conditions was chose as “control village”. From adopted
village 30 households were selected at random while from control village 15 households were
randomly chosen. Thus, in all, 270 farmers spread across two districts, four talukas and 12 villages
were chosen based on stratified random sampling technique. The district-wise, taluka-wise and
village-wise size of sample is given in Appendix-5.
Nature and source of data
Primary data were collected through personal interview method using pre-tested and well
designed comprehensive schedule prepared for the purpose. The period of reference for the flow
variables was July 2006 to June 2007 and for the stock variables, it was as on 1st July 2007.
Secondary data were collected from various sources in the State for the study on various
parameters, namely, area, production, productivity and prices of chickpea in Karnataka state and in
the selected districts. The major source of this secondary data was the Directorate of Economics
and Statistics (DES), Bangalore.

4
RESULTS AND DISCUSSION
Cropping pattern
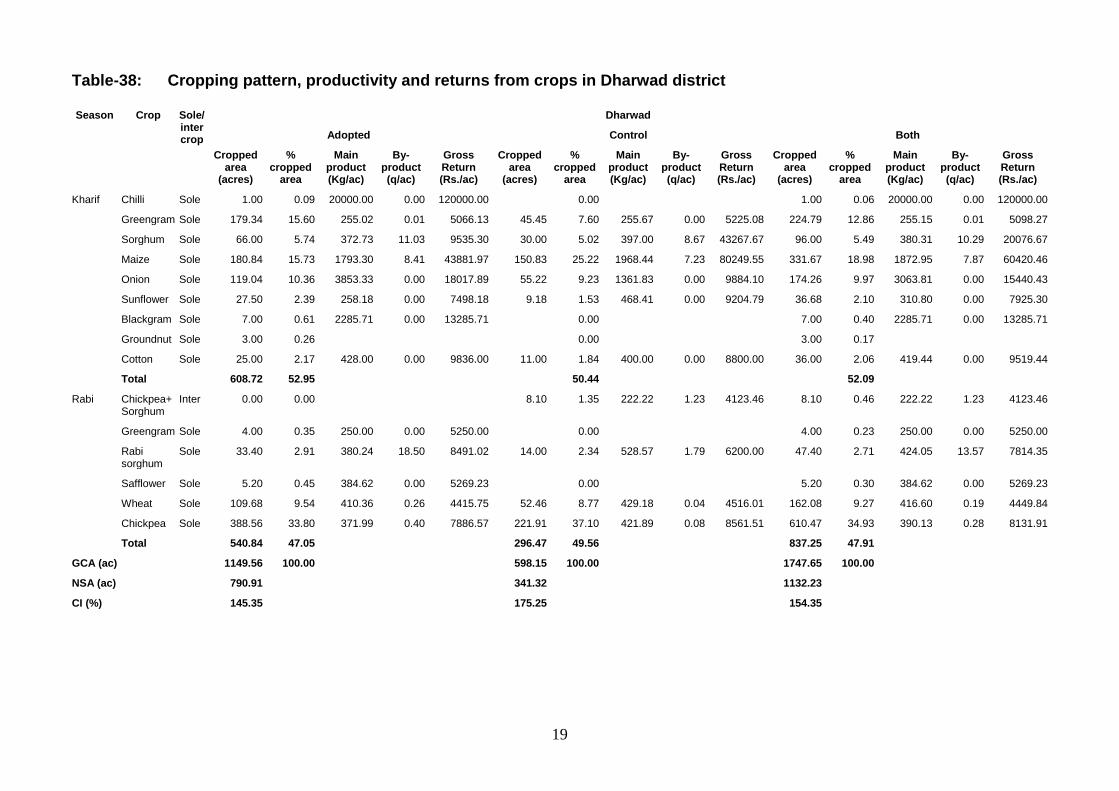
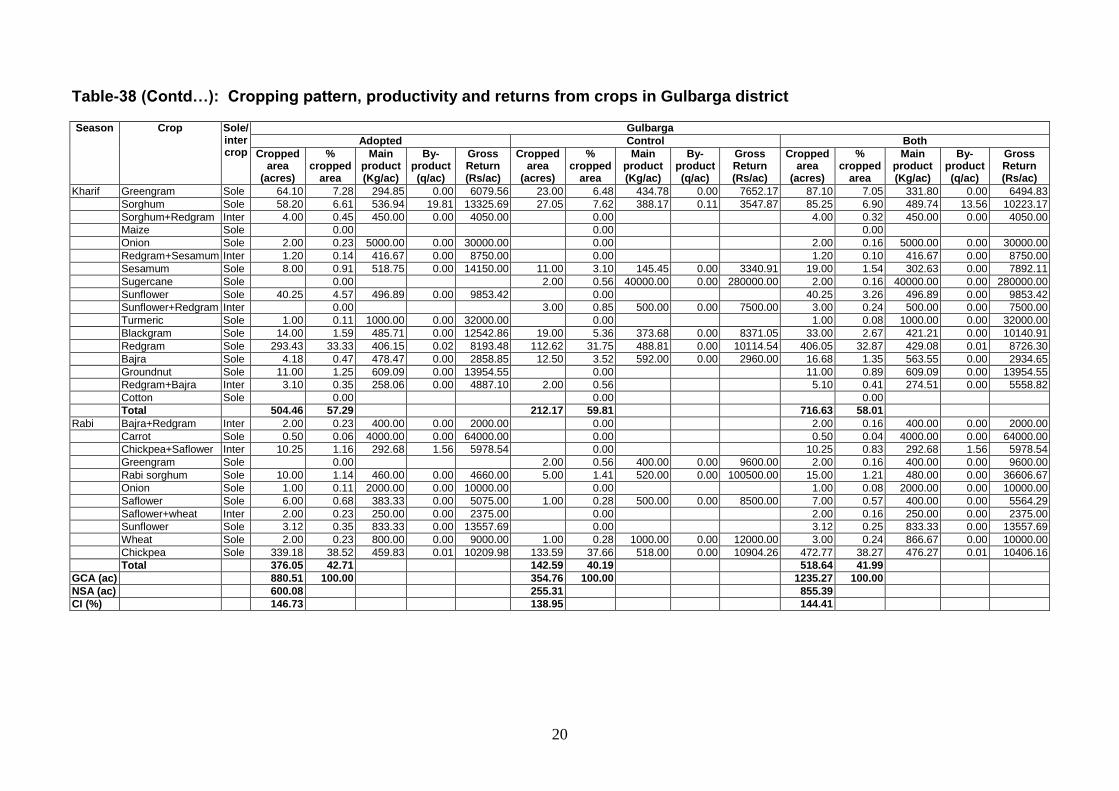
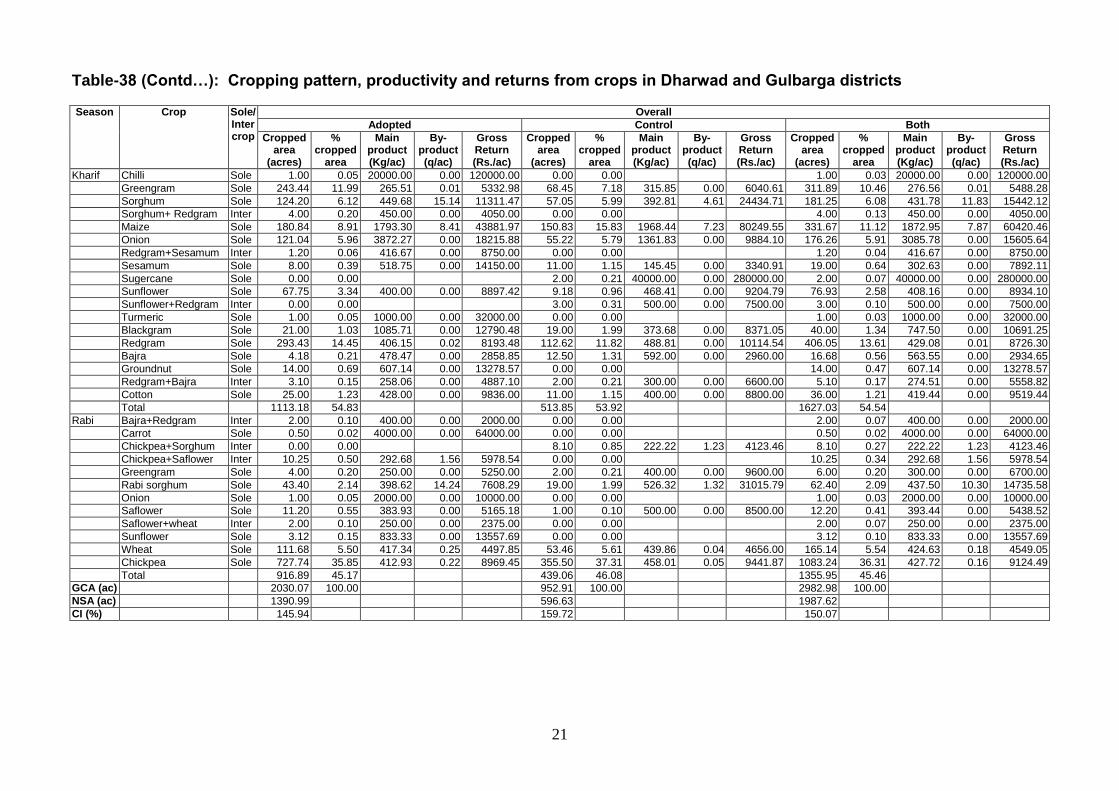
The cropping pattern followed by the sample respondents during the year 2006-07
agricultural year is presented in Table-38. Across the selected districts and area (adopted and
control), the gross cropped area was to the tune of 2983 ac and the net sown area was 1988 ac.
The cropping intensity was worked out to be 150 per cent. Kharif crops shared nearly 55 per cent of
the gross cropped area while the remaining 45 per cent was planted to rabi crops. The major crops
grown during kharif season were redgram, maize, greengram, sorghum, onion and sunflower,
accounting for 13.61%, 11.12%, 10.46%, 6.08%, 5.91% and 2.58% of the gross cropped area.
During rabi, since all the respondents were chickpea growers by choice, the area under chickpea
was the highest (36.31%) followed by wheat (5.54%) and rabi sorghum (2.09%).
The cropping pattern was slightly different between districts. In Dharwad, kharif and rabi
seasons shared 52% and 48% of the gross cropped area respectively. The major crops grown
during kharif were maize (18.98%), greengram (12.86%), onion (9.97%), sorghum (5.49%),
sunflower (2.10%) and cotton (2.06%), while in rabi, chickpea (34.93%), wheat (9.27%) and rabi
sorghum (2.71%) were predominantly cultivated. This pattern was almost similar in adopted and
control villages of Dharwad district, with a lone exception of greengram being less predominant than
onion.
In Gulbarga district, 58% of the gross cropped area was occupied by kharif crops as against
42% in rabi. The major kharif crops were redgram (occupying 32.87% of the gross cropped area),
greengram (7.05%), sorghum (6.90%), sunflower (3.26%) and blackgram (2.67%), whereas
chickpea (38.27%) and rabi sorghum (1.21%) were the important rabi crops. Thus, Gulbarga district
has been called as the “Pulse bowl of India”.
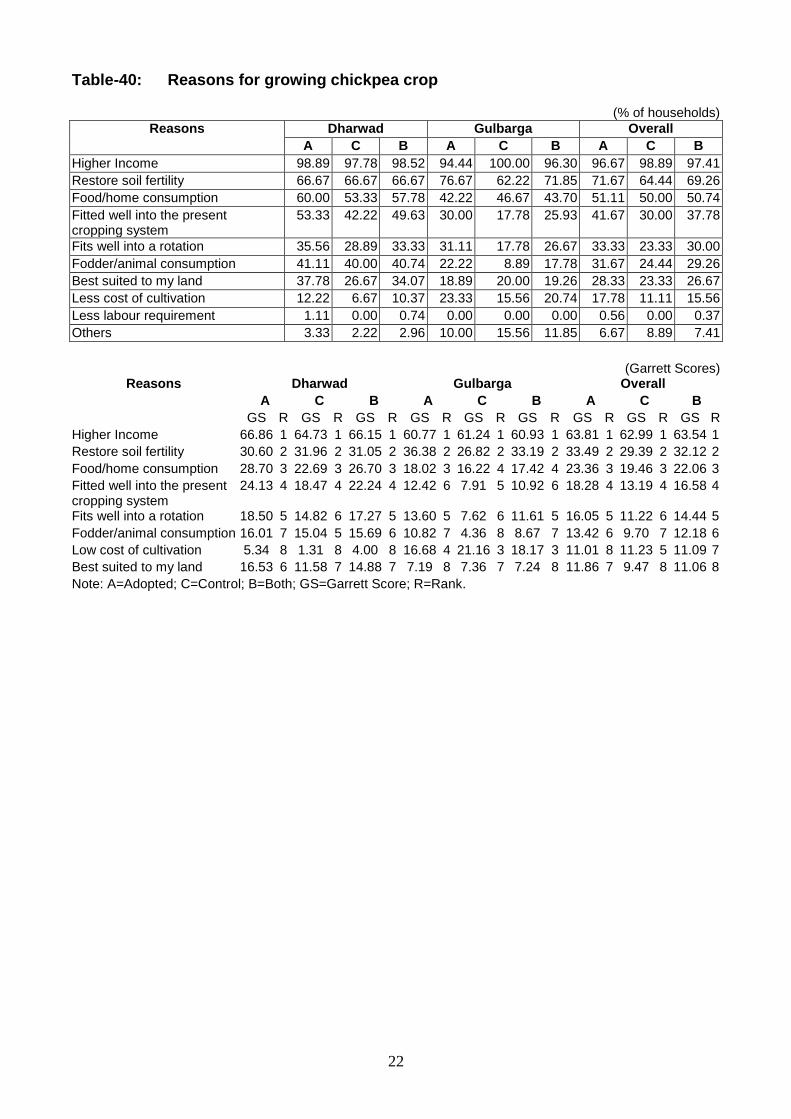
Reasons for growing chickpea
The most important reasons for growing chickpea by the sample respondents were
ascertained and analysed using Garrett Scores (Table-40). Across districts and areas, the most
5
important reason for growing chickpea was higher income as indicated by the highest Garrett Score
(63.54), followed by restoration of soil fertility (32.12), food/home consumption (22.06) and fits well
into the present cropping system (16.58). Similar pattern existed in adopted and control areas
separately and also in Dharwad district individually. However, in Gulbarga district, while the first two
reasons remained same, low cost of cultivation and food/home consumption assumed third and
fourth positions. This reason of “higher income” attributed to the chickpea cultivation was reflected in
the cropping pattern both in adopted and control areas.
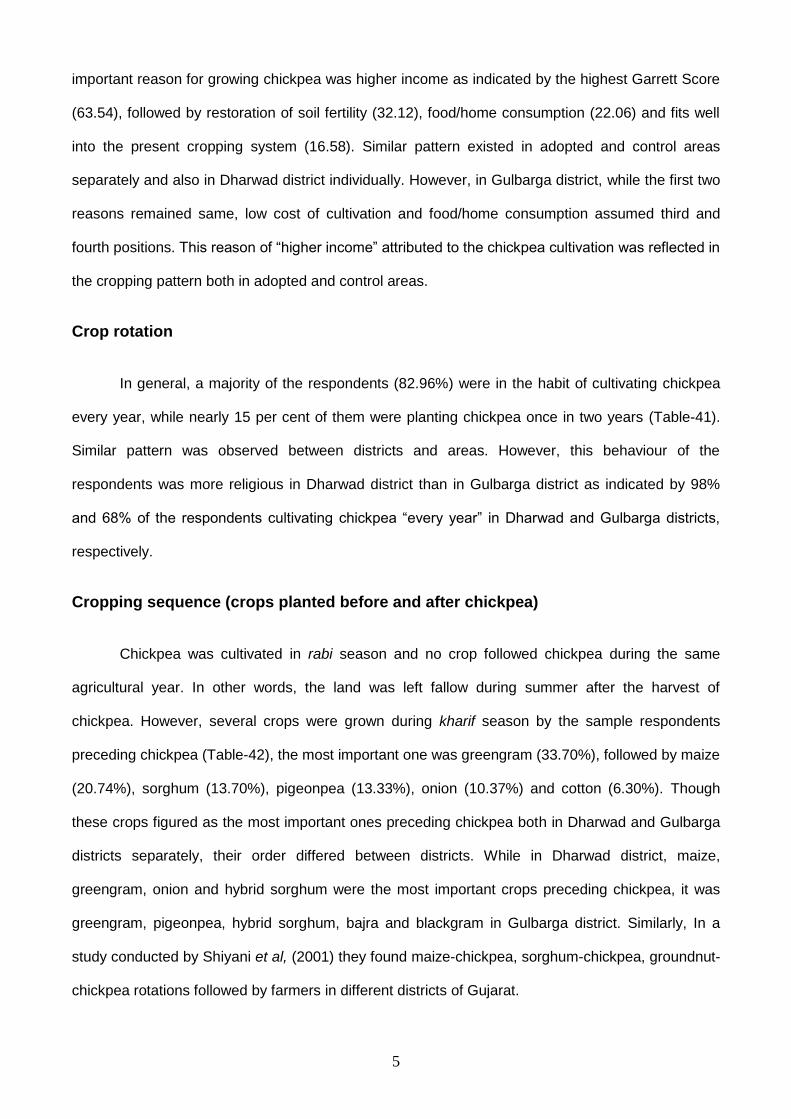
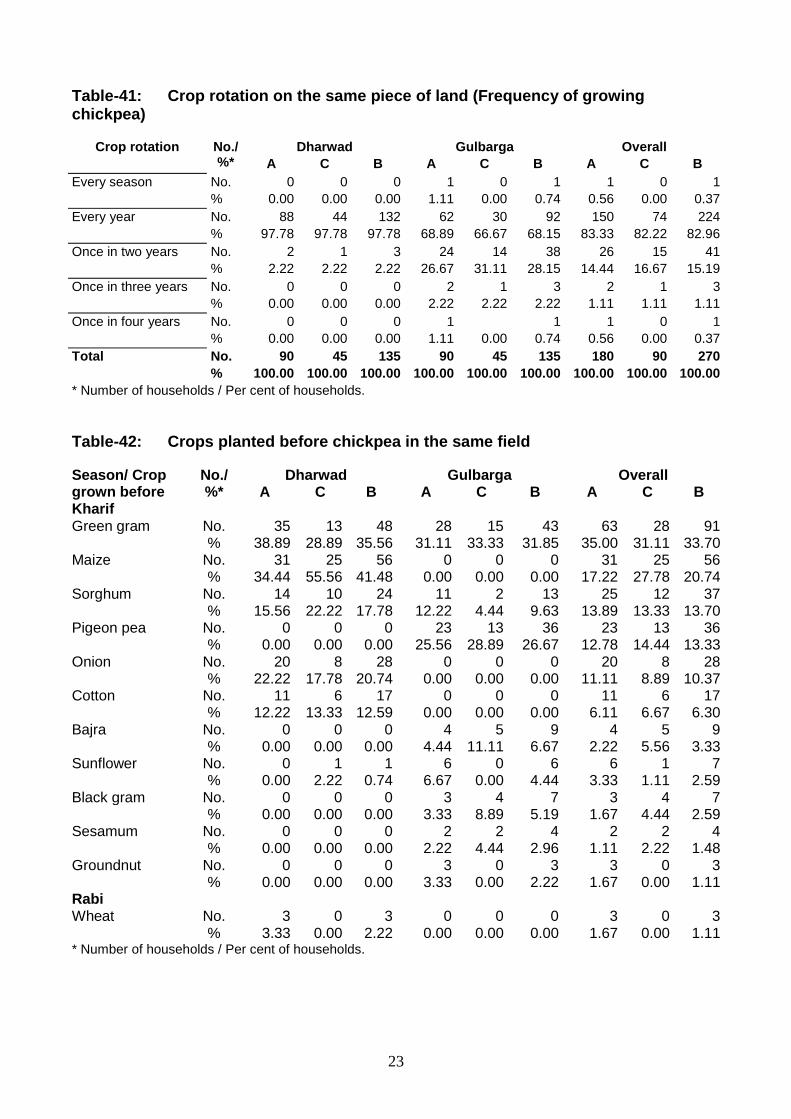
Crop rotation
In general, a majority of the respondents (82.96%) were in the habit of cultivating chickpea
every year, while nearly 15 per cent of them were planting chickpea once in two years (Table-41).
Similar pattern was observed between districts and areas. However, this behaviour of the
respondents was more religious in Dharwad district than in Gulbarga district as indicated by 98%
and 68% of the respondents cultivating chickpea “every year” in Dharwad and Gulbarga districts,
respectively.
Cropping sequence (crops planted before and after chickpea)
Chickpea was cultivated in rabi season and no crop followed chickpea during the same
agricultural year. In other words, the land was left fallow during summer after the harvest of
chickpea. However, several crops were grown during kharif season by the sample respondents
preceding chickpea (Table-42), the most important one was greengram (33.70%), followed by maize
(20.74%), sorghum (13.70%), pigeonpea (13.33%), onion (10.37%) and cotton (6.30%). Though
these crops figured as the most important ones preceding chickpea both in Dharwad and Gulbarga
districts separately, their order differed between districts. While in Dharwad district, maize,
greengram, onion and hybrid sorghum were the most important crops preceding chickpea, it was
greengram, pigeonpea, hybrid sorghum, bajra and blackgram in Gulbarga district. Similarly, In a
study conducted by Shiyani et al, (2001) they found maize-chickpea, sorghum-chickpea, groundnut-
chickpea rotations followed by farmers in different districts of Gujarat.
6
In Dharwad district, maize-chickpea cropping sequence was the most popular one. With the
onset of monsoon, the farmers go for early sowing of maize so that they the crop is irrigated at later
critical stages once the water is released in the irrigation canals. In the North-Eastern part of
Gulbarga district, green gram-chickpea and short duration pigeon pea followed by chickpea are the
popular cropping sequences followed.
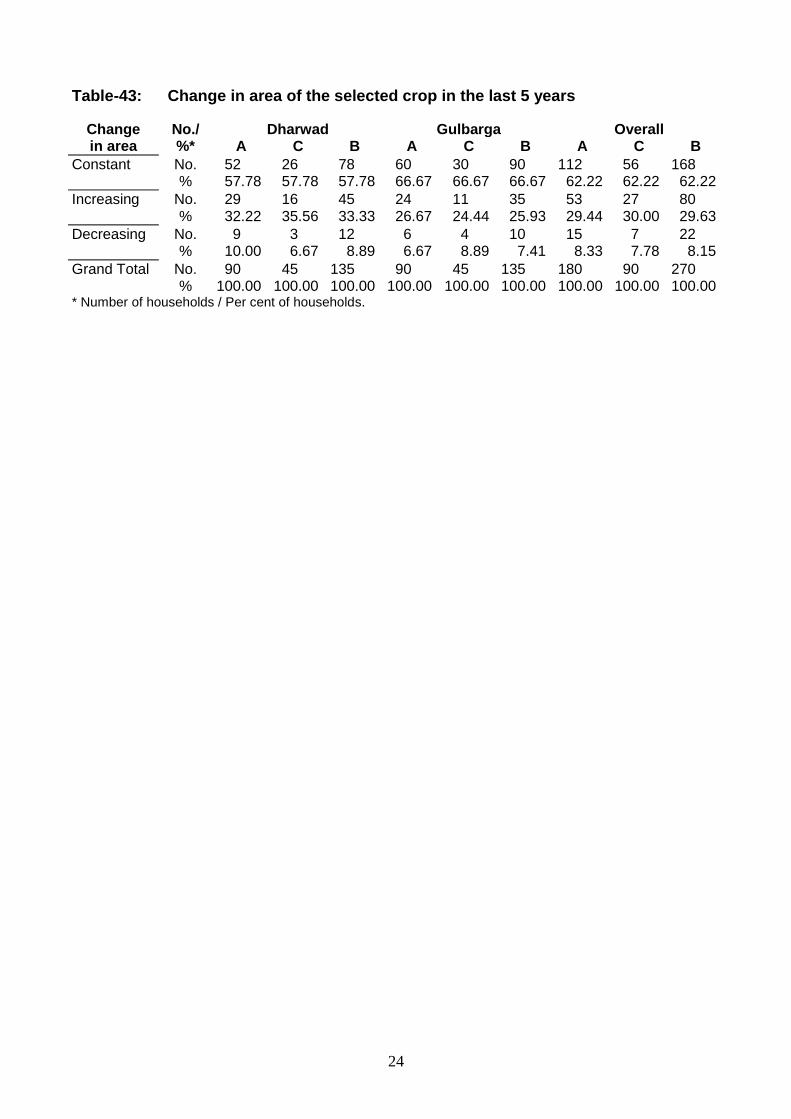
Change in area of chickpea in last 5 years
The micro-level evidence suggests that the area under chickpea was constant according to
nearly 62 per cent of the sample respondents (Table-43). On the other hand, about 30 per cent of
the sample respondents opined that the chickpea area was increasing as against about 8 per cent
of them feeling a decline. The situation was almost similar across selected districts and areas. This
reveals an increasing interest among the farmers towards cultivation of chickpea crop as a
commercial crop.
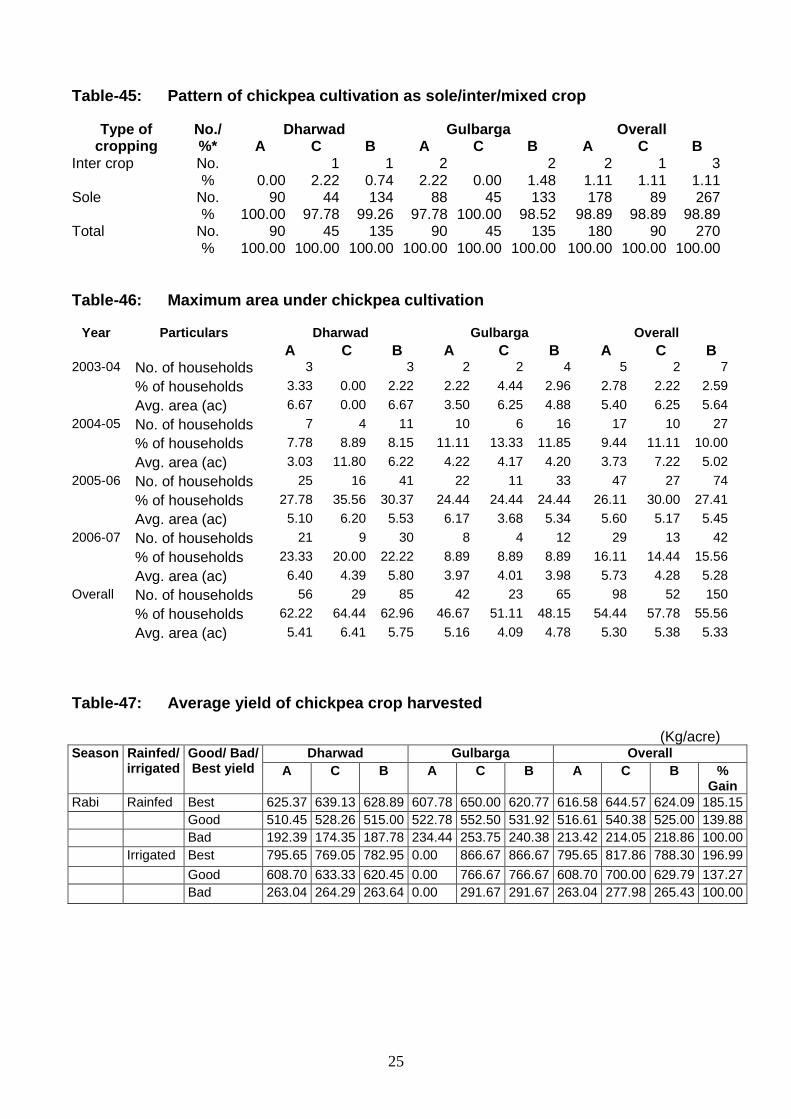
Cropping system followed by chickpea farmers
It is interesting to see that nearly 99% of the chickpea farmers cultivated chickpea as a sole
crop (Table-45). Hardly 1.11% of them grew chickpea as inter crop with either sorghum or safflower.
In earlier years, chickpea was cultivated mostly as an intercrop with rabi sorghum in 1:5 proportion.
Over time, this practice is vanishing mainly due to relatively higher returns from chickpea crop and
reduced demand for sorghum fodder. On the other hand, safflower as an intercrop with chickpea
has become uncommon due to difficulties in harvesting of safflower.
Maximum area under chickpea cultivation
Across districts and areas, the area under chickpea per household was maximum (5.64 ac)
in the year 2004, which fell to 5.02 ac in 2005, increased to 5.45 in 2006 and again fell to 5.28 in
2007 (Table-46). Thus, it ranged between 5-6 ac, with an average of 5.33 ac. This acreage is
something like frontier area under chickpea per household. However, the proportion of respondents
registering maximum area in different years (2004-07) followed a bell shaped curve, starting from
2.59% to 10% to 27.41% to 15.56%. Similar pattern was observed separately in selected districts
7
and areas. This analysis indicates that the maximum area allocation to chickpea by a farmer newly
opting for chickpea cultivation would remain in the range of 5-6 ac. This also has some bearing on
the saturation level of chickpea production technology uptake.
Yield of chickpea in best, good and bad years
The average of the best yields harvested by the sample respondents was 624 kg/ac in
rainfed situation as against 788 kg/ac in irrigation condition (Table-47). It ranged from 607 to 650
kg/ac in rainfed condition as against 769 to 867 kg/ac in irrigation situation across districts and
areas (adopted and control).
In good years, the average yield was to the tune of 525 kg/ac (range: 510-553) and 630
kg/ac (range: 609-767) in rainfed and irrigated conditions, respectively, whereas in bad years, the
corresponding yield levels were 219 kg/ac (range: 174-254) and 265 kg/ac (range: 263-292). The
percentage yield gains over the bad-year yields were also calculated and presented in Table-47.
The good-year yields were 40 per cent and 37 per cent over the bad-year yields under rainfed and
irrigated situations, respectively whereas the best-year yield increments were correspondingly 185
per cent and 137 per cent. Hence, other things being equal, the technology performance was better
between bad to good years than between good to best years.
Chickpea cultivars grown in the last three years
The chickpea cultivars grown during the last three years (2004-05 to 2006-07 cropping
seasons) in the select districts was analysed and the results are presented in Table-48. In all, four
varieties were grown in the study area, namely, Annigeri, Kabuli, Bhima and local. However, Bhima
was rarely cultivated in Gulbarga district. Annigeri was grown predominantly in the study area as
revealed by more than 91 per cent of the farmer respondents cultivating chickpea (around 90% in
Dharwad and 97% in Gulbarga).
In terms of average area under variety per household, Annigeri appropriated the highest
area (nearly 4 acres), followed by Kabuli, Bhima and local, in general, with the exception of absence
of Bhima in Gulbarga district.
8
It is very interesting to note that over the last three years, the area under chickpea seemed
to increase, irrespective of the variety. It increased from 3.62 to 4.13 acres under Annigeri, 2.10 to
3.90 acres under Kabuli, 1.73 to 3.05 acres under Bhima and 1.81 to 2.71 acres under local
varieties. This trend in area gives an indication that although the other varieties like Kabuli and
Bhima are not popularly grown by the farmers however shows an inclination towards bringing more
area under them.
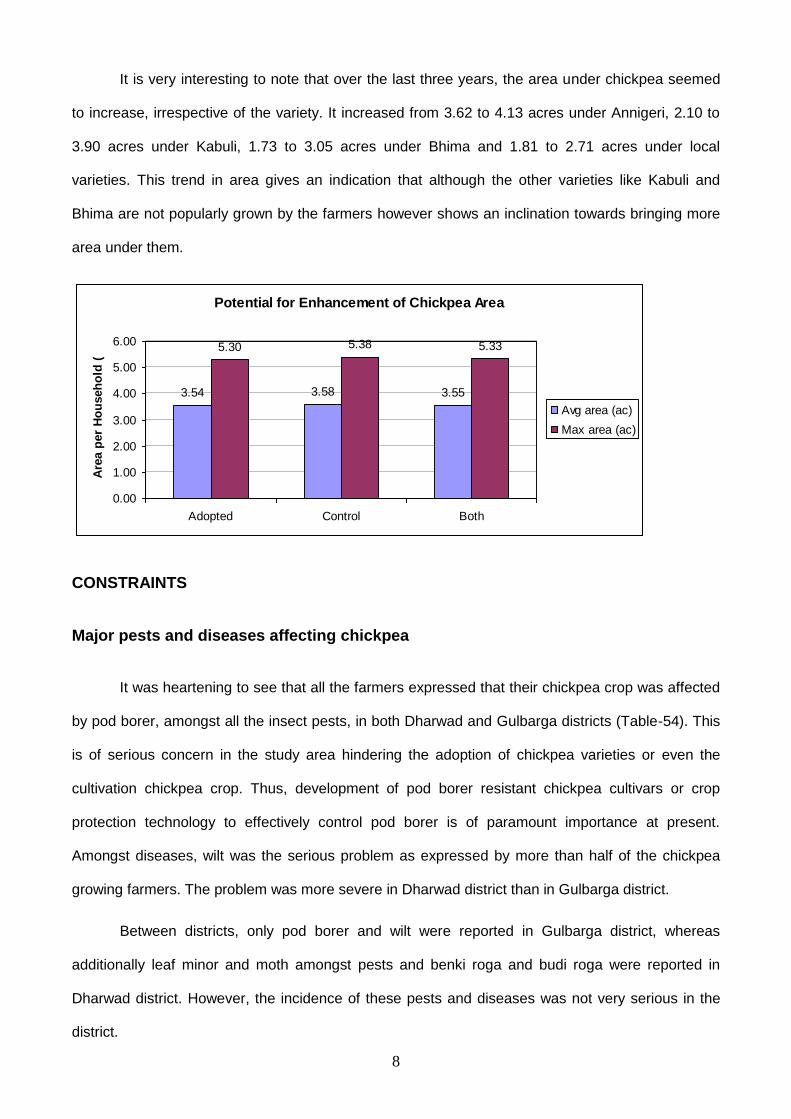
Potential for Enhancement of Chickpea Area
3.54 3.58 3.55
5.30 5.38 5.33
0.00
1.00
2.00
3.00
4.00
5.00
6.00
Adopted Control Both
Are
a p
er
Ho
useh
old
(h
a)
Avg area (ac)
Max area (ac)
CONSTRAINTS
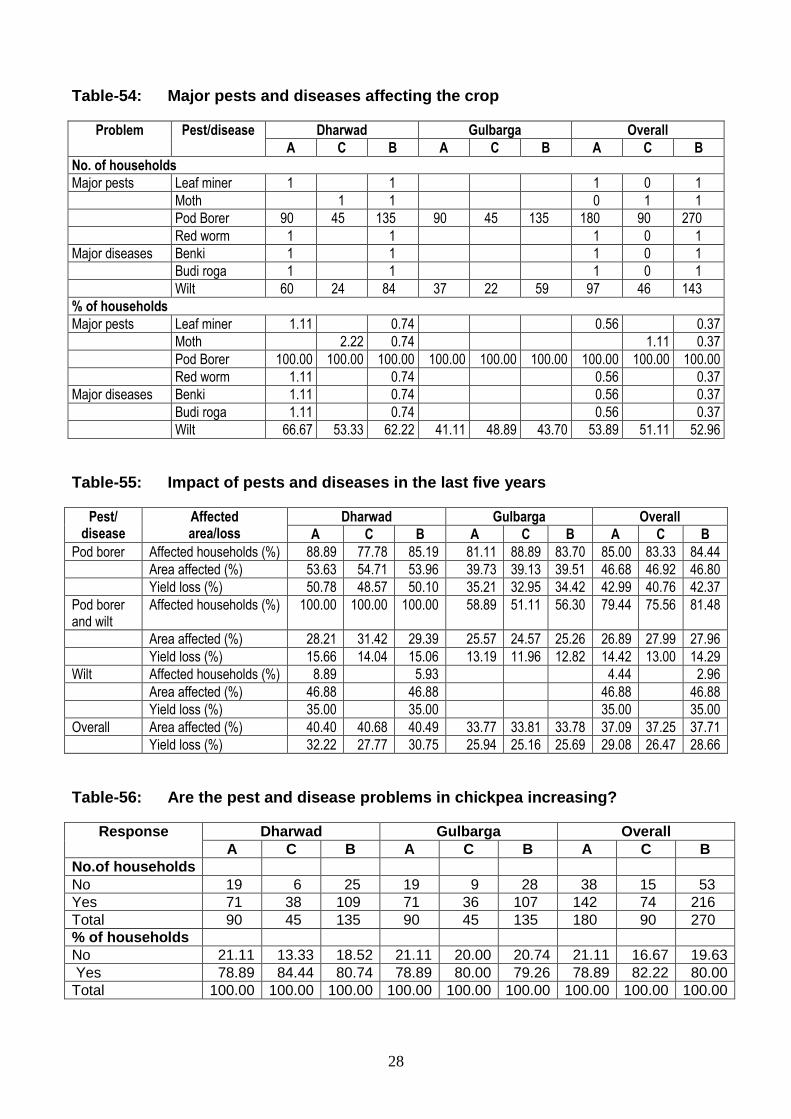
Major pests and diseases affecting chickpea
It was heartening to see that all the farmers expressed that their chickpea crop was affected
by pod borer, amongst all the insect pests, in both Dharwad and Gulbarga districts (Table-54). This
is of serious concern in the study area hindering the adoption of chickpea varieties or even the
cultivation chickpea crop. Thus, development of pod borer resistant chickpea cultivars or crop
protection technology to effectively control pod borer is of paramount importance at present.
Amongst diseases, wilt was the serious problem as expressed by more than half of the chickpea
growing farmers. The problem was more severe in Dharwad district than in Gulbarga district.
Between districts, only pod borer and wilt were reported in Gulbarga district, whereas
additionally leaf minor and moth amongst pests and benki roga and budi roga were reported in
Dharwad district. However, the incidence of these pests and diseases was not very serious in the
district.
9
Frequency of occurrence and yield loss estimated by household in the last five years
During the last five years, the incidence of pests and diseases on chickpea crop and its
impact was analysed in terms of percentage households affected, percentage area affected and
percentage yield loss and results are presented in Table-55. The responses of farmers are grouped
into three: one, those affected by pod borer; second, those affected by wilt; and third, those affected
by both pod borer and wilt.
In terms of percentage of respondents affected, nearly 84 per cent were affected by pod
borer alone, while wilt was the problem with only 3 per cent of the respondents. Both pod borer and
wilt were of serious concern for nearly 81 per cent of the respondents.
The area affected by pod borer, wilt and pod borer+wilt was to the tune of 47 per cent, 47
per cent and 28 per cent, respectively. Thus, in terms of area affected, both pod borer and wilt were
of equally serious concern.
However, in terms of yield loss, pod borer topped the list reducing the yield to the extent of
42 per cent, whereas the yield loss due to wilt was to the tune of 35 per cent. Interestingly, the
chickpea farms affected both by pod borer and wilt witnessed a yield loss of only about 14 per cent.
Occurrence of wilt along was not found in Gulbarga district; it was either pod borer or pod
borer+wilt. Similar was the situation in control area of Dharwad district. Thus, it signal towards the
need for protecting the crop against these pests and diseases by promoting extension services to
the farmers so as to enhance crop growth performance and to minimise the yield losses.
Are the pest and disease problems increasing over time?
In general across districts and regions (adopted and control), nearly 80 per cent of the
farmers felt that the pest and disease problems were increasing over time, whereas the remaining
20 per cent of them felt the other way (Table-56). One farmer opined neutral indicating that the
problem remains constant. Such an increasing trend in pest and disease problems has an
implication in the crop management and eventually on the profitability. The intervention through
resistant cultivars addresses the issue of rising menace.

10
Between adopted and control areas, the problem was relatively less severe in adopted area
compared to control area; nearly 82 per cent of farmers opined that there was an increase in pest
and disease problem in adopted area as against 79 per cent in control area.
However, between districts, the situation was almost similar.
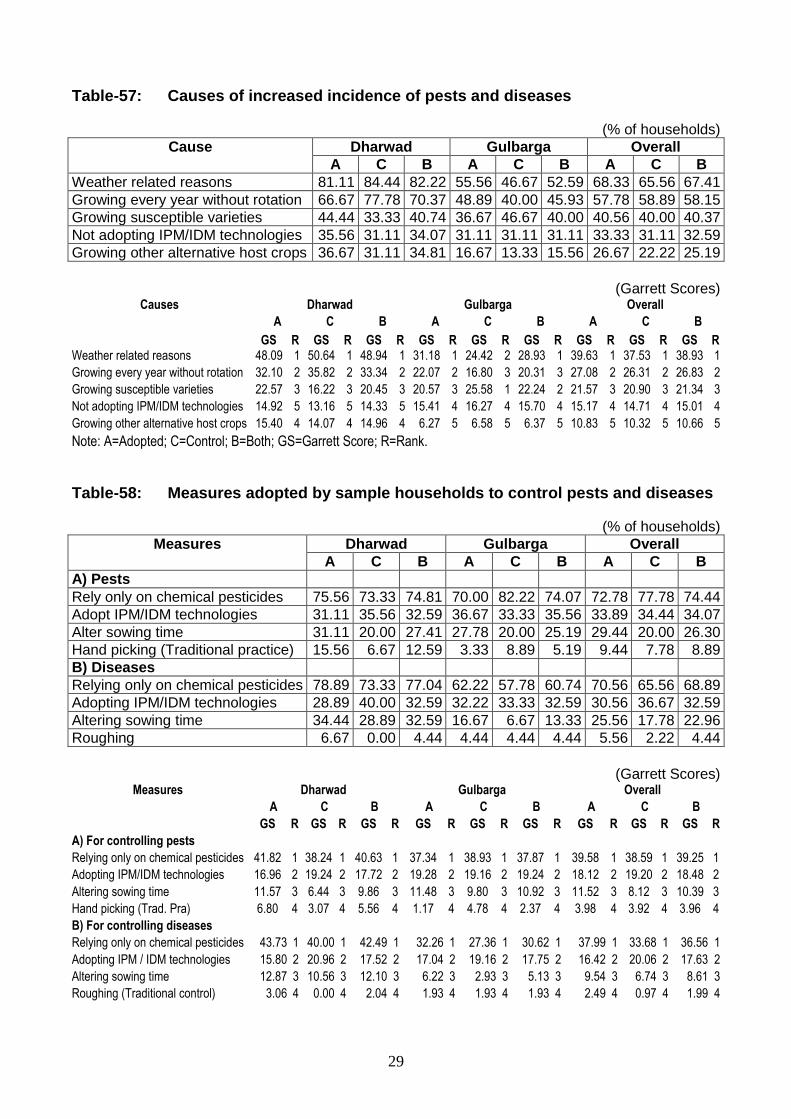
Causes for increased incidence of pests and diseases (Garrett Scores)
The ranks given by the respondents for various causes of increased pest and disease
incidence were processed into Garrett Scores (Table-57). Generally, across districts and regions,
“weather related reasons” topped the list (GS=38.93), followed by “growing every year without
rotation” (GS=26.83), “growing susceptible varieties” (GS=21.34), “not adopting IPM/IDM
technologies (GS=15.01) and “growing other alternative host crops” (GS=10.66).
The prioritisation of these causes was similar between adopted and control regions.
However, it varied slightly in individual districts; “growing other alternative host crops” scoring over
“not adopting IPM/IDM technologies” in Dharwad district while in Gulbarga district, “growing
susceptible varieties” was more a severe cause than “growing every year without rotation”.
Measures of controlling pests and diseases (Garrett Scores)
Farmers were asked to rank the measures that adopted to control the pests and diseases on
chickpea crop that they grew. These ranks were processed into Garrett Scores and presented in
Table-58.
To control pests on chickpea, most of the farmers relied only on application of chemical
pesticides as indicated by the Garrett Score (39.25). The other pest controlling measures adopted
by farmers, in order of priority, were adopting IPM/IDM technologies (GS=18.48), altering sowing
time (GS=10.39) and hand picking (GS=3.96). The situation was exactly similar in different districts
and regions (adopted and control).
As regards control of diseases, again “relying only chemical pesticides” was predominantly
adopted, followed by “adopting IPM/IDM technologies”, “altering sowing time” and “roguing”. Again,
exactly same prioritisation was observed in selected districts and regions.

11
This analysis indicated a greater reliance on the use of chemical pesticides by farmers in the
management of pests and diseases in chickpea. Therefore, there is a need for popularising the
other methods of pest management such as through IPM/IDM technologies, by altering sowing time,
hand picking and roughing.
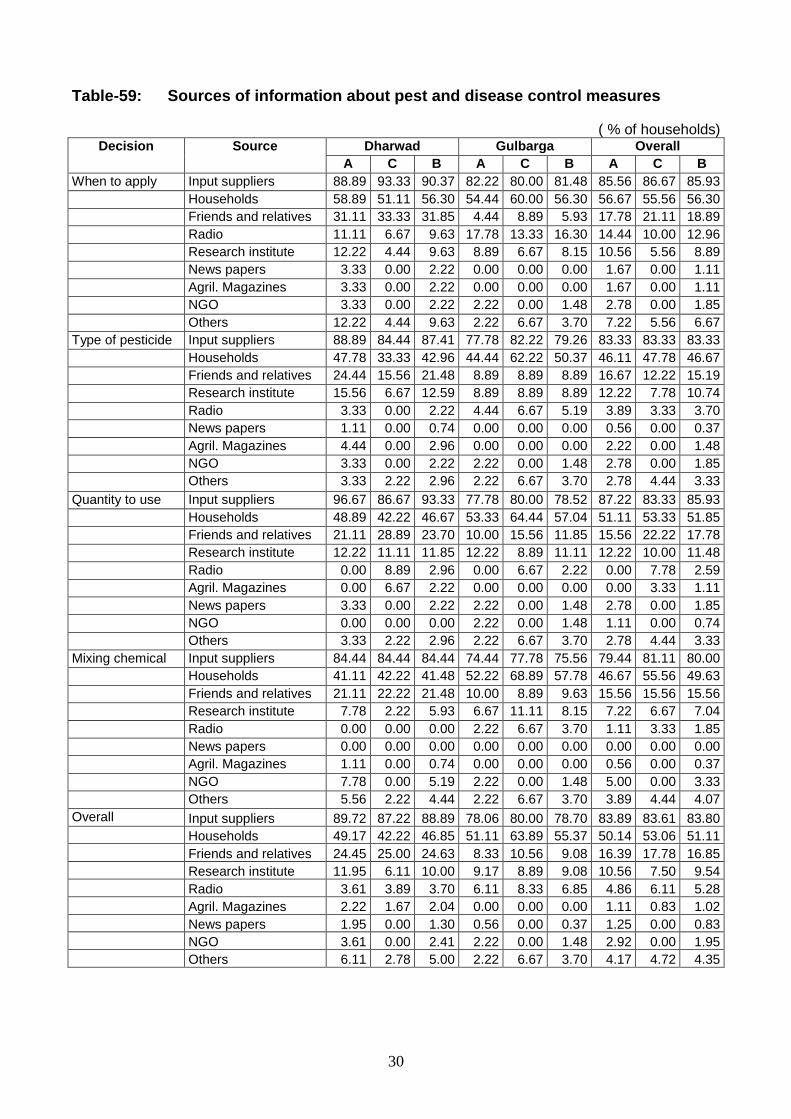
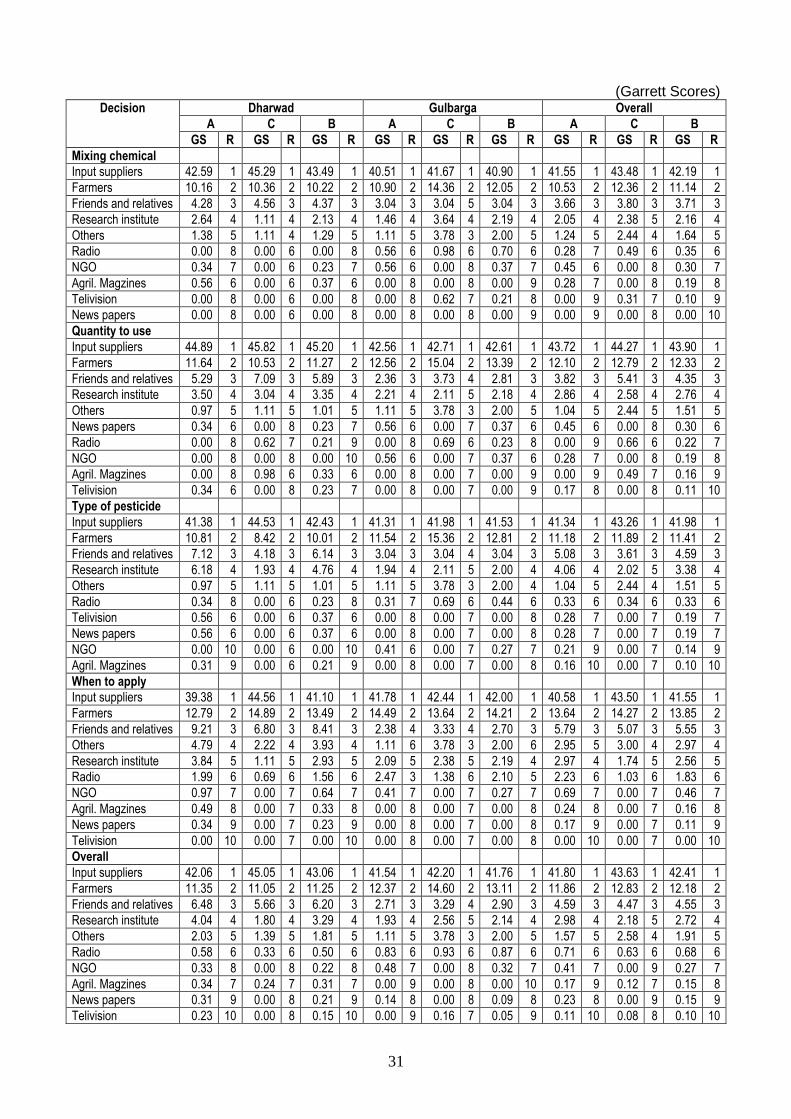
Sources of information about pest and disease control measures (Garrett Scores)
The sources of information on various aspects of pest and disease control measures
adopted, namely, when to apply, what to apply (type of pesticide), how to apply (mixing chemical)
and how much to apply (quantity to use) were ascertained from the sample households. These
ranks were again converted into Garrett Scores and presented in Table-59.
In general, across all these aspects, districts and regions, input suppliers were the most
important source of information on pest and disease control to the farmers, followed by fellow
farmers, friends and relatives, research institute, radio, NGOs, agricultural magazines, news papers,
television and others, in that order.
The first five sources of information remained the same across districts and regions (adopted
and control), with slightly varied order. Even they remained the same across various aspects of pest
and disease control, namely, when to apply, what to apply, how to apply and how much to apply.
Amongst the mass media, radio was the most important source of information followed by
news paper and television, in general. This could be probably because of the less
accessibility/affordability of news paper and television.
These traditional sources of information are still considered important and often the farmers
depend for information on pest and disease control measures. However, the institutional sources
have a considerable role in promoting spread of technological know-how to the farmers and the
results thus direct towards the need for increasing such efforts.

12
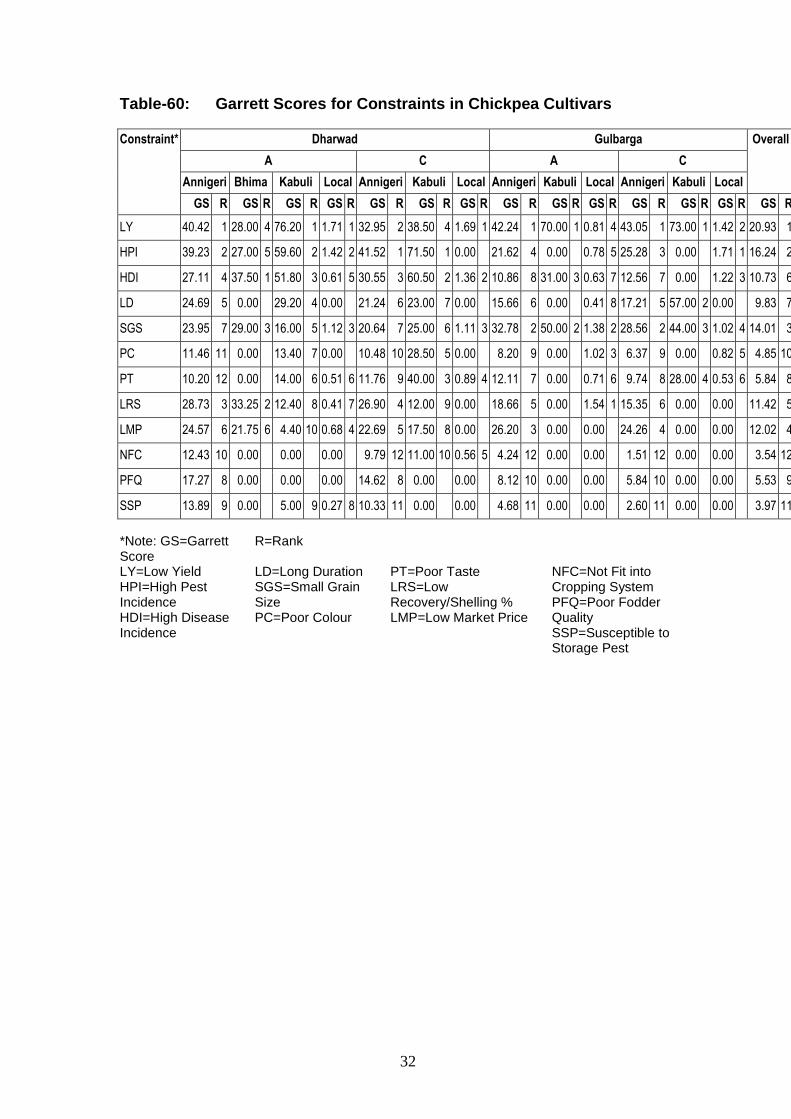
Constraints in chickpea cultivars
The constraints faced by the chickpea cultivars in terms of production, marketing and
consumption are analysed using Garrett Ranking Method and the results are summarized in Table-
60. These are based on the opinions expressed by the men in the selected households.
The Annigeri, Kabuli and local varieties were cultivated by the farmers in the study districts
both in adopted and control areas, except that Bhima variety was also cultivated additionally in
Dharwad-Adopted situation. However, Annigeri variety was popularly cultivated by a large
proportion of farmers both in adopted and control areas of the study districts.
In general, across all cultivars, areas (adopted and control) and districts, low yield (Garrett
Score, GS=20.93) was the major constraint confronted by the farmers in chickpea production. The
major constraints in descending order of priority were high pest incidence (GS=16.24), small grain
size (GS=14.01), low market price (GS=12.02), low recovery/shelling percentage (GS=11.42), high
disease incidence (GS=10.73) and long crop duration (GS=9.83).
Coming to variety-wise constraints, in Dharwad district, cultivators of Annigeri variety faced
the constraints of low yield, high pest incidence, low recovery/shelling percentage and high disease
incidence, both in adopted and control areas, but with varying order. However, in Gulbarga, though
low yield and high pest incidence topped the list in both adopted and control areas, the other
constraints of severity were small grain size and low market price. One of the reasons for low
market price was small grain size. Hence, Gulbarga being the major chickpea-producing district in
the country, grain size needs enough attention in future chickpea crop breeding programmes.
In the case of Kabuli variety, while low yield, high pest incidence, high disease incidence and
long duration were the major constraints in Dharwad-adopted area, Dharwad-control area was
confronted with high pest incidence, high disease incidence, poor taste and low yield in that order.
In Gulbarga, on the other hand, adopted area was confronted with the constraints of low yield, small
grain size and high disease incidence whereas low yield, long duration, small grain size and poor
taste were the major constraints faced by their counterparts in control area.

13
For Bhima, which was cultivated only in Dharwad-adopted area, the serious bottlenecks
were high disease incidence, low recovery/shelling percentage, small grain size, low yield, high pest
incidence and low market price. If nothing can be done by the researchers about low
recovery/shelling percentage, grain size and low market price, at least pests and diseases could be
controlled through improved agronomic practices which would probably enhance its yield and
promote its adoption in Gulbarga district and other areas of Dharwad district.
The constraints faced by the farmers in cultivating local varieties of chickpea varied between
districts and areas (adopted and control).
Thus, the crop improvement efforts should concentrate on at least two or three constraints
faced by the farmers in the study area by prioritising these constraints, if the research budgets are
limited.
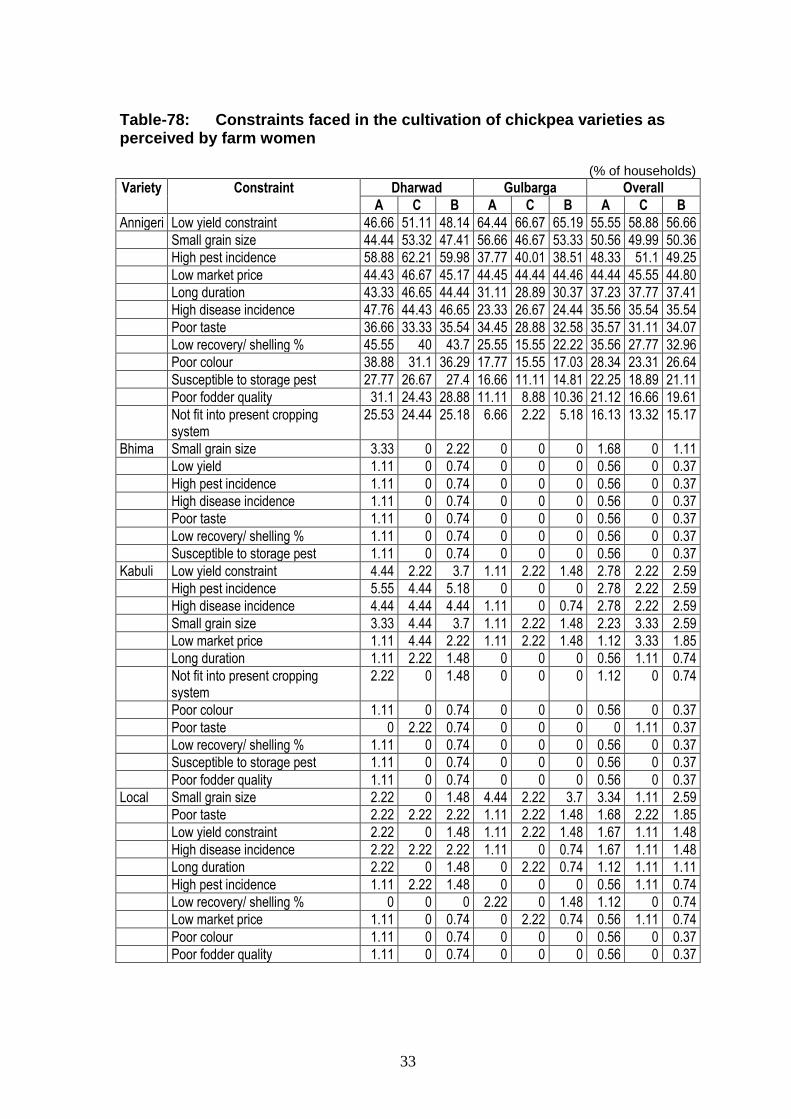
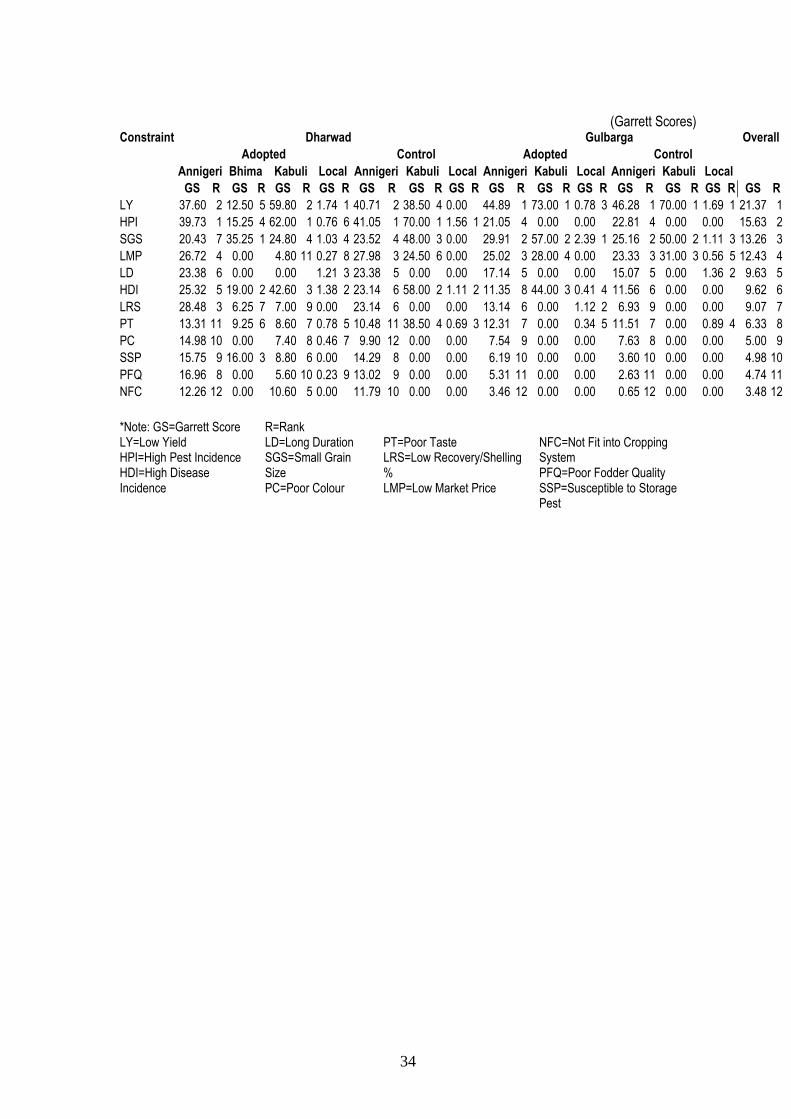
Constraints in chickpea cultivars according to farm women
When we compare the constraints in chickpea cultivars expressed by women (Table-78) with
those of men (Table-60) in the selected households, it could be observed that top four constraints
remain same between men and women across districts and regions in general, namely, low yield,
high pest incidence, small grain size and low market price.
For women, long duration is a more severe constraint than low recovery/shelling percentage
and poor colour and susceptibility to storage pest were more important than poor fodder quality.
However, the responses of women were more heterogeneous across varieties, districts and
regions when compared to those of men.
14
CONCLUSION
Across the selected districts and area (adopted and control), the major crops grown during
kharif season were redgram, maize, greengram, sorghum, onion and sunflower. During rabi, since
all the respondents were chickpea growers by choice, the area under chickpea was the highest
followed by wheat and rabi sorghum. The cropping pattern followed in the adopted and control
areas within each district were almost similar.
It was observed that higher income followed by its ability to restore soil fertility, food/home
consumption, fits well into the present cropping system were the prime reasons both in adopted and
control areas in Dharwad district. However, in Gulbarga district, apart from higher income and its
ability to restore soil fertility, the low cost of cultivation was also considered as another important
reason for growing chickpea crop. The prospectus of “higher income” as an important attribute to
the chickpea cultivation was reflected in the allocation of large area in the cropping pattern both in
adopted and control areas across districts.
In general, across districts and areas a majority of the respondents were cultivating chickpea
every year, while only 15 per cent of them were planting chickpea once in two years.
Chickpea was cultivated in rabi season and no crop followed chickpea during the same
agricultural year. However, several crops were grown during kharif season by the farmers preceding
chickpea, the most important one was greengram, followed by maize, sorghum, pigeonpea, onion
and cotton both in Dharwad and Gulbarga districts. However, their order differed between districts.
In Dharwad district, maize-chickpea cropping sequence was the most popular one. In the North-
Eastern part of Gulbarga district, green gram-chickpea and short duration pigeon pea followed by
chickpea are the popular cropping sequences followed.
The majority of the (62 %) farmers across districts and areas felt that the area under
chickpea remained constant while, 30 per cent opined that its area is increasing and the remaining 8
per cent of them feeling a decline. This depicts increasing farmers interests in the crop.
15
Majority of the farmers cultivated chickpea as a sole crop while, hardly 1.11% of them grew
chickpea as inter crop with either sorghum or safflower. High return from chickpea is the main
reason for growing it as sole crop against the traditional practice of growing as intercrop with
sorghum or safflower.
Across districts and areas, the maximum/frontier area under chickpea per household ranged
between 5-6 acres indicating that a farmer newly opting for chickpea cultivation would remain in that
range. Thereby, also reveals the saturation level of chickpea production technology uptake.
The average of the best yields harvested by the sample respondents was 624 kg/ac in
rainfed situation as against 788 kg/ac in irrigated condition across districts and areas. The yields in
good years were 525 kg/ac and 630 kg/ac in rainfed and irrigated conditions, respectively, whereas
in bad years, the corresponding yield levels were 219 kg/ac and 265 kg/ac. The good-year yields
were 40 per cent and 37 per cent more over the bad-year yields under rainfed and irrigated
situations, respectively whereas, the best-year yield increments were correspondingly 185 per cent
and 137 per cent.
Among the four chickpea varieties grown in the last three years (2004-05 to 2006-07)
namely, Annigeri, Kabuli, Bhima and local, Annigeri was grown predominantly and covered a
highest area of nearly 4 acres per household in the study area followed by Kabuli, Bhima and local,
in general, with the exception of absence of Bhima in Gulbarga district. Interestingly the area under
chickpea seemed to increase irrespective of the variety in the study area.
Among the insect pests in chickpea crop, pod borer was the serious pest that affected the
crop most in both the districts. Amongst diseases, wilt was the serious problem as expressed by
more than half of the chickpea growing farmers. The problem was more severe in Dharwad district
than in Gulbarga district.
In terms of percentage of pest and disease impact in the last five years, nearly 84 per cent of
the farmers were affected by pod borer alone on an area of 47 per cent resulting in substantial yield
reduction to the extent of 42 per cent. Both pod borer and wilt together were of serious concern for
nearly 81 per cent of the respondents affecting 28 per cent area and a yield loss of about 14 per
cent. While, wilt was the problem with only 3 per cent of the respondents affecting 47 per cent area

16
that resulted in yield reduction by 35 per cent. Thus, in terms of area affected, both pod borer and
wilt were of equally serious concern. Occurrence of wilt along was not found in Gulbarga district; it
was either pod borer or pod borer+wilt. Similar was the situation in control area of Dharwad district.
In general across districts and regions, majority of the farmers (80 %) felt that the pest and
disease problems were increasing over time, whereas the remaining felt the other way.
Generally, across districts and regions, “weather related reasons” topped the list, followed by
“growing every year without rotation”, “growing susceptible varieties”, “not adopting IPM/IDM
technologies and “growing other alternative host crops”.
The measures adopted by farmers to control pests and diseases across the districts and
regions exactly had the same prioritisation. They indicated that most of the farmers relied only on
application of chemical pesticides. The other measures adopted by farmers, in order of priority, were
adopting IPM/IDM technologies, altering sowing time and hand picking of insects and roughing of
disease infected plants.
In general, across all these aspects, districts and regions, input suppliers were the most
important source of information on pest and disease control to the farmers, followed by fellow
farmers, friends and relatives, research institute, radio, NGOs, agricultural magazines, news papers,
television and others, in that order.
The opinions of farmers on the constraints faced w.r.t. chickpea cultivars in terms of
production, marketing and consumption indicated that in general, across all cultivars, regions and
districts, low yield was the major constraint confronted by the farmers in chickpea production. The
major constraints in descending order of priority were high pest incidence, small grain size, low
market price, low recovery/shelling percentage, high disease incidence and long crop duration.
Variety-wise constraints across both regions in Dharwad district showed that cultivators of
Annigeri variety faced the constraints of low yield, high pest incidence, low recovery/shelling
percentage and high disease incidence. However, in Gulbarga, though low yield and high pest
incidence topped the list in both the regions, the other constraints of severity were small grain size
and low market price.
17
In the case of Kabuli variety, while low yield, high pest incidence, high disease incidence and
long duration were the major constraints in Dharwad-adopted area, Dharwad-control area was
confronted with high pest incidence, high disease incidence, poor taste and low yield in that order.
In Gulbarga, on the other hand, adopted area was confronted with the constraints of low yield, small
grain size and high disease incidence whereas low yield, long duration, small grain size and poor
taste were the major constraints faced by their counterparts in control area.
For Bhima, which was cultivated only in Dharwad-adopted area, the serious bottlenecks
were high disease incidence, low recovery/shelling percentage, small grain size, low yield, high pest
incidence and low market price.
When comparison was made on the constraints in chickpea cultivars expressed by women
with those of men in the selected households, it could be observed that top four constraints namely,
low yield, high pest incidence, small grain size and low market price remain the same between men
and women across districts and regions. While, for women long duration is a more severe constraint
than low recovery/shelling percentage and poor colour and susceptibility to storage pest were more
important than poor fodder quality.
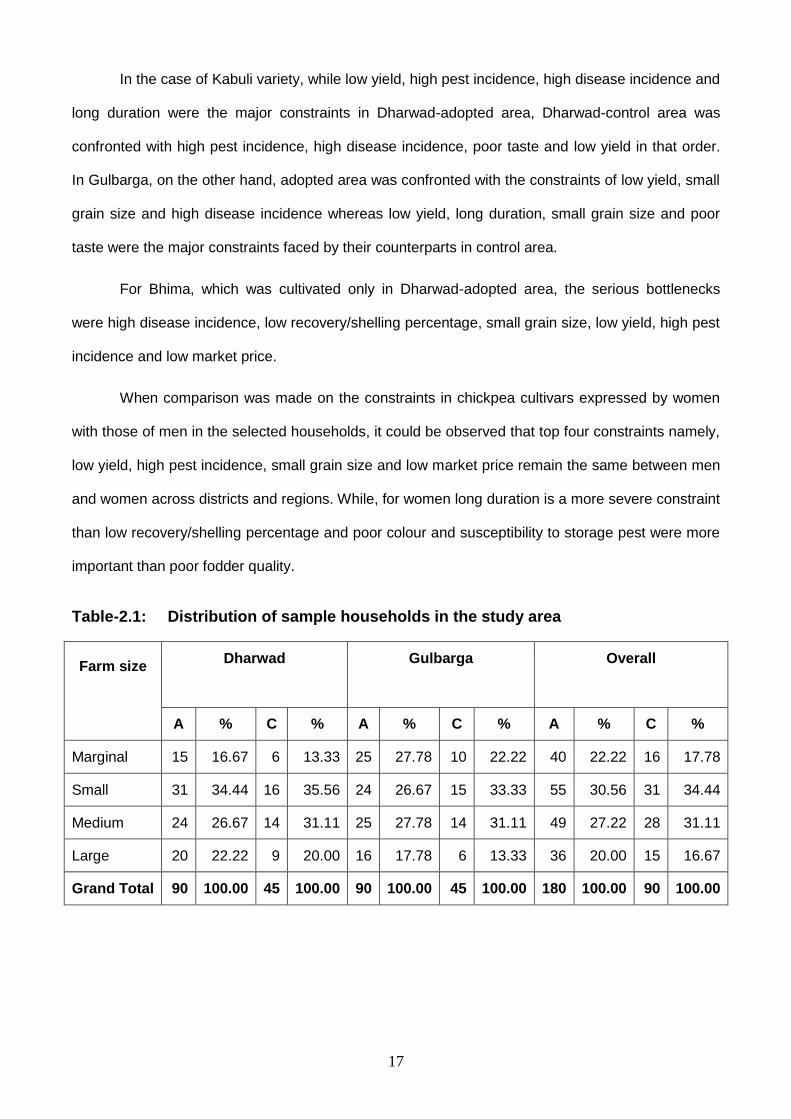
Table-2.1: Distribution of sample households in the study area
Farm size Dharwad Gulbarga Overall
A % C % A % C % A % C %
Marginal 15 16.67 6 13.33 25 27.78 10 22.22 40 22.22 16 17.78
Small 31 34.44 16 35.56 24 26.67 15 33.33 55 30.56 31 34.44
Medium 24 26.67 14 31.11 25 27.78 14 31.11 49 27.22 28 31.11
Large 20 22.22 9 20.00 16 17.78 6 13.33 36 20.00 15 16.67
Grand Total 90 100.00 45 100.00 90 100.00 45 100.00 180 100.00 90 100.00

18
19
Table-38: Cropping pattern, productivity and returns from crops in Dharwad district
Season Crop Sole/ inter crop
Dharwad
Adopted Control Both
Cropped area
(acres)
% cropped
area
Main product (Kg/ac)
By-product (q/ac)
Gross Return (Rs./ac)
Cropped area
(acres)
% cropped
area
Main product (Kg/ac)
By-product (q/ac)
Gross Return (Rs./ac)
Cropped area
(acres)
% cropped
area
Main product (Kg/ac)
By-product (q/ac)
Gross Return (Rs./ac)
Kharif Chilli Sole 1.00 0.09 20000.00 0.00 120000.00 0.00 1.00 0.06 20000.00 0.00 120000.00
Greengram Sole 179.34 15.60 255.02 0.01 5066.13 45.45 7.60 255.67 0.00 5225.08 224.79 12.86 255.15 0.01 5098.27
Sorghum Sole 66.00 5.74 372.73 11.03 9535.30 30.00 5.02 397.00 8.67 43267.67 96.00 5.49 380.31 10.29 20076.67
Maize Sole 180.84 15.73 1793.30 8.41 43881.97 150.83 25.22 1968.44 7.23 80249.55 331.67 18.98 1872.95 7.87 60420.46
Onion Sole 119.04 10.36 3853.33 0.00 18017.89 55.22 9.23 1361.83 0.00 9884.10 174.26 9.97 3063.81 0.00 15440.43
Sunflower Sole 27.50 2.39 258.18 0.00 7498.18 9.18 1.53 468.41 0.00 9204.79 36.68 2.10 310.80 0.00 7925.30
Blackgram Sole 7.00 0.61 2285.71 0.00 13285.71 0.00 7.00 0.40 2285.71 0.00 13285.71
Groundnut Sole 3.00 0.26 0.00 3.00 0.17
Cotton Sole 25.00 2.17 428.00 0.00 9836.00 11.00 1.84 400.00 0.00 8800.00 36.00 2.06 419.44 0.00 9519.44
Total 608.72 52.95 50.44 52.09
Rabi Chickpea+ Sorghum
Inter 0.00 0.00 8.10 1.35 222.22 1.23 4123.46 8.10 0.46 222.22 1.23 4123.46
Greengram Sole 4.00 0.35 250.00 0.00 5250.00 0.00 4.00 0.23 250.00 0.00 5250.00
Rabi sorghum
Sole 33.40 2.91 380.24 18.50 8491.02 14.00 2.34 528.57 1.79 6200.00 47.40 2.71 424.05 13.57 7814.35
Safflower Sole 5.20 0.45 384.62 0.00 5269.23 0.00 5.20 0.30 384.62 0.00 5269.23
Wheat Sole 109.68 9.54 410.36 0.26 4415.75 52.46 8.77 429.18 0.04 4516.01 162.08 9.27 416.60 0.19 4449.84
Chickpea Sole 388.56 33.80 371.99 0.40 7886.57 221.91 37.10 421.89 0.08 8561.51 610.47 34.93 390.13 0.28 8131.91
Total 540.84 47.05 296.47 49.56 837.25 47.91
GCA (ac) 1149.56 100.00 598.15 100.00 1747.65 100.00
NSA (ac) 790.91 341.32 1132.23
CI (%) 145.35 175.25 154.35
20
Table-38 (Contd…): Cropping pattern, productivity and returns from crops in Gulbarga district
Season Crop Sole/ inter crop
Gulbarga
Adopted Control Both
Cropped area
(acres)
% cropped
area
Main product (Kg/ac)
By-product (q/ac)
Gross Return (Rs/ac)
Cropped area
(acres)
% cropped
area
Main product (Kg/ac)
By-product (q/ac)
Gross Return (Rs/ac)
Cropped area
(acres)
% cropped
area
Main product (Kg/ac)
By-product (q/ac)
Gross Return (Rs/ac)
Kharif Greengram Sole 64.10 7.28 294.85 0.00 6079.56 23.00 6.48 434.78 0.00 7652.17 87.10 7.05 331.80 0.00 6494.83
Sorghum Sole 58.20 6.61 536.94 19.81 13325.69 27.05 7.62 388.17 0.11 3547.87 85.25 6.90 489.74 13.56 10223.17
Sorghum+Redgram Inter 4.00 0.45 450.00 0.00 4050.00 0.00 4.00 0.32 450.00 0.00 4050.00
Maize Sole 0.00 0.00 0.00
Onion Sole 2.00 0.23 5000.00 0.00 30000.00 0.00 2.00 0.16 5000.00 0.00 30000.00
Redgram+Sesamum Inter 1.20 0.14 416.67 0.00 8750.00 0.00 1.20 0.10 416.67 0.00 8750.00
Sesamum Sole 8.00 0.91 518.75 0.00 14150.00 11.00 3.10 145.45 0.00 3340.91 19.00 1.54 302.63 0.00 7892.11
Sugercane Sole 0.00 2.00 0.56 40000.00 0.00 280000.00 2.00 0.16 40000.00 0.00 280000.00
Sunflower Sole 40.25 4.57 496.89 0.00 9853.42 0.00 40.25 3.26 496.89 0.00 9853.42
Sunflower+Redgram Inter 0.00 3.00 0.85 500.00 0.00 7500.00 3.00 0.24 500.00 0.00 7500.00
Turmeric Sole 1.00 0.11 1000.00 0.00 32000.00 0.00 1.00 0.08 1000.00 0.00 32000.00
Blackgram Sole 14.00 1.59 485.71 0.00 12542.86 19.00 5.36 373.68 0.00 8371.05 33.00 2.67 421.21 0.00 10140.91
Redgram Sole 293.43 33.33 406.15 0.02 8193.48 112.62 31.75 488.81 0.00 10114.54 406.05 32.87 429.08 0.01 8726.30
Bajra Sole 4.18 0.47 478.47 0.00 2858.85 12.50 3.52 592.00 0.00 2960.00 16.68 1.35 563.55 0.00 2934.65
Groundnut Sole 11.00 1.25 609.09 0.00 13954.55 0.00 11.00 0.89 609.09 0.00 13954.55
Redgram+Bajra Inter 3.10 0.35 258.06 0.00 4887.10 2.00 0.56 5.10 0.41 274.51 0.00 5558.82
Cotton Sole 0.00 0.00 0.00
Total 504.46 57.29 212.17 59.81 716.63 58.01
Rabi Bajra+Redgram Inter 2.00 0.23 400.00 0.00 2000.00 0.00 2.00 0.16 400.00 0.00 2000.00
Carrot Sole 0.50 0.06 4000.00 0.00 64000.00 0.00 0.50 0.04 4000.00 0.00 64000.00
Chickpea+Saflower Inter 10.25 1.16 292.68 1.56 5978.54 0.00 10.25 0.83 292.68 1.56 5978.54
Greengram Sole 0.00 2.00 0.56 400.00 0.00 9600.00 2.00 0.16 400.00 0.00 9600.00
Rabi sorghum Sole 10.00 1.14 460.00 0.00 4660.00 5.00 1.41 520.00 0.00 100500.00 15.00 1.21 480.00 0.00 36606.67
Onion Sole 1.00 0.11 2000.00 0.00 10000.00 0.00 1.00 0.08 2000.00 0.00 10000.00
Saflower Sole 6.00 0.68 383.33 0.00 5075.00 1.00 0.28 500.00 0.00 8500.00 7.00 0.57 400.00 0.00 5564.29
Saflower+wheat Inter 2.00 0.23 250.00 0.00 2375.00 0.00 2.00 0.16 250.00 0.00 2375.00
Sunflower Sole 3.12 0.35 833.33 0.00 13557.69 0.00 3.12 0.25 833.33 0.00 13557.69
Wheat Sole 2.00 0.23 800.00 0.00 9000.00 1.00 0.28 1000.00 0.00 12000.00 3.00 0.24 866.67 0.00 10000.00
Chickpea Sole 339.18 38.52 459.83 0.01 10209.98 133.59 37.66 518.00 0.00 10904.26 472.77 38.27 476.27 0.01 10406.16
Total 376.05 42.71 142.59 40.19 518.64 41.99
GCA (ac) 880.51 100.00 354.76 100.00 1235.27 100.00
NSA (ac) 600.08 255.31 855.39
CI (%) 146.73 138.95 144.41
21
Table-38 (Contd…): Cropping pattern, productivity and returns from crops in Dharwad and Gulbarga districts
Season Crop Sole/ Inter crop
Overall
Adopted Control Both
Cropped area
(acres)
% cropped
area
Main product (Kg/ac)
By-product (q/ac)
Gross Return (Rs./ac)
Cropped area
(acres)
% cropped
area
Main product (Kg/ac)
By-product (q/ac)
Gross Return (Rs./ac)
Cropped area
(acres)
% cropped
area
Main product (Kg/ac)
By-product (q/ac)
Gross Return (Rs./ac)
Kharif Chilli Sole 1.00 0.05 20000.00 0.00 120000.00 0.00 0.00 1.00 0.03 20000.00 0.00 120000.00
Greengram Sole 243.44 11.99 265.51 0.01 5332.98 68.45 7.18 315.85 0.00 6040.61 311.89 10.46 276.56 0.01 5488.28
Sorghum Sole 124.20 6.12 449.68 15.14 11311.47 57.05 5.99 392.81 4.61 24434.71 181.25 6.08 431.78 11.83 15442.12
Sorghum+ Redgram Inter 4.00 0.20 450.00 0.00 4050.00 0.00 0.00 4.00 0.13 450.00 0.00 4050.00
Maize Sole 180.84 8.91 1793.30 8.41 43881.97 150.83 15.83 1968.44 7.23 80249.55 331.67 11.12 1872.95 7.87 60420.46
Onion Sole 121.04 5.96 3872.27 0.00 18215.88 55.22 5.79 1361.83 0.00 9884.10 176.26 5.91 3085.78 0.00 15605.64
Redgram+Sesamum Inter 1.20 0.06 416.67 0.00 8750.00 0.00 0.00 1.20 0.04 416.67 0.00 8750.00
Sesamum Sole 8.00 0.39 518.75 0.00 14150.00 11.00 1.15 145.45 0.00 3340.91 19.00 0.64 302.63 0.00 7892.11
Sugercane Sole 0.00 0.00 2.00 0.21 40000.00 0.00 280000.00 2.00 0.07 40000.00 0.00 280000.00
Sunflower Sole 67.75 3.34 400.00 0.00 8897.42 9.18 0.96 468.41 0.00 9204.79 76.93 2.58 408.16 0.00 8934.10
Sunflower+Redgram Inter 0.00 0.00 3.00 0.31 500.00 0.00 7500.00 3.00 0.10 500.00 0.00 7500.00
Turmeric Sole 1.00 0.05 1000.00 0.00 32000.00 0.00 0.00 1.00 0.03 1000.00 0.00 32000.00
Blackgram Sole 21.00 1.03 1085.71 0.00 12790.48 19.00 1.99 373.68 0.00 8371.05 40.00 1.34 747.50 0.00 10691.25
Redgram Sole 293.43 14.45 406.15 0.02 8193.48 112.62 11.82 488.81 0.00 10114.54 406.05 13.61 429.08 0.01 8726.30
Bajra Sole 4.18 0.21 478.47 0.00 2858.85 12.50 1.31 592.00 0.00 2960.00 16.68 0.56 563.55 0.00 2934.65
Groundnut Sole 14.00 0.69 607.14 0.00 13278.57 0.00 0.00 14.00 0.47 607.14 0.00 13278.57
Redgram+Bajra Inter 3.10 0.15 258.06 0.00 4887.10 2.00 0.21 300.00 0.00 6600.00 5.10 0.17 274.51 0.00 5558.82
Cotton Sole 25.00 1.23 428.00 0.00 9836.00 11.00 1.15 400.00 0.00 8800.00 36.00 1.21 419.44 0.00 9519.44
Total 1113.18 54.83 513.85 53.92 1627.03 54.54
Rabi Bajra+Redgram Inter 2.00 0.10 400.00 0.00 2000.00 0.00 0.00 2.00 0.07 400.00 0.00 2000.00
Carrot Sole 0.50 0.02 4000.00 0.00 64000.00 0.00 0.00 0.50 0.02 4000.00 0.00 64000.00
Chickpea+Sorghum Inter 0.00 0.00 8.10 0.85 222.22 1.23 4123.46 8.10 0.27 222.22 1.23 4123.46
Chickpea+Saflower Inter 10.25 0.50 292.68 1.56 5978.54 0.00 0.00 10.25 0.34 292.68 1.56 5978.54
Greengram Sole 4.00 0.20 250.00 0.00 5250.00 2.00 0.21 400.00 0.00 9600.00 6.00 0.20 300.00 0.00 6700.00
Rabi sorghum Sole 43.40 2.14 398.62 14.24 7608.29 19.00 1.99 526.32 1.32 31015.79 62.40 2.09 437.50 10.30 14735.58
Onion Sole 1.00 0.05 2000.00 0.00 10000.00 0.00 0.00 1.00 0.03 2000.00 0.00 10000.00
Saflower Sole 11.20 0.55 383.93 0.00 5165.18 1.00 0.10 500.00 0.00 8500.00 12.20 0.41 393.44 0.00 5438.52
Saflower+wheat Inter 2.00 0.10 250.00 0.00 2375.00 0.00 0.00 2.00 0.07 250.00 0.00 2375.00
Sunflower Sole 3.12 0.15 833.33 0.00 13557.69 0.00 0.00 3.12 0.10 833.33 0.00 13557.69
Wheat Sole 111.68 5.50 417.34 0.25 4497.85 53.46 5.61 439.86 0.04 4656.00 165.14 5.54 424.63 0.18 4549.05
Chickpea Sole 727.74 35.85 412.93 0.22 8969.45 355.50 37.31 458.01 0.05 9441.87 1083.24 36.31 427.72 0.16 9124.49
Total 916.89 45.17 439.06 46.08 1355.95 45.46
GCA (ac) 2030.07 100.00 952.91 100.00 2982.98 100.00
NSA (ac) 1390.99 596.63 1987.62
CI (%) 145.94 159.72 150.07
22
Table-40: Reasons for growing chickpea crop
(% of households)
Reasons Dharwad Gulbarga Overall
A C B A C B A C B
Higher Income 98.89 97.78 98.52 94.44 100.00 96.30 96.67 98.89 97.41
Restore soil fertility 66.67 66.67 66.67 76.67 62.22 71.85 71.67 64.44 69.26
Food/home consumption 60.00 53.33 57.78 42.22 46.67 43.70 51.11 50.00 50.74
Fitted well into the present cropping system
53.33 42.22 49.63 30.00 17.78 25.93 41.67 30.00 37.78
Fits well into a rotation 35.56 28.89 33.33 31.11 17.78 26.67 33.33 23.33 30.00
Fodder/animal consumption 41.11 40.00 40.74 22.22 8.89 17.78 31.67 24.44 29.26
Best suited to my land 37.78 26.67 34.07 18.89 20.00 19.26 28.33 23.33 26.67
Less cost of cultivation 12.22 6.67 10.37 23.33 15.56 20.74 17.78 11.11 15.56
Less labour requirement 1.11 0.00 0.74 0.00 0.00 0.00 0.56 0.00 0.37
Others 3.33 2.22 2.96 10.00 15.56 11.85 6.67 8.89 7.41
(Garrett Scores)
Reasons Dharwad Gulbarga Overall
A C B A C B A C B
GS R GS R GS R GS R GS R GS R GS R GS R GS R
Higher Income 66.86 1 64.73 1 66.15 1 60.77 1 61.24 1 60.93 1 63.81 1 62.99 1 63.54 1
Restore soil fertility 30.60 2 31.96 2 31.05 2 36.38 2 26.82 2 33.19 2 33.49 2 29.39 2 32.12 2
Food/home consumption 28.70 3 22.69 3 26.70 3 18.02 3 16.22 4 17.42 4 23.36 3 19.46 3 22.06 3
Fitted well into the present cropping system
24.13 4 18.47 4 22.24 4 12.42 6 7.91 5 10.92 6 18.28 4 13.19 4 16.58 4
Fits well into a rotation 18.50 5 14.82 6 17.27 5 13.60 5 7.62 6 11.61 5 16.05 5 11.22 6 14.44 5
Fodder/animal consumption 16.01 7 15.04 5 15.69 6 10.82 7 4.36 8 8.67 7 13.42 6 9.70 7 12.18 6
Low cost of cultivation 5.34 8 1.31 8 4.00 8 16.68 4 21.16 3 18.17 3 11.01 8 11.23 5 11.09 7
Best suited to my land 16.53 6 11.58 7 14.88 7 7.19 8 7.36 7 7.24 8 11.86 7 9.47 8 11.06 8
Note: A=Adopted; C=Control; B=Both; GS=Garrett Score; R=Rank.
23
Table-41: Crop rotation on the same piece of land (Frequency of growing chickpea)
Crop rotation No./ %*
Dharwad Gulbarga Overall
A C B A C B A C B
Every season No. 0 0 0 1 0 1 1 0 1
% 0.00 0.00 0.00 1.11 0.00 0.74 0.56 0.00 0.37
Every year No. 88 44 132 62 30 92 150 74 224
% 97.78 97.78 97.78 68.89 66.67 68.15 83.33 82.22 82.96
Once in two years No. 2 1 3 24 14 38 26 15 41
% 2.22 2.22 2.22 26.67 31.11 28.15 14.44 16.67 15.19
Once in three years No. 0 0 0 2 1 3 2 1 3
% 0.00 0.00 0.00 2.22 2.22 2.22 1.11 1.11 1.11
Once in four years No. 0 0 0 1 1 1 0 1
% 0.00 0.00 0.00 1.11 0.00 0.74 0.56 0.00 0.37
Total No. 90 45 135 90 45 135 180 90 270
% 100.00 100.00 100.00 100.00 100.00 100.00 100.00 100.00 100.00
* Number of households / Per cent of households.
Table-42: Crops planted before chickpea in the same field
Season/ Crop grown before
No./ %*
Dharwad Gulbarga Overall A C B A C B A C B
Kharif
Green gram No. 35 13 48 28 15 43 63 28 91 % 38.89 28.89 35.56 31.11 33.33 31.85 35.00 31.11 33.70 Maize No. 31 25 56 0 0 0 31 25 56 % 34.44 55.56 41.48 0.00 0.00 0.00 17.22 27.78 20.74 Sorghum No. 14 10 24 11 2 13 25 12 37 % 15.56 22.22 17.78 12.22 4.44 9.63 13.89 13.33 13.70 Pigeon pea No. 0 0 0 23 13 36 23 13 36 % 0.00 0.00 0.00 25.56 28.89 26.67 12.78 14.44 13.33 Onion No. 20 8 28 0 0 0 20 8 28 % 22.22 17.78 20.74 0.00 0.00 0.00 11.11 8.89 10.37 Cotton No. 11 6 17 0 0 0 11 6 17 % 12.22 13.33 12.59 0.00 0.00 0.00 6.11 6.67 6.30 Bajra No. 0 0 0 4 5 9 4 5 9 % 0.00 0.00 0.00 4.44 11.11 6.67 2.22 5.56 3.33 Sunflower No. 0 1 1 6 0 6 6 1 7 % 0.00 2.22 0.74 6.67 0.00 4.44 3.33 1.11 2.59 Black gram No. 0 0 0 3 4 7 3 4 7 % 0.00 0.00 0.00 3.33 8.89 5.19 1.67 4.44 2.59 Sesamum No. 0 0 0 2 2 4 2 2 4 % 0.00 0.00 0.00 2.22 4.44 2.96 1.11 2.22 1.48 Groundnut No. 0 0 0 3 0 3 3 0 3 % 0.00 0.00 0.00 3.33 0.00 2.22 1.67 0.00 1.11 Rabi Wheat No. 3 0 3 0 0 0 3 0 3 % 3.33 0.00 2.22 0.00 0.00 0.00 1.67 0.00 1.11 * Number of households / Per cent of households.
24
Table-43: Change in area of the selected crop in the last 5 years
Change in area
No./ %*
Dharwad Gulbarga Overall A C B A C B A C B
Constant No. 52 26 78 60 30 90 112 56 168 % 57.78 57.78 57.78 66.67 66.67 66.67 62.22 62.22 62.22
Increasing No. 29 16 45 24 11 35 53 27 80 % 32.22 35.56 33.33 26.67 24.44 25.93 29.44 30.00 29.63
Decreasing No. 9 3 12 6 4 10 15 7 22 % 10.00 6.67 8.89 6.67 8.89 7.41 8.33 7.78 8.15
Grand Total No. 90 45 135 90 45 135 180 90 270 % 100.00 100.00 100.00 100.00 100.00 100.00 100.00 100.00 100.00 * Number of households / Per cent of households.
25
Table-45: Pattern of chickpea cultivation as sole/inter/mixed crop
Type of cropping
No./ %*
Dharwad Gulbarga Overall A C B A C B A C B
Inter crop No. 1 1 2 2 2 1 3 % 0.00 2.22 0.74 2.22 0.00 1.48 1.11 1.11 1.11 Sole No. 90 44 134 88 45 133 178 89 267 % 100.00 97.78 99.26 97.78 100.00 98.52 98.89 98.89 98.89 Total No. 90 45 135 90 45 135 180 90 270 % 100.00 100.00 100.00 100.00 100.00 100.00 100.00 100.00 100.00
Table-46: Maximum area under chickpea cultivation
Year Particulars Dharwad Gulbarga Overall
A C B A C B A C B 2003-04 No. of households 3 3 2 2 4 5 2 7
% of households 3.33 0.00 2.22 2.22 4.44 2.96 2.78 2.22 2.59
Avg. area (ac) 6.67 0.00 6.67 3.50 6.25 4.88 5.40 6.25 5.64
2004-05 No. of households 7 4 11 10 6 16 17 10 27
% of households 7.78 8.89 8.15 11.11 13.33 11.85 9.44 11.11 10.00
Avg. area (ac) 3.03 11.80 6.22 4.22 4.17 4.20 3.73 7.22 5.02
2005-06 No. of households 25 16 41 22 11 33 47 27 74
% of households 27.78 35.56 30.37 24.44 24.44 24.44 26.11 30.00 27.41
Avg. area (ac) 5.10 6.20 5.53 6.17 3.68 5.34 5.60 5.17 5.45
2006-07 No. of households 21 9 30 8 4 12 29 13 42
% of households 23.33 20.00 22.22 8.89 8.89 8.89 16.11 14.44 15.56
Avg. area (ac) 6.40 4.39 5.80 3.97 4.01 3.98 5.73 4.28 5.28
Overall No. of households 56 29 85 42 23 65 98 52 150
% of households 62.22 64.44 62.96 46.67 51.11 48.15 54.44 57.78 55.56
Avg. area (ac) 5.41 6.41 5.75 5.16 4.09 4.78 5.30 5.38 5.33
Table-47: Average yield of chickpea crop harvested
(Kg/acre) Season Rainfed/
irrigated Good/ Bad/ Best yield
Dharwad Gulbarga Overall
A C B A C B A C B % Gain
Rabi Rainfed Best 625.37 639.13 628.89 607.78 650.00 620.77 616.58 644.57 624.09 185.15
Good 510.45 528.26 515.00 522.78 552.50 531.92 516.61 540.38 525.00 139.88
Bad 192.39 174.35 187.78 234.44 253.75 240.38 213.42 214.05 218.86 100.00
Irrigated Best 795.65 769.05 782.95 0.00 866.67 866.67 795.65 817.86 788.30 196.99
Good 608.70 633.33 620.45 0.00 766.67 766.67 608.70 700.00 629.79 137.27
Bad 263.04 264.29 263.64 0.00 291.67 291.67 263.04 277.98 265.43 100.00

26
Table-48: Cultivation of different chickpea varieties during last three years
Year Crop Varieties
Dharwad Gulbarga Overall
A C B A C B A C B
Number of households cultivating chickpea
2006-07 Annigeri 80 42 122 88 43 131 168 85 253
Bhima 4 4 4 0 4
Kabuli 6 2 8 1 1 2 7 3 10
Local 3 1 4 1 1 2 4 2 6
2005-06 Annigeri 78 42 120 62 28 90 140 70 210
Bhima 4 4 4 0 4
Kabuli 6 2 8 1 1 2 7 3 10
Local 3 1 4 1 1 2 4 2 6
2004-05 Annigeri 79 42 121 86 42 128 165 84 249
Bhima 3 3 3 0 3
Kabuli 6 2 8 1 1 2 7 3 10
Local 3 1 4 1 1 2 4 2 6
Percent of households cultivating chickpea
2006-07 Annigeri 88.89 93.33 90.37 97.78 95.56 97.04 93.33 94.44 93.70
Bhima 4.44 0.00 2.96 0.00 0.00 0.00 2.22 0.00 1.48
Kabuli 6.67 4.44 5.93 1.11 2.22 1.48 3.89 3.33 3.70
Local 3.33 2.22 2.96 1.11 2.22 1.48 2.22 2.22 2.22
2005-06 Annigeri 86.67 93.33 88.89 68.89 62.22 66.67 77.78 77.78 77.78
Bhima 4.44 0.00 2.96 0.00 0.00 0.00 2.22 0.00 1.48
Kabuli 6.67 4.44 5.93 1.11 2.22 1.48 3.89 3.33 3.70
Local 3.33 2.22 2.96 1.11 2.22 1.48 2.22 2.22 2.22
2004-05 Annigeri 87.78 93.33 89.63 95.56 93.33 94.81 91.67 93.33 92.22
Bhima 3.33 0.00 2.22 0.00 0.00 0.00 1.67 0.00 1.11
Kabuli 6.67 4.44 5.93 1.11 2.22 1.48 3.89 3.33 3.70
Local 3.33 2.22 2.96 1.11 2.22 1.48 2.22 2.22 2.22
Area cultivated with chickpea
2006-07 Annigeri 3.78 4.92 4.16 3.92 2.92 3.59 3.85 3.92 3.87
Bhima 0.14 0.00 0.09 0.00 0.00 0.00 0.07 0.00 0.05
Kabuli 0.33 0.16 0.27 0.01 0.02 0.01 0.17 0.09 0.14
Local 0.08 0.09 0.08 0.02 0.07 0.04 0.05 0.08 0.06
Total 4.33 5.17 4.61 3.96 3.01 3.64 4.14 4.09 4.12
2005-06 Annigeri 3.28 4.12 3.56 2.43 1.77 2.21 2.85 2.95 2.88
Bhima 0.09 0.00 0.06 0.00 0.00 0.00 0.05 0.00 0.03
Kabuli 0.22 0.11 0.19 0.01 0.02 0.01 0.12 0.07 0.10
Local 0.06 0.09 0.07 0.01 0.04 0.02 0.04 0.07 0.05
Total 3.65 4.33 3.88 2.45 1.83 2.25 3.05 3.08 3.06
2004-05 Annigeri 3.20 4.11 3.50 3.36 2.80 3.17 3.28 3.45 3.34
Bhima 0.06 0.00 0.04 0.00 0.00 0.00 0.03 0.00 0.02
Kabuli 0.16 0.11 0.14 0.01 0.02 0.01 0.08 0.07 0.08
Local 0.05 0.09 0.07 0.01 0.02 0.01 0.03 0.06 0.04
Total 3.47 4.31 3.75 3.38 2.84 3.20 3.43 3.58 3.48 * Number of households / Per cent of households.
27
Table-49: First and peak year and area of adoption
(Mean of years and area in ac/household)
Cultivars FYA/ PYA*
Parti- culars
Dharwad Gulbarga Overall
A C B A C B A C B
Annigeri FYA Year 2000.90 2001.57 2001.13 2000.28 2000.30 2000.29 2000.59 2000.94 2000.71
Area 2.75 3.51 3.01 2.83 2.20 2.62 2.79 2.85 2.82
PYA Year 2005.77 2005.97 2005.83 2005.38 2005.07 2005.27 2005.58 2005.52 2005.55
Area 5.51 6.76 5.91 5.65 4.51 5.25 5.58 5.64 5.58
Bhima FYA Year 2002.60 2002.60 1001.30 0.00 1001.30
Area 2.64 2.64 1.32 0.00 1.32
PYA Year 2006.40 2006.40 1003.20 0.00 1003.20
Area 4.20 4.20 2.10 0.00 2.10
Kabuli FYA Year 2003.00 2003.00 2003.00 2001.00 2002.00 2001.50 2002.00 2002.50 2002.25
Area 2.83 1.50 2.50 1.00 1.00 1.00 1.92 1.25 1.75
PYA Year 2005.83 2006.00 2005.88 2005.00 2004.00 2004.50 2005.42 2005.00 2005.19
Area 5.33 3.50 4.88 2.00 3.00 2.50 3.67 3.25 3.69
Local FYA Year 1995.88 1995.25 1995.67 1996.33 2004.50 1999.60 1996.10 1999.88 1997.63
Area 2.65 3.18 2.82 1.67 2.50 2.00 2.16 2.84 2.41
PYA Year 2004.67 2001.25 2002.71 2006.00 2006.00 2006.00 2005.33 2003.63 2004.36
Area 4.67 4.38 4.50 2.00 3.00 2.50 3.33 3.69 3.50
Overall FYA Year 2000.71 2001.10 2000.84 2000.16 2000.52 2000.28 2000.44 2000.81 2000.56
Area 2.74 3.40 2.95 2.78 2.18 2.58 2.76 2.79 2.77
PYA Year 2005.77 2005.43 2005.66 2005.39 2005.06 2005.27 2005.58 2005.25 2005.47
Area 5.37 6.30 5.67 5.52 4.42 5.13 5.45 5.36 5.40
*FYA=First Year of Adoption; PYA=Peak Year of Adoption.
28
Table-54: Major pests and diseases affecting the crop
Problem Pest/disease Dharwad Gulbarga Overall
A C B A C B A C B
No. of households
Major pests Leaf miner 1 1 1 0 1
Moth 1 1 0 1 1
Pod Borer 90 45 135 90 45 135 180 90 270
Red worm 1 1 1 0 1
Major diseases Benki 1 1 1 0 1
Budi roga 1 1 1 0 1
Wilt 60 24 84 37 22 59 97 46 143
% of households
Major pests Leaf miner 1.11 0.74 0.56 0.37
Moth 2.22 0.74 1.11 0.37
Pod Borer 100.00 100.00 100.00 100.00 100.00 100.00 100.00 100.00 100.00
Red worm 1.11 0.74 0.56 0.37
Major diseases Benki 1.11 0.74 0.56 0.37
Budi roga 1.11 0.74 0.56 0.37
Wilt 66.67 53.33 62.22 41.11 48.89 43.70 53.89 51.11 52.96
Table-55: Impact of pests and diseases in the last five years
Pest/ disease
Affected area/loss
Dharwad Gulbarga Overall
A C B A C B A C B
Pod borer Affected households (%) 88.89 77.78 85.19 81.11 88.89 83.70 85.00 83.33 84.44
Area affected (%) 53.63 54.71 53.96 39.73 39.13 39.51 46.68 46.92 46.80
Yield loss (%) 50.78 48.57 50.10 35.21 32.95 34.42 42.99 40.76 42.37
Pod borer and wilt
Affected households (%) 100.00 100.00 100.00 58.89 51.11 56.30 79.44 75.56 81.48
Area affected (%) 28.21 31.42 29.39 25.57 24.57 25.26 26.89 27.99 27.96
Yield loss (%) 15.66 14.04 15.06 13.19 11.96 12.82 14.42 13.00 14.29
Wilt Affected households (%) 8.89 5.93 4.44 2.96
Area affected (%) 46.88 46.88 46.88 46.88
Yield loss (%) 35.00 35.00 35.00 35.00
Overall Area affected (%) 40.40 40.68 40.49 33.77 33.81 33.78 37.09 37.25 37.71
Yield loss (%) 32.22 27.77 30.75 25.94 25.16 25.69 29.08 26.47 28.66
Table-56: Are the pest and disease problems in chickpea increasing?
Response Dharwad Gulbarga Overall
A C B A C B A C B
No.of households
No 19 6 25 19 9 28 38 15 53
Yes 71 38 109 71 36 107 142 74 216
Total 90 45 135 90 45 135 180 90 270
% of households
No 21.11 13.33 18.52 21.11 20.00 20.74 21.11 16.67 19.63
Yes 78.89 84.44 80.74 78.89 80.00 79.26 78.89 82.22 80.00
Total 100.00 100.00 100.00 100.00 100.00 100.00 100.00 100.00 100.00
29
Table-57: Causes of increased incidence of pests and diseases
(% of households)
Cause Dharwad Gulbarga Overall
A C B A C B A C B
Weather related reasons 81.11 84.44 82.22 55.56 46.67 52.59 68.33 65.56 67.41
Growing every year without rotation 66.67 77.78 70.37 48.89 40.00 45.93 57.78 58.89 58.15
Growing susceptible varieties 44.44 33.33 40.74 36.67 46.67 40.00 40.56 40.00 40.37
Not adopting IPM/IDM technologies 35.56 31.11 34.07 31.11 31.11 31.11 33.33 31.11 32.59
Growing other alternative host crops 36.67 31.11 34.81 16.67 13.33 15.56 26.67 22.22 25.19
(Garrett Scores)
Causes Dharwad Gulbarga Overall
A C B A C B A C B
GS R GS R GS R GS R GS R GS R GS R GS R GS R Weather related reasons 48.09 1 50.64 1 48.94 1 31.18 1 24.42 2 28.93 1 39.63 1 37.53 1 38.93 1
Growing every year without rotation 32.10 2 35.82 2 33.34 2 22.07 2 16.80 3 20.31 3 27.08 2 26.31 2 26.83 2
Growing susceptible varieties 22.57 3 16.22 3 20.45 3 20.57 3 25.58 1 22.24 2 21.57 3 20.90 3 21.34 3
Not adopting IPM/IDM technologies 14.92 5 13.16 5 14.33 5 15.41 4 16.27 4 15.70 4 15.17 4 14.71 4 15.01 4
Growing other alternative host crops 15.40 4 14.07 4 14.96 4 6.27 5 6.58 5 6.37 5 10.83 5 10.32 5 10.66 5
Note: A=Adopted; C=Control; B=Both; GS=Garrett Score; R=Rank.
Table-58: Measures adopted by sample households to control pests and diseases
(% of households)
Measures Dharwad Gulbarga Overall
A C B A C B A C B
A) Pests
Rely only on chemical pesticides 75.56 73.33 74.81 70.00 82.22 74.07 72.78 77.78 74.44
Adopt IPM/IDM technologies 31.11 35.56 32.59 36.67 33.33 35.56 33.89 34.44 34.07
Alter sowing time 31.11 20.00 27.41 27.78 20.00 25.19 29.44 20.00 26.30
Hand picking (Traditional practice) 15.56 6.67 12.59 3.33 8.89 5.19 9.44 7.78 8.89
B) Diseases
Relying only on chemical pesticides 78.89 73.33 77.04 62.22 57.78 60.74 70.56 65.56 68.89
Adopting IPM/IDM technologies 28.89 40.00 32.59 32.22 33.33 32.59 30.56 36.67 32.59
Altering sowing time 34.44 28.89 32.59 16.67 6.67 13.33 25.56 17.78 22.96
Roughing 6.67 0.00 4.44 4.44 4.44 4.44 5.56 2.22 4.44
(Garrett Scores)
Measures Dharwad Gulbarga Overall
A C B A C B A C B
GS R GS R GS R GS R GS R GS R GS R GS R GS R
A) For controlling pests
Relying only on chemical pesticides 41.82 1 38.24 1 40.63 1 37.34 1 38.93 1 37.87 1 39.58 1 38.59 1 39.25 1
Adopting IPM/IDM technologies 16.96 2 19.24 2 17.72 2 19.28 2 19.16 2 19.24 2 18.12 2 19.20 2 18.48 2
Altering sowing time 11.57 3 6.44 3 9.86 3 11.48 3 9.80 3 10.92 3 11.52 3 8.12 3 10.39 3
Hand picking (Trad. Pra) 6.80 4 3.07 4 5.56 4 1.17 4 4.78 4 2.37 4 3.98 4 3.92 4 3.96 4
B) For controlling diseases
Relying only on chemical pesticides 43.73 1 40.00 1 42.49 1 32.26 1 27.36 1 30.62 1 37.99 1 33.68 1 36.56 1
Adopting IPM / IDM technologies 15.80 2 20.96 2 17.52 2 17.04 2 19.16 2 17.75 2 16.42 2 20.06 2 17.63 2
Altering sowing time 12.87 3 10.56 3 12.10 3 6.22 3 2.93 3 5.13 3 9.54 3 6.74 3 8.61 3
Roughing (Traditional control) 3.06 4 0.00 4 2.04 4 1.93 4 1.93 4 1.93 4 2.49 4 0.97 4 1.99 4
30
Table-59: Sources of information about pest and disease control measures
( % of households) Decision Source Dharwad Gulbarga Overall
A C B A C B A C B
When to apply Input suppliers 88.89 93.33 90.37 82.22 80.00 81.48 85.56 86.67 85.93
Households 58.89 51.11 56.30 54.44 60.00 56.30 56.67 55.56 56.30
Friends and relatives 31.11 33.33 31.85 4.44 8.89 5.93 17.78 21.11 18.89
Radio 11.11 6.67 9.63 17.78 13.33 16.30 14.44 10.00 12.96
Research institute 12.22 4.44 9.63 8.89 6.67 8.15 10.56 5.56 8.89
News papers 3.33 0.00 2.22 0.00 0.00 0.00 1.67 0.00 1.11
Agril. Magazines 3.33 0.00 2.22 0.00 0.00 0.00 1.67 0.00 1.11
NGO 3.33 0.00 2.22 2.22 0.00 1.48 2.78 0.00 1.85
Others 12.22 4.44 9.63 2.22 6.67 3.70 7.22 5.56 6.67
Type of pesticide Input suppliers 88.89 84.44 87.41 77.78 82.22 79.26 83.33 83.33 83.33
Households 47.78 33.33 42.96 44.44 62.22 50.37 46.11 47.78 46.67
Friends and relatives 24.44 15.56 21.48 8.89 8.89 8.89 16.67 12.22 15.19
Research institute 15.56 6.67 12.59 8.89 8.89 8.89 12.22 7.78 10.74
Radio 3.33 0.00 2.22 4.44 6.67 5.19 3.89 3.33 3.70
News papers 1.11 0.00 0.74 0.00 0.00 0.00 0.56 0.00 0.37
Agril. Magazines 4.44 0.00 2.96 0.00 0.00 0.00 2.22 0.00 1.48
NGO 3.33 0.00 2.22 2.22 0.00 1.48 2.78 0.00 1.85
Others 3.33 2.22 2.96 2.22 6.67 3.70 2.78 4.44 3.33
Quantity to use Input suppliers 96.67 86.67 93.33 77.78 80.00 78.52 87.22 83.33 85.93
Households 48.89 42.22 46.67 53.33 64.44 57.04 51.11 53.33 51.85
Friends and relatives 21.11 28.89 23.70 10.00 15.56 11.85 15.56 22.22 17.78
Research institute 12.22 11.11 11.85 12.22 8.89 11.11 12.22 10.00 11.48
Radio 0.00 8.89 2.96 0.00 6.67 2.22 0.00 7.78 2.59
Agril. Magazines 0.00 6.67 2.22 0.00 0.00 0.00 0.00 3.33 1.11
News papers 3.33 0.00 2.22 2.22 0.00 1.48 2.78 0.00 1.85
NGO 0.00 0.00 0.00 2.22 0.00 1.48 1.11 0.00 0.74
Others 3.33 2.22 2.96 2.22 6.67 3.70 2.78 4.44 3.33
Mixing chemical Input suppliers 84.44 84.44 84.44 74.44 77.78 75.56 79.44 81.11 80.00
Households 41.11 42.22 41.48 52.22 68.89 57.78 46.67 55.56 49.63
Friends and relatives 21.11 22.22 21.48 10.00 8.89 9.63 15.56 15.56 15.56
Research institute 7.78 2.22 5.93 6.67 11.11 8.15 7.22 6.67 7.04
Radio 0.00 0.00 0.00 2.22 6.67 3.70 1.11 3.33 1.85
News papers 0.00 0.00 0.00 0.00 0.00 0.00 0.00 0.00 0.00
Agril. Magazines 1.11 0.00 0.74 0.00 0.00 0.00 0.56 0.00 0.37
NGO 7.78 0.00 5.19 2.22 0.00 1.48 5.00 0.00 3.33
Others 5.56 2.22 4.44 2.22 6.67 3.70 3.89 4.44 4.07
Overall Input suppliers 89.72 87.22 88.89 78.06 80.00 78.70 83.89 83.61 83.80
Households 49.17 42.22 46.85 51.11 63.89 55.37 50.14 53.06 51.11
Friends and relatives 24.45 25.00 24.63 8.33 10.56 9.08 16.39 17.78 16.85
Research institute 11.95 6.11 10.00 9.17 8.89 9.08 10.56 7.50 9.54
Radio 3.61 3.89 3.70 6.11 8.33 6.85 4.86 6.11 5.28
Agril. Magazines 2.22 1.67 2.04 0.00 0.00 0.00 1.11 0.83 1.02
News papers 1.95 0.00 1.30 0.56 0.00 0.37 1.25 0.00 0.83
NGO 3.61 0.00 2.41 2.22 0.00 1.48 2.92 0.00 1.95
Others 6.11 2.78 5.00 2.22 6.67 3.70 4.17 4.72 4.35
31
(Garrett Scores) Decision Dharwad Gulbarga Overall
A C B A C B A C B
GS R GS R GS R GS R GS R GS R GS R GS R GS R
Mixing chemical
Input suppliers 42.59 1 45.29 1 43.49 1 40.51 1 41.67 1 40.90 1 41.55 1 43.48 1 42.19 1
Farmers 10.16 2 10.36 2 10.22 2 10.90 2 14.36 2 12.05 2 10.53 2 12.36 2 11.14 2
Friends and relatives 4.28 3 4.56 3 4.37 3 3.04 3 3.04 5 3.04 3 3.66 3 3.80 3 3.71 3
Research institute 2.64 4 1.11 4 2.13 4 1.46 4 3.64 4 2.19 4 2.05 4 2.38 5 2.16 4
Others 1.38 5 1.11 4 1.29 5 1.11 5 3.78 3 2.00 5 1.24 5 2.44 4 1.64 5
Radio 0.00 8 0.00 6 0.00 8 0.56 6 0.98 6 0.70 6 0.28 7 0.49 6 0.35 6
NGO 0.34 7 0.00 6 0.23 7 0.56 6 0.00 8 0.37 7 0.45 6 0.00 8 0.30 7
Agril. Magzines 0.56 6 0.00 6 0.37 6 0.00 8 0.00 8 0.00 9 0.28 7 0.00 8 0.19 8
Telivision 0.00 8 0.00 6 0.00 8 0.00 8 0.62 7 0.21 8 0.00 9 0.31 7 0.10 9
News papers 0.00 8 0.00 6 0.00 8 0.00 8 0.00 8 0.00 9 0.00 9 0.00 8 0.00 10
Quantity to use
Input suppliers 44.89 1 45.82 1 45.20 1 42.56 1 42.71 1 42.61 1 43.72 1 44.27 1 43.90 1
Farmers 11.64 2 10.53 2 11.27 2 12.56 2 15.04 2 13.39 2 12.10 2 12.79 2 12.33 2
Friends and relatives 5.29 3 7.09 3 5.89 3 2.36 3 3.73 4 2.81 3 3.82 3 5.41 3 4.35 3
Research institute 3.50 4 3.04 4 3.35 4 2.21 4 2.11 5 2.18 4 2.86 4 2.58 4 2.76 4
Others 0.97 5 1.11 5 1.01 5 1.11 5 3.78 3 2.00 5 1.04 5 2.44 5 1.51 5
News papers 0.34 6 0.00 8 0.23 7 0.56 6 0.00 7 0.37 6 0.45 6 0.00 8 0.30 6
Radio 0.00 8 0.62 7 0.21 9 0.00 8 0.69 6 0.23 8 0.00 9 0.66 6 0.22 7
NGO 0.00 8 0.00 8 0.00 10 0.56 6 0.00 7 0.37 6 0.28 7 0.00 8 0.19 8
Agril. Magzines 0.00 8 0.98 6 0.33 6 0.00 8 0.00 7 0.00 9 0.00 9 0.49 7 0.16 9
Telivision 0.34 6 0.00 8 0.23 7 0.00 8 0.00 7 0.00 9 0.17 8 0.00 8 0.11 10
Type of pesticide
Input suppliers 41.38 1 44.53 1 42.43 1 41.31 1 41.98 1 41.53 1 41.34 1 43.26 1 41.98 1
Farmers 10.81 2 8.42 2 10.01 2 11.54 2 15.36 2 12.81 2 11.18 2 11.89 2 11.41 2
Friends and relatives 7.12 3 4.18 3 6.14 3 3.04 3 3.04 4 3.04 3 5.08 3 3.61 3 4.59 3
Research institute 6.18 4 1.93 4 4.76 4 1.94 4 2.11 5 2.00 4 4.06 4 2.02 5 3.38 4
Others 0.97 5 1.11 5 1.01 5 1.11 5 3.78 3 2.00 4 1.04 5 2.44 4 1.51 5
Radio 0.34 8 0.00 6 0.23 8 0.31 7 0.69 6 0.44 6 0.33 6 0.34 6 0.33 6
Telivision 0.56 6 0.00 6 0.37 6 0.00 8 0.00 7 0.00 8 0.28 7 0.00 7 0.19 7
News papers 0.56 6 0.00 6 0.37 6 0.00 8 0.00 7 0.00 8 0.28 7 0.00 7 0.19 7
NGO 0.00 10 0.00 6 0.00 10 0.41 6 0.00 7 0.27 7 0.21 9 0.00 7 0.14 9
Agril. Magzines 0.31 9 0.00 6 0.21 9 0.00 8 0.00 7 0.00 8 0.16 10 0.00 7 0.10 10
When to apply
Input suppliers 39.38 1 44.56 1 41.10 1 41.78 1 42.44 1 42.00 1 40.58 1 43.50 1 41.55 1
Farmers 12.79 2 14.89 2 13.49 2 14.49 2 13.64 2 14.21 2 13.64 2 14.27 2 13.85 2
Friends and relatives 9.21 3 6.80 3 8.41 3 2.38 4 3.33 4 2.70 3 5.79 3 5.07 3 5.55 3
Others 4.79 4 2.22 4 3.93 4 1.11 6 3.78 3 2.00 6 2.95 5 3.00 4 2.97 4
Research institute 3.84 5 1.11 5 2.93 5 2.09 5 2.38 5 2.19 4 2.97 4 1.74 5 2.56 5
Radio 1.99 6 0.69 6 1.56 6 2.47 3 1.38 6 2.10 5 2.23 6 1.03 6 1.83 6
NGO 0.97 7 0.00 7 0.64 7 0.41 7 0.00 7 0.27 7 0.69 7 0.00 7 0.46 7
Agril. Magzines 0.49 8 0.00 7 0.33 8 0.00 8 0.00 7 0.00 8 0.24 8 0.00 7 0.16 8
News papers 0.34 9 0.00 7 0.23 9 0.00 8 0.00 7 0.00 8 0.17 9 0.00 7 0.11 9
Telivision 0.00 10 0.00 7 0.00 10 0.00 8 0.00 7 0.00 8 0.00 10 0.00 7 0.00 10
Overall
Input suppliers 42.06 1 45.05 1 43.06 1 41.54 1 42.20 1 41.76 1 41.80 1 43.63 1 42.41 1
Farmers 11.35 2 11.05 2 11.25 2 12.37 2 14.60 2 13.11 2 11.86 2 12.83 2 12.18 2
Friends and relatives 6.48 3 5.66 3 6.20 3 2.71 3 3.29 4 2.90 3 4.59 3 4.47 3 4.55 3
Research institute 4.04 4 1.80 4 3.29 4 1.93 4 2.56 5 2.14 4 2.98 4 2.18 5 2.72 4
Others 2.03 5 1.39 5 1.81 5 1.11 5 3.78 3 2.00 5 1.57 5 2.58 4 1.91 5
Radio 0.58 6 0.33 6 0.50 6 0.83 6 0.93 6 0.87 6 0.71 6 0.63 6 0.68 6
NGO 0.33 8 0.00 8 0.22 8 0.48 7 0.00 8 0.32 7 0.41 7 0.00 9 0.27 7
Agril. Magzines 0.34 7 0.24 7 0.31 7 0.00 9 0.00 8 0.00 10 0.17 9 0.12 7 0.15 8
News papers 0.31 9 0.00 8 0.21 9 0.14 8 0.00 8 0.09 8 0.23 8 0.00 9 0.15 9
Telivision 0.23 10 0.00 8 0.15 10 0.00 9 0.16 7 0.05 9 0.11 10 0.08 8 0.10 10
32
Table-60: Garrett Scores for Constraints in Chickpea Cultivars
Constraint* Dharwad Gulbarga Overall
A C A C
Annigeri Bhima Kabuli Local Annigeri Kabuli Local Annigeri Kabuli Local Annigeri Kabuli Local
GS R GS R GS R GS R GS R GS R GS R GS R GS R GS R GS R GS R GS R GS R
LY 40.42 1 28.00 4 76.20 1 1.71 1 32.95 2 38.50 4 1.69 1 42.24 1 70.00 1 0.81 4 43.05 1 73.00 1 1.42 2 20.93 1
HPI 39.23 2 27.00 5 59.60 2 1.42 2 41.52 1 71.50 1 0.00 21.62 4 0.00 0.78 5 25.28 3 0.00 1.71 1 16.24 2
HDI 27.11 4 37.50 1 51.80 3 0.61 5 30.55 3 60.50 2 1.36 2 10.86 8 31.00 3 0.63 7 12.56 7 0.00 1.22 3 10.73 6
LD 24.69 5 0.00 29.20 4 0.00 21.24 6 23.00 7 0.00 15.66 6 0.00 0.41 8 17.21 5 57.00 2 0.00 9.83 7
SGS 23.95 7 29.00 3 16.00 5 1.12 3 20.64 7 25.00 6 1.11 3 32.78 2 50.00 2 1.38 2 28.56 2 44.00 3 1.02 4 14.01 3
PC 11.46 11 0.00 13.40 7 0.00 10.48 10 28.50 5 0.00 8.20 9 0.00 1.02 3 6.37 9 0.00 0.82 5 4.85 10
PT 10.20 12 0.00 14.00 6 0.51 6 11.76 9 40.00 3 0.89 4 12.11 7 0.00 0.71 6 9.74 8 28.00 4 0.53 6 5.84 8
LRS 28.73 3 33.25 2 12.40 8 0.41 7 26.90 4 12.00 9 0.00 18.66 5 0.00 1.54 1 15.35 6 0.00 0.00 11.42 5
LMP 24.57 6 21.75 6 4.40 10 0.68 4 22.69 5 17.50 8 0.00 26.20 3 0.00 0.00 24.26 4 0.00 0.00 12.02 4
NFC 12.43 10 0.00 0.00 0.00 9.79 12 11.00 10 0.56 5 4.24 12 0.00 0.00 1.51 12 0.00 0.00 3.54 12
PFQ 17.27 8 0.00 0.00 0.00 14.62 8 0.00 0.00 8.12 10 0.00 0.00 5.84 10 0.00 0.00 5.53 9
SSP 13.89 9 0.00 5.00 9 0.27 8 10.33 11 0.00 0.00 4.68 11 0.00 0.00 2.60 11 0.00 0.00 3.97 11
*Note: GS=Garrett Score
R=Rank
LY=Low Yield HPI=High Pest Incidence HDI=High Disease Incidence
LD=Long Duration SGS=Small Grain Size PC=Poor Colour
PT=Poor Taste LRS=Low Recovery/Shelling % LMP=Low Market Price
NFC=Not Fit into Cropping System PFQ=Poor Fodder Quality SSP=Susceptible to Storage Pest
33
Table-78: Constraints faced in the cultivation of chickpea varieties as perceived by farm women
(% of households)
Variety Constraint Dharwad Gulbarga Overall
A C B A C B A C B
Annigeri Low yield constraint 46.66 51.11 48.14 64.44 66.67 65.19 55.55 58.88 56.66
Small grain size 44.44 53.32 47.41 56.66 46.67 53.33 50.56 49.99 50.36
High pest incidence 58.88 62.21 59.98 37.77 40.01 38.51 48.33 51.1 49.25
Low market price 44.43 46.67 45.17 44.45 44.44 44.46 44.44 45.55 44.80
Long duration 43.33 46.65 44.44 31.11 28.89 30.37 37.23 37.77 37.41
High disease incidence 47.76 44.43 46.65 23.33 26.67 24.44 35.56 35.54 35.54
Poor taste 36.66 33.33 35.54 34.45 28.88 32.58 35.57 31.11 34.07
Low recovery/ shelling % 45.55 40 43.7 25.55 15.55 22.22 35.56 27.77 32.96
Poor colour 38.88 31.1 36.29 17.77 15.55 17.03 28.34 23.31 26.64
Susceptible to storage pest 27.77 26.67 27.4 16.66 11.11 14.81 22.25 18.89 21.11
Poor fodder quality 31.1 24.43 28.88 11.11 8.88 10.36 21.12 16.66 19.61
Not fit into present cropping system
25.53 24.44 25.18 6.66 2.22 5.18 16.13 13.32 15.17
Bhima Small grain size 3.33 0 2.22 0 0 0 1.68 0 1.11
Low yield 1.11 0 0.74 0 0 0 0.56 0 0.37
High pest incidence 1.11 0 0.74 0 0 0 0.56 0 0.37
High disease incidence 1.11 0 0.74 0 0 0 0.56 0 0.37
Poor taste 1.11 0 0.74 0 0 0 0.56 0 0.37
Low recovery/ shelling % 1.11 0 0.74 0 0 0 0.56 0 0.37
Susceptible to storage pest 1.11 0 0.74 0 0 0 0.56 0 0.37
Kabuli Low yield constraint 4.44 2.22 3.7 1.11 2.22 1.48 2.78 2.22 2.59
High pest incidence 5.55 4.44 5.18 0 0 0 2.78 2.22 2.59
High disease incidence 4.44 4.44 4.44 1.11 0 0.74 2.78 2.22 2.59
Small grain size 3.33 4.44 3.7 1.11 2.22 1.48 2.23 3.33 2.59
Low market price 1.11 4.44 2.22 1.11 2.22 1.48 1.12 3.33 1.85
Long duration 1.11 2.22 1.48 0 0 0 0.56 1.11 0.74
Not fit into present cropping system
2.22 0 1.48 0 0 0 1.12 0 0.74
Poor colour 1.11 0 0.74 0 0 0 0.56 0 0.37
Poor taste 0 2.22 0.74 0 0 0 0 1.11 0.37
Low recovery/ shelling % 1.11 0 0.74 0 0 0 0.56 0 0.37
Susceptible to storage pest 1.11 0 0.74 0 0 0 0.56 0 0.37
Poor fodder quality 1.11 0 0.74 0 0 0 0.56 0 0.37
Local Small grain size 2.22 0 1.48 4.44 2.22 3.7 3.34 1.11 2.59
Poor taste 2.22 2.22 2.22 1.11 2.22 1.48 1.68 2.22 1.85
Low yield constraint 2.22 0 1.48 1.11 2.22 1.48 1.67 1.11 1.48
High disease incidence 2.22 2.22 2.22 1.11 0 0.74 1.67 1.11 1.48
Long duration 2.22 0 1.48 0 2.22 0.74 1.12 1.11 1.11
High pest incidence 1.11 2.22 1.48 0 0 0 0.56 1.11 0.74
Low recovery/ shelling % 0 0 0 2.22 0 1.48 1.12 0 0.74
Low market price 1.11 0 0.74 0 2.22 0.74 0.56 1.11 0.74
Poor colour 1.11 0 0.74 0 0 0 0.56 0 0.37
Poor fodder quality 1.11 0 0.74 0 0 0 0.56 0 0.37
34
(Garrett Scores)
Constraint Dharwad Gulbarga Overall
Adopted Control Adopted Control
Annigeri Bhima Kabuli Local Annigeri Kabuli Local Annigeri Kabuli Local Annigeri Kabuli Local
GS R GS R GS R GS R GS R GS R GS R GS R GS R GS R GS R GS R GS R GS R
LY 37.60 2 12.50 5 59.80 2 1.74 1 40.71 2 38.50 4 0.00 44.89 1 73.00 1 0.78 3 46.28 1 70.00 1 1.69 1 21.37 1
HPI 39.73 1 15.25 4 62.00 1 0.76 6 41.05 1 70.00 1 1.56 1 21.05 4 0.00 0.00 22.81 4 0.00 0.00 15.63 2
SGS 20.43 7 35.25 1 24.80 4 1.03 4 23.52 4 48.00 3 0.00 29.91 2 57.00 2 2.39 1 25.16 2 50.00 2 1.11 3 13.26 3
LMP 26.72 4 0.00 4.80 11 0.27 8 27.98 3 24.50 6 0.00 25.02 3 28.00 4 0.00 23.33 3 31.00 3 0.56 5 12.43 4
LD 23.38 6 0.00 0.00 1.21 3 23.38 5 0.00 0.00 17.14 5 0.00 0.00 15.07 5 0.00 1.36 2 9.63 5
HDI 25.32 5 19.00 2 42.60 3 1.38 2 23.14 6 58.00 2 1.11 2 11.35 8 44.00 3 0.41 4 11.56 6 0.00 0.00 9.62 6
LRS 28.48 3 6.25 7 7.00 9 0.00 23.14 6 0.00 0.00 13.14 6 0.00 1.12 2 6.93 9 0.00 0.00 9.07 7
PT 13.31 11 9.25 6 8.60 7 0.78 5 10.48 11 38.50 4 0.69 3 12.31 7 0.00 0.34 5 11.51 7 0.00 0.89 4 6.33 8
PC 14.98 10 0.00 7.40 8 0.46 7 9.90 12 0.00 0.00 7.54 9 0.00 0.00 7.63 8 0.00 0.00 5.00 9
SSP 15.75 9 16.00 3 8.80 6 0.00 14.29 8 0.00 0.00 6.19 10 0.00 0.00 3.60 10 0.00 0.00 4.98 10
PFQ 16.96 8 0.00 5.60 10 0.23 9 13.02 9 0.00 0.00 5.31 11 0.00 0.00 2.63 11 0.00 0.00 4.74 11
NFC 12.26 12 0.00 10.60 5 0.00 11.79 10 0.00 0.00 3.46 12 0.00 0.00 0.65 12 0.00 0.00 3.48 12
*Note: GS=Garrett Score R=Rank LY=Low Yield HPI=High Pest Incidence HDI=High Disease Incidence
LD=Long Duration SGS=Small Grain Size PC=Poor Colour
PT=Poor Taste LRS=Low Recovery/Shelling % LMP=Low Market Price
NFC=Not Fit into Cropping System PFQ=Poor Fodder Quality SSP=Susceptible to Storage Pest
35
APPENDICES
App-1: Area, Production and Yield of Chickpea along with Percentage Coverage under Irrigation in India (1950-1951 to 2007-2008)
(Area in m.ha; Production in m.t.; Yield in Kg/ha)
Year Area Production Yield % Coverage under Irrigation
1950-51 7.57 3.65 482 12.5
1951-52 6.83 3.39 496 15.1
1952-53 7.26 4.21 580 14.6
1953-54 7.97 4.83 606 14
1954-55 9.25 5.62 608 12.8
1955-56 9.78 5.42 554 12.1
1956-57 9.67 6.23 644 10.8
1957-58 9.09 4.89 538 12.5
1958-59 10.08 7.02 697 12
1959-60 10.33 5.62 544 12.4
1960-61 9.28 6.25 674 11.9
1961-62 9.57 5.79 605 12.2
1962-63 9.19 5.36 583 13.7
1963-64 9.35 4.5 481 13.7
1964-65 8.87 5.78 651 15.8
1965-66 8.02 4.22 527 16.4
1966-67 8 3.62 453 18.8
1967-68 8.26 5.97 723 15.6
1968-69 7.11 4.31 607 18.8
1969-70 7.75 5.55 715 17.3
1970-71 7.84 5.2 663 15.6
1971-72 7.91 5.08 642 15
1972-73 6.97 4.54 651 15.6
1973-74 7.76 4.1 528 15.8
1974-75 7.04 4.02 570 17.8
1975-76 8.32 5.88 707 16.5
1976-77 7.97 5.42 680 15.2
1977-78 7.97 5.41 678 14.7
1978-79 7.71 5.74 745 15.6
1979-80 6.99 3.36 481 18.6
1980-81 6.58 4.33 657 20.6
1981-82 7.87 4.64 590 17.9
1982-83 7.4 5.29 715 15.6
1983-84 7.16 4.75 663 14.5
1984-85 6.91 4.56 661 14.8
1985-86 7.8 5.79 742 15.6
1986-87 6.98 4.53 649 19.4
1987-88 5.77 3.63 629 19.2
1988-89 6.81 5.13 753 18.3
1989-90 6.47 4.22 652 21
1990-91 7.52 5.36 712 20.5
1991-92 5.58 4.12 739 24.2
1992-93 6.45 4.42 684 22
1993-94 6.36 4.98 783 24
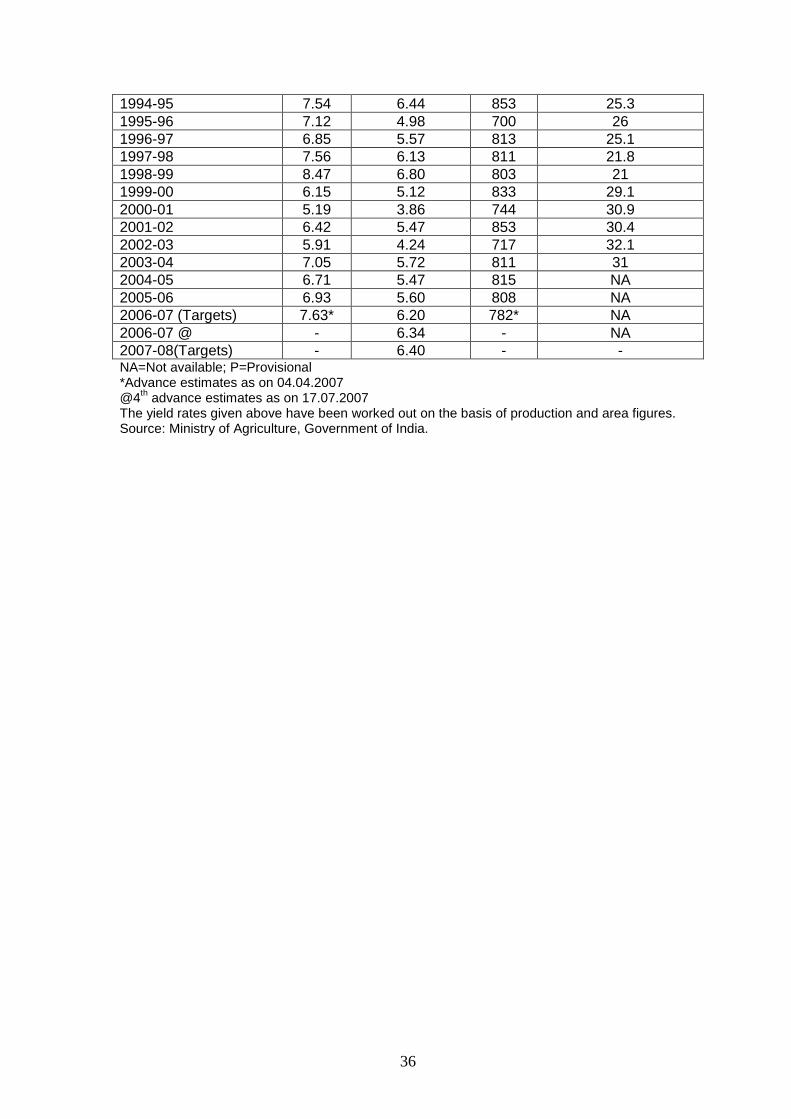
36
1994-95 7.54 6.44 853 25.3
1995-96 7.12 4.98 700 26
1996-97 6.85 5.57 813 25.1
1997-98 7.56 6.13 811 21.8
1998-99 8.47 6.80 803 21
1999-00 6.15 5.12 833 29.1
2000-01 5.19 3.86 744 30.9
2001-02 6.42 5.47 853 30.4
2002-03 5.91 4.24 717 32.1
2003-04 7.05 5.72 811 31
2004-05 6.71 5.47 815 NA
2005-06 6.93 5.60 808 NA
2006-07 (Targets) 7.63* 6.20 782* NA
2006-07 @ - 6.34 - NA
2007-08(Targets) - 6.40 - - NA=Not available; P=Provisional *Advance estimates as on 04.04.2007 @4
th advance estimates as on 17.07.2007
The yield rates given above have been worked out on the basis of production and area figures. Source: Ministry of Agriculture, Government of India.

37
App-2: State-wise Triennium Average (TE 2005-06) Area, Production and Yield of Chickpea
SN States/UTs Area Prodn Yield
‘000 ha % to Total ‘000 t % to Total Kg/ha % to Total
1 Andhra Pradesh 385.67 5.60 476.33 8.53 1235 152.22
2 Assam 2.17 0.03 1.03 0.02 477 58.78
3 Bihar 71.53 1.04 64.97 1.16 908 111.93
4 Gujarat 146.43 2.13 124.27 2.22 849 104.59
5 Haryana 120.00 1.74 87.67 1.57 731 90.04
6 Himachal Pradesh 1.77 0.03 1.90 0.03 1075 132.55
7 Jammu & Kashmir 0.23 0.00 0.13 0.00 571 70.43
8 Karnataka 448.50 6.51 208.03 3.72 464 57.17
9 Madhya Pradesh 2699.50 39.20 2501.67 44.77 927 114.21
10 Maharashtra 881.67 12.80 530.67 9.50 602 74.18
11 Meghalaya 0.50 0.01 0.30 0.01 600 73.95
12 Nagaland 0.97 0.01 1.13 0.02 1172 144.50
13 Orissa 32.13 0.47 20.13 0.36 627 77.22
14 Punjab 5.03 0.07 4.27 0.08 848 104.47
15 Rajasthan 1077.93 15.65 653.03 11.69 606 74.67
16 Tamil Nadu 6.40 0.09 4.23 0.08 661 81.52
17 Tripura 0.40 0.01 0.20 0.00 500 61.62
18 Uttar Pradesh 746.27 10.84 706.63 12.65 947 116.70
19 West Bengal 41.50 0.60 41.03 0.73 989 121.86
20 Chandigarh 215.57 3.13 158.27 2.83 734 90.49
21 Dadra & Nagar Haveli 0.20 0.00 0.10 0.00 500 61.62
22 Delhi 0.03 0.00 0.10 0.00 3000 369.74
All India 6886.30 100.00 5587.43 100.00 811 100.00
Source: Ministry of Agriculture, Government of India.
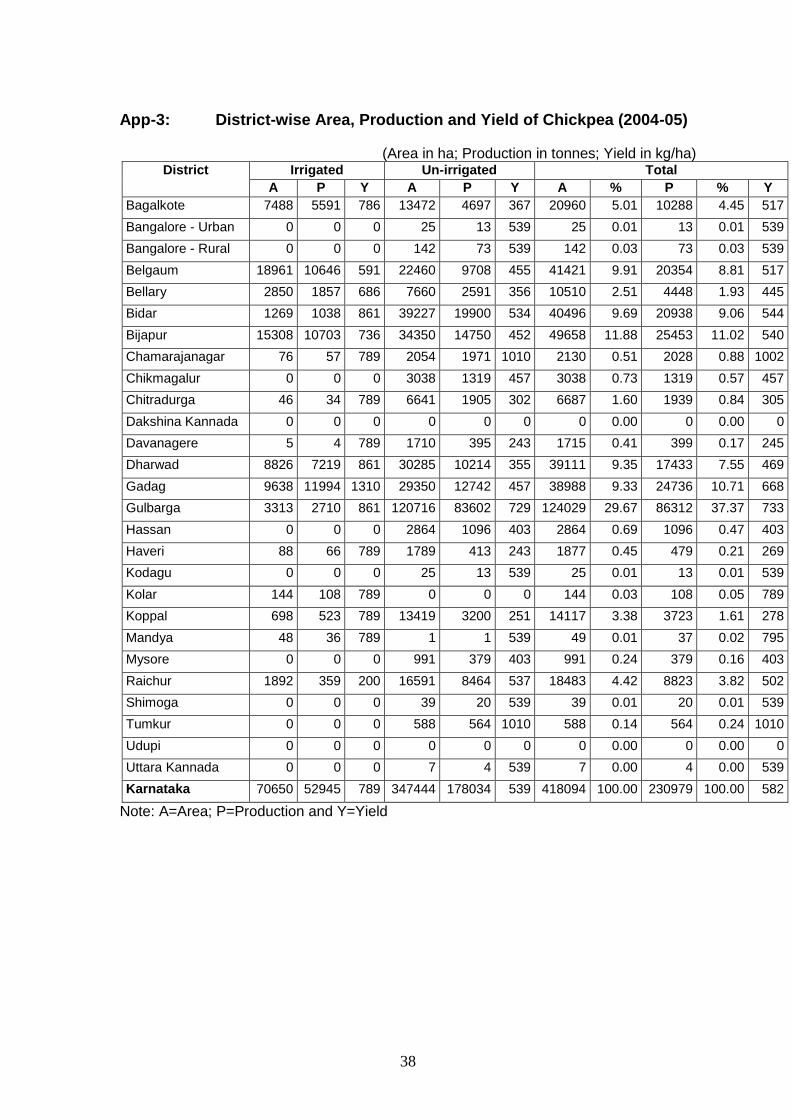
38
App-3: District-wise Area, Production and Yield of Chickpea (2004-05)
(Area in ha; Production in tonnes; Yield in kg/ha) District Irrigated Un-irrigated Total
A P Y A P Y A % P % Y
Bagalkote 7488 5591 786 13472 4697 367 20960 5.01 10288 4.45 517
Bangalore - Urban 0 0 0 25 13 539 25 0.01 13 0.01 539
Bangalore - Rural 0 0 0 142 73 539 142 0.03 73 0.03 539
Belgaum 18961 10646 591 22460 9708 455 41421 9.91 20354 8.81 517
Bellary 2850 1857 686 7660 2591 356 10510 2.51 4448 1.93 445
Bidar 1269 1038 861 39227 19900 534 40496 9.69 20938 9.06 544
Bijapur 15308 10703 736 34350 14750 452 49658 11.88 25453 11.02 540
Chamarajanagar 76 57 789 2054 1971 1010 2130 0.51 2028 0.88 1002
Chikmagalur 0 0 0 3038 1319 457 3038 0.73 1319 0.57 457
Chitradurga 46 34 789 6641 1905 302 6687 1.60 1939 0.84 305
Dakshina Kannada 0 0 0 0 0 0 0 0.00 0 0.00 0
Davanagere 5 4 789 1710 395 243 1715 0.41 399 0.17 245
Dharwad 8826 7219 861 30285 10214 355 39111 9.35 17433 7.55 469
Gadag 9638 11994 1310 29350 12742 457 38988 9.33 24736 10.71 668
Gulbarga 3313 2710 861 120716 83602 729 124029 29.67 86312 37.37 733
Hassan 0 0 0 2864 1096 403 2864 0.69 1096 0.47 403
Haveri 88 66 789 1789 413 243 1877 0.45 479 0.21 269
Kodagu 0 0 0 25 13 539 25 0.01 13 0.01 539
Kolar 144 108 789 0 0 0 144 0.03 108 0.05 789
Koppal 698 523 789 13419 3200 251 14117 3.38 3723 1.61 278
Mandya 48 36 789 1 1 539 49 0.01 37 0.02 795
Mysore 0 0 0 991 379 403 991 0.24 379 0.16 403
Raichur 1892 359 200 16591 8464 537 18483 4.42 8823 3.82 502
Shimoga 0 0 0 39 20 539 39 0.01 20 0.01 539
Tumkur 0 0 0 588 564 1010 588 0.14 564 0.24 1010
Udupi 0 0 0 0 0 0 0 0.00 0 0.00 0
Uttara Kannada 0 0 0 7 4 539 7 0.00 4 0.00 539
Karnataka 70650 52945 789 347444 178034 539 418094 100.00 230979 100.00 582
Note: A=Area; P=Production and Y=Yield
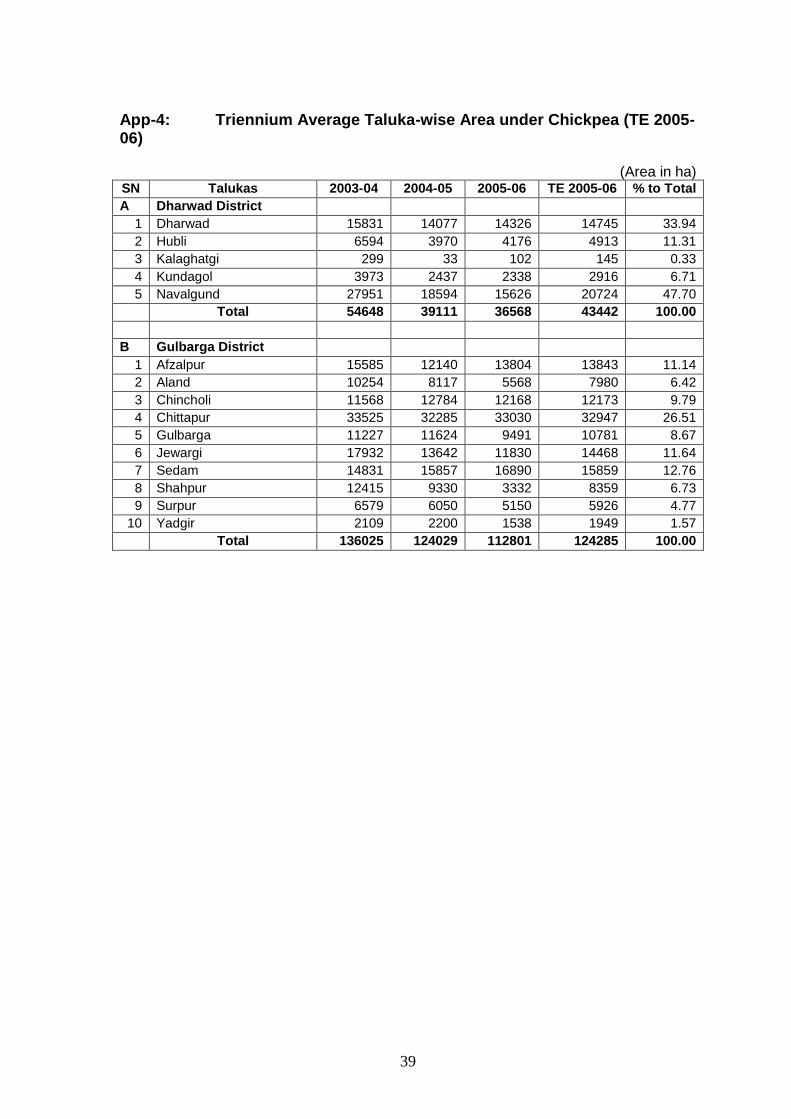
39
App-4: Triennium Average Taluka-wise Area under Chickpea (TE 2005-06)
(Area in ha) SN Talukas 2003-04 2004-05 2005-06 TE 2005-06 % to Total
A Dharwad District
1 Dharwad 15831 14077 14326 14745 33.94
2 Hubli 6594 3970 4176 4913 11.31
3 Kalaghatgi 299 33 102 145 0.33
4 Kundagol 3973 2437 2338 2916 6.71
5 Navalgund 27951 18594 15626 20724 47.70
Total 54648 39111 36568 43442 100.00
B Gulbarga District
1 Afzalpur 15585 12140 13804 13843 11.14
2 Aland 10254 8117 5568 7980 6.42
3 Chincholi 11568 12784 12168 12173 9.79
4 Chittapur 33525 32285 33030 32947 26.51
5 Gulbarga 11227 11624 9491 10781 8.67
6 Jewargi 17932 13642 11830 14468 11.64
7 Sedam 14831 15857 16890 15859 12.76
8 Shahpur 12415 9330 3332 8359 6.73
9 Surpur 6579 6050 5150 5926 4.77
10 Yadgir 2109 2200 1538 1949 1.57
Total 136025 124029 112801 124285 100.00

40
App-5: Sample of Households by Districts, Talukas and Villages
SN Districts
Taluks Villages A/C* No. of Farmers
Total Marginal Small Medium Large
1 Dharwad 1. Dharwad 1. Harobelwadi A 30 3 13 7 7
2. Kabbenur C 15 1 6 5 3
2. Navalgund 1. Shirkol A 30 8 11 7 4
2. Hansi C 15 2 5 5 3
3. Kumaragoppa
A 30 4 7 10 9
4. Yemnur C 15 3 5 4 3
Adopted Total
90 15 31 24 20
Control Total 45 6 16 14 9
Both 135 21 47 38 29
2 Gulbarga 1. Gulbarga 1. Kurikota A 30 11 8 8 3
2. Bhushangi C 15 2 8 4 1
3. Farhatabad A 30 6 7 8 9
4. Honnakirangi
C 15 2 4 6 3
2. Chittapur 1. Gotur A 30 8 9 9 4
2. Bennur C 15 6 3 4 2
Adopted Total
90 25 24 25 16
Control Total 45 10 15 14 6
Both 135 35 39 39 22
3 Overall Adopted Total
180 40 55 49 36
Control Total
90 16 31 28 15
Both 270 56 86 77 51
References
Shiyani, R.L., P.K.Joshi, and M.C.S. Bantilan, 2001. Impact of Chickpea Research in
Gujarat. Impact Series No.9, Pub. By Gujarat Agricultural University, Junagadh
and International Crop Research Institute for Semi-Arid Tropics, Patancheru,
Andhra pradesh, India, p.14-15