adopted budget and resource allocation plan fy2017/18
TRANSCRIPT

Adopted Budget and Resource Allocation PlanCity of Sunnyvale, California – Fiscal Year 2017/18
Volume ISummary

City of Sunnyvale DIRECTORY OF CITY OFFICIALS
July 1, 2017
Glenn Hendricks Mayor
Gustav Larsson Vice Mayor Jim Griffith
Councilmember Larry Klein
Councilmember
Walter Rossmann Assistant City Manager
Kent Steffens Assistant City Manager
Trudi Ryan Director of Community Development
Kent Steffens Acting Director of Environmental
Services Tim Kirby
Director of Finance
Deanna J. Santana
Nancy Smith Councilmember
Russ Melton Councilmember
Michael S. Goldman Councilmember
Teri Silva Director of Human Resources
Kathleen Boutté Foster Chief Information Officer
Cynthia Bojorquez Director of Library and Community Services
Kris Stadelman Director of NOVA Workforce Services
Phan Ngo Director of Public Safety
Manuel Pineda Director of Public Works
City Manager
John Nagel City Attorney

City of Sunnyvale
ADOPTED BUDGET and RESOURCE ALLOCATION PLAN Fiscal Year 2017/18
TABLE OF CONTENTS
VOLUME I – SUMMARY
OVERVIEW Volume I includes Budget Overview documents such as the City Manager’s Letter of Transmittal, budget summary, and twenty-year financial plans for all City funds. Detailed information on the operating and projects budget is included in Volumes II through III.
Introduction 5
15
City Manager's Adopted Budget Message
City Manager's Letter of Transmittal An in-depth review of the budget including the City’s long and short term strategies, and the priorities and issues for the new fiscal year.
Budget Overview 35
39
43
53
55
61
67
81
83
Budget Summary
City Profile & Organization Chart
Community Condition Indicators
Summary of Budgeted Personnel Hours Citywide summary of position count by Department and Employment Status (full time equivalents).
Financial Graphs Graphs depicting the sources and uses of the City’s revenues and expenditures for all funds.
Debt Service Summary of the City’s legal debt limit and repayment schedule for all debt instruments.
Budget and Fiscal Policies Summary of the City’s budget process, including Budget and Fiscal Policies.
Successor Agency of the Redevelopment Agency Obligations
City Budget Resolution and Appropriations Limit Resolution Resolutions for budget adoption and establishment of the appropriations limit for the new fiscal year.
Individual Financial Plans Financial plans provide a summary of revenues, expenditures, reserves, and beginning and ending fund balance over the twenty-year planning horizon. Detailed revenues by source follow the General and Enterprise Funds, and a detailed discussion of each fund precedes all financial plans.
123 General Fund The major operating fund that accounts for all financial resources necessary to carry out basic government activities such as public safety, street maintenance, libraries and parks and open space maintenance
151 Special Revenue Funds: Funds that are used to account for the proceeds of specific revenue sources that are legally restricted or earmarked for particular functions or activities. In many cases, a Special Revenue Fund has been set up in response to legal requirements established by a granting agency or another level of government.
159
167 169 171 173
175
177
179
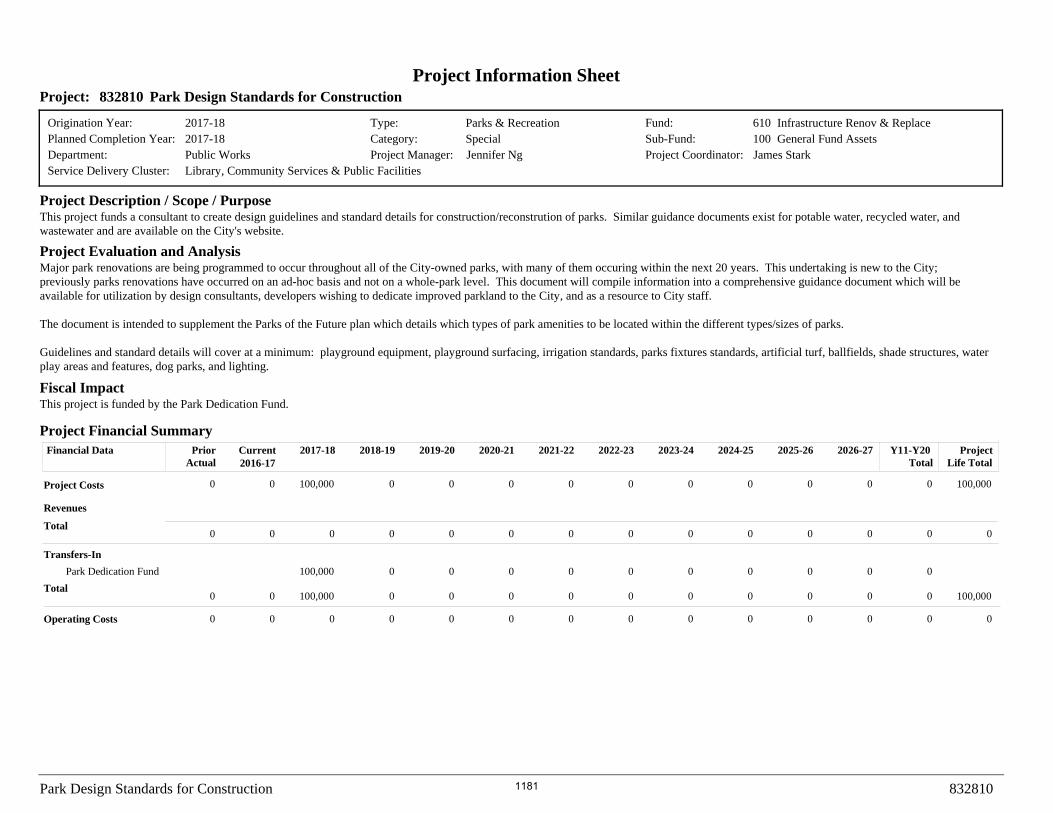
181
183
185
187
189
Housing Fund Sub-Funds: Housing Mitigation, Below Market Rate (BMR) Housing, & Redevelopment Housing
HOME Grant Fund Redevelopment Housing Fund Community Development Block Grant Park Dedication Fund
Asset Forfeiture Fund
Police Services Augmentation Fund.
Employment Development Fund
Parking District Fund
Gas Tax Fund
Transportation Development Act (TDA) Fund
VRF Local Road Improvement Program Fund
Youth and Neighborhood Services Fund
191 Capital and Infrastructure Funds: Funds that account for the City’s major capital acquisition and construction projects (non-utility) and the rehabilitation and replacement of these assets.
195 Capital Projects Fund Sub-Funds: General Assets, Gas Tax, Calabazas Creek Bridge, Traffic Mitigation, Transportation Impact Fees, Sense of Place Fees, & VTA Local Program Reserve
1

City of Sunnyvale
ADOPTED BUDGET and RESOURCE ALLOCATION PLAN Fiscal Year 2017/18
TABLE OF CONTENTS
Individual Financial Plans (continued)
Capital and Infrastructure Funds:
211 Infrastructure Renovation and Replacement Fund Sub-Funds: General, Golf and Tennis, Housing and Community Development (HCD)
219 Enterprise Funds: Funds that are used to account for programs and activities that are either fully or partially self-supporting by way of user charges and fees.
227
231
235
239
241
243
245
Water Supply and Distribution Fund
Wastewater Management Fund
Solid Waste Management Fund
SMaRT Station Fund
SMaRT Station Replacement Fund
Development Enterprise Fund
Golf and Tennis Center Operations Fund
249 Internal Services and Other Funds: Funds that are used to account for the financing of goods or services provided by one department or program to other departments or programs of the City on a cost-reimbursement basis, or other funds that separately account for assets that the City holds in a trustee or agency capacity.
261
273
283 285 287 289
General Services Fund Sub-Funds: Fleet Services, Facilities Management Services, Sunnyvale Office Center, Technology & Communication Services, & Project Management Services Employee Benefits Fund Sub-Funds: Leaves Benefits, Retirement Benefits, Workers’ Compensation, & Insurance and Other Benefits
Liability & Property Insurance Fund Community Facilities District No. 3 Fund Fremont Pool Trust Fund Dorolou Swirsky Youth Opportunities Fund
Budget Supplements Budget Supplements were called out separately in the recommended budget to draw a distinction between service levels provided in a baseline budget and recommended expansion or reduction of service levels. The adopted budget supplements are now incorporated in this budget document. For reference, the proposed budget supplements are provided in this volume.
291 Budget Supplements
Glossary of Budget Terms Definitions of terms used throughout the budget document.
337 Glossary of Budget Terms
2

City of Sunnyvale
ADOPTED BUDGET and RESOURCE ALLOCATION PLAN Fiscal Year 2017/18
TABLE OF CONTENTS
VOLUME II – OPERATING BUDGET
The budget document is organized by department, to allow users of the budget to easily identify expenditures by department and program. Each department detail includes the following:
• Narrative with Department Description,Programs and Services, Department BudgetSummary, Budget Overview and SignificantChanges, and Department Position Allocation
• Department Performance and WorkloadIndicators
• Detailed budgeted expenditures reports byprogram and activities
Department Operating Budgets
351 359 385 413 465 513 527 537 579 591 659
Office of the City Attorney Office of the City Manager Community Development Environmental Services Finance Human Resources Information Technology Library and Community Services NOVA Workforce Services Public Safety Public Works
VOLUME III – PROJECTS BUDGET
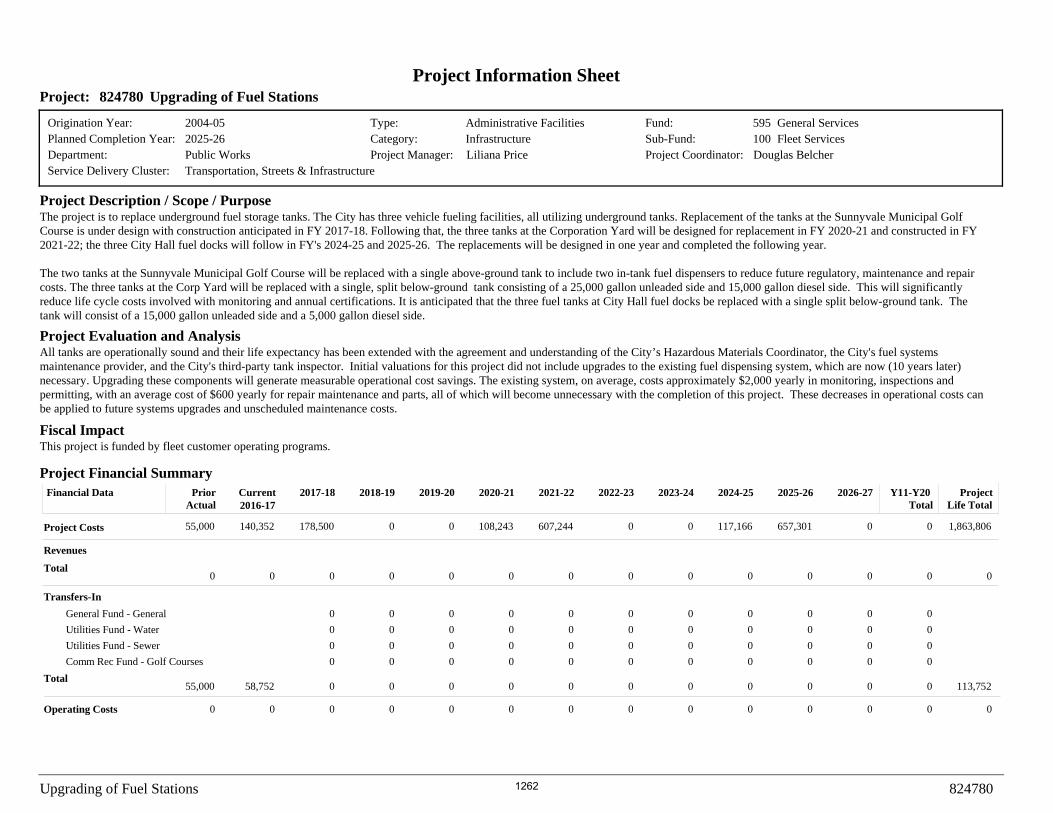
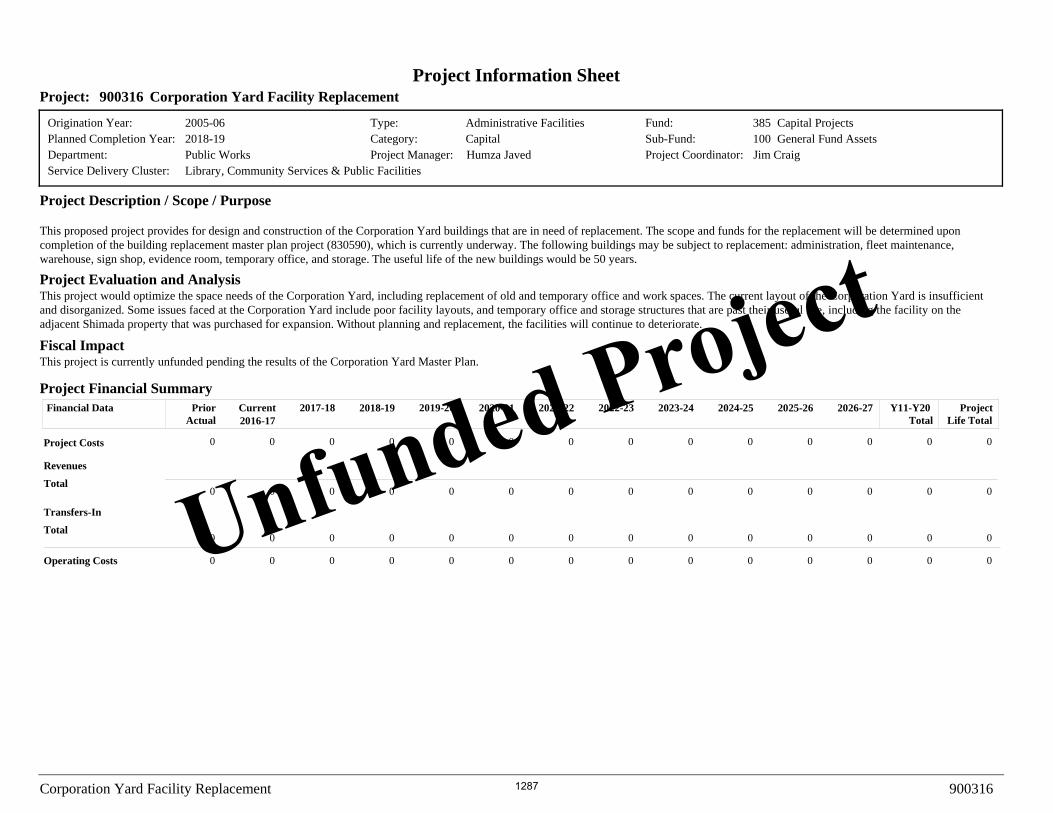
The Projects Budget includes City-wide projects that cover major improvements, construction, acquisition, infrastructure renovation and replacement as well as special projects that capture one-time costs, and outside group funding projects. Detailed project information sheets for all projects are included in this volume. The project information sheet provides the project description, scope, evaluation and analysis, fiscal impact, project costs, operating costs, and revenues and cost savings over the life of the project.
3

This Page Intentionally Blank
4

City Manager’s Letter of Transmittal
Memorandum
I am pleased to present the FY 2017/18 Adopted Budget and 20-Year Resource Allocation Plan. As background, Sunnyvale’s budget process alternates each year between an operating and projects budget. This Adopted Budget focuses on the City’s projects plan which is comprised of capital projects, strategic initiatives, and multi-year projects not requiring on-going funds over 20 years. As we focus on the projects budget, part of the normal course of this process includes some operating budget adjustments or corrections. This Adopted Budget maintains the high level of service that our community enjoys and invests in strategic projects needed to sustain and improve our public services. In the following pages, the FY 2017/18 Adopted Budget Highlights provides greater detail on the budget by its key components. This year’s Adopted Budget includes:
• Balanced inventory of proposed projects that reflect the City’s wide range of services; • Investment in multiple City Council strategic priorities; • Funds for major transportation infrastructure projects, including the funds allocated from
Measure B’s successful passage; • Increased funding due to the rising construction costs to deliver projects during a
competitive economic market; • Investment in the significant needs of our aging infrastructure and equipment; • Operating budget refinements that require budget consideration in advance of next year’s
more detailed review; and, • Detailed phased planning that reflects staff capacity with a goal of preparing for a slowed
economy and delivering capital projects at a lower cost when the market is less competitive. Legal and Policy Framework The Adopted Budget and 20-Year Resource Allocation Plan reflects a set of community values, the Council’s public policies, and the resources required to implement them. Unlike many other public agencies, Sunnyvale is relatively unique in that it does not budget year-to-year but over two years. Sunnyvale’s reputation of strong financial management rests in the wisdom and strong community values of City Charter voter mandates and long- established City Council Policies that together require that the City remain fiscally strategic and sustainable. These disciplined laws and policies promote fiscal solvency over the long term, for example: • 10-Year Balanced Budget Mandate – Sunnyvale voters have mandated a City Charter provision
requiring “At least thirty-five days prior to the beginning of each fiscal year, the City Manager shall submit to the City Council the proposed budget as prepared by him/her. Said budget shall
Date: 9/13/2017 To: Honorable Mayor, Councilmembers and Residents of Sunnyvale From: Deanna J. Santana, City Manager Subject: Fiscal Year 2017/18 Adopted Budget and 20-Year Resource Allocation Plan
5

Memorandum
be a balanced 10-year budget, reflect a minimum of 10 years long-range financial planning” (Article 1302);
• 20-Year Resource Allocation Plan Requirement – In addition to voter mandates, City Council Policy 7.1.1 requires decision making focused on long-range implications of short-range budgeting decisions, with specific focus on the following:
A.1.3 A balanced 20-Year Resource Allocation Plan shall be presented to the City Council
annually. A.2.1 The City shall maintain a long term fiscal perspective by annually preparing a 20-Year
Long Term Financial Plan for each fund. Those funds which account for intergovernmental grants will only include known entitlements.
A.2.2 Major financial decisions should be made in the context of the 20-Year Long Term Financial Plan.
A.2.3 Long term financial planning should enable the current service level provided to be sustained over time through the strategic use of reserves.
A.2.4 The Long Term Financial Plans should be used to communicate the fiscal impact of City decisions to all stakeholders whenever possible.
• Budget Stabilization Fund Threshold Requirement – City Council Policy 7.1.E. (1.4) requires that
the General Fund “Budget Stabilization Fund will be a minimum of 15% of projected revenues for the first two years of the 20-year planning period. Beyond year two, the Budget Stabilization Fund will always have a balance of at least zero.”
Continuing the City’s long standing tradition, the FY 2017/18 Adopted Budget maintains the balance of resource demands for core operations and strategic investments. This budget is deliberate in investing in present day needs, sufficiently plans for unanticipated events that cause for additional expenditures, and is mindful that our service needs change quickly but must rest within a long- term fiscal context. Economic Climate Sunnyvale’s economy is local with global impact. While our multi-year economic boom results in revenue growth, expenditures are growing at an even faster pace. The economic climate and fiscal condition in Sunnyvale are complex and dynamic with key indicators, such as:
• Unprecedented low unemployment rates for the region; • Record breaking year after year volume of business development and/or expansion; • Year to date increase in private sector layoff or closure WARN notices; • Multi-year drop in sales tax revenue, with a paradigm shift in the retail economic sector,
causing for a projected $35 million reduction in sales tax in this budget; and • Economic uncertainty with the Federal Administration’s policy initiatives that potentially
impact community well-being, programs for employees, and businesses in the innovation economy.
6
Memorandum The innovation economy experienced in Silicon Valley has a major impact on the global economy and private sector; however, as revenue growth is both shared and restricted by State law, the City’s revenue does not grow as fast as the private sector but, nonetheless, the City has experienced some revenue growth. Historically, periods of expansion are followed by periods of economic contraction. With an average economic boom lasting about five to eight years, our current economic expansion has exceeded well beyond the average term. While we must continue to plan for the inevitable economic slow-down, it has proven challenging. New revenues are quickly consumed by cost escalations that are not always in our control and previously deferred investments that require immediate action to sustain core operations. While the underlying financial foundation of the City is solidly fueled by a growing real estate market impacting property tax revenue, uncertainty in other revenues sources, mixed signals from economic indicators, as well as significant expenditure pressures temper the ability to absorb new services and meet demands. Last, the Federal Government’s proposed budget for the fiscal year starting October 1, 2017 threatens key sources of funding for service delivery that directly benefits a slowed economy and the unemployed (NOVA). With potential impacts to the workforce development, Community Development Block Grant, the HOME Program, environment and sustainability, and transportation funding, we must prepare for the absence of these services or develop alternate strategies to maintain these critical services to vulnerable parts of our community. In the context of an unprecedented housing and transportation crisis, with long-term consequences, it is imperative that these larger policy and service impacts are given proper consideration when evaluating our local budget. Unfortunately, while the Adopted Budget sustains past year’s programs, and absorbs new funding resulting from Measure B (Transportation Initiative), this budget does not present options for stabilizing potential appropriation reductions or eliminations resulting from any federal action. Adopted Budget Context and Significant Impacts The City’s budget is developed based on review of revenue and expenditure trends and projections. Within the above policy framework and economic climate, this Adopted Budget maintains service levels and invests in strategic policy priorities and projects that continue to advance the above average level of service that our community enjoys. We are fortunate to have a budget with a long-term focus and, it is with that in mind, that the below context and significant impacts are provided to add to a more robust conversation and long-term focus of the work that we will need to continue to stabilize areas in our budget that require solutions. Like last year, budget presentations and Council deliberations focused on investment opportunities and expenditure challenges emerging quickly that have a significant impact to the City’s Budget. As already mentioned, key economic indicators are showing complex patterns that directly impact our budget projections. Below are additional topics that were considered when deliberating on this Budget and considering resource investment trade-offs against each other:
7
Memorandum The CalPERS Challenge – The California Public Employee Retirement System (CalPERS), the agency that manages the City’s pension benefits, has taken steps to de-risk the system. There is no greater single factor of our budget impacting costs, that we do not have policy control over, than retirement costs. In most cases, the City can control cost escalation by local policy actions to contain them. In this case, the management of this pension system is by a different board charged with managing the total fund, ensuring that CalPERS members receive the vested pension benefit, and issuing actions, that require participating agencies’ compliance. In this Adopted Budget, the payment to CalPERS is set at $36.5 million for FY 2017/18. In the tenth year, the payment is anticipated to rise to a total of $65.5 million, illustrating the rapid growth resulting from CalPERS reforms, corrections due to lower than expected rate of returns, and/or new de-risking efforts. This Adopted Budget resolves this near doubling of CalPERS payments over 10 years, as required by the City Charter. After two consecutive years of virtually no return on investments (upon which benefit payments depend), the FY 2016/17 Budget included a projection of a significant increase in Sunnyvale’s cost for pensions totaling an additional $167 million over 20 years to make up for those losses. On the heels of resolving this mandate, the CalPERS Board implemented a reduction in the assumed rate of return on investments from 7.5% annually to 7%. This is projected to have an additional impact of $108 million over 20 years. Combined with increases in the cost for the retiree medical benefit (also known as OPEB – Other Post-Employment Benefits), this year’s budget assumes another $130 million in just these two categories, totaling approximately $300 million over the past two budgets. To simplify, in order to fund these increased mandated costs, the City is required to generate approximately $15+ million of new revenue per year to support this benefit (equivalent to an additional investment of about $333,000/full-time position over 20 years). We know that this is not the end of these increases, as it is already predicted that further significant reforms to the system will be required to stabilize it in the short- and long-term. This is not unique to Sunnyvale. California public agencies that are CalPERS members will face additional corrections; however, given our City Charter and Council Policies, we are required to balance the budget over a 10-year term and, additionally, plan for these costs over 20 years. As an example, in the long term, CalPERS has discussed bringing down its rate of return to 6% to further stabilize the pension system; true to our long-term fiscal focus, our actuarial review and expenditure planning, assumes a rate of return of 6% in the long- term to begin to plan for the inevitable fiscal impact and understand the fiscal conditions that result from absorbing additional costs. This is exactly why these local mandates exist, to provide advanced time to prepare for these fiscal events and manage services and resources in the long term. Unfunded Pension and OPEB Liabilities – This FY 2017/18 Adopted Budget projects the City’s Unfunded Liability for pension costs at $291 million ($146.6 Public Safety and $144.3 Miscellaneous). This is up $40 million from last year due to poor investment returns. Additionally, the change in the discount rate lowers the project funded status of City’s pension plans from the prior year’s projection. That means that in addition to the above base projected annual payments, along with the recent CalPERS actions and increased OPEB costs resulting in $300 million fiscal impacts, the City must also address the
8
Memorandum Unfunded Liability over time. For FY 2017/18, the pension Unfunded Liability payment totals approximately $19.5 million. This climbs to $45.6 million in 10 years. The cost is roughly split in half between public safety and miscellaneous employees, despite a much smaller number of safety employees. The City’s OPEB Unfunded Liability is at $85.7 million. This liability is currently 46% funded and projected to increase to 95% in 20 years. Unfunded Infrastructure – In the face of rising personnel cost challenges, the City also faces continued challenges with unfunded or underfunded infrastructure. In fact, this manifested itself this winter with the storms bringing down the City’s 911 call center for a brief period, and the loss of a transformer at City Hall, closing the facility for almost a full day. Most recently, equipment failures have partially and fully shut down Fire Station #2 and the Library, respectively. Infrastructure is aging across the City. The Council approved the contract for the Civic Center master planning effort and provided further input in August; the corporation yard is currently under a master planning process to address old facilities; evidence storage is outdated and in need of modernization; fire stations are over fifty years old and in need of remodel or rebuild; and, the City does not have a modern Emergency Operations Center from which to manage recent local service emergencies or the inevitable disaster that we know is on the horizon. A more complete list of unfunded projects is provided as part the Overview of the Adopted Budget and 20-Year Resource Allocation Plan attached to this budget message. As alarming as this issue may sound, infrastructure maintenance and replacement is a national issue and has been discussed significantly at a state and federal level. A Strategic Approach to a Solution In order to address long term uncertainty, unfunded needs, and rising personnel and other costs, the Adopted Budget takes a three-pronged approach: partial use of reserves, full use of revenue growth, and focused fiscal strategies. Holding true to one of Sunnyvale’s core values, challenges are being taken in the context of the 20-year planning period. First, we are fortunate to experience additional revenue during a period of growing demand for resources and unanticipated cost increases. In this Adopted Budget, as the first step to balancing the budget, all new revenue was used to fund planned service levels. Last year, we increased citywide revenue projections and, as a result, we worked off a higher revenue base for our 20-year revenue projections with this Adopted Budget. In the event that more revenue is realized, we would recommend that funds first be invested in the third category to preserve service levels and then replenish reserve levels. Second, the City strategically set aside a reserve fund for unanticipated increases in total compensation. A portion of this funding has also been allocated to absorb the escalations in cost. It is important to note that there is much uncertainty in total compensation costs outside of just pensions. With the health care market in flux due to the uncertainty around the fate of the Affordable Care Act, and increasing costs in workers’ compensation, maintaining capacity to absorb future increases will be critical. This Adopted Budget uses a portion of this reserve, leaving funds for unanticipated costs while focusing on more structural changes to our long-term fiscal management. If new revenue is achieved, a portion of
9

Memorandum those funds should be invested in this reserve because, based on past cost impacts, the balance is unlikely to be able to fully absorb any additional costs. Lastly, the General Fund adopted budget plans for fiscal strategies needed to keep the fund in overall health. These needs may be met through new revenue sources, alternative methods of service delivery, or moderation/cost control of current expenditures. The first step in achieving this goal will be through the Study Issue to evaluate New Revenue Strategies. From there, other actions may need to be taken. However, as Sunnyvale plans over a long period, we can foresee this need and have several years to plan and implement the needed changes. In the near term, the City will rely on approximately $4 million in unanticipated revenue and/or cost control strategies for FY 2017/18 to help maintain current service levels while fiscal strategies are explored. This combination comes from an estimate of actual current year operational savings from vacancies and controlling goods and services costs, as well as anticipated revenues meeting or exceeding planned levels. Overall, this three-pronged approach serves to balance our budget over the long term, but not without significant impacts. In fact, were we not faced with the challenges from CalPERS, if we had made the crucial timely infrastructure investments in the past that were needed, the new revenues we are experiencing could be used to enhance services to our community, instead of absorbing ever increasing costs for providing the same level of service. Budget Stabilization Fund One of the key tools the City uses in its budget are reserves. Reserves are purposed for many different needs, including emergencies, holding restricted monies, or to balance out cash flow and economic volatility. We frequently discuss the Budget Stabilization Fund in the General Fund, which serves as the General Fund's economic volatility and cash flow reserve, however there are other similar "discretionary" reserves in other funds (e.g. the Rate Stabilization Reserves in the Utility Funds). As part of the budget presentation and Council deliberations, we reviewed the City’s reserves, funding levels, and strategic uses over 20 years. One of the long-standing practices Sunnyvale has used is to budget large, multi-year, one-time expenditures over multiple years on a projected cash flow basis. This results in reserves appearing to be much larger than they are, as these one-time multi-year expenditures are already committed to Council approved expenditures. During preparation of this Budget, staff changed this practice for the Budget Stabilization Fund, removing multi-year one-time expenditures. This serves to surface what portion of the Budget Stabilization Fund is discretionary. In fact, this reduces the Budget Stabilization Fund to approximately $1.5 million of discretionary funding within nine years, showing just how precarious a financial position the General Fund maintains. This fundamental shift in Budget Stabilization Fund management provides for greater transparency of actual discretionary funds and provides for a clearer fiscal picture for the City Council to make informed policy decisions. Projects Budget As mentioned early on in this cover letter, the FY 2017/18 Adopted Budget focuses on projects, as we alternate between a detailed review of operations and projects each year. The proposed projects
10

Memorandum budget, totaling $191.6 million in FY 2017/18 ($1.5 billion over 20 years), reflects rising construction costs, the significant needs of our aging infrastructure, but also, the forethought and detailed planning that goes into the City’s capital project program. Addressing multiple City Council strategic priorities, the positive side of this budget is that service levels are preserved, maintaining a high level of service for our community and the project budget includes planned parks projects, major transportation infrastructure projects, the Lakewood Branch Library and Learning Center, and the Washington Community Swim Center. Additionally, with the passage of Measure B providing approximately $3 million per year, the City can invest in streets and sidewalks to maintain a Pavement Condition Index or PCI of 77 and hold the current backlog of sidewalk repairs steady at five years. Due to the timing of the subsequent gas tax legislation, Road Repair and Accountability Act of 2017 (Senate Bill 1), approved by the governor, the City is anticipating additional investments in this critical area of infrastructure. Additional details to the projects that will be funded will be brought forward to the City Council in Fall 2017. The City’s utilities infrastructure is also addressed with the replacement of the water pollution control plant now fully funded and increased funding for waterline replacements. In 2014, the Department of Public Works reviewed the implementation process for capital projects. In the past all capital projects “started” on July 1st, with the new Fiscal Year budget. This caused a number of issues, as it was not really feasible to start all new projects at the same time. The approach caused confusion because too many projects were being managed at one time, the phases of projects would extend beyond typical timeframes, and it made reasonable and realistic scheduling difficult. In 2015, Public Works staff modified the approach by dividing the fiscal year into quarters, and developing realistic schedules based on the number of projects that would start each quarter. It considered the number of projects each project manager had, and the phase of each project (scoping, request for proposals, design, etc.) as each phase has different work requirements. In 2017, this new scheduling approach was maintained and further refined allowing the City to be proactive instead of reactive, and giving the City flexibility to pace, accelerate, decelerate, or replace projects as needed (without delaying active projects). This flexibility can also allow staff to decelerate project schedules to take advantage of better bidding markets in the future or delay planned projects and replace them with unplanned near-term needs (such as the recent need to accelerate the City generators project). This scheduling approach also better aligns with the City’s new modern project management database, which complements this recent project management strategy.
11

Memorandum Council Policy Priorities The City Council has established strategic policy priorities and has held several sessions that help guide the development of the adopted budget. In acknowledgement of our operational priorities and limited capacity, Council adopted the following policy priorities:
1. Civic Center Campus and Main Library – The City Council will work on the Master Plan process and determine next steps for surplus land over this fiscal year.
2. Ability of Infrastructure to Support Development and Traffic – Efforts to implement several capital projects and absorb the positive impact of Measure B passage will begin.
3. Open Space Acquisition Planning: Future of Golf Courses – The City Council will consider up to approximately 8.5 acres of new park space this year and evaluate policy options for the golf courses over the next five years.
4. Downtown Sunnyvale – Phase 1 completion continues with the pending announcement of the theater lease, housing construction, and preparation work on Phase 2.
5. Improved Processes and Services through the Use of Technology – This budget requests additional staff to begin implementation of critical IT projects and to provide proactive operational support such as IT security and risk aversion. Major accomplishments include core information technology service updates (e.g., Microsoft O365, Skype for Business, expanded remote access to service - Virtual Private Network (VPN) - enhanced network bandwidth) along with the establishment of an IT Governance Structure (IT Steering and IT Solutions) to prioritize and approve IT projects, standards, policies and procedures.
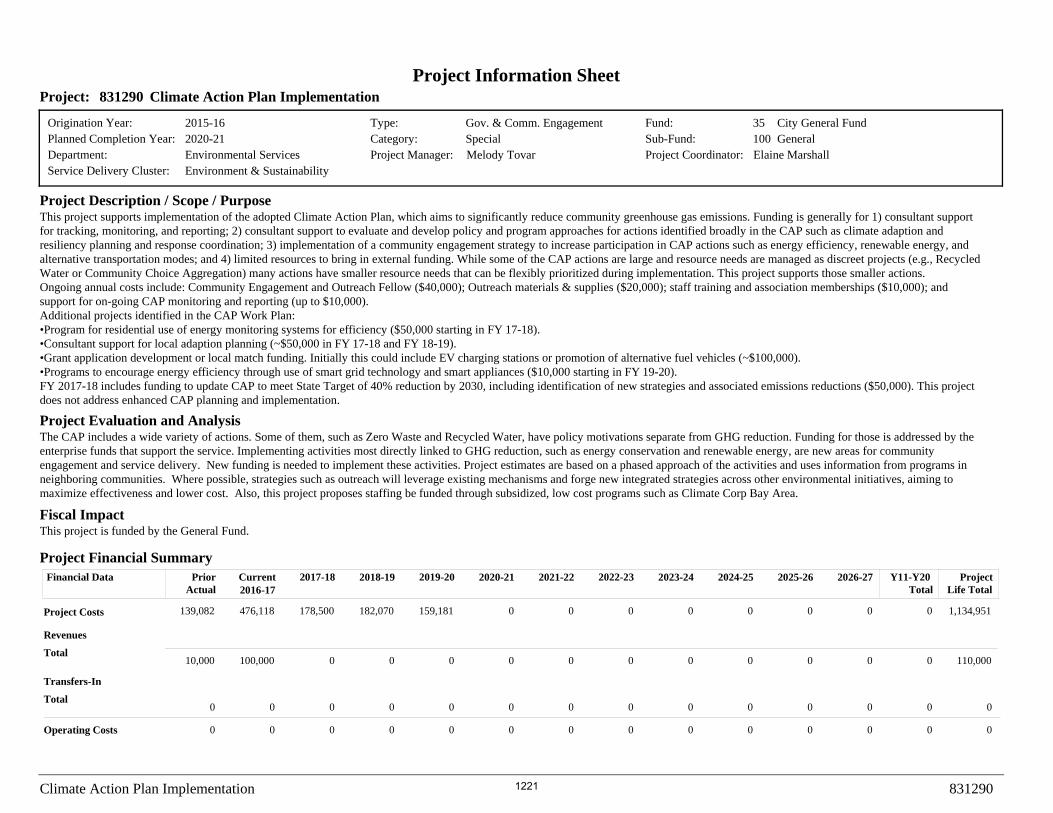
6. Accelerate the Climate Action Plan – Council consideration of a collaborative effort to determine required actions to accelerate the City’s efforts on implementing the climate action plan and develop aspirational goals.
The Adopted Budget advances each of these priorities, applying resources both at a high level and on a very specific and targeted basis. While these are important strategic priorities, the City is resourced for core operations and, therefore, supporting policy priorities does heavily impact staff. Staff is taking care to add resources where appropriate to support Council's policy priorities, as well as pacing the work to meet resource and staffing levels. Continued focused discussions of staff’s capacity is important in order to be able to maintain core operations, advance administrative initiatives to stabilize services, and implement strategic policy priorities. Budget Supplements The Adopted Budget also includes eight funded Budget Supplements as approved by the Council. These total $1.04 million over 20 years, all of which impact the General Fund. With these in place, the Adopted Long-Term General Fund Financial Plan reaches a low point in FY 2025/26 of approximately $1.5 million in the Budget Stabilization Fund. Except for only a few, the majority rise from the Study Issues process. These are ultimately policy tradeoffs against the Council’s desire to maintain a Budget Stabilization Fund at a certain level.
12

Memorandum
FY 2017/18 Budget Supplements
No. Title Cost Fund Status
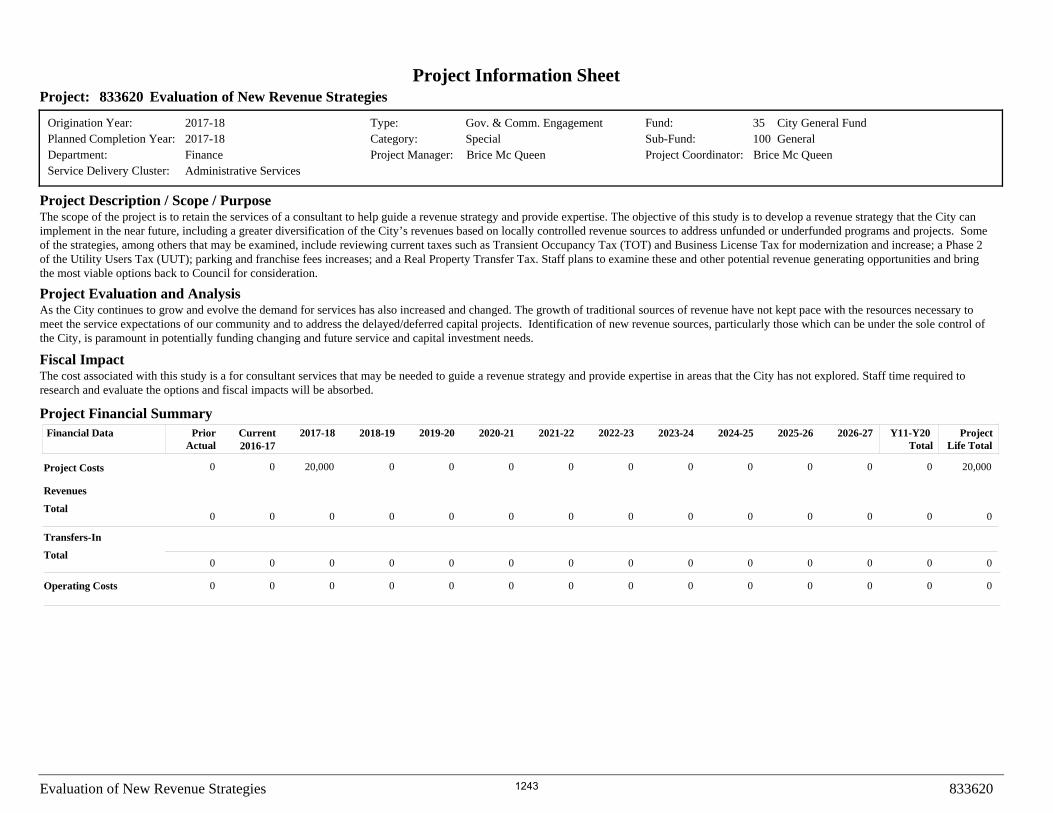
1 Evaluation of New Revenue Strategies to Fund New and Increasing Service Demands and/or Unfunded Capital Investments Needs
$20,000 one-time General Fund
Approved for Funding
2 2017 Housing Strategy $200,000 one-time General Fund
Approved for Funding
3 Downtown Development Policies for Parking
$60,000 one-time General Fund
Approved for Funding
4 Funding for Consultant and/or Legal Services to Develop a Program for Implementation of a Wage Theft Ordinance
$20,000 one-time General Fund
Approved for Funding
5 Public Access Programming for KSUN2
$15,000 each, for 2.5 years
General Fund
Approved for Funding
6 Accelerating Climate Action $250,000 one-time General Fund
Approved for Funding
7 Increased Supplemental Human Services Funding in FY 2017/18
$50,000 one-time General Fund
Not Approved
8 Feasibility Study for Development of a Class 1 Cycle and Pedestrian Trail Along Evelyn Avenue
$100,000 one-time Traffic Impact Fees Fund
Not Approved
9 Parkland/Open Space Policy/Initiative
$250,000 one-time General Fund
Approved for Funding
10 Lawrence Station Area Plan - Increased Housing Study and Sense of Place Plan
$200,000 one-time General Fund
Approved for Funding
13

Memorandum After the release of the Recommended Budget, the City Council approved actions to increase fire prevention and hazardous material staffing and corresponding fee revenue. The General Fund Long-Term Financial Plan was updated to reflect these changes. As a result, the General Fund appropriation in FY 2017/18 increased by $422,765 to the additional service that the City is required to perform as part of the fee changes. General Fund revenue projections for FY 2017/18 increased by the equivalent amount, causing no change to the General Fund Budget Stabilization Fund. The Sunnyvale City Council adopted the budget on June 20th, 2017. In the following pages, the FY 2017/18 Adopted Budget Highlights provide greater detail by the key components: revenues, expenditures, and reserves. It also includes a section for Budget Supplements and Unfunded Needs for the evaluation discussed above. For further information, Volume I: Summary includes the 20-year financial plans for all funds and Volume II: Operating Budget includes the operating budget by department. Volume III: Projects presents specific project detail by project category. Conclusion In summary, the FY 2017/18 Adopted Budget presents a sustained level of resources required to maintain a high level of service to our community and invest in strategic projects. Additionally, this Adopted Budget is an allocation of resources that maintains reserves to position the City well to manage new challenges sure to come in the future. It holds Sunnyvale’s reputation for being strategic, prudent, and thoughtful in its long-term budgeting. It allows resources to continue advancing the policy priorities set by the City Council, invests in infrastructure to modernize and improve service to the community, and sustains service levels that our residents have ranked highly. While we will continue to be faced with challenges such as long-term compensation costs for our employees and underfunded infrastructure, with continued prudent fiscal planning and thoughtful deliberation on setting priorities, we are well positioned to address these issues and there is time to work on the identified challenges. With a continued focus on community engagement and collaboration we will find solutions to the challenges presented and continue Sunnyvale’s strong tradition as a top City. The FY 2017/18 Adopted Budget strives to achieve our ultimate highest priority – ensuring a strong fiscal foundation to maintain quality and strategic services for our community!
Deanna J. Santana City Manager
14

F Y 2017/18 Adopted Budget Highlights The FY 2017/18 Adopted Budget totals $474.5 million and includes all City operations and project expenditures, as
well as withdrawls and contributions to the City’s reserves. Citywide budgeted expenditures are funded from multiple sources that include general taxes and revenues (the General Fund), restricted enterprise funds (Water, Wastewater,Solid Waste, Development Enterprise), restricted special revenue funds such as Housing, Park Dedication and Gas Tax, and grant funding which include transportation related grants for capital projects and federal and state workforcegrants for employment development. Restricted funds make up over half of the budget.
The total City budget is up 19.0% over FY 2016/17 primarily due to new and already planned capital projects aswell as increases in personnel costs. Citywide operations, which total $277.8 million are up 6.5% due primarily to increases in costs for total compensation of employees and some strategic position additions. The total projects budgetis up $79.4 million (73.8%) over the prior year. It is important to note that much of this increase was already plannedin the FY 2016/17 Budget and is almost wholly related to a small number of very large infrastructure projects including the Water Pollution Control Plant renovation, and several large grant or impact fee funded transportation and housing projects.
The City’s General Fund, which accounts for 36% of the citywide budget, has approved expenditures of $169.0 million. The General Fund is balanced over the ten year financial plan with a Budget Stabilization Fund Reserve that ends with $2 million in the tenth year, however, the reserve is dipping down to $1.5 million in FY 2025/26. In orderto balance the fund to the tenth year per charter and the twentieth year per Council Policy, the General Fund hasto implement fiscal strategies through reduced services, enhanced revenue, or alternative service delivery startingin Fiscal Year 2020/21 by $2.8 million on an ongoing basis. In addition, cost control measures are underway in FY 2016/17 to ensure vacancy savings that are assumed in this budget. An additional $2.4 million of cost control measures are required in FY 2018/19 in order to meet the City Council Policy of 15% Budget Stabilization Fund Balance in thefirst two years of the twenty year plan. We also will review revenue projections next year again, which may yieldslightly more revenue for FY 2018/19 in order to meet Council policy.
The Budget Stabilization Fund is used strategically over the twenty-year planning period to ensure a stable and consistent level of service is provided over the long-term. One of the long standing practices Sunnyvale has used is to budget large, multi-year, one time expenditures over multiple years on a cash flow basis. This resulted in the Budget Stabilization Fund appearing to be much larger than it really was, as Council committed funds for expenditures in future years were included in the Budget Stabilization Fund. During preparation of the Adopted Budget, staff changed this practice for the Budget Stabilization Fund, removing multi-year, one-time expenditures. This serves to surface the really discretionary portion within the reserve. In fact, this reduces the Budget Stabilization Fund to $1.5 million within nine years, showing just how precarious a financial position the General Fund maintains.
It is important to note that this plan takes real, long-term risk. While it uses the Budget Stabilization Fund to absorb increases in cost to maintain services over the mid-term, longer-term projections reflect the need to slow expenditure growth to the pace of revenue growth. The current budget is prepared at a time when several revenues appear to be at high-growth levels. Care has been taken to budget to historical growth averages over the long-term plan, as the City has experienced years of slow revenue growth and dramatic revenue reductions during the last twenty years.
Additionally, in the context of more complex economic cycles, personnel expenditures have also become less predictable, with growing focus on corrective action for pension sustainability and uncertainty in the health care market as a result of federal actions. As such, this budget includes projected increased costs for pension ($108 million)and other post employment benefit contributions ($35 million) totaling $143 million over a twenty-year planning period. It is important to note that planned personnel cost assumptions may not be reflective of future increases given the City’s long-term unfunded liabilities for pension and other post employment benefits. This, coupled with the results of recent labor negotiations and their corresponding ripple effect, puts significant additional pressure on theCity’s long-term financial plans. Therefore, long-term, fiscal sustainability will have to be balanced with controlling the total cost of compensation for our employees. With these vulnerabilities in mind, funds from the Budget Stabilization Reserve should be used thoughtfully and strategically.
City of Sunnyvale FY 2017/18 Adopted Budget Overview
15

The FY 2017/18 Adopted Budget also includes eight Budget Supplements for funding, totaled $1.04 million. Detail is provided in the “Budget Supplements” section.
City’s Budget and Resource Allocation PlanThere are three key elements to the City’s budget and resource allocation plan that provide the financial picture
of the City for both the short- and long-term: revenues, expenditures and reserves. The following sections discuss the highlights, key assumptions and changes included in this Adopted Budget for each of these elements. It is important to note these elements are budgeted into specific funds, such as the Park Dedication Fund and the Gas Tax Fund,primarily to ensure that revenues restricted to specific purposes are spent for those purposes. While the discussion here is not organized by fund, this important structure is reflected in the budget document with the presentationof twenty-year financial plans for each of the City’s funds. Detailed discussions about revenues, expenditures, and reserves by specific fund are included with the financial plans.
I. City Revenues and Resources The City relies on many sources of revenues to fund services to the community at a stable and sustainable level. As
Figure 1 shows, the largest revenue categories are taxes and service fees.
Figure 1. FY 2017/18 Citywide Revenue by Source
Total: $474.5M
Bond Proceeds: $37.8M,
Taxes: $133.5M,
Service Fees: $200.5M,
Federal / State: $76.6M,
Franchise / Rents: $10.4M,
8.0%
Use of Reserves: $6.2M, 1.3%
28.1%
42.3%
16.1%
2.2%
Other Revenues*: $9.5M, 2.0%
*Other Revenues include: permits/licenses, interest income, fines & forfeitures, miscellaneous revenues (e.g. damage to City property, housing loan repayments), SMaRT® Station revenues, reimbursement from the county, and other agencies contributions.
Taxes
Taxes, imposed by a government for the purpose of raising revenue to support governmental activities, are distinctly different from fees in that a tax does not need to be levied in proportion to the specific benefit received by a person or property. Therefore, almost all of the City’s tax revenues are in the General Fund, the primary general purpose fund of the City. Taxes account for 80% of the total revenues in the General Fund, supporting many of the
City of Sunnyvale FY 2017/18 Adopted Budget Overview
16

most visible and essential city services such as police, fire, road maintenance, libraries and parks maintenance. The one major tax revenue accounted for in a separate fund is the Gas Tax, which is levied and distributed by the State. Gas Tax funds must be spent on maintenance and capital projects related to public streets and highways. Figure 2 presents recent revenue received and projections for the top tax revenues.
Figure 2 – Top Tax Revenues
Revenue Source2014 /15
Actual2015/16
Actual2016/17 Budget
2016/17 Revised
Projection
2017/18 Adopted
Projection
% Change 2017/18
over 2016/17
Property Tax $54,940,570 $62,390,637 $62,777,052 $67,335,066 $68,974,004 2.43%
Sales Tax 29,676,176 31,356,775 31,698,678 31,488,243 31,230,324 -0.82%
Transient Occupancy Tax 14,137,069 16,295,589 14,471,479 16,798,573 15,294,653 -8.95%
Utility Users Tax 6,774,027 6,900,881 6,903,949 6,903,949 7,058,149 2.23%
Gas Tax 3,717,503 3,219,726 3,023,610 2,894,726 3,275,903 13.17%
Construction Tax 3,066,351 3,298,178 2,582,427 3,378,579 3,026,335 -10.43%
Total Top Tax Revenues $112,311,696 $123,461,786 $121,457,195 $128,799,136 $128,859,368 0.06%
The revenues present an overall positive outlook in the short-term, but also reflect the volatility in key tax revenue sources such as the Transient Occupancy Tax. As part of the development of the Adopted Budget, the current year projections are also updated. Based on year-to-date figures, we anticipate FY 2017/18 revenues to exceed actual returns in the prior year with the exceptions of gas tax and sales tax. Revised FY 2017/18 estimates for these revenues estimate a slight decrease from FY 2015/16.
Property tax revenue has continued to experience strong growth. The increased revenue is due to property sales and new construction in both the residential and commercial real estate markets. In particular, Sunnyvale home sales prices have hit record levels with an average sale price of $1.2 million. Revenues from the residential sector increased8.2% in FY 2016/17 while the commercial/industrial sector experienced 13.3% growth. While growth was forecasted in the FY 2016/17 Adopted Budget, actual growth is higher than estimated and therefore, the City’s property tax revenue base was adjusted upward. In addition, we anticipate continued strong growth in property tax revenue for the next two years. The residential growth projection is adjusted to 4.6% for FY 2017/18. Additionally, we have analyzed significant approved commercial development projects and the estimated construction schedules for these projects. Based on this data, three years of high growth is projected as these projects are added to the tax roll. Beginning in FY 2021/22, we forecast property tax growth at a long-term historical average of 4.1%. With the higher property tax base and increased growth assumptions in the short-term, the combined effect is that property tax revenues over the GeneralFund long-term financial plan are up $90 million over twenty years.
Sales tax, the City’s second largest tax revenue source, continues to provide unstable returns. The largest segment of activity in the sales tax base is business-to-business sales, which has been essentially flat over the last five years. For the long-term, given the ongoing volatility and the erosion of the sales tax base as we continue to move into more ofa service based economy, we have maintained modest sales tax growth projections. Projections for additional sales tax revenue from the redevelopment of the downtown are estimated to start in FY 2018/19, phased in over eight years to add an estimated $1.1 million annually to the base. The overall impact of all these adjustments to the City’s General Fund long-term financial plan is a $33 million decrease over twenty years.
Transient occupancy tax (TOT) has shown significant growth over recent years, coming in above estimates forFY 2015/16 and anticipated to be above original estimates again for FY 2016/17. Currently, TOT is one of the City’s strongest growth revenues, and the Adopted Budget anticipates that room rates and occupancy levels will remain
City of Sunnyvale FY 2017/18 Adopted Budget Overview
17
strong in the short-term, stepping down from current record level but remaining well above the historical average. Itis important to note that hotel activity in Sunnyvale is heavily reliant on business travel activity, and therefore this revenue source can be quite volatile and directly related to the economic climate. In the update of revenue projections for the FY 2017/18 Adopted Budget, we have adjusted the timing of projected new hotels forecast in the budget andhave only included approved projects. Because of the heavy reliance on business travel and the resulting volatility, we utilize historical room and occupancy rates for projections starting in FY 2017/18 but have revised those up to reflect more recent trends.
Utility users tax (UUT) revenue, generated from the sale of electricity, telecom services, and the sale of gas,is forecasted to grow moderately in the FY 2017/18 Budget. The forecast is driven by two factors, the recent modernization of the ordinance around telecom services and the increase in energy efficiency improvements. In November 2016, the voters passed a UUT Modernization ballot measure, updating the tax to include new telecom services such as pre-paid wireless. Although, it is expected that the modernization of telecom services will stem the decline of telecom UUT revenue and growth will slowly return, no growth from telecom was forecasted in the FY 2017/18 Adopted Budget, as the City had not received new data on the impacts of the UUT modernization as of the development of the Adopted Budget. Additionally, energy efficiency improvements continue to impact the City’sgas and electricity UUT. High development activity, in particular the impact of additional buildings within theCity, is growing the base. However, the impact of this growth has been substantially negated by energy efficiency improvements, resulting in only moderate growth in revenue related to gas, and electricity usage.
Gas tax, levied as a flat rate per gallon sold, is projected to decline in the short-term and then hold flat in thelong-term over the twenty-year financial plan. The majority of the tax is based on volume sold and not on the priceof gasoline, and therefore, projections consider advancements in fuel economy offsetting increased population and number of vehicles. The short-term increase is due to a true-up rate set by the State for the portion that is based onprice. While this revenue source holds flat over time, the costs and needs for street maintenance and improvements continue to climb.
In April 2017, State lawmakers approved a plan to raise fuel tax rates and vehicle registration fees to generate $52 billion for transportation purposes. The measure raises the gasoline tax by 12 cents per gallon and the diesel fuel tax by 20 cents per gallon starting November 1, 2017. The increase in vehicle registration fees will range from $25 to $175, depending on the value of the vehicle, beginning January 1, 2018, with an additional $100 per year charge on electric vehicles starting July 1, 2020. The measure also includes annual inflation adjustments that will be applied to both fuel taxes and vehicle registration fees. The funds raised will be allocated to repairing local streets,state highways and local transit projects. Based on revenue projections provided by the State Department of Finance, it is estimated that the City of Sunnyvale will be eligible to receive approximately $34 million for local street and road projects. It is also important to note that as part of this program, there are maintenance of effort and other requirements that must be met to obtain the funding. While it is anticipated that the City will receive some funding in FY 2017/18, staff is evaluating the fiscal impact and funding restrictions, and will incorporate the future revenue into the FY 2018/19 Recommended Budget.
Construction tax returns have been strong, reflecting the high level of development activity that the City has sustained for four consecutive years. It is anticipated that this current peak level will cool off, stepping down over the next two years although still estimated at elevated amounts as compared to historical averages.
Service Fees
Service fees are the City’s largest source of revenue. A diverse set of fees are charged to recover all or a portionof the City’s costs for providing a service or access to public property, or for mitigating the impacts of the fee payer’s activities on the community. Intended for cost recovery, a fee may not exceed the estimated reasonable cost of providing the service or facility for which the fee is charged. Because of this basis and the legal restrictions related to the expenditure of many of the fees, many of the City’s fees are accounted for in separate funds. By far, the largest source of fee revenue comes from the provision of water, sewer and solid waste collection services. The approved increases in utility rates are discussed below, as well as significant highlights in other fee categories.
City of Sunnyvale FY 2017/18 Adopted Budget Overview
18

Utility Rates The City has three utility funds that are fully self-supporting: the Water Supply and Distribution Fund, the Solid Waste Management Fund, and the Wastewater Management Fund. Each year, as part of the budget process, staff analyzes the current condition and long-term outlook for all three funds. The analysis includes a review of fund balances; State and Federal environmental requirements; revenues; anticipated capital, infrastructure, and operational requirements; and a detailed inspection of significant expenditure areas. The results lead to adjustments to rates that will generate the revenues necessary to meet planned expenditures. Through the long-term planning model, staff attempts to keep utility rates as stable as possible with modest increases annually, rather than keeping rates flat and impacting customers with a high increase in one year. The overall increase for FY 2017/18 is shown below, in Figure 3, with a comparison to the original projection made in the FY 2016/17 Adopted Budget:
Figure 3. Utility Rates
Utility Original Projection Adopted FY 2017/18 Change in Percentage Points
Water 15.00% 12.50% -2.50%
Wastewater 8.00% 10.00% 2.00%
Solid Waste 3.00% 3.00% 0.00%
Each of the utility enterprises has its own unique pressures that are driving rate adjustments. The FY 2017/18 Adopted Budget is a capital budget cycle. As such, each utility updated current project budgets as well as adding new projects. These projects are highlighted in the “Major Project Highlights” section below. There are other significant drivers as detailed below.
In the water utility, the two drivers affecting rates are the extended drought being experienced across the State for five consecutive years, and increased infrastructure needs. Although the drought is now over, Sunnyvale residents and businesses have done an outstanding job conserving water and as a result, water demand and corresponding sales are down significantly over the last several years. In fact, from FY 2012/13 to FY 2015/16, water demand in Sunnyvale is down 24%. Coming out of the drought, the region experienced a wetter than normal year. This also negatively affects the revenues to the fund, as demand slows due to the extensive rain. Due to the underlying behavior change that has occurred during the drought, water consumption is projected to remain relatively flat with moderate growth into the future. Another factor in increasing rates is related to the City’s take-or-pay provisions in its water supply agreements. In FY 2016/17, both wholesalers agreed to reduce the City’s minimum purchase requirements, so the revenue loss is largely offset by savings in buying less water. The wholesalers have notified the City that they will no longer reducethe take-or-pay provisions going forward. As such, the City’s rates must also be adjusted significantly.
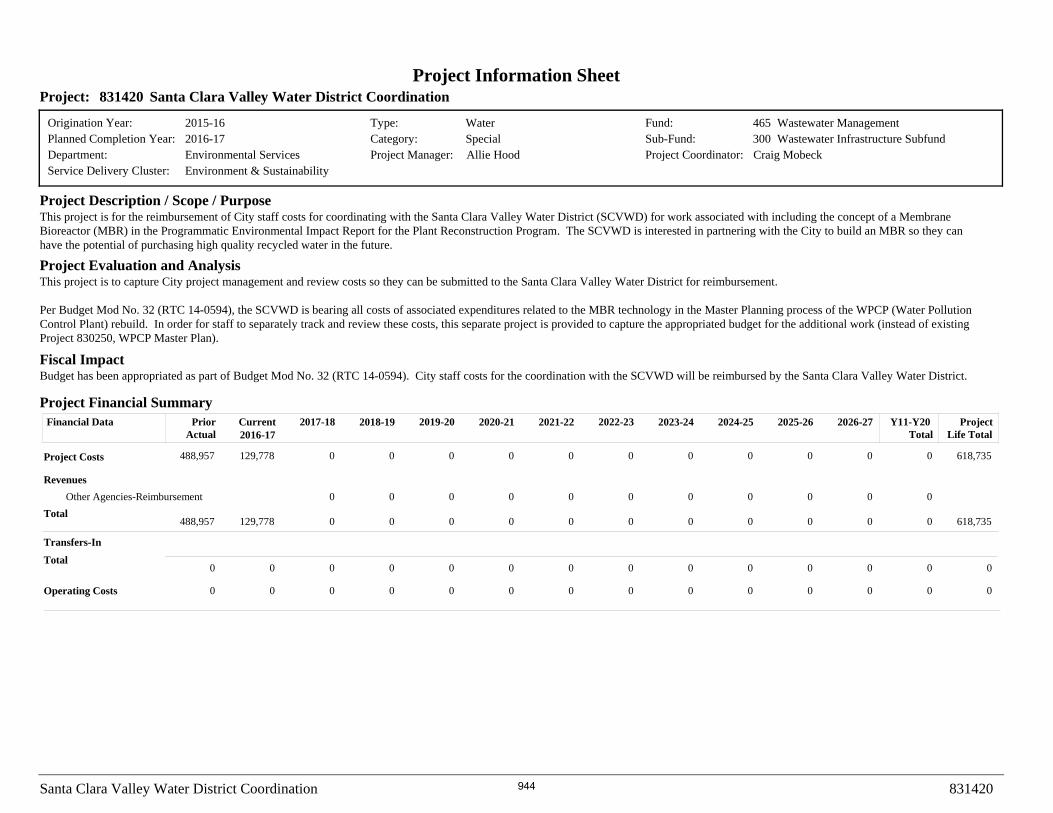
As with all utilities, there are fixed costs to operate the water system that are not based on the volume of water delivered. These include large capital needs in the Water Fund, mainly associated with pipe, tank, and well replacements and rehabilitation. The Adopted Budget includes approximately $113 million in projects over twenty years, the most significant of which is $73 million for water pipe and main replacements. The plan also includes investment in recycled water through the Wolfe Road Pipeline and the Continuous Recycled Water Production project being implemented at the City’s Water Pollution Control Plant. This investment leverages a $1.5 million grant from the State Department of Water Resources and supports both an investment in recycled water within the City and a more regional approach in partnership with the Santa Clara Valley Water District to secure and stabilize water supply.
The City recently implemented a Water Cost of Service Rate Study. This practice, which periodically recalibrates rates to reflect the current costs of providing water service modified the City’s pricing structure to adjust rates tomore closely reflect the cost of providing service. The new structure shifts costs from the variable water consumption charges to the fixed service charge to reflect the fixed costs of providing water service. Additionally, in response to recent statewide rate structure changes, the modifications include a flattening of the tiered pricing structure, whichhas had a varying effect on different customer classes.
City of Sunnyvale FY 2017/18 Adopted Budget Overview
19

Wastewater rates are rising as planned driven primarily by costs associated with improvements to the City’s wastewater collection and treatment system and stricter regulatory requirements. The main driver of rates in the Wastewater Management Fund is the need to replace the City’s aging wastewater treatment plant. The Adopted Budget includes the full impact of the master plan for the plant. The rates include the debt service on a $127 million loanfrom the State for the first phase of the project, as well as an assumption that the City will issue 30-year utility revenue bonds to fund the project over many years; annual debt service costs are expected to be over $48 million by FY 2034/35 after all the bonds have been issued. This debt service expense is substantial as it will eventually make up a third of the Fund’s total expenditure requirements.
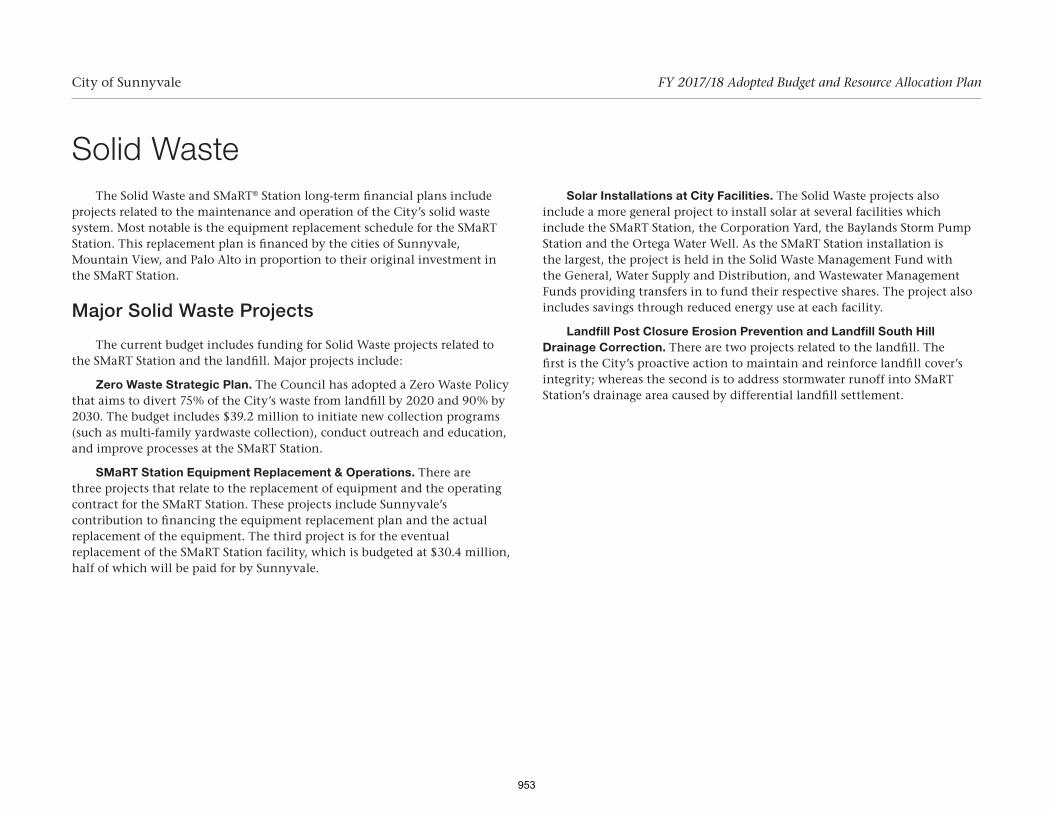
Solid waste rates are rising approximately as planned, driven primarily by the implementation of the City’s Zero Waste Strategic Plan. This plan, which targets increasing the City’s waste diversion rate to 75% by 2020 and 90%by 2030, is scheduled to achieve these goals through a combination of new services and enhanced public education and outreach. A portion of the increases from zero waste are offset by savings through waste being diverted from the landfill.
Solid waste rates also include the costs of operating and maintaining the Sunnyvale Materials Recovery and Transfer Station (SMaRT Station). These costs are shared by the cities of Mountain View and Palo Alto proportionally by the amount of recyclable material processed.
Overall, the utility funds remain on solid footing and are performing well. As the City continues its disciplined approach in reviewing the financial condition of each of these critical funds every year, if affords sufficient time to make adjustments and minimize the fiscal impact on each utility’s customers over the twenty-year horizon.
Development-Related Fees Effective FY 2014/15, a separate Development Enterprise Fund was established that includes all development-related fees (e.g. plan check fees, inspection fees and permit application fees) and related expenditures. In addition to ensuring full cost recovery, the fund allows us to track revenues and expenditures separately and build and draw down on a separate reserve. This is especially important as development-related fee revenues are highly volatile and, as large development projects take many years to complete, expenditures related to specific fees can occur later fiscal years than the one in which the revenue was collected.
With several large scale development projects in the Moffett Park and Peery Park areas, staff estimates revenueto remain elevated over historical averages through FY 2018/19, however, projections step down slightly over thelonger-term, from peak year numbers. History has shown us that this revenue is highly volatile with very wide swings between the peaks and valleys. As a result, the historical average has been budgeted starting in FY 2019/20.
On the expenditure side, total operations are up $10.2 million over twenty years. This reflects rising personnel costs as well as the addition of limited term staffing to meet the current high level of demand for services. This addition comes with the assumption that attrition will occur over time to reduce staffing levels to reflect more normal(as opposed to peak) demands for services. Once the projection for revenues drops back to historical averages, the long- term financial plan indicates revenues will not fully cover expenditures over the long-term. As a result, in out-yearsof the financial plan, fees will need to be increased or expenses reduced. Careful monitoring of development activity within the City and the effects on the Development Enterprise Fund will be key in the coming years.
Development Impact Fees The City imposes four development impact fees to mitigate the impact of a development on the community: Park Dedication fees, Transportation Impact fees, Housing Mitigation fees andSense of Place fees. Impact fees have strict requirements, set by state government code, that require fees to be roughly proportional to the impacts of the project and imposed for purposes related to the impacts of the project. Therefore, each of these fees is accounted for separately in its own fund or sub-fund. With development activity in the Cityat record levels, revenue from these fees has been significant. The City collected $36 million in revenue from thesefour fees in FY 2015/16. Based on year-to-date figures and approved projects, we estimate collecting $23.3 millionin FY 2016/17. With the known development projects in the permitting process currently, a high level of revenue is anticipated for FY 2017/18 and FY 2018/19. Because of the volatile nature of development projects, it is challengingto forecast impact fee revenue beyond the most immediate years. The revenue projected above last year’s budget is primarily appropriated in projects, or reflected as increases to fund reserves that will be dedicated to future projects.
City of Sunnyvale FY 2017/18 Adopted Budget Overview
20

Figure 4. Development Impact Fee Revenue
Revenue Source2015/16
Actual2016/17 Budget
2017/18 Budget
2018/19 Plan
2019/20 Plan
2020/21 Plan
Park Dedication Fee $ 23,053,336 $ 18,320,933 $ 16,556,388 $ 11,282,310 $ 8,232,840 $ 8,397,497
Housing Mitigation Fee 8,488,706 2,439,908 21,515,745 18,297,353 4,893,666 4,991,540
Transportation Impact Fee 4,047,810 1,765,793 5,841,007 7,500,111 2,969,586 3,028,977
Sense of Place Fee 54,223 727,719 1,915,116 1,214,345 183,885 187,563
TOTAL IMPACT FEES $ 35,644,075 $ 23,254,353 $ 45,828,256 $ 38,294,119 $ 16,279,977 $ 16,605,577
Golf Fees Newly configured in FY 2012/13, the Golf and Tennis Fund has struggled over the last five years to operate as a true enterprise fund, with all activities attempting to be self-supporting. This has been a strategic focus for Council, and staff has made good progress in restructuring activities to reduce expenditures; however growing revenues has been a challenge and the Fund will require continued subsidy. Recently, we have contracted with new restaurant operators for both courses with both restaurants now open. While staff will continue to explore cost saving opportunities, the Fund remains in a precarious position requiring annual subsidies of $1.4 million starting in FY 2017/18. In April of 2017, staff brought forward a report acknowledging the fiscal condition of this fund and committed to presenting policy options to the Council next fiscal year. An additional pressure is the funding of capital improvements. Current planned capital projects are funded by Park Dedication fees through FY 2032/33, but subsequently the Golf and Tennis Fund is expected to fund its own capital and infrastructure. General Fund monies were appropriated to the Golf and Tennis Operations Fund and programmed over the next seven years, totaling $9.8 million. This will allow time for the stabilization of Golf Operations and a strategic review of how to address the issue in the long run.
Other Revenue Sources
The remaining revenue sources are varied including franchises, rents, fines, licenses and interest income. There are also one-time revenues in this category such as bond proceeds, federal and state grants and sale of property. Highlights of other revenue sources are discussed below.
Debt Financing We use debt financing as a tool to maintain long-term financial stability by paying for certain expenditures over time. Debt financing is a tool for managing cash flow when large, one-time outlays are required, generally for large infrastructure projects.
The City currently carries debt for both the Water and Wastewater Systems, the SMaRT Station, the Redevelopment Successor Agency and the Government Center property at 505 West Olive Avenue (“Sunnyvale Office Center”). All of the currently held debt is funded by rate revenues, former tax increment or lease payments paid by various funds. The City does not maintain any general obligation debt (commonly called “GO Bonds”) and continues to maintain the highest issuer credit rating issued by Standard & Poors (AAA) and Moody’s (Aaa).
Sale of Property One-time in nature, proceeds from the sale of property go to the fund that owned or purchased the property. By City policy, one-time revenues are spent on one-time expenditures. As such, in the General Fund, sale of property revenue is placed in the Capital Improvement Reserve within the Fund. For FY 2015/16, the General Fund reflects $14 million for the sale of the Raynor Activity Center. Sale proceeds from the Raynor Activity Center are planned for design and construction of a branch library on the Lakewood Park site. The Adopted Budget also reflects updated sales numbers for the Unilever Margarine Plant site and the Onizuka property. Estimated value, based on appraisals, is $17 million for the Unilever property and $20 million for the Onizuka property. Unilever has exited the property and an evaluation of its disposition is underway.
City of Sunnyvale FY 2017/18 Adopted Budget Overview
21

II. City ExpendituresCity expenditures fall into three broad categories: operating, projects and equipment, and debt service. As Figure 5
shows, operating expenditures make up most of the City’s expenditures.
Figure 5. FY 2017/18 Adopted Budget Citywide Expenditures By Type
Total: $474.5M
Debt Service, Equipment, & Lease Payments: $9.8M, 2.1%
Projects: $186.9M,
Operating: $277.8M,
39.4%
58.5%
Operating Expenditures
The City alternates budget years, focusing on operating in one year and projects in the other. This Adopted Budget is a projects budget. As such, the majority of the operating budget remains intact. However each year staff does review major expenditure areas such as employee compensation assumptions, and overall budgetary inflation factors, as well as large single expenditures such as the cost for buying water or paying for solid waste collection services.
Total Employee Compensation
As a service organization, total employee compensation, which includes salaries and benefits, are the largest component of the City’s operating expenditures, accounting for 59% of total operations. Throughout the twenty-years of the financial plan, keeping the growth of salaries, retirement and healthcare costs balanced with revenue growth will continue to be a major driver in Sunnyvale’s ability to maintain current services or provide enhanced services without a new revenue source. In the Adopted Budget, pay increases are based on current agreements reached with each of the City’s bargaining units. While the majority of the agreements are set to expire within the first few yearsof the twenty-years of the financial plan, modest increases are assumed for all bargaining units in the out-years in anticipation of negotiations for years beyond the current contract period.
In recent years, retirement costs have risen steeply due to investment losses and demographic changes that have increased unfunded liabilities. Additionally, CalPERS has changed its rate methodology to recognize gains and losses over a shorter period of time. Lastly, this spring, CalPERS dialed down the investment return assumption over thenext three years (from 7.5% to 7.0%). These factors have resulted in increasing employer contribution rates (what the City pays for retirement) for the next several years and more rate volatility on a year-to-year basis in general. This rate volatility is reflected in the updated rates in this long-term financial plan. On average, the long-term rates developedby our consulting actuary are several percentage points higher than the rates we have in the FY 2016/17 Adopted Budget. It is also important to note that the City’s retirement plans are around 70% funded with a total unfunded liability currently at $291 million. Therefore, this Adopted Budget reflects an increase of approximately $108 millionto pension costs, in addition to the $167 million increase from June 2016 in order to pay down the unfunded liabilities within the next thirty years with a majority of the unfunded liability scheduled to be paid off within the twenty-year
City of Sunnyvale FY 2017/18 Adopted Budget Overview
22

plan horizon. Combined with retiree medical increases, this increase totals over $300 million over the past two years. As we monitor CalPERS current information indicates that the recent reduction to the investment return rate will not be the last. The rates developed by the City’s actuary assume the investment return rate drops to 6% by the last year of the financial plan.
There is also greater uncertainty with increases in medical premiums over the next several years. The City contracts with CalPERS, for medical benefits and rate increases have varied by different medical plans in recent years. Another part of the uncertainty is the impact of revisions ot the Affordable Care Act on our premiums. With the regulations continuing to evolve, we do not know the full impact at this time. To address these uncertainties, increases are throughout the long-term financial plan. Another element of medical costs is the cost for retiree medical benefits. Retiree medical costs have continued to grow. The City began addressing this issue several years ago by prefunding retiree medical costs through a trust. We continue to be on track to pay down the unfunded liability over the next twenty years.
The City is organized into eleven operating departments. Figure 6 summarizes the changes in the budget for each department:
Figure 6. Budgeted and Actual Operating Costs by Department
Fund/Program Actual
2014/15Budget
2015/16Actual
2015/16Budget
2016/17Budget
2017/18
% Change FY 2016/17 to
FY 2017/18
Community Development $ 7,206,305 $ 7,596,975 $ 7,636,757 $ 8,682,219 $ 9,382,868 8.1%
Environmental Services * 75,351,517 84,211,327 79,398,618 86,494,304 93,755,874 8.4%
Finance 8,200,684 8,490,746 8,317,651 8,996,089 10,356,607 15.1%
Human Resources 4,027,665 4,419,667 4,209,209 5,041,213 5,305,105 5.2%
Information Technology 6,715,674 7,100,904 7,033,848 7,877,713 9,099,053 15.5%
Library and Community Services 16,731,226 17,847,712 17,332,406 18,637,047 19,787,776 6.2%
NOVA Workforce Services 7,193,894 10,344,250 10,111,368 10,055,000 10,249,975 1.9%
Office of the City Attorney 1,738,918 1,856,142 1,773,735 1,956,799 2,265,877 15.8%
Office of the City Manager 4,303,071 4,626,672 4,660,763 6,469,079 4,840,753 -25.2%
Public Safety 82,754,465 90,783,057 89,085,098 97,656,943 99,947,189 2.3%
Public Works 34,886,063 36,768,298 35,102,817 39,708,133 41,824,394 5.3%
TOTAL EXPENDITURES $ 249,109,481 $ 274,045,749 $ 264,662,269 $ 291,574,539 $ 306,815,471 5.2%
*Excludes SMaRT Station Operating Program
Overall, the operating budget is up 5.2% across all funds. Some of this change is due to base changes in employee compensation, and some is due to increases in the number of employees, goods and services budgets to meet increasing demands. The following discusses some of the significant project changes that were made in each service cluster.
City of Sunnyvale FY 2017/18 Adopted Budget Overview
23

Project and Equipment Expenditures
We categorize our projects into four broad categories, Capital, Infrastructure, Special and Outside Group Funding. Capital projects are efforts to construct new or expanded facilities or infrastructure. Infrastructure projects are to rehabilitate existing infrastructure. Special projects are efforts like special studies or initiatives. Outside Group Funding projects are separate to capture funding to community organizations. These categories overlay the more specific project types by which the projects are grouped with the Projects Budget Volume III. Project categories and types have meaning from a budgetary and funding perspective, however have little meaning when viewed from the organizational and operational viewpoint under which city services are provided on a daily basis.
As City departments are extremely integrated and highly reliant on each other to deliver services and achieve the goals and results established by the City Council, city services are grouped into functional areas or service clusters as illustrated in the diagram below. Services and strategy are highly dependent on collaboration, teaming and working beyond departmental boundries as many priorities and decisions do not fall into a single department. With this in mind, the subsequent overview highlights the major projects presented in the FY 2017/18 Adopted Projects Budget in the context of service delivery clusters.
Transportation,Streets &
Infrastructure
Environment& Sustainability
Public Safety
Library & CommunityServices and
Public Facilities
AdministrativeServices
Community,Economy & Workplace
Development
CITY MANAGER & CITY ATTORNEY
CITY COUNCIL
Figure 7. Projects Budget by Service Cluster
Projects by Service Cluster
2017/18 Budget
2018/19 Plan
2019/20Plan
20-Year Project Totals
Administrative Services $ 8,726,319 $ 2,735,968 $ 1,584,820 $ 17,536,096
Community, Economic and Workforce Development 13,288,221 430,630 936,302 24,197,779
Environment & Sustainability 67,954,772 61,563,454 64,258,757 883,380,285
Library, Community Services & Public Facilities 33,882,246 18,893,286 15,665,880 229,641,784
Public Safety 7,233,781 7,442,779 3,185,784 64,729,491
Transportation, Streets & Infrastructure 60,472,006 8,587,534 10,494,553 254,023,303
Grand Total $ 191,557,345 $ 99,653,651 $ 96,126,096 $ 1,473,508,738
City of Sunnyvale FY 2017/18 Adopted Budget Overview
24
City Attorney and City Manager
These two departments serve as support to all service clusters, providing overall legal and policy guidance as well as organizational leadership and strategic direction. They support the City Council in its policy making and strategic planning while also providing core services such as the City Clerk, Elections, and City-wide communications. The Office of the City Manager is directly responsible for all day-to-day operations, through collaboration and coordination with departments. The Office of the City Attorney ensures that actions are legally compliant and minimize risk or liability to the City.
The FY 2017/18 Adopted Budget reflects funding for two primary projects falling under the direct oversight of the City Manager’s Office. This includes $340,000 over the twenty-year plan for the City’s website redesign, implementation and maintenance and $204,000 in FY 2017/18 for a Charter Assessment. An additional $240,000 is set aside over the next twenty years to fund project management for the Town Center Development Agreement overseen by the Office of the City Attorney.
Administrative Services
The Administrative Services cluster includes the Departments of Finance, Human Resources, and Information Technology (also referred to as internal service departments throughout this Adopted Budget). Consistent with Council’s action in FY 2016/17 to prioritize the proper planning and investment in mission-critical technology systems, the Adopted Budget continues funding for critical information technology systems such as the Enterprise Resource Planning System, the permitting system, and the public safety records management system over the next twenty years. Additionally, the budget reflects funding to support the sale of Onizuka and the Unilever plant, a Wastewater Cost of Service Study and contracting out for Administrative Hearing Officer services.
Major Project Highlights
Enterprise Resource Planning System In FY 2014/15 initial funding was provided to begin the process of replacing the City’s financial and budget systems. As the project has evolved, the scope expanded from a stand-alone financial system to an Enterprise Resource Planning (ERP) system that will integrate core financials with payroll and human resources functionality within one system and a specialized budget system. The project will replace the City’s current aging systems with modern, integrated systems that will provide real-time access and reporting of financial information to City leaders and managers and can provide greater functionality and ease of use for all staff. The FY 2017/18 project budget includes funding to meet the cost of the ERP and Budget System acquisition; to provide for the consulting expertise and staffing backfill needed to ensure a successful implementation; and complete an upgrade of the current HRIS system to bridge the system through the HRIS phase of the ERP. Funding for the ERP was added in FY 2016/17 as part of the City’s overall investment in technology with $8.1 million of the City’s $15.7 million investment directed to the ERP project. In FY 2016/17 the project funding, combined with funds set aside in Informational Technology Internal Services Fund, equaled $12.6 million. The FY 2017/18 project budget increased $1.1 million to $13.7 million and, reflects the allocation of project costs across City funds resulting in the Enterprise Funds contributing $2.8 million to the project and reducing the share paid by the General Fund by approximately $1.7 million.
Community, Economic, and Workforce Development
The Community, Economic, and Workforce Development cluster combines services from the Community Development Department, the Office of the City Manager and NOVA. Community development activity has been at a high level for the past several years and the FY 2017/18 budget reflects funding for contracted services to support this effort. The City’s support of on-going housing efforts continue to be funded in the Adopted Budget including projects for first time home buyer and housing rehabilitation loans, as well as homeless prevention and rapid re-housing. Minimum wage enforcement and an economic strategy initiative are also included in the Adopted Budget. The City’s Workforce Development effort is grant-funded and the FY 2017/18 Adopted Budget reflects the recent expansion of services into San Mateo County.
City of Sunnyvale FY 2017/18 Adopted Budget Overview
25

Library, Community Services, and Public Facilities
The Library, Community Services and Public Facilities cluster includes services provided through the Library and Community Services Department and the Facilities Divison of the Department of Public Works. The FY 2017/18 Adopted Budget reflects on-going City investments in community services including funding for recreational fee waivers and the State of the City. The budget also reflects funding for city facilities as well as funding for a number of parks related projects. Parks projects, which are primarily funded through park dedication fees, underwent a significant review and update through this budget process. Each project received a detailed review and costs for design and construction were updated to reflect the City’s most recent construction bid experience and design consultant estimates. The FY 2017/18 Adopted Budget reflects projects throughout the twenty-year plan that renovate and update all the City’s existing parks. Several major park projects are scheduled in the near term.
Major Project Highlights
Fair Oaks Park and Lakewood Park Enhancements Over $18.5 million in the next three years is planned to replace features that are over fifty years old. Updates include the planting of more drought tolerant plants, more efficient irrigation, energy efficient lighting and ADA compliance. These parks will be the first in the City to have artificial turf fields installed, which will allow for year-round and all weather programming.
All-Inclusive Playground This project provides for an all-inclusive playground at one of the City’s Community Parks. The playground will have equipment suitable for all park users including the elderly and children with various physical and cognitive abilities. This project schedule is aligned with the Fair Oaks Park renovation.
Other Park Renovation Projects Renovation of parks throughout the City other than Lakewood and Fair Oaks are spaced over the twenty-year planning period to allow for workload considerations, as well as timing them when renovation is appropriate. Some of the major highlights include the renovation of Ortega Park starting in FY 2020/21, Baylands Park starting in FY 2022/23, Las Palmas and Serra Parks starting in FY 2023/24. The budget also includes funding for the replacement of playground equipment at various parks. As the projects budget is reviewed in detail every two years, adjustments may be made to the current schedule based on need or other considerations.
Recreational Facilities The City also maintains numerous recreational facilities, the renovations of which are also funded largely by park dedication fees. The Washington Community Swim Center is one of many highlights in this Adopted Budget. Funded at $7.8 million over the next few years, this facility will be fully rebuilt, completely replacing the pool complex. Included will be a new family observation area, zero depth entry pools, water play equipment, slides and wading areas. This will increase the footprint of the facility, and the surrounding areas will also be improved, as appropriate. Design is underway with construction scheduled to start in 2018.
At the Community Center, progress is being made to upgrade the infrastructure at the site. Work includes roof repair, heating and air conditioning replacement, theatre house lighting, and miscellaneous finishes and upgrades in the various rooms throughout the facility. In addition, infrastructure repair and renovation to existing park buildings are included in this projects budget.
Projects currently funded by park dedication fees involving facilities in the Golf and Tennis Operations Fund continue to be funded at the same level. Although there are no new golf and tennis facilities projects planned in this budget, any future new projects will be funded by the Golf and Tennis Operations Fund and not the Park Dedication Fund. As the Golf and Tennis Operations Fund may not have sufficient operational revenue to support capital projects, fiscal strategies will be required to operate and fund necessary capital improvements at the City’s golf and tennis center facilities.
City of Sunnyvale FY 2017/18 Adopted Budget Overview
26

Civic Center and Library Facility Modernization The City provides an array of services from six different buildings located at the Civic Center. These include buildings that were built from 1958 to 1985, with one additional small modular building purchased in 2001. The City Council has provided direction to create a Master Plan for the entire campus, implement a phased approach to the project, create a financing plan based on existing City assets and to not sell any land at the Civic Center. In FY 2017/18, a Civic Center Master Plan will be completed to address future building locations, site circulation, open space and sustainability features.
Funding for the construction of a new or renovated Civic Center and Library is not included in the FY 2017/18 Adopted Budget. Funding strategies will be identified once a project approach and scope has been further developed.
Branch Library and Learning Center at Lakewood Park In order to increase access to library services for residents in north Sunnyvale, Council directed staff in 2012 to explore a branch library at the Lakewood School and Park site in partnership with the Sunnyvale School District. In line with the City’s policy to utilize one-time funds for one-time expenditures, the proceeds from the sale of the Raynor Activity Center were planned to provide funding for the construction of the branch library. Additional funding from the Park Dedication Fund and the General Fund to fund a community learning center are included in this budget to supplement the project funding. In total, $20.9 million is included in this budget, with $13.5 million of the proceeds from the sale of Raynor Activity Center set aside for design, construction, and startup costs of a new branch library. The City is exploring a partnership with Sunnyvale School District to construct and operate the project. Design is anticipated to start in FY 2017/18. Annual operating costs for the branch library are estimated to be approximately $500,000. Of this amount, $197,000 will be reallocated funding from the Library’s existing operating budget and will not constitute new funding. The remaining $292,000 will be the net new annual funding requirement. This amount has been reflected in the General Fund twenty-year financial plan beginning in FY 2019/20.
Transportation, Streets and Infrastructure
The Transportation, Streets and Infrustructure cluster includes Divisions withinthe Department of Public Works. The City’s transportation infrastructure is a critical component for ensuring livable local communities while supporting economic development. Sunnyvale has developed an excellent transportation infrastructure, but regional and local growth and the passage of time has put continual strain on capacity and maintenance needs. The City has proactively conducted long-range planning for traffic and transportation needs for a number of years and is actively involved in countywide planning efforts. Several long-range plans guide the development of the projects budget for the short- and long-term. These are: Valley Transportation Plan (VTP) 2040, Transportation Strategic Program, Downtown Specific Plan (2003), Bicycle Capital Improvement Program, 2007 Pedestrian Safety and Opportunities Study, Tasman/Fair Oaks Bicycle and Pedestrian Circulation Plan, Moffett Park Specific Plan, and Fair Oaks Junction Sense of Place Plan.
Each of these plans identifies traffic and transportation projects that are important for the specific area, the City, and/ or the region. These plans allow the City to undertake a coordinated traffic and transportation capital projects program and to position itself to compete strongly for outside specialized discretionary funding as it becomes available.
City of Sunnyvale FY 2017/18 Adopted Budget Overview
27
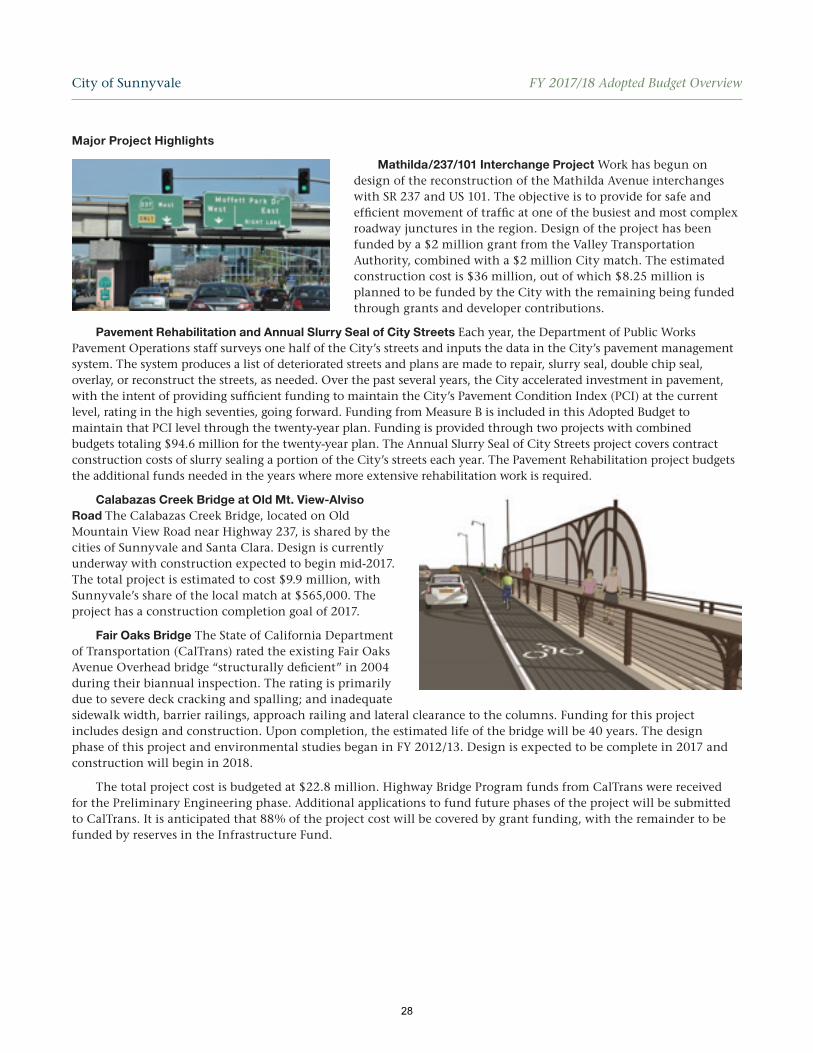
Major Project Highlights
Mathilda/237/101 Interchange Project Work has begun on design of the reconstruction of the Mathilda Avenue interchanges with SR 237 and US 101. The objective is to provide for safe and efficient movement of traffic at one of the busiest and most complex roadway junctures in the region. Design of the project has been funded by a $2 million grant from the Valley Transportation Authority, combined with a $2 million City match. The estimated construction cost is $36 million, out of which $8.25 million is planned to be funded by the City with the remaining being funded through grants and developer contributions.
Pavement Rehabilitation and Annual Slurry Seal of City Streets Each year, the Department of Public Works Pavement Operations staff surveys one half of the City’s streets and inputs the data in the City’s pavement management system. The system produces a list of deteriorated streets and plans are made to repair, slurry seal, double chip seal, overlay, or reconstruct the streets, as needed. Over the past several years, the City accelerated investment in pavement, with the intent of providing sufficient funding to maintain the City’s Pavement Condition Index (PCI) at the current level, rating in the high seventies, going forward. Funding from Measure B is included in this Adopted Budget to maintain that PCI level through the twenty-year plan. Funding is provided through two projects with combined budgets totaling $94.6 million for the twenty-year plan. The Annual Slurry Seal of City Streets project covers contract construction costs of slurry sealing a portion of the City’s streets each year. The Pavement Rehabilitation project budgets the additional funds needed in the years where more extensive rehabilitation work is required.
Calabazas Creek Bridge at Old Mt. View-Alviso Road The Calabazas Creek Bridge, located on Old Mountain View Road near Highway 237, is shared by the cities of Sunnyvale and Santa Clara. Design is currently underway with construction expected to begin mid-2017. The total project is estimated to cost $9.9 million, with Sunnyvale’s share of the local match at $565,000. The project has a construction completion goal of 2017.
Fair Oaks Bridge The State of California Department of Transportation (CalTrans) rated the existing Fair Oaks Avenue Overhead bridge “structurally deficient” in 2004 during their biannual inspection. The rating is primarily due to severe deck cracking and spalling; and inadequate sidewalk width, barrier railings, approach railing and lateral clearance to the columns. Funding for this project includes design and construction. Upon completion, the estimated life of the bridge will be 40 years. The design phase of this project and environmental studies began in FY 2012/13. Design is expected to be complete in 2017 and construction will begin in 2018.
The total project cost is budgeted at $22.8 million. Highway Bridge Program funds from CalTrans were received for the Preliminary Engineering phase. Additional applications to fund future phases of the project will be submitted to CalTrans. It is anticipated that 88% of the project cost will be covered by grant funding, with the remainder to be funded by reserves in the Infrastructure Fund.
City of Sunnyvale FY 2017/18 Adopted Budget Overview
28

Sidewalks, Curbs, and Gutters The City maintains the vast majority of sidewalks, curbs and gutters throughout the City. This infrastructure is often pushed up or broken by street trees; as they grow over time, trees slowly damage sidewalks, curbs, and gutters with their roots. The budget includes two projects to address this issue, one to provide ongoing funding to repair damaged sidewalks, and the other to repair sidewalks which become out of compliance with the Americans for Disabilities Act. The two projects provide a combined $42.6 million over twenty years in funding for these repairs.
Environment and Sustainability
The Environment and Sustainability cluster includes the City’s water, wastewater and solid waste utilities as well as efforts toward environmental sustainability and is largely supported by utility rates. The results of the drought on the cost of water, reduced demand for water and the maintenance requirements of the aging utility system continue to be major contributing factors in the cost of service provision. The City has been addressing its aging water and wastewater utility infrastructure for many years now and will continue to for the foreseeable future. Like many municipalitiesin the state and the country, Sunnyvale’s water storage and distribution systems and wastewater collection and treatment systems are over fifty years old and in need of significant rehabilitation. Due to the physical location of the infrastructure, the need to make investments that will benefit the City over a very long time, and the ever-changing policy and regulatory environment, there is no cheap, easy, or simple solution.
Major Project Highlights
Water Supply and Distribution System The Sunnyvale water system is a comprehensive water storage and delivery system. The City is divided into three zones. Zone 1 comprises the northerly two-thirds of the City and is supplied by six San Francisco Public Utilities Commission (SFPUC) turnouts. Zones 2 and 3 comprise the southerly one-third of the City and are supplied by two Santa Clara Valley Water District (SCVWD) turnouts, and by seven wells. The distribution system also consists of three booster pump plants and ten storage tanks with a capacity of 26 million gallons. There is also one recycled water reservoir with a storage capacity of two million gallons. The system alsoserves an important role in providing fire protection for the City, featuring approximately 3,400 public fire hydrants and many private fire service connections. The system is managed by an automated Supervisory Control and Data Acquisition (SCADA) system that controls distribution of water throughout the system.
Over the past few years, staff has been working to identify and scope projects to replace the aging infrastructure and improve the system’s reliability. The FY 2017/18 Adopted Budget includes $141.8 million over 22 projects. While the main focus on water line replacements will continue, comprising $75 million of the total, emphasis is also being placed on rehabilitation and maintenance of potable water tanks and wells and ensuring reliability for recycled water production and delivery. Approximately $13 million has been budgeted for the renovation of water plants, wells, and tanks.
Wastewater Collection and Treatment System The Wastewater Utility continues to face large infrastructure challenges. The most significant is the renovation of the City’s Water Pollution Control Plant (WPCP). The Wastewater Utility recently completed a master planning effort which consists of a number of projects that will renovate the City’s existing wastewater treatment. The Master Plan, which was approved by City Council in August of 2016, will serve asa long-term guide for replacing the WPCP’s facilities and operations. The FY 2017/18 Adopted Budget includes planned infrastructure expenditures of approximately $723 million over twenty years, with 91% (or $658 million) allocated to the WPCP Master Plan. In addition, funds are budgeted for projects to manage the gap between the old and new plant, and infrastructure work on the sewer and storm collection systems.
Replacement of the Water Pollution Control Plant Rehabilitationand replacement of the WPCP continues to be the highest priority for the City’s wastewater treatment system. The first phase of the Master Plan is underway with site demolition and grading work nearing completion andthe construction contract of the Primary Treatment Facility was awarded in Spring 2017. This includes a new headworks facility, which removes large debris from incoming sewage and pumps the sewage into new primary treatment tanks which, in turn, slow down the wastewater to settle out large
City of Sunnyvale FY 2017/18 Adopted Budget Overview
29

solids. The existing primary treatment facilities are structurally deficient, deteriorated, and susceptible to significant failure during a seismic event. The current influent sewage pump station includes gas-powered influent engines that will not meet future emissions limits and need replacement. The new headworks and primary facilities will be located at the previous biosolids drying operation site, adjacent to the current influent pump station. Currently, biosolids drying operations are being performed mechanically by a vendor contract until new bio-solids facilities are constructed. Other phase 1 projects include new parking on Caribbean Drive and Bay Trail access enhancements, and rehabilitation of influent pipelines to the treatment facility.
The second phase of the Master Plan includes new buildings for maintenance, administration staff and a laboratory, new secondary treatment, as well as a new thickening and dewatering facility and other piping and draining upgrades. Pre-construction and design activities are underway.
The WPCP Master Plan also includes $46.5 million for Program Management Services and $33.0 million for Construction Management over the next twenty years. The Program Management Consultant (PMC) is responsible for quality assurance related to project design documents and will assist the City in evaluating design consultant recommendations for equipment selection and design features. The PMC provides oversight and coordination for the overall program implementation of the reconstruction program including establishing, maintaining, and tracking project budgets and schedule. The construction management consultant provides additional technical, engineering and project support such as contractibility reviews, construction oversight, inspection services, quality assurance testing, construction schedule and budget management, construction coordination, meeting management and records management to deliver the projects in the program.
It is important to note that over time, the City will be issuing bonds to fund the renovation project. In addition, the City signed final papers completing Clean Water State Revolving Fund Loans totaling $127 million.
Wastewater Collection System The City’s wastewater collection systems are also in need of significant rehabilitation due to their age. The FY 2017/18 Adopted Budget includes projects related to sewer and stormwater collection. The wastewater collection system consists of approximately 613 miles of sewer and storm mains, and seven pump or lift stations. The system has five major sewer trunk lines that terminate at the WPCP, where sewage is treated. Major projects include $17 million for sanitary sewer pipe improvements and $10.7 million for storm water infrastructure. Funding of $1.4 million is allocated for immediate repairs and further analysis of the Lawrence Expressway trunk line. Additional funding may be necessary based upon the conclusion of additional analysis on that sewer project.
Over $45 million has been included in the Adopted Budget for stormwater program costs. The City stormwater system operates under the terms of a Municipal Stormwater National Pollutant Discharge Elimination System (NPDES) permit. This allocation also includes project funding to implement trash reduction programs and other maintenance activities in order to meet permit requirements. The funds will provide for outreach and enforcement efforts, and fund retrofit projects that would redirect stormwater to biotreatment areas.
Solid Waste Management System In 2013, the City Council approved the Zero Waste Strategic Plan, a policy which seeks to increase the City’s waste diversion rate to 75% by 2020 and 90% by 2030. The FY 2017/18 Adopted Budget includes $39.2 million to initiate new collection programs, such as multi-family yard waste collection, conduct outreach and education, and improve processes at the SMaRT Station.
There are four projects that relate to the replacement of equipment and the operating contract for the SMaRT Station, These projects include Sunnyvale’s contribution to financing the equipment replacement plan and the actual replacement of the equipment. A fifth project is for the replacement of the SMaRT Station facility, which is budgeted at $30.4 million, half of which will be paid for by Sunnyvale.
City of Sunnyvale FY 2017/18 Adopted Budget Overview
30
Climate Action Plan In 2014, the Council adopted the City’s Climate Action Plan (CAP) aimed at significantly reducing greenhouse gas emissions. While some of the City’s actions are large and resource needs are managed as discrete projects, this project is intended to support the aggregate of smaller actions. The Adopted Budget supports current CAP implementation, including Budget Supplement No. 6, which initiates a more aggressive planning effort to advance climate action beyond 2020.
Public Safety
The City continues to deliver police, fire and EMS services to the community through the utilization of cross- trained personnel. This unique model of service provision provides the City with the ability to be more agile in the deployment of resources to best serve the needs of the community. The FY 2017/18 Adopted Budget reflects funding for a Fire Station Master plan, Safe Routes to School initiatives and equipment acquisition and maintenance.
Major Project Highlights
Recruitment and Training for Sworn Officers The Public Safety Department budgets for the recruitment, selection, and training of new public safety officers in a series of recurring Special Projects rather than in the operating budget. This methodology allows expenditures to fluctuate each year based on the number of recruitments and allows for better monitoring and tracking of costs. The total twenty-year budget for these recruitment and training projects is$74 million. In December 2016, Council accelerated funding for recruitment and training to address continued lowstaffing levels in the department. The new schedule reflects an additional $9.2 million over the next twenty years to fund increased recruitment efforts.
Budget Supplements and Unfunded Needs As part of the development of the FY 2017/18 Adopted Budget, we identified potential unfunded needs (i.e.
programs, projects, and infrastructure) and carried forward Budget Supplements that came out of the Study/Budget Issues Workshop. Departments were tasked to develop a list of unfunded needs which is intended to be a dynamic and evolving document that helps illustrate funding priorities in a larger context and maintain the long-term vision for which Sunnyvale is so well known. The Adopted Budget includes eight Budget Supplements, which impact the General Fund.
Without any of these in place, the Long-Term General Fund Financial Plan ends the twenty years with $15.9 million in the Budget Stabilization Fund. To the extent that Council eliminates expenditures included in the Adopted Budget, identifies additional revenues, or draws reserves, Council can use those resources to add supplements or begin to address unfunded needs.
The following lists include all Budget Supplements and currently identified unfunded needs for the evaluation discussed above. The City Manager recommended certain Budget Supplements for inclusion in the Adopted Budget. No unfunded needs have been addressed at this time as many are still in the early stages of development or other funding requirements were necessary to structurally cure the budget in the twenty year plan.
Budget Supplements Budget supplements are proposals to increase, decrease or change service levels. Each supplement is presented
separately and approved supplements have been included in the FY 2017/18 Budget. This year, the Adopted Budget includes eight Budget Supplements. Figure 8 lists the supplements and the City Manager’s recommendation. These eight supplements have been included in the financial plan of the affected fund for budget adoption. Details of each supplement can be found in the Budget Supplements section of this Adopted Budget.
City of Sunnyvale FY 2017/18 Adopted Budget Overview
31

Figure 8. Budget Supplements
FY 2017/18 Budget Supplements
No. Title Cost Fund Status
1 Evaluation of New Revenue Strategies to Fund New and Increasing Service Demands and/or Unfunded Capital Investments Needs
$20,000 one-time General Fund Approved for Funding
2 2017 Housing Strategy $200,000 one-time General Fund Approved for Funding
3 Downtown Development Policies for Parking $60,000 one-time General Fund Approved for Funding
4 Funding for Consultant and/or Legal Services to Develop a Program for Implementation of a Wage Theft Ordinance
$20,000 one-time General Fund Approved for Funding
5 Public Access Programming for KSUN2 $15,000 each, for 2.5 years General Fund Approved for Funding
6 Accelerating Climate Action $250,000 one-time General Fund Approved for Funding
7 Increased Supplemental Human Services Funding in FY 2017/18
$50,000 one-time General Fund Not Approved
8 Feasibility Study for Development of a Class 1 Cycle and Pedestrian Trail Along Evelyn Avenue
$100,000 one-time Traffic Impact Fees Fund Not Approved
9 Parkland/Open Space Policy/Initiative $250,000 one-time General Fund Approved for Funding
10 Lawrence Station Area Plan - Increased Housing Study and Sense of Place Plan
$200,000 one-time General Fund Approved for Funding
20 Year Total $1,037,500
City of Sunnyvale FY 2017/18 Adopted Budget Overview
32

Unfunded Programs and Projects The following list enumerates known areas that are unfunded or underfunded. Some of the programs have
numbers associated with them while others would require more study or scoping to fully identify. It is important to note that this list is dynamic and will change with each budget cycle and as the City identifies new needs or funds items on the list.
Figure 9. Unfunded Programs and Projects
Unfunded Projects Listing
Administrative Services
Work order and Asset Management Systems
GIS Assessment — GIS Coordinator
Modernization of various customer interface systems (POS, non-CDD permitting, etc.)
Library, Community Services & Public Facilities
Civic Center Modernization
Corporation Yard Modernization
Fire Station Replacements/Rehabilitation
Gap funding for repairs to corporation yard
Golf building replacements
Branch Library operating and ongoing costs
Transportation, Streets & Infrastructure
Transportation Strategic Plan Projects
Bicycle CIP Improvement Program Projects
Downtown Specific Plan Projects
Traffic Signal Infrastructure Replacement
Sidewalk Repair
Street Maintenance (additional to maintain PCI)
Public Safety
Fully functioning Emergency Operations Center
Environment and Sustainability
CAP Program Funding
Water Infrastructure
Wastewater Collection Infrastructure
Stormwater Collection Infrastructure
Power Generation Facility Funding
Stormwater Program Funding
City of Sunnyvale FY 2017/18 Adopted Budget Overview
33

III. City Reserves The backbone of our financial planning process is the Twenty-Year Resource Allocation Plan. This planning
document provides the framework to maintain a structurally balanced budget by requiring financial discipline in making policy and service level decisions. One of the key components of the financial plans is the various reserves contained within each plan, which is considered a best practice. While many organizations have reserves, our use of them in this strategic and disciplined way is different and more active than a typical city. We maintain reserves for different purposes; some are restricted in use while others are available for a variety of priorities. Examples of restricted reserves include debt service reserves or reserves of special revenues. Unrestricted reserves are used strategically overthe twenty-year planning period to balance each fund. We plan to increase or decrease reserve levels as business and economic cycles pass, allowing us to provide a stable and consistent level of service. This is especially critical when several of our large revenue sources are volatile by nature. Reviewing reserves over a long period forces policymakers, staff and the community to think carefully before adding services that must be sustained through both periods of economic growth and recession.
In the General Fund, the unrestricted reserve is the Budget Stabilization Fund. Disciplined and strategic useof this reserve allowed us to weather the great recession, and is helping us to strategically add back services in a planned way to ensure sustainability over the long run. Most significantly, in this Adopted Budget and as directed by former Council actions, it helped manage the significant increase in projected pension costs. A Capital Improvement Projects Reserve is set-aside for land or property purchases in the downtown area with an emphasis on future income generation through economic development. Proceeds from surplus land sales are deposited into this reserve
In the utility funds, the use of the Rate Stabilization Reserves allow for the measured increase of rates to cover rapidly increasing costs such as wholesale water costs and tightening regulations on wastewater discharge. This reserve also allows us to incrementally increase rates to the level needed to support the significant debt service associated with the replacement of the WPCP. Capital reserves are also set-aside in the utility funds to fund projects in the event of an emergency or unanticipated circumstances.
In both of these cases, and throughout the budget, reserves also allow us to deal with unexpected expenditures.In the most extreme case, each significant fund carries large contingency reserves for emergencies such as natural disasters; however, reserves also allow us to address projects that may be more expensive than estimated or absorb unanticipated operating costs. In all cases, reserves are one of our most critical tools to achieve and maintain financial sustainability.
Conclusion This budget focuses on deploying resources strategically to meet the increasing demands of the community and
improve the City’s infrastructure while continuing to maintain a sustainable financial position for the long-term. The Adopted Budget resources the vast array of services the City provides and funds a wide variety of projects that improve our transportation, housing, and utility infrastructure, adds wonderful new amenities like the Washington Community Swim Center and a branch library, upgrades parks and recreational facilities, and more. Revenues are growing, asare expenditures, which requires that the City look critically at any actions taken to augment services and resource allocations. While this budget allows for some additional ongoing costs, it resolves projected pension and retireemedical liabilities that will continue into the future. This budget is both strategic in advancing the City Council’s goals, maintains services that the residents highly value, while also remaining fiscally prudent to sustain our service in the long-term.
We will continue to be faced with tough decisions regarding management of personnel costs, use of debt forlarge infrastructure needs and mitigating volatility in our major revenues. Our twenty-year planning allows us totake a balanced approach, to evaluate decisions in a long-term fiscal context and plan ahead. To that end, this budget presents a responsible, sustainable, and balanced plan for the future of Sunnyvale and, like many other California jurisdictions, more work is required to remain competitive and sustainable in future years.
City of Sunnyvale FY 2017/18 Adopted Budget Overview
34

Budget Summary

Revenue Sources:
Property Tax 68,974,004Water Supply and Distribution Fees 48,896,143Refuse Collection and Disposal Service Fees 46,904,122Wastewater Management Service Fees 38,323,356Sales Tax 32,776,458Bond Proceeds 37,840,000Local Agency - Transportation Grants 29,944,422Housing Mitigation Fee 21,515,745Federal Grants 16,959,574Park Dedication Fee 16,556,388State Revolving Loan Fund 15,760,000Transient Occupancy Tax 15,294,653Development Revenues 11,691,999Workforce Innovation and Opportunity Act Grant 10,500,000Franchise Fees 7,261,043Utility Users Tax 7,058,149Traffic Impact Fee 5,841,007Other Taxes 5,873,487Interest Income 3,545,640Rents and Concessions 3,158,455Recreation Service Fees 3,274,838Golf and Tennis Fees 2,820,294State Highway Users Tax (Gas Tax) 3,275,903Miscellaneous Revenues 2,584,850Other Fees and Services 2,416,638Sense of Place Fee 1,915,116State Shared Revenues 1,497,673Permits and Licenses 1,598,255Community Development Block Grant 1,000,000Fines and Forfeitures 996,876SMaRT Station Revenues 708,385Other Agencies Contributions 595,989BMR In-Lieu Fees 389,405HOME Grant 300,000Special Assessment 209,908
Use of Reserves 6,216,219
Total Revenue Sources* $474,474,994
* Excludes internal service fund revenues.
CITY OF SUNNYVALEFY 2017/18 BUDGET SUMMARY
35

CITY OF SUNNYVALEFY 2017/18 BUDGET SUMMARY
EXPENDITURES:
Operating Budget:
Office of the City Attorney $2,256,472
Office of the City Manager $4,840,753
Community Development DepartmentBuilding Safety 4,082,326Planning 3,234,720Housing and CDBG Program 1,425,723Community Development Department Management 544,238Total Community Development Department $9,287,007
NOVA Workforce Services Department $10,249,975
Finance DepartmentUtility Billing 2,735,748Accounting and Financial Services 2,132,144Purchasing 1,789,496Budget Management 1,053,951Revenue Collection and Audit 1,006,792Financial Management and Analysis 939,262Total Finance Department $9,657,393
Human Resources Department $4,846,658
Library and Community Services DepartmentLibrary 9,479,444Arts and Recreation Programs and Operation of Recreation Facilities 9,059,167Youth, Family and Child Care Resources 1,249,165Total Library and Community Services Department $19,787,776
Public Safety DepartmentPolice Services 32,314,247Fire Services 32,782,531Public Safety Administrative Services 6,503,263Investigation Services 5,123,761Community Safety Services 4,369,109Communication Services 4,301,891Records Management and Property Services 2,246,524Personnel and Training Services 2,210,305Fire Prevention Services 3,176,817Total Public Safety Department $93,028,448
36

CITY OF SUNNYVALEFY 2017/18 BUDGET SUMMARY
Operating Budget: (Continued)
Public Works DepartmentNeighborhood Parks and Open Space Management 10,246,090Pavement, Traffic Signs and Markings, Street Sweeping, and Roadside Easement 6,458,007Golf Course Operations 3,793,421Transportation and Traffic Services 3,058,195Street Tree Services 2,176,477Land Development - Engineering Services 2,161,090Street Lights 1,162,723Public Works Administration 926,238Downtown Parking Lot Maintenance 68,588Total Public Works Department $30,050,829
Environmental Services DepartmentSolid Waste Management* 37,341,978Wastewater Management 10,601,381Water Resources 7,294,877Wastewater Collection Systems 3,335,437Regulatory Programs 5,218,420Wholesale Water Purchases 29,964,066Total Environmental Services Department $93,756,159
Total Operating Budget** $277,761,469
* Solid Waste Management includes the City's share of SMaRT Station operating expenditures.** Excludes internal service fund operating budget.
37

CITY OF SUNNYVALEFY 2017/18 BUDGET SUMMARY
Projects Budget:
Capital Projects $67,210,969
Special Projects $24,686,250
Infrastructure Projects $90,447,009
Outside Group Funding $175,500
Project Operating ($225,546)
Council Service Level Set-Aside $100,000
Project Administration $3,452,578
Budget Supplements $1,015,000
Total Projects Budget* $186,861,760
Other Expenditures:
Debt Service $5,308,016
Lease Payments $2,589,837
Equipment $1,953,912
Total Other Expenditures $9,851,765
Total Expenditures $474,474,994
Total Budget $474,474,994
* Excludes internal services fund and SMaRT Station projects; but includes prior year carryover amounts
38
City Profile & Organization Chart

City ProfileThe City of Sunnyvale was incorporated December 24, 1912. The original
Charter of the City was prepared in accordance with the provisions of Section 8, Article XI of the Constitution of the State of California and became effective on May 18, 1949. The City operates under a Council-Manager form of government. Policy-making and legislative authority are vested with the City Council. There are seven Council Members elected by seat number for staggered four-year terms, with a two-term limit. The City Manager is responsible for carrying out the policies and ordinances of the City Council, for overseeing the day-to-day operations of the City, and for appointing the heads of various departments. The City Manager and City Attorney are appointed by the City Council.
A Brief HistorySunnyvale’s history has always been based on its economy. Initially, the
area’s vast open space and fertile soil were ideal for the fruit orchards that supported the settlement’s first residents. With the arrival of the railroad in 1864, the economic base of the community was able to expand, as canneries to process the fruit from the surrounding orchards were built near the rail lines. In 1906, the Hendy Iron Works relocated from San Francisco to Sunnyvale, continuing the area’s industrial development.
By 1940, the population had grown to about 4,400 and the Hendy Iron Works was taken over by Westinghouse to support the war effort. After the war, the defense-related industry arrived, capitalizing on the pleasant climate and Moffett Naval Air Station. Lockheed Missiles & Space Company moved to Sunnyvale in 1956, and soon became Sunnyvale’s largest employer. The 1950s and 1960s became the periods of largest growth for the community, resulting in a population of 96,000 in 1970.
The defense era gave way to the high-tech era when the microprocessor was introduced in 1971. During the years that followed, companies with foresight saw the potential of computers and the power of semiconductors. The City became the nexus of research, development and manufacturing that created Silicon Valley, and that legacy continues today in the era of the Internet.
Sunnyvale At A Glance• Region: The Heart of Silicon Valley
• Size: 24 Square Miles (Second largestcity in Santa Clara County, fifthlargest in the San Francisco Bay Area)
• Average Temperature: 71° (July) to53° (January)
• Residential Population: 149,831(Source: State Department of Financeestimate; valid until Spring 2018)
• Number of Businesses:Approximately 8,400
• Labor Force: Approximately 85,100
• Median Household Income: $105,401
• Bachelor or Higher Education:63 percent
• Libraries: 1
• Golf Courses: 2
• Parks: 23
• Elementary, Middle and HighSchools: 37 (public and private)
• Tennis Courts: 51 (16 at the world-class Tennis Center, and 35 at 15other locations)
• Sports Fields: 132 multi-purpose
• Restaurants: approximately 360
• Shopping Centers/Complexes: 52
• Hotels: 32 (total of 3,500 rooms)
San Francisco
Los Angeles
San Diego
Oakland
Sunnyvale San Jose
Sacramento
Bakers�eld
Santa Cruz
Lake TahoeSan
Francisco
SanJose
Oakland
Sunnyvale237
85
237
880
880
680
680
580
TO5
City of Sunnyvale City Profile
39

CITY MANAGER
BOARDS AND COMMISSIONS
BOARDS AND COMMISSIONS
(Required by Charter) Board of Library Trustees Heritage Preservation
Commission Parks and Recreation
Commission Personnel Board Planning Commission
CITY COUNCIL Elects the Mayor every two years
from one of its members
COMMUNITY DEVELOPMENT
Arts Commission Bicycle and Pedestrian
Advisory Committee Board of Building Code
Appeals Housing and Human
Services Commission Sustainability
Commission
Elect
Appoints
HUMAN RESOURCES
CITY OF SUNNYVALE ORGANIZATION CHART
SUNNYVALE CITIZENS
CITY ATTORNEY
LIBRARY AND COMMUNITY
SERVICES NOVA
WORKFORCE SERVICES
PUBLIC SAFETY
PUBLIC WORKS
ENVIRONMENTAL SERVICES
FINANCE
INFORMATION TECHNOLOGY
City Manager Appoints Department Heads
40

Pgm 702 Office of the City Manager
CITY MANAGER
COMMUNITY DEVELOPMENT HUMAN RESOURCES
CITY OF SUNNYVALE DEPARTMENT PROGRAMS
CITY ATTORNEY
LIBRARY AND COMMUNITY SERVICES
NOVA WORKFORCE
SERVICES PUBLIC SAFETY
PUBLIC WORKS
ENVIRONMENTAL SERVICES FINANCE
INFORMATION TECHNOLOGY
City Manager Appoints Department Heads
City Council Appoints
Pgm 360 Water Resources Pgm 363 Solid Waste Management Pgm 364 SMaRT Station Pgm 365 Wastewater Management Pgm 366 Regulatory Programs Pgm 367 Wastewater Collection Systems Pgm 396 Wholesale Water Purchases
Pgm 703 Budget Management Pgm 704 Purchasing Pgm 705 Financial Management & Analysis Pgm 706 Accounting & Financial Services Pgm 707 Revenue Collection & Audit Pgm 708 Utility Billing
Pgm 510 Employment Development
Pgm 119 Transportation & Traffic Services Pgm 120 Pavement Maintenance, Traffic Signs & Markings Pgm 121 Street Lights Pgm 219 Street Tree Services Pgm 256 Downtown Parking Lot Maintenance Pgm 267 Neighborhood Parks & Open Space Management Pgm 308 Public Works Administration Pgm 309 Capital Project Management Pgm 310 Land Development – Engineering Services Pgm 647 Golf Course Operations Pgm 709 Facility Services Pgm 763 Fleet Services
Pgm 233 Building Safety Pgm 234 Planning Pgm 235 Housing & CDBG Program Pgm 237 Community Development
Department Management
Pgm 746 IT Services & Support
Pgm 754 Human Resources
Pgm 471 Police Services Pgm 472 Fire Services Pgm 473 Community Safety Services Pgm 474 Personnel & Training
Services Pgm 475 Investigation Services Pgm 476 Communication Services Pgm 477 Public Safety I Hope No One
Can See t Administrative Services Pgm 478 Records Management &
Property Services Pgm 479 Fire Prevention Services
Pgm 527 Youth & Family Services Pgm 620 Library Pgm 626 Arts and Recreation Programs
Pgm 750 Office of the City Attorney
41

This Page Intentionally Blank
42

Community Condition Indicators
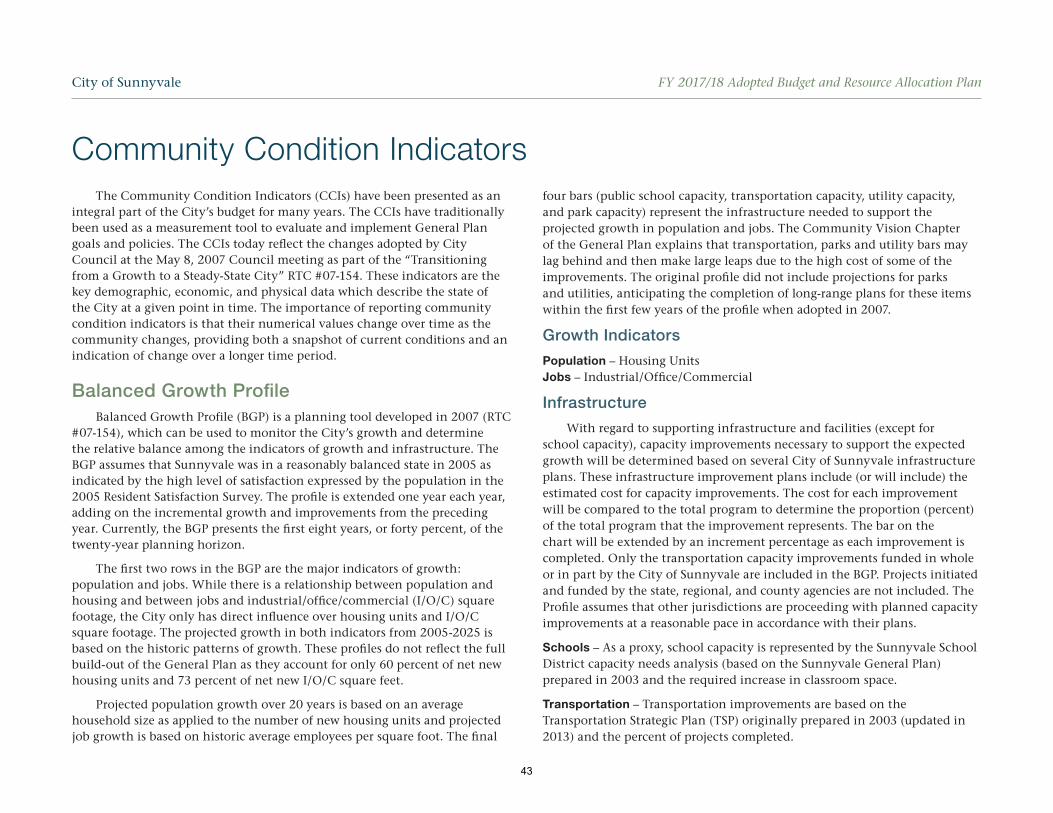
Community Condition Indicators The Community Condition Indicators (CCIs) have been presented as an
integral part of the City’s budget for many years. The CCIs have traditionally been used as a measurement tool to evaluate and implement General Plangoals and policies. The CCIs today reflect the changes adopted by CityCouncil at the May 8, 2007 Council meeting as part of the “Transitioningfrom a Growth to a Steady-State City” RTC #07-154. These indicators are thekey demographic, economic, and physical data which describe the state ofthe City at a given point in time. The importance of reporting community condition indicators is that their numerical values change over time as thecommunity changes, providing both a snapshot of current conditions and an indication of change over a longer time period.
Balanced Growth Profile Balanced Growth Profile (BGP) is a planning tool developed in 2007 (RTC
#07-154), which can be used to monitor the City’s growth and determinethe relative balance among the indicators of growth and infrastructure. TheBGP assumes that Sunnyvale was in a reasonably balanced state in 2005 asindicated by the high level of satisfaction expressed by the population in the 2005 Resident Satisfaction Survey. The profile is extended one year each year,adding on the incremental growth and improvements from the precedingyear. Currently, the BGP presents the first eight years, or forty percent, of thetwenty-year planning horizon.
The first two rows in the BGP are the major indicators of growth:population and jobs. While there is a relationship between population andhousing and between jobs and industrial/office/commercial (I/O/C) square footage, the City only has direct influence over housing units and I/O/Csquare footage. The projected growth in both indicators from 2005-2025 isbased on the historic patterns of growth. These profiles do not reflect the fullbuild-out of the General Plan as they account for only 60 percent of net new housing units and 73 percent of net new I/O/C square feet.
Projected population growth over 20 years is based on an averagehousehold size as applied to the number of new housing units and projectedjob growth is based on historic average employees per square foot. The final
four bars (public school capacity, transportation capacity, utility capacity, and park capacity) represent the infrastructure needed to support the projected growth in population and jobs. The Community Vision Chapter of the General Plan explains that transportation, parks and utility bars may lag behind and then make large leaps due to the high cost of some of the improvements. The original profile did not include projections for parks and utilities, anticipating the completion of long-range plans for these items within the first few years of the profile when adopted in 2007.
Growth Indicators
Population – Housing Units Jobs – Industrial/Office/Commercial
Infrastructure
With regard to supporting infrastructure and facilities (except for school capacity), capacity improvements necessary to support the expected growth will be determined based on several City of Sunnyvale infrastructure plans. These infrastructure improvement plans include (or will include) the estimated cost for capacity improvements. The cost for each improvement will be compared to the total program to determine the proportion (percent) of the total program that the improvement represents. The bar on the chart will be extended by an increment percentage as each improvement is completed. Only the transportation capacity improvements funded in whole or in part by the City of Sunnyvale are included in the BGP. Projects initiated and funded by the state, regional, and county agencies are not included. The Profile assumes that other jurisdictions are proceeding with planned capacity improvements at a reasonable pace in accordance with their plans.
Schools – As a proxy, school capacity is represented by the Sunnyvale School District capacity needs analysis (based on the Sunnyvale General Plan) prepared in 2003 and the required increase in classroom space.
Transportation – Transportation improvements are based on the Transportation Strategic Plan (TSP) originally prepared in 2003 (updated in 2013) and the percent of projects completed.
City of Sunnyvale FY 2017/18 Adopted Budget and Resource Allocation Plan
43

Parks – Council examined the desired amount of parks several times since 2007. Staff is currently in the process of identifying a tool for measuring park capacity improvements. The parks and open space capacity improvements plan is pending.
Utilities – The Water Utility Master Plan was adopted in 2010; the companion Wastewater Master Plan was adopted in 2015. Staff is currently in the process of identifying a tool for measuring utility capacity improvements.
Reading The Profile
The profile is divided into 20 segments, each representing one year (five percent) of the twenty-year timeline. The current year, 2016, is fifty percent of the profile. Each year the profile is updated to reflect the growth inpopulation, housing, I/O/C square footage, and jobs from the prior calendar year, along with the completed capacity improvements. If all elements were growing in a balanced manner, all of the bars in the profile would be of equal length every year, extending exactly to the then current year.
This will not always be the case. An imbalance in a single year does not signify a problem. Animbalance over multiple years, however, could be a concern to decision-makers, who may want to consider modifications of development policy orpriorities to infrastructure improvements to respond to the rate of growth. As the Sunnyvale Community Vision is updated in the future, or as General Plan element updates result in different projected goals for 2025, the BGP must be recalibrated to reflect revised projected increases.
Readers may want to compare the physical changes (housing units andI/O/C square footage) to the occupancy of these structures (population and jobs) to aid in understanding growth in the community. For example, the housing units are below the current year mark yet the population bar exceeds the same mark; note too that the public school capacity improvements are also above the current year mark. Because all of the data is not available regarding other infrastructure it is premature to gauge whether there is a lack of balance relative to this infrastructure.
City of Sunnyvale FY 2017/18 Adopted Budget and Resource Allocation Plan
44

CURRENT BALANCED GROWTH PROFILE (January 1 to December 31, 2016)
Balanced Growth IndicesBase Year
2005GOAL FOR
2025
Total Planned Growth Net
Increase 2005 to 2025 2007 Actual 2008 Actual 2009 Actual 2010 Actual 2011 Actual 2012 Actual 2013 Actual 2014 Actual 2015 Actual 2016 Actual
2016 Increment Increase
(actual since 2015)
2016 Increment
(% of Total Planned Growth)
Park Capacity Improvements n/a n/a n/a n/a n/a n/a n/a n/a n/a n/a n/a n/a n/a n/a
Utility Capacity Improvements n/a n/a n/a n/a n/a n/a n/a n/a n/a n/a n/a n/a n/a n/a
Transportation Capacity Improvements
$46,884,000 $46,884,000 $547,970 $547,970 0 0 0 0 0 0 0 0 0 0%
Public School Capacity 5,373 6,729 1,356 5,535 5,535 5,905 6,051 6,083 6,291 6,315 6,315 6,369 6,369 0 0%
Annual Tax Revenue1 $72,271,030 $174,748,212 $102,477,182 $82,731,078 $86,536,989 $80,080,423 $80,640,616 $83,447,216 $85,189,946 $87,277,140 $90,536,760 $96,255,557 $103,856,328 $7,600,771 7%
Retail/Service Floor Area2 5,784,000 7,500,000 2,200,000 5,962,662 5,962,662 5,962,662 5,976,840 6,027,052 6,005,338 6,000,788 5,978,104 6,142,624 6,126,545 -16,079 -1%
Office/Industrial Floor Area 30,100,000 37,700,000 7,600,000 30,327,927 30,673,881 31,973,881 31,979,928 32,009,556 32,058,721 32,568,435 32,368,012 32,580,601 32,003,340 -577,261 -8%
Housing Units 54,800 61,900 7,100 55,261 55,501 55,658 55,818 56,271 56,886 57,075 57,650 58,184 58,495 311 4%
Jobs3 73,630 92,650 19,020 n/a n/a n/a 77,890 78,322 80,104 82,532 84,276 n/a n/a n/a n/a
Population 132,725 150,725 18,000 135,721 137,538 138,826 140,081 141,099 142,896 145,973 147,055 148,028 148,372 344 2%
0% 5% 10% 15% 20% 25% 30% 35% 40% 45% 50% 55% 60% 65% 70% 75% 80% 85% 90% 95% 100%
Park Capacity Improvements
Utility Capacity Improvements
Transportation Capacity Improvements
Public School Capacity
Annual Tax Revenue1
2
3
Retail/Service Floor Area
Office/Industrial Floor Area
Housing Units
Jobs
Population
Cumulative Increase 2005-2016 (Expressed as % of Total Planned Growth)
Balanced growth scenario for 2016.4
20062007200820092010201120122013201420152016
Notes1. FY 2004/2005 is the base year for the Balanced Growth Index. All revenues are converted to FY 2004/2005 dollars for comparison purposes.2. This index only represents net new floor area, and does not reflect tenant improvements to existing floor area. 3. Data has been modified resulting in a decrease in base year, projections, and current year estimates. Association of Bay Area Governments (ABAG) data from 2010 and earlier. US Census data from 2011 to present. 2016 data not yet available.4. In a “balanced growth scenario” each profiled item would increase 5% each year. Cumulative “balanced growth” to the end of 2016 would be 50%.
City of Sunnyvale FY 2017/18 Adopted Budget and Resource Allocation Plan
45

# INDICATOR 1990 2000 2006 2007 2008 2009 2010 2011 2012 2013 2014 2015 2016 SOURCE/NOTES
POPULATION
Number
1 • Total 117,229 131,760 133,544 135,721 136,352 138,826 140,081 141,099 142,896 145,973 147,055 148,028 148,372 CA Dept of Finance (Decennial Census used every 10 years, CA Dept of Finance estimate used in the interim)
2 – Under 18 years (%) 19.2 20.4 16.5 21.1 22.1 23.6 22.4 22.4 22 20.5 25.8 22.4 N/A 2015 updated with 2015 American Community Survey 1-Year Estimates; 2016 American Community Survey 1-Year Estimates not yet available
3 – 19 – 64 years (%) 70.4 69 72.7 68.9 66.8 66.1 66.4 66.9 67 65.4 63.1 66.1 N/A Same as above
4 – 65 years and older (%) 10.4 10.6 10.8 10 11.1 10.3 11.2 10.7 11 14.1 11.1 11.5 N/A Same as above
5 • Average household size 2.42 2.49 2.43 2.63 2.54 2.72 2.61 2.68 2.6 2.6 2.74 2.74 N/A Same as above
6 • Sunnyvale public school enrollment N/A N/A 12,128 12,725 12,320 13,404 13,700 14,031 14,343 15,129 14,721 15,176 15,005 CA Dept of Education
7 • Sunnyvale private school enrollment N/A N/A 4,079 4,025 3,811 3,802 3,726 N/A 3,858 4,011 4,118 N/A 4,748 Private School Universe Survey (nces.ed.gov). As of November 2016.
Ethnicity/Origin
8 • Caucasian (%) 71.6 53.3 45.8 45.8 43.0 40.8 43.0 47.3 45.0 46.7 50.1 47.1 N/A 2015 updated with 2015 American Community Survey 1-Year Estimates; 2016 American Community Survey 1-Year Estimates not yet available
9 • Asian / Pacific Islander (%) 19.3 32.6 36.5 39.9 39.1 42.0 41.4 41.7 41.1 42.2 42.2 42.6 N/A Same as above
10 • African-American (%) 3.4 2.2 3.9 2.8 1.8 1.4 2.0 1.3 2.0 2.6 1.6 2.0 N/A Same as above
11 • Other (%) 5.7 11.9 13.8 11.5 16.1 15.7 13.6 9.7 11.9 8.5 6.1 8.3 N/A Same as above
12 • Foreign Born (%) 22.5 39.4 41.8 46.3 43.7 42.9 42.2 45.5 44.5 44.2 44.5 45.5 N/A Same as above
13 • Hispanic Origin (%) 13.2 15.5 18.1 13.8 16.1 18.8 18.9 20.4 18.3 13.7 18.3 17.9 N/A Same as above
City of Sunnyvale FY 2017/18 Adopted Budget and Resource Allocation Plan
46

# INDICATOR 1990 2000 2006 2007 2008 2009 2010 2011 2012 2013 2014 2015 2016 SOURCE/NOTES
Education
14 • High school graduate or higher (%) 87.1 89.4 90 90.7 90.4 89.5 92.7 91.6 89.4 92.1 92.3 91.8 N/A 2015 updated with 2015 American Community Survey 1-Year Estimates; 2016 American Community Survey 1-Year Estimates not yet available
15 • Bachelor degree or higher (%) 37.1 50.8 52.2 58.3 55.1 55.5 56.7 58.9 50.8 59.6 62.5 62.6 N/A Same as above
16 • Graduate degree (%) N/A 21.9 24.4 27 26.3 25.9 26.5 30.1 21.9 27.6 32.9 32.7 N/A Same as above
Income
17 • Median household income ($) 46,403 74,409 79,926 87,417 89,543 88,364 95,582 93,836 101,611 100,043 104,681 112,217 N/A 2015 updated with 2015 American Community Survey 1-Year Estimates; 2016 American Community Survey 1-Year Estimates not yet available
18 – Population below poverty (%) 2.5 3.8 8.2 5.0 4.3 6.8 8.0 8.5 7.8 8.1 7.1 7.3 N/A Same as above
Community
19 • Active neighborhood and business associations
N/A N/A 28 30 30 29 28 28 30 29 30 28 30 LCS; 27 active neighborhood associations; 3 active business associations(Sunnyvale Downtown Association, Auto Dealers Association and Moffett Park Business Group).
20 • Residents rating city good place to live (%)
N/A 92 N/A 93 92 87 N/A 92 N/A 94.0 94.0 90.0 90.0 National Citizen Survey; Available every 2 years from 2009 (2016 data not available - 2015 data repeated)
21 • Residents rating public services good to excellent (%)
N/A 92 N/A 82 85 83 N/A 85 N/A 86.0 86.0 78.0 78.0 Same as above
22 • Part I crimes N/A N/A 2,170 2,070 2,040 2,130 2,444 2,150 2,752 2,953 2,871 2,530 2,315 DPS; Calendar Year as reported to DOJ
23 • Average emergency police response time (minutes)
N/A N/A 4:06 4:17 4:38 4:41 4:35 4:57 4:47 5:06 4:40 4:40 5:05 DPS; Calendar Year
City of Sunnyvale FY 2017/18 Adopted Budget and Resource Allocation Plan
47

# INDICATOR 1990 2000 2006 2007 2008 2009 2010 2011 2012 2013 2014 2015 2016 SOURCE/NOTES
ECONOMY
Jobs
24 • Total number N/A 99,290 N/A N/A N/A N/A 77,890 78,322 80,104 82,532 84,276 N/A N/A US Census Longitudinal Employer-Household Dynamics from 2011 to present. 2015 and 2016 data not yet available. Association of Bay Area Governments (ABAG) data from 2010 and earlier.
Employment
25 • Labor Force N/A N/A N/A N/A 75,700 74,900 74,600 76,600 78,600 79,300 83,100 85,200 87,183 Annual average; Source: EDD Labor Market Info Div
• Employed Residents N/A N/A N/A N/A 71,800 67,800 67,400 70,200 73,000 74,600 79,200 82,000 84,292 Same as above
• Unemployed (% of labor force) 2.6 4.3 3.9 4.3 5.1 9.4 9.6 8 7.1 5.8 4.7 3.7 3.4 Same as above
26 • Jobs/employed resident N/A N/A N/A N/A N/A N/A 1.2 1.1 1 1.1 1 N/A N/A #24 divided by #25 Employed Residents
27 • Employed residents working in Sunnyvale (%)
N/A 23 N/A N/A N/A N/A 25.8 26.6 19.6 N/A 22.9 24.6 N/A 2015 updated with 2015 American Community Survey 1-Year Estimates; 2016 American Community Survey 1-Year Estimates not yet available
28 • Employed residents in service jobs (%)
N/A 8.9 N/A N/A 7.8 10.9 10.6 12.2 11.8 12 9.4 13.4 N/A Same as above
29 • Employed residents in management/professional jobs (%)
N/A 59.5 N/A N/A 60.1 59.6 57.1 59.4 59.7 61 66 64.9 N/A Same as above
Retail
30 • Retail & restaurant sales volume ($ in millions)
N/A 158.6 153.7 163.9 152.6 129.2 137.6 147.7 149.4 152.8 162 163 161 HDL Business License Database
31 • Sales/sq. ft. ($) N/A 51.2 25.8 27.5 25.6 21.7 23.0 24.5 24.9 25.5 27.1 26.6 26.3 Same as above
City of Sunnyvale FY 2017/18 Adopted Budget and Resource Allocation Plan
48

# INDICATOR 1990 2000 2006 2007 2008 2009 2010 2011 2012 2013 2014 2015 2016 SOURCE/NOTES
Hospitality
32 • Total Number of Hotel Rooms N/A 3,835 3,930 3,923 3,378 3,394 3,290 3,290 3,290 3,217 3,256 3,525 3,330 Econ Dev - TOT Report; 2016 Hotel rooms - excluded Airbnb units
33 • Average hotel occupancy (%) N/A N/A 72 63.27 64 57.6 62.2 71.2 72.1 77.1 78.7 79.8 76.4 Econ Dev; Average hotel occupany rates from hotels with 100+ rooms - calendar year
Real Estate
34 • Total assessed value ($ in billions) N/A N/A 20.71 22.67 24.73 25.90 25.62 25.93 26.90 29.25 31.43 34.80 38.20 SCC Assessor’s Annual Report
35 • Vacant office, industrial, R&D (%) 11.7 2 12.2 13.6 17.1 20.6 18.8 N/A 8.8 8.3 6.6 6 3.6 CoStar Real Estate Web
– Vacant office (%) N/A N/A N/A 9.7 13 19 18.6 16.4 7.0 9.3 5.6 6.8 2.2 CoStar Real Estate Web
– Vacant industrial/R&D (%) N/A N/A 12.2 11.1 13.8 15.3 13 12.8 9.8 7.8 7.1 5.2 4.3
36 • Average office/industrial rent ($/sq. ft.) 0.71 3.47 1.48 2.09 2.77 1.93 1.76 N/A 2.03 2.30 2.55 3.39 3.15 CoStar Real Estate Web
– Average office rent ($/sq. ft.) N/A N/A N/A 2.89 2.87 2.52 2.57 2.51 3.54 3.70 4.11 4.22 5.06 CoStar Real Estate Web
– Average industrial/R&D rent ($/sq. ft.)
N/A N/A 1.48 1.32 1.32 1.10 1.08 1.17 0.51 1.41 1.59 2.55 1.93 Same as above
37 • Average apartment rent (3 bedroom) ($)
N/A 2,600 1,822 2,138 2,380 2,093 2,209 2,456 2,662 3,092 3,370 3,448 3,770 RealFacts, From BB CIR Appx.22 2Q 2016
38 • Housing rental vacancy rate (%) N/A N/A 2.37 2.72 4.7 5.1 3.4 3.5 3.9 5.4 3.9 3.6 4.2 RealFacts, From BB CIR Appx.22 2Q 2016
39 • Median single-family detached home price ($)
N/A 618,000 835,000 850,538 901,000 750,000 795,000 785,000 865,000 1,012,500 1,218,000 1,365,280 1,467,500 ReReport.com (Closed sales per MLS for Sunnyvale only, Dec 2016)
40 • Median single-family attached home (townhouse/condo) price ($)
N/A 390,000 555,000 565,468 562,000 496,250 472,000 460,000 519,000 643,500 793,300 966,000 955,000 Same as above
41 • Valuation of new construction permitted ($ in millions)
16.3 235.9 101.4 335.7 280.3 66.7 121.3 190.4 224.6 202.2 321.6 302.5 251.2 CDD SunGIS
Tax Base
42 • Property tax revenue ($ in millions) 15.8 18.7 32 35.8 39.95 42.26 43.7 42.4 43.4 47.6 50.3 54.9 62.4 FIN; FY 15/16 - General Fund Long Term Financial Plan
43 • Sales tax revenue ($ in millions) 21.5 30 28.4 30.8 29.71 25.07 25.43 29.2 30.3 30.0 30.2 29.7 31.4 Same as above
44 • Transient occupancy tax revenue ($ in millions)
3.6 9.8 5.6 6.4 7.35 5.69 5.58 6.6 7.8 9.0 10.9 14.1 16.3 Same as above
City of Sunnyvale FY 2017/18 Adopted Budget and Resource Allocation Plan
49

# INDICATOR 1990 2000 2006 2007 2008 2009 2010 2011 2012 2013 2014 2015 2016 SOURCE/NOTES
PHYSICAL CITY
Land Use
45 • Land area (sq. mi.) 22.81 22.82 22.86 22.86 22.86 22.86 22.86 22.86 22.86 22.86 22.86 22.86 22.87 Butcher’s Corner Annexation
46 – Developable land area (sq. mi.) 15.46 15.46 15.46 15.46 15.46 15.46 15.46 15.46 15.46 15.46 15.46 15.46 15.47 CDD SunGIS. Vacant includes sites Under Construction (i.e. Downtown, Moffett Place, Moffett Towers II, The Vale, Central & Wolfe, 520 and 620 E. Weddell and other industrial to residential sites). Butcher’s Corner added to developable land area.
47 • Vacant land area (%) 0.8 0.8 0.8 0.8 0.8 0.8 1 0.6 0.7 0.9 1.6 2.0 2.8 Same as above
48 • Residential area (%) N/A 52.7 52.4 52.6 55 55 52.8 53.7 53.7 53.7 54.0 54.1 54.1 Same as above
49 • Office/industrial land area(%) N/A 24.2 26.2 26 25.2 25.2 25.1 25.2 25.2 25.0 24.2 23.9 23.1 Same as above
50 • Retail/service land area (%) N/A 7.5 6.8 6.8 6.5 6.5 6.5 6.5 6.5 6.5 6.4 6.4 6.4 Same as above
51 • City parks and open space (%) N/A 7.4 7.4 7.4 7.4 7.4 7.4 7.4 7.4 7.4 7.4 7.4 7.4 Same as above
52 • Other (%) N/A 7.4 7 7 5.7 5.7 7.4 6.7 6.6 6.6 6.4 6.2 6.2 Same as above
Transportation
53 • Vehicle miles traveled in weekday (millions of miles)
N/A 2.31 2.25 2.28 2.21 1.83 1.97 2.28 1.86 2.05 2.06 2.01 2.09 DPW Traffic
54 • Intersections not meeting LOS standards
1 1 0 N/A 0 N/A 0 N/A 0 N/A N/A N/A N/A DPW Traffic; CMP intersection monitoring conducted every 2 years by VTA
55 • Transit boardings/de-boardings per day
N/A 25,122 19,824 22,428 24,580 21,647 22,405 22,158 25,426 30,698 N/A 24,931 25,359 VTA & Caltrain
56 • Miles of streets 300 300 300 300 300 300 300 300 300 300.8 300.8 300.8 300.8 DPW Traffic
57 • Miles of bikeways N/A 65 79 82.9 83.1 83.8 84.2 85.2 87.9 88.2 88.2 88.2 100.8 DPW Traffic
City of Sunnyvale FY 2017/18 Adopted Budget and Resource Allocation Plan
50

# INDICATOR 1990 2000 2006 2007 2008 2009 2010 2011 2012 2013 2014 2015 2016 SOURCE/NOTES
Housing
58 • Total housing units N/A 53,474 55,045 55,261 55,501 55,658 55,818 56,271 56,886 57,075 57,650 58,184 58,495 CDD SunGIS ; Townhomes and Condos include Arques Place (Fair Oaks & Arques), and a portion of Sandalwood(Evelyn west of Wolfe). Rental apartments include Onizuka Crossing (Maude & Wolfe), 560 S. Mathilda, and 481 Mathilda (Olive and Mathilda). Closure of Nick’s Trailer Park reflected in mobile home count.
59 – Single-family detached (includes accessory living units)
N/A 21,091 21,265 21,276 21,299 21,324 21,351 21,360 21,375 21,424 21,446 21,456 21,487 Same as above
60 – Townhomes and Condos (ownership)
N/A 4,755 5,240 5,701 5,918 6,050 6,183 6,311 6,483 6,623 6,693 6,880 7,018 Same as above
61 – Mobile Homes N/A 4,056 3,989 3,960 3,960 3,960 3,960 3,960 3,960 3,960 3,960 3,960 3,916 Same as above
62 – Duplexes N/A 1,598 1,598 1,598 1,598 1,598 1,598 1,598 1,598 1,598 1,600 1,600 1,608 Same as above
63 – Three or more attached units (rental)
N/A 20,949 21,704 21,477 21,477 21,477 21,477 21,669 22,097 22,097 22,578 22,856 23,034 Same as above
64 – Specialty units (i.e. senior/affordable housing developments)
N/A 1,025 1,249 1,249 1,249 1,249 1,249 1,373 1,373 1,373 1,373 1,432 1,432 Same as above
65 • Owner occupied (%) 48.9 47.6 50.2 48.9 52.3 49.6 48.0 47.0 47.4 46.9 46.5 44.7 N/A 2015 updated with 2015 American Community Survey 1-Year Estimates; 2016 American Community Survey 1-Year Estimates not yet available
66 • Over 20 years old (%) N/A 83 88 88 90 90 90 92 92 90 90 91 92 CDD SunGIS
67 • Total affordable units N/A N/A 1,452 1,452 1,412 1,688 1,774 1,753 1,845 1,860 1,879 1,950 2,035 CDD Housing Div (pre-2009 data did not include BMR homeowner units)
68 • New units receiving building permits N/A 504 276 305 360 118 853 490 217 661 790 862 248 CDD SunGIS
69 – Intended for ownership N/A 57 276 305 360 118 109 211 217 145 271 192 248 Same as above
70 – Rental N/A 447 0 0 0 0 744 279 0 516 519 671 0 Same as above
City of Sunnyvale FY 2017/18 Adopted Budget and Resource Allocation Plan
51

# INDICATOR 1990 2000 2006 2007 2008 2009 2010 2011 2012 2013 2014 2015 2016 SOURCE/NOTES
Office/Industrial
71 • Total floor area (sq. ft. in millions) N/A 42.7 45.2 45.2 45.6 46.9 46.9 46.9 46.9 47.5 47.3 47.5 46.9 CDD SunGIS; Moffett Place, Moffett Gateway buildings; demolition of DeGuigne and Central & Wolfe buildings. 2000 to 2016 data adjusted to reflect recently adopted LUTE.
72 – Class A (%) N/A N/A 17.2 N/A N/A N/A N/A N/A N/A N/A N/A N/A N/A Econ Dev
73 • New floor area permitted (sq. ft.) N/A 660,975 146,368 2,780,657 831,705 675 29,278 774,098 1,070,523 671,402 1,398,987 829,323 1,152,117 Building permits; CDD SunGIS
74 • No. of patents received 413 3,034 3,626 3,177 3,177 3,556 4,795 5,017 5,448 6,199 6,973 6,686 7,018 U.S. Patent and Trademark Office; Calendar Year
Retail/Services
75 • Total floor area (sq. ft. in millions) N/A 3.1 5.95 5.96 5.96 5.96 5.98 6.03 6.01 6.00 5.97 6.13 6.11 CDD SunGIS; Demolition of Evelyn buildings
76 • Floor area/capita (sq. ft.) N/A N/A 44.6 43.9 43.7 42.9 42.7 42.7 42.0 41.1 40.6 41.4 41.2 #75 divided by #1
77 • New floor area permitted (sq. ft.) N/A 0 8,000 5,000 293,000 229,494 127,838 0 12,000 49,496 0 0 0 Building permits; CDD SunGIS
Environment
78 • Sunny days N/A N/A 300 292 293 293 272 286 293 327 293 316 299 www.wunderground.com
79 • Rainfall (in.) N/A 13.12 8.15 6.42 9.42 10.25 11.12 10.75 17.36 12.28 11.85 6.42 15.28 ESD/SCVWD
80 • Days ozone standard exceeded N/A N/A 3 0 0 0 0 0 0 0 0 0 0 BAAQMD
81 • Recycled solid waste (%) 18 56 63 63 63 65 67 66 65 65 64 65 N/A Calrecycle: data available in September of each year; 2015 updated
• Disposal per resident (lbs/day) N/A N/A N/A 4 4 3.5 3.3 3.4 3.5 3.5 3.6 3.5 N/A Same as above
• Disposal per person employed within the city (lbs/day)
N/A N/A N/A 6.3 6.5 6.5 6.3 5.8 6 6.3 6.1 5.9 N/A Same as above
82 • Number of street trees N/A 36,341 37,000 37,000 36,935 36,889 36,889 37,000 37,000 37,000 37,000 37,000 37,000 Approximate; DPW Trees
83 • Average daily water consumption/capita (gal.)
N/A 161 139 153.18 153.7 145.42 130.71 127.15 128.60 130.95 115.39 94.21 99.22 ESD
84 • Average daily electric energy use/capita (kwh)
N/A N/A 33.16 71.6 81.1 79.7 78.6 80.2 78.3 77.5 74.5 72.2 69.1 ESD/PG&E; Whole City.
85 • Average daily gas use/capita (therms) N/A N/A N/A 1.9 2.9 2.8 2.8 2.9 2.9 2.9 2.6 2.6 2.6 ESD/PG&E; Whole City.
86 • Average daily landings at Moffett Federal Airfield
N/A 33 25 26 23 19 15 17 N/A N/A N/A 12 11 Moffett Field - Planetary Ventures
City of Sunnyvale FY 2017/18 Adopted Budget and Resource Allocation Plan
52

Summary of Budgeted
Personnel Hours

SUMMARY OF BUDGETED PERSONNEL HOURS Overview The City of Sunnyvale budgets by work hours, not by position. This enables staff to more accurately determine the amount of time required to provide a service. In order to manage the positions, staff develops a budgeted position allocation by Department after the adoption of the budget. Beginning in FY 2014/15, the City revised the level of productive hours per position to more accurately reflect current conditions. The budgeted position allocation calculates full-time (FTE) and part-time (PTE) equivalents using the following standards:
FY 2012/13 – FY 2013/14 FY 2014/15 – FY 2017/18 • Management Staff 1,850 hours equals one FTE 1,790 hours equals one FTE • Non-management Staff 1,800 hours equals one FTE 1,760 hours equals one FTE • Public Safety Officers 1,900 hours equals one FTE 1,835 hours equals one FTE • Part-time Staff 1,090 hours equals one PTE 1,090 hours equals one PTE
Staffing Trends The tables on the following page show the budgeted position allocation for full-time and part-time positions, by Department, and by employment status on a City-wide basis. Two years of actual data, as well as the current and budget years’ data are presented. The values reflected in the Actual FY 2014/15 and Actual FY 2015/16 columns are actual, filled positions in each department/job category as of the end of the fiscal year. The values in the Current FY 2016/17 and Budget FY 2017/18 columns are the budgeted positions in each department/job category. As of July 1st, 2017, the City had 824 active employees. The difference between the actual positions and the budgeted positions is predominantly due to vacancies.
53

BUDGETED PERSONNEL HOURS FY 2014/15 — FY 2017/18
Total Personnel by Department Total Personnel by Employment Status
Actual FY
2014/15
Actual FY
2015/16
Current FY
2016/17
Budget FY
2017/18
Office of the City Attorney
6 6 6 7
Office of the City Manager
17 18 18 17
Community Development
36 41 45 46
Environmental Services
105 118 120 123
Finance
47 50 54 55
Human Resources
16 18 20 20
Information Technology
22 22 23 27
Library and Community Services
88 100 100 100
NOVA Workforce Services
32 43 44 44
Public Safety
271 285 288 291
Public Works
168 186 186 187
Totals
808 887 904 917
Actual FY
2014/15
Actual FY
2015/16
Current FY
2016/17
Budget FY
2017/18
Management
82 96 100 102
Non-Management
483 538 551 563
Part-Time Staff
46 52 52 51
Public Safety Officers
197 201 201 201
Totals
808 887 904 917
54

Financial Graphs

City of SunnyvaleFY 2017/18 Budget
Financial Graphs
General $150,930,278
32%
Solid Waste Management$47,859,252
10%Water Supply &
Distribution$49,427,172
10%
Wastewater Management$92,941,086
20%
Other**$32,092,695
7%
Development Enterprise
$11,955,029 2%
Capital Projects
$52,475,943 11%
Employment Development$10,500,000
2%
Park Dedication
$16,996,995 4%
Golf and Tennis$3,080,325
1%Use of Reserves
$6,216,219 1%
Graph 1.1 Revenues by Fund – All Funds*
Total Revenues$474,474,994
*Excludes internal service fund charges and inter-fund transfers
**Other includes CDBG, Housing, Gas Tax, Youth and Neighborhood Services, CFD #3, TDA Article 3, and various other minor funds
General Fund$169,911,509
36%
Solid Waste Management$42,359,367
9%Water Supply & Distribution$44,499,103
9%
Wastewater Management$84,336,422
18%
Other**$17,461,739
4%
Employment Development$10,249,975
2%
Golf and Tennis$3,793,421
1%
Development Enterprise
$11,569,284 2%
Infrastructure$24,473,824
5% Capital Projects$65,820,350
14%
Graph 1.2 Expenditures by Fund – All Funds*
Total Expenditures$474,474,994
*Excludes internal service fund operating budgets and inter-fund transfers
**Other includes Gas Tax, Youth and Neighborhood Services, Park Dedication, Capital Projects, Infrastructure Renovation & Replacement, and various other minor funds 55

City of SunnyvaleFY 2017/18 Budget
Financial Graphs
Service Fees$200,545,050
42%
Taxes$133,462,564
28%
Federal / State $76,557,657
16%
Franchises / Rents$10,419,498
2%
SMaRT Station® Reimbursement
$708,385 0%
Other Revenues **$2,584,850
1%Interest Income
$3,545,640 1%
Fines / Licenses / Permits$2,595,131
1%
Use of Reserves
$6,216,219 1%
Bond Proceeds$37,840,000
8%
Graph 1.3 Revenues by Source – All Funds*
Total Revenues$474,474,994
*Excludes internal service fund charges and inter-fund transfers
**Other includes CDBG, Housing, Gas Tax, Youth and Neighborhood Services, CFD #3, TDA Article 3, and various other minor funds
Operating$277,761,469
58%
Projects & Equipment$188,715,673
40%
Debt Service & Other Expenditures$7,997,852
2%
Graph 1.4 Expenditures by Type – All Funds*
Total Expenditures$474,474,994
*Excludes internal service fund operating budgets and inter-fund transfers
56

City of SunnyvaleFY 2017/18 Budget
Financial Graphs
Service Fees$200,545,050
42%
Federal / State$76,557,657
16%
Franchise / Rents$10,419,498
2%
SMaRT Station Reimbursement
$708,385 0%
Bond Proceeds$37,840,000
8%
Other Revenues**$2,584,850
1%
Interest Income$3,545,640
1%Fines / Licenses / Permits
$2,595,131 1%
Use of Reserves$6,216,219
1% Property Tax$68,974,004
15%
Sales Tax$32,776,458
7%
Utility Users Tax$7,058,149
1%
Transient Occupancy Tax$15,294,653
3%
Other Taxes***$9,359,299
2%
Taxes$133,462,564
28%
Graph 1.5 Revenues by Source – Taxes by Category*
Total Revenues$474,474,994
*Excludes internal service fund charges and inter-fund transfers
**Other Revenues include Miscellaneous Revenues, SMaRT Station Revenues and Other Agencies Contributions
***Other Taxes include Gas Tax, Construction Tax, Business License Tax, Real Property Transfer Tax, and Special Assessments
Taxes by Category*
57

City of SunnyvaleFY 2017/18 Budget
Financial Graphs
Taxes$133,462,564
28%
Federal / State$76,557,657
16%
Franchise / Rents$10,419,498
2%
Bond Proceeds$37,840,000
8%
Other Revenues**$3,293,235
1%
Interest Income$3,545,640
1%
Fines / Licenses / Permits$2,595,131
1%Use of Reserves
$6,216,219 1% Refuse Service Fees
$46,904,122 10%
Water Service Fees$48,896,143
10%
Sewer Service Fees$38,323,356
8%
Parkd Dedication Fees$16,556,388
3%
Other Service Fees***$49,865,041
11%
Service Fees$200,545,050
42%
Graph 1.6 Revenues by Source – Service Fees by Category*
Total Revenues$474,474,994
* Excludes internal service fund charges and inter-fund transfers
** Other Revenues include Miscellaneous Revenues, SMaRT Station Revenue, SMaRT Station Reimbursement and Other Agencies Contributions
*** Other Service Fees include Traffic Impact Fees, Sense of Place Fees, Housing Mitigation Fees, BMR In-Lieu Fees, Recreation Service Fees, Golf & Tennis Service Fees, and Development Fees
Service Fees by Category*
58
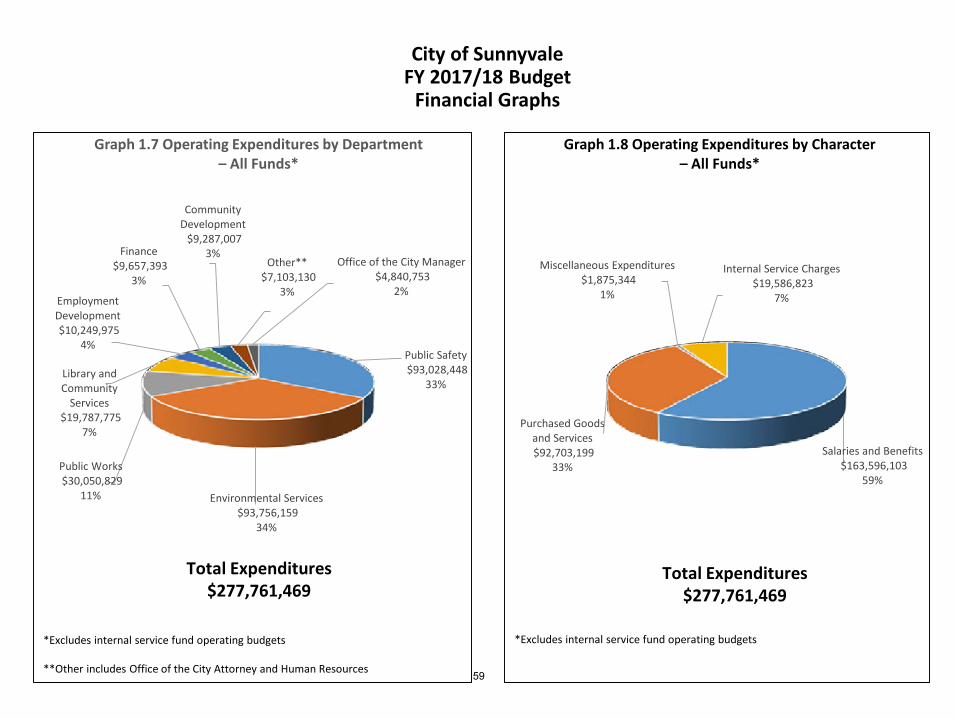
City of SunnyvaleFY 2017/18 Budget
Financial Graphs
Public Safety$93,028,448
33%
Environmental Services$93,756,159
34%
Public Works$30,050,829
11%
Library and Community
Services$19,787,775
7%
Employment Development$10,249,975
4%
Finance$9,657,393
3%
Community Development
$9,287,007 3%
Other**$7,103,130
3%
Office of the City Manager$4,840,753
2%
Graph 1.7 Operating Expenditures by Department – All Funds*
Total Expenditures$277,761,469
*Excludes internal service fund operating budgets
**Other includes Office of the City Attorney and Human Resources
Salaries and Benefits$163,596,103
59%
Purchased Goods and Services$92,703,199
33%
Miscellaneous Expenditures$1,875,344
1%
Internal Service Charges$19,586,823
7%
Graph 1.8 Operating Expenditures by Character – All Funds*
Total Expenditures$277,761,469
*Excludes internal service fund operating budgets
59

City of SunnyvaleFY 2017/18 Budget
Financial Graphs
Property Tax$68,974,004
46%
Sales Tax$32,776,458
22%Utility Users Tax$7,058,149
5%
Other Revenues**$598,715
0%
Transient Occupancy Tax
$15,294,653 10%
Franchise Fees / Rents &
Concessions$9,919,515
6%
Fines / Licenses / Permits$2,595,131
2% Interest Income
$1,567,655 1%
Other Taxes***$5,873,487
4%Recreation Fees
$3,249,267 2%
Service Fees$2,380,707
2%Federal / State
$642,537 0%
Graph 2.1 Revenues by Source – General Fund*
Total Revenues$150,930,278
*Excludes internal service fund charges and inter-fund revenues, and transfers from other funds
** Other Revenues include Damage to City Property and various miscellaneous categories
***Other Taxes include Business License, Construction, and Real Property Transfer taxes
Public Safety$91,552,886
54%Public Works$23,271,954
14%
Library and Community
Services$18,882,814
11%
Finance$9,657,393
5%
Community Development
$1,215,883 1%
Other Departments**$6,644,317
4%
Office of the City Manager$4,840,753
3%
Other Expenditures***$13,845,509
8%
Graph 2.2 Expenditures by Department – General Fund*
Total Expenditures$169,911,509
* Excludes inter-fund transfers
** Other Departments include Office of the City Attorney and Human Resources
*** Other Expenditures include Projects Budget, Equipment, Lease Payments, and Service Level Set-Aside
60

Debt Service
DEBT SERVICE Overview The City of Sunnyvale uses debt financing as a tool to maintain its long-term financial stability by paying for certain expenditures over time. Debt financing is also a tool for managing cashflow when large, one-time outlays are required as in the case of constructing a new building or large-scale upgrades to infrastructure. This section provides a summary of the City’s debt service for the twenty-year planning horizon. Included is the Computation of Legal Debt Margin which calculates the City’s debt limit as defined by the City Charter. Also included is the debt service schedule which represents the current bond issues for both the City and the Redevelopment Successor Agency. The City does not have any general obligation debt. Debt Policies Section 1308 of the City Charter limits the allowable bonded indebtedness of the City at 15% of the total assessed valuation of property within the City. However, Council’s adopted policies limit the use of debt even further. Council’s policy 7.1F Debt Management Policy details the city’s approach to debt issuance. Key criteria include:
1. Total bonded indebtedness supported by General Fund revenues should not exceed 5% of assessed valuation of property within the City. Bond issues supported by the General Fund should be restricted to annual debt service of 5% of General Fund revenue.
2. Land based financings should maintain a minimum property value-to-debt ratio of 3:1, with exceptions made for special circumstances at Council’s discretion.
3. Debt service should not affect the City’s ability to meet future operating, capital and reserve requirements. Issuer Credit Rating Each entity that is allowed to issue bonds is rated on its ability to repay the debt. This rating is known as the Issuer Credit Rating (ICR), which is an independent gauge of the credit risk of the issuer. Credit risk is based on the issuer’s solvency or ability to pay the interest and principal. The greater the credit risk, the more interest the issuer has to pay to sell its bonds. Not only does the credit rating of the issuer determine the initial yield of the bond, but it can also affect bond prices in the secondary market if the issuer’s credit rating changes. There are five major services that rate bonds: Standard & Poor’s (S&P), Moody’s Investors Service, Fitch, A.M. Best, and Dominion Bond Rating Service. Ratings range from AAA for the highest quality bonds to D, which are bonds in default. Standard & Poor’s completed a review of the City’s overall credit worthiness in April 2009. This resulted in an upgrade in our “Issuer Credit Rating” to AAA, affording the City the highest possible underlying rating from S&P. In August 2015, this AAA rating was affirmed by S&P. The City also carries a Aaa “Issuer Rating” from Moody’s, again the highest possible rating available. In January 2013 Moody’s confirmed Sunnyvale’s issuer rating as Aaa, with latest Stable Outlook issued in September 2016.
61

Summary of FY 2017/18 Debt Service The FY 2017/18 Budget includes $7,935,821 in debt service payments (including fees). The level of debt associated with these payments is significantly below the legal maximum allowable of approximately $5.8 billion and well below each of the three policy criteria outlined above. Each bond issuance is briefly described below. The twenty-year schedule for debt service payments is shown in the table on the following pages. It should be noted that, separate from the debt service schedule below, future debt issuances are reflected in each respective twenty-year financial plan for planning and funding purposes. The potential issuances are discussed in detail under the fund reviews preceding the Financial Plans in Volume I. Revenue Bonds
Water Distribution System and Wastewater Infrastructure. Revenue bonds were originally issued in 1992 to construct the City’s recycled water system and sludge management facilities. In 2001, the bonds were refunded to reduce debt service costs. At that time, additional funds of $12.5 million were borrowed to pay for additional wastewater infrastructure projects. Debt service payments were financed by water and wastewater revenues. In June 2010, the City issued $59 million of water and wastewater revenue bonds. Approximately $41 million in bond proceeds were provided and are being used to construct new water and wastewater infrastructure projects (including the initial work on a new water pollution control plant). The remaining amount, $18 million, was used to refund the 2001 outstanding bonds, to pay issuance costs, and to provide a debt service reserve account for the 2010 bonds. SMaRT Station®. These bonds were originally issued to construct the Sunnyvale Materials Recovery and Transfer (SMaRT) Station. This facility receives, sorts for recycling, and transports solid waste for the cities of Sunnyvale, Mountain View, and Palo Alto. Sunnyvale’s share of the debt service is financed by solid waste revenues. In 2007, the three cities approved a project to replace the Materials Recovery Facility equipment. This replacement project was funded by reserves of $5.2 million in the Capital Equipment Replacement Fund, a cash contribution of $2.2 million by Mountain View, and the issuance of $8.1 million in revenue bonds by Palo Alto and Sunnyvale. In 2014, to take advantage of historically low interest rates, the 2003 and 2007 bonds were refinanced with the Solid Waste Refunding Note, Series 2014. The outstanding amount of $7,598,525 was refinanced at the tax-exempt rate of 1.23%.
62

Redevelopment Successor Agency Tax Allocation Bonds and Certificates of Participation Redevelopment District. The City’s Redevelopment Successor Agency has two bond-financed projects pursuant to the 1976 Town Center development agreement. The financing obligation includes: the Central Core Redevelopment Project Tax Allocation Bonds (TABs) and Parking Facility Certificates of Participation (COPs). The Central Core Redevelopment Project Tax Allocation Bonds In 1977, tax allocation bonds were sold to fund the acquisition of property, relocation, demolition and public improvements within the Town Center project area. The bonds were twice refinanced. Debt service on 2003 TABs issuance is financed by property tax increment revenues from the Redevelopment Property Tax Trust Fund (RPTTF). Parking Facility Certificates of Participation In 1977 and 1978, two issues of lease revenue bonds were sold to construct a parking deck as part of the Town Center project. These bonds were first refinanced in 1992 and later refinanced in 1998 with COPs. The State Department of Finance (DOF) has denied the repayment of the COPs debt service from the RPTTF because the payments are pledged by lease rental payments required by the City and DOF has not recognized the corresponding repayment agreement as an enforceable obligation. The COPs were moved over to the General Fund in FY 2012/13. Government Center Site Bond Government Center Property. In 2001, variable rate certificates of participation (COPs) were issued to reimburse the City for the cost of acquiring the property located at 505 West Olive. The property, known as the Sunnyvale Office Center, is adjacent to the Civic Center and was purchased in anticipation of future space needs of the City. The 2001 COPs were insured by Ambac, a major bond insurer that has been significantly downgraded by the rating agencies. As a result, interest rates on the 2001 COPs increased multiple times. In late FY 2008/09, the City issued Variable Rate Demand Refunding Certificates of Participation, Series 2009 A, to refund the 2001 COPs. The 2009 COPs are backed by an irrevocable bank letter of credit. City lease payments will reimburse the bank for monthly letter of credit draws by the trustee to pay holders of the refunding COPS. Debt service on this bond is financed by the interest on the reserve fund of the COPs and rental revenue from outside tenants and City operations.
63

Assessed value 38,199,341$ Add back: exempt real property 479,971 Total assessed value 35,238,037$
Debt limit - 15% of Total Assessed Value 5,801,897
Amount of Debt Applicable to Debt Limit:Total bonded debt 69,071 Less:
Water and Wastewater Revenue Bonds (48,406) Solid Waste Revenue Bonds (2,611)
Total net debt applicable to limit 18,054
Legal debt margin 5,783,843$
Note: Section 1308 of the City Charter of the City of Sunnyvale, California, states:"The bonded indebtedness of the City may not in the aggregate exceed the sum offifteen (15%) percent of the total assessed valuation of property within the City, exclusive of any indebtedness that has been or may hereafter be incurred forthe purposes of acquiring, constructing, extending or maintaining municipally ownedutilities, for which purposes a further indebtedness may be incurred by the issuanceof bonds, subject only to provisions of the State Constitution and of this Charter."
Source: City of Sunnyvale
CITY OF SUNNYVALEComputation of Legal Debt Margin
June 30, 2017Unaudited
(dollars in thousands)
64

FY 2016/2017TO
ACTUAL CURRENT PLAN PLAN PLAN PLAN PLAN PLAN PLAN PLAN PLAN PLAN FY 2026/2027BOND ISSUE 2015/2016 2016/2017 2017/2018 2018/2019 2019/2020 2020/2021 2021/2022 2022/2023 2023/2024 2024/2025 2025/2026 2026/2027 TOTAL--------------------------------------------------------------------------- -------------------- -------------------- -------------------- -------------------- -------------------------------------------------------------- -------------------- ----------------------------------------------------------------------------------- --------------------REVENUE BONDS: Water Revenue Bonds 2010
Principal 845,000 890,000 925,000 455,000 470,000 495,000 520,000 545,000 575,000 605,000 635,000 670,000 6,785,000 Interest 1,033,300 991,050 951,550 914,550 896,350 872,850 848,100 822,100 794,850 764,663 732,900 699,563 9,288,525
-------------------- -------------------- -------------------- -------------------- -------------------- -------------------- -------------------- -------------------- -------------------- -------------------------------------------------------------- -------------------- Subtotal - Water Revenue Bond 1,878,300 1,881,050 1,876,550 1,369,550 1,366,350 1,367,850 1,368,100 1,367,100 1,369,850 1,369,663 1,367,900 1,369,563 16,073,525
-------------------- -------------------- -------------------- -------------------- -------------------- -------------------- -------------------- -------------------- -------------------- -------------------- -------------------- -------------------- -------------------- Wastewater Revenue Bonds 2010
Principal 1,375,000 1,440,000 1,515,000 1,010,000 1,060,000 1,115,000 1,165,000 1,230,000 1,290,000 1,355,000 1,430,000 1,510,000 14,120,000 Interest 1,488,275 1,419,525 1,347,525 1,271,775 1,221,275 1,168,275 1,112,525 1,054,275 992,775 925,050 853,913 778,838 12,145,750
-------------------- -------------------- -------------------- -------------------- -------------------- -------------------- -------------------- -------------------- -------------------- -------------------- -------------------- -------------------- -------------------- Subtotal - Wastewater Revenue Bond 2,863,275 2,859,525 2,862,525 2,281,775 2,281,275 2,283,275 2,277,525 2,284,275 2,282,775 2,280,050 2,283,913 2,288,838 26,265,750
-------------------- -------------------- -------------------- -------------------- -------------------- -------------------- -------------------- -------------------- -------------------- -------------------- -------------------- -------------------- -------------------- Solid Waste Revenue Refunding 2014
Principal 2,365,300 2,392,200 531,200 685,000 691,900 702,800 0 0 0 0 0 0 5,003,100 Interest 76,085 46,826 28,847 21,368 12,900 4,322 0 0 0 0 0 0 114,263
-------------------- -------------------- -------------------- -------------------- -------------------- -------------------- -------------------- -------------------- -------------------- -------------------- -------------------- -------------------- -------------------- Subtotal - Solid Waste Revenue 2,441,385 2,439,026 560,047 706,368 704,800 707,122 0 0 0 0 0 0 5,117,363
-------------------- -------------------- -------------------- -------------------- -------------------- -------------------- -------------------- -------------------- -------------------- -------------------- -------------------- -------------------- --------------------TOTAL REVENUE BONDS 7,182,960 7,179,601 5,299,122 4,357,693 4,352,425 4,358,247 3,645,625 3,651,375 3,652,625 3,649,713 3,651,813 3,658,400 47,456,638
-------------------- -------------------- -------------------- -------------------- -------------------- -------------------- -------------------- -------------------- -------------------- -------------------- -------------------- -------------------- --------------------REDEVELOPMENT AGENCY REVENUE BONDS: Central Core Project Refunding TABs 2003
Principal 435,000 460,000 475,000 495,000 515,000 535,000 560,000 585,000 0 0 0 0 3,625,000Interest 164,941 147,041 128,044 107,729 86,138 63,295 38,925 13,163 0 0 0 0 584,335Agent Fee 2,300 4,500 2,416 2,477 4,746 2,602 2,667 5,111 0 0 0 0 24,521
-------------------- -------------------- -------------------- -------------------- -------------------- -------------------- -------------------- -------------------- -------------------- -------------------- -------------------- -------------------- -------------------- Subtotal - Central Core Project Refunding 602,241 611,541 605,460 605,206 605,884 600,897 601,592 603,274 0 0 0 0 4,233,856
-------------------- -------------------- -------------------- -------------------- -------------------- -------------------- -------------------- -------------------- -------------------- -------------------- -------------------- -------------------- --------------------Parking Lease Refunding 1998
Principal 820,000 860,000 905,000 950,000 1,035,000 1,095,000 1,150,000 1,250,000 0 0 0 0 7,245,000 Interest 382,750 340,750 296,625 250,250 200,625 147,375 91,250 31,250 0 0 0 0 1,358,125 Agent Fee 6,960 6,960 6,960 6,960 6,960 6,960 6,960 6,960 0 0 0 0 48,720
-------------------- -------------------- -------------------- -------------------- -------------------- -------------------- -------------------- -------------------- -------------------- -------------------- -------------------- -------------------- -------------------- Subtotal - Parking Lease Refunding 1998 1,209,710 1,207,710 1,208,585 1,207,210 1,242,585 1,249,335 1,248,210 1,288,210 0 0 0 0 8,651,845
-------------------- -------------------- -------------------- -------------------- -------------------- -------------------- -------------------- -------------------- -------------------- -------------------- -------------------- -------------------- --------------------TOTAL REDEVELOPMENT AGENCY REVENUE BONDS 1,811,951 1,819,251 1,814,045 1,812,416 1,848,469 1,850,232 1,849,802 1,891,484 0 0 0 0 12,885,701
-------------------- -------------------- -------------------- -------------------- -------------------- -------------------- -------------------- -------------------- -------------------- -------------------- -------------------- -------------------- --------------------GOVERNMENT CENTER SITE BOND: Government Center Site 2009-A (COPs)
Principal 575,000 605,000 630,000 655,000 680,000 710,000 740,000 770,000 800,000 835,000 870,000 905,000 8,200,000 Interest 63,975 61,100 116,150 164,775 206,600 241,250 268,200 246,000 222,900 198,900 173,850 147,750 2,047,475 Agent Fee and Letter of Credit 83,971 80,332 76,504 72,517 68,372 64,068 59,575 54,892 50,020 44,957 39,673 34,167 645,076
-------------------- -------------------- -------------------- -------------------- -------------------- -------------------- -------------------- -------------------- -------------------- -------------------- -------------------- -------------------- --------------------TOTAL GOVERNMENT CENTER SITE BOND 722,946 746,432 822,654 892,292 954,972 1,015,318 1,067,775 1,070,892 1,072,920 1,078,857 1,083,523 1,086,917 10,892,551
-------------------- -------------------- -------------------- -------------------- -------------------- -------------------- -------------------- -------------------- -------------------- -------------------- -------------------- -------------------- --------------------TOTAL 9,717,857 9,745,284 7,935,821 7,062,400 7,155,866 7,223,798 6,563,203 6,613,752 4,725,545 4,728,569 4,735,335 4,745,317 71,234,890
============ ============ ============ ============ ============ ============ ============ ============ ================================================== ============
CITY OF SUNNYVALEDEBT SERVICE
JULY 1, 2016 TO JUNE 30, 2027
65

BOND ISSUE---------------------------------------------------------------------------REVENUE BONDS: Water Revenue Bonds 2010
Principal Interest
Subtotal - Water Revenue Bond
Wastewater Revenue Bonds 2010 Principal Interest
Subtotal - Wastewater Revenue Bond
Solid Waste Revenue Refunding 2014 Principal Interest
Subtotal - Solid Waste Revenue
TOTAL REVENUE BONDS
REDEVELOPMENT AGENCY REVENUE BONDS: Central Core Project Refunding TABs 2003
PrincipalInterestAgent Fee
Subtotal - Central Core Project Refunding
Parking Lease Refunding 1998 Principal Interest Agent Fee
Subtotal - Parking Lease Refunding 1998
TOTAL REDEVELOPMENT AGENCY REVENUE BONDS
GOVERNMENT CENTER SITE BOND: Government Center Site 2009-A (COPs)
Principal Interest Agent Fee and Letter of Credit
TOTAL GOVERNMENT CENTER SITE BOND
TOTAL
FY 2027/2028 FY 2016/2017TO TO
PLAN PLAN PLAN PLAN PLAN PLAN PLAN PLAN PLAN PLAN FY 2036/2037 FY 2036/20372027/2028 2028/2029 2029/2030 2030/2031 2031/2032 2032/2033 2033/2034 2034/2035 2035/2036 2036/2037 TOTAL TOTAL
-------------------- -------------------- -------------------- -------------------- -------------------- -------------------------------------------------------------------------------------------------------- --------------------- ---------------------
705,000 740,000 780,000 820,000 860,000 910,000 955,000 1,005,000 1,060,000 1,115,000 8,950,000 15,735,000664,388 627,375 588,525 547,575 504,525 459,375 411,600 361,463 308,700 253,050 4,726,575 14,015,100
-------------------- -------------------- -------------------- -------------------------------------------------------------------------------------------------------------------------------------------------- --------------------- ---------------------1,369,388 1,367,375 1,368,525 1,367,575 1,364,525 1,369,375 1,366,600 1,366,463 1,368,700 1,368,050 13,676,575 29,750,100
-------------------- -------------------- -------------------- -------------------------------------------------------------------------------------------------------------------------------------------------- --------------------- ---------------------
740,000 780,000 820,000 865,000 910,000 955,000 1,005,000 1,060,000 1,115,000 1,175,000 9,425,000 23,545,000699,563 660,713 619,763 576,713 531,300 483,525 433,388 380,625 324,975 266,438 4,977,000 17,122,750
-------------------- -------------------- -------------------- -------------------------------------------------------------------------------------------------------------------------------------------------- --------------------- ---------------------1,439,563 1,440,713 1,439,763 1,441,713 1,441,300 1,438,525 1,438,388 1,440,625 1,439,975 1,441,438 14,402,000 40,667,750
-------------------- -------------------- -------------------- -------------------------------------------------------------------------------------------------------------------------------------------------- --------------------- ---------------------
0 0 0 0 0 0 0 0 0 0 0 5,003,1000 0 0 0 0 0 0 0 0 0 0 114,262.695
-------------------- -------------------- -------------------- ------------------------------------------------------------------------------------------------------------------------------------------------------------------------- ---------------------0 0 0 0 0 0 0 0 0 0 0 5,117,363
-------------------- -------------------- -------------------- ------------------------------------------------------------------------------------------------------------------------------------------------------------------------- ---------------------2,808,950 2,808,088 2,808,288 2,809,288 2,805,825 2,807,900 2,804,988 2,807,088 2,808,675 2,809,488 28,078,575 75,535,213
-------------------- -------------------- -------------------- -------------------------------------------------------------------------------------------------------------------------------------------------- --------------------- ---------------------
0 0 0 0 0 0 0 0 0 0 0 3,625,0000 0 0 0 0 0 0 0 0 0 0 584,3350 0 0 0 0 0 0 0 0 0 0 24,521
-------------------- -------------------- -------------------- -------------------- -------------------- -------------------- -------------------- -------------------- -------------------- -------------------- --------------------- ---------------------0 0 0 0 0 0 0 0 0 0 0 4,233,856
-------------------- -------------------- -------------------- -------------------------------------------------------------------------------------------------------------------------------------------------- --------------------- ---------------------
0 0 0 0 0 0 0 0 0 0 0 7,245,0000 0 0 0 0 0 0 0 0 0 0 1,358,1250 0 0 0 0 0 0 0 0 0 0 48,720
-------------------- -------------------- -------------------- -------------------- -------------------- -------------------- -------------------- -------------------- -------------------- -------------------- --------------------- ---------------------0 0 0 0 0 0 0 0 0 0 0 8,651,845
-------------------- -------------------- -------------------- -------------------- -------------------- -------------------- -------------------- -------------------- -------------------- -------------------- --------------------- ---------------------0 0 0 0 0 0 0 0 0 0 0 12,885,701
-------------------- -------------------- -------------------- -------------------------------------------------------------------------------------------------------------------------------------------------- --------------------- ---------------------
945,000 985,000 1,025,000 1,065,000 0 0 0 0 0 0 4,020,000 12,220,000120,600 92,250 62,700 31,950 0 0 0 0 0 0 307,500 2,354,97528,440 22,460 16,226 9,740 0 0 0 0 0 0 76,865 721,942
-------------------- -------------------- -------------------- -------------------- -------------------- -------------------- -------------------- -------------------- -------------------- -------------------- --------------------- ---------------------1,094,040 1,099,710 1,103,926 1,106,690 0 0 0 0 0 0 4,404,365 15,296,917
-------------------- -------------------- -------------------- -------------------------------------------------------------------------------------------------------------------------------------------------- --------------------- ---------------------3,902,990 3,907,797 3,912,214 3,915,977 2,805,825 2,807,900 2,804,988 2,807,088 2,808,675 2,809,488 32,482,940 103,717,830
============ ============ ============ ============ ============ ============ ============ ===================================== ============= =============
DEBT SERVICEJULY 1, 2027 TO JUNE 30, 2037
CITY OF SUNNYVALE
66

Budget and Fiscal Policies

Sunnyvale Budget Guide
Understanding The Sunnyvale Budget
Sunnyvale’s Budget and Long-Term Financial Plan provides a framework for a unique budget document that presents both the immediate short-term action plans and the long-term trends for the City. In this manner, the budget provides the reader with a comprehensive view of the City’s current financial picture, staff assumptions for long-term trends, and the way we work to achieve and maintain financial stability using those assumptions. The following elements contained in this document are integral to understanding this year’s budget:
• Twenty-Year Financial Plans
• Departmental Overviews
• Performance Based Operating Budget
• Projects Budget
Twenty-Year Resource Allocation Plan & Financial Planning
The Budget Document presents a twenty-year financial plan for the City’s General Fund, as well as all other City funds. Twenty-year financial plans for other City funds are grouped into four categories: Special Revenue Funds, Capital and Infrastructure Funds, Enterprise Funds, and Internal Services and Other Funds. The General Fund is presented separately. It is the primary fund that accounts for many of the largest revenues, such as Property Tax and Sales Tax, and the most visible City services, such as police, fire, road maintenance, the library, and parks. For each category, detailed Fund Reviews are included before the Financial Plans. These reviews provide a summary of the funds, including explanations of major components and new developments for the current budget.
The Twenty-Year Resource Allocation Plan (RAP, or the long term-financial plan) is the backbone of the City’s financial planning process. Each long-term financial plan lays out the revenues and expenditures by fiscal year. The financial plans include the prior year actual audited results and the current year budget, as well as projections for each of the coming twenty years. The City examines its operating and project budgets in depth in alternating years. In addition, key factors are rigorously evaluated and updated annually. On the revenue side, the current year budget is updated based on year-to-date revenue receipts. For ongoing revenues, staff works to estimate the next two years as accurately as possible and then analyzes historical information, economic cycles, and factors that can impact the revenue source, among other data, to project the revenue trend over the long term.
On the expenditure side, the operating budget is updated with Council- approved budget modifications that have occurred during the fiscal year. If significant project budgets are anticipated to be spent in future fiscal years, estimated carryover of project funds will be incorporated. All program budgets are rolled up annually by fund or sub-fund to the total amounts in the “Operations” line of the financial plans. From that base, inflation factors are applied to expenditures. Inflation factors are developed for each category of expenditures such as salaries, employee benefits, purchased goods and services, and equipment. Project budgets are also totaled annually by fund and reflected in the “Projects” line of the financial plans. In addition, project operating costs, if applicable, are shown separately on the financial plan.
A critical purpose of the long-term financial plan is its use as a tool for achieving and maintaining a structurally-balanced budget. A fundamental part of the financial plans is that they are, by policy, balanced to the twentieth year. In order for the budget to be balanced, not only must resources be available to meet requirements over the twenty-year planning period with all reserve requirements met per Council Policy, but service levels must also not be impacted.
City of Sunnyvale FY 2017/18 Adopted Budget and Resource Allocation Plan
67
A balanced budget enables the City to maintain service levels over the twenty-year planning horizon by ensuring reserves are used strategically. For example, a budget is not balanced for the long term when there are drawdowns of reserves over a protracted length of time. Conversely, the build-up of reserves to the detriment of service levels also does not portray a balanced budget. The objective in utilizing a twenty-year planning horizon is to sustain service levels, in large part, by managing reserves so that reserve levels are increased in good times and drawn down in difficult financial times. Further, the City’s budget policy dictates that one-time revenues should not be used for ongoing expenditures, and all revenue estimates must be conservative, objective and reasonable.
The General Fund’s Budget Stabilization Fund is required by policy to be maintained at a minimum 15% of projected revenues for the first two years of the twenty-year planning period. The purpose of the Budget Stabilization Fund is to allow for sustainable service level fluctuations in the economy.
By contrast, the General Fund Contingency Reserve can only be used for non-fiscal emergencies or disasters. The General Fund Contingency Reserve is required to be maintained at 15% of operating costs in the first year of the twenty-year plan and increased annually for projected increases in the Consumer Price Index.
The City’s balanced twenty-year plan allows decision makers to better understand the true impact of policy decisions, and effectively requires that decisions made today include a guarantee that resources will be available to maintain services in the future. More importantly, this methodology incorporates both short- and long-term perspectives for planning revenues, operating requirements, and capital spending. It allows the cost of any policy decision to be measured in terms of long-range expenditure requirements, thereby raising “red flags” in areas where financial conditions may be significantly different in the future.
Departmental Overviews
To help the reader understand the proposed two-year operating budget, departmental overviews provide the context for the services and service levels provided. Leading off the section presenting each department’s program or set of programs, the departmental overviews describe the organizational structure for service delivery, factors that informed the development of the operating budget proposal, and significant changes in the proposed budget as compared to the current budget.
The departmental overviews also include performance and workload indicators for each of the programs managed by the department, as well as budgeted headcount. The performance indicators represent the goals and results staff hopes to achieve with the resources provided, while the workload indicators provide output and relevant statistical data. Additionally, they are linked to goals laid out in the City’s Consolidated General Plan. These indicators help explain why services are provided and the impacts of the level at which we provide them. As such, the indicators are an important component of the performance based budget structure.
Performance Based Operating Budget
Following the Departmental Overviews and Performance and Workload Indicators in the budget document are the City’s operating budget reports. The presentation of these operating reports mirrors the City’s operating structure. It is organized into programs, or services, and all expenditures are budgeted into activities, which break down the services into logical and manageable components. Where appropriate, work products are budgeted for activities. As a result, the budget presents information on the services the City provides, the cost of services and where logical, the planned amount of service. This budget structure focuses the City on identifying and quantifying the value created by the efficient/effective provision of City services. Community members can clearly see what services they are receiving and how much they cost, which also holds staff accountable.
City of Sunnyvale FY 2017/18 Adopted Budget and Resource Allocation Plan
68

Projects Budget
In the City of Sunnyvale, the term “project” refers to a non-operating activity. The City segregates each project into one of four possible categories: Capital, Infrastructure, Special, and Outside Group Funding. Capital projects are major expenditures related to construction, improvement or acquisition of capital assets. Infrastructure projects are inherently related to capital projects. After a capital project is complete, the City has an asset that must be maintained through the operating budget until the asset reaches a point where maintenance costs exceed renovation/replacement costs. An infrastructure project is developed in order to provide future funds at the time that replacement or renovation is required. Special projects are one-time only in nature and are set up to eliminate the impact such costs would have on operating programs. For example, the cost of service study for solid waste would be a special project. Outside group funding projects are essentially special projects; however, they are established to identify contributions made to local community-based organizations.
Each project is identified individually in the budget document including its estimated costs over the next twenty years. Projects also reflect anticipated outside revenues that will fund the project, such as grants and fees. In addition, project operating costs are budgeted for those ongoing operating costs that will need to be included in future years upon completion of a given project. Consideration of this information enables decision makers to evaluate the complete costs of proposed actions. This prevents the City from adding assets or activities that are not sustainable over the long term.
The projects budget also includes unfunded projects, which are desirable or pose a liability in the long term but do not have identified funding sources. In some cases, future grant funds may be available for all or a portion of the costs, but it is the City’s policy not to recognize these revenue sources until they are actually available.
Projects related to long-range plans are also identified separately in their respective sections of the Projects Budget volume. Specifically, projects related to Traffic & Transportation that are part of long-range plans are listed in the Traffic and Transportation section of the Projects Budget volume.
City of Sunnyvale FY 2017/18 Adopted Budget and Resource Allocation Plan
69

Budget & Fiscal Policies
Two-Year Operating & Projects Budget
In recognition of the tremendous effort required to develop budgets, the City implemented a two-year operating budget in the early 1980’s. Although the City reviews its budget on an annual basis, it only prepares a detailed operating budget each biennium. This means that operating budgets are minimally updated during the second year of the two-year budget. During the “off year” of the operating budget, the projects budget is reviewed in detail.
Types of Expenditures
There are four major types of expenditures in the City’s spending plan: operating, equipment, capital improvements, and debt service. Operating expenditures are related to a program’s base budget and include such items as general supplies, personnel costs, and equipment rental. Major equipment expenses like computer hardware or city-owned cars are provided for separately under a general services program. Capital improvements are expenditures which affect the economic vitality and quality of life in the community. A good example would be construction of a park or resurfacing a city street. Debt service allows an improvement to be made when it is needed rather than being delayed until funds are accumulated in the City’s treasury. Debt service is essentially a long term loan, buying something today and paying for it over time. It may be used to finance, for example, a new community center building.
Cost Accounting
Cost accounting is a method of accounting that gathers together all the elements of cost incurred to accomplish a purpose, carry on an activity, or complete a unit of work. By using this financial technique, the City is able to assess the true cost of providing a service. The City’s internal users of information management, fleet and equipment, and buildings are assessed rental rates through their programs for the use and eventual replacement of
services and equipment. Employee benefits such as leave usage, retirement, and insurances also are recovered by charging the programs that use personnel services. The City also uses an allocation system to distribute administrative costs for services provided by departments such as Finance and Human Resources.
Basis of Budgeting
“Basis of budgeting” refers to the method used to recognize revenues and expenditures in the budget. For the City of Sunnyvale, the basis of budgeting is the same basis used for accounting. The modified accrual basis is followed in the Governmental and Agency Funds including the General Fund and special revenue funds like the Park Dedication Fund. Under this basis, revenues are recognized when they become “susceptible to accrual,” which means they are both measurable and available. Measurable means the amount of the transaction can be determined.
The City considers revenues to be available if they are collected within 60 days of the current fiscal year end for property tax and 90 days for other revenues, with the exception of the County back-fill (for the loss of sales tax and Motor Vehicle License Fees (VLF) revenues) for which the City adopts a seven-month availability period so that total sales tax and VLF revenues would be most consistent with revenues reported in years before the State sales tax flip and VLF swap. Expenditures generally are recorded when a liability is incurred except for debt service expenditures, which are recorded when payment is due.
Intergovernmental revenues (primarily grants) that are received as reimbursement for specific purposes or projects are recognized based on when the related expenditures are recorded. Intergovernmental revenues which have virtually unrestricted purpose and are revocable only for failure to meet prescribed compliance requirements are reflected as revenues at the time of receipt or earlier if availability criteria are met.
City of Sunnyvale FY 2017/18 Adopted Budget and Resource Allocation Plan
70

The accrual basis is used in the proprietary funds, which include enterprise funds and internal service funds. Revenues are recognized when earned and expenses are recognized when the related liabilities are incurred.
Comprehensive Annual Financial Report (CAFR)
The Comprehensive Annual Financial Report (CAFR) is prepared according to “generally accepted accounting principles” (GAAP). The City prepares its budget in accordance with GAAP with the following exceptions:
• Loans requiring the use of current resources need to be budgeted as expenditures; in the CAFR, the disbursement of loans is treated as a balance sheet item.
• Appropriated budgets are not always needed for all of the City’s funds. For example, a budget is not appropriated for the advance refunding of bonds because the resulting bond proceeds are deposited into escrow accounts and are considered restricted assets.
• Principal payments on long-term debt within the enterprise funds are applied to the outstanding liability in the CAFR, while such items are treated as expenses in the budget.
• Capital outlay within enterprise funds and internal service funds are capitalized as fixed assets in the CAFR, in contrast to their treatment as expenses in the budget.
• The budget does not record depreciation expenses.
• GAAP requires the reporting of investments at fair value. Because the City’s policy is to hold investments to maturity, the changes in fair value are not reflected in the budget.
The CAFR shows fund expenditures and revenues on both a GAAP and budget basis for comparison purposes.
Budgetary Policy & Control
When the annual budget is adopted the City follows procedures that enact its policies. These procedures involve the City management, employees, the public, boards and commissions, and the City Council throughout the
year. These interactions between policy and planning culminate in the establishment of new or revised General Plan goals and objectives. The budget must implement the policies contained in the General Plan. Therefore, both must be synchronized completely. The City operates on a July 1 through June 30 budget year. The budget schedule is detailed in a separate section below, which includes these interactions between policy and planning.
The City’s budget is very detailed, ensuring that the City Council as the governing body is fully informed and in control of all aspects of the City’s financial activities. Information is itemized by fund, by department, and by project. The budget includes equipment costs, operating costs, and debt service costs, as well as capital, infrastructure, and special projects for the ensuing budget year. The budget also contains detailed long-term financial plans with projections for expenditures, revenues, and reserves for an additional nineteen years.
During the budget year, for governmental and agency funds, the City Manager is authorized to reappropriate budgeted amounts between departments that are financed by the same fund. Council approval is required if the reappropriation exceeds the thresholds outlined below:
Annual Program Budget
Reappropriation Threshold
Maximum Reappropriation Threshold (Annual)
> $500,000 $100,000 or 5%, whichever is greater
$250,000
< $500,000 $50,000 or 50%, whichever is less
$50,000
Council approval also is required for proprietary funds and internal services funds if the expenditures for the fiscal year exceed actual revenues plus the planned, annualized appropriation from Reserves.
Budgets are legally adopted for all governmental funds except for the Special Assessment Debt Service Fund. The Special Assessment Debt Service Fund does not have an adopted budget because the City is only required to make debt service payments in the event of a property owner’s default
City of Sunnyvale FY 2017/18 Adopted Budget and Resource Allocation Plan
71

Budgets are also adopted legally for all proprietary funds. Formal budgets are employed as a management control device for all funds in which a budget has been adopted. However, it serves as the primary means of spending control for the General Fund, special revenue funds, debt service funds, and capital project funds.
Budgets can be modified during the fiscal year if needed because of a legislative mandate, City Council or City Manager directive, or an unanticipated change in service level. Budget modifications cover one fiscal year only and must generally be approved and appropriated by City Council. This allows management to focus on changes to the base budget during the next budget process. To aid City Council and administration efficiency, per Council Policy 7.1.5, the City Manager may appropriate grants up to $100,000 that are also free of local match requirements and do not obligate the City to ongoing expenses not already planned in the City’s Resource Allocation Plan.
Citizen Participation
Citizens have an opportunity to participate in the Twenty-Year Resource Allocation planning process through avenues such as Council-appointed boards and commissions, study sessions, and public hearings. Each winter, citizens are provided the opportunity to speak on proposed study and budget issues at a formal public hearing. Citizens may attend study sessions dealing with upcoming Council issues, as well as Council meetings which are scheduled on Tuesdays throughout the year. At the Council meetings, citizens are given an opportunity to speak during the public hearing period. In addition, a formal public hearing on the Adopted Budget is held annually in June.
Budget Calendar
The City’s annual budget development process begins in September each year with the initial planning of the development cycle and culminates with the adoption of the budget by the City Council in June. In January, the City Council specifically discusses important fiscal issues which may have short- term or long-term effects on how the City provides and maintains services to its citizens and customers. Consistent with City Charter, no later than 35 days prior to June 30th the City Manager submits a Adopted Budget to the City Council. The City Council holds a workshop on the Adopted Budget, which is open to the public. In June of each year the City Council also holds a public hearing, required by the City Charter. Prior to June 30 of each year, the budget as modified by the City Council is legally enacted by adoption of a budget resolution.
Below is a high-level calendar detailing key steps throughout the process.
As noted previously, the City of Sunnyvale alternates years for developing operating budgets and projects budgets. The calendar below represents key milestones that take place regardless of whether the budget being developed is an operating budget or a projects budget. It also incorporates critical elements of budgetary policy and control, as discussed in a separate section above.
City of Sunnyvale FY 2017/18 Adopted Budget and Resource Allocation Plan
72

Budget Calendar
Sep Oct Nov Dec Jan Feb Mar Apr May Jun
Budget kick-off
Departments develop budget proposals
Budget Office and departments begin pre-reviews
*Budgetary year-end report for previous fiscal year to Council
City Manager reviews of department budgets
Finalize internal services ependitures
*Budget Issues Workshop/Fiscal Outlook Presentation
*Budget Supplements from Workshop completed and approved
Complete budget system updates
Review revenue projections and service charges
Develop 20-year Long-Term Financial Plans for all City funds
Prepare and finalize transmittal letter
Deliver Adopted Budget to Council
*Budget Workshop by City Manager
Adopted Budget public hearing
*City Council adopts budget
*These are milestones during the Budget Calendar that are related to Budgetary Policy & Control
City of Sunnyvale FY 2017/18 Adopted Budget and Resource Allocation Plan
73
Fiscal Policies
Council Fiscal Policy applies the following guiding fiscal policies to the City’s Budget and Resource Allocation Plan:
7.1 A Budget Policies
A.1: Development of the Budget and Resource Allocation Plan
A.1.1 The public will be encouraged to participate fully in the budget process.
A.1.2. A Fiscal Issues Workshop will be held each year prior to preparation of the City Manager’s Adopted Budget to consider budget issues for the upcoming Resource Allocation Plan.
A.1.3. A balanced Twenty-Year Resource Allocation Plan shall be presented to the City Council annually.
A.1.4. The Twenty-Year Resource Allocation Plan shall be prepared on a two-year Operating Budget cycle.
A.1.5. The Operating Budget shall be approved annually with the second year approved in concept.
A.1.6. A proposed budget shall be recommended to the City Council by the City Manager no less than thirty-five days before the beginning of the fiscal year, in accordance with the City Charter.
A.1.7. At least one public hearing shall be held after the City Manager’s Adopted Budget is presented to the Council in order to solicit public input before adoption.
A.1.8. Boards and Commissions should review the annual budget as appropriate to their area of interest and make recommendations to the City Council.
A.1.9. The City Council shall adopt the City Manager’s Adopted Budget, with any changes desired, by resolution before June 30th of each year.
A.1.10. Resources will be allocated in direct relation to General Plan goals.
A.1.11. The Resource Allocation Plan shall be prepared by General Plan element to link city resources with the accomplishment of General Plan goals.
A.1.12. New or expanded services should support the priorities reflected in the General Plan.
A.1.13. All competing requests for City resources should be weighed within the formal annual budget process.
A.1.14. Final actions on study items with significant financial impacts should be withheld until they can be made in the full context of the annual budget process.
A.2: Long-Term Financial Planning
A.2.1. The City shall maintain a long-term fiscal perspective by annually preparing a Twenty-year Long-Term Financial Plan for each fund. Those funds which account for intergovernmental grants will only include known entitlements.
A.2.2. Major financial decisions should be made in the context of the Twenty-Year Long-Term Financial Plan.
A.2.3. Long-term financial planning should enable the current service level provided to be sustained over time through the strategic use of reserves.
A.2.4. The Long-Term Financial Plans should be used to communicate the fiscal impact of City decisions to all stakeholders whenever possible.
City of Sunnyvale FY 2017/18 Adopted Budget and Resource Allocation Plan
74

A.3: Performance-Based Budget System
A.3.1. The operating budget will be prepared and managed on a program basis.
A.3.2. All costs attributable to a budgeted program will be fully reflected in program budgets (with the exception of capital costs of general-use public buildings and facilities).
A.3.3. An emphasis should be placed on achieving maximum work productivity to ensure an optimal allocation of human and fiscal resources for Council approved services and programs.
A.3.4. All operating programs must identify the service provided, the service level, and the resources necessary to accomplish the specific service level.
A.3.5. A performance measurement system will be maintained and used to evaluate quality of service and to report results.
A.4: Budget Monitoring and Modification
A.4.1. Expenditures for each department are legally limited to the amount authorized by the City Council in the Budget Resolution, plus subsequent changes individually approved by the City Council through Budget Modifications.
A.4.2. The City’s annual budget may be modified at any Council meeting by a majority vote of the City Council.
A.4.3. The City’s budget appropriation control shall be by program within the same fund for operating programs in the General Fund and Special Revenue Funds. For the Proprietary and Internal Service
Funds, expenditures cannot exceed actual revenues plus the planned use of reserves.
A.4.4. Appropriations for capital and special projects shall be limited to the amounts contained on the Budget Resolution for each project. All modifications to project budgets require Council approval.
A.4.5. Budget reappropriations among programs within a Department and Fund may be authorized by the City Manager if service levels as approved by City Council are maintained.
A.4.6. Any unexpended appropriations shall expire at fiscal year-end unless specifically reappropriated by the City Council for expenditure during the new fiscal year. (* per City Charter Article XIII Fiscal Administration Section 1305, amended November 28, 2007, approved appropriations for Capital Improvement Projects shall not lapse at the end of the fiscal year unless the Capital Improvement Project has been completed and closed out or the City Council takes affirmative action to modify the budget appropriation for the Capital Improvement Project)
7.1B Revenue Policies
B.1: Revenue Base
B.1.1. The City will maintain a diversified and stable revenue base, not overly dependent on any land use or external funding source.
B.1.2. Taxes levied by the City will be used for the purpose of financing services performed for the common benefit.
City of Sunnyvale FY 2017/18 Adopted Budget and Resource Allocation Plan
75

B.1.3. Taxes should be held at their lowest possible level, while maintaining Council-approved service levels.
B.1.4. When considering a new tax or revenue source or an increase in an existing tax or revenue source, the following criteria should be considered:
– Community/voter acceptance
– Competitiveness with surrounding communities
– Efficiency of revenue collection and enforcement
– Effectiveness in generating sufficient revenues in the short- and long-term to justify its establishment
– Enhancement of revenue diversity to promote stability and provide protection from downturns in business cycles
– Equity/Fairness in distribution of the revenue burden on various segments of the community
B.1.5. Reliance on any restricted and/or inelastic sources of revenue will be avoided.
B.1.6. One-time revenues should not be used for ongoing expenditures.
B.1.7. Revenue should not be targeted for a specific program, unless a revenue source has been established for the sole purpose of financing a particular expenditure.
B.1.8. Potential new revenue sources will be investigated periodically to ensure that the City’s revenue base is stable and diversified.
B.1.9. Donations, contributions, and sponsorships may be accepted if they are in accordance with City policy and General Plan priorities.
B.2: Revenue Forecasting and Monitoring
B.2.1. All revenue estimates must be conservative, objective and reasonable.
B.2.2. Revenue forecasts should be based on detailed information regarding historical performance and economic conditions whenever possible.
B.2.3. At least ten years data for all tax revenue sources will be maintained.
B.2.4. Revenues will be estimated for the budget year and for each planning year in the Twenty-Year Resource Allocation Plan.
B.2.5. Methods to maximize the accuracy of revenue forecasts will be established.
B.2.6. Estimated revenues from grant sources will be projected only to the specific date on which the entitlement will end.
B.2.7. Estimated intergovernmental revenues for which the City is eligible (but which are not guaranteed) will be forecast to assure that local matching funds will be available if the revenues are realized.
B.3: Revenue Collection
B.3.1. The City will seek all possible Federal and State reimbursement for mandated projects and/or programs.
B.3.2. An aggressive collection system for all accounts receivable, including utility receivables, will be utilized to assure that monies due to the City are received in a timely fashion.
City of Sunnyvale FY 2017/18 Adopted Budget and Resource Allocation Plan
76
B.3.3. Monthly reviews and periodic audits of Transient Occupancy Tax returns will be conducted.
B.3.4. Monthly reviews and periodic audits of all major locally administered revenue sources will be conducted.
B.3.5. Periodic point-of-sale audits for Sales Tax will be conducted.
B.4: Grants and Intergovernmental Assistance
B.4.1. The use of intergovernmental grant assistance for routine programs will be discouraged. Intergovernmental grants may be used for special projects which strengthen a program, have a definable starting and ending date, and do not expand a service in such a way as to require the substitution of local funds to continue part or all of the service once intergovernmental assistance ends.
B.4.2. Intergovernmental assistance may only be used to establish or expand a program when the Twenty- Year Resource Allocation Plan meets the following conditions:
– The program is eliminated at the end of the intergovernmental funding period, or
– The program continues with the requisite local funding in the Twenty-Year Resource Allocation Plan upon completion of intergovernmental funding
B.4.3. A uniform grants application process must be utilized to assure that the City Council has the information necessary to make a decision regarding a potential intergovernmental grant. Staff should present to Council a Notice of Intent regarding a possible grant source which shall include at least the following information:
– The grant being pursued and the use to which it would be placed
– The objectives or goals of the City which will be achieved through use of the grant
– The local match required, if any, plus the source of the local match
– The increased cost to be locally funded upon termination of the grant
– The ability of the City to administer the grant
B.5: User Fees
B.5.1. User fees should be used to recover the cost of services that benefit specific segments of the community.
B.5.2. User fees should be reviewed and adjusted at least annually to avoid sharp changes.
B.5.3. User fees and charges should not exceed the City’s full cost of providing the service.
B.5.4. User fees should be established at a level which reflects the full cost of providing those services.
B.5.5. The City Council may determine for any service whether a subsidy from the General Fund is in the public interest.
B.5.6. User fees shall only be used when the cost of providing the service can be readily calculated and administered.
B.5.7. User fees should be adopted by Council resolution and included in the Annual Fee Schedule.
City of Sunnyvale FY 2017/18 Adopted Budget and Resource Allocation Plan
77

7.1C Capital Improvement Policies
C.1: Capital Improvement Plan
C.1.1 An updated Twenty-Year Capital Improvement Plan shall be prepared on a two-year budget cycle.
C.1.2 The City shall fund only those Capital Improvement Projects that are consistent with the adopted Capital Improvement Plan, City priorities, and General Plan goals.
C.1.3 High priority should be given to replacing capital improvements prior to the time that they have deteriorated to the point where they are hazardous, incur high maintenance costs, negatively affect property values, or no longer serve their intended purposes.
C.1.4 New or expanded capital improvements should maximize value and avoid duplication whenever possible by partnering with other entities to pool resources or share facilities.
C.1.5 Priority will be given to the repair and replacement of existing infrastructure as compared to the provision of new or expanded facilities.
C.1.6 The decision on whether to repair or to replace an existing capital asset will be based on which alternative is most cost-effective or provides the best value to the City.
C.1.7 The operating impact of proposed capital projects, including ongoing operating expenditures, capital outlay, debt service, and infrastructure replacement will be identified in the Capital Budget and considered in the selection of projects for funding.
C.1.8 Staff will identify the estimated costs, potential funding sources, return on investment, project schedule and relationship to the General Plan for each capital project proposal before it is submitted to the Council for approval.
C.1.9 Capital improvements should be maintained to the level required to adequately protect the
City’s capital investment and to minimize future maintenance and replacement costs.
C.1.10 A Capital Projects Fund shall be used to account for major capital acquisition or construction projects associated with the General Fund and other governmental funds. The capital projects of the Utility Enterprise Funds shall be accounted for within the respective fund.
C.1.11 The Infrastructure Renovation and Replacement Fund shall be used to account for projects related to the City’s Long-Range Infrastructure Plan for the renovation and replacement of existing general City assets. Infrastructure projects related to the City’s utilities shall be accounted for in the respective utility fund.
C.2: Funding
C.2.1 Governmental capital improvements should be funded on a “pay-as-you-go” basis in most cases. Alternate financing strategies may be considered in light of the specific project and the consequences of each financing strategy.
C.2.2 Development-related improvements such as sidewalks, curbs and gutters, street lights, and water and sewer lines should be funded by those directly benefiting from the improvements.
City of Sunnyvale FY 2017/18 Adopted Budget and Resource Allocation Plan
78

C.2.3 The City will seek out and use intergovernmental funding sources for capital improvements, as is consistent with City priorities and General Plan goals.
C.2.4 Funds for the replacement of City assets originally paid for by a developer should be included in the Capital Improvement Plan of the appropriate City fund.
C.3: Design and Evaluation
C.3.1 The planning and design of capital improvements should be based on standards that minimize construction costs, while assuring acceptable useful life and reducing maintenance requirements. Value engineering processes will be utilized when necessary and appropriate.
C.3.2 Budgeting for capital projects must reflect when the expenditures are scheduled to occur, using multi- year planning to ensure a reasonable time frame for projecting costs.
C.3.3 Improvements should be designed with the following goals: to maximize energy efficiency, require minimal maintenance, create an efficient physical relationship for those working in the facility, provide adequate capacity for the projected useful life, and to have the ability to accommodate future expansion with minimum remodeling costs.
7.1D Land Policies
D.1: Acquisition, Disposition and Leasing of City-Owned Real Property
D.1.1 A high priority will be given to acquiring undeveloped land needed to meet City goals before it is developed.
D.1.2 Developed land should be acquired in reasonable proximity to the time the property is required for City purposes.
D.1.3 Every effort shall be made to acquire property through negotiation, reserving the use of eminent domain for those circumstances when immediate possession is required and the property cannot be acquired through negotiation at a cost approximating market value.
D.1.4 The purchase, sale or lease of real property where the purchase or sale price or lease cost is more than $75,000, per the Sunnyvale Municipal Code, shall be approved by the City Council.
D.1.5 The purchase, sale or lease of real property where the purchase or sales price or lease cost is less than $75,000, per the Sunnyvale Municipal Code, shall be approved by the City Manager.
D.1.6 The lease of city property which results in revenue to the City and the term is less than or equal to 55 years shall be approved by the City Manager.
D.1.7 The lease of city property for a term longer than 55 years shall be authorized by the City Council by resolution following a public hearing.
City of Sunnyvale FY 2017/18 Adopted Budget and Resource Allocation Plan
79

D.1.8 Property leased to outside entities should be based on market rents except when the Council finds that there is a public purpose for leasing at a lower rate.
D.1.9 The net proceeds from the disposition of surplus City property owned by the General Fund shall be placed into the General Fund Reserve for Capital Improvements.
D.1.10 Proceeds from the sale of land or facilities originally purchased with monies from a specific fund should be kept within that fund.
7.1E Reserve Policies
E.1: General Fund Reserves
E.1.1 The General Fund Contingency Reserve will be maintained at 15% of operations costs in year one of the long-term plan, with annual increases based on projected increases in the Consumer Price Index. This reserve will only be utilized for non-fiscal emergencies or disasters as determined by Council.
E.1.2 The sale of surplus property owned by the General Fund and any other one-time revenues shall be placed into a Reserve for Capital Improvement Projects to be used for capital improvement or expansion.
E.1.3 The Twenty-Year Resource Allocation Plan (RAP) Reserve shall be used to levelize economic cycles and maintain stable service levels over the long term.
E.1.4 The Budget Stabilization Fund will be a minimum of 15% of projected revenues for the first two years of the 20-year planning period. Beyond year two, the Budget Stabilization Fund will always have a balance of at least zero.
E.1.5 The Service Level Set-Aside will be used to provide ongoing funds to increase service levels or add new services. Once used, this Set-Aside may be replenished according to economic conditions.
E.1.6 Any other reserves may be established to segregate funds which are legally restricted to specific purposes.
*Note: For additional user fee policies specific to the Utility Funds or the Golf and Tennis Fund, please see those sections under Enterprise Fund policies.
City of Sunnyvale FY 2017/18 Adopted Budget and Resource Allocation Plan
80

Successor Agency of the Redevelopment Agency ObligationsFiscal Year 2017/18
The Redevelopment Agency of the City of Sunnyvale (Agency) was established by Resolution No. 2600 in 1957. The Agency existed separate and distinct from the City exercising the powers granted pursuant to the California Community Redevelopment Law. The City Council served as the Agency Board and the City Manager served as Executive Director.
Sunnyvale had one redevelopment project area, the Sunnyvale Central Core Redevelopment Project to remove or correct the conditions of blight which depress the project area. The Central Core project area covers the original business district of the City and surrounding housing, together with the expanded commercial area which has become the City’s Town Center.
Effective February 1, 2012, all California redevelopment agencies, including the Redevelopment Agency of the City of Sunnyvale, were dissolved by the State of California’s Dissolution Act. The City elected to serve as the Successor Agency to the former Redevelopment Agency, to facilitate the wind down process (i.e., manage redevelopment projects currently underway, make payments on enforceable obligations, and dispose of redevelopment assets and properties), subject to the oversight of a newly established Sunnyvale Oversight Board, which is required to approve certain actions of the Successor Agency and to direct the Successor Agency to take other actions as set forth in Health and Safety Code Sections 34180 and 34181, respectively. The Oversight Board consists of seven representatives made up of members from the City of Sunnyvale, the County of Santa Clara and local education and special districts that serve the Redevelopment Project Area. The actions of the Oversight Board are overseen by the California Department of Finance, which can approve an action or return it to the Oversight Board for reconsideration.
A critical piece of the wind down process is the determination of enforceable obligations for payment from the Redevelopment Property Tax Trust Fund (RPTTF) allocation. The Adopted Budget presents the FY 2017/18 Recognized Obligation Payment Schedule (ROPS) for the Redevelopment Successor Agency’s approved enforceable obligations. The ROPS include debt service payments for the Tax Allocation Bonds, amounts owing to the Low and Moderate Income Housing Fund, funding for the Town Center project management and environmental remediation payments. The ROPS appropriation for fiscal year 2017/18 totals $3,094,391 million.
The ROPS also includes administrative expenses. The Dissolution Law allows for reimbursement of administrative expenses, up to a cap.
City of Sunnyvale FY 2017/18 Adopted Budget and Resource Allocation Plan
81

Fiscal Year 2017/18 Recognized Obligation Payment Schedule*
ROPS 17-18A Total (July – December)
ROPS 17-18B Total (January – June) ROPS 17-18 Total
Funding for Approved Enforceable Obligations:
Redevelopment Property Tax Trust Fund $2,801,267 $293,124 $3,094,391
Total Funding for Approved Enforceable Obligations $2,801,267 $293,124 $3,094,391
Approved Enforceable Obligations:
2003 Tax Allocation Refunding Bonds $543,921 $59,124 $603,045
2003 Tax Allocation Refunding Bonds Trustee Fees 2,500 0 2,500
Repayment to Low and Moderate Income Housing Asset Fund 1,941,611 0 1,941,611
Reimbursement – FY 2015/16 Chief Downtown Project Manager 79,235 0 79,235
Town Center Hazardous Material Remediation 69,000 69,000 138,000
Town Center Disposition and Development and Owner Participation Agreement Management
40,000 40,000 80,000
Administration and Operation of Successor Agency 125,000 125,000 250,000
Total Approved Enforceable Obligations $2,801,267 $293,124 $3,094,391
*Spending plan as approved by The State Department of Finance on April 5, 2017.
City of Sunnyvale FY 2017/18 Adopted Budget and Resource Allocation Plan
82

City Budget and Appropriations Limit Resolutions

CITY BUDGET RESOLUTION AND APPROPRIATIONS LIMIT RESOLUTION The City Council annually adopts by resolution the budget for the upcoming fiscal year. The report to the Mayor and Council presents a summary of major expenditure and revenue categories. This report also details any changes to the recommended budget. In conjunction with the adoption of the budget, the City is required to establish an appropriation limit and spending limitation in accordance with Article XIII-B of the California Constitution. The City Council annually adopts by resolution the appropriation limit and spending limitation.
83

This Page Intentionally Blank
84
RESOLUTION NO. 834-17
A RESOLUTION OF' THE CITY COUNCIL OF THE CITY OF SUNNYVALE ADOPTING THE BUDGET OF THE CITY OF SUNNYVALE FOR THE FISCAL YEAR JULY 1, 2017 TO JUNE 30,2018
WHEREAS, the proposed budget of the City of Sunnyvale for the fiscal year 2017-2019 was prepared and submitted to the City Council by the City Manager on May 10, 2017, which date was at least thirty-five (35) days prior to the beginning of fiscal year 2017-2018 as required by Section 1302 of the Charter; and
WHEREAS, the City Council reviewed the proposed budget, and advertised and held a public hearing on June 6, 2017, at which interested members of the public were gtven an opportunity to be heard, consistent with City Charter Section 1303; and
\VHEREAS, the City Council further considered the proposed budget at its meeting on June 20, 2017, as provided for in City Charter Section 1304.
NOW, THEREFORE, BE IT RESOLVED BY THE CITY COUNCIL OF THE CITY OF SUNNYVALE THAT:
1. The budget of the City of Sunnyvale for the fiscal year beginning on July 1, 2017 and ending on June 30, 2018, as submitted to the City Council by the City Manager on May 10,2017, and as amended by the City Council on June 20,2017, is hereby approved and adopted as the budget of the City of Sunnyvale for fiscal year 2017-2018.
2. Expenditures of the City of Sunnyvale for fiscal year 2017-2018, appropriations to reserves and inter-fund transfers/loans shall be governed and controlled according to the amounts specified in this resolution for each of the classifications of the General Fund and Special Revenue Funds, and for the total thereof, it being intended that the expenditure of the total amount budgeted and appropriated by this resolution for each fund, reserve or department shall be limited only by the amount specified herein and in the budget for each of such classifications.
3. During the budget year, for governmental and agency funds, the City Manager is authorized to reappropriate budgeted amounts between programs that are financed by the same fund and within the same department, consistent with the following thresholds:
T-FIN-160163/18241 2 Council Agenda: 6-20-17 Item No.: 2.B
1
85

a. For programs where the annual program budget is equal to or greater than $500,000, the City Manager may approve reappropriations between programs that do not exceed $100,000 or 5% of the annual program budget, whichever is greater, up to a maximum of$250,000.
b. For programs where the annual program budget is less than $500,000, the City Manager may approve reappropriations between programs that do not exceed $50,000 or 50% of the annual program budget, whichever is less, up to a maximum of$50,000.
4. The City Manager is authorized to appropriate, to the designated fund, grant revenue of up to $100,000 from grants that meet the City Manager's authority for accepting and appropriating grant funds, as set forth in Council Policy 7.1.5. The City Manager is authorized to accept and appropriate grants up to $100,000, so long as they do not require a local match or obligate the City to ongoing expenses not already planned in the City's Resource Allocation Plan. The City Manager may appropriate qualified grant funds up to $100,000 through an administrative budget modification. Any grants of $100,000 or more, or that require a local match or obligate the City to ongoing expenses, shall require City Council approval of a budget modification before funds can be expended by staff.
5. The specified sums of money set forth opposite the names of the funds, reserves, departments and programs set forth in Exhibits A, B, C, and D, attached and incorporated by reference, are hereby appropriated to the funds, reserves, departments and programs based upon the adopted budget.
6. If the expenditures for the Proprietary Funds and Internal Services Funds for the fiscal year exceed actual revenues plus the planned appropriation from the Rate Stabilization Reserve Account or the Resource Allocation Plan Reserve Account, as the case may be, on an annualized basis, Council approval shall be required.
7. The budget estimates for the twenty-year period shown in the 2017-2018 to 2036-203 7 Resource Allocation Plan are approved for financial planning purposes.
8. If the appropriations for the General Fund and Special Revenue Funds for fiscal year 2017-2018 exceed the expenditures from the funds for the fiscal year, the excess shall be allocated to the Budget Stabilization Fund Account for the General Fund and to the Resource Allocation Plan Reserve Account for the Special Revenue Funds. If the expenditures from the General Fund and Special Revenue Funds for fiscal year 2017-2018 exceed the appropriations for the funds for the fiscal year then the difference shall be deducted from the Budget Stabilization Fund Account for the General Fuhd and from the Resource Allocation Plan Reserve Account for the Special Revenue Funds. If the appropriations for the Proprietary Funds and Internal Services Funds for the fiscal year exceed the expenditures from the funds for the fiscal year, or if the expenditures from the funds for the fiscal year exceed the appropriations for the funds, the excess shall be allocated to or deducted from the
T-FIN-160163/18241 2 Council Agenda: 6-20-17 Item No.: 2.B
2
86

vote:
AYES: NOES:
Resource Allocation Plan Reserve Account or the Rate Stabilization Reserve Account, as the case may be.
9. A copy of the budget hereby adopted, certified by the City Clerk, shall be filed with the City Manager or designated representative, and a further copy so certified shall be placed and shall remain on file in the Office of the City Clerk where it shall be available for inspection. Copies of the certified budget shall be made available for the use of departments, offices and agencies of the City.
Adopted by the City Council at a regular meeting held on June 20, 2017, by the following
HENDRICKS, LARSSON, GRIFFITH, KLEIN, MELTON, SMITH, GOLDMAN NONE
ABSTAIN: NONE ABSENT: NONE RECUSAL: NONE
REBECCA L. MOON Sr. Assistant City Attorney
T-FIN-160163/18241 2 Council Agenda: 6-20-17 Item No.: 2.B
APPROVED:
GLENN HENDRICKS Mayor
3
87

Program/Project Description
DEBT SERVICE Utility Revenue Bond- Water
Uti\Jty Re\ enue Bond- Sewe1
Utility Revenue Bond- SrvbRT+
Utility Revenue Bond- StvJaRT"'
Sunny\ ale Oftice C'ente1
TOTAL DEBT SERVICE
035. 070.
General Housing
0
0 0
0
0
0
0
EXHIBIT A
CITY OF SVNNYVALE APPROPRIATIONS
GENERAL FVND, SPECIAL REVENVE FVNDS, ENTERPRISE FVNDS, CAPITAL PROJECTS FUNDS FY 2017/18 BUDGET
071.
HOME
0
0
072. 110.
Community Redevelopment Development
Housing Block Grant
0
0
FUND!SVB-FUND
141.
Park Dedication
0
0
0
175.
Asset Forfeiture
0
190.
Police Services
Aug.
0
0
0
0
0
210.
Employment Development
0
0
0
""~)'um(\'Va/e'.•• sha1·~· tl{,\'A1aR'l'Stafion f)chf Serv1ce up pears in both tlu! ,)'o/iJ Was/e .111allrJKement Fu11d and the ~MaRT ._\'tathm ()perattons Fltnd due It> I he tnterre!ated IW/1/tl! <if these funds.
OPERATING PROGRAMS C1ty Attorney
750 Comprehensive Legal Services
Total C1tv Attorney
City Manager 702 Office of the City !\•tanager
Total City Manager
Human Resources 75.f Human Resources
Total Human Resou1 ces
I ,797.659 0
1,797,659
4,840,753
4.840,753
4,846,658
4,846,658 0
0 0 0
0 0 0 0 0
0 0 0 0 0 0
0 0 0 0
0 0 0
0 0 0
A-1
245.
Parking District
0
0
0
255.
Community Facilities
District #3
0
0
0
280.
Gas Tax
0
0
0
0
0
0
0
0
0
0
88

Progn1miProject Description
DEBT SER\"ICE Utility Revenue Bond- Wate1
Utility Revenue Bond- Sewet
Utility Revenue Bond- S!\laRT¥
Utility Revenue Bond- SMaRT'"
Slmny\ale Otftce Center
TOTAL DEBT SERVICE
CITY OF SUNNYVALE APPROPRIATIONS
GENERAL FUND, SPECIAL REVENUE FUNDS, ENTERPRISE FUNDS, CAPITAL PRO.JECTS FUNDS FY 2017/18 BUDGET
295.
Youth and Neighbor. Services
385.
Capital P1·o_jects
0
0
460.
\\"ater Supply and Distribution
L876,550
0
0
FUND/SUB-FUND
465.
Wastewater i\lgmt.
0
2,862,525
0
485.
Solid Waste Mgmt.
0
0
404.410
490/100.
SMaRT Station
Operations
0
0
0
490/200.
SMaRT Station Rep!.
0
0
0 0 0 0 0 0 560,047
0 60,876 41,791 61,864 0 0
510.
Development Enterprise
525.
Golf and Tennis
0
0
0
0
0
610.
lnf. Renov. and Rep!.
0
0
0
All Funds
FY 2017/18 Total
1.876,550
2.S62.525
404_410
560,047
164531 -----------~------ ---------------~-- --~~--~----------- ------------~~-- --------------- -----------~------ ------------~- -------------- -------------------- ---~---------- -------------
0 0 1.937,426 2,904,316 466,274 560,047 5,868.063
--------------- ---------~-~---~ ~--------------- ------------------ ----------------- ---------------- --------------- ------------------- ------------- -------------- -----------------*Sunnyvale's share of SMaRT Station Debt Servi(e appears tn both the Solid \Vaste Management Fund and the SMnRT Station Operations Fund due to the mterre!ated nature of these funds
OPERATING PROGRAMS C1ty Attorney
750 CompreheJHive Legal Services
Total Citv Attorney
City Manager 701 Office of the City lVIanager
~ Total CitY Manager
Human Resomces 754 Human Resources
Total Human Resources
0
0 0
0
0
0
0 458,812 2,256.472
0 458,812 2,256,472
0 0 0 4.840, 753
0 0 4.840,753
0 0 0 0 4,846,658
0 0 4,846,658
A-2 89

Program/Project Desniption
Community Development 233 Building Snfety
234 Plannmg
23 5 Housing and CDBG Program *
23 7 Department Management
Total Community Development
035. 070.
General Housing
0
671,644
&77,933
544,238
1,215,883 877,933
CITY OF SliNNYVALE APPROPRJA TIONS
GENERAL FliND, SPECIAL REVENUE FliNDS, ENTERPRISE FUNDS, CAPITAL PRO.JECTS HINDS FY 201'7/18 BUDGET
071.
HOME
0
I 03,98&
0
I 03,988
072. 110.
Community Redevelopment Development
Housing Block Grant
41_040 402,762
41,040 402,762
FUND/SUB-FlJND
141.
Park Dedication
0
0
0
0
175.
Asset Forfeiture
0
0
0
190.
Police Services
Aug.
210.
Employment Development
0
0
"'J>oes not include lmhrccl Cusl Allocalionfhr General Fund udminisltcl/ll'e support serl'icl!sfin· Funds 7 I and I 10; !Ius expenst: is cm·l!rl!d us a fund tran.~ji.•r.
Finance 369 Wholesale Water Purchases
0 0 0 0 0 0 0 0 0 703 Budget Management
I ,053,951 0 0 0 0 0 0 0 0 704 Purchasmg
1,789_496 0 0 0 0 0 0 0 0 705 Fmanc1al Management and Analysts
939,262 0 0 0 0 0 0 0 0 706 Accountmg and Financ1al Servtces
2,132,144 0 0 0 0 0 0 0 0 707 Revetme Collectton and Audtt
1,006,792 0 0 0 0 0 0 0 0 708 Utol!t) Billing
2,735,748 0 0 0 0 0 0 () 0
Total Finance 9,657,393 0 0 0 0
Library and Communtty Services 527 Youth and Family Services
379,013 0 0 0 0 0
620 Ltbrary 9,479,444 0 0 0 0 0
626 Arts and Recreation Programs 9,024,358 0 0 0 0 0
Total Library and C'ommumty Se1-, ices 18,882,814 0 0 0 0 0
A-3
245.
Parking District
0
0
0
0
0
0
0
0
0
0
0
0
0
0
255.
Community Facilities
District #3
280.
Gas Tax
0 0
0 0
0
0 0
0
0
0 0
0 0
0 0
0
0
0
90

Program/Project Description
Community Development ::!33 Buddmg Sufetj-
234 Plannmg
2.3 5 Housing and CDBG Program *
237 Department Management
CITY OF SUNNYVALE APPROPRIATIONS
GENERAL FtJND, SPECIAL REYENtJE FtJNDS, ENTERPRISE FtJNDS, CAPITAL PRO.JECTS FtJNDS FY 2017!18 BliDGET
295.
Youth and Neighbor. Services
385.
Cllpital Projects
0
0
460.
w~\ter
Supply and Distribution
0
FtJNDIStJB-FtJND
465.
Wastewater Mgmt.
485.
Solid Waste Mgmt.
0
0
490/100.
SMaRT Station
Operations
0
0
0
490/200.
SMaRT Station Rep I.
0
0
0
510.
Development Enterprise
4,082.326
2,563,075
525.
Golf and Tennis
0
0
0
0
610.
lnf. Re-nov. and Repl.
0
0
0
All Funds
FY2017/18 Total
4.082.326
3,234,720
1.425.723
544.238 --------------- ----------------- ---------------- ---------------- ------------- -------------- ----------------- ---------------- ------------------ --------------- -----------------
Total Commun1ty Development 0 0 0 0 0 6,645,402 9287.007
"'/)oes not mch!dr! !ndirl!ct Cost Allocation.fi)f' Uenau/ Fund admmistratn:e support servicesjhr Funds 7 I and I /0; tJus expense IS co1·ered us afund trun~jer
Fmance 369 Wholesale Water Pwchases
0 0 29,964.066 0 0 0 0 0 0 0 29,964,066 703 Budget Management
0 0 0 0 0 0 0 0 0 1.053,951 704 Purchasmg
0 0 0 0 0 0 0 0 0 1.789.496 705 Fmancml Management and Ana!ys1s
0 0 0 0 0 0 0 0 0 939,262 706 Accounting and Financwl Services
0 0 0 0 0 0 0 0 0 2.132.144 707 Revenue CollectiOn and Audit
0 0 0 0 0 0 0 0 0 0 1.006.792 708 tJt!ltty Billmg
0 0 0 0 0 0 0 0 0 2.735.748
Total Finance 0 29,964.066 0 0 39,621.459
Lib1 a1 y and Community Services 527 Youth and Family Services
870,152 0 0 0 0 0 1,249,165 620 Library
0 0 0 0 9.479,444 626 Arts and Reneation Progtams
0 0 0 34,809 0 0 9,059,167
Total Library and Commumty Set"-JCes 870,152 0 0 34,809 0 19,787.775
A-4 91

Program/Project Description
035.
General
070.
Housing
CITY OF SUNNYVALE APPROPRIATIONS
GENERAL FUND, SPECIAL REVENUE FUNDS, ENTERPRISE FUNDS, CAPITAL PRO,JECTS FUNDS FY 2017/18 BUDGET
071.
HOME
072.
Redevelopment Housing
110.
Community Development Block Grant
FUND/SUB-FliND
141.
Park Dedication
175.
Asset Forfeiture
190.
Police Services
Aug.
210.
Employment Development
245.
Pltrking District
255.
Community Facilities
District #3
280.
Gas Tax
------------------------------------------------------ --------------- -------------- -------------- ----------------- ----------------- ---------------- --------------- -------------- ---------------- --------------- --------------- ----------------Public Safety
471 Police Set vtces
472 FHe Setvtces
471 Communtty Safety Services
474 Personnel and Trammg
475 Investigation Ser\'ICes
476 Commumcat10n Services
477 Public Snfety Admuustlative Services
478 Records Management and Property Sen1ces
4 79 F1re P1 event ion Ser\ ICes
Total Public Safety
Public \V urks 119 TransportatiOn and Traffic Ser\ 1ces
120 Pavement, Twffic S1gns and Markmgs, Street S\.,eeping, and Roadside Easements
12 1 Street L1ghts
21 9 Street T1 ee Serv1ces
256 Downtown Parking Lot Maintenance
32,068,922
32,782,531
4.369.109
2,210.305
5.123,761
4,301.891
6.503,263
2.246,524
1.946.580
91,552.886
2.403.826
6A58.007 (2,025,000)
1,162)23
2,132,374
0 267 Neighborhood Parks and Open Space i\1anugement
10.188)85 308 Public \Vorks Administrat!O!l
926.238 310 Land Development- Engineenng Sen tees
0 647 Golf Course Operations
Total Public Works 21,246,954
0
0
0 ()
0 0
0 0
0 0
0 0
0 0 0
0 0 0
0 0
0 0
0 0
0 0
0 () 0
A-5
0 2.009 243.316 0 0 0
0 0 0
0 0 0 0
0 0 0 0
0 0 0
0 0
0 0 0 0 0
0 0 0
0 0 0 0 0
2.009 243.316 0 0 0
0 0 0 0 0 0 0
0 0 0 0 0 0 0 2.025.000
0 0 0 0 0 0 0 0
0 0 0 0 0 0 0
0 0 0 0 0 68,806 0 0
0 0 0 0 0 57,305 0
0 0 0 0 0 0 0 0
0 0 0 0 0 3,591 0 0
0 0 0 0 0 0 0
0 0 129.701 2.025.000
92

CITY OF SUNNYVALE APPROPRIATIONS
GENERAL FUND, SPECIAL REVENUE FUNDS, ENTERPRISE FUNDS, CAPITAL PROJECTS FtlNDS FY 2017/18 BUDGET
Progrnm/Projcct Description
Public Safety 47 J Pollee Se1 v1ces
472 Fire SeJvJces
473 Comnnuuty Safety Services
474 Personnel and Tmmmg
475 InvestJgatJon Ser\lces
476 C'ommumcat1on Sen1ces
477 Pubhc Safety Admnust1atne Sernces
295,
Youth and Neighbor. Services
4 78 Records Management and Propert) Se1 YJces
479 F1re P1eventwn SeJvJces
Total Publlc Safetv
Public Works 119 Transportation and Traftic Sen 1ces
120 Pa,ement, Twff1c SI.I.!OS and Markmgs, Street Sweeping, and Roadside Easements
121 Street Ltghts
219 Street T1 ee Serv1ces
256 Downtown Parking Lot Maintenance
267 Neighborhood Parks and Open Space i\Ianagement
308 Publtc Works Administration
3 I 0 Land Development ~ Engineering Sen 1ces
647 Golf Course Operations
Total Public \Yorks
0
0
0
0
0
0
0
385.
C;tpital Projects
0
0
0
0
0
0
460.
W;ltt'r Supply and Distribution
0
0
0
0
0
0
0
0
0
0
FUND/SUB-FUND
465.
Wastewater I\! gmt.
0
0
0
0
0
0
0
0
0
0
0
0
0
485.
Solid Waste i\'lgmt.
A-6
0
0
0
0
0
0
0
0
0
0
490/100.
SMaRT Station
Operations
0
0
0
0
0
0
0
0
0
0
0
0
490/200.
SMaRT Station Repl.
0
0
0
0
0
0
0
510.
Development Ente-rprise
0
0
0
0
0
1,230,237
I ,230,237
2,855,971
525.
Golf and Tennis
0
0
0
0
3.79.1.421
610.
Inf. Renov. and Repl.
0
0
0
0
0
0
0
0
All Funds
FY 2017/18 Total
32,314.247
32.782.531
4.369.109
2.210.305
5.123.761
4,301.891
6,503.263
2,246.524
3.176.816
93,028,447
3.058.195
8,483.007 (2,025,000)
1,162.723
2.176,477
68,806
I 0.246.090
926,238
2,161,090
3,793A2l
30.051.047
93

Program/Project Description
Environmental Services 360 Water Resources
363 Solid Waste Management
J64 SMaRT Station t
365 Wastewater Manage1nent
366 Regulatory Programs
367 \;J,,:astev\ater Co!lectwn Systems
Total Envtronmental Services
03S. 070.
Genet·al Housing
0
0
0
CITY OF SUNNYVALE APPROPRIATIONS
GENERAL FUND, SPECIAL REVENUE FUNDS, ENTERPRISE FUNDS, CAPITAL PROJECTS FUNDS FY 2017/18 BliDGET
071.
HOME
0
0
0
072. 110.
Community Redevelopment Development
Housing Block Grant
0 0
0
0 0
FUND/SUB-FUND
141.
Park Dedication
0
0
0
0
17S.
Asset Forfeiture
190.
PoliceServices
Aug.
0
0
0
0
0
0
210.
Employment Development
""Swmywlle's shari! of SMaRT Suuion Operatums appears in both Lhc S'o/id Waste Manageml.!l11 Fwul and till! .. )'Mal{/' :'.!~tatum Opt:rations hmd dtw Jo the: interrdali!d nature f~{tJwse.fimd.'i,
NOVA Workforce Services 5 J 0 Employment Development
0 0 0 0 I 0,249_075
Total NOVA \Vorkforce Services 0 0 0 0 0 I0,249.975
/)uc" 1101 include Jndirecl Cost :1/locationfi.;r (h•neral hmd ~.ulmmistrativc support senices; this amoum Is caplured as ajimd transfer
TOTAL OPERATING PROGRAMS I54.04I,OOO 877.933 I 03,988 4I.040 402.762 2,009 243.316 I 0.249.975
Project Operatine 395,974 0 0 0 0
A-7
245.
Parking District
0
0
0
129,70 I
255.
Community Facilities
District #3
0
0
23,055
23,055
0
0
23,055
0
280.
G1\ST1lX
0
0
0
0
0
0
2.025,000
0
94

Program/Project Desniption
CITY OF SUNNYVALE APPROPRIATIONS
GENERAL FUND, SPECIAL REVENUE FUNDS, ENTERPRISE FUNDS, CAPITAL PRO.JECTS FUNDS FY 2017118 BUDGET
295.
Youth and Neighbor. Services
385.
Capital Projects
460.
\Vater Supply and Distribution
FUND/SUB-FUND
465.
Wastewater l\1gmt.
485.
Solid Waste Mgmt.
4901100.
SMaRT Station
Operations
490/200.
SMaRT Station Rep I.
510.
Development Enterprise
525.
Golfand Tennis
610.
lnf. Renov. and Repl.
All Funds
FY 2017118 Total
----------------------------------------------------- --------------- ---------------- ------------------ --------------- ----------------- ------------- ------------------------------------- ----------------- ---------------- ---------------Environmental Services
360 Watc1 Resources 0 0 7,225,920 0 68,957 0 0 7,294,877
363 Solid Waste Management 37.3-11,694 0 0 0 0 0 37,341,694
364 SMaRT Station' 0 0 0 26,914,053 0 0 0 0 26,914.053
365 Wastewater Management 10.601,381 0 0 0 0 0 0 10,601.381
366 Regulat01y Programs 0 20.066 5.176,914 13,710 0 0 6,829 0 0 5.218.420
367 WastcV\ater Collect! Oil Systems 0 3,265,515 0 0 0 46,867 0 0 3,335.437
~--~--~--~~~-- -------------- ---------------- ---------------- --------------- ---------------- -------------~-- -------------- ------------~- --------------- ------------------Total Environmental Services 0 7.246,886 19,043,811 37,355,404 26,914,053 122,653 0 90,705,863
-------------- ------------------ ---------------- --------------- ------------------ ------------------ ----------------- ------------- ----------------- ------------- -------------------* ,\'wmyvule's share ofSA4aRT Sial ion Opera/ions appears m holh the Solid WusJe A.fanagemelll Fund and the ._\'AfaRTStatiun Operalwns Fund due lo the mterrelal<!d nulure (~fthese.flmJs.
NOVA Workforce Services-!< 5 I 0 Employment Development
0 0 0 0 0 1 0,24()_975
Total NOVA \Vorkforce Services 0 0 0 0 0 10.249,975
J)oes notmclude indirect ( 'osf Allocafwnfin· <leneru/ hmd administralive support services; 1/us amuwlt IS caplllred as a fimd 1rw1.~[er
TOTAL OPERATING PROGRAMS 870.152 37,210.952 19,043,811 37.355,404 26,914,053 0 11,347,884 3,793.421 304,675.456
Project Operating 45,900 (667,420) (225,546)
A-8 95

Program/Project Description
PROJECTS
035.
General
070,
Housing
801351 Sunny\ ale Conttibutton to SMaRT Station Equipment Rep. Fund 0
#
#
803501 CDBG Housmg Rehabilitation Re\·olving Loan Fund
803700 Leadership Sunnyvale [GF] 6,000
805253 Sewer Emergency Repair and Replacement 0
8063 51 Land Development and C'ap1tal C'onsttuctton 0
811250 SMaRT Station·f:l Eqwpment Replacement 0
812701 Home Access, Pamt, Emergency Repmr, and Energy~Etlic1ency 0
816000 Futm e Traffic S1gnal Const1 uction
816050 Minor Repatt ofCtty Bndges and Culverts 0
818550 Park Buddmgs ~ Rehabtlitation 0
818600 Sen10r Center Buildmgs- Rehabilitation 0
818700 Corporattol\ Yard Buildmgs- Rehablittatton 0
819720 Outstde Group Fundmg Support lGFJ 100,000
8 I 9840 Pol1ce Serv1ces Equipment Acquisition 0
820 120 Repaint Street L1ght Poles 0
820 130 Routme Resm f:Kmg of Ctty Owned Pa1 king Lots 0
820 I 40 ComputeJ,'RadJo Controlled Landscape Medmn II rigatwn 0
820180 Traffic S1gnal Controller Replacement 0
820190 Traftic Signal Hardware & \\'inng
820200 Traftlc Signal Light Emitting DJOde {LED) Array Replacements 0
820240 Park Tennis/Basketball Court Reconstruction 0
820280 Park Furniture and Fixtures Replacement 0
820570 Minor Bmldmg Modlf'ications
# ~~= 82! 0 I 0 Mmntennnce of City Owned Properties- Dovvntown
2.448
0
0
0
0
0
0
0
0
0
0
CITY OF SlJNNYVALE APPROPRIATIONS
GENERAL FliND, SPECIAL REVENUE FUNDS, ENTERPRISE FUNDS, CAPITAL PROJECTS FUNDS FY 2017/18 BUDGET
071.
HOME
0
0
0
0
0
0
0
0
0
0
0
0
0
0
0
072. 110.
Community Redevelopment Development
Housing Block Grant
230,000
0 0
0 0
0 0
0
0 40,000
0 0
0 0
0 0
0 0
0 0
0 0
0
0 0
0 0
0
0
0
A-9
FUND/SUB-FUND
141.
Park Dedication
0
175.
Asset Forfeiture
0
0
0
0
0
0
0
190.
Police Services
Aug,
0
0
210.
Employment Development
0
0
0
0
0
0
0
0
0
0
0
0
0
0
0
0
0
245.
Pat·king District
0
0
0
0
0
0
0
0
0
0
0
0
0
0
0
255.
Community Facilities
District #3
0
0
0
0
280.
Gas Tax
0
0
96

CITY OF SUNNYVALE APPROPRIATIONS
GENERAL FliND, SPECIAL REVENUE FUNDS, ENTERPRISE FUNDS, CAPITAL PRO.JECTS FUNDS FY 2017/18 BUDGET
Program/Project Description
PRO.JEC'TS
295.
Youth and Neighbor. Services
385.
c~lpital
Projects
801351 Sunny\ ale Cont1ibut10n to SMaRT Station Equipment Rep. Ftmd 0
80350 I CDBG Hous111g RehabditatJon Revolving Loan fund
803700 Leaderslup Sunn}va!e !OF]
805253 Sewer Emergency Repair nnd Replacement
80635 I Land Development and C'ap1tal Construction
81 ! 250 SMaRT Station® Eqmprnent Replacement
0
460.
Water Supply and Distribution
0
0
0
0
408,000
FUND/SUB-FUND
465.
\Vastewater Mgmt.
0
0
0
204,000
485.
Solid WHste Mgmt.
138,200
490/100.
SMaRT Station
Operations
0
0
0
0
0
490/200.
SMaRT Station Repl.
0
0
0
0
0 0 0 172,578 81270 I Horne Access, Pamt, Emergency Repa1r, and Energy-EfticJency
0 816000 Futute Traffic S1gnal ConstJuct!On
816050 Minor Repai1 ofC1ty Bndges and Culve1ts
818550 Park Bwldmgs- Rehab11itation
818600 Sell!or Center Bmldings- Rehabilitation
818700 CorporatiOn Yard Buildmgs- RehabdJtattOn
819720 Outside Group Fundmg Support [GF]
819840 Police Services Eqmpment Acquisition
820 120 Repamt St1 eel L1ght Poles
820130 Rout me Resurfacmg of City Owned Pm kmg Lots
820140 Compute1:Rad1o Controlled Landscape Medtan hngation 0
820180 Trame Signal Controller Replacement
820190 Traffic Signa[ Hardware & \Vi ring
820200 Traffic Signal Light Em1tting Diode (LED) Array Replacements 0
820240 Park Tennis.'Basketbal! Court Reconstruction
820280 Park Furniture and Fixtures Replacement
820570 Minor Btuldmg Mod1tications
82 J 0 I 0 Maintenance of City Owned Properttes- Downtovvn
0
72.197
0
0
0
0
0
0
0
0
0 0
0 0 0
0 0
0 0 0
0 0 0
0 0 0
0 0 0
0 0
0 0
0 0 0 0
0 0 0
0 tl
0 0 0 0
0 0 0
0 0 0
0 0 0
0 0
0 0 {)
A-10
510.
Development Enterprise
0
0
0
0
0
0
0
0
0
0
0
525.
Golf and Tennis
610.
lnf. Renov. and Rep!.
All Funds
FY 2017/18 Total
138,200
230,000
6,000
204,000
408,000
172.578
40,000
72,197
5,100
1.517.760
26,214
61,200
100,000
136,596
244.800
85,285
102,000
179.061
663,000
119,340
380,460
112.200
10,200
2,448
97

Program/Project Descf'iption
823750 BMR Compliance Enforcement
035.
General
824281 Leak Detection and Condition Assessment Progrnm
8243-t 1 Wastev.-ater Cost ofServ1ce Study
070.
Housing
0 10.000
0 0
0 0 824571 ProJeCt Management for To\.Vlt Center Development Agreement
0 0 82477 I SC\VP Pnmmy Process Design and Construction
0 0 825070 B1cycle Map Revision
51.000 0 825290 Pavement Rehabilitation
0 0 825301 Pressure Reducing Valve Replacement
0 0 825340 Street L1ghts Conduit Replacement
0 0 825361 Replacement,-Repail, Rehabilitation of Storm Dram System
0 0 825451 C1ty-w!de \\'ater Line Replacement
0 0 825521 WPCP Bwsohds Proce;;sing
0 825530 TransportatiOn Model Update
0 0 825570 239-241 Commerctal Street Property Maintenance
5.100 0 825700 General Plan Updates
102.000 0 825730 Pedestrian L1ghted Crossv,a!k Mamtenance and Replacement
0 0 825740 Battery Backup System tOr Traffic Signals Maintenance
0 0 825850 Swim Pools Jntl"astructure
# 0 0 825961 SC\'URPPP Contracting and Ftscal Agent
0 0 826320 FY 15-16 Recruitment and Training for Sworn Otlicers
357 .000 0 826330 FY 16-17 Recruitment and Tramtng for S\\Orn Officers
2,661,838 0 826340 FY 17-18 Recnutment and Training for Sworn Oftlcers
3.073.117 0 826350 FY 18-19 Recruitment and Trmning for Sworn Offtcers
111,776 0 82(~520 Pre-Development Costs on Affordable Housing Stte:s
0 20.000 826710 Washington Community Swim Center
0 0 826790 Sunny'. ale Avenue Median from iowa to \Vashington
0 0
CITY OF SUNNYVALE APPROPRIATIONS
GENERAL FUND, SPECIAL REVENUE FUNDS, ENTERPRISE FUNDS, CAPITAL PRO.JECTS FUNDS FY 2017/18 BliDGET
071.
HOME
0
0
0
0
0
0
0
0
0
0
0
0
0
0
0
()
0
0
0
0
0
0
()
0
072.
R~development
Housing
0
0
0
0
0
0
0
0
0
0
0
0
0
0
0
0
0
0
FUND/SUB-FUND
IJO.
Community Development Block Gnwt
0
0
0
0
0
0
0
0
0
A-11
141.
Park De-dication
0
0
0
0
0
0
0
0
0
175.
Asset Forfeiture
0
0
0
0
0
0
0
0
0
0
190.
Police Services
Aug.
()
0
0
0
0
0
0
0
0
0
0
210.
Employment Development
0
()
0
0
0
0
0
0
0
0
0
0
0
245.
Parking District
0
0
0
0
0
0
0
0
0
255.
Community Facilities
District #3
280.
Gas Tax
0
0
0
0
()
0
0
0
0
0
0 0
0
0
0
0 0
0 0
0 0
0
0
0
0
0
98

CITY OF SUNNYVALE APPROPRIATIONS
GENERAL FUND, SPECIAL REVENUE FUNDS, ENTERPRISE FUNDS, CAPITAL PROJECTS FUNDS FY 2017/18 BUDGET
295. 385.
Program/Project Desct·iption
Youth and Neighbor. Services
Capital Projects
823750 BMR Compl1ance Enforcement
824281 Leak Detection and Condition Assessment Program 0
824341 Wastewater Cost of Service Stud) 0
82457 I ProJeCt Management for Town Center Development Agreement 0
824771 SC\VP Primary Process Design and ConstructiOn 0
825070 Bicycle Map Rev1sion 0
825290 Pavement Rehab!IJtatton
825301 Pressure Reducing Valve Replacement
825340 Street L1ghts Condu1t Replacement
825361 Replacement.Repai1 RehabilitatiOn of Storm Dra1n System 0
825451 Cit;-wide \Vater Line Replacement
825521 WPCP B10solids Processing 0
825530 Transportation Model Update 0
825570 239-241 Commercial Street Propetty Maintenance
825700 General Plan Updates
825730 Pedestrian Lighted Crosswalk tvtaintenance and Replacement 0
825740 Battery Backup System for Tratlic Signals Maintenance 0
825850 Swim Pools Infrastructure
825961 SCVURPPP Contracting and Ftscal Agent
826320 FY 15-16 Recruitment and Trainmg for Sworn Officers 0
826330 FY 16-17 Recru1tment and Trammg for Sworn OffiL·ers 0
826340 FY 17-18 Recruitment and Traming for Sworn Officers 0
826350 FY 18-19 Recruitment and Traming for Sworn Officers 0
826520 Pre-Development Costs on At10rdable Housing Sttes
826710 \t\'ash1ngton CommunJty Swim C'enter
826790 Sunny\ ale Avenue Median from lm\a to Washington 0
0
15,300
0
0
0
5,647,740
250,000
460.
Water Supply and Distribution
45,900
()
0
0
122,400
0
1,552,785
0
0
0
0
0
0
0
0
0
0
0
FUND/SUB-FUND
465.
\V'astcwater Mgmt.
0
20.400
0
38,030,000
0
0
0
51,000
1,683,000
0
0
0
0
0
0
50,000
0
0
0
0
0
0
48:>.
Solid \Vaste 1\lgmt.
A-12
0
0
0
0
0
0
0
0
0
0
0
0
0
0
490/100.
SMaRT Shttion
Operations
0
0
0
0
490i200.
SMaRT Station Rep!.
0
0
0
0
0
0
0
0
0
0
0
0
0
0
0
0
0
510.
Development Enterprise
525.
Golf and Tennis
0
610.
Inf. Renov. and Rep f.
All Funds
FY20!7/18 Total
10,000
45,900
20,400
38,030,000
51,000
3,060,000
122,400
10.200
51,000
1,552,785
I ,683,000
I 5,300
5,100
102,000
5.100
38,541
502,814
50,000
357.000
2,661,838
3.073, I I 7
111.776
20,000
5,647.740
250,000
99

035.
ProgrmnJProject Descr·iption General
826890 Mathilda. 237 10 I Interchange Improvements
827160 Sunny,_a\e Tennis Center C'oun RehabihtatJon
827180 Automation ofVVater Meter Reading
827550 Outsrde Group Fundrng Support [C'DBG]
827570 Downtown Parking District Major Maintenance
828030 Annual Slurry Seal of C'it;; Streets
828100 First-T1me Homehuyer Loans
828150 Pollee Serv1ces Equipment- Cell Phones
828260 Replace SMaRT StatJOn
828400 GolfBwldmgs Renovations
828750 Tenant Based Rental Assrstance (HOME)
829070 Lav.rence Express\\3) Sanitary Sewer RehabilitatiOn
829080 Storm System Trash Control De.,i.:es
829400 Sidev.alk, Curb and Gutter Replacement
829440 Land Acquisition Due Diligenl'e
070.
Housing
0 0
0 ()
0 0
0 0
0 300,000
0 0
0 0
0 0
0 0
0 0
0 820510 Emergency Medical D1spatch F1rst Re;,;ponder Incenti\e Funding
98,000 0 82'>560 Sunnyvale \Vorkforce Development Program-DST
0 0 820620 OO\\·ntown Association
30,000 829630 C'ounciJ Set Aside
100,000 0 830170 Refw bishment of \Vater Tanks
830180 Landfill Post-Closure ErosiOn Prevention 0 0
830200 Repairs to the Secondary Process
830240 SC\VP Program Management 0
830280 Sunny\ ale Baylands Park Infrastructure
0 0 830490 Fremont Pool Infrastructure Improvements
# 0 830580 Emergency Generator Installation
0 0
CITY OF SUNNYVALE APPROPRIATIONS
GENERAL FUND. SPECIAL REVENUE FUNDS, ENTERPRISE FUNDS, CAPITAL PROJECTS FUNDS FY 2017118 BUDGET
071.
HOME
0
0
0
441,221
0
0
0
072.
Redevelopment Housing
0
0
0
0
0
0
0
0
110.
Community Development BlockGnlnt
0
175,500
0
0
0
0
0
0
0
0
0
0
0
404,000
0
0
0
0
0
0
0
0
A-13
FlJND/SllB-FllND
141.
Park Dedication
0
0
0
0
0
175.
Asset Forfeiture
0
0
0
0
190.
Police Sen.' ices
Aug.
0
0
0
0
0
0
0
0
0
0
0
0
0
0
0
0
210.
Employment Development
0
0
0
0
245.
Parking District
0
0
0
I 02,000
0
0
0
0
255.
Community Facilities
District #3
280.
Gas Tax
0
0
0
0 0
0
0
0
0
0 0
0
0 0
0
0
0
0
0 0
0
0 0
0
0
0
0
0
100

CITY OF SUNNYVALE APPROPRIATIONS
GENERAL FliND, SPECIAL REVENUE FUNDS, ENTERPRISE FUNDS, CAPITAL PRO.JECTS FUNDS FY 2017/18 BUDGET
Progrnm/Project Description
295.
Youth ~md Neighbor. Services
826890 Mathilda/237, 101 Inten~hange Improvements
827160 Sunnyvale Tennis Center Cow1 Rehabihtat1on
827180 Automation of\\.ateJ Meter Readmg
827550 Outside Group Fundmg Support [CDBGJ
827570 DO\vntown Parkmg D1strict Major f\faintenance
828030 Annual Slurry Sea! ofC'it;. Streets
828100 First-Time Homebuyer Loans
828150 Pollee Serv1ces Equipment- Cell Phones
828260 Replace SMaRT Station
0
0
0
0
0
0
0
()
385.
Capital Projects
27,750,000
0
0
0
0
0
0
0
460.
Water Supply and Distribution
0
0
204,000
0
0
0
0
0
FUND/SUB-FUND
465.
\\'astewater Mgmt.
0
0
0
0
0
0
0
0
485.
Solid Waste Mgmt.
0
0
0
0
0
0
0
0
490/100.
SMaRT Station
Oper~ltions
0
0
0
0
0
0
0
0
490/200.
SMaRT Station Rep I.
0
0
0
0
()
0
0
0
0 0 0 0 0 0 100,000 828400 GolfBtuld1ngs RenovatiOns
0 0 0 0 0 0 0 828750 ·Tenant Based Rental Assistant:e (HOME)
0 0 0 0 0 0 0 829070 Lawrence Expressway San1tary Sewer Rehabilitation
0 0 0 1,428,000 0 0 0 820080 Storm System Trash Control De'vit.:es
0 0 0 183,600 0 0 0 829400 Sidewalk, Curb and Gutter Replacement
0 0 0 0 0 0 0 829440 Land Acquisition Due Diligence
0 25.000 0 0 0 0 0 829510 Emergency Medical D1spatch First Responder Incentive Fundmg
0 0 0 0 0 0 0 829560 Sunny"< ale \Vorkforce Development Program-DST
0 0 0 0 (} 0 0 829620 Dov.ntown Association
0 0 0 0 0 0 0 829630 Council Set As1de
0 0 0 0 0 0 0 830170 Refurbishment of Water Tank'3
0 0 1.632,000 0 0 0 0 830180 LandtJII Post-Closure ErosiL)n Pre\~ntton
0 0 0 0 255,000 0 0 830200 Repairs fl) the Secondary Process
0 0 0 165.000 0 0 0 830240 SC\VP Program Management
0 0 0 4,000,000 0 0 0 830280 Sunn;.•ale Baylands Park Infrastructme
0 0 0 0 0 0 0 830490 Fremont PoollnfJ·astJ ucturt; Improvements
0 0 0 0 0 0 0 830580 Emergency Generator Instal!atwn
0 0 0 0 0 0 0
A-14
510.
Development Enterprise
0
0
0
0
0
0
0
0
0
0
0
0
0
0
0
0
0
0
0
0
0
0
0
0
0
0
525.
Golf and Tennis
0
0
0
0
0
')
0
0
0
0
0
0
0
0
0
0
0
0
0
0
0
0
0
0
0
0
610.
lnf. Renov. and Rep I.
0
95,600
0
0
0
510,000
0
0
0
93,840
0
0
0
1.775.290
0
0
0
0
0
0
0
0
0
269,280
60,343
882,300
All Funds
FY 2017/18 Total
27.750,000
95,600
204,000
175.500
102.000
510,000
300,000
44,639
100,000
93,840
441.221
1,428,000
183,600
I ,775.290
25.000
98,000
404,000
30,000
100,000
1,632,000
255,000
165.000
4,000,000
269,280
60,343
882,300
101

035. 070.
CITY OF SUNNYVALE APPROPRIATIONS
GENERAL FUND, SPECIAL REVENUE FUNDS, ENTERPRISE FUNDS, CAPITAL PROJECTS FUNDS FY 2017/18 BUDGET
FUND/SUB-FUND
071. 072. 110. 141. 175. 190. 210. 245. 255. 280.
~~-~·------------- ---------------- ------------------ --------------------- ------------------ --------------- ------------ ---------------- ----------------- ---------------- ---------------- ----------------
Program/Project Description Gene•· a! Housing HOME
Redevelopment Housing
Community Development Block Grant
Park Dedication
Asset Forfeiture
Police Services
Aug. Employment Dt'"velopment
PM king District
Community Facilities
District #3 Gas Tax --------------------------------------------- ----------------- ---------------- ---------------- ----------------- ---------------- ---------------- --------------- --------------- ------------------ -------------- ----------- _______ ':' _______
830600 Lakewood Branch L1brury Facility 0 0 0 0 0 0 0 0 0 0 0
830630 Dispute ResolutiOn Services 45.000 () 0 0 0 0 0 0 0 0 0 0
830901 Transpo11atwn <md Traffic Sen1ce;; Staff Augmentation {510) 0 0 0 0 0 0 0 0 0 0 0 0
830910 Zero \Vaste Strateg1c Plan 0 0 0 0 0 0 0 0 0 0 0 0
831290 Climate Actiun Plan lmplemt>!ntatwn 178.500 0 0 () 0 0 0 0 0 0 0 0
831310 Minimum Wage EnfOrcement Agreement 30,000 0 0 0 0 0 0 0 0 0 () 0
831320 RD.\ Counsel Fees 40,000 0 0 0 0 0 0 0 0 0 0 0
831360 Recreation Fee \Vaiver 47.871 0 0 0 0 0 0 0 0 0 0 0
831450 Public V\1orks Development Engmeering Starting () 0 () 0 () 0 0 0 0 0 0
831470 SC\VP Construction Management 0 0 0 0 0 0 0 0 0 0 0
831490 Website Redes1gn Implementatwn, Upgrades and Maintenance 100.000 0 0 0 0 0 0 0 0 0 0 0
831510 Green Streets fm Stormv,ater 0 0 0 0 0 0 0 0 0 0 0
831550 Adjust Water UtJiitie:; In Support of Paving Projects 0 0 0 0 0 0 0 0 0 0
831580 ADA ProJects and Emergency Concrete Replacement 0 0 () 0 0 () 0 0 0 0 0 0
83 J 590 lnte!iigent Transportation Systems 0 0 0 0 0 0 0 0 0 0 0 306,000
83 J 600 Solar Installations on City Facilities 0 0 0 0 0 0 0 0 0 0 0 0
831680 Adjust Sewer Utilit1es In Support of Paving Projects 0 0 0 0 0 0 0 0 0
83 J 690 Storm System Trash Reduction Programs 0 0 0 0 0 0 0 0 0
831730 WPCP Ox1dation Pond Levee Rehabilitation 0 0 () 0 0 0 0 0 0 0 0
831761 Homeless Prevention and Rapid Re-Housing (HPRR} 0 0 0 250.000 0 0 0 0 0 0 0
831770 1!1wmnated Street Stgn Replacement Project 65.280 0 0 0 0 0 0 0
831830 Lakewood Park Renovatwn and Enhancement 0 0 0 0 0 0 0 0 0 0 0 0
831840 Cathodic ProtectiOn SFPU(' Turnouts and Transm1ssion Pipeline ~ 0 0 0 0 0 0 0 0 0 0 0
831860 John \V. Chnstian Greenbelt Pathway Rehabilitation 0 0 0 0 0 0 0 0 0 0 0 0
831870 Preventive Maintenance for Vanous Bridges 0 0 0 0 0 0 0 0 0 0 0 255,000
831880 Preschool Outdoor Play Area 0 0 () 0 0 0 0 0 0 0 0 0
A-15 102

CITY OF SUNNYVALE APPROPRIATIONS
GENERAL FUND, SPECIAL REVENUE FUNDS, ENTERPRISE FUNDS, CAPITAL PROJECTS FUNDS FY 2017118 BUDGET
Program/Project Description
830600 Lakewood Branch Library Facility
295.
Youth and Neighbor. Services
385.
Capital Projects
10,000,000 830630 Dtspute Resolut1on Services
83090 I Transportation and Traftic Services Staff Augmentation (510) 0
830910 Zero \Vaste Strategic Plan
831290 Clunate Action Plan lmplementatwn
8313!0 Minimum \Vag,e Enforcement Agreement
831320 RDA Counsel Fees
831360 RecreatiOn Fee \Vaiver
831450 Public \\1orks Development Engineering Stalling
831470 SC\VP Construction Management
831490 Website Redes1gn Implementation, Up-grades and Mamtenance 0
831 5 l 0 Green Streds for Storm\'.cater
831550 Adjust Water Utilitu:s In Support of Paving ProJects
831580 ADA Projects and Emergency Conc1 ete Replacement
831590 Intelligent Transp01tation Systems 0
831600 Solar Installations on City Facditles 0
831680 Adjust Sewer Utilitie-s In Support ofPavmg Projects ()
831690 Storm System Trash Reduction Programs
831730 WPCP Oxidation Pond Le\ee Rehabilitation
831761 Homeless Prevention and Rap1d Re~Housing (HPRR)
831770 Illuminated Street S1gn Replacement Project
831830 Lakewood Park RenovatiOn and Enhancement 0
831840 Cathodic ProtectJOn SFPUC Turnouts and Transmission Pipeline 0
831860 John W Chnstian Greenbelt Pathway Rehabilitation
831870 Preventive Maintenance for Vanous Bridges 0
831880 Prescht1ol Outdom Play Area
0
0
0
0
0
0
0
0
460,
\\'ater Supply and Distribution
0
0
0
0
FUND/SUB-FUND
465.
Wastewater Mgml.
0
0
0
485,
Solid \Yaste l\lgmt.
2,4!0,409
0
0
0
A-16
4901100,
SM>~RT
Station Operations
0
490.'200.
SMaRT Station Repl.
0
0
0
0
0
()
0
510,
Development Enterprise
0
!50,000
0
0
71,400
0
0
0
0
0
525.
Golf and Tennis
0
0
0
0
0
0
610,
Jnf. Renov. and Repl.
0
0
0
76,500
All Funds
FY 2017/18 Total
10,000,000
45,000
150,000
2,410,409
178.500
30,000
40,000
47,871
71,400
2,730,000
100,000
425,000
81,600
76,500
306,000
1,264,800
81,600
357,000
306,000
250,000
65,280
12,330,074
816,000
145,350
255,000
270,606
103

035. 070.
CITY OF SUNNYVALE APPROPRIATIONS
GENERAL FliND, SPECIAL REVENUE FUNDS, ENTERPRISE FUNDS, CAPITAL PROJECTS FUNDS FY 2017118 BUDGET
FUNDISlJB-FUND
071. 072. llO. 141. 1'75. 190. 210. 2-15. 255. 280. ------------- ---------------- ---------------- ---------------- ----------------- -------------- -------------- --------------- ----------------- -------------- ----------------- ------------
Program/Project Description Genentl Housing
#
83191 0 E. v...·ashington Ave and E_ E' elyn Ave Park Des1gn
831920 Fair Oaks/Highway 237 Preliminary Park Des1gn
831980 Annual State of the City 40,800
832040 Persmn Dnve Sidev..alk Extenswn (CDBG)
832100 InteJsection of Mathilda Avenue and Indio \Vay 0
832160 Eng. Services for TranspoJtation Related ProJect:;..'Pnoritu:s
440,000 832280 Maintenance for Citv-owned Property at 1484 Ktfer Road
12,240 832290 Safe Routes to School Program
138,679 832310 Silicon Valley Talent Partnership
3,000 832320 Implementation of Green B1ke Lanes
250,000 832360 Sustainabil1ty Speaker Senes
25,500 832450 ATMS Upgrades- Data CollectiOn and Display Enhancements
0 832510 Tranlc Signals Timing Plan- Fremont Avenue
0 832520 Traffic Signals Timmg Plan- Hollenbeck Avenue
0 832530 Tratlic S1gnals Timmg Pian- Mary Awnue
0 832540 Traffic Signals Timmg Plan~ Remington Drive
0 832730 Washington Pool Infi·astructure Replacement and Renovation
0 833060 Annual D1gester Cleanmg
0 832840 Fire Station 2 Trainmg Trailer Mamtcnance
9,636 832880 Fire Station Mastel Plan
0 833070 V\ PCP Electromc Operations & Maintenance Manual
0 832850 DPS Alarm Permitting, Billing and Tracking Softv.;are
50,000 832890 Bicycle Master Plan Update
350,000 833080 WPCP Waste Gas Burner Replacement
0 832920 Bernardo Avenue Bicycle Undercrossmg Environmental Analysis
0 832930 East Sunny\ ale Area Transpottatlon Improvements
HOME
0
0
0 0
0 0
0 0
0
0
0
0
0
0
0
0 0
0
0
0 0
0
0
0
0 0
0
0
0 0
Community Redevelopment Development
Housing Block Grant
0
0
0
0
0
0
0
0
0
0
0
0
0
0
0
0
0
0
0
0
0
0 0
0 0
0
A-17
Park Dedication
0
0
0
Asset Forfeiture
0
0
0
0
0
0
0
0
0
0
Police Services
Aug.
0
0
0
Employment Development
0
0
0
0
0
0
0
0
0
0
0
0
0
0
0
0
0
P~1rking
District
0
0
0
0
0
0
0
0
0
0
0
0
0
0
0
0
0
0
0
0
Community Facilities
District #3 G}tsTax
0
0 0
0
0
0
0 0
0
0 0
0
0
0 0
0 0
0
0 0
0 0
0
0
0 0
0 0
0 0
104

CITY OF SUNNYVALE APPROPRIATIONS
GENERAL FUND, SPECIAL REVENUE F!INDS, ENTERPRISE FUNDS, CAPITAL PROJECTS FUNDS FY 2017/18 BUDGET
Progn1m/Project Descl'iption
295.
Youth and Neighbor. Services
831910 E \Vnshmgton Ave and E. Evelyn Ave Park Design
831920 Fmr Oaks/Htghway 237 Prelimmary Park Design
831980 Annual State of the Ctty
832040 Persian Drive Sidewalk Extenswn (CDBG)
832100 Intersection of Mathilda Avenue and Indio \\ay
832160 Eng Services fur TransportatiOn Related ProJects.'Priont!es 0
832280 Maintenance for Clt\-OVvlled Property at 1484 Ktfer Road 0
832290 Safe Routes to School Program
8323\0 Silicon \'alley Talent Partnership 0
832320 Implementation of Green Bike Lanes 0
832360 Sustainability Speaker Series 0
832450 ATMS Upgrades- Data Collection and D1splay Enhancement::.
385.
c~1pital
Projects
51,000
102,000
300,000
0 500,000 832510 Traffic Signals Timmg Plan- Fremont Avenue
0 832520 Traff1c Signals Timmg Plan- Hollenbeck Avenue
0 832530 Trallic Signals Timmg Plan- Mary A\enue
832540 Trafllc S1gnals Timmg Plan- Remington Drive
832730 Washmgton Pool Jnfbstructure Replacement and Renovation 0
833060 Annual Digester Cleanm~
832840 Fire Station 2 Training Trailer Mamtenance
832880 Fne Station Master Plan
833070 WPC'P Electromc Operatwns & Maintenance Manual
832850 DPS .'\!arm Permitting, Billing and Tracking Software 0
832890 Bicycle Master Plan Update
833080 WPC'P \Vaste Gas Burner Replacement
55.321
59,869
98,724
38,897
0
0
0
0
0
0 832920 Bernardu Avenue Bicycle Undercrossmg EnvJronmental AnalySIS
0 632,911 832930 East SunriJ vale Area Transportation lmpro .. ements
3,857,500
460.
\\'ater Supply and Distribution
0
0
0
0
0
0
FUND/SUB-FUND
465.
\Vastewater Mgmt.
0
0
0
0
0
0
0
0
485.
Solid Waste Mgmt.
0
0
0
0
0
0
0
0
0
490/100.
SMaRT Station
Operations
0
0
()
0
0
0
0
0
0
0
0
490/200.
SMaRT Station Rep!.
0
0
0
0
0
0
0
0
510.
Development Entt'rprise
0
0
0
0
0
0
0
0
0
0
0
0
0
525.
Go1fand Tennis
0
0
0
610.
Inf. Renov. and Repl.
0
All Funds
FY 2017/18 Total
51,000
102,000
40,800
448,500
300,000
440,000
12,240
138,6 79
3,000
250,000
25,500
500,000
55,321
59,869
98,724
38,897
7,186
81,600
9,636
382.500
306,000
50,000
350,000
175,000
632,911
3,857,500
105

Program/Project Description
035.
Genel'al
8329-+0 Fa1r Oaks Avenue Bike Lanes and Streetscape- Phuse 2 0
832950 Fremont Avenue Btke\vay and Streetscape ImprO\-ements 0
832960 Java DrTI,e Road D1et and Bike Lanes
832970 Lawrence Station Area Sidev.-alks and B1cyle Faci!JtJes 0
832980 Peel) Park Area TranspotiatJon Improvements
832690 L1brary Plumbing Study 50.000
832990 SunnJ vale Roadwav Pavement Rehabilitation
833000 Sunnyvale Trame Signal Upgrades
832750 Upgrade Park Pathv.-ay Lighting to LED
833020 Bicycle and Pedestmn Safety Improvements 0
832770 Serra Park Spray Pool Reno'<atJon 0
833600 Landfill South Hill Dramage Correction 0
833620 Downtown Pedestnan Traffic Signal Systems 0
833110 SC\v P Rehabilitation Influent Pipelines to WPCP 0
833120 SCWP Existmg Plant RehabilitatiOn· Split Flow 0
070.
Housing
833130 SC\VP Caribbean Dnve Parking and Trail Access Enhancements 0
833140 SC\VP Secondary Treatment Improvements~Split Flo\% CAS Stage 1 ()
833150 SC\VP D1gester Supernatant PS and Drainage P1ping Upgrades 0
833160 SCWP Thickening and Oe\\att::nng Facility- Stage I
832800 Baylands Park C'ondJtJOn Assessment Study
833170 SCWP Admimstration and Lab Building
832620 F1re Stations Exterior Window Upgrades 0
833180 SC'\VP Maintenance BUJldmg
832630 Pilot Grant Writer at ('NC' 182,235
832810 Performing A1is Center Infrastructure
832640 AdtmmstratJve Hearing Officer 51.000
0
0
0
0
0
0
0
0
0
0
0
0
0
0
0
0
0
CITY OF SUNNYVALE APPROPRIATIONS
GENERAL FUND, SPECIAL REVENUE FlJNI)S, ENTERPRISE FUNDS, CAPITAL PROJECTS FUNDS FY 2017/18 Blii)GET
071.
HOME
0
0
0
0
0
0
(}
072. 110.
Community Redevelopment Development
Housing Block Grant
Fl!NI)/SUB-FUNI)
141.
Park Dedication
175.
Asset Forfeiture
0
0
0
0
0
0
0
0
0
0
0
190.
Police Services
Aug.
0
0
0
0
0
0
0
0
0
0
0
0
0
210.
Employment Development
0
0
0
0
0
0
0
0
0
0
0
0
0
0
0
0
245.
P~trking
District
0
0
0
0
0
0
255.
Community Facilities
District #3
280.
Gas Tax
0 0
0
0 0
0 0
n
0 0
0
0 0
0 0
0
0
0
0
0
0
0
0
0
0
0
0
106

CITY OF SUNNYVALE APPROPRIATIONS
GENERAL FUND, SPECIAL REVENlJE FUNDS, ENTERPRISE FlJNDS, CAPITAL PRO.JECTS FliNDS FY 2017118 BUDGET
FUND/SUB-FUND
295. 385. 460. 465. 485. 490/100. 490/200. 510. 525. 610. All Funds -~------------ ----------------- --------------- ------------- ------------- ----------------- ----------------- ---------------- ------------------ -------------- -----------------
Program/Project Description
Youth and Neighbor. Services
832940 Fair Oaks Avenue B1ke Lanes and Streetscape- Phase 2 0
832950 Fremont Avenue Bikev.ay and Streetscape Improvements 0
832960 Java Dri\e Road D1et and Bike Lanes
832970 Lm,.:rence Station Area S1dev<'alks and Bicyle Fact!itJes 0
832980 PeeJ) Pa1k Area Transp011atwn Improvements
832690 Library Plumbing Study 0
832990 Sunnyvale Roadway Pavement Rehabilitation
833000 Sunnyvale Traftic S1gnal Upgrades 0
832750 Upgrade Park Pathway Ltghting to LED
833020 Bicycle and Pedestian Safety Improvements
832770 Serra Park Spray Pool Reno\atwn
833600 Landfill South H.jll Drainage Correction
833620 Dov.ntown Pedest11an Traffic Signal S)stems 0
833110 SCWP Rehalnlitatlon Influent Pipelines to IVPCP 0
833120 SC\VP E>.istmg Plant Rehabtlttatwn- Spilt Flow 0
Capital Projects
990,500
1.575,000
632,911
612.911
3,400,000
1' 183,600
1,714.853
400,000
0
0
250,000
833130 SC\VP Caribbean Dnve Parking and Trail Access Enhancements 0
833140 SC\VP Secondary Treatment Improvements-Spilt Flow CAS Stage I 0
833150 SC\VP Dtgcster Supernatant PS and Dramage Ptpmg Upgrades 0
833160 SCWP Thickening and Dewatenng Facility· Stage l
832800 Bay lands Park Cond1tton Assessment Study 0
833170 SCWP Admintstration and Lab Budding 0
832620 Ftre Stations Exterior Window Upgrades
833180 SC\VP Maintenance Budding 0
832630 PJ!ot Grant Writer at CNC 0
832810 Performing Arts Center lnfra;tructure
832640 Admimstrative Hearing Ofticer 0
0
0
\Vater Supply :md Distl'ibution
0
0
0
0
0
0
0
0
0
0
0
0
0
0
0
0
Wastewater 1\lgmt.
0
0
0
0
0
100,000
1,120,000
370,000
3,010,000
120,000
1,280,000
0
1,230,000
350,000
Solid Waste 1\lgmt.
0
0
0
0
0
0
204.000
0
0
()
0
0
0
0
A-20
SMaRT Station
Operations
0
0
0
0
0
0
0
0
0
0
0
0
0
0
SMaRT Station Rep!.
0
0
0
0
0
0
0
0
0
0
0
0
0
0
0
0
Development Enterprise
0
0
0
0
0
0
0
0
Golf anti Tennis
0
0
0
0
0
0
0
Inf. Renov. and Rep!.
75,000
85,000
66,300
0
FY 2017/18 Total
990,500
1,575,000
632,911
6:12,911
3,400,000
50,000
1,183,600
1."14,853
20,000
400.000
75,000
204.000
250,000
100,000
1,120,000
370,000
3,010,000
120,000
1,280,000
75,000
1.230,000
85,000
350,000
182,235
66,300
51,000
107

035.
Program/Project Description General
R32820 Park Destgn Standards for ConstructiOn 0
832050 C '\P and Green Bulldmg Updates 45.900
832660 Peery Park Housing Study 102.000
833090 Samtmy and Storm System Hydraulic Model Update 0
~32860 Public Safety Headquarters- Security Upgrades 75,000
832590 City Hall Annex Basement Security. Storage 10.000
832600 Installation of Charging Stations for Electnc Vehicles 40,800
832610 Ltbrary LED Lightmg Conversion 148,000
833100 SC\VP- Capltal Replacement 0
833190 SC\VP- Environmental Mit1gatton 0
833200 SC\VP- Oversight 0
832670 Economic Development Strategy 100,000
83JG I 0 Block 15- Affordable Housing Site 0
832870 FY 2017,18 DPS Internal Affairs Assessment 95,000
8330 I 0 Sunnyvale SNAIL Neighborhood Improvements- ATP 0
832680 Charter Assessment 200,000
833630 Emergency Operations Center Design 100,000
TOTAL PRO.JECTS 9,734,92()
070.
Housing
0
0
0
0
0
0
0
0
0
0
0
0
10,000,000
0
0
0
0
I 0,330,000
CITY OF SUNNYVALE APPROPRJA TIONS
GENERAL FUND, SPECIAL REVENUE FUNDS, ENTERPRISE FUNDS, CAPITAL PROJECTS FUNDS FY 2017/18 BUDGET
071.
HOME
0
0
0
0
0
0
0
0
0
0
0
0
()
0
0
0
0
441,221
072. 110.
Community Redevelopment Development
Housing Block Grant
0 0
0 0
0 0
0 0
0 0
0 0
0 0
0 0
0 0
0 0
0 0
0 0
0 0
0 0
0 0
0 0
0 0
250,000 I ,298,000
A-21
FliND/SliB-nJND
141.
Park Dedication
0
0
0
0
0
0
0
0
0
0
0
0
0
0
0
0
0
0
1'75.
Asset Fot·feiture
0
0
0
0
0
0
0
0
0
0
0
0
0
0
0
181,235
190.
Police Services
Aug.
0
0
0
0
0
0
0
0
0
0
0
0
0
0
0
210.
Employment DeYelopment
0
0
0
0
0
0
0
0
0
0
0
245.
Parking District
0
0
0
0
0
0
0
0
0
0
0
102.000
255.
Community Facilities
District #3
280.
Gas Tax
0 0
0
0
0 0
0
0
0 0
0
0
0
0
0
0
0
0
0
566,100
108

Program/Project Desct·iption
CITY OF SUNNYVALE APPROPRIATIONS
GENERAL FUND, SPECIAL REVENUE FUNDS, ENTERPRISE FUNDS, CAPITAL PROJECTS FUNDS FY 2017/18 BUDGET
295.
Youth and Neighbor. Services
385.
Capital Projects
460.
\Vater Supply and Distribution
FlJNDiSUB-FUND
465.
Wastewater Mgmt.
485.
Solid Waste Mgmt.
490/100.
SMaRT Station
Operations
4901200.
SMaRT Station Rep I.
510.
Development Enterprise
525.
Golf and Tennis
610.
Inf. Renov. and Repl.
All Funds
FY 2017/18 Total
-~-~~~--~------------------------------------------------- ----------------- ------------- ------------------- ------------------- ---------------- ------------- ----------------------------------- --------------- ---------------- ----------------832820 Park Design Standards for Construction
0 832650 CAP and Green Btrildmg Updates
0 832660 Pee1y Park Housing Study
833090 Samtary and Storm System Hydraulic Model Update 0
832860 PubltG Safety Hcadquatters- Securit) Upgrades 0
832590 C'itj Hall Annex Basement Securit) Storage
832600 Installation of Charging Stations for Eh:ctnc Vdudes 0
832610 Library LED Lighting Conversion 0
833100 SC\VP- C'ap1tal Replacement
833190 SC\VP- Env1ronmental MitigatiOn
833200 SC\VP- Oversight
832670 Economic Development Strategy
833610 Block IS- Affordable Housing Site
832870 FY 2017/18 DPS Internal A!Tairs Assessment
8330 I 0 Sunn;r vale SNAIL Neighborhood Improvements- ATP 0
832680 Charter Assessment
833630 Emergency Operations Center Des1gn 0
TOTAL PROJECTS 66,295,334 4,862.685 59,882,200 4,272,409
A-22
0 0 100.000 100.000
0 45,900
0 0 102.000
0 0 765.000
0 75,000
0 0 0 10,000
0 0 0 40.800
0 0 148.000
0 410,000
0 460,000
0 0 390.000
0 0 100,000
0 0 10,000,000
0 0 95,000
0 0 0 6,059.100
0 0 200.000
0 0 100,000
272,578 221,400 24,428.144 !83,138,226
109

Program/Project Description
Budget Supplements:
833620 Evaluation of New Re\enue Strateg1es
833640 2017 Housing Strategy
03!\.
Gene1·al
20.000
200,000 833650 Dov.'ntown Development Pohcies for Parkmg
60,000 833660 Wage Theft Ordinance Stud)
20,000 833670 Pubil~; Access Programmmg foJ KSUN2
15,000 833680 Accelerating Climate ActiOn
250,000 833690 Parkland,· Open Space Po!tcy Initiative
250,000 833700 La-wTence Station _\rea Plan Study
200,000
TOTAL BUDGET SUPPLEMENTS 1,015,000
ProJe\.'t AdmJnJstration
454,690 Equrpment
762,595 Lease Payments
1,20 I ,625 OperatiOns Cost Savmgs
GR~NDTOTAL 16 7,605,804
070.
Housing
0
0
0
0
0
0
0
0
0
0
0
0
11,207,933
CITY OF SUNNYVALE APPROPRIATIONS
GENERAL FUND, SPECIAL REVENUE FUNDS, ENTERPRISE FUNDS, CAPITAL PROJECTS FtiNDS FY 2017/18 BUDGET
071.
HOME
0
0
0
0
0
0
0
0
0
545,209
072. 110.
Community Redevelopment Development
Housing Block Grant
0 0
0 0
0 0
0 0
0 0
0 0
0 0
0 0
0
0
291,040 1,700,762
A-23
FUND/SUB-FUND
141.
Park Dedication
0
0
0
0
0
0
0
0
0
1,4<·8,944
0
0
1,468,944
175.
Asset Forfeiture
0
0
0
0
0
0
0
0
0
183,244
190.
Police Services
Aug.
0
0
0
0
0
0
0
0
0
0
243,316
210.
Employment Development
0
0
0
0
0
0
0
0
I 0,249,975
245.
Parking District
0
0
0
0
0
0
0
0
231,701
255.
Community Facilities
District #3
0
0
0
0
0
0
23,055
280.
Gas Tax
0
0
0
0
130,282
0
0
2,721,382
110

CITY OF SUNNYVALE APPROPRIATIONS
GENERAL FUND, SPECIAL REVENUE FUNDS, ENTERPRISE FUNDS, CAPITAL PRO.JECTS FUNDS FY 2017/18 BUDGET
FUND/SUB-FUND
295. 385. 460. 465. 485. 490/100. 490/200. 510. 525. 610. All Funds -~~----------- ----------- ------------------- ---------------- --------------- ------------------ ------------- ----------------- -------------- ----------------- ---------------
ProgranVProject Description
Budget Supplements:
833620 Evaluation of New Revenue Strategtes
833640 2017 Housmg Strategy
Youth and Neighbor. Services
833650 Downto\\'11 Development Policies for Parkmg
833660 V\. age Theft Ordtnance Study
833670 Pubhc Access Prugrammmg for KSUN2
833680 Accelerating Climate .'\ct1on 0
833690 Parkland I Open Space Policy Initiative
833700 LawTence Station Area Plan Study 0
TOTAL BUDGET SUPPLEMENTS
Pruject Administration
Equipment 0
Lease Payments
Operations Co5t Savings 0
GRAND TOTAL 870.152
Capit;ll Projects
0
0
25,017
0
0
66.320.351
Water Supply and Distribution
483,893
44.494,956
Wastewater Mgmt.
0
0
0
0
7 66.083
I, 191,317
502,797
84.336,424
Solid Waste l\'lgmt.
0
0
0
0
0
0
0
0
0
47,285
0
885.415
0
42,359,367
A-24
SMaRT Station
Operations
0
0
0
0
()
0
(}
0
26,914.053
SMaRT Station Rep!.
0
0
0
0
0
0
0
0
0
0
0
832.625
Development Enterprise
0
II ,569,284
Golf and Tennis
0
0
0
0
0
3.793,421
lnf. Renov. and Rep I.
0
0
0
0
0
0
45.680
0
0
24,473,824
FY 2017/18 Total
20,000
200.000
60,000
20,000
15,000
250.000
250.000
200.000
1.015.000
3,421,874
1.953.912
2,589,837
502,436,822
111

PrvgramiProje<:t
EXHIBIT B
CJTY OF Sl!NNYVALE
APPROPRIATIONS
INTERNAL SERVICE FUNDS
FY 2UJ':'!HI BUDGET
FUND!SllB·FUND
595/100. 595/200. ~ 595/210. 5%/350. 5?5"1iOO. M--------- ------------------- ------------ -----------
Flc~·t FHdlitin Sunn,n•k
Office Tct·bnuluj!;y
640/HIO. 6.JU/2UO. 6o.I0!300. 640/401). 6-15. AU Funds --------------------------------------- ---------- ---------· Empln)CC lmurtlnn:~ Proper~·
Bcndih- Rdin•mcnt Workers' &Other Lh11Jilit) & FYZUPJIH
DncriJltion Scn·kl'~ Mgmt. Ccnta Service~
Project Manllf!;l'fflt'lll
(,;,,....ice~ Leave~ Bcncfih Comjlcn~ation Benefits Jnsur. Fund T11t~li ---------------------------------------------- ·-------- ---------------- ------------ ------------ ------------ ---------- ~---------~ ---------~
DEBT SERVICE
Stum;>Jk <Hli~~ Cm\~t {l47,J:." f,47J50
TOTAL DEBT SERVICE t-:n (J o u o o o r,n,l5il ---------- --------- ---------~ ------- -------------- ~--------- ---------- -----------~ ---------- ------------ -----------~ EQUIPMENT
J:qu1pmcn1 2;l6LS5(J 5723&0 ' 7,54!,?i50
TOTAL EQUIPMENT 2,<1 572 ~>:o (J <l.5o7 ,{,2fJ t1 o o 7 .:-. .JJ J:5o ----------- ----------~ -------- -------- ------------ ---------- --------- ---------- --------- ----------- -----------OPERATING PROGRAMS ---------- --------- --------- -------- ----------~ ---------- ----------- ~---------- -------· --------- ---------
Hum:.m!l, uu1n.•. ·:s-1 Jlun~<mE .... .._nuhc:.
..J5q . .J.j.7 4~f{,..l-.J7
l·.mplo.cc L~·Jt"' l:ku~hls- L-:,1\.: J:Jtnd J':'.G':'2%P J7.672JH''
7\.-l RdJHUJC!lL !n:'U! HK•~s. Jnd
1h.51.1.T~' 2.o.5(}(!,05] (>1,0!\1121 71;5 \\oJkcl, Compcnqlwn !· '-"V'- Ju;,m:mw, co~\ uft'!u1m .. and I ~-1\<.: ]]oms J'Jhcu
5,1SJ.946 5,hl,'·-lh "';;7 CJ\. l.wh1hl~ and l'I~'P<.!! I'; Jnsman..:, and CJ.um c,·~Js
I :-115,:"~9 1,415,5>')
~------------ ------------ ----------- ---------- -----------~ ------------- ~------- ----------- ------------ ---------- --------~ '!\,Ia! I Iuman R~·~mucc~ l"',h"'2J>1> ;\'·Sl'T· .5,1Sl,'J46 2,,,\(lt),I}5J 1,,1;71.'':{(> S7,'J-12572
--------~ ---------- --------------- --------- ~--------- -------- ------------- ~--------- ----------lnJ<uma\!on ·r.·dmohn;
..,-16 ll Scntv·,,mJSuppun
'JJ-1()"5' t) 14'·05>
---------- ---------- ----------- ---------- ---------- ------------ ·-------- ---------- ---------- ----------- ----------r<.l!:;]/l\bllll,\tJUn'J\.:;:h!h'JOg' '.l,l4/J,(6> '•,1-J•;.o•>
---------- ---------- ------- ---------- ---------~ ------------- ---------- ·--------- -------------- ~-------- -----------J>lmmmt:
T•>l<~l t lffK~ <if !11~ C!l>; J\L.!H<.~g.~r '))\h2 1,,;,!\(,2
l'ubh,W.ak ;1(1') ( '<p!I,JJJ'JHI~·d~ .\Jtnm!S(h\(Hlll
1 .. l3'>;.\ . .f6 ;,3;'115,64(>
70'' l'.K!ll1_, S.-pl~C 4A6.iJl.J 275,4-;A 4.7'1~.75>
~-,':\ l'!WdSIOll of Vdu.:k~ Ml<.l L1o10ll/cd rcllUJl!lH.'ll1
,U')IJ1j i.6ll:J,'I.:.l
Tot<~ll'uhiKWU!h'> ;,6M.tl21 .JA"'Ul.:J 27J_.nR 0 >,:;-;&,646 0 (l 0 11 ~--------- ---------- --------- ---------- -----------~ ------------ ---------- ~--------- ---------- ------------- ---------
B-1 112
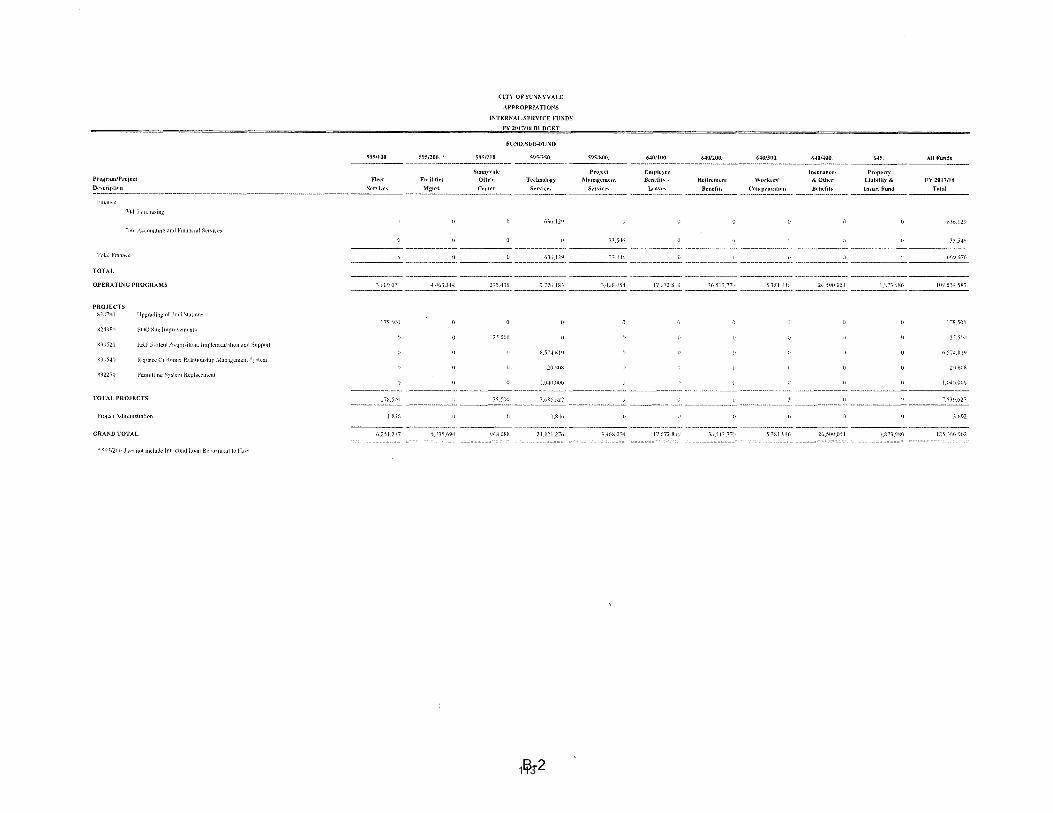
Prognml/Project
Dc\cription
CITY OF SlJNNYVALE
APPROPRIATIONS
INTERNAL SERVICE FUNDS
FY 2017.'ltl BUDGET
FllND/SUB-Fl!ND
59:\/100. 5951200. ~ !'i95!210. 59"£350. S95i'MOO. 640/100. 64111200. 640/300. 640/4110. ------------ ------------------- --------- ------------ --------------------------------------Fled
"'"'"'ices
Fadlitin Sunn)·l·ale
Offin• Tl•chnolue:v Project
Mamlgl·mcnt
Employee
Bencfih- Retirement ~:~ .. ~ .. .-;., Mgrnt. Center Scrviu~ S~.·rvkcs Lc:wc.\ --··-···
lmur:mn•s Workcn' &Other
C~>tn)Jcmatlnn Bcnl'fits
6-15. -------Property
Li:Jbilil) &
Inwr. Fund
FY 2017/HI
T~~tal ----------------------------------------------- ----------- --------------- -------- ---------- ------------ -------- ---------l·m.11Kc'
711-l l'm'-h<~~mg
()~f>.l2'J t.~(). !2J
\LL(lllnlm!; ,md Fm,mLJ,\1 ScJH~c~
~~.546 :<1;54'
Tu!J! FmJl\C<' d6,!29 <~.<l6 lJ (<)<)67G ----------- -----------· ----------- -----------· ------------- ----------- ---------- -----------· ------------- -------------- -----------TOTAL
OPERATiNG PROGRAMS 1 h{J'),\121 ·I <J(il,>J'-1 2~~ . ..J:;f IJ.7ill,J!\) \'-lnl\054 !7.r.72.XI<) )(>.5l'i.T<! S.13l.'l41J 2(· SIH1.US! 10« S>·LSf>i --------- ---------- ----------- --------- ----------- ------------ ·--------- ----------- ---------- ----------- ------------PROJECTS S2~"',n !Jp:;l;uJmg 11fFudSLJl1(·n··
11f>.:('\) ~-~,5(J(J
82~%' S1 IC S1k lmpluY~m..:nl~ n'i{}'o 25)!t';
811J:'21 UU' ;:;;,"L<.:mi':.-.qunhou, !m]'km,:uLJtwn ,mJ Support
tS>~ oil<J 6,5'-1.81') Ki1.541, R.:pi,Kc C11 tnmc1 Rd,\lum~lup 1\tuu~<.:m..:nl S~~km
2()-.t{)!\ [;\UK
<''12271J J>cml!Hlll!! S··~\l:m R~pl<l~l.'lll<.:nl !, >•tfl·l()l} !.{14-',,(W'•
TOTAL PROJECTS J7){,5HI 2\9'0 7.(>\5/>27 ll (I I) (t .., SN,62.' -------- ----------- ---------- ------------ -------------- ---------- ---------- ------------ ---------- ·------------- ------------!'Jol'-'' \dmmJ~tl<~!ltm l.i~..J(, l,S4h 1,0')2
-------- ----------- ---------- ---------- ----------- ----------- ~--------- -------------- ---------· ------------ -----------GRAND TOTAL (>251,217 5,11.~5,6<,1-1 <J<ll!.Ul<h 2J,':2!.27u >,<IM\,0~ 1 17.<172,!!);. 1.·.5li,T''· 5,>S!.'J4(> 2(,,5()(105! !,S7-,,<>;(J 12~ .. :!,16,)1)2
"'5''.~/2\•0 <k-> nutm~ludclnlJ·Ifun,\l.o,m Rc·p.!·m..:n1lni·Lcl
B-2 113

TRANSFERS FROM FUND,'SUB-FUND
TRANSFERS
01' UcncJa!
o-.J Jh,usmg
\,71 lltlMF()pJtll
072 Ro:lkwh,pmcntllnusmg
lliJ CIJH<.i
i.f! !';ul-.JkdJUIII<'ll
17-- ,\_.-:c! FuJfl'il\uc·
21(' l!mpll>\!l\cl\1 D<..v~lupm-.:n\
2-1·: P.ukm)l DJslllct
2)5 t\>lll!ll\l!lll) LH .. Jl!ltcs. DJS.l!Jcl N1> }
0<!3],\.\,
z;:~l \'[~} LOI;,)\ R\laJ hnpwcemcnt l'w;ll<l!H
'>R5 ('.lp!l,!ll'H>l~';(c
.:J(,q V, .1k1 Suppl· .mJ D1st1 tbutJo!l
.]•'·) \\,,Jslc'·"lk! MJuagcmcnt
4K5 Suld \\-J~\c !vt.magcmcnt
Sill Dvs,.lllpnh:nl Enh.:tpil'\
521 !til Cln!Lm<l.l cnn1~ OpcJ;J\Jons
5'>5 Gcnct;tl Sd~Jccs
727 Fwnwnt 1\>nl
Do1oluu St'll,k- Ynulh Oppt)ll\lllll\
TOTAL TRANSFERS
"'H'\"Jl-S/1'111/ _,,() 1J1.J.';SJ·J"}<S JI<H.\CitSI!OW' T!1:1 S~f, ..f,-i, /w lmk;·fn·f.l,'ll 1rm.·/i.•1 <1/Jd lilt> 1 UJJd I.
035. 1170. 2?5.
Vnuth and Nl'iAhlwrhood
G1•ncral HousinA Sc1·vkc~
)0·7.5K6
77_~,.1) 1,}_,{)(,0
C.,.J-6\
2.))(> l,(lV},(Ol)
2-t<J'?\
IIU.J-12
\]2'}1,-l
1".771
2! 12>
I:>.T',,
>,2.>J.-IW
-1JiS2J<J\
6_411,571
1.45Ll'59
42l,'hl
2<J.J-.:/,2
11.!05
(,.~li)i)
J7,112J>:l7 1,\0{) 1\0,') s ~.n. 5 sr.
EXHIBIT C
CITY OF SUNNYVALE TRANSFERS TO/FROM
ALL FUNDS h
FY 2UI?/1H BUDGET
TRANSFERS TO FUNDISUB~FUND
JH5.
Co1pital Projl•cts
IS,.J-~{1.453
'>J-\25."'40
2iJ.''Hl3
27 2"12.t•<l(,
46!'.
Wash•waler Man:1gcmt•nt
'1.146 It~•
4U.J-.'? ~4
155ll,KH
4H5.
SolidWa~tc
Manngcmcnt
S5.1~>2
4125-:.2
\C .. '-'54
(lS.J-h7S
{;,~t 1mtl'rqcd .lthl.,m .:rarwn ami fld1/ S<rll: ,. 1i·,u,c'~·r;, l'r<':'''"l,ldm,m,fr<llW/1 ( >.or;>,,• m.d f), f.; So ll~'e ill' n.'/-·, lnlm l!'d:JJ!I./
C-1
525!1110.
Golfomd Tennb
Opemtion ...
!.MJO.L-i'()
\,4!·dJll)lJ
595.
Gencr:tl Service,.,
ll.2S~.OH'>
5'17."4(1
J,J112--HC
14-;_~,,,..j
J,s.ux)qo
1]l),J41
15,260 56!
595!210. 610. 645. All Fund.~
--------------- ------------------------- ------------------- ----------Sunnyvale fnfra~tructure Li;lbili~·
Office Rcnovatinn and and P1·opcrty FV 20l7!IS Cenh•r Replacement Insur;mc~· Tnt:~l
5,2:;').(){,7 1.Wh,1')·· ..j],i.f(,,7~:,
'77 7(,()
h,.l-1>1
l.l\\2,55(•
2..!_97\
1 ::.<J.Jo_.tn:; 21.7~6.1-B
ll0,-il2
3125<>4
lf'.77.l
2.'!23
::.2t0.170 2.2-1') 379
J.!-<ll.-H.l J()PIJ,-i.J-'
0 2.<J73,5X9
() 6,\'i·.-') 212,570 .J-,52!Ul2
17,2- ~ 2(•{>.52\J (,,.J-( },..jlK
2X.9'J7 19,(,74 7,01f)_()51J
() () 1,602 ,,2(,4,i(J]
() () -14,2'AJ 7S.5,-U2
]](1,7)-..1 5•t7,';47 l,I\03Jl(~·
t•.IO.:\
(,,')(d)
!IP.7"-1 ,Uf,(l',1() 1,6-i2JJ.J-S 94,20\,781
114

Reserve
035 0'0 071
EXHIBIT D
CITY OF SUNNYVALE APPROPRIATIONS TO/DEDUCTION FROM RESERVES
ALL FUNDS' FY 2017/18 BUDGET AS COMPARED TO FY 2016/17 PLAN
FllNDISUB-FUND
072 110 141 175 190. 210 245 255 280 290
~·---------~------- -------------------- -------------------- -------------------- -------------------- ------------------- -------------------- ------------------- -------------------- ----------------------------------------- -----------------------------------------
General Housing HOME Grant
Community Redevelopment Development
Housing Block Grant Park
Dedication
Police A£set Services Employment
Fol'feiture Augmentation Development Parking District
Community Facilities
District No.3
VRF Local Road Imp1·ovement
Ga; Ta:\. Program
----------------------------------------------------------------- ------------------- -------------------- -------------------- -------------------- -------------------- ------------------- ----------~--~~----- -------~~--~-----~-- ------------------- --------------------------------------- -----------------------------------------20 Year RAP
677,301 (525,733) 2-1-!:1 (62,.53'1) (54,3-1-5) (l,MS5!:15)
A:.';;ct Forfeiture 129~_255)
Budget StabJillntJon Fund (25.992.6-1-g)
Bf\!Rln-Li..:u (203,05-1-)
Capita! Replacement (16.3()0,251)
Capital R..:scne (9,539,370)
Contmgenc~
1.65R.674 Debt Sen1ce
Development Entcrpnse Reserve
Equ1pment Replacement- KSUN (Rcslnclcd)
FacJiitJcs Management Rcsct\-c
Fket Sen lees Rcscn c
Future Land Usc & Transpo1 ta\Jon Projects
HOME Grant (247.577)
Housing Mitigation !2.'0!:17.5XO
Infrastmcturc Reserve 1.JS3
Insurance Rate Uncatainty
Land Acqmsition Set-Aside 3.311.278
LiabJ!tly nnd Propc1l~ Jnsnnmcc
PERS Rate Unccrtamty
Rate Stabi!i/at10n
SBH3 VRF Funds ( 102.214)
Technology and Communications Rcser\"c
Tech Surdtorgc Rcsenc {Rcstnctcd)
Worker:>' Compensation
~---~---~~-~R~---~- ---------~--------- -------~------------ ••••••••••••••••••~- ----~--------------- MOO••••••••••••••••• ------------------- •••••••••••••••••••• ------·-··--•••••-• •••••-•••••••••••- -------------------- --~---••••••••••••• -------------------
Total (40.724.22.1) 12.JS4.52(• (2A7}77) (J77,30l (525,733) (6,22lUJ92J (293,255) 24K ((12,53()) (5-U45) 1,383 (l.<l48,585) (102.214)
(•) FUNDS/RESERVES WITH NO CHANGES ARE NOT SHOWN.
D-1 115

Reserve
385 460
CITY OF SUNNYVALE APPROPRIATIONS TO/DEDUCTION FROM RESERVES
ALL FUNDS • FY 2017/1& BUDGET AS COMPARED TO FY 2016/17 PLAN
FlJNDISUB-FUND
465 485 490/200 5!0 525/tOO 595 610
·~----------- ------------------· -------------------- -------------------- ----------------------------------------- -------------------- -------------------- ------------· Water SMaRT Jnfrastructure
Capital Supply and Wastewater Solid Waste Station Development Golf and Tennis General Renovation and Projects Distribution Management Management Replacement Ente1·prise Operations Services Replacement
640 645
-----------------------------------------------------------Employee Benefits
Liability and Property Insurance
FY 2017/18 Total
----------------------------------~~~~-~-~----~--~-------------- ----~-~----~--~----~ ------~------------ ~--------------~--~ --~--------------~-- ~----~-~------~~-~------------------~--- -----~-~~--------~-- ----------~-~-----~ ----~--~--~--------- -------------------- --~------~--~------- ---~----------------
20 Year RAP (98,51K) (U12,l71J
A~:set ForJCiturc (293,255)
Budget Stabi!JJ:ullon Fund (25_992.648)
BMR !n-Lio:u (203.05-l)
C'nptlal Replacement (16.3<>0.251)
Capital R!!SCt\e lO)Xl,933 3,055,""-ll (2.533.417) 196,024 (IOV17J l.X52_19..J-
C' onting~nc~, 1.24(1,900 2J7.Ml7 111,043 1.291.921 4.5-!.6.205
Debt Set\lce (1,788) 5,270.93-J. :\.2(,9,146
DC\ clopment Entcrpnsc Rcscr\'c l2.87X.556! (2.R7H.5%)
Equtpment Replacement- KSUN {Restnctcd) 29-L057 294.057
Facthl!cs Management Rcsenc {(l67...J.92) (6fi7..f()2)
Fleet Sen tees Rcscn c (1.1-t..J..l%) (Ll4..J..JlJ6)
Futwe Land U~c & Transpm1ntion ProJects ((,:'.92-t) (67Y24l
HOME Grant 1247,577)
Housing MittgaLJOn 12,9K7,5XO
lnfmstructurc Rcscr\'c 1.3K3
Insurance Rate Unccrtamt: (I>,(,J2) 16.612)
Land Acquisition Sct-Astdc '.31 L278
Ltnbtltl) and Propel t~ lnsm ancc (21X,9</>) (218,9(,())
PER$ Rate Uncertamly 500.L1R 500.138
Rntc Stabilit:atlon {3,()01.495) 2.370.150 (551.787) <2.mB.l32J
SBK3 \'RF Funds (102,214\
Technology and Commumcations Reserve 1.451.1611 1,451.1(10
Tech Surcharge Rcv.:ne (Restricted) ':JtL7(,<.; 9X_7(,9
Workcts' Compensation 839.495 83{)_4()5
----~~~-~~~-----~--~ --~-~-----~-~~---~-- ----~-~-~----------- --------~~-----~--- ----------~---~----~-------~------------ -----~----~-~-~----- --~-~--------------- ---~-~---~-------- ~------------------ -------------------- ------~-~-----------
Totnl 10)14,009 399.3SX 5,345,334 (440,744) 19<>,024 (2,87X,556J 19X,SlX) (76,41V\ L291,92l 1,333,021 (218.961J) (20.X5fi.6..J.6)
(') Fl'.VIJS!RESERVES WITH NO CHANGES ARE NOT SHOWN
D-2 116

RESOLUTION NO. 835-17
A RESOLUTION OF THE CITY COUNCIL OF THE CITY OF SUNNYVALE ESTABLISHING THE APPROPRIATIONS LIMIT FOR FISCAL YEAR 2017- 2018 PURSUANT TO ARTICLE XIII B OF THE CALIFORNIA CONSTITUTION
WHEREAS, Article XIII B of the California Constitution (enacted with the passage of Proposition 4 in 1979; with modifications under Proposition Ill, passed by the voters of California in June 1990; and implemented by California Government Code Sections 7900 et seq.), specifies that appropriations of governmental entities may increase by an amount adjusted by the cost ofliving and change in population from the prior year; and
WHEREAS, California Government Code Section 7910 provides for the annual establishment by local jurisdictions of their appropriations limit for each fiscal year, and further provides that upon establishment of such appropriations limit any judicial action or proceeding to attack, review, set aside, void, or annul such action by the City Council must be commenced within forty-five (45) days of the effective date of the resolution establishing the appropriations limit; and
WHEREAS, pursuant to Government Code Section 7910, in Report to Council (RTC) No. 17-0192, dated June 6, 2017, the Director of Finance has computed the appropriations limit applicable to the City of Sunnyvale for the fiscal year 2017 - 2018, and transmitted the same to the City Council in RTC No. 16-0193, dated June 20, 2017; and
WHEREAS, documentation used in determining the appropriations limit has been made available to the public for a period of not less than fifteen (15) days prior to City Council's consideration of this resolution.
NOW, THEREFORE, BE IT RESOLVED BY THE CITY COUNCIL OF THE CITY OF SUNNYVALE AS FOLLOWS:
1. Pursuant to the appropriations limit formula set forth by Government Code Sections 7900-7914, the City Council does hereby establish the appropriations limit for fiscal year 2017- 2018 for the City of Sunnyvale as $219,843,964, as documented in Exhibit A, attached hereto and incorporated herein by reference as though fully set forth.
2. Pursuant to Government Code Section 7910, no judicial action or proceeding to attack, review, set aside, void, or annul the action of the City Council in establishing the appropriations limit for fiscal year 2017 - 2018 shall be brought unless such action or proceeding shall have been commenced within forty-five (45) days of the date of adoption of this resolution.
T-FIN-160163/ 18242 2 Council Agenda: 6-20-17 Item No.: 2.B
1
117

Adopted by the City Council at a regular meeting held on June 20, 2017, by the following vote:
AYES: NOES:
HENDRICKS, LARSSON, GRIFFITH, KLEIN, MELTON, SMITH, GOLDMAN NONE
ABSTAIN: NONE ABSENT: NONE RECUSAL: NONE
\ . \,) ATTEST: { (""
_+t::!. ~ K.t-\TjiLEEN FRANOJSIMMONS City Clerk (SEAL)
APPROVED AS TO FORM:
.. ·····/) \ ?l' ·" ···········~--, _, ·f' · .. / /v 1""~
REBECC;L:Mo~O-N-------~-----Sr. Assistant City Attorney
T-FnN-160163/18242 2 Council Agenda: 6-20-17 Item No.: 2.B
APPROVED:
GLENN HENDRICKS Mayor
2
118

EXHIBIT A
CITY OF SUNNYVALE CALCULATION OF APPROPRIATIONS LIMIT
FY 2017/18 Recommended Budget
Appropriations:
035. General Fund 070. Housing Fund 071. Home Fund 072. Redevelopment Housing Fund 110. Community Development Block Grant Fund 141. Park Dedication Fund 175. Public Safety Forfeiture Fund 190. Police Services Augmentation Fund 210. Employment Development Fund 245. Parking District Fund 280. Gas Tax Fund 290. VRF Local Road Improvement Fund 295. Youth and Neighborhood Services Fund 385. Capital Projects Fund 610. Infrastructure Renovation and Replacement Fund
Total Appropriations
Appropria_tion Adjustments:
Current Non-Tax Revenues Prior Non-Tax Revenues -Qualitied Capital Outlay
Total Appropriation Adjustments
Appropriations Subject to Limit
Growth Rate Factor
Total Allowable Appropriations Limit (Prior Year Appropriations Limit x Growth Rate Factor)
Amount Under (Over) Allowable Appropriations Limit
A-1
FY 2016/2017
$ 155.023,764 6,942,967
693,536 290,093
1,564,505 1,046,871
151,792 231,405
10,500,000 194,847 355,164
839,688 16,585,015 11,220,725
205,640,373
(98,004,267)
(I ,950,750)
(99 ,955,0 17)
I 05,685,356
1.0670
210.316,844
$ I 04,631 ,488
FY 2017/2018
$ 174,383,221 11,581,813
$
551,232 1,293,523 1,723,139 1,468.944
293.656 296,333
10,524,932 238,745 696.382 184.443 866,623
71,473.940 24,473,824
300,050,750
( 135,442,689) (19,203, 167)
( 1 ,201 ,625)
(155,847,481)
144,203,268
1.0453
219,843.964
75,640,696
119

CITY OF SUNNYVALE CALCULATION OF APPROPRIATIONS LIMIT
FY 2017/18 Recommended Budget
FY 2016/2017 Revenues:
Tax Revenues: Property Tax $ 64,072,610 Sales Tax 33.334,799 Other Taxes 26,714,557 Unrestricted State Subventions 222,960 Interest Income 1,020,816
Total Tax Revenues 125,365,742
Non-Tax Revenues: Federal Grants 18,018,377 Restricted State Shared Revenues 3,023,610 State Grants/Reimbursements 524,002 Other Intergovernmental Contributions 1,884,967 Franchise Fees 7,153,717 Permits and Licenses 1,261,679 Service and Development Fees 43,162,529 Rents and Concessions 2,501,755 Fines and Forfeitures 999,943 Housing Loan Repayments 607,452 Revenue from Sale of Property 10,910,000 Miscellaneous 756,162 Inter-Fund Loan Repayments 6,290,179 Interest Income 909,895
Total Non-Tax Revenues 98,004,267
Total Revenues $ 223,370,009
A-2
FY 2017/2018
$ 70,915,615 32,776.458 28,226,290
222,960 1,227,757
133,369,080
28,487,319 3,275,903
429,257 30,582,781
7,261,043 1,276,049
51,992,705 2,690,723
996,876 1,055,709
158,714 5,731,407 1,504,204
135,442,689
$ 268,811,769
120

A. LAST YEAR'S LIMIT
B. ADJUSTMENT FACTORS
I. Population 2. Inflation
CITY OF SUNNYVALE APPROPRIATIONS LIMIT
FY 2017/18 Recommended Budget
AMOUNT
$ 210,316,844
1.0081 1.0369 1.0453
Total Adjustment % 0.0453
C. ANNUAL ADJUSTMENT $ 9,527,120
D. OTHER ADJUSTMENTS:
Lost Responsibility(-) 0 Transfer to private (-) 0 Transfer to fees(-) 0 Assumed Responsibility(+) 0 Sub-total 0
E. TOTAL ADJUSTMENTS $ 9,527,120
F. THIS YEAR'S LIMIT $ 219,843,964
A-3
SOURCE
Prior Year
State Department of Finance State Depattment of Finance
(Bl*B2)
(B1*B2-1)
(B*A)
(C+D)
(A+E)
121

This Page Intentionally Blank
A-4122

Financial Plan –
General Fund

General FundThe General Fund is used by the City to account for all financial
resources except those required by law or practice to be accounted for in another fund. It supports many of the most visible and essential City services such as police, fire, road maintenance, libraries, and parks and open space maintenance. General government support functions are also included in this fund, and their costs are apportioned through the use of indirect administrative charges to other City funds. The General Fund receives the preponderance of its revenue from taxes. Therefore, the state of the regional economy has a direct effect on the General Fund.
The General Fund has a very close relationship with several other funds. Those funds are the Youth and Neighborhood Services Fund, Gas Tax Fund, Internal Service Funds, Capital Projects Fund, and Infrastructure Renovation and Replacement Fund. In each case, the condition of these funds has a direct bearing on the General Fund because the General Fund is a significant source of financial support. The relationship between these various funds, where appropriate, will be discussed as a part of the General Fund, as well as in the review of each of these individual funds.
General Fund Revenues Revenue Estimation Methodology
All revenue assumptions and projections are reviewed and revised each fiscal year. Further, considerable analysis is undertaken to identify the key elements that drive our major revenue sources so that the projection methodology is as reliable as possible over the long-term. A review of historical data demonstrates the fact that economic cycles can yield a significant swing in revenues. Projecting revenue based on the high point of an economic cycle would overstate the City’s financial position significantly for future years and could result in spending patterns that cannot be sustained. Conversely, projecting revenues from the lowest point of the economic cycle could understate the long-term financial position of the City and cause unnecessary service reductions.
Each revenue source has unique characteristics which are used as the basis for projections. In general, actual revenue data and trend data for each major source are used to calculate projections for the next two years. For the balance of the financial plan, however, projections are based on the history of each revenue. Future growth trends are estimated and, depending on the specific revenue source, inflation factors may be applied to project revenue levels in the out-years of the plan. Following the adoption of each long-term financial plan, the major revenue sources are monitored throughout the budget year to detect any change in patterns or circumstances.
General Fund Major Revenue SourcesFive key sources generated over 85% of the City’s General Fund revenues
(excluding property sale proceeds) in FY 2015/16. These sources are Property Tax, Sales Tax, Transient Occupancy Tax, Utility Users Tax, and Franchise Fees. FY 2015/16 results for each of the top five sources were positive. Each revenue source increased from the prior year. Growth in Property Tax was the most significant, increasing $7.5 million, driven by several factors which are discussed in greater detail below. FY 2015/16 was also a strong year for Transient Occupancy Tax (TOT) returns, which increased $2.2 million from the prior year. Sales Tax revenues climbed $1.7 million, recovering from a low year in FY 2014/15. Utility Users Tax (UUT) revenue was up $127,000, a 1.8% increase from the prior year, and Franchise Fee revenues climbed 2.3%. The FY 2016/17 Adopted Budget projected growth for each of these revenue sources, except for Utility Users Tax, which staff projected would hold flat from the prior year. The FY 2015/16 results exceeded the revenue projections for Property Tax, Sales Tax, UUT, and Franchise Fees. TOT revenues ended the year below the level projected in the FY 2016/17 Adopted Budget by 0.54%. While FY 2015/16 was a positive year, the results demonstrated the continued fluctuation in these revenue sources. The general volatility of most of these revenue sources are key issues in the revenue projection efforts as discussed in detail below.
As FY 2016/17 has unfolded, Property Tax revenue has continued to increase and TOT has held steady. These results are above the original growth
City of Sunnyvale FY 2017/18 General Fund
123

expectation. The updated projection for Property Tax revenue in FY 2016/17 is 5% over the initial 5.5% estimated growth. On the Sales Tax side, the City is lowering the projection for FY 2016/17 revenues, as well as projecting a minor decline in FY 2017/18. The initial estimate for FY 2016/17 in the Adopted Budget forecasted growth of 3.7%, which has been lowered to 0.4%. Utility Users Tax and Franchise Fees are expected to be up slightly from FY 2015/16.
Our projections for FY 2017/18 and beyond vary based on the revenue source. Property Tax is projected to experience healthy growth over the next two years before growth returns to more historical levels. Sales Tax is expected to be flat, with very modest growth going forward. Transient Occupancy Tax, historically a very volatile revenue source driven by business
travel, has held steady at an elevated level and our projection for FY 2017/18 Adopted Budget reflects a continuation at an elevated level for two more years. From FY 2019/20 forward, the TOT revenue projection is based on a longer term historical average room rates and occupancy percentages. Utility Users Tax and Franchise Fees grow at an inflation factor moving forward.
Total General Fund revenue is projected to be down 19.8% in FY 2017/18, due primarily the significant one-time revenue projected in FY 2016/17 from the Sale of Property. Excluding this source, General Fund revenue is projected to be up 0.3% in FY 2017/18.
The table below reflects projected sources of General Fund revenues for FY 2017/18 and compares those sources with the FY 2016/17 revised projections. Actual revenues for FY 2014/15 and FY 2015/16 are also included.
Exhibit 1: Major Revenues
Revenue Source2014/15
Actual2015/16
Actual2016/17
Revised Projection2017/18
Adopted Projection% Change 2017/18
over 2016/17
Property Tax $54,940,570 $62,390,637 $67,335,066 $68,974,004 2.43%
Sales Tax 31,218,981 32,909,169 33,047,146 32,776,458 -0.82%
Transient Occupancy Tax 14,137,069 16,295,589 16,798,573 15,294,653 -8.95%
UUT & Franchises 13,671,830 13,957,590 14,057,666 14,319,192 1.86%
Construction Tax 3,066,351 3,298,178 3,378,579 3,026,335 -10.43%
Business License Tax 1,845,883 1,871,848 1,768,680 1,804,054 2.00%
Real Property Transfer Tax 1,764,551 1,971,841 1,113,329 1,043,098 -6.31%
Permits & Fees 1,308,386 1,296,765 1,261,679 1,598,255 26.68%
Service Fees 6,028,267 6,163,323 5,503,194 5,629,974 2.30%
Rents and Concessions 2,439,797 2,464,256 2,434,633 2,535,602 4.15%
Contributions 0 94,536 440,000 440,000 0.00%
Other Revenue 3,919,698 4,852,744 2,868,160 3,488,653 21.63%
SUBTOTAL $134,341,383 $147,566,476 $150,006,704 $150,930,278 0.62%
Sale of Property 14,069 13,925,365 37,600,000 0 -100.00%
TOTAL RESOURCES $134,355,451 $161,491,841 $187,606,704 $150,930,278 -19.55%
* Excludes In Lieu Charges / Transfers & Interfund Revenues
City of Sunnyvale FY 2017/18 General Fund
124

In the following sections are detailed discussions of the City’s five major revenue sources, including explanations of the revenue forecasts for FY 2017/18 and beyond. Discussions of several other revenue sources of particular note follow.
Property Tax
Property Tax represents the largest source of General Fund revenue, estimated to be about 45% of all General Fund revenues in FY 2017/18. For each dollar of Property Tax paid by property owners in Sunnyvale, approximately $0.17 is now allocated to the City of Sunnyvale. This amount is up from the previous $0.13, which the City received prior to the implementation of the VLF Swap discussed below.
The City’s Property Tax revenue consists of several categories. Secured Tax, which represents the vast majority of the overall Property Tax, is the tax on real property and the structures on that real property. Unsecured Tax represents the tax on appurtenances such as furniture, machinery, and equipment. Supplemental Tax is the result of reassessing the value of real property when there is a change of ownership or new construction is completed after the official lien date. Other sources of Property Tax revenue come from Unitary Tax, which is assessed by the State Board of Equalization on property such as utilities or railroad lines, and Tax Delinquencies.
Property Tax has also been the revenue most affected by voter initiatives and legislative actions. With approval of Proposition 13 in 1978, Property Tax revenues were reduced by two-thirds and thereafter limited to 2% annual increases or the Consumer Price Index (CPI), whichever is less. In the early 1990s, the State legislature permanently shifted a larger portion of the Property Tax to schools. This shift was made to the State’s Educational Revenue Augmentation Fund (ERAF) to backfill a portion of the State’s obligation for school funding. In FY 2004/05 and FY 2005/06 the State shifted an additional $4.1 million over those two years from Sunnyvale Property Tax to the ERAF as part of a solution to its ongoing budget crisis (ERAF III).
Also included in the State Budget deal with local governments in FY 2004/05 was a permanent redistribution of two of the City’s revenue sources. Under this agreement, the Vehicle License Fee (VLF) rate for cities was permanently reduced from 2% to 0.65%. For FY 2004/05, the VLF that
the City would have gotten at the 2% rate was calculated and this amount was added to our Property Tax base through transfers from the ERAF. In FY 2005/06, the City began to receive our portion of VLF revenues at the lower rate of 0.65%, while the Property Tax base was adjusted to reflect its new, permanent base.
Overall FY 2017/18 Property Tax revenues are expected to be up from the prior year, continuing the growth seen in the FY 2016/17. The outlook for Property Tax is positive, with expectations of assessed valuations growth in both the residential and commercial sectors and flat turnover rates driving revenue growth.
Secured Tax, which accounts for approximately 91% of total Property Tax revenue, experienced strong growth in FY 2016/17 and revenue is expected to continue to increase over the next two fiscal years. Assessed valuation of residential property in the City is expected to slightly exceed historical average for the next three years. Accelerated growth is also expected in the short-term for the commercial sector. Substantial assessed value was been added to the City’s Property Tax roll in FY 2015/16 and FY 2016/17, and the City is forecasting continued strong new construction numbers as well as continued high demand for commercial leases in Sunnyvale. Overall, the combined residential and commercial growth rate is expected to be 4.6% in FY 2017/18, and 4.4% in FY 2018/19 and FY 2019/20. After that, growth is expected to continue at the historical average of approximately 4% annually. This factors in 2% growth and the maximum 2% increase from the California Consumer Price Index (CCPI).
The Secured Property Tax base increased with the dissolution of the RDA. After the payment of enforceable obligations, the former property tax increment will be distributed as Property Tax to all applicable taxing agencies, and $57 million has been programmed into the long-term financial plan to account for the City’s expected allocation. In FY 2017/18, the distribution of the former property tax increment is expected to provide $1.6 million in revenue to the City. Downtown development with the Town Center project will further strengthen this revenue source.
City of Sunnyvale FY 2017/18 General Fund
125

Two other important elements of Property Tax revenue are the Unsecured Property Tax and Supplemental Property Tax rolls. Despite remaining flat in FY 2016/17, the Unsecured Property Tax revenue was a positive result given that a significant negative adjustment for personal property had shifted some Unsecured value to the Secured roll. Unsecured Property Tax revenue is projected to be $3.1 million in FY 2016/17. The historical average for this source, adjusted for inflation, is $2.6 million. This amount is projected in FY 2017/18 with an inflation factor applied in future years.
The Supplemental Property Tax roll reflects properties that are sold or transferred after the official lien date. Supplemental assessments pick up the higher or lower value on the property immediately by using a floating lien date, and the added or reduced assessed value is placed on a separate Property Tax bill. Revenue from the supplemental roll is dependent strictly upon timing of sales and thus is difficult to forecast. Another factor that makes this revenue source difficult to forecast is the fact that it is a pooled revenue at the County level. All Supplemental Property Tax collected by the County is allocated to the cities based on a formula and not on transactions within each jurisdiction. Over the past several years, this revenue source has recovered from a record low in FY 2010/11 of $175,000 and climbed to $1.4 million in FY 2015/16. Staff projects that Supplemental Property Tax revenue will remain high in FY 2016/17 before returning to a historical average, beginning in FY 2017/18. Our projection revises the FY 2016/17 amount to $1.6 million, and the long term average of $863,000 in FY 2017/18, increasing by an inflation factor.
Another component of the City’s Property Tax is the administrative fee the County of Santa Clara charges to collect and distribute Property Tax. In FY 2006/07, counties throughout the State of California, including the County of Santa Clara, significantly increased their administrative fee for collecting and distributing Property Tax revenues to cities. State Revenue and Tax Code allows counties to collect an administrative fee equivalent to 1% of collections, and because two State actions, the “Triple Flip” and the Vehicle License Fee (VLF)/Property Tax swap, essentially increased the amount of Property Tax going to the cities, the counties asserted the significant increase in the administrative fee was warranted.
Widely challenged by cities throughout California, the issue came to resolution during FY 2012/13, as the California Supreme Court ruled that the counties’ interpretation of SB 1096, which was the law implementing the Triple Flip and the VLF swap, was incorrect as it related to administrative fees. Specifically, the law stated the counties could collect actual costs to administer the Triple Flip and the VLF swap, but it did not state that the additional Property Tax revenue received by the cities could be counted toward the standard administrative fee.
The City of Sunnyvale received a $1.2 million refund in FY 2012/13 for the inflated administrative fee it paid for the past six years. More importantly, the baseline Property Tax Administrative Fee for our 20-year plan was reduced significantly. However, for FY 2016/17, the County estimates that administrative fees will increase modestly. The Administrative Fee reduces the City’s property tax revenue by approximately $500,000 each year.
City of Sunnyvale FY 2017/18 General Fund
126

Sales and Use Tax
Sales and Use Tax (Sales Tax) represents the second largest source of revenue to the General Fund. Sales Tax is expected to make up 22% of budgeted revenues in FY 2017/18. Sales and Use Tax also represents one of the General Fund’s most volatile revenue sources, with drastic swings over the past decade. In FY 2000/01, Sales Tax was the General Fund’s largest revenue source, constituting 32% of total revenue at $36.3 million. The subsequent economic downturn caused by the technology industry bust saw Sales Tax revenue plummet to $22.8 million by FY 2002/03. Revenues began to recover until the great recession hit in 2008/09. Since that time returns have been volatile. Total Sales Tax revenue in FY 2015/16 was $31.4 million with anticipated revenue of $33.0 million in FY 2016/17.
Exhibit 2: Sales Tax Distribution9 Cents per Dollar – Santa Clara County
City of Sunnyvale:
VTA:
Total: 9.000 cents
County Funds:
VTA (BART):County Transit District:
State General Fund:
1.000 cents0.375 cents
0.125 cents0.500 cents
1.000 cent
6.000 cents
Source: CA Board of Equalization
Exhibit 2 shows how Sales Tax dollars are distributed within Santa Clara County. The State receives the largest share of the nine cents per dollar of sales, while cities only directly receive one cent of the rate. There have been four increases to the Sales Tax implemented since 2011, and the increases have added a total of three-quarters of one cent to the Sales Tax. Prop 30, a quarter-cent increase to the statewide base Sales Tax rate, expired on December 31, 2016. Measure B, approved by voters in 2016, added a half-cent Sales Tax to support countywide transit, highways and expressways and became effective April 1, 2017. This additional tax will be effective for 30 years. The net change to the sales tax rate between the expiration of Prop 30 and the implementation of Measure B is a quarter cent increase, from 8.75 to 9 cents. While this change impacts the sales tax rate paid by Sunnyvale residents, the City tax rate for the General Fund continues to receive only one percent of all taxable sales. Funding that may become available to the City from Measure B is projected in the long-term financial plan, however this funding is restricted to approved transit-related projects.
Sales and Use Tax is composed of primary categories of transactions – general retail sales and business-to-business sales. In Sunnyvale, as well as some other Silicon Valley cities, a high percentage of overall Sales Tax has traditionally been business-to-business in nature. This sector currently constitutes 37% of our point-of-sale sales tax revenue, as compared to the statewide average of approximately 16%. This makes Sales Tax complicated and difficult to predict because it is often one-time in nature. Specific year-over-year growth projections are developed by dividing Sales Tax receipts into five major segments that have similar economic characteristics: Business and Industry, General Consumer Goods, Autos and Transportation, County Pool, and Other. The Other category includes Restaurants and Hotels, Building and Construction, Fuel and Service Stations, and Food and Drugs. As can be seen from the following graph listing Sunnyvale’s Sales Tax receipts by sector between 2002 and 2016, each category has a unique pattern:
City of Sunnyvale FY 2017/18 General Fund
127

Exhibit 3. Sales Tax Receipts by Major Sector (Calendar Year 2002 - 2016)
Business And Industry
General Consumer Goods
Autos And Transportation
Restaurants And Hotels
Building And Construction
Fuel And Service Stations
Food And Drugs
0
$2 M
$4 M
$6 M
$8 M
$10 M
$12 M
2002 2004 2006 2008 2010 2012 2014 2016
City of Sunnyvale FY 2017/18 General Fund
128

Most sectors are relatively stable and experience swings within a narrow band, however, the business and industry sector is highly volatile, as can be seen above. This makes revenues very unpredictable and forecasting future revenues very challenging. In FY 2006/07, Sales Tax reached $30.9 million, however two years later, due to the Great Recession, revenue dropped to $25.1 million, a 19% loss over two years. In the seven years since the impact of the recession, Sales Tax revenues from the Business and Industry category have just recovered to FY 2006/07 levels.
Our revised Sales Tax estimate for FY 2016/17 is $33.0 million, up slightly from the prior year actual revenue of $31.5 million. This increase is driven by strong growth from the State and County pools and Restaurants and Hotels. Modest growth is anticipated in the next two years as development continues to be active. Specifically, staff is forecasting moderate growth activity in the Building/Construction, Restaurant/Hotels, and Auto/Transportation categories, as well as increased projections on revenue received from the County pool.
Pooled revenues are expected to increase as a percentage of the City’s overall Sales Tax revenue as e-commerce continues to become a larger part of the economy. When transactions occur online for Sales Tax- eligible purchases, the 1% share received by cities instead goes into a County pool for distribution. For example, if a Sunnyvale resident goes to Target in Sunnyvale and purchases a television, the City receives 1% of the sale price in Sales Tax revenue. If that same Sunnyvale resident buys that television from Target’s website, the 1% of the sale price instead goes to the County pool for distribution to all agencies, as the revenue from online purchases is tracked to the county where the customer is located rather than to a more precise location due to the lack of detail in the seller’s tax return. The County pool is distributed based on each jurisdiction’s share of total taxable sales. For the last reporting period, Sunnyvale’s share of the pool was 7.8%. This increasing trend not only makes Sales Tax revenue increasingly difficult to project, but it also means that a larger part of this significant revenue source has less to do with activity in Sunnyvale.
Because of the volatility of this revenue source, staff has taken a conservative approach toward projecting growth. Staff anticipates that revenue is essentially flat in FY 2017/18 at $31.2 million. Growth is
anticipated at a modest rate in FY 2018/19, reaching $32.1 million, for a 2.8% increase over the projected FY 2017/18 revenue. Growth projections past FY 2018/19 are very modest, averaging 2.8% annually through FY 2036/37, which is only slightly above the inflation expectation for that timeframe. While it is not possible to predict the next slowdown or how that slowdown will impact Sales Tax revenues, the projection for future revenue reflects modest growth with the expectation that some years of growth will be offset by losses in other years due to economic fluctuations.
Further, following completion of the Town Center project, it is anticipated that the City will receive additional Sales Tax revenue of approximately $1.1 million per year once the project is complete. It is estimated that the project will not come fully online until FY 2025/26. Staff revised the projection to reflect a conservative estimate for when various stages of the project will be completed. We begin showing a portion of these funds starting in FY 2018/19. In total, the revised projections reduce the total Sales Tax revenue by $35 million over the twenty-year plan.
Utility Users Tax and Franchise Fees
Utility Users Tax (UUT) and Franchise Fees represent the third largest source of General Fund revenue, generating about 10% of the total for FY 2016/17. Historically, these two revenue categories have been combined because one of the primary sources of revenue for both is the sale of electricity and gas. In FY 2015/16 combined UUT and Franchise Fee revenue increased 2% to $14.0 million. The City’s UUT rate is 2% on electricity, gas, and intrastate telephone providers, which is lower than the 3.7% average of those cities in Santa Clara County which have UUT. It is also lower than the UUT rate of 3.6% for Santa Clara County when weighted by population and significantly lower than the statewide average of 6%. Approximately 67% of UUT revenue is derived from the sale of electricity, 23% is related to intrastate telephone usage, and 10% is derived from the sale of gas.
The single largest component of UUT revenue is against the electric rates charged by Pacific Gas and Electric (PG&E). With the elevated level of commercial development over recent years, and as the new square footage gets occupied, electric usage is expected to go up. However, in recent years the City has experienced very modest growth, indicating that the anticipated growth from new development is being offset by the fact that many of these
City of Sunnyvale FY 2017/18 General Fund
129

new buildings are more energy-efficient than prior uses. It is anticipated that modest growth continues. The revised projection for UUT on electric is $4.4 million in FY 2016/17 and $4.5 million in FY 2017/18.
The City is expecting to receive approximately $1.46 million in FY 2016/17 from UUT on intrastate telephone usage. This is down approximately .02% from the $1.5 million received in FY 2015/16. At the General Municipal Election held on November 8, 2016, the voters approved Measure N updating the existing UUT ordinance. The telecommunications section was modernized to reflect updated uses of telecommunications technology and to treat wired, wireless (contract or prepaid) and other telecom services equally. In prior year budgets, revenue from this source was projected to decline. However, with the revision of the UUT ordinance, revenue projections from telecom for FY 2016/17 forward, no longer reflect continued degradation of this revenue source. Revenue is projected to be flat, with estimates scheduled to be revisited once data is available under the revised ordinance. The FY 2016/17 Adopted Budget projected declines of 2.8% annually. The FY 2017/18 Adopted Budget projects no growth for these revenues.
The City receives a one-time franchise payment from PG&E each year which represents approximately 38% of all Franchise Fee revenue. The PG&E franchise rate is 1% of gross receipts. Statewide, franchise rates range from .5% to 2%. The City’s other main franchise agreements are with our cable television providers and Specialty Solid Waste. For FY 2017/18, Franchise Fees are projected to increase by approximately 1.5% over the revised FY 2016/17 projection. This mixed growth is comprised of modest growth from the Specialty garbage and Cal Water franchises and cell phone tower franchise agreements.
Transient Occupancy Tax
Transient Occupancy Tax (TOT) represents the fourth largest revenue source of the General Fund, constituting over 10% of the total projected revenue for FY 2016/17. TOT revenue is expected to finish at nearly $16.8 million in FY 2016/17. This represents a 3% increase over FY 2015/16. This represents a fourth consecutive year of record-setting TOT revenue. The
elevated TOT returns are driven by two key factors. Effective midway through FY 2013/14, on January 1, 2014, the TOT tax rate increased from 9.5% to 10.5%. The second driving factor is business-related travel, the core business of Sunnyvale’s hotels, remains at a high level. As the economic recovery has continued and business travel continues to be strong, Sunnyvale hotels have benefited from increasing room rates and occupancy rates, which has positively impacted the City’s TOT revenues.
Due to the peak level TOT revenues that the City is currently receiving, the long-term plan resets revenue projections to a sustainable base over a period of two years. The anticipated decline reflects projected decreases in room rates and occupancy rates to their historical averages; which is then used as sustainable level base level for future years. The long-term plan has growth built in future years. The projection does include plans for the addition of five hotels in the City. The first of the new hotels is projected to come online in FY 2017/18. When fully operational, these new hotels are expected to bring in approximately $2.7 million in net new TOT revenue annually. While there have been many additional hotel applications submitted, due to the volatile nature of hotel development, only likely projects are included in the long-term plan. Beyond FY 2020/21, growth is expected to be relatively steady, reflecting primarily flat occupancy rates with modest annual increases in room rates.
Measure B
Measure B accounts for projected revenue from a half-cent sales tax approved by Santa Clara County voters in 2016. This a new revenue source to the General Fund. The tax, which pays for countywide transit, highways and expressways, became effective on April 1, 2017. The City will begin receiving funds in FY 2018/19 with approval of the FY 2018/19 Valley Transportation Authority (VTA) Budget. The VTA estimates that Measure B will generate $1.2 billion in revenue for local streets and roads, which will be allocated to Cities based on population and the County’s road and expressway lane mileage. Staff estimates that this will generate approximately $2.9 million in revenue annually, to begin in FY 2018/19.
City of Sunnyvale FY 2017/18 General Fund
130

Other Revenue HighlightsThe FY 2017/18 Adopted Budget includes certain other revenue sources
which warrant some discussion.
Other Taxes
Construction Tax, Business License Tax, and Real Property Transfer Tax revenue have each had strong returns in recent years. Construction Tax revenues have been strong through FY 2016/17, an indication of the high level of development activity that the City has sustained for four consecutive years. The long-term financial plan anticipates that this historically high level will cool off, with an elevated amount estimated for FY 2017/18 and the historical average level planned beginning in FY 2018/19. Business License Tax has seen steady growth, in line with the strong level of economic activity in the City in recent years. Real Property Transfer Tax, which is driven by property turnover and changes in valuation, has also been high in recent years. The long-term financial plan anticipates that this revenue will return to its historical average in FY 2017/18.
Permits & Service Fees
This category includes revenue collections from fees charged for services provided by City operations. The majority of revenue in this category comes from the Department of Public Safety, the Recreation Division in the Department of Library and Community Services, the Community Development Department, and the Department of Public Works.
Sale of Property
This revenue item reflects the sale of some of the City’s property. There are three sales of City property included in the General Fund’s long-term financial plan for the FY 2017/18 Adopted Budget. The sale of the Raynor Activity Center ($13.9 million) was received in FY 2015/16. Two City-owned properties were included in FY 2016/17; the estimated value of the former margarine plant at 1484 Kifer Road has been updated to $17.6 million. Also, the property located at 1050 and 1060 Innovation Way, also referred to as Parcels D and E of the former Onizuka Air Force Station, is planned to be sold in FY 2017/18.
Revenues from the sale of property, as one-time funds, are best utilized for one-time capital needs. As such, these revenues are segregated into the Capital Improvement Projects Reserve. Proceeds from the Raynor Activity Center have been programmed for the Lakewood Branch Library Facility project. The proceeds from the other sales have not been appropriated to any projects.
In-Lieu Charges and Transfers
In-Lieu Charges and Transfers are primarily funds transferred into the General Fund from other City funds to pay for projects and the cost of City- Wide administration, including the cost of the Department of Finance, the Human Resources Department, the Office of the City Manager, and the Office of the City Attorney. In-lieu charges are up 2% in FY 2017/18.
Inter-Fund Revenues
Inter-Fund Revenues are primarily loan repayments to the General Fund from other funds, including the utility funds. Year-to-year fluctuations in this revenue source are expected, as loan repayment schedules are not always on fixed amortization periods and often change based on cash considerations. The Sunnyvale Office Center Sub-fund rebate was removed in the FY 2015/16 Adopted Budget to strengthen reserves in this sub-fund, which funds the lease payments associated with the purchase of the debt financed Sunnyvale Office Center. The General Fund has two loans to the Wastewater Fund. These loans were refinanced at lower interest rates for FY 2017/18 with final pay-offs scheduled in FY 2028/29 and FY 2019/20. The repayment from the Solid Waste Fund was also refinanced. The final loan repayment of $3.05 million from the Solid Waste fund is scheduled in FY 2023/24.
General Fund ExpendituresGeneral Fund expenditures fund common and core City operations like
public safety, libraries, and parks and provide critical infrastructure funding for streets and sidewalks and more. The FY 2017/18 Adopted General Fund expenditures, including budget supplements, projects, lease payments, equipment, and transfers total $210.5 million. Of this amount, operating expenditures are the majority, totaling $155.6 million or 7.6% over the current FY 2016/17 budget, primarily due to the addition of budgeted personnel to address increasing demands for service and rising compensation costs.
City of Sunnyvale FY 2017/18 General Fund
131

Operations – Employee Total Compensation
Employee Total Compensation makes up the largest portion of operating expenditures. For accuracy in projections, compensation is broken into two categories, Safety and Miscellaneous. Changes in Safety Total Compensation are driven by salary surveys and the cost of pensions and other benefits. For FY 2017/18, safety total compensation is budgeted at $67.8 million. This is a $4.8 million, or 7.6%, increase from the $63 million in the current budget for FY 2016/17. Safety salaries are adjusted annually based on a market survey of total compensation.
For FY 2017/18, Miscellaneous Total Compensation is budgeted at $57.8 million. This is a $5.5 million increase over the FY 2016/17 budget due to revised salary assumptions as well as the strategic addition of personnel.
Benefits, which consist of leave, retirement, insurance, and workers compensation costs, increased in FY 2017/18 approximately 5.7% for Miscellaneous and 7.8% for Safety employees. This is primarily due to increases in retirement costs in FY 2017/18. As more fully discussed in the Internal Service Fund section, employer contribution rates for retirement are projected to continue to rise steeply over the next five to ten years. These increases exceed what was planned in the FY 2016/17 Adopted Budget long-term financial plans.
Operations — Other
Other operations are expenditures for purchased goods and services and overhead charges. Over the twenty-year planning period, these expenditures are up $40.7 million over the current budget. About half of the change is attributable to adjustments in goods and service needed to meet increasing demands and the rising cost of electricity.
Each year, a portion of the Public Works Pavement Operations program, which is accounted for in the General Fund, is supported by the Gas Tax Fund. The amount that is used for this purpose varies depending upon funds available and project requirements. As mentioned above, this support is projected to decrease in the future, primarily due to lower volumes and sale prices of gas sold. In FY 2016/17, the support is held flat to the current budgeted amount of $2.025 million. Starting in FY 2018/19, this amount is reduced to $1.1 million a year, and then to $950,000 million terminating in FY 2031/32.
Public Safety Recruitment Projects, Projects and Project Administration, and Project Operating Costs reflect General Fund expenditures related to capital, special, and Department of Public Safety recruitment projects. The content of these expenditures is discussed below in the General Fund Projects section.
The Equipment line item contains the appropriations for equipment for the departments of Public Safety and assistance to the Library and Community Services based on their replacement schedules. These costs are up slightly, primarily due to adjustments to replacement timing. There was one addition to the public safety equipment schedule for an additional set of personal protective equipment for Public Safety Officers assigned to the fire division.
Lease payments in the amount of $1,201,625 are included in the appropriation for FY 2017/18 as well. These payments fulfill the City’s agreement with the former Redevelopment Agency to pay lease payments equal to the annual debt service on one of the downtown parking structures. Previously a Redevelopment Agency obligation, this item remains a subject of litigation in the redevelopment dissolution process.
Council Service-Level Set Aside is an annual $100,000 set aside for Council’s use at its discretion for unplanned projects, services, or other initiatives that come up over the course of the fiscal year.
The FY 2017/18 General Fund Budget includes funding for eight budget supplements. Details on each of the supplements are included in the Budget Supplement section in this volume of the FY 2017/18 Adopted Budget. The total expenditures budget for the eight supplements adopted in FY 2017/18 is $1,015,000 with total costs over the twenty-year plan of $1.04 million.
Transfers to Other Funds reflect transfers from the General Fund to other funds for operating and capital project purposes. These include transfers to the Wastewater Management Fund for Stormwater costs, Youth and Neighborhood Services Fund for support of Columbia Neighborhood Center, the Liability and Property Insurance Fund for the General Fund’s share of claims and insurance. The transfer to the Wastewater Management Fund is to fund retrofit projects that would redirect stormwater to biotreatment areas. This funding is also used to implement trash reduction
City of Sunnyvale FY 2017/18 General Fund
132

programs and other maintenance activities in order to meet permit requirements, as well as to provide for outreach and enforcement efforts. The transfer to the General Services Fund consists of the Technology Investments appropriation that was included in the FY 2016/17 Adopted Budget. The General Fund also funds several projects in the Capital Projects Fund and Infrastructure Fund. As established in the FY 2012/13 Budget, the long-term financial plan for the General Fund reflects an annual transfer of $1.5 million for investment in the City’s administrative infrastructure. These funds are not set aside for a specific project or set of projects at this point but will accumulate in the Infrastructure Fund and be appropriated as projects are identified and prioritized. The Transfer to the Infrastructure Fund includes $772,650 for a new project to complete the Fire Station Master Plan.
Starting in FY 2016/17, approximately $17.9 million is planned to be transferred over two years to the Capital Projects Fund for the design and construction work on the Lakewood Branch Library Facility project. In FY 2019/20, the General Fund will transfer $6 million to the Capital Projects Fund for fire station rehabilitation. Lastly, funding of $1.4 million is budgeted in FY 2017/18, and $9.8 million over twenty years, to transfer to the Golf and Tennis Fund to address the structural deficit in that Fund.
Project Administration costs in the amount of $485,395 are included in the Transfer to the General Services Fund in FY 2017/18. This reflects costs of Public Works staff for design and inspection of General Fund supported capital projects.
General Fund Projects
The FY 2017/18 Adopted Budget for the General Fund includes $21.2 million for capital, special, and outside group funding projects. The majority the General Fund projects expenditures in FY 2017/18, over $6 million, is in a special project for the recruitment and training of sworn public safety officers. This category of projects represents the largest share of General Fund project expenditures over the twenty-year plan, with $64.5 million budgeted for this purpose. The practice of budgeting for the recruitment, selection, and training of new public safety officers in a series of recurring special projects rather than in the operating budget began in FY 2006/07. This methodology allows expenditures to fluctuate each year based on the number of recruitments and allows for better monitoring and tracking of costs. It should
be noted that the fixed costs associated with this activity, which include management oversight and other recruitment expenses, continue to be part of the Public Safety Department operating budget.
The FY 2016/17 Adopted Budget included an expenditure line-item for Technology Project Funding. In the FY 2017/18 Budget, this funding is transferred to the General Services Fund / Technology and Communication Sub-Fund which is the primary fund for Information Technology investments. This includes funding of $8.1 million for the Enterprise Resource Planning (ERP) project.
There are seventeen new planned projects for FY 2017/18 totaling approximately $1.9 million. These include $350,000 for Bicycle Master Plan Update project, $250,000 for Downtown Pedestrian Traffic Signals, and $148,000 for Library LED Lighting Conversion.
The FY 2017/18 Budget contains $100,000 for Outside Group Funding per Council policy. This amount is reflected as an ongoing project cost through the entire twenty-year financial plan.
Often, one-time capital projects will result in ongoing operational costs. These Project Operating amounts are included in the budget in the Operations – Other line. The DPS Body Worn Cameras project accounts for a significant share of the Project Operating costs, totaling $204,000. This amount will be programmed in the operating budget as part of the FY 2018/19 budget development process. Another project with ongoing operation costs is the project for maintenance of the pay parking systems downtown ($59,105). The ongoing operating costs for the parking systems is expected to be fully offset by revenues, which are also programmed into the General Fund long-term financial plan. One significant offset to future operating costs comes in FY 2018/19. With the completion of the LED Streetlights project, the City anticipates savings on the cost of energy of approximately $245,000 annually.
The Total Compensation Set Aside is a key funding mechanism used to balance the General fund. When Council adopted the FY 2016/17 Budget, the General Fund was under significant pressure due to increasing pension costs. Retirement cost increases, which were not known until late in the budget development process, resulted in increases to our projected contribution rates
City of Sunnyvale FY 2017/18 General Fund
133

in back ten years. The strategy chosen to address this challenge was to modify the City’s long-term total compensation growth assumptions.
Future retirement costs due to CalPERS have further increased, and the updated amounts are included in the FY 2017/18 Adopted Budget. The retirement cost growth is driven by low investment returns as well as a change made by the CalPERS board to adjust the discount rate (used in combination with other factors to establish the City’s contribution rate). This subject is covered in detail in the Internal Services Fund section. As it relates to the General Fund, total General Fund requirements in the FY 2017/18 Budget have increased $195 million over twenty years. A portion of the Total Compensation Set Aside has been programmed to cover this shortfall. Approximately $58 million is drawn down from the $121 million Total Compensation Set Aside to keep the General Fund in balance over twenty years.
The Fiscal Strategies line is the second funding mechanism utilized to balance the General Fund. Given the increased operating costs, the General Fund long-term plan highlights the need to achieve $52 million in fiscal strategies over the twenty-year plan. Examples of fiscal strategies could be identifying new or additional revenue sources, evaluating service delivery levels to identify possible service adjustments or eliminations that are needed to balance the budget. The savings achieved from Fiscal Strategies is scheduled to begin with the FY 2018/19 operating budget.
General Fund Reserves
One of the most powerful aspects of multi-year financial planning is its capability to recognize trends over time and begin at an early point to consider the necessary steps to alter the long-term forecasted position of a particular fund should that appear necessary. The reserves contained in the General Fund’s long-term financial plan play a pivotal role in the City’s multi-year planning strategy.
The City has established reserves in the General Fund that are restricted by prior policy or legal requirements to specific uses. Most of the City’s reserves are established in accordance with policies adopted by Council.
The General Fund has four reserves that are contained in the General Fund’s long-term financial plan under the sub-heading, Reserves. The first is the Contingencies Reserve. By Council policy, this reserve must be equal to 15% of the operating budget in the first year of the long-term plan, in this case FY 2017/18, and then grow by the estimated change in the Consumer Price Index in each subsequent year. It is important to note that this reserve is not intended for normal unanticipated expenditures and is instead to be used for non-fiscal emergencies or disasters as determined by Council.
The second reserve in the General Fund is the Reserve for Capital Improvement Projects. Originally entitled the Land Acquisition Reserve, it was established in FY 1994/95 for the purpose of purchasing land or property in the downtown area with an emphasis on future income generation through economic development. In the past, it was used to purchase key parcels in the downtown area. In FY 2006/07 the reserve name was changed to Reserve for Capital Improvement Projects to reflect its expanded purpose. At the end of FY 2016/17, it is projected that the balance in this reserve will be $57.3 million. This reflects the $22.7 million in the reserve as of the end of FY 2015/16, as well as $37.6 million in proceeds from the sale of city property that is planned in FY 2016/17. It is important to note that the balance in the CIP Reserve depends on the final property sale amounts, and that the current projections are estimates prior to completing the City’s surplus property process. Projects planned using funding from the CIP Reserve include the Lakewood Branch Library Facility ($17.9 million), Sunnyvale Avenue Median - Iowa to Washington ($750,000), and Town Center Traffic Signal Modification ($744,396). The reserve is expected to increase with interest earnings and other sales of City property, as noted earlier.
A third reserve in the General Fund mandated by Council policy is the Budget Stabilization Fund. The Budget Stabilization Fund functions to normalize service levels through economic cycles. In essence, the intent is for this fund to increase during periods of economic growth and to be drawn down during the low points of economic cycles to maintain stable service levels.
In August 2011, Council adopted a new policy governing the balance of the Budget Stabilization Fund. This policy requires that the Budget Stabilization Fund be maintained at no less than 15% of total projected revenues for the first two years of the 20-year plan and that it never go below
City of Sunnyvale FY 2017/18 General Fund
134

$0 in any year. For the FY 2017/18 Budget, the Budget Stabilization Fund balance is 22% of revenues in FY 2017/18 and 15% in FY 2018/19.
The FY 2017/18 Adopted Budget continues to maintain balance over the short- and long-term. Over the twenty-year plan, Total Available Resources (excluding revenue and interest from the sale of property) are up $189 million, and Total Expenditures (excluding projects funded by the CIP Reserve) are up by $184.5 million. This results in a budget stabilization reserve that is up $4.5 million over the entire twenty-year plan. It is important to note that, as mentioned above, this budget draws down the Total Compensation Reserve and assumes fiscal strategies, yet to be identified, that either reduce the expenditure base by $52 million, or increase revenues by this amount. This structural change must be achieved in order to maintain the current service levels funded in the General Fund.
Lastly, the Equipment & Project C/O Reserve accounts for actual FY 2015/16 project carryover costs (and related revenues). Since a significant portion
of the current budgeted project costs are from the prior year (FY 2015/16) carryover, it was prudent to separate out this reserve to increase transparency of unspent project costs. Additionally, accounting for this reserve separately helps ensure that the available funds sin the Budget Stabilization Fund are not overstated.
Total Reserves in the General Fund increase or decrease depending upon the relationship between Total Current Resources and Total Current Requirements in the long-term financial plan. Put simply, when revenues and resources are greater than expenditures and transfers, money is put into the reserves, and when expenses are higher, money is taken out. The relationship between these can be seen at the bottom of the plan in the rows marked Total Current Resources, Total Current Requirements, and Difference. It should be noted that Sunnyvale’s Reserves are actual funds rather than estimated surpluses as is the case in the State Budget and some other local jurisdictions. The advantage of funded reserves includes the substantial interest earnings that are generated and added to annual revenues.
City of Sunnyvale FY 2017/18 General Fund
135

This Page Intentionally Blank
City of Sunnyvale FY 2017/18 General Fund
136
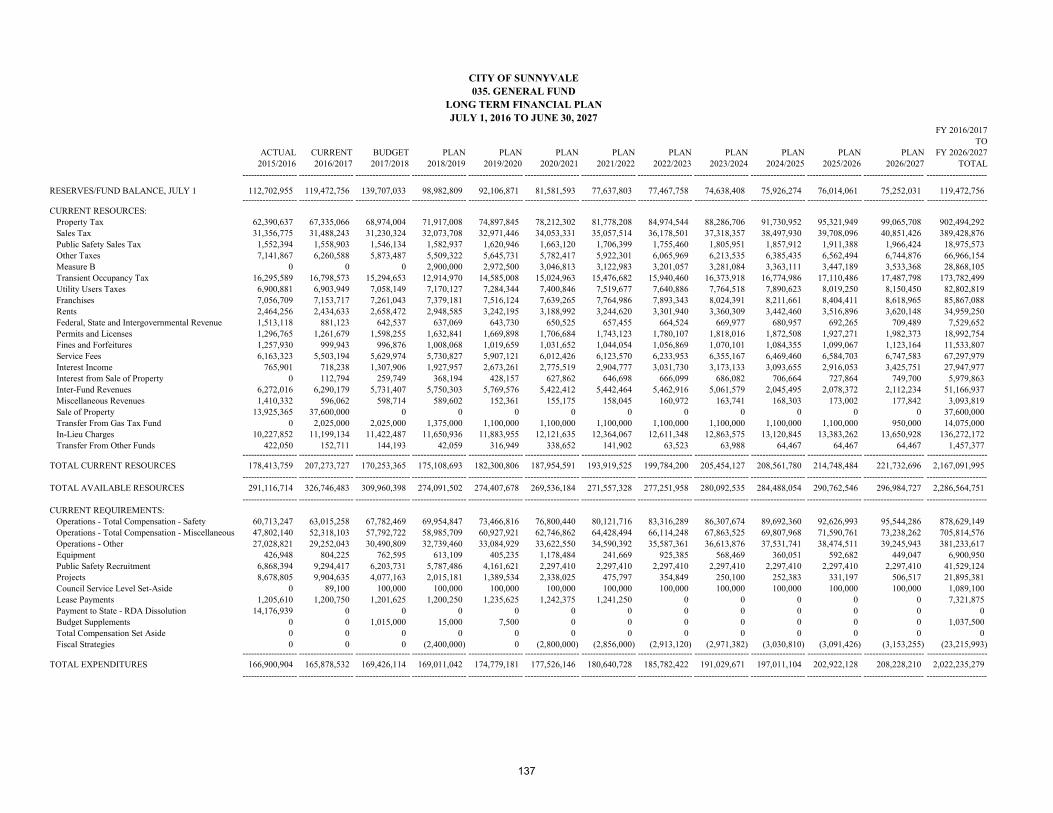
FY 2016/2017TO
ACTUAL CURRENT BUDGET PLAN PLAN PLAN PLAN PLAN PLAN PLAN PLAN PLAN FY 2026/20272015/2016 2016/2017 2017/2018 2018/2019 2019/2020 2020/2021 2021/2022 2022/2023 2023/2024 2024/2025 2025/2026 2026/2027 TOTAL
------------------- ------------------- ------------------- ------------------- ------------------- ------------------- ------------------- ------------------- ------------------- ------------------- ------------------- --------------------- ---------------------
RESERVES/FUND BALANCE, JULY 1 112,702,955 119,472,756 139,707,033 98,982,809 92,106,871 81,581,593 77,637,803 77,467,758 74,638,408 75,926,274 76,014,061 75,252,031 119,472,756------------------- ------------------- ------------------- ------------------- ------------------- ------------------- ------------------- ------------------- ------------------- ------------------- ------------------- --------------------- ---------------------
CURRENT RESOURCES: Property Tax 62,390,637 67,335,066 68,974,004 71,917,008 74,897,845 78,212,302 81,778,208 84,974,544 88,286,706 91,730,952 95,321,949 99,065,708 902,494,292 Sales Tax 31,356,775 31,488,243 31,230,324 32,073,708 32,971,446 34,053,331 35,057,514 36,178,501 37,318,357 38,497,930 39,708,096 40,851,426 389,428,876 Public Safety Sales Tax 1,552,394 1,558,903 1,546,134 1,582,937 1,620,946 1,663,120 1,706,399 1,755,460 1,805,951 1,857,912 1,911,388 1,966,424 18,975,573 Other Taxes 7,141,867 6,260,588 5,873,487 5,509,322 5,645,731 5,782,417 5,922,301 6,065,969 6,213,535 6,385,435 6,562,494 6,744,876 66,966,154 Measure B 0 0 0 2,900,000 2,972,500 3,046,813 3,122,983 3,201,057 3,281,084 3,363,111 3,447,189 3,533,368 28,868,105 Transient Occupancy Tax 16,295,589 16,798,573 15,294,653 12,914,970 14,585,008 15,024,963 15,476,682 15,940,460 16,373,918 16,774,986 17,110,486 17,487,798 173,782,499 Utility Users Taxes 6,900,881 6,903,949 7,058,149 7,170,127 7,284,344 7,400,846 7,519,677 7,640,886 7,764,518 7,890,623 8,019,250 8,150,450 82,802,819 Franchises 7,056,709 7,153,717 7,261,043 7,379,181 7,516,124 7,639,265 7,764,986 7,893,343 8,024,391 8,211,661 8,404,411 8,618,965 85,867,088 Rents 2,464,256 2,434,633 2,658,472 2,948,585 3,242,195 3,188,992 3,244,620 3,301,940 3,360,309 3,442,460 3,516,896 3,620,148 34,959,250 Federal, State and Intergovernmental Revenue 1,513,118 881,123 642,537 637,069 643,730 650,525 657,455 664,524 669,977 680,957 692,265 709,489 7,529,652 Permits and Licenses 1,296,765 1,261,679 1,598,255 1,632,841 1,669,898 1,706,684 1,743,123 1,780,107 1,818,016 1,872,508 1,927,271 1,982,373 18,992,754 Fines and Forfeitures 1,257,930 999,943 996,876 1,008,068 1,019,659 1,031,652 1,044,054 1,056,869 1,070,101 1,084,355 1,099,067 1,123,164 11,533,807 Service Fees 6,163,323 5,503,194 5,629,974 5,730,827 5,907,121 6,012,426 6,123,570 6,233,953 6,355,167 6,469,460 6,584,703 6,747,583 67,297,979 Interest Income 765,901 718,238 1,307,906 1,927,957 2,673,261 2,775,519 2,904,777 3,031,730 3,173,133 3,093,655 2,916,053 3,425,751 27,947,977 Interest from Sale of Property 0 112,794 259,749 368,194 428,157 627,862 646,698 666,099 686,082 706,664 727,864 749,700 5,979,863 Inter-Fund Revenues 6,272,016 6,290,179 5,731,407 5,750,303 5,769,576 5,422,412 5,442,464 5,462,916 5,061,579 2,045,495 2,078,372 2,112,234 51,166,937 Miscellaneous Revenues 1,410,332 596,062 598,714 589,602 152,361 155,175 158,045 160,972 163,741 168,303 173,002 177,842 3,093,819 Sale of Property 13,925,365 37,600,000 0 0 0 0 0 0 0 0 0 0 37,600,000 Transfer From Gas Tax Fund 0 2,025,000 2,025,000 1,375,000 1,100,000 1,100,000 1,100,000 1,100,000 1,100,000 1,100,000 1,100,000 950,000 14,075,000 In-Lieu Charges 10,227,852 11,199,134 11,422,487 11,650,936 11,883,955 12,121,635 12,364,067 12,611,348 12,863,575 13,120,845 13,383,262 13,650,928 136,272,172 Transfer From Other Funds 422,050 152,711 144,193 42,059 316,949 338,652 141,902 63,523 63,988 64,467 64,467 64,467 1,457,377
------------------- ------------------- ------------------- ------------------- ------------------- ------------------- ------------------- ------------------- ------------------- ------------------- ------------------- --------------------- ---------------------TOTAL CURRENT RESOURCES 178,413,759 207,273,727 170,253,365 175,108,693 182,300,806 187,954,591 193,919,525 199,784,200 205,454,127 208,561,780 214,748,484 221,732,696 2,167,091,995
------------------- ------------------- ------------------- ------------------- ------------------- ------------------- ------------------- ------------------- ------------------- ------------------- ------------------- --------------------- ---------------------TOTAL AVAILABLE RESOURCES 291,116,714 326,746,483 309,960,398 274,091,502 274,407,678 269,536,184 271,557,328 277,251,958 280,092,535 284,488,054 290,762,546 296,984,727 2,286,564,751
------------------- ------------------- ------------------- ------------------- ------------------- ------------------- ------------------- ------------------- ------------------- ------------------- ------------------- --------------------- ---------------------CURRENT REQUIREMENTS:
Operations - Total Compensation - Safety 60,713,247 63,015,258 67,782,469 69,954,847 73,466,816 76,800,440 80,121,716 83,316,289 86,307,674 89,692,360 92,626,993 95,544,286 878,629,149Operations - Total Compensation - Miscellaneous 47,802,140 52,318,103 57,792,722 58,985,709 60,927,921 62,746,862 64,428,494 66,114,248 67,863,525 69,807,968 71,590,761 73,238,262 705,814,576Operations - Other 27,028,821 29,252,043 30,490,809 32,739,460 33,084,929 33,622,550 34,590,392 35,587,361 36,613,876 37,531,741 38,474,511 39,245,943 381,233,617Equipment 426,948 804,225 762,595 613,109 405,235 1,178,484 241,669 925,385 568,469 360,051 592,682 449,047 6,900,950Public Safety Recruitment 6,868,394 9,294,417 6,203,731 5,787,486 4,161,621 2,297,410 2,297,410 2,297,410 2,297,410 2,297,410 2,297,410 2,297,410 41,529,124Projects 8,678,805 9,904,635 4,077,163 2,015,181 1,389,534 2,338,025 475,797 354,849 250,100 252,383 331,197 506,517 21,895,381Council Service Level Set-Aside 0 89,100 100,000 100,000 100,000 100,000 100,000 100,000 100,000 100,000 100,000 100,000 1,089,100Lease Payments 1,205,610 1,200,750 1,201,625 1,200,250 1,235,625 1,242,375 1,241,250 0 0 0 0 0 7,321,875Payment to State - RDA Dissolution 14,176,939 0 0 0 0 0 0 0 0 0 0 0 0Budget Supplements 0 0 1,015,000 15,000 7,500 0 0 0 0 0 0 0 1,037,500Total Compensation Set Aside 0 0 0 0 0 0 0 0 0 0 0 0 0Fiscal Strategies 0 0 0 (2,400,000) 0 (2,800,000) (2,856,000) (2,913,120) (2,971,382) (3,030,810) (3,091,426) (3,153,255) (23,215,993)
------------------- ------------------- ------------------- ------------------- ------------------- ------------------- ------------------- ------------------- ------------------- ------------------- ------------------- --------------------- ---------------------TOTAL EXPENDITURES 166,900,904 165,878,532 169,426,114 169,011,042 174,779,181 177,526,146 180,640,728 185,782,422 191,029,671 197,011,104 202,922,128 208,228,210 2,022,235,279
------------------- ------------------- ------------------- ------------------- ------------------- ------------------- ------------------- ------------------- ------------------- ------------------- ------------------- --------------------- ---------------------
CITY OF SUNNYVALE
035. GENERAL FUND
LONG TERM FINANCIAL PLAN
JULY 1, 2016 TO JUNE 30, 2027
137

FY 2016/2017TO
ACTUAL CURRENT BUDGET PLAN PLAN PLAN PLAN PLAN PLAN PLAN PLAN PLAN FY 2026/20272015/2016 2016/2017 2017/2018 2018/2019 2019/2020 2020/2021 2021/2022 2022/2023 2023/2024 2024/2025 2025/2026 2026/2027 TOTAL
------------------- ------------------- ------------------- ------------------- ------------------- ------------------- ------------------- ------------------- ------------------- ------------------- ------------------- --------------------- ---------------------
CITY OF SUNNYVALE
035. GENERAL FUND
LONG TERM FINANCIAL PLAN
JULY 1, 2016 TO JUNE 30, 2027
TRANSFERS TO OTHER FUNDS: Infrastructure Fund 538,328 10,290,183 3,739,007 3,740,468 3,636,334 4,276,601 5,190,392 9,160,999 5,177,498 4,222,653 5,288,500 4,246,224 58,968,859 Investment in City Facilities 1,500,000 1,500,000 1,500,000 1,500,000 1,500,000 1,500,000 1,500,000 1,500,000 1,500,000 1,500,000 1,500,000 1,500,000 16,500,000 Capital Projects Fund 67,233 4,154,411 18,246,453 156,060 6,795,906 1,015,505 0 0 172,303 761,579 0 0 31,302,217 Youth and Neighborhood Services Fund 508,598 582,886 597,586 704,563 727,392 745,391 765,382 785,676 806,454 819,354 840,853 867,369 8,242,906 Golf and Tennis Fund 450,000 850,000 1,400,000 1,200,000 1,300,000 1,400,000 1,400,000 1,500,000 1,600,000 0 0 0 10,650,000 General Services Fund 660,229 1,822,581 11,741,779 785,522 238,813 542,040 232,193 366,760 281,077 303,009 326,839 702,021 17,342,633 Liability and Property Insurance Fund 1,018,667 1,059,858 1,095,389 1,139,205 1,184,773 1,232,164 1,281,451 1,307,080 1,333,221 1,359,886 1,414,281 1,470,852 13,878,159 Solid Waste Fund 0 101,000 85,162 0 0 0 0 0 0 0 0 0 186,162
Wastewater Fund 0 0 3,146,100 3,747,771 2,663,685 3,660,534 3,079,424 2,210,614 2,266,036 2,496,409 3,217,913 2,437,134 28,925,620Employee Benefits Fund 0 800,000 0 0 0 0 0 0 0 0 0 0 800,000
------------------- ------------------- ------------------- ------------------- ------------------- ------------------- ------------------- ------------------- ------------------- ------------------- ------------------- --------------------- ---------------------TOTAL TRANSFERS TO OTHER FUNDS 4,743,054 21,160,918 41,551,476 12,973,588 18,046,903 14,372,235 13,448,842 16,831,128 13,136,589 11,462,889 12,588,387 11,223,600 186,796,556
------------------- ------------------- ------------------- ------------------- ------------------- ------------------- ------------------- ------------------- ------------------- ------------------- ------------------- --------------------- ---------------------TOTAL CURRENT REQUIREMENTS 171,643,958 187,039,450 210,977,590 181,984,630 192,826,084 191,898,381 194,089,570 202,613,550 204,166,261 208,473,993 215,510,515 219,451,811 2,209,031,835
------------------- ------------------- ------------------- ------------------- ------------------- ------------------- ------------------- ------------------- ------------------- ------------------- ------------------- --------------------- ---------------------RESERVES: DESIGNATED: Contingencies (15%) 20,081,497 21,687,811 23,346,485 24,186,733 24,791,402 25,411,187 26,046,466 26,697,628 27,365,069 28,049,195 28,750,425 29,469,186 29,469,186 Capital Improvement Projects 22,726,502 57,429,900 41,039,649 41,407,843 41,836,000 41,556,600 42,203,298 42,869,397 43,555,479 44,262,143 44,990,007 45,739,708 45,739,708 Budget Stabilization Fund 60,527,864 60,589,322 34,596,674 26,512,295 14,954,192 10,670,017 9,217,993 5,071,383 5,005,727 3,702,723 1,511,598 2,324,022 2,324,022 Equipment & Project C/O Reserve 16,136,893 0 0 0 0 0 0 0 0 0 0 0 0
------------------- ------------------- ------------------- ------------------- ------------------- ------------------- ------------------- ------------------- ------------------- ------------------- ------------------- --------------------- --------------------- SUB-TOTAL DESIGNATED RESERVES 119,472,756 139,707,033 98,982,809 92,106,871 81,581,593 77,637,803 77,467,758 74,638,408 75,926,274 76,014,061 75,252,031 77,532,916 77,532,916
------------------- ------------------- ------------------- ------------------- ------------------- ------------------- ------------------- ------------------- ------------------- ------------------- ------------------- --------------------- ---------------------TOTAL RESERVES 119,472,756 139,707,033 98,982,809 92,106,871 81,581,593 77,637,803 77,467,758 74,638,408 75,926,274 76,014,061 75,252,031 77,532,916 77,532,916
------------------- ------------------- ------------------- ------------------- ------------------- ------------------- ------------------- ------------------- ------------------- ------------------- ------------------- --------------------- ---------------------FUND BALANCE, JUNE 30 0 0 0 0 0 0 0 0 0 0 0 0 0
========== ========== ========== ========== ========== ========== ========== ========== ========== ========== ========== ============ ============
Total Current Resources 178,413,759 207,273,727 170,253,365 175,108,693 182,300,806 187,954,591 193,919,525 199,784,200 205,454,127 208,561,780 214,748,484 221,732,696 Total Current Requirements 171,643,958 187,039,450 210,977,590 181,984,630 192,826,084 191,898,381 194,089,570 202,613,550 204,166,261 208,473,993 215,510,515 219,451,811 DIFFERENCE 6,769,801 20,234,277 (40,724,224) (6,875,937) (10,525,278) (3,943,790) (170,046) (2,829,350) 1,287,866 87,787 (762,030) 2,280,885
Budget Stabilization Fund - % of Resources 29% 20% 15% 9% 6% 5% 3% 3% 2% 1% 1%
138

FY 2027/2028 FY 2016/2017TO TO
PLAN PLAN PLAN PLAN PLAN PLAN PLAN PLAN PLAN PLAN FY 2036/2037 FY 2036/20372027/2028 2028/2029 2029/2030 2030/2031 2031/2032 2032/2033 2033/2034 2034/2035 2035/2036 2036/2037 TOTAL TOTAL
------------------- ------------------- ------------------- ------------------- ------------------- ------------------- ------------------- ------------------- ------------------- ------------------- --------------------- ---------------------
RESERVES/FUND BALANCE, JULY 1 77,532,916 78,883,981 83,518,223 85,158,902 87,458,359 87,821,261 92,696,789 97,369,183 101,737,927 103,680,028 77,532,916 119,472,756------------------- ------------------- ------------------- ------------------- ------------------- ------------------- ------------------- ------------------- ------------------- ------------------- --------------------- ---------------------
CURRENT RESOURCES: Property Tax 102,947,909 106,984,424 111,181,441 113,644,503 118,111,979 121,946,082 126,752,481 130,412,339 135,514,634 140,814,684 1,208,310,476 2,110,804,769 Sales Tax 42,028,097 43,239,092 44,485,419 45,768,119 47,088,263 48,446,954 49,845,325 51,284,548 52,765,824 54,292,010 479,243,651 868,672,527 Public Safety Sales Tax 2,023,064 2,081,356 2,141,350 2,203,094 2,266,640 2,332,042 2,399,354 2,468,632 2,539,935 2,613,321 23,068,787 42,044,360 Other Taxes 6,932,756 7,126,310 7,325,724 7,531,189 7,742,900 7,961,064 8,185,891 8,417,600 8,656,417 8,902,572 78,782,424 145,748,578 Measure B 3,621,703 3,730,354 3,842,264 3,957,532 4,076,258 4,198,546 4,324,502 4,454,237 4,587,865 4,725,500 41,518,762 70,386,866 Transient Occupancy Tax 17,837,554 18,194,305 18,558,192 18,929,355 19,307,942 19,694,101 20,087,983 20,489,743 20,899,538 21,317,529 195,316,243 369,098,742 Utility Users Taxes 8,351,185 8,557,943 8,770,903 8,990,252 9,216,182 9,448,889 9,688,578 9,935,457 10,189,743 10,451,658 93,600,792 176,403,610 Franchises 8,839,957 9,067,577 9,302,027 9,543,510 9,792,237 10,048,426 10,312,301 10,584,092 10,864,036 11,152,379 99,506,541 185,373,629 Rents 3,710,937 3,803,077 3,904,349 4,002,927 4,102,587 4,213,701 4,320,368 4,429,304 4,528,316 4,630,223 41,645,789 76,605,039 Federal, State and Intergovernmental Revenue 722,080 735,048 715,072 728,830 743,001 757,597 772,631 788,116 804,065 820,493 7,586,933 15,116,585 Permits and Licenses 2,039,809 2,096,984 2,156,534 2,215,605 2,245,230 2,308,891 2,372,859 2,437,104 2,503,298 2,569,944 22,946,257 41,939,011 Fines and Forfeitures 1,148,143 1,174,030 1,200,848 1,228,622 1,257,378 1,287,142 1,317,942 1,349,807 1,382,766 1,416,849 12,763,528 24,297,335 Service Fees 6,917,040 7,100,702 7,278,629 7,465,874 7,661,670 7,852,521 8,042,421 8,266,510 8,476,460 8,692,198 77,754,024 145,052,004 Interest Income 3,208,597 3,001,972 2,770,001 2,496,314 2,259,136 2,115,254 2,066,292 2,146,868 2,321,019 2,367,439 24,752,892 52,700,869 Interest from Sale of Property 1,029,588 1,070,772 1,113,603 1,158,147 1,204,473 1,252,652 1,302,758 1,354,868 1,409,063 1,465,425 12,361,347 18,341,211 Inter-Fund Revenues 2,147,113 1,785,960 1,270,426 1,308,538 1,347,795 1,388,228 1,429,875 1,472,772 1,516,955 1,562,463 15,230,125 66,397,062 Miscellaneous Revenues 182,827 180,600 185,889 191,336 196,947 202,726 208,678 214,809 221,124 227,629 2,012,567 5,106,386 Sale of Property 0 0 0 0 0 0 0 0 0 0 0 37,600,000 Transfer From Gas Tax Fund 950,000 950,000 950,000 950,000 950,000 0 0 0 0 0 4,750,000 18,825,000 In-Lieu Charges 14,060,456 14,482,269 14,916,737 15,364,238 15,825,165 16,299,921 16,788,919 17,292,586 17,811,364 18,345,706 161,187,361 297,459,533 Transfer From Other Funds 80,965 81,474 81,997 82,537 526,433 1,390,415 1,034,254 1,034,861 1,035,486 1,036,130 6,384,552 7,841,930
------------------- ------------------- ------------------- ------------------- ------------------- ------------------- ------------------- ------------------- ------------------- ------------------- --------------------- ---------------------TOTAL CURRENT RESOURCES 228,779,781 235,444,248 242,151,405 247,760,523 255,922,217 263,145,153 271,253,413 278,834,254 288,027,908 297,404,151 2,608,723,053 4,775,815,047
------------------- ------------------- ------------------- ------------------- ------------------- ------------------- ------------------- ------------------- ------------------- ------------------- --------------------- ---------------------TOTAL AVAILABLE RESOURCES 306,312,697 314,328,229 325,669,628 332,919,425 343,380,576 350,966,413 363,950,202 376,203,437 389,765,835 401,084,179 2,686,255,969 4,895,287,803
------------------- ------------------- ------------------- ------------------- ------------------- ------------------- ------------------- ------------------- ------------------- ------------------- --------------------- ---------------------CURRENT REQUIREMENTS:
Operations - Total Compensation - Safety 98,970,677 102,122,822 105,510,124 108,833,248 110,966,160 113,961,837 116,539,765 118,676,409 120,897,812 122,473,867 1,118,952,722 1,997,581,871Operations - Total Compensation - Miscellaneous 75,042,307 76,582,569 78,273,047 79,651,245 76,088,812 77,706,376 79,115,255 80,302,877 81,528,030 82,543,604 786,834,122 1,492,648,698Operations - Other 40,318,520 41,421,920 42,554,141 43,719,109 44,948,842 46,175,999 47,437,770 48,735,140 50,067,294 51,436,848 456,815,582 838,049,199Equipment 1,177,743 573,699 386,348 1,390,732 474,351 1,219,469 546,661 933,416 748,385 601,639 8,052,443 14,953,393Public Safety Recruitment 2,297,410 2,297,410 2,297,410 2,297,410 2,297,410 2,297,410 2,297,410 2,297,410 2,297,410 2,297,410 22,974,100 64,503,224Projects 406,479 349,296 786,124 703,104 388,582 333,443 286,380 384,450 295,537 428,813 4,362,208 26,257,589Council Service Level Set-Aside 100,000 100,000 100,000 100,000 100,000 100,000 100,000 100,000 100,000 100,000 1,000,000 2,089,100Lease Payments 0 0 0 0 0 0 0 0 0 0 0 7,321,875Payment to State - RDA Dissolution 0 0 0 0 0 0 0 0 0 0 0 0Budget Supplements 0 0 0 0 0 0 0 0 0 0 0 1,037,500Total Compensation Set Aside 0 0 0 0 6,295,444 7,380,636 8,512,440 8,722,683 16,243,823 16,637,539 63,792,565 63,792,565Fiscal Strategies (3,216,320) (3,280,646) (3,346,259) (3,178,946) (3,019,999) (2,868,999) (2,725,549) (2,589,272) (2,459,808) (2,336,818) (29,022,616) (52,238,609)
------------------- ------------------- ------------------- ------------------- ------------------- ------------------- ------------------- ------------------- ------------------- ------------------- --------------------- ---------------------TOTAL EXPENDITURES 215,096,816 220,167,071 226,560,936 233,515,901 238,539,602 246,306,171 252,110,132 257,563,114 269,718,483 274,182,902 2,433,761,126 4,455,996,405
------------------- ------------------- ------------------- ------------------- ------------------- ------------------- ------------------- ------------------- ------------------- ------------------- --------------------- ---------------------
JULY 1, 2027 TO JUNE 30, 2037
CITY OF SUNNYVALE
035. GENERAL FUND
LONG TERM FINANCIAL PLAN
139

FY 2027/2028 FY 2016/2017TO TO
PLAN PLAN PLAN PLAN PLAN PLAN PLAN PLAN PLAN PLAN FY 2036/2037 FY 2036/20372027/2028 2028/2029 2029/2030 2030/2031 2031/2032 2032/2033 2033/2034 2034/2035 2035/2036 2036/2037 TOTAL TOTAL
------------------- ------------------- ------------------- ------------------- ------------------- ------------------- ------------------- ------------------- ------------------- ------------------- --------------------- ---------------------
JULY 1, 2027 TO JUNE 30, 2037
CITY OF SUNNYVALE
035. GENERAL FUND
LONG TERM FINANCIAL PLAN
TRANSFERS TO OTHER FUNDS: Infrastructure Fund 5,726,060 3,423,645 5,937,163 3,761,660 9,615,130 4,702,439 6,856,436 7,624,636 7,705,579 7,884,283 63,237,031 122,205,890 Investment in City Facilities 1,500,000 1,500,000 1,500,000 1,500,000 1,500,000 1,500,000 1,500,000 1,500,000 1,500,000 1,500,000 15,000,000 31,500,000 Capital Projects Fund 0 195,886 874,307 0 92,755 0 227,086 1,013,561 0 0 2,403,595 33,705,812 Youth and Neighborhood Services Fund 852,291 870,768 889,651 908,950 928,675 948,835 969,441 990,503 1,012,032 1,034,037 9,405,184 17,648,090 Golf and Tennis Fund 0 0 0 0 0 0 0 0 0 0 0 10,650,000 General Services Fund 246,577 527,778 376,011 544,272 545,598 511,110 510,558 1,057,989 467,581 1,187,918 5,975,391 23,318,025 Liability and Property Insurance Fund 1,514,978 1,545,277 1,576,183 1,607,707 1,639,861 1,705,455 1,773,673 1,809,147 1,845,330 1,863,783 16,881,393 30,759,552 Solid Waste Fund 0 0 0 0 0 0 0 0 0 0 0 186,162
Wastewater Fund 2,491,995 2,579,581 2,796,476 3,622,576 2,697,695 2,595,613 2,633,693 2,906,560 3,836,803 2,754,659 28,915,651 57,841,271Employee Benefits Fund 0 0 0 0 0 0 0 0 0 0 0 800,000
------------------- ------------------- ------------------- ------------------- ------------------- ------------------- ------------------- ------------------- ------------------- ------------------- --------------------- ---------------------TOTAL TRANSFERS TO OTHER FUNDS 12,331,900 10,642,935 13,949,791 11,945,165 17,019,714 11,963,453 14,470,887 16,902,396 16,367,324 16,224,680 141,818,245 328,614,801
------------------- ------------------- ------------------- ------------------- ------------------- ------------------- ------------------- ------------------- ------------------- ------------------- --------------------- ---------------------TOTAL CURRENT REQUIREMENTS 227,428,716 230,810,006 240,510,726 245,461,066 255,559,315 258,269,624 266,581,020 274,465,510 286,085,807 290,407,582 2,575,579,371 4,784,611,206
------------------- ------------------- ------------------- ------------------- ------------------- ------------------- ------------------- ------------------- ------------------- ------------------- --------------------- ---------------------RESERVES: DESIGNATED: Contingencies (15%) 30,205,916 30,961,063 31,735,090 32,528,467 33,341,679 34,175,221 35,029,601 35,905,341 36,802,975 37,723,049 37,723,049 37,723,049 Capital Improvement Projects 46,769,296 47,840,068 48,953,670 50,111,817 51,316,290 52,568,942 53,871,699 55,226,567 56,635,630 58,101,055 58,101,055 58,101,055 Budget Stabilization Fund 1,908,769 4,717,092 4,470,142 4,818,075 3,163,292 5,952,627 8,467,882 10,606,019 10,241,423 14,852,493 14,852,493 14,852,493 Equipment & Project C/O Reserve 0 0 0 0 0 0 0 0 0 0 0 0
------------------- ------------------- ------------------- ------------------- ------------------- ------------------- ------------------- ------------------- ------------------- ------------------- --------------------- --------------------- SUB-TOTAL DESIGNATED RESERVES 78,883,981 83,518,223 85,158,902 87,458,359 87,821,261 92,696,789 97,369,183 101,737,927 103,680,028 110,676,597 110,676,597 110,676,597
------------------- ------------------- ------------------- ------------------- ------------------- ------------------- ------------------- ------------------- ------------------- ------------------- --------------------- ---------------------TOTAL RESERVES 78,883,981 83,518,223 85,158,902 87,458,359 87,821,261 92,696,789 97,369,183 101,737,927 103,680,028 110,676,597 110,676,597 110,676,597
------------------- ------------------- ------------------- ------------------- ------------------- ------------------- ------------------- ------------------- ------------------- ------------------- --------------------- ---------------------FUND BALANCE, JUNE 30 0 0 0 0 0 0 0 0 0 0 0 0
========== ========== ========== ========== ========== ========== ========== ========== ========== ========== ============ ============
Total Current Resources 228,779,781 235,444,248 242,151,405 247,760,523 255,922,217 263,145,153 271,253,413 278,834,254 288,027,908 297,404,151 Total Current Requirements 227,428,716 230,810,006 240,510,726 245,461,066 255,559,315 258,269,624 266,581,020 274,465,510 286,085,807 290,407,582 DIFFERENCE 1,351,065 4,634,243 1,640,679 2,299,457 362,901 4,875,529 4,672,393 4,368,745 1,942,101 6,996,569
Budget Stabilization Fund - % of Resources 1% 2% 2% 2% 1% 3% 3% 4% 4% 6%
140

FY 2016/2017TO
ACTUAL CURRENT BUDGET PLAN PLAN PLAN PLAN PLAN PLAN PLAN PLAN PLAN FY 2026/20272015/2016 2016/2017 2017/2018 2018/2019 2019/2020 2020/2021 2021/2022 2022/2023 2023/2024 2024/2025 2025/2026 2026/2027 TOTAL
------------------- ------------------- ------------------- ------------------- ------------------- ------------------- ------------------- ------------------- ------------------- ------------------- ------------------- ------------------- ---------------------
035. GENERAL FUNDREVENUES BY SOURCE
150 Secured Tax 39,922,007 43,995,980 46,025,522 48,104,379 50,129,063 52,379,231 54,497,411 56,700,529 58,992,855 61,378,007 63,859,749 66,442,001 602,504,727152 Unitary Roll - AB454 489,975 498,300 538,047 560,568 585,306 609,274 633,961 659,649 686,381 714,197 743,142 773,261 7,002,086153 Property Tax in Lieu of VLF 14,774,725 16,275,952 17,026,764 17,795,820 18,544,836 19,377,267 20,160,870 20,975,896 21,823,923 22,706,290 23,624,390 24,579,673 222,891,680155 Tax Delinquencies 424,478 861,336 878,563 896,134 914,057 932,338 950,985 970,004 989,404 1,009,193 1,039,468 1,070,652 10,512,135156 Unsecured Tax 2,921,015 3,080,000 2,598,102 2,650,064 2,703,065 2,757,126 2,812,269 2,868,514 2,925,885 2,984,402 3,044,090 3,104,972 31,528,490157 Supplemental Roll 1,359,142 1,606,000 863,837 881,114 898,736 916,711 935,045 953,746 972,821 992,277 1,012,123 1,042,486 11,074,896159 Administrative Fees (472,364) (491,914) (519,335) (541,074) (564,951) (588,085) (611,913) (636,709) (662,511) (689,359) (717,298) (746,369) (6,769,518)181 General Fund Share of Tax Increment 2,971,659 1,509,413 1,562,505 1,570,001 1,687,733 1,828,440 2,399,581 2,482,914 2,557,948 2,635,946 2,716,284 2,799,031 23,749,796TOTAL PROPERTY TAXES 62,390,637 67,335,066 68,974,004 71,917,008 74,897,845 78,212,302 81,778,208 84,974,544 88,286,706 91,730,952 95,321,949 99,065,708 902,494,292
300 Sales and Use Tax 31,356,775 31,488,243 31,230,324 31,973,708 32,741,446 33,593,331 34,467,514 35,458,501 36,478,357 37,527,930 38,608,096 39,719,752 383,287,203300 Additional Sales Tax - Downtown 0 0 0 100,000 230,000 460,000 590,000 720,000 840,000 970,000 1,100,000 1,131,673 6,141,673TOTAL SALES AND USE TAXES 31,356,775 31,488,243 31,230,324 32,073,708 32,971,446 34,053,331 35,057,514 36,178,501 37,318,357 38,497,930 39,708,096 40,851,426 389,428,876
301 Sales and Use Tax - Public Safety 1,552,394 1,558,903 1,546,134 1,582,937 1,620,946 1,663,120 1,706,399 1,755,460 1,805,951 1,857,912 1,911,388 1,966,424 18,975,573TOTAL SALES AND USE TAX - PUBLIC SAFETY 1,552,394 1,558,903 1,546,134 1,582,937 1,620,946 1,663,120 1,706,399 1,755,460 1,805,951 1,857,912 1,911,388 1,966,424 18,975,573
450 Business License Tax 1,871,848 1,768,680 1,804,054 1,840,135 1,876,937 1,914,476 1,952,766 1,991,821 2,031,657 2,092,607 2,155,385 2,220,047 21,648,565451 Construction Tax 3,298,178 3,378,579 3,026,335 2,582,427 2,634,076 2,686,757 2,740,492 2,795,302 2,851,208 2,908,232 2,966,397 3,025,725 31,595,530452 Real Property Transfer Tax 1,971,841 1,113,329 1,043,098 1,086,760 1,134,718 1,181,183 1,229,043 1,278,846 1,330,669 1,384,596 1,440,711 1,499,105 13,722,059
Measure B 2,900,000 2,972,500 3,046,813 3,122,983 3,201,057 3,281,084 3,363,111 3,447,189 3,533,368 28,868,105TOTAL OTHER TAXES 7,141,867 6,260,588 5,873,487 8,409,322 8,618,231 8,829,229 9,045,284 9,267,026 9,494,619 9,748,546 10,009,682 10,278,245 95,834,259
453-1 Transient Occupancy Tax 16,267,696 16,798,573 15,294,653 12,914,970 14,585,008 15,024,963 15,476,682 15,940,460 16,373,918 16,774,986 17,110,486 17,487,798 173,782,499TOTAL TRANSIENT OCCUPANCY TAX 16,295,589 16,798,573 15,294,653 12,914,970 14,585,008 15,024,963 15,476,682 15,940,460 16,373,918 16,774,986 17,110,486 17,487,798 173,782,499
454-4 Utility User's Tax - Other Phone 398,288 339,768 339,768 339,768 339,768 339,768 339,768 339,768 339,768 339,768 339,768 339,768 3,737,444454-6 Utility User's Tax - Sprint 97,733 122,356 122,356 122,356 122,356 122,356 122,356 122,356 122,356 122,356 122,356 122,356 1,345,912454-7 Utility User's Tax - AT&T 893,913 827,098 827,098 827,098 827,098 827,098 827,098 827,098 827,098 827,098 827,098 827,098 9,098,073454-8 Utility User's Tax - Other Electric 250,904 309,065 316,791 323,127 329,590 336,182 342,905 349,763 356,759 363,894 371,172 378,595 3,777,843454-9 Utility User's Tax - PG&E Electric 4,395,177 4,382,141 4,491,695 4,581,529 4,673,159 4,766,623 4,861,955 4,959,194 5,058,378 5,159,546 5,262,736 5,367,991 53,564,947454-10 Utility User's Tax - PG&E Gas 574,632 568,032 595,866 607,783 619,939 632,338 644,984 657,884 671,042 684,462 698,152 712,115 7,092,596454-21 Utility User's Tax - Verizon 165,741 170,045 170,045 170,045 170,045 170,045 170,045 170,045 170,045 170,045 170,045 170,045 1,870,496454-22 Utility User's Tax - Other Gas 124,494 185,444 194,531 198,422 202,390 206,438 210,567 214,778 219,074 223,455 227,924 232,483 2,315,506TOTAL UTILITY USERS TAXES 6,900,881 6,903,949 7,058,149 7,170,127 7,284,344 7,400,846 7,519,677 7,640,886 7,764,518 7,890,623 8,019,250 8,150,450 82,802,819
600-1 Franchise - Air Products 29,745 33,339 33,339 34,006 34,686 35,380 36,087 36,809 37,545 38,296 39,062 40,234 398,782600-2 Franchise - Cal Water Service 25,287 25,793 26,309 26,835 27,372 27,919 28,478 29,047 29,628 30,517 31,433 32,376 315,707600-3 Franchise - Taxicab Service 9,224 7,734 0 0 0 0 0 0 0 0 0 0 7,734602 Franchise - Comcast Cable 1,245,206 1,252,600 1,252,600 1,252,600 1,252,600 1,252,600 1,252,600 1,252,600 1,252,600 1,252,600 1,252,600 1,252,600 13,778,600603 Franchise - PG&E 2,735,769 2,742,561 2,797,412 2,853,360 2,910,428 2,968,636 3,028,009 3,088,569 3,150,340 3,244,851 3,342,196 3,442,462 33,568,825604 Franchise - Specialty Garbage 1,849,824 1,886,820 1,924,557 1,963,048 2,002,309 2,042,355 2,083,202 2,124,866 2,167,363 2,232,384 2,299,356 2,368,336 23,094,595606 Host Fees - Garbage 853,334 878,250 900,206 922,712 945,779 969,424 993,659 1,018,501 1,043,963 1,070,062 1,096,814 1,129,718 10,969,088607 Franchise - ATT 308,320 326,620 326,620 326,620 342,951 342,951 342,951 342,951 342,951 342,951 342,951 353,240 3,733,757TOTAL FRANCHISE FEES 7,056,709 7,153,717 7,261,043 7,379,181 7,516,124 7,639,265 7,764,986 7,893,343 8,024,391 8,211,661 8,404,411 8,618,965 85,867,088
751-4 Rental - American Medical Response 0 0 9,770 10,063 10,365 10,676 10,996 11,326 11,666 12,016 12,376 12,748 112,002751-5 Rental - Cal West Automotive 15,600 15,600 15,600 16,068 16,550 17,047 17,558 18,085 18,627 19,186 19,762 20,354 194,437751-6 Rental - City Real Property 26,875 10,500 10,500 10,500 10,500 10,500 10,500 10,500 10,500 10,500 10,500 10,500 115,500751-8 Rental - 5th Matador 24,161 0 0 0 0 0 0 0 0 0 0 0 0751-17 Rental - Downtown Properties 56,100 39,402 39,402 0 0 0 0 0 0 0 0 0 78,804751-21 Rental - 239 Commercial Street 59,937 55,880 57,556 108,456 108,456 0 0 0 0 0 0 0 330,348751-23 Rental - Courthouse Parking 44,137 45,474 46,838 47,775 48,730 49,705 50,699 51,713 52,747 54,330 55,959 57,638 561,608751-24 Rental - Dental 28,080 28,080 29,484 30,074 30,675 31,289 31,914 32,553 33,204 34,200 35,226 36,283 352,981
141
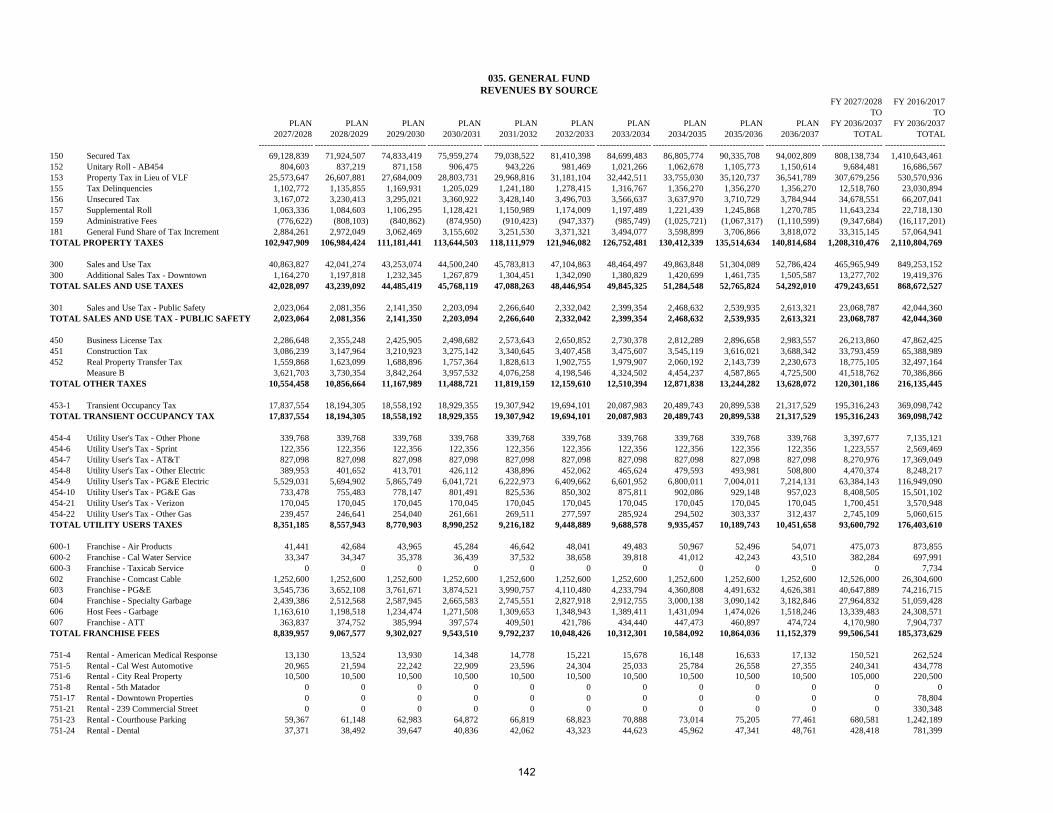
150 Secured Tax 152 Unitary Roll - AB454153 Property Tax in Lieu of VLF155 Tax Delinquencies156 Unsecured Tax157 Supplemental Roll159 Administrative Fees181 General Fund Share of Tax IncrementTOTAL PROPERTY TAXES
300 Sales and Use Tax 300 Additional Sales Tax - DowntownTOTAL SALES AND USE TAXES
301 Sales and Use Tax - Public SafetyTOTAL SALES AND USE TAX - PUBLIC SAFETY
450 Business License Tax 451 Construction Tax452 Real Property Transfer Tax
Measure BTOTAL OTHER TAXES
453-1 Transient Occupancy Tax TOTAL TRANSIENT OCCUPANCY TAX
454-4 Utility User's Tax - Other Phone454-6 Utility User's Tax - Sprint 454-7 Utility User's Tax - AT&T454-8 Utility User's Tax - Other Electric 454-9 Utility User's Tax - PG&E Electric454-10 Utility User's Tax - PG&E Gas454-21 Utility User's Tax - Verizon454-22 Utility User's Tax - Other GasTOTAL UTILITY USERS TAXES
600-1 Franchise - Air Products600-2 Franchise - Cal Water Service600-3 Franchise - Taxicab Service602 Franchise - Comcast Cable603 Franchise - PG&E604 Franchise - Specialty Garbage 606 Host Fees - Garbage607 Franchise - ATTTOTAL FRANCHISE FEES
751-4 Rental - American Medical Response751-5 Rental - Cal West Automotive751-6 Rental - City Real Property751-8 Rental - 5th Matador751-17 Rental - Downtown Properties751-21 Rental - 239 Commercial Street751-23 Rental - Courthouse Parking751-24 Rental - Dental
FY 2027/2028 FY 2016/2017TO TO
PLAN PLAN PLAN PLAN PLAN PLAN PLAN PLAN PLAN PLAN FY 2036/2037 FY 2036/20372027/2028 2028/2029 2029/2030 2030/2031 2031/2032 2032/2033 2033/2034 2034/2035 2035/2036 2036/2037 TOTAL TOTAL
------------------- ------------------- ------------------- ------------------- ------------------- ------------------- ------------------- ------------------- ------------------- ------------------- --------------------- ---------------------
035. GENERAL FUNDREVENUES BY SOURCE
69,128,839 71,924,507 74,833,419 75,959,274 79,038,522 81,410,398 84,699,483 86,805,774 90,335,708 94,002,809 808,138,734 1,410,643,461804,603 837,219 871,158 906,475 943,226 981,469 1,021,266 1,062,678 1,105,773 1,150,614 9,684,481 16,686,567
25,573,647 26,607,881 27,684,009 28,803,731 29,968,816 31,181,104 32,442,511 33,755,030 35,120,737 36,541,789 307,679,256 530,570,9361,102,772 1,135,855 1,169,931 1,205,029 1,241,180 1,278,415 1,316,767 1,356,270 1,356,270 1,356,270 12,518,760 23,030,8943,167,072 3,230,413 3,295,021 3,360,922 3,428,140 3,496,703 3,566,637 3,637,970 3,710,729 3,784,944 34,678,551 66,207,0411,063,336 1,084,603 1,106,295 1,128,421 1,150,989 1,174,009 1,197,489 1,221,439 1,245,868 1,270,785 11,643,234 22,718,130(776,622) (808,103) (840,862) (874,950) (910,423) (947,337) (985,749) (1,025,721) (1,067,317) (1,110,599) (9,347,684) (16,117,201)
2,884,261 2,972,049 3,062,469 3,155,602 3,251,530 3,371,321 3,494,077 3,598,899 3,706,866 3,818,072 33,315,145 57,064,941102,947,909 106,984,424 111,181,441 113,644,503 118,111,979 121,946,082 126,752,481 130,412,339 135,514,634 140,814,684 1,208,310,476 2,110,804,769
40,863,827 42,041,274 43,253,074 44,500,240 45,783,813 47,104,863 48,464,497 49,863,848 51,304,089 52,786,424 465,965,949 849,253,1521,164,270 1,197,818 1,232,345 1,267,879 1,304,451 1,342,090 1,380,829 1,420,699 1,461,735 1,505,587 13,277,702 19,419,376
42,028,097 43,239,092 44,485,419 45,768,119 47,088,263 48,446,954 49,845,325 51,284,548 52,765,824 54,292,010 479,243,651 868,672,527
2,023,064 2,081,356 2,141,350 2,203,094 2,266,640 2,332,042 2,399,354 2,468,632 2,539,935 2,613,321 23,068,787 42,044,3602,023,064 2,081,356 2,141,350 2,203,094 2,266,640 2,332,042 2,399,354 2,468,632 2,539,935 2,613,321 23,068,787 42,044,360
2,286,648 2,355,248 2,425,905 2,498,682 2,573,643 2,650,852 2,730,378 2,812,289 2,896,658 2,983,557 26,213,860 47,862,4253,086,239 3,147,964 3,210,923 3,275,142 3,340,645 3,407,458 3,475,607 3,545,119 3,616,021 3,688,342 33,793,459 65,388,9891,559,868 1,623,099 1,688,896 1,757,364 1,828,613 1,902,755 1,979,907 2,060,192 2,143,739 2,230,673 18,775,105 32,497,1643,621,703 3,730,354 3,842,264 3,957,532 4,076,258 4,198,546 4,324,502 4,454,237 4,587,865 4,725,500 41,518,762 70,386,866
10,554,458 10,856,664 11,167,989 11,488,721 11,819,159 12,159,610 12,510,394 12,871,838 13,244,282 13,628,072 120,301,186 216,135,445
17,837,554 18,194,305 18,558,192 18,929,355 19,307,942 19,694,101 20,087,983 20,489,743 20,899,538 21,317,529 195,316,243 369,098,74217,837,554 18,194,305 18,558,192 18,929,355 19,307,942 19,694,101 20,087,983 20,489,743 20,899,538 21,317,529 195,316,243 369,098,742
339,768 339,768 339,768 339,768 339,768 339,768 339,768 339,768 339,768 339,768 3,397,677 7,135,121122,356 122,356 122,356 122,356 122,356 122,356 122,356 122,356 122,356 122,356 1,223,557 2,569,469827,098 827,098 827,098 827,098 827,098 827,098 827,098 827,098 827,098 827,098 8,270,976 17,369,049389,953 401,652 413,701 426,112 438,896 452,062 465,624 479,593 493,981 508,800 4,470,374 8,248,217
5,529,031 5,694,902 5,865,749 6,041,721 6,222,973 6,409,662 6,601,952 6,800,011 7,004,011 7,214,131 63,384,143 116,949,090733,478 755,483 778,147 801,491 825,536 850,302 875,811 902,086 929,148 957,023 8,408,505 15,501,102170,045 170,045 170,045 170,045 170,045 170,045 170,045 170,045 170,045 170,045 1,700,451 3,570,948239,457 246,641 254,040 261,661 269,511 277,597 285,924 294,502 303,337 312,437 2,745,109 5,060,615
8,351,185 8,557,943 8,770,903 8,990,252 9,216,182 9,448,889 9,688,578 9,935,457 10,189,743 10,451,658 93,600,792 176,403,610
41,441 42,684 43,965 45,284 46,642 48,041 49,483 50,967 52,496 54,071 475,073 873,85533,347 34,347 35,378 36,439 37,532 38,658 39,818 41,012 42,243 43,510 382,284 697,991
0 0 0 0 0 0 0 0 0 0 0 7,7341,252,600 1,252,600 1,252,600 1,252,600 1,252,600 1,252,600 1,252,600 1,252,600 1,252,600 1,252,600 12,526,000 26,304,6003,545,736 3,652,108 3,761,671 3,874,521 3,990,757 4,110,480 4,233,794 4,360,808 4,491,632 4,626,381 40,647,889 74,216,7152,439,386 2,512,568 2,587,945 2,665,583 2,745,551 2,827,918 2,912,755 3,000,138 3,090,142 3,182,846 27,964,832 51,059,4281,163,610 1,198,518 1,234,474 1,271,508 1,309,653 1,348,943 1,389,411 1,431,094 1,474,026 1,518,246 13,339,483 24,308,571
363,837 374,752 385,994 397,574 409,501 421,786 434,440 447,473 460,897 474,724 4,170,980 7,904,7378,839,957 9,067,577 9,302,027 9,543,510 9,792,237 10,048,426 10,312,301 10,584,092 10,864,036 11,152,379 99,506,541 185,373,629
13,130 13,524 13,930 14,348 14,778 15,221 15,678 16,148 16,633 17,132 150,521 262,52420,965 21,594 22,242 22,909 23,596 24,304 25,033 25,784 26,558 27,355 240,341 434,77810,500 10,500 10,500 10,500 10,500 10,500 10,500 10,500 10,500 10,500 105,000 220,500
0 0 0 0 0 0 0 0 0 0 0 00 0 0 0 0 0 0 0 0 0 0 78,8040 0 0 0 0 0 0 0 0 0 0 330,348
59,367 61,148 62,983 64,872 66,819 68,823 70,888 73,014 75,205 77,461 680,581 1,242,18937,371 38,492 39,647 40,836 42,062 43,323 44,623 45,962 47,341 48,761 428,418 781,399
142

FY 2016/2017TO
ACTUAL CURRENT BUDGET PLAN PLAN PLAN PLAN PLAN PLAN PLAN PLAN PLAN FY 2026/20272015/2016 2016/2017 2017/2018 2018/2019 2019/2020 2020/2021 2021/2022 2022/2023 2023/2024 2024/2025 2025/2026 2026/2027 TOTAL
------------------- ------------------- ------------------- ------------------- ------------------- ------------------- ------------------- ------------------- ------------------- ------------------- ------------------- ------------------- ---------------------
035. GENERAL FUNDREVENUES BY SOURCE
752-1 Rental - Indoor Sports Center 126,900 115,000 118,450 118,450 122,004 122,004 125,664 125,664 129,434 129,434 133,317 133,317 1,372,734752-3 Rental - Park Buildings 94,795 80,800 81,608 82,424 83,248 84,081 84,922 85,771 86,629 87,495 88,370 89,253 934,600752-4 Rental - Picnic Areas 117,897 121,200 122,412 123,636 124,872 126,121 127,382 128,656 129,943 131,242 132,555 133,880 1,401,900752-5 Rental - Performing Arts Center 149,665 165,240 168,544 171,915 175,353 178,860 182,437 186,086 189,808 193,604 197,476 203,400 2,012,725752-6 Rental - Community Center 124,163 116,150 117,311 118,484 119,669 120,866 122,074 123,295 124,528 125,773 127,031 128,301 1,343,483752-7 Rental - Athletic Fields 165,449 209,100 209,100 213,282 213,282 217,548 217,548 221,899 221,899 226,337 226,337 230,863 2,407,193752-9 Rental - Equipment 10,775 12,000 12,240 12,240 12,240 12,240 12,240 12,240 12,852 12,852 12,852 12,852 136,848752-10 Rental - Senior Center 154,000 121,200 122,412 123,636 124,872 126,121 127,382 128,656 129,943 131,242 132,555 139,182 1,407,203752-14 Rental - Creative Arts Center 1,420 2,500 0 0 0 0 0 0 0 0 0 0 2,500752-15 Rental - Banner Installations 3,200 2,000 2,000 2,000 2,000 2,000 2,000 2,000 2,000 2,000 2,000 2,060 22,060752-16 Rental - Non Profit Use - Park Buildings 22,591 20,200 20,402 20,606 20,812 21,020 21,230 21,443 21,657 21,874 22,092 22,092 233,429752-17 Rental - Non-Profit Use - Community Center 0 2,020 2,040 2,060 2,081 2,102 2,123 2,144 2,166 2,187 2,209 2,319 23,451754-4 Tower/Antenna Rental - Sprint 8,464 8,470 8,639 8,812 8,988 9,168 9,351 9,538 9,729 10,021 10,321 10,631 103,668754-5 Tower/Antenna Rental - Cingular 71,316 72,740 9,772 0 0 0 0 0 0 0 0 0 82,512754-6 Tower/Antenna Rental - T-Mobile 74,956 76,085 79,042 80,623 82,235 83,880 85,558 87,269 89,014 91,685 94,435 97,268 947,095754-7 Tower/Antenna Rental - Metro PCS 0 8,472 8,726 8,900 9,078 9,260 9,445 9,634 9,827 10,121 10,425 10,738 104,625754-10 Tower/Antenna Rental - Clearwire 45,671 47,654 49,560 50,551 51,562 52,593 53,645 54,718 55,813 57,487 59,212 60,988 593,7833606-42 SMART Station Rent 414,551 422,842 545,450 668,057 790,665 806,478 822,608 839,060 855,841 881,516 907,962 935,201 8,475,6813607-43 Water Pollution Control Plant Rent 365,174 372,478 502,797 645,778 794,278 810,163 826,366 842,894 859,752 885,544 912,110 939,474 8,391,6343610-42 Landfill Rent 258,379 263,547 268,818 274,194 279,678 285,271 290,977 296,796 302,732 311,814 311,814 330,804 3,216,446TOTAL RENTS AND CONCESSIONS 2,464,256 2,434,633 2,658,472 2,948,585 3,242,195 3,188,992 3,244,620 3,301,940 3,360,309 3,442,460 3,516,896 3,620,148 34,959,250
901 Federal Grants 84,324 0 0 0 0 0 0 0 0 0 0 0 0930 Bureau of Justice Grant 7,338 11,730 11,999 0 0 0 0 0 0 0 0 0 23,729938 ISTEA Grant 56,400 0 0 0 0 0 0 0 0 0 0 0 0965 Homeland Security Grants 57,553 2,400 2,400 2,400 2,400 2,400 2,400 2,400 2,400 2,400 2,400 2,400 26,4001110 Bus Shelter Advertising 7,806 6,110 6,110 6,110 6,110 6,110 6,110 6,110 6,110 6,110 6,110 6,110 67,2101111 County of Santa Clara Reimbursement 25,242 0 0 0 0 0 0 0 0 0 0 0 01114 Other Agencies - Reimbursement 10,000 84,000 0 0 0 0 0 0 0 0 0 0 84,0001119-1 PCJPB Reimbursement - Multimodal 166,836 214,139 218,422 222,791 227,246 231,791 236,427 241,156 245,979 253,358 260,959 268,788 2,621,0571121 Silicon Valley Council on Aging Grant 18,000 0 0 0 0 0 0 0 0 0 0 0 01122 Fremont Pool Cost Sharing 20,285 19,200 19,200 19,200 19,200 19,200 19,200 19,200 19,200 19,200 19,200 19,776 211,7761123 Columbia Pool Cost Sharing 51,657 27,963 28,523 29,093 29,675 30,268 30,874 31,491 32,121 33,085 34,077 35,100 342,2701126 Cupertino School District Reimbursement 62,400 0 0 0 0 0 0 0 0 0 0 0 01128 Community Choice Energy Cost Sharing 450,000 0 0 0 0 0 0 0 0 0 0 0 0
1,017,840 365,543 286,654 279,594 284,631 289,770 295,011 300,357 305,810 314,153 322,746 332,173 3,376,441
1012 Homeowner's Property Tax Relief 223,211 222,960 222,960 222,960 222,960 222,960 222,960 222,960 222,960 222,960 222,960 222,960 2,452,5601014 Motor Vehicle License Fees 59,727 0 0 0 0 0 0 0 0 0 0 0 01017 Office of Traffic Safety 82,969 41,000 0 0 0 0 0 0 0 0 0 0 41,0001018 POST Reimbursement 35,946 20,000 20,000 20,000 20,000 20,000 20,000 20,000 20,000 20,000 20,000 25,000 225,0001025 Mandated Cost - SB 90 51,564 78,030 79,591 81,182 82,806 84,462 86,151 87,874 87,874 90,511 93,226 96,023 947,7311025 Mandated Costs PY Reimbursement 0 33,333 33,333 33,333 33,333 33,333 33,333 33,333 33,333 33,333 33,333 33,333 366,6631027 Miscellaneous State Grants 20,709 120,257 0 0 0 0 0 0 0 0 0 0 120,2571034 Library Services and Tech Act 5,000 0 0 0 0 0 0 0 0 0 0 0 01041 State Tire Enforcement Grant 16,151 0 0 0 0 0 0 0 0 0 0 0 0TOTAL STATE SHARED REVENUE 495,277 515,580 355,884 357,475 359,099 360,755 362,444 364,167 364,167 366,804 369,519 377,316 4,153,211
1349 Certified Unified Program Agency 864,045 859,329 1,176,064 1,202,354 1,230,823 1,258,922 1,286,576 1,314,611 1,343,380 1,384,374 1,425,343 1,465,579 13,947,3541359 Permit - Hazardous Materials 66,230 65,000 88,958 90,947 93,100 95,225 97,317 99,438 101,614 104,715 107,814 110,857 1,054,9841361 Permit - Miscellaneous 50 0 0 0 0 0 0 0 0 0 0 0 01362 Permit - Fire Operations 253,111 245,000 245,000 249,900 254,898 259,996 265,196 270,500 275,910 284,187 292,713 301,494 2,944,7931368 Permit - Transportation 18,793 17,854 17,854 17,854 17,854 17,854 17,854 17,854 17,854 18,390 18,941 19,510 199,6721370 Permit - Taxi Driver and Vehicle 31,724 20,153 14,806 15,102 15,404 15,712 16,026 16,347 16,674 17,007 17,348 17,868 182,448
TOTAL FEDERAL & INTERGOVERNMENTAL
143

752-1 Rental - Indoor Sports Center752-3 Rental - Park Buildings752-4 Rental - Picnic Areas752-5 Rental - Performing Arts Center752-6 Rental - Community Center752-7 Rental - Athletic Fields752-9 Rental - Equipment752-10 Rental - Senior Center752-14 Rental - Creative Arts Center752-15 Rental - Banner Installations752-16 Rental - Non Profit Use - Park Buildings752-17 Rental - Non-Profit Use - Community Center754-4 Tower/Antenna Rental - Sprint754-5 Tower/Antenna Rental - Cingular754-6 Tower/Antenna Rental - T-Mobile754-7 Tower/Antenna Rental - Metro PCS754-10 Tower/Antenna Rental - Clearwire3606-42 SMART Station Rent3607-43 Water Pollution Control Plant Rent3610-42 Landfill RentTOTAL RENTS AND CONCESSIONS
901 Federal Grants 930 Bureau of Justice Grant938 ISTEA Grant965 Homeland Security Grants1110 Bus Shelter Advertising1111 County of Santa Clara Reimbursement1114 Other Agencies - Reimbursement1119-1 PCJPB Reimbursement - Multimodal1121 Silicon Valley Council on Aging Grant1122 Fremont Pool Cost Sharing1123 Columbia Pool Cost Sharing1126 Cupertino School District Reimbursement1128 Community Choice Energy Cost Sharing
1012 Homeowner's Property Tax Relief1014 Motor Vehicle License Fees1017 Office of Traffic Safety 1018 POST Reimbursement1025 Mandated Cost - SB 901025 Mandated Costs PY Reimbursement1027 Miscellaneous State Grants 1034 Library Services and Tech Act1041 State Tire Enforcement GrantTOTAL STATE SHARED REVENUE
1349 Certified Unified Program Agency1359 Permit - Hazardous Materials1361 Permit - Miscellaneous1362 Permit - Fire Operations1368 Permit - Transportation 1370 Permit - Taxi Driver and Vehicle
TOTAL FEDERAL & INTERGOVERNMENTAL
FY 2027/2028 FY 2016/2017TO TO
PLAN PLAN PLAN PLAN PLAN PLAN PLAN PLAN PLAN PLAN FY 2036/2037 FY 2036/20372027/2028 2028/2029 2029/2030 2030/2031 2031/2032 2032/2033 2033/2034 2034/2035 2035/2036 2036/2037 TOTAL TOTAL
------------------- ------------------- ------------------- ------------------- ------------------- ------------------- ------------------- ------------------- ------------------- ------------------- --------------------- ---------------------
035. GENERAL FUNDREVENUES BY SOURCE
137,316 137,316 141,435 141,435 145,679 145,679 150,049 150,049 154,550 159,187 1,462,695 2,835,43090,146 91,047 91,958 92,878 93,806 94,744 95,692 96,649 97,615 98,591 943,127 1,877,727
135,219 136,571 137,937 139,316 140,709 142,117 143,538 144,973 146,423 147,887 1,414,690 2,816,590209,502 215,788 222,261 228,929 235,797 242,871 250,157 257,662 265,391 273,353 2,401,711 4,414,435129,584 130,880 132,189 133,511 134,846 136,194 137,556 138,932 140,321 141,724 1,355,739 2,699,221230,863 235,481 235,481 240,190 240,190 244,994 244,994 249,894 249,894 249,894 2,421,874 4,829,067
13,495 13,495 13,495 13,495 13,495 14,169 14,169 14,169 14,169 14,169 138,320 275,168139,182 139,182 146,142 146,142 146,142 153,449 153,449 153,449 153,449 153,449 1,484,032 2,891,235
0 0 0 0 0 0 0 0 0 0 0 2,5002,122 2,185 2,251 2,319 2,388 2,460 2,534 2,610 2,688 2,768 24,324 46,384
23,197 23,197 23,197 24,357 24,357 24,357 25,575 25,575 25,575 25,575 244,961 478,3902,319 2,319 2,435 2,435 2,435 2,557 2,557 2,557 2,557 2,557 24,731 48,183
10,950 11,278 11,617 11,965 12,324 12,694 13,075 13,467 13,871 14,287 125,529 229,1970 0 0 0 0 0 0 0 0 0 0 82,512
100,186 103,192 106,288 109,476 112,761 116,144 119,628 123,217 126,913 130,721 1,148,525 2,095,62011,060 11,392 11,733 12,085 12,448 12,821 13,206 13,602 14,010 14,431 126,789 231,41362,818 64,702 66,643 68,642 70,702 72,823 75,007 77,258 79,575 81,963 720,133 1,313,917
963,257 992,155 1,021,919 1,052,577 1,084,154 1,116,679 1,150,179 1,184,684 1,220,225 1,256,832 11,042,660 19,518,341967,658 996,688 1,026,588 1,057,386 1,089,108 1,121,781 1,155,434 1,190,097 1,225,800 1,262,574 11,093,114 19,484,748340,728 350,950 361,478 372,323 383,492 394,997 406,847 419,052 419,052 419,052 3,867,972 7,084,419
3,710,937 3,803,077 3,904,349 4,002,927 4,102,587 4,213,701 4,320,368 4,429,304 4,528,316 4,630,223 41,645,789 76,605,039
0 0 0 0 0 0 0 0 0 0 0 00 0 0 0 0 0 0 0 0 0 0 23,7290 0 0 0 0 0 0 0 0 0 0 0
2,400 2,400 2,400 2,400 2,400 2,400 2,400 2,400 2,400 2,400 24,000 50,4006,110 6,110 6,110 6,110 6,110 6,110 6,110 6,110 6,110 6,110 61,100 128,310
0 0 0 0 0 0 0 0 0 0 0 00 0 0 0 0 0 0 0 0 0 0 84,000
276,851 285,157 293,712 302,523 311,599 320,947 330,575 340,492 350,707 361,228 3,173,790 5,794,8470 0 0 0 0 0 0 0 0 0 0 0
20,369 20,980 21,610 22,258 22,926 23,614 24,322 25,052 25,803 26,577 233,511 445,28736,153 37,237 38,354 39,505 40,690 41,911 43,168 44,463 45,797 47,171 414,448 756,718
0 0 0 0 0 0 0 0 0 0 0 00 0 0 0 0 0 0 0 0 0 0 0
341,883 351,884 362,186 372,796 383,724 394,981 406,575 418,517 430,817 443,486 3,906,850 7,283,291
222,960 222,960 222,960 222,960 222,960 222,960 222,960 222,960 222,960 222,960 2,229,600 4,682,1600 0 0 0 0 0 0 0 0 0 0 00 0 0 0 0 0 0 0 0 0 0 41,000
25,000 25,000 25,000 25,000 25,000 25,000 25,000 25,000 25,000 25,000 250,000 475,00098,903 101,871 104,927 108,074 111,317 114,656 118,096 121,639 125,288 129,047 1,133,817 2,081,54933,333 33,333 0 0 0 0 0 0 0 0 66,666 433,329
0 0 0 0 0 0 0 0 0 0 0 120,2570 0 0 0 0 0 0 0 0 0 0 00 0 0 0 0 0 0 0 0 0 0 0
380,196 383,164 352,887 356,034 359,277 362,616 366,056 369,599 373,248 377,007 3,680,083 7,833,295
1,507,654 1,549,146 1,592,498 1,635,043 1,649,842 1,695,901 1,741,852 1,787,655 1,834,853 1,882,040 16,876,484 30,823,838114,040 117,178 120,457 123,675 124,795 128,279 131,754 135,219 138,789 142,358 1,276,544 2,331,528
0 0 0 0 0 0 0 0 0 0 0 0310,539 319,855 329,451 339,334 349,514 360,000 370,800 381,924 393,381 405,183 3,559,980 6,504,774
20,095 20,698 21,319 21,958 22,617 23,295 23,994 24,714 25,456 26,219 230,365 430,03718,404 18,956 19,525 20,111 20,714 21,335 21,975 22,635 23,314 24,013 210,982 393,430
144

FY 2016/2017TO
ACTUAL CURRENT BUDGET PLAN PLAN PLAN PLAN PLAN PLAN PLAN PLAN PLAN FY 2026/20272015/2016 2016/2017 2017/2018 2018/2019 2019/2020 2020/2021 2021/2022 2022/2023 2023/2024 2024/2025 2025/2026 2026/2027 TOTAL
------------------- ------------------- ------------------- ------------------- ------------------- ------------------- ------------------- ------------------- ------------------- ------------------- ------------------- ------------------- ---------------------
035. GENERAL FUNDREVENUES BY SOURCE
1371 Permit - Misc. Public Safety 34,557 35,394 36,103 36,825 37,562 38,313 39,079 39,861 40,658 41,471 42,300 43,569 431,1351372 Permit - Liquidambar Street 1,227 0 0 0 0 0 0 0 0 0 0 0 01373 Adult Entertainment Permits 22,935 14,175 14,601 14,893 15,191 15,495 15,805 16,121 16,443 16,772 17,107 17,621 174,2231374 OCM Special Event Permit Fee 4,093 4,774 4,869 4,966 5,066 5,167 5,270 5,376 5,483 5,593 5,705 5,876 58,145TOTAL PERMITS AND LICENSES 1,296,765 1,261,679 1,598,255 1,632,841 1,669,898 1,706,684 1,743,123 1,780,107 1,818,016 1,872,508 1,927,271 1,982,373 18,992,754
1502-01 Fines - Overdue Material - Circulation Desk 58,167 53,145 49,956 48,957 47,978 47,018 46,078 45,156 44,253 43,368 42,501 42,076 510,4861502-02 Fines - Overdue/Lost & Damaged-Internet 165,208 168,685 168,685 165,311 162,005 158,765 155,590 152,478 149,428 146,440 143,511 140,641 1,711,5391503-01 Fines - Parking 638,957 500,000 500,000 510,000 520,200 530,604 541,216 552,040 563,081 574,343 585,830 603,405 5,980,7191504 Fines - Traffic and Criminal 225,780 225,000 225,000 229,500 234,090 238,772 243,547 248,418 253,387 258,454 263,623 271,532 2,691,3231506 Juvenile Diversion 1,735 2,000 2,000 2,040 2,081 2,122 2,165 2,208 2,252 2,320 2,389 2,461 24,0391507 Late Payment Penalties 104,730 5,000 5,000 5,100 5,202 5,306 5,412 5,520 5,631 5,800 5,974 6,153 60,0981509 Returned Check Charge 5,535 6,113 6,235 6,360 6,487 6,617 6,749 6,884 7,022 7,232 7,449 7,673 74,8211516 Neighborhood Preservation Code Violations 57,817 40,000 40,000 40,800 41,616 42,448 43,297 44,163 45,046 46,398 47,790 49,224 480,783TOTAL FINES AND FORFEITURES 1,257,930 999,943 996,876 1,008,068 1,019,659 1,031,652 1,044,054 1,056,869 1,070,101 1,084,355 1,099,067 1,123,164 11,533,807
1667-1 General Plan Maintenance Fees 920,050 717,341 615,670 631,060 646,837 663,008 679,583 696,573 713,987 731,837 750,133 772,637 7,618,6641677 State Certified Access Specialist Fee 5,173 3,500 0 0 0 0 0 0 0 0 0 0 3,500TOTAL COMMUNITY DEVELOPMENT FEES 925,223 720,841 615,670 631,060 646,837 663,008 679,583 696,573 713,987 731,837 750,133 772,637 7,622,164
1801-1 Business License Processing-New Applications 7,279 16,236 16,561 16,892 17,230 17,575 17,926 18,285 18,650 19,210 19,786 20,380 198,7321801-2 Business License Processing - Renewals (102) 0 0 0 0 0 0 0 0 0 0 0 0TOTAL FINANCE FEES 7,177 16,236 16,561 16,892 17,230 17,575 17,926 18,285 18,650 19,210 19,786 20,380 198,732
2102 Library- Lost/Damaged Materials 6,083 6,541 6,149 6,026 5,905 5,787 5,672 5,558 5,447 5,338 5,231 5,127 62,7822105 Miscellaneous Library Charges 2,246 0 0 0 0 0 0 0 0 0 0 0 0TOTAL LIBRARY FEES 8,329 6,541 6,149 6,026 5,905 5,787 5,672 5,558 5,447 5,338 5,231 5,127 62,782
2310 Recreation Credit (Net) 356 0 0 0 0 0 0 0 0 0 0 0 02347 Senior Adult Services 343 0 0 0 0 0 0 0 0 0 0 0 02351 Vending 7,500 6,300 6,300 6,300 6,300 6,300 6,300 6,300 6,300 6,300 6,300 6,300 69,3002357 Youth Basketball League 138,200 140,112 142,914 145,772 148,688 151,661 154,695 157,789 160,944 164,163 167,447 172,470 1,706,6552359 Adult Basketball 57,570 51,510 52,540 53,591 54,663 55,756 56,871 58,008 59,169 60,352 61,559 63,406 627,4242360 Adult Volleyball 45,660 40,000 40,800 41,616 42,448 43,297 44,163 45,046 45,947 46,866 47,804 49,238 487,2272361 Adult Drop-In Sports 42,208 34,000 41,000 41,000 41,000 41,000 41,000 41,000 41,000 41,000 41,000 41,000 444,0002364 Youth Sports Classes 254,613 252,500 257,550 262,701 267,955 273,314 278,780 284,356 290,043 295,844 301,761 310,814 3,075,6182365 Adult Sports Activities 109,392 110,000 112,200 114,444 116,733 119,068 121,449 123,878 126,355 128,883 131,460 135,404 1,339,8732367 Youth Sports Camp 208,213 214,200 218,484 222,854 227,311 231,857 236,494 241,224 246,048 250,969 255,989 261,109 2,606,5392370 Special Events HOTS 8,010 10,200 10,400 10,608 10,820 11,037 11,257 11,482 11,712 11,946 12,185 12,185 123,8332375 Gymnastics - Youth 389,558 391,400 403,142 415,236 427,693 440,524 453,740 467,352 481,373 495,814 510,688 526,009 5,012,9712381 Swim Pool Rentals 48,411 43,197 43,647 43,647 43,647 43,647 45,829 45,829 45,829 45,829 45,829 48,121 495,0532383 Washington Pool Adult Swim Lessons 16,002 12,750 13,005 13,265 13,530 13,801 14,077 14,359 14,646 14,939 15,237 15,390 154,9992385 Special Interest - Youth 812 0 0 0 0 0 0 0 0 0 0 0 02388 Visual Arts - Youth 33,748 25,614 26,127 26,650 27,183 27,726 28,281 28,846 29,423 30,012 30,612 31,530 312,0032391 Visual Arts - Adult 10,982 10,000 10,200 10,404 10,612 10,824 11,041 11,262 11,487 11,717 11,951 12,309 121,8072392 Dance Classes - Child 74,601 80,945 82,564 84,215 85,900 87,618 89,370 91,157 92,980 94,840 96,737 99,639 985,9652393 Dance Classes - Adult 60,653 60,387 61,595 62,827 64,083 65,365 66,672 68,006 69,366 70,753 72,168 74,333 735,5572394 Drama - Youth 31,574 29,599 30,191 30,795 31,411 32,039 32,680 33,333 34,000 34,680 35,374 36,435 360,5362396 Cultural Arts Theater Tickets 25,076 25,000 28,700 29,274 29,859 30,457 31,066 31,687 32,321 32,967 33,627 33,627 338,5842397 Preschool Programs 276,584 265,927 268,586 271,272 273,985 276,724 279,492 282,287 285,109 287,961 290,840 299,565 3,081,7482401 Neighborhood Recreation 469,776 393,028 400,888 408,906 417,084 425,426 433,934 442,613 451,465 460,494 469,704 483,795 4,787,3372406 Senior Adults Dances 1,071 2,500 3,820 3,820 5,140 5,140 6,460 6,460 7,780 7,780 7,780 9,100 65,7802407 Senior Adult Programs 97,505 87,750 96,730 99,632 102,621 105,699 108,870 112,137 115,501 118,966 122,535 126,211 1,196,6512408 Senior Adult Trips 90,678 100,000 130,000 130,000 130,000 130,000 130,000 130,000 130,000 130,000 130,000 130,000 1,400,000
145

1371 Permit - Misc. Public Safety1372 Permit - Liquidambar Street1373 Adult Entertainment Permits1374 OCM Special Event Permit FeeTOTAL PERMITS AND LICENSES
1502-01 Fines - Overdue Material - Circulation Desk 1502-02 Fines - Overdue/Lost & Damaged-Internet 1503-01 Fines - Parking1504 Fines - Traffic and Criminal1506 Juvenile Diversion 1507 Late Payment Penalties1509 Returned Check Charge1516 Neighborhood Preservation Code ViolationsTOTAL FINES AND FORFEITURES
1667-1 General Plan Maintenance Fees1677 State Certified Access Specialist FeeTOTAL COMMUNITY DEVELOPMENT FEES
1801-1 Business License Processing-New Applications1801-2 Business License Processing - RenewalsTOTAL FINANCE FEES
2102 Library- Lost/Damaged Materials2105 Miscellaneous Library ChargesTOTAL LIBRARY FEES
2310 Recreation Credit (Net)2347 Senior Adult Services2351 Vending2357 Youth Basketball League2359 Adult Basketball2360 Adult Volleyball2361 Adult Drop-In Sports2364 Youth Sports Classes2365 Adult Sports Activities2367 Youth Sports Camp2370 Special Events HOTS2375 Gymnastics - Youth2381 Swim Pool Rentals2383 Washington Pool Adult Swim Lessons2385 Special Interest - Youth2388 Visual Arts - Youth2391 Visual Arts - Adult2392 Dance Classes - Child2393 Dance Classes - Adult2394 Drama - Youth2396 Cultural Arts Theater Tickets2397 Preschool Programs2401 Neighborhood Recreation2406 Senior Adults Dances2407 Senior Adult Programs2408 Senior Adult Trips
FY 2027/2028 FY 2016/2017TO TO
PLAN PLAN PLAN PLAN PLAN PLAN PLAN PLAN PLAN PLAN FY 2036/2037 FY 2036/20372027/2028 2028/2029 2029/2030 2030/2031 2031/2032 2032/2033 2033/2034 2034/2035 2035/2036 2036/2037 TOTAL TOTAL
------------------- ------------------- ------------------- ------------------- ------------------- ------------------- ------------------- ------------------- ------------------- ------------------- --------------------- ---------------------
035. GENERAL FUNDREVENUES BY SOURCE
44,877 46,223 47,609 49,038 50,509 52,024 53,585 55,192 56,848 58,554 514,459 945,5940 0 0 0 0 0 0 0 0 0 0 0
18,149 18,694 19,255 19,832 20,427 21,040 21,671 22,321 22,991 23,681 208,061 382,2846,052 6,234 6,421 6,613 6,812 7,016 7,227 7,443 7,667 7,897 69,382 127,527
2,039,809 2,096,984 2,156,534 2,215,605 2,245,230 2,308,891 2,372,859 2,437,104 2,503,298 2,569,944 22,946,257 41,939,011
41,655 41,238 40,826 40,418 40,014 39,613 39,217 38,825 38,437 38,053 398,296 908,782137,828 135,071 132,370 129,723 127,128 124,586 122,094 119,652 117,259 114,914 1,260,624 2,972,162621,507 640,152 659,356 679,137 699,511 720,497 742,112 764,375 787,306 810,925 7,124,878 13,105,597279,678 288,068 296,710 305,612 314,780 324,223 333,950 343,969 354,288 364,916 3,206,195 5,897,519
2,535 2,611 2,689 2,770 2,853 2,939 3,027 3,118 3,211 3,308 29,061 53,1006,338 6,528 6,723 6,925 7,133 7,347 7,567 7,794 8,028 8,269 72,653 132,7507,903 8,140 8,384 8,636 8,895 9,162 9,437 9,720 10,011 10,312 90,600 165,421
50,700 52,221 53,788 55,402 57,064 58,775 60,539 62,355 64,226 66,152 581,221 1,062,0041,148,143 1,174,030 1,200,848 1,228,622 1,257,378 1,287,142 1,317,942 1,349,807 1,382,766 1,416,849 12,763,528 24,297,335
795,816 819,690 844,281 869,609 895,697 922,568 950,245 978,753 1,008,115 1,038,359 9,123,134 16,741,7980 0 0 0 0 0 0 0 0 0 0 3,500
795,816 819,690 844,281 869,609 895,697 922,568 950,245 978,753 1,008,115 1,038,359 9,123,134 16,745,298
20,991 21,621 22,270 22,938 23,626 24,335 25,065 25,817 26,591 27,389 240,641 439,3740 0 0 0 0 0 0 0 0 0 0 0
20,991 21,621 22,270 22,938 23,626 24,335 25,065 25,817 26,591 27,389 240,641 439,374
5,024 4,924 4,825 4,729 4,634 4,541 4,451 4,362 4,274 4,189 45,953 108,7350 0 0 0 0 0 0 0 0 0 0 0
5,024 4,924 4,825 4,729 4,634 4,541 4,451 4,362 4,274 4,189 45,953 108,735
0 0 0 0 0 0 0 0 0 0 0 00 0 0 0 0 0 0 0 0 0 0 0
6,300 6,300 6,300 6,300 6,300 6,300 6,300 6,300 6,300 6,300 63,000 132,300177,644 182,973 188,463 194,116 199,940 205,938 212,116 218,480 225,034 231,785 2,036,490 3,743,145
65,308 67,267 69,285 71,364 73,505 75,710 77,981 80,321 82,730 85,212 748,682 1,376,10650,715 52,236 53,803 55,418 57,080 58,793 60,556 62,373 64,244 66,172 581,390 1,068,61741,000 41,000 41,000 50,400 50,400 50,400 50,400 50,400 50,400 50,400 475,800 919,800
320,138 329,742 339,635 349,824 360,318 371,128 382,262 393,729 405,541 417,708 3,670,025 6,745,643139,466 143,650 147,960 152,398 156,970 161,679 166,530 171,526 176,671 181,972 1,598,823 2,938,696261,109 266,331 266,331 271,657 271,657 277,091 277,091 282,632 291,111 299,845 2,764,854 5,371,393
12,795 12,795 12,795 12,795 13,434 13,434 13,434 13,434 14,106 14,811 133,832 257,666541,789 558,043 574,784 592,028 609,788 628,082 646,925 666,332 686,322 706,912 6,211,005 11,223,977
48,121 48,121 48,121 48,121 50,527 50,527 50,527 50,527 50,527 50,527 495,644 990,69715,544 15,699 15,856 16,015 16,175 16,337 16,500 16,665 16,832 17,000 162,622 317,620
0 0 0 0 0 0 0 0 0 0 0 032,476 33,450 34,454 35,488 36,552 37,649 38,778 39,942 41,140 42,374 372,303 684,30712,679 13,059 13,451 13,854 14,270 14,698 15,139 15,593 16,061 16,543 145,348 267,154
102,628 105,707 108,878 112,145 115,509 118,974 122,543 126,220 130,006 133,906 1,176,517 2,162,48276,563 78,860 81,226 83,663 86,173 88,758 91,421 94,163 96,988 99,898 877,714 1,613,27037,528 38,654 39,813 41,008 42,238 43,505 44,810 46,154 47,539 48,965 430,214 790,75033,627 35,644 35,644 35,644 35,644 37,783 37,783 37,783 37,783 37,783 365,118 703,702
308,552 317,809 327,343 337,163 347,278 357,697 368,428 379,480 390,865 402,591 3,537,207 6,618,954498,309 513,258 528,656 544,516 560,851 577,677 595,007 612,857 631,243 650,180 5,712,556 10,499,893
9,100 10,420 10,420 11,740 11,740 13,060 13,060 14,380 14,380 14,380 122,680 188,460129,997 133,897 137,914 142,051 146,313 150,702 155,223 159,880 164,676 169,617 1,490,270 2,686,921131,300 130,000 131,300 130,000 131,300 130,000 131,300 130,000 131,300 132,613 1,309,113 2,709,113
146
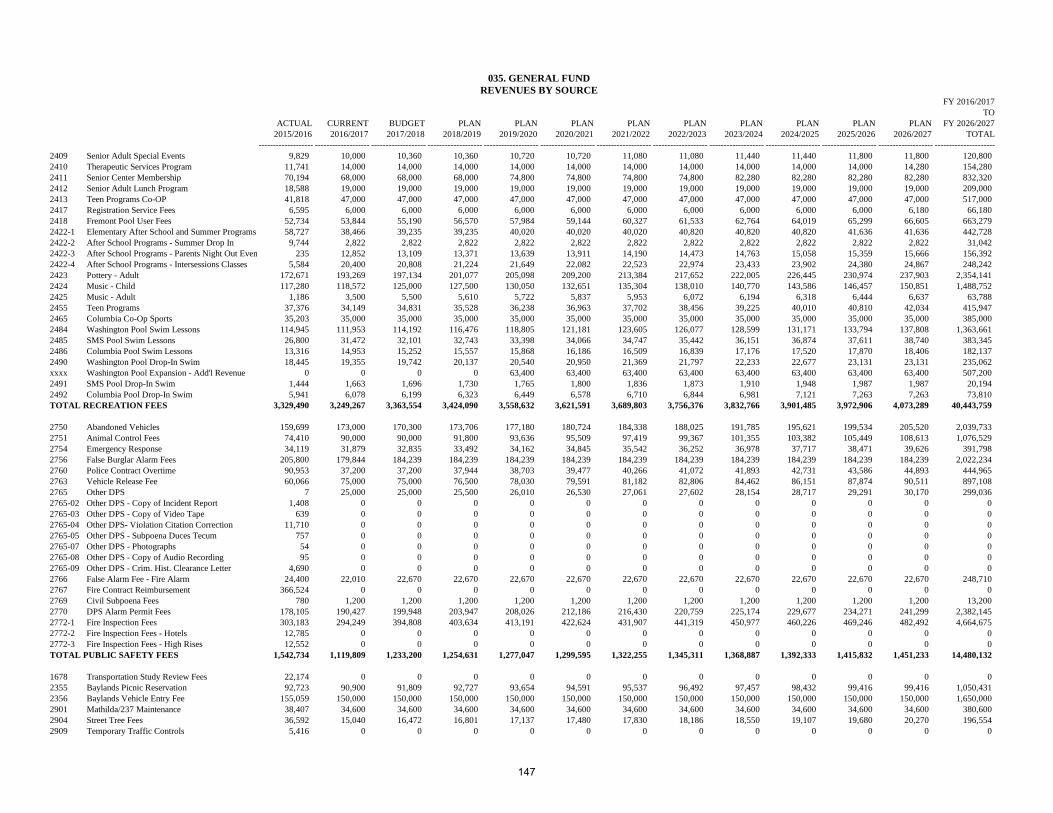
FY 2016/2017TO
ACTUAL CURRENT BUDGET PLAN PLAN PLAN PLAN PLAN PLAN PLAN PLAN PLAN FY 2026/20272015/2016 2016/2017 2017/2018 2018/2019 2019/2020 2020/2021 2021/2022 2022/2023 2023/2024 2024/2025 2025/2026 2026/2027 TOTAL
------------------- ------------------- ------------------- ------------------- ------------------- ------------------- ------------------- ------------------- ------------------- ------------------- ------------------- ------------------- ---------------------
035. GENERAL FUNDREVENUES BY SOURCE
2409 Senior Adult Special Events 9,829 10,000 10,360 10,360 10,720 10,720 11,080 11,080 11,440 11,440 11,800 11,800 120,8002410 Therapeutic Services Program 11,741 14,000 14,000 14,000 14,000 14,000 14,000 14,000 14,000 14,000 14,000 14,280 154,2802411 Senior Center Membership 70,194 68,000 68,000 68,000 74,800 74,800 74,800 74,800 82,280 82,280 82,280 82,280 832,3202412 Senior Adult Lunch Program 18,588 19,000 19,000 19,000 19,000 19,000 19,000 19,000 19,000 19,000 19,000 19,000 209,0002413 Teen Programs Co-OP 41,818 47,000 47,000 47,000 47,000 47,000 47,000 47,000 47,000 47,000 47,000 47,000 517,0002417 Registration Service Fees 6,595 6,000 6,000 6,000 6,000 6,000 6,000 6,000 6,000 6,000 6,000 6,180 66,1802418 Fremont Pool User Fees 52,734 53,844 55,190 56,570 57,984 59,144 60,327 61,533 62,764 64,019 65,299 66,605 663,2792422-1 Elementary After School and Summer Programs 58,727 38,466 39,235 39,235 40,020 40,020 40,020 40,820 40,820 40,820 41,636 41,636 442,7282422-2 After School Programs - Summer Drop In 9,744 2,822 2,822 2,822 2,822 2,822 2,822 2,822 2,822 2,822 2,822 2,822 31,0422422-3 After School Programs - Parents Night Out Even 235 12,852 13,109 13,371 13,639 13,911 14,190 14,473 14,763 15,058 15,359 15,666 156,3922422-4 After School Programs - Intersessions Classes 5,584 20,400 20,808 21,224 21,649 22,082 22,523 22,974 23,433 23,902 24,380 24,867 248,2422423 Pottery - Adult 172,671 193,269 197,134 201,077 205,098 209,200 213,384 217,652 222,005 226,445 230,974 237,903 2,354,1412424 Music - Child 117,280 118,572 125,000 127,500 130,050 132,651 135,304 138,010 140,770 143,586 146,457 150,851 1,488,7522425 Music - Adult 1,186 3,500 5,500 5,610 5,722 5,837 5,953 6,072 6,194 6,318 6,444 6,637 63,7882455 Teen Programs 37,376 34,149 34,831 35,528 36,238 36,963 37,702 38,456 39,225 40,010 40,810 42,034 415,9472465 Columbia Co-Op Sports 35,203 35,000 35,000 35,000 35,000 35,000 35,000 35,000 35,000 35,000 35,000 35,000 385,0002484 Washington Pool Swim Lessons 114,945 111,953 114,192 116,476 118,805 121,181 123,605 126,077 128,599 131,171 133,794 137,808 1,363,6612485 SMS Pool Swim Lessons 26,800 31,472 32,101 32,743 33,398 34,066 34,747 35,442 36,151 36,874 37,611 38,740 383,3452486 Columbia Pool Swim Lessons 13,316 14,953 15,252 15,557 15,868 16,186 16,509 16,839 17,176 17,520 17,870 18,406 182,1372490 Washington Pool Drop-In Swim 18,445 19,355 19,742 20,137 20,540 20,950 21,369 21,797 22,233 22,677 23,131 23,131 235,062xxxx Washington Pool Expansion - Add'l Revenue 0 0 0 0 63,400 63,400 63,400 63,400 63,400 63,400 63,400 63,400 507,2002491 SMS Pool Drop-In Swim 1,444 1,663 1,696 1,730 1,765 1,800 1,836 1,873 1,910 1,948 1,987 1,987 20,1942492 Columbia Pool Drop-In Swim 5,941 6,078 6,199 6,323 6,449 6,578 6,710 6,844 6,981 7,121 7,263 7,263 73,810TOTAL RECREATION FEES 3,329,490 3,249,267 3,363,554 3,424,090 3,558,632 3,621,591 3,689,803 3,756,376 3,832,766 3,901,485 3,972,906 4,073,289 40,443,759
2750 Abandoned Vehicles 159,699 173,000 170,300 173,706 177,180 180,724 184,338 188,025 191,785 195,621 199,534 205,520 2,039,7332751 Animal Control Fees 74,410 90,000 90,000 91,800 93,636 95,509 97,419 99,367 101,355 103,382 105,449 108,613 1,076,5292754 Emergency Response 34,119 31,879 32,835 33,492 34,162 34,845 35,542 36,252 36,978 37,717 38,471 39,626 391,7982756 False Burglar Alarm Fees 205,800 179,844 184,239 184,239 184,239 184,239 184,239 184,239 184,239 184,239 184,239 184,239 2,022,2342760 Police Contract Overtime 90,953 37,200 37,200 37,944 38,703 39,477 40,266 41,072 41,893 42,731 43,586 44,893 444,9652763 Vehicle Release Fee 60,066 75,000 75,000 76,500 78,030 79,591 81,182 82,806 84,462 86,151 87,874 90,511 897,1082765 Other DPS 7 25,000 25,000 25,500 26,010 26,530 27,061 27,602 28,154 28,717 29,291 30,170 299,0362765-02 Other DPS - Copy of Incident Report 1,408 0 0 0 0 0 0 0 0 0 0 0 02765-03 Other DPS - Copy of Video Tape 639 0 0 0 0 0 0 0 0 0 0 0 02765-04 Other DPS- Violation Citation Correction 11,710 0 0 0 0 0 0 0 0 0 0 0 02765-05 Other DPS - Subpoena Duces Tecum 757 0 0 0 0 0 0 0 0 0 0 0 02765-07 Other DPS - Photographs 54 0 0 0 0 0 0 0 0 0 0 0 02765-08 Other DPS - Copy of Audio Recording 95 0 0 0 0 0 0 0 0 0 0 0 02765-09 Other DPS - Crim. Hist. Clearance Letter 4,690 0 0 0 0 0 0 0 0 0 0 0 02766 False Alarm Fee - Fire Alarm 24,400 22,010 22,670 22,670 22,670 22,670 22,670 22,670 22,670 22,670 22,670 22,670 248,7102767 Fire Contract Reimbursement 366,524 0 0 0 0 0 0 0 0 0 0 0 02769 Civil Subpoena Fees 780 1,200 1,200 1,200 1,200 1,200 1,200 1,200 1,200 1,200 1,200 1,200 13,2002770 DPS Alarm Permit Fees 178,105 190,427 199,948 203,947 208,026 212,186 216,430 220,759 225,174 229,677 234,271 241,299 2,382,1452772-1 Fire Inspection Fees 303,183 294,249 394,808 403,634 413,191 422,624 431,907 441,319 450,977 460,226 469,246 482,492 4,664,6752772-2 Fire Inspection Fees - Hotels 12,785 0 0 0 0 0 0 0 0 0 0 0 02772-3 Fire Inspection Fees - High Rises 12,552 0 0 0 0 0 0 0 0 0 0 0 0TOTAL PUBLIC SAFETY FEES 1,542,734 1,119,809 1,233,200 1,254,631 1,277,047 1,299,595 1,322,255 1,345,311 1,368,887 1,392,333 1,415,832 1,451,233 14,480,132
1678 Transportation Study Review Fees 22,174 0 0 0 0 0 0 0 0 0 0 0 02355 Baylands Picnic Reservation 92,723 90,900 91,809 92,727 93,654 94,591 95,537 96,492 97,457 98,432 99,416 99,416 1,050,4312356 Baylands Vehicle Entry Fee 155,059 150,000 150,000 150,000 150,000 150,000 150,000 150,000 150,000 150,000 150,000 150,000 1,650,0002901 Mathilda/237 Maintenance 38,407 34,600 34,600 34,600 34,600 34,600 34,600 34,600 34,600 34,600 34,600 34,600 380,6002904 Street Tree Fees 36,592 15,040 16,472 16,801 17,137 17,480 17,830 18,186 18,550 19,107 19,680 20,270 196,5542909 Temporary Traffic Controls 5,416 0 0 0 0 0 0 0 0 0 0 0 0
147

2409 Senior Adult Special Events2410 Therapeutic Services Program2411 Senior Center Membership2412 Senior Adult Lunch Program2413 Teen Programs Co-OP2417 Registration Service Fees2418 Fremont Pool User Fees2422-1 Elementary After School and Summer Programs2422-2 After School Programs - Summer Drop In2422-3 After School Programs - Parents Night Out Even2422-4 After School Programs - Intersessions Classes2423 Pottery - Adult2424 Music - Child2425 Music - Adult2455 Teen Programs2465 Columbia Co-Op Sports2484 Washington Pool Swim Lessons2485 SMS Pool Swim Lessons2486 Columbia Pool Swim Lessons2490 Washington Pool Drop-In Swimxxxx Washington Pool Expansion - Add'l Revenue2491 SMS Pool Drop-In Swim2492 Columbia Pool Drop-In SwimTOTAL RECREATION FEES
2750 Abandoned Vehicles 2751 Animal Control Fees2754 Emergency Response 2756 False Burglar Alarm Fees2760 Police Contract Overtime2763 Vehicle Release Fee2765 Other DPS2765-02 Other DPS - Copy of Incident Report2765-03 Other DPS - Copy of Video Tape2765-04 Other DPS- Violation Citation Correction2765-05 Other DPS - Subpoena Duces Tecum2765-07 Other DPS - Photographs2765-08 Other DPS - Copy of Audio Recording2765-09 Other DPS - Crim. Hist. Clearance Letter2766 False Alarm Fee - Fire Alarm2767 Fire Contract Reimbursement 2769 Civil Subpoena Fees2770 DPS Alarm Permit Fees2772-1 Fire Inspection Fees2772-2 Fire Inspection Fees - Hotels2772-3 Fire Inspection Fees - High RisesTOTAL PUBLIC SAFETY FEES
1678 Transportation Study Review Fees2355 Baylands Picnic Reservation2356 Baylands Vehicle Entry Fee2901 Mathilda/237 Maintenance2904 Street Tree Fees2909 Temporary Traffic Controls
FY 2027/2028 FY 2016/2017TO TO
PLAN PLAN PLAN PLAN PLAN PLAN PLAN PLAN PLAN PLAN FY 2036/2037 FY 2036/20372027/2028 2028/2029 2029/2030 2030/2031 2031/2032 2032/2033 2033/2034 2034/2035 2035/2036 2036/2037 TOTAL TOTAL
------------------- ------------------- ------------------- ------------------- ------------------- ------------------- ------------------- ------------------- ------------------- ------------------- --------------------- ---------------------
035. GENERAL FUNDREVENUES BY SOURCE
12,160 12,160 12,520 12,520 12,880 12,880 13,240 13,240 13,600 13,970 129,170 249,97014,566 14,857 15,154 15,457 15,766 16,082 16,403 16,731 17,066 17,407 159,489 313,76990,508 90,508 90,508 90,508 99,559 99,559 99,559 99,559 99,559 99,559 959,385 1,791,70519,000 19,000 19,000 19,000 19,000 19,000 19,000 19,000 19,000 19,000 190,000 399,00047,000 47,000 47,000 47,000 47,000 47,000 47,000 47,000 47,000 47,000 470,000 987,000
6,365 6,556 6,753 6,956 7,164 7,379 7,601 7,829 8,063 8,305 72,972 139,15267,937 69,296 70,682 72,096 73,538 75,008 76,509 78,039 79,600 81,192 743,897 1,407,17541,636 42,469 42,469 42,469 43,319 43,319 43,319 44,618 44,618 44,618 432,855 875,583
2,822 2,822 2,822 2,822 2,822 2,822 2,822 2,822 2,822 2,822 28,220 59,26215,980 16,299 16,625 16,958 17,297 17,643 17,996 18,356 18,723 19,097 174,974 331,36625,365 25,872 26,390 26,917 27,456 28,005 28,565 29,136 29,719 30,313 277,738 525,980
245,040 252,391 259,963 267,762 275,795 284,069 292,591 301,369 310,410 319,722 2,809,111 5,163,252155,377 160,038 164,839 169,784 174,878 180,124 185,528 191,094 196,827 202,731 1,781,220 3,269,971
6,837 7,042 7,253 7,471 7,695 7,925 8,163 8,408 8,660 8,920 78,374 142,16243,295 44,594 45,932 47,310 48,729 50,191 51,697 53,248 54,845 56,491 496,333 912,28035,000 35,000 35,000 35,000 35,000 35,000 35,000 35,000 35,000 35,000 350,000 735,000
141,942 146,200 150,586 155,104 159,757 164,550 169,486 174,571 179,808 185,202 1,627,208 2,990,87039,902 41,099 42,332 43,602 44,910 46,257 47,645 49,074 50,547 52,063 457,431 840,77718,958 19,527 20,113 20,716 21,338 21,978 22,637 23,316 24,016 24,736 217,337 399,47423,131 23,131 28,914 28,914 28,914 28,914 28,914 36,142 36,142 36,142 299,256 534,31863,400 63,400 63,400 63,400 63,400 63,400 63,400 63,400 63,400 63,400 634,000 1,141,200
1,987 1,987 2,484 2,484 2,484 2,484 2,484 3,105 3,105 3,105 25,709 45,9037,263 7,263 9,079 9,079 9,079 9,079 9,079 11,349 11,349 11,349 93,967 167,777
4,178,160 4,283,430 4,393,250 4,511,036 4,631,742 4,748,589 4,862,751 4,995,578 5,125,679 5,259,638 46,989,852 87,433,611
211,685 218,036 224,577 231,314 238,254 245,401 252,763 260,346 268,156 276,201 2,426,733 4,466,466111,871 115,227 118,684 122,245 125,912 129,689 133,580 137,587 141,715 145,967 1,282,478 2,359,007
40,814 42,039 43,300 44,599 45,937 47,315 48,734 50,196 51,702 53,253 467,891 859,689184,239 184,239 184,239 184,239 184,239 184,239 184,239 184,239 184,239 184,239 1,842,390 3,864,624
46,240 47,627 49,056 50,528 52,044 53,605 55,213 56,869 58,576 60,333 530,091 975,05693,226 96,023 98,903 101,871 104,927 108,074 111,317 114,656 118,096 121,639 1,068,732 1,965,84031,075 32,008 32,968 33,957 34,976 36,025 37,106 38,219 39,365 40,546 356,244 655,280
0 0 0 0 0 0 0 0 0 0 0 00 0 0 0 0 0 0 0 0 0 0 00 0 0 0 0 0 0 0 0 0 0 00 0 0 0 0 0 0 0 0 0 0 00 0 0 0 0 0 0 0 0 0 0 00 0 0 0 0 0 0 0 0 0 0 00 0 0 0 0 0 0 0 0 0 0 0
22,670 22,670 22,670 22,670 22,670 22,670 22,670 22,670 22,670 22,670 226,700 475,4100 0 0 0 0 0 0 0 0 0 0 0
1,200 1,200 1,200 1,200 1,200 1,200 1,200 1,200 1,200 1,200 12,000 25,200248,538 255,994 263,674 271,584 279,732 288,124 296,767 305,670 314,841 324,286 2,849,210 5,231,355496,344 510,004 524,276 538,283 543,155 558,318 573,446 588,525 604,063 619,598 5,556,012 10,220,687
0 0 0 0 0 0 0 0 0 0 0 00 0 0 0 0 0 0 0 0 0 0 0
1,487,903 1,525,067 1,563,548 1,602,489 1,633,044 1,674,661 1,717,036 1,760,179 1,804,624 1,849,932 16,618,481 31,098,614
0 0 0 0 0 0 0 0 0 0 0 099,416 104,387 104,387 104,387 109,606 109,606 109,606 115,086 115,086 115,086 1,086,654 2,137,085
150,000 157,500 157,500 157,500 165,375 165,375 165,375 173,644 173,644 173,644 1,639,556 3,289,55634,600 34,600 34,600 34,600 34,600 34,600 34,600 34,600 34,600 34,600 346,000 726,60020,878 21,505 22,150 22,814 23,499 24,204 24,930 25,678 26,448 27,242 239,347 435,901
0 0 0 0 0 0 0 0 0 0 0 0
148

FY 2016/2017TO
ACTUAL CURRENT BUDGET PLAN PLAN PLAN PLAN PLAN PLAN PLAN PLAN PLAN FY 2026/20272015/2016 2016/2017 2017/2018 2018/2019 2019/2020 2020/2021 2021/2022 2022/2023 2023/2024 2024/2025 2025/2026 2026/2027 TOTAL
------------------- ------------------- ------------------- ------------------- ------------------- ------------------- ------------------- ------------------- ------------------- ------------------- ------------------- ------------------- ---------------------
035. GENERAL FUNDREVENUES BY SOURCE
2912 Parking Meter Fees 0 99,960 101,959 103,998 106,078 108,200 110,364 112,571 114,823 117,119 117,119 120,633 1,212,824TOTAL PUBLIC WORKS FEES 350,370 390,500 394,840 398,127 401,470 404,871 408,331 411,850 415,430 419,257 420,815 424,919 4,490,409
TOTAL SERVICE FEES 6,163,323 5,503,194 5,629,974 5,730,827 5,907,121 6,012,426 6,123,570 6,233,953 6,355,167 6,469,460 6,584,703 6,747,583 67,297,979
3355 Interest 765,901 718,238 1,307,906 1,927,957 2,673,261 2,775,519 2,904,777 3,031,730 3,173,133 3,093,655 2,916,053 3,425,751 27,947,977xxxx Interest - Sale of Property 0 112,794 259,749 368,194 428,157 627,862 646,698 666,099 686,082 706,664 727,864 749,700 5,979,863TOTAL INTEREST INCOME 765,901 831,032 1,567,655 2,296,151 3,101,418 3,403,381 3,551,475 3,697,829 3,859,215 3,800,319 3,643,917 4,175,451 33,927,840
Refuse Loan (42)3601-42 Refuse Loan Principal Repayment 2,229,8873602-43 Refuse Loan Interest 1,869,669 4,099,556 3,470,202 3,470,202 3,470,202 3,470,202 3,470,202 3,470,202 3,048,003 0 0 0 27,968,771Sewer Loan (43) 03601-43 Sewer Loan Repayment 520,926 1,264,380 1,316,438 1,316,438 1,316,438 949,615 949,615 949,615 949,615 949,615 949,615 949,615 11,860,9993602-43 Sewer Loan- Interest 743,454 03605 Power Generation Facility 908,080 926,243 944,767 963,663 982,936 1,002,595 1,022,647 1,043,100 1,063,961 1,095,880 1,128,757 1,162,619 11,337,167TOTAL INTERFUND REVENUES 6,272,016 6,290,179 5,731,407 5,750,303 5,769,576 5,422,412 5,442,464 5,462,916 5,061,579 2,045,495 2,078,372 2,112,234 51,166,937
1207-2 Donations to Recreation - Arts 13,530 0 0 0 0 0 0 0 0 0 0 0 01214 Contributions 94,536 440,000 440,000 440,000 0 0 0 0 0 0 0 0 1,320,0001216 Miscellaneous Grants - Other 12,957 0 0 0 0 0 0 0 0 0 0 0 03801-1 Personal Property Sale 2,952 9,634 9,827 10,023 10,224 10,428 10,637 10,849 10,849 11,175 11,510 11,855 117,0112764 Unclaimed Property 10,447 0 0 0 0 0 0 0 0 0 0 0 02774 DPS Property Revenue 17,858 5,000 5,000 0 0 0 0 0 0 0 0 0 10,0002775 Arson Response Fee 1,608 0 0 0 0 0 0 0 0 0 0 0 04100 Miscellaneous Revenues 5,772 5,520 5,631 5,743 5,858 5,975 6,095 6,217 6,341 6,531 6,727 6,929 67,5674102 Damage to City Property 189,608 110,408 112,616 114,868 117,166 119,509 121,899 124,337 126,824 130,629 134,548 138,584 1,351,3874104 Jury Duty Reimbursement 160 0 0 0 0 0 0 0 0 0 0 0 04114 Cash Overage & Shortage 73 0 0 0 0 0 0 0 0 0 0 0 04116 Photocopies 288 3,000 3,000 3,000 3,000 3,000 3,000 3,000 3,000 3,000 3,000 3,000 33,0004117 Sale of Printed Material 2,641 7,010 7,151 7,294 7,440 7,588 7,740 7,895 8,053 8,294 8,543 8,800 85,8084120 Litigation Settlement Proceeds 1,040,000 0 0 0 0 0 0 0 0 0 0 0 04121 Miscellaneous Reimbursement 11,277 0 0 0 0 0 0 0 0 0 0 0 04123-03 Bankruptcy Recovery - Other 205 0 0 0 0 0 0 0 0 0 0 0 04460-02 Repayments - Conway Property Owners 6,422 15,490 15,490 8,674 8,674 8,674 8,674 8,674 8,674 8,674 8,674 8,674 109,046TOTAL MISCELLANEOUS 1,410,332 596,062 598,714 589,602 152,361 155,175 158,045 160,972 163,741 168,303 173,002 177,842 3,093,819
3800 Real Property Sale 13,925,365 37,600,000 0 0 0 0 0 0 0 0 0 0 37,600,000TOTAL SALE OF PROPERTY 13,925,365 37,600,000 0 0 0 0 0 0 0 0 0 0 37,600,000
4400 Transfers In 10,649,902 11,351,844 11,566,680 11,692,995 12,200,904 12,460,287 12,505,969 12,674,871 12,927,562 13,185,312 13,447,729 13,715,395 137,729,549TOTAL TRANSFERS IN 10,649,902 11,351,844 11,566,680 11,692,995 12,200,904 12,460,287 12,505,969 12,674,871 12,927,562 13,185,312 13,447,729 13,715,395 137,729,549
------------------- ------------------- ------------------- ------------------- ------------------- ------------------- ------------------- ------------------- ------------------- ------------------- ------------------- ------------------- ---------------------
FUND TOTAL 178,413,759 205,248,727 167,805,600 173,298,565 180,750,734 186,390,602 192,342,763 198,194,652 203,851,292 206,944,081 213,117,267 220,239,088 2,148,183,370
149

2912 Parking Meter FeesTOTAL PUBLIC WORKS FEES
TOTAL SERVICE FEES
3355 Interestxxxx Interest - Sale of PropertyTOTAL INTEREST INCOME
Refuse Loan (42)3601-42 Refuse Loan Principal Repayment3602-43 Refuse Loan InterestSewer Loan (43)3601-43 Sewer Loan Repayment 3602-43 Sewer Loan- Interest3605 Power Generation FacilityTOTAL INTERFUND REVENUES
1207-2 Donations to Recreation - Arts1214 Contributions1216 Miscellaneous Grants - Other3801-1 Personal Property Sale 2764 Unclaimed Property2774 DPS Property Revenue2775 Arson Response Fee4100 Miscellaneous Revenues4102 Damage to City Property 4104 Jury Duty Reimbursement4114 Cash Overage & Shortage4116 Photocopies4117 Sale of Printed Material4120 Litigation Settlement Proceeds4121 Miscellaneous Reimbursement4123-03 Bankruptcy Recovery - Other4460-02 Repayments - Conway Property OwnersTOTAL MISCELLANEOUS
3800 Real Property SaleTOTAL SALE OF PROPERTY
4400 Transfers InTOTAL TRANSFERS IN
FUND TOTAL
FY 2027/2028 FY 2016/2017TO TO
PLAN PLAN PLAN PLAN PLAN PLAN PLAN PLAN PLAN PLAN FY 2036/2037 FY 2036/20372027/2028 2028/2029 2029/2030 2030/2031 2031/2032 2032/2033 2033/2034 2034/2035 2035/2036 2036/2037 TOTAL TOTAL
------------------- ------------------- ------------------- ------------------- ------------------- ------------------- ------------------- ------------------- ------------------- ------------------- --------------------- ---------------------
035. GENERAL FUNDREVENUES BY SOURCE
124,252 127,979 131,819 135,773 139,846 144,042 148,363 152,814 157,398 162,120 1,424,406 2,637,230429,146 445,970 450,456 455,074 472,926 477,827 482,874 501,822 507,176 512,691 4,735,963 9,226,372
6,917,040 7,100,702 7,278,629 7,465,874 7,661,670 7,852,521 8,042,421 8,266,510 8,476,460 8,692,198 77,754,024 145,052,004
3,208,597 3,001,972 2,770,001 2,496,314 2,259,136 2,115,254 2,066,292 2,146,868 2,321,019 2,367,439 24,752,892 52,700,8691,029,588 1,070,772 1,113,603 1,158,147 1,204,473 1,252,652 1,302,758 1,354,868 1,409,063 1,465,425 12,361,347 18,341,2114,238,185 4,072,743 3,883,604 3,654,461 3,463,609 3,367,906 3,369,049 3,501,736 3,730,082 3,832,865 37,114,240 71,042,080
0 0 0 0 0 0 0 0 0 0 0 27,968,7710 0
949,615 552,537 0 0 0 0 0 0 0 0 1,502,152 13,363,1510 0
1,197,498 1,233,423 1,270,426 1,308,538 1,347,795 1,388,228 1,429,875 1,472,772 1,516,955 1,562,463 13,727,973 25,065,1402,147,113 1,785,960 1,270,426 1,308,538 1,347,795 1,388,228 1,429,875 1,472,772 1,516,955 1,562,463 15,230,125 66,397,062
0 0 0 0 0 0 0 0 0 0 0 00 0 0 0 0 0 0 0 0 0 0 1,320,0000 0 0 0 0 0 0 0 0 0 0 0
12,211 12,577 12,955 13,343 13,744 14,156 14,581 15,018 15,469 15,933 139,986 256,9960 0 0 0 0 0 0 0 0 0 0 00 0 0 0 0 0 0 0 0 0 0 10,0000 0 0 0 0 0 0 0 0 0 0 0
7,137 7,351 7,572 7,799 8,033 8,274 8,522 8,777 9,041 9,312 81,816 149,384142,741 147,024 151,434 155,977 160,657 165,476 170,441 175,554 180,821 186,245 1,636,371 2,987,758
0 0 0 0 0 0 0 0 0 0 0 00 0 0 0 0 0 0 0 0 0 0 0
3,000 3,000 3,000 3,000 3,000 3,000 3,000 3,000 3,000 3,000 30,000 63,0009,064 9,335 9,615 9,904 10,201 10,507 10,822 11,147 11,481 11,826 103,903 189,711
0 0 0 0 0 0 0 0 0 0 0 00 0 0 0 0 0 0 0 0 0 0 00 0 0 0 0 0 0 0 0 0 0 0
8,674 1,313 1,313 1,313 1,313 1,313 1,313 1,313 1,313 1,313 20,491 129,537182,827 180,600 185,889 191,336 196,947 202,726 208,678 214,809 221,124 227,629 2,012,567 5,106,386
0 0 0 0 0 0 0 0 0 0 0 37,600,0000 0 0 0 0 0 0 0 0 0 0 37,600,000
14,141,421 14,563,742 14,998,735 15,446,775 16,351,598 17,690,336 17,823,173 18,327,447 18,846,850 19,381,836 167,571,914 305,301,46314,141,421 14,563,742 14,998,735 15,446,775 16,351,598 17,690,336 17,823,173 18,327,447 18,846,850 19,381,836 167,571,914 305,301,463
------------------- ------------------- ------------------- ------------------- ------------------- ------------------------------------------------------------------------------------------------- --------------------- ---------------------
227,272,523 233,925,523 240,620,005 246,219,028 254,411,096 262,572,026 270,670,013 278,242,417 287,427,352 296,796,619 2,598,156,601 4,746,339,971
150

Financial Plans – Special Revenue Funds

Special Revenue FundsSpecial Revenue Funds are used to account for the proceeds of specific
revenue sources that are legally restricted or earmarked for particular functions or activities of government. In many cases, a Special Revenue Fund has been set up in response to legal requirements established by a granting agency or another level of government.
Housing FundThe Housing Fund is comprised primarily of Housing Mitigation Fees and
Below-Market-Rate Housing (“BMR”) fees. Expenditures are for operations related to developing affordable housing, managing the City’s below-market- rate housing program, and for capital and special projects that produce new affordable housing.
Housing Mitigation
Housing Mitigation Fees are development impact fees paid by developers of large new employment-generating developments, pursuant to S.M.C. 19.22.035, in order to maintain or improve the City’s jobs/housing balance. These fees are used to provide additional affordable housing in the City. Housing Mitigation Fees and accrued interest are maintained in this sub-fund of the Housing Fund.
Revenue projections are based on a number of factors, including: projects currently underway or in the development process, historical collections, total development square footage eligible to pay this fee, and the current and projected per square foot Housing Mitigation Fee. Due to the recent surge of development activity in the City, revenue of $21.5 million in FY 2017/18, $18.3 million in FY 2018/19, and $4.9 million in FY 2019/20 is projected based on twenty large, commercial development projects and one mixed-use project. Beginning in FY 2020/21 the revenue projection uses an inflation rate with the baseline year of FY 2019/20. The baseline used is lower than the historical average, to reflect expected slowdown in property development, which will be reviewed and adjusted each year. Over the twenty-year plan, total revenue from Housing Mitigation Fees is estimated to be up by $16.6 million over the prior year’s plan.
Assistance to affordable housing developments is provided in the form of a loan, with payments amortized, deferred, or based on residual receipts of the project’s anticipated operating cash flow. Interest rates vary and are set forth in each loan agreement. Payments received on these loans are consistent with City policy for the use of Housing Mitigation funds, and are deposited into this fund and re-used for additional housing activities.
The Housing Mitigation Program loan repayment revenue projection for FY 2017/18 is based on staff’s assessment of outstanding loans, while future year projections are based on the historical average, which is reviewed and adjusted each year. During the first ten years of the planning period, staff projects the program will receive $4.6 million in loan repayments.
Interest income on the reserve balances in this sub-fund continues to accrue and is available for future housing projects.
Project expenditures for FY 2016/17 consist primarily of the Persian Drive Affordable Apartments project, the Morse Court Rental Rehabilitation project, and the Orchard Gardens Apartments Redevelopment project. In FY 2017/18, there is $10 million budgeted for the Block 15 Affordable Housing Site project that will consist of approximately 75-100 new affordable rental units for lower-income households in Downtown Sunnyvale.
By the end of FY 2017/18 the Housing Mitigation Reserve is expected to have balance of approximately $27.3 million. These funds are available for future affordable housing projects in the City when they are identified. A placeholder entitled Future Housing Projects is included in the long-term financial plan for such projects.
Below Market Rate (BMR) Housing
The BMR Program, as set forth in SMC Chapter 19.67, is primarily intended to generate affordable housing directly, through mandatory development requirements applied to most new housing developments. This is a land use/zoning tool used nationally to guarantee a minimum level of affordable housing even in higher cost areas, known as “inclusionary zoning.”
City of Sunnyvale FY 2017/18 Special Revenue Funds
151

The Municipal Code requires that developers sell 12.5% of all new homes in subdivision and condominium developments to lower and moderate income households at affordable prices established by the BMR program guidelines and SMC Chapter 19.67. The BMR Program has specific eligibility requirements and income limits for prospective buyers of BMR homes.
Revenues in the BMR Program include BMR In-Lieu fees, BMR application fees, revenues from BMR compliance and enforcement actions, payments on home buyer loans funded from the BMR program, and interest earnings. Expenditures include operating costs for administering and monitoring the BMR program, and a special project for BMR compliance enforcement.
The BMR Housing Program has a BMR Reserve for the deposit of BMR In-Lieu Fees which are paid by developers in accordance with project-specific developer agreements, in lieu of providing actual BMR homes for sale, and/or to fulfill fractional BMR unit requirements. The fee revenues are intended to be used by the City to provide a comparable or greater number of affordable housing units elsewhere in the City. The Municipal Code was amended in 2012 to allow greater application of the in-lieu fee option, and FY 2013/14 was the first year in which the City began collecting substantial revenue from developers for fractional in-lieu fees for BMR obligations.
Once a substantial amount of funds have accumulated in the BMR reserve, staff will issue an RFP to solicit affordable housing proposals to utilize these funds for developing additional affordable units, based on the priorities established by the City in the Housing Element, Consolidated Plan, and/or various adopted land use plans such as station area plans and/or specific plans.
HOME Grant FundHOME Investment Partnership Program grants from the federal
government may be used to provide affordable housing to lower-income households. Eligible uses of HOME grant funds include acquisition, new construction, rehabilitation, tenant-based rental assistance, and down payment assistance. The activities must benefit low-income households with incomes at or below 80% of area median income. According to federal statutes, HOME grants must be committed to a specific project within two years and fully expended within five years of the grant award.
The long-term financial plan for the HOME Grant Fund includes an estimated grant allocation for FY 2017/18 of $300,000, and shows ongoing estimated HOME grant revenues of the same amount as a placeholder for future allocations. This is relatively flat from the FY 2016/17 allocation.
The City also receives loan repayments on loans that had been made with HOME grant funds for affordable housing. Approximately $6.3 million in loan payments are expected throughout the twenty-year plan. These repayments will be utilized for future HOME projects, to be identified and approved by Council.
The Benner Plaza project for new affordable apartments began construction in May 2017, with completion expected in 2019. No new projects are committed for FY 2017/18. Also included in the long-term financial plan is a line item for Future HOME/ Housing Projects beginning in FY 2018/19. As specific projects are identified, they will be brought to Council for approval.
Redevelopment Housing FundThe Redevelopment Housing Fund is a new fund started in FY 2016/17,
established to account for funds received from the former Redevelopment Agency / Housing Successor Agencies which are based on a percentage of the property tax increment from the former redevelopment project area. These funds can be used on Low-Moderate Income Housing programs. Future year revenue forecasts are sporadic due to the varied timing of the enforceable obligation payments, however, staff expects to collect $14 million in the first ten years.
A limited percentage of these funds can be applied to operating activities, including the work hours required to administer the revenue source. This fund also has one special project for Homeless Prevention and Rapid Re-Housing in FY 2017/18 and throughout the twenty-year plan. The Future Projects line sets funding aside for low-moderate income housing projects in future years as the fund accumulates sufficient reserves to fund a capital project.
City of Sunnyvale FY 2017/18 Special Revenue Funds
152

Community Development Block Grant (CDBG) Fund
The Community Development Block Grant (CDBG) program is a federal program that allocates annual grants to larger cities and urban counties for community development and housing programs that primarily benefit lower-income households. The City receives an annual CDBG grant from the U.S. Department of Housing and Urban Development (HUD) based on a formula using factors such as population, poverty rate, and certain economic indicators. Major CDBG expenditure categories include housing rehabilitation, accessibility improvements and retrofits, workforce development programs, human services, public infrastructure improvements in lower-income neighborhoods, and program administration.
Revenues for the Community Development Block Grant Fund include the annual grants from HUD and CDBG program income from prior loans made with CDBG funds for various capital projects. The CDBG Fund (110) includes two sub-funds: sub-fund 100, the CDBG entitlement grant fund, holds the direct CDBG grant proceeds, while sub-fund 200 is the Revolving Loan Fund, described below.
Community Development Block Grant (CDBG)
For FY 2017/18, the City will receive a CDBG entitlement grant of $1,004,607 and a HOME grant of $289,702. The CDBG and HOME grants must be spent in accordance with a five-year “Consolidated Plan,” a strategic plan and budget for use of these grants, submitted to HUD for approval every five years. HUD requires the City to submit annual updates, called Action Plans, in May of each year. Projects funded with CDBG must implement the goals of the 2015-2020 Consolidated Plan. The City submits a performance report (the “CAPER”) to HUD annually to report on its uses of the CDBG and HOME funds, and how these activities contribute toward achieving the goals of the Consolidated Plan.
HUD regulations limit the amount of CDBG funds that can be spent on public (human) services to no more than 15% of the annual CDBG grant plus prior year program income. The FY 2017/18 Adopted Budget includes an estimated $175,500 in CDBG funds for human services grants (Outside Group Funding – CDBG), contingent on the final CDBG grant amount. The
City awards these grants to human services providers every other year on a competitive basis for a two-year grant term. FY 2017/18 is the first year of the current funding cycle.
CDBG funds may also be used for projects that benefit groups with special needs, such as senior or handicapped citizens, or for targeted geographical areas that meet certain income requirements. Projects budgeted for the FY 2017/18 CDBG grant include $40,000 for the Home Improvement Program (HIP), which provides small grants for accessibility improvements, exterior paint, and other minor home improvements, $404,000 for the Sunnyvale Workforce Development Program, $448,500 for the Persian Drive Sidewalk Extension and $175,500 for human services grants. The project budgets are contingent on the City’s FY 2017 CDBG grant amount and available CDBG program income. If insufficient funds are received, some projects may be delayed or canceled, consistent with the contingency provisions in the FY 2017 Action Plan.
CDBG Revolving Loan Fund (RLF)
The RLF, sub-fund 200 of the CDBG Fund, is the repository for CDBG program income, which is payments received on prior housing loans made with CDBG funds. Once funds have been deposited into the RLF, they can only be reused for other housing rehabilitation loans and rehabilitation program operations, pursuant to City policy and HUD regulations. Staff projects $200 ,000 in CDBG loan repayment revenue for FY 2017/18. Expenditures for FY 2017/18 include one project in the amount of $230,000 to fund the Housing Rehabilitation loan program. These loans may be made for rehabilitation of housing owned and/or occupied by lower-income households, which may include owner-occupied single-family homes, or small affordable rental housing projects, such as group homes or other small non-profit rental properties.
City of Sunnyvale FY 2017/18 Special Revenue Funds
153

Park Dedication FundState law allows local communities to require developers of housing units
to offset the impact of the demand from those units on the City’s open space by providing additional open space or paying a comparable fee. The Park Dedication Fund was established to meet statutory requirements regarding the accounting for Park Dedication Fees paid by developers. In general, the City collects park in-lieu fees for housing projects that do not dedicate land for use as parks or open space. This fee is calculated on an average fair market value per square foot as determined by the Community Development Department annually. In April 2011, Council raised the standard to 5.0 acres per 1,000 population, to be phased in over three years. In FY 2015/16, after completion of a land valuation study, the land value used in the fee calculation was set to $129 per square foot, effective August 30, 2016. For the FY 2017/18 Adopted Budget, the Park Dedication Fee is held flat with land value at the rate of $129 per square foot.
Park Dedication Fee revenues are accounted for in the Park Dedication Fund as legally required, and then available resources are appropriated directly to projects in the fund or transferred to the Capital Projects Fund or the Infrastructure Fund for park-related projects.
Authorizing language in the State Quimby Act, which governs park dedication fees, requires that fees be used to pay for “developing new or rehabilitating existing neighborhood or community park or recreational facilities.” Certain legal cases have clarified that park in-lieu fees may be used for parks or recreational facilities that are adjacent to the subdivision or multi-family development from which they are collected but may also be used for larger community parks and regional facilities that are reasonably available for use by the residents of the subdivision or development. Park Dedication Fees may not be used for operating or routine maintenance. For the last several years, Park Dedication Fees were also used to pay for golf course rehabilitation projects. In April 2011, Council acted to cease that practice for projects that were not already programmed, determining instead that golf course revenues associated with the Golf and Tennis Enterprise Fund would pay for these improvements.
Park in-lieu fees must be committed within a five-year period. This revenue source is subject to the Fee Mitigation Act, which requires specific review and findings every five years. The City conforms to both of these requirements.
It is estimated that $18.3 million in Park Dedication Fees will be received during FY 2016/17. Based on current development projects in process, revenues for FY 2017/18 and FY 2018/19 are expected to be $16.5 million and $11.3 million respectively. For FY 2019/20 through the end of the first ten years of the plan, fee revenue is escalated by 2% per year, reflecting estimated growth. These projections yield approximately $117 million in revenue over the first ten years, and $97 million during the second ten years of the long-term plan. Revenues are held flat in the second ten years at $9.7 million. This is based on the historical average of 200 fee eligible dwelling units per year at the current fee of $105 per square foot.
The Park Dedication Fund provides funding for capital and infrastructure projects at community parks and recreational facilities. A total of $207 million in transfers to the Capital and Infrastructure Funds are programmed throughout the long-term financial plan to ensure that park and recreational facilities are in good working condition and able to meet the demands of increased public use. During the last projects budget cycle costs for all projects, and especially park renovation projects, were updated to reflect the latest cost estimates for construction and materials.
In FY 2017/18, $21.7 million is programmed for transfers to projects. The largest of funded projects include$5.8 million for the Washington Community Swim Center, $1.5 million for general park building rehabilitation, and $12.3 million for the Lakewood Park renovation. Other notable projects in the near term of the plan include an additional $6.2 million to complete the Fair Oaks Park Renovation, $1.6 million over the next two years for golf irrigation replacement, and $3 million to start the Lakewood Branch Library.
The Capital Projects Reserve includes funds that have not yet been appropriated to projects. Significantly more Park Dedication Fee revenue is projected in this financial plan as compared to last year. In addition to the Capital Projects Reserve, the twenty-year plan includes a second reserve fund that is specifically designated for Land Acquisition funds. This reserve
City of Sunnyvale FY 2017/18 Special Revenue Funds
154

collects twenty percent of the annual revenue from Park Dedication Fees and allocates the funds to acquire and develop new land for the purpose of parks, open space, trails and other recreational facilities.
Asset Forfeiture FundThe Asset Forfeiture Fund was established to account for monies received
through drug and other law enforcement activities as allowed under Federal and State asset forfeiture guidelines. For the FY 2017/18 Budget, current projected revenues have been adjusted to assume no additional revenues will be received. These revenues were for the Department of Public Safety’s participation in a regional task force operated by the Drug Enforcement Agency (DEA), and the original estimates were preliminary figures that have not come to fruition due to changes in the revenue distribution methodology. The purposes for which asset forfeiture can be used are limited, and funds are drawn down for new one-time expenses targeted for law enforcement services. As these funds are projected to discontinue, adjustments to expenses have been made.
The FY 2017/18 Budget includes a continuing transfer to the General Fund to support juvenile diversion activities within the Police Services program. The City currently has an agreement with the County of Santa Clara to pay for the direct salary, excluding benefits, of one Deputy Probation Officer. For FY 2017/18, this amount is $110,412. It is the last year for such transfer, as there are not enough funds to support this expenditure along with other priorities. Funding for this program will be provided by the City’s General Fund.
The FY 2017/18 Budget also includes $136,596 for the Police Services Equipment Acquisition project. $44,639 is funded in the Police Services Equipment - Cell Phones project, which supports the cost of specialized cellular phones used for police services. This project has been programmed to end in FY 2018/19, at which point the ending twenty-year reserve is unable to fund the project.
Police Services Augmentation FundThe Police Services Augmentation Fund accounts for grant programs
that provide monies for law enforcement purposes. The Supplemental Law Enforcement Services (SLES) program established by the State, and the smaller federal Edward Byrne Memorial Justice Assistance Grant from the Bureau of Justice Administration (BJA) have been the two sources of revenue to this Fund.
The State SLES monies constitute the major portion of revenue. However, over the years, the amounts of both grants have decreased or varied significantly. BJA decreased from a high of $70,158 to a low of $0 in FY 2011/12. SLES funding has also fluctuated over the years, with a high of nearly $300,000 in FY 1996/97 and a low of $100,000 in FY 2008/09. After initially being eliminated, funding for FY 2011/12 was restored to a level of nearly $230,000, which was the result of the State shifting Motor Vehicle License funds away from local agency general funds into the grants that provide SLES funding. This was a permanent shift, and as such, funding in the amount of $243,560 has been programmed for the entire twenty-year plan. Because of the stable funding, SLES monies will fund nearly one full-time lieutenant for the Department of Public Safety, with the remaining cost being funded by the General Fund. This is in keeping with past use of these funds, which has been for staffing for most of the years. Because BJA funds are uncertain, they are not projected in the long-term plan and instead will be appropriated as they become available.
Employment Development FundThe City of Sunnyvale, as administrative entity for the North Valley
(NOVA) Job Training Consortium, is required by legislation and regulations to account for the use of various federal and state funds and program revenues for the workforce development activities that are conducted for the consortium. The City established the Employment Development Fund to fulfill this obligation.
NOVA, formed in 1983, serves the cities of Cupertino, Los Altos, Milpitas, Mountain View, Palo Alto, Santa Clara and Sunnyvale. As of July 1, 2015, at the request of the San Mateo County Board of Supervisors and with the
City of Sunnyvale FY 2017/18 Special Revenue Funds
155
approval of the seven cities of the consortium and the State of California, San Mateo County joined the NOVA Consortium.
The City of Sunnyvale, through its NOVA Workforce Services Department, administers NOVA’s programs on behalf of the consortium. NOVA has a wide variety of programs funded through various sources, with baseline funding originating from the federal government and passing through the State of California. A significant amount of additional grant money is received through competitive grants from federal and state sources. Since July 1, 2000, the primary funding source for the NOVA Workforce Services Department has been federal Workforce Investment Act (WIA) appropriations and competitive grants.
WIA was replaced as of July 1, 2015 with the federal Workforce Innovation and Opportunity Act (WIOA). The City of Sunnyvale’s City Council took action on February 10, 2015, to remain the Chief Local Elected Official (CLEO) for the NOVA consortium, with the City assuming financial liability for the program and functioning as the administrative entity for NOVA’ s services. Council also reaffirmed the NOVA Workforce Board as the governing board for NOVA and approved the revised Agreement on Roles and Responsibilities Between the NOVA Workforce Board and the Sunnyvale City Council. Other than incorporating the new WIOA terminology, the Joint Exercise of Power Agreement (JPA) for Council serving as the CLEO for the NOVA consortium maintains many of the same agreements.
The WIOA dictates funding formulas whereby the allocation of funds provided by Congress to support the Act is distributed to the states. A primary factor of these formulas is the unemployment rate. These funds come in three targeted categories: Youth, Adult, and Dislocated Worker. Each of these categories serves a defined population.
The FY 2017/18 Adopted Budget is based on an estimate of grant resources for the year. In addition, NOVA’s staffing level is based on an approach that budgets staffing only for its most stable funding resources, which are NOVA’s allocated funding and additional funding for the excess demand for services from the dislocated worker population. NOVA has a long history of being very competitive for additional federal and state resources and intends to submit several grant applications during the year. Any additional revenues and expenditures as a result of new grants obtained,
including the need to budget casual staff for those short-term projects, will be reflected in a cumulative budget modification submitted each fiscal year. For the purposes of the City’s FY 2017/18 Adopted Budget, NOVA has taken the total funding estimates as described and used these as the basis for NOVA’s FY 2017/18 program and service levels. This budget incorporates guidance received from the state, which provided specific planning goals.
It is important to note that as different grants come and go, various programs and activities operated by NOVA often have a short lifespan relative to programs operated by other City departments. Therefore, the current listings of programs that have been operated by NOVA during the last several years are not included in the budget document. Rather, a base funding level will be carried into the new fiscal year and the budget will be modified for planned activities, outcomes, and expenditures during the course of the year as new funding is secured and new contract goals and obligations are agreed upon.
To recognize NOVA’s long tenure in the City, grant funding of $10.5 million has been projected for FY 2017/18 and as an average resource level per year for the remaining nineteen years of the twenty-year planning period.
Parking District FundThe Parking District Fund is a small fund that provides for the ongoing
landscape and maintenance of downtown parking lots through assessments on property owners within the district. The Downtown Parking District includes all public parking in the downtown area, with the exception of the parking provided by the Sunnyvale Town Center.
For a number of years, the Parking District assessment was set by an election held every one or two years. In June 2009, the District property owners approved a long-term assessment methodology whereby the FY 2009/10 assessment rate was set as the base rate that would be adjusted annually by the previous year’s change in the Consumer Price Index going forward. The special assessment is projected based on preliminary estimates from the assessment and administration engineer for the District. Total project costs of $1.3 million are planned over the twenty-year plan to install gutters and rehabilitate existing pavement in the downtown lots, and for various maintenance activities, including periodic asphalt patching, slurry seals, curb painting, sign replacement, and re-striping as necessary.
City of Sunnyvale FY 2017/18 Special Revenue Funds
156

Annual operations costs represent the ongoing maintenance of the Parking District by the City for personnel, utilities, materials, contractual services and other items necessary or appropriate for the parking facilities and administration of the district and assessment.
It is anticipated the Parking District and assessment methodology will be reviewed after the redevelopment of the adjacent Town Center and Town and Country sites.
Gas Tax FundThe Gas Tax Fund is required by State law to account for Gas Taxes
collected and allocated by the State. The State Gasoline Tax is a flat rate per gallon levied on gasoline and other motor fuels. Gas Tax is distributed to the State, cities, and counties on a formula based on population and the proportion of registered vehicles.
In March 2010, the legislature passed a bill that repealed a portion of the State Sales Tax on gasoline, which had been the funding source for Proposition 42, and replaced it with a variable rate excise tax on gasoline (Section 2103). The intention was for the repeal and replacement to be revenue neutral. As such, the excise tax is adjusted annually to ensure that revenue will keep pace with the repealed sales tax. It should be noted that only the State Sales Tax on gasoline was repealed; the local 1% rate remains intact. Starting with the FY 2011/12 Adopted Budget, revenues and expenditures that were formerly in the Traffic Congestion Relief Fund (Proposition 42) were incorporated into the Gas Tax Fund to reflect this legislation.
Since FY 2014/15, combined Gas Tax revenues have been on the decline. This decline is the result of a decline in gas prices and a true-up from the State for the excise tax portion of gas tax revenue. After two years of decline, the FY 2016/17 excise tax index was adjusted down again by the State for having over-allocated in the prior year. Starting in FY 2017/18 through the end of the twenty-year plan, Gas Tax revenues are forecasted to be approximately $3.3 million each year. This totals an increase of $5.8 million over the twenty-year plan, compared to prior fiscal year’s projections. This increase resulted from overall Highway User Tax Allocation (HUTA) mainly attributable to Section 2103 estimates growth. As a portion of Gas
Tax revenues offset the cost of the Street Operations Program, this gain of resources will provide some relief to the General Fund. As the majority of gas tax revenue is based on the number of gallons sold and not on the price of gasoline, no growth in revenue is projected for the long-term plan due to continued expected advancements in vehicle fuel economy.
FY 2017/18 State Budget includes a new transportation funding package to address critical needs at various local agencies to rehabilitate streets and roads. Based on SB-1, Sunnyvale will receive an additional allocated amount of approximately $2.6 million. These funds have not been programmed in the twenty-year financial plan.
Gas Tax funds are also used for street renovation projects. The Budget for the Gas Tax Fund has transfers to the Capital and Infrastructure Funds of $2.2 million earmarked for construction. The majority of this funding will be used for traffic signal hardware and wiring, pavement rehabilitation, and street light poles repairs.
In accordance with State law, the Gas Tax Fund receives interest earnings on any unspent cash balances. Gas Tax funds must be spent on maintenance and capital related to public streets and highways. The Gas Tax Fund works in tandem with the General Fund, with a set amount of funding for operations and remaining funds used to cover Gas Tax-eligible capital projects.
The project administration expenditure in the Gas Tax Fund represents the indirect charges for Engineering Services that are expected to be utilized in supporting capital projects that are funded from the Gas Tax Fund.
Transportation Development Act (TDA) FundIn FY 2003/04, a small special revenue fund was established to account
for activities related to Transportation Development Act (TDA) funds. These funds were created by State legislation that annually returns to each region in the State ¼ of 1% of State Sales Tax revenues to be used for transportation projects. These funds are restricted for pedestrian and bicycle facilities and bicycle safety education programs and must be segregated for those purposes. The TDA, in accordance with Public Utilities Code Section 99245, must submit a report of a fiscal and compliance audit made by an independent auditor at the end of each fiscal year.
City of Sunnyvale FY 2017/18 Special Revenue Funds
157
The FY 2017/18 Budget does not include any new appropriations; however, as TDA-eligible projects are identified, revenues will be recognized and appropriated to those projects. FY 2016/17 appropriations which total approximately $625,000 are primarily for various bicycle lane projects.
Vehicle Registration Fee FundIn 2010, voters approved Measure B, which collects vehicle registration
fees to pay for programs and projects that provide local transportation improvements. In FY 2012/13, the City of Sunnyvale established a special revenue fund to account for revenues received through the $10 annual Vehicle Registration Fee (VRF) assessed to automobiles owned by residents of Santa Clara County.
In 2012, the VRF provided $14.8 million to the County, and 80 percent of this amount was distributed to the cities based on population. In August 2012, the City of Sunnyvale received its first allocation of VRF funds in the amount of $797,394. For FY 2016/17, the City received $898,229 in VRF funds, and it is expected that the City’s share will remain constant throughout the twenty-year planning period. In general, VRF funds are distributed based on each jurisdiction’s population in the county, and a small percentage is available based on a competitive County-wide program. The remainder is reserved for Program Administration.
All VRF funds received from the County are programmed to be transferred to the Infrastructure Fund to provide funding for the Pavement Rehabilitation project throughout the twenty-year plan.
Youth and Neighborhood Services FundThe Youth and Neighborhood Services Fund accounts for the revenues
and ongoing operating program expenditures associated with the management and maintenance of the Columbia Neighborhood Center (CNC). On May 10, 1994, Council approved development of a neighborhood service center at Columbia Middle School to meet the health, social, recreational, and educational needs of North Sunnyvale residents (with an emphasis on serving disadvantaged youth) through a coordinated network of services. Advanced Micro Devices contributed $1 million to the Columbia
Neighborhood Center project, one-half of which Council used to establish the Youth Opportunity Fund (now renamed the Youth and Neighborhood Services Fund) to generate interest income which is used to offset ongoing operating program expenditures.
The operating program expenditures for Columbia Neighborhood Center and related projects are accounted for in this fund, along with the associated program revenues. As outlined in the partnership agreement, the City is reimbursed by the Sunnyvale School District for a portion of the cost of services provided at the Columbia Neighborhood Center. For FY 2017/18 this reimbursement is projected to be $204,358. Other revenues to the Fund are recreation fees, rental fees for the facilities, interest earnings on the endowment, and an annual subsidy from the General Fund. For FY 2017/18, this subsidy is expected to be $597,586.
Expenses included in this Fund are for the direct services provided at the CNC, including CNC operations, which is overseen by the Library and Community Services Department.
City of Sunnyvale FY 2017/18 Special Revenue Funds
158

RESERVE/FUND BALANCE, JULY 1
CURRENT RESOURCES: Housing Mitigation Fees Housing Loan Repayments Miscellaneous Reimbursement BMR In-Lieu Fees BMR Processing Fees Transfers In Interest Income
TOTAL CURRENT RESOURCES
TOTAL AVAILABLE RESOURCES
CURRENT REQUIREMENTS: Operations Special Projects Future Housing Projects Transfer To General Fund Transfer To Redevelopment Housing Fund General Fund In-Lieu
TOTAL CURRENT REQUIREMENTS
RESERVES: Housing Mitigation Reserve BMR Reserve Redevelopment Housing Subfund Reserve
TOTAL RESERVES FUND BALANCE, JUNE 30
FY 2016/2017TO
ACTUAL CURRENT BUDGET PLAN PLAN PLAN PLAN PLAN PLAN PLAN PLAN PLAN FY 2026/20272015/2016 2016/2017 2017/2018 2018/2019 2019/2020 2020/2021 2021/2022 2022/2023 2023/2024 2024/2025 2025/2026 2026/2027 TOTAL
--------------------- --------------------- --------------------- --------------------- --------------------- --------------------- --------------------- --------------------- --------------------- --------------------- --------------------- --------------------- ----------------------20,864,270 24,031,157 16,268,836 29,053,362 36,326,513 31,803,449 27,582,262 23,257,089 18,966,942 14,656,322 10,295,453 5,907,453 24,031,157
--------------------- --------------------- --------------------- --------------------- --------------------- --------------------- --------------------- --------------------- --------------------- --------------------- --------------------- --------------------- ----------------------
8,488,706 2,439,908 21,515,745 18,297,353 4,893,666 4,991,540 5,091,370 5,193,198 5,297,062 5,403,003 5,511,063 5,550,958 84,184,866336,833 520,676 855,709 497,391 504,558 511,867 519,323 526,928 534,685 542,597 550,668 558,900 6,123,302
1,500 0 0 0 0 0 0 0 0 0 0 0 01,161,332 590,100 389,405 397,193 405,137 413,240 421,504 429,935 438,533 447,304 456,250 465,375 4,853,976
34,200 35,226 35,931 36,649 37,382 38,130 38,892 39,670 40,464 41,273 42,098 42,940 428,6550 2,430,000 1,300,000 0 0 0 0 0 0 0 0 0 3,730,000
183,408 187,192 273,430 567,112 674,555 877,621 751,321 624,000 496,896 368,745 239,451 233,752 5,294,075--------------------- --------------------- --------------------- --------------------- --------------------- --------------------- --------------------- --------------------- --------------------- --------------------- --------------------- --------------------- ----------------------
10,205,979 6,203,102 24,370,220 19,795,698 6,515,297 6,832,397 6,822,411 6,813,731 6,807,640 6,802,922 6,799,531 6,851,925 104,614,874--------------------- --------------------- --------------------- --------------------- --------------------- --------------------- --------------------- --------------------- --------------------- --------------------- --------------------- --------------------- ----------------------
31,070,249 30,234,259 40,639,056 48,849,060 42,841,810 38,635,846 34,404,673 30,070,820 25,774,582 21,459,244 17,094,984 12,759,378 128,646,031--------------------- --------------------- --------------------- --------------------- --------------------- --------------------- --------------------- --------------------- --------------------- --------------------- --------------------- --------------------- ----------------------
794,913 838,974 877,933 903,549 927,355 950,884 974,366 997,326 1,020,358 1,053,234 1,085,971 1,119,063 10,749,0146,164,949 12,804,137 10,630,000 39,630 30,000 20,019 10,000 20,424 10,000 20,845 10,000 21,394 23,616,449
0 0 0 11,500,000 10,000,000 10,000,000 10,000,000 10,000,000 10,000,000 10,000,000 10,000,000 3,500,000 85,000,0009,811 0 0 0 0 0 78,831 0 0 0 0 0 78,831
0 244,503 0 0 0 0 0 0 0 0 0 0 244,50369,420 77,810 77,760 79,368 81,008 82,680 84,387 86,127 87,902 89,713 91,559 93,443 931,757
--------------------- --------------------- --------------------- --------------------- --------------------- --------------------- --------------------- --------------------- --------------------- --------------------- --------------------- --------------------- ----------------------7,039,094 13,965,424 11,585,693 12,522,547 11,038,362 11,053,584 11,147,584 11,103,877 11,118,260 11,163,792 11,187,531 4,733,900 120,620,554
--------------------- --------------------- --------------------- --------------------- --------------------- --------------------- --------------------- --------------------- --------------------- --------------------- --------------------- --------------------- ----------------------
19,338,908 14,326,876 27,314,456 35,994,891 31,390,949 27,084,283 22,672,609 18,294,842 13,895,477 9,449,401 4,980,064 7,020,229 7,020,2294,447,746 1,941,960 1,738,906 331,622 412,500 497,979 584,480 672,100 760,845 846,052 927,389 1,005,249 1,005,249
244,503 0 0 0 0 0 0 0 0 0 0 0 0--------------------- --------------------- --------------------- --------------------- --------------------- --------------------- --------------------- --------------------- --------------------- --------------------- --------------------- --------------------- ----------------------
24,031,157 16,268,836 29,053,362 36,326,513 31,803,449 27,582,262 23,257,089 18,966,942 14,656,322 10,295,453 5,907,453 8,025,478 8,025,478--------------------- --------------------- --------------------- --------------------- --------------------- --------------------- --------------------- --------------------- --------------------- --------------------- --------------------- --------------------- ----------------------
0 0 0 0 0 0 0 0 0 0 0 0 0============ ============ ============ ============ ============ ============ ============ ============ ============ ============ ============ ============ =============
JULY 1, 2016 TO JUNE 30, 2027LONG TERM FINANCIAL PLAN
070. COMBINED HOUSING FUNDCITY OF SUNNYVALE
159

RESERVE/FUND BALANCE, JULY 1
CURRENT RESOURCES: Housing Mitigation Fees Housing Loan Repayments Miscellaneous Reimbursement BMR In-Lieu Fees BMR Processing Fees Transfers In Interest Income
TOTAL CURRENT RESOURCES
TOTAL AVAILABLE RESOURCES
CURRENT REQUIREMENTS: Operations Special Projects Future Housing Projects Transfer To General Fund Transfer To Redevelopment Housing Fund General Fund In-Lieu
TOTAL CURRENT REQUIREMENTS
RESERVES: Housing Mitigation Reserve BMR Reserve Redevelopment Housing Subfund Reserve
TOTAL RESERVES FUND BALANCE, JUNE 30
FY 2027/2028 FY 2016/2017TO TO
PLAN PLAN PLAN PLAN PLAN PLAN PLAN PLAN PLAN PLAN FY 2036/2037 FY 2036/20372027/2028 2028/2029 2029/2030 2030/2031 2031/2032 2032/2033 2033/2034 2034/2035 2035/2036 2036/2037 TOTAL TOTAL
--------------------- --------------------- --------------------- --------------------- --------------------- --------------------- --------------------- --------------------- --------------------- --------------------- ---------------------- ----------------------8,025,478 10,499,483 13,229,668 16,007,557 19,312,289 22,948,098 26,906,266 31,233,797 35,933,614 41,057,311 8,025,478 24,031,157
--------------------- --------------------- --------------------- --------------------- --------------------- --------------------- --------------------- --------------------- --------------------- --------------------- ---------------------- ----------------------
5,717,487 5,889,012 6,065,682 6,247,652 6,435,082 6,628,134 6,826,978 7,031,788 7,242,741 7,242,741 65,327,297 149,512,163567,296 580,143 593,375 607,004 621,042 635,501 650,394 665,733 681,533 697,807 6,299,829 12,423,131
0 0 0 0 0 0 0 0 0 0 0 0479,336 493,716 508,528 523,784 539,497 555,682 572,353 589,523 607,209 625,425 5,495,053 10,349,029
44,229 45,555 46,922 48,330 49,780 51,273 52,811 54,395 56,027 57,708 507,030 935,6850 0 0 0 0 0 0 0 0 0 0 3,730,000
403,826 508,833 615,676 742,780 882,619 1,034,856 1,201,300 1,382,062 1,579,127 1,783,527 10,134,606 15,428,681--------------------- --------------------- --------------------- --------------------- --------------------- --------------------- --------------------- --------------------- --------------------- --------------------- ---------------------- ----------------------
7,212,174 7,517,260 7,830,183 8,169,549 8,528,020 8,905,446 9,303,836 9,723,502 10,166,637 10,407,208 87,763,816 192,378,690--------------------- --------------------- --------------------- --------------------- --------------------- --------------------- --------------------- --------------------- --------------------- --------------------- ---------------------- ----------------------
15,237,652 18,016,743 21,059,851 24,177,106 27,840,309 31,853,544 36,210,102 40,957,299 46,100,251 51,464,519 95,789,294 216,409,847--------------------- --------------------- --------------------- --------------------- --------------------- --------------------- --------------------- --------------------- --------------------- --------------------- ---------------------- ----------------------
1,131,844 1,165,692 1,200,538 1,236,493 1,273,465 1,311,587 1,350,777 1,380,181 1,410,218 1,441,000 12,901,795 23,650,80910,000 22,088 10,000 22,824 10,000 23,605 10,000 24,433 10,000 25,312 168,262 23,784,711
3,500,000 3,500,000 3,500,000 3,500,000 3,500,000 3,500,000 3,500,000 3,500,000 3,500,000 3,500,000 35,000,000 120,000,0000 0 239,404 0 0 0 0 0 0 0 239,404 318,2350 0 0 0 0 0 0 0 0 0 0 244,503
96,325 99,294 102,351 105,501 108,745 112,086 115,527 119,072 122,723 126,483 1,108,105 2,039,862--------------------- --------------------- --------------------- --------------------- --------------------- --------------------- --------------------- --------------------- --------------------- --------------------- ---------------------- ----------------------
4,738,169 4,787,074 5,052,293 4,864,817 4,892,210 4,947,277 4,976,304 5,023,686 5,042,941 5,092,795 49,417,567 170,038,121--------------------- --------------------- --------------------- --------------------- --------------------- --------------------- --------------------- --------------------- --------------------- --------------------- ---------------------- -----------------------
9,406,045 12,047,135 14,735,051 17,949,054 21,493,386 25,359,424 29,594,155 34,194,332 39,211,044 44,410,689 44,410,690 44,410,6911,093,438 1,182,533 1,272,506 1,363,235 1,454,712 1,546,842 1,639,642 1,739,282 1,846,267 1,961,034 1,961,034 1,961,034
0 0 0 0 0 0 0 0 0 0 0 0--------------------- --------------------- --------------------- --------------------- --------------------- --------------------- --------------------- --------------------- --------------------- --------------------- ---------------------- ----------------------
10,499,483 13,229,668 16,007,557 19,312,289 22,948,098 26,906,266 31,233,797 35,933,614 41,057,311 46,371,723 46,371,724 46,371,725--------------------- --------------------- --------------------- --------------------- --------------------- --------------------- --------------------- --------------------- --------------------- --------------------- ---------------------- ----------------------
0 0 0 0 0 0 0 0 0 0 0 0============ ============ ============ ============ ============ ============ ============ ============ ============ ============ ============= =============
JULY 1, 2027 TO JUNE 30, 2037LONG TERM FINANCIAL PLAN
070. COMBINED HOUSING FUNDCITY OF SUNNYVALE
160

RESERVE/FUND BALANCE, JULY 1
CURRENT RESOURCES: Housing Mitigation Fees Housing Loan Repayments Transfer from BMR Subfund Transfer from Redevelopment Housing Fund Interest Income
TOTAL CURRENT RESOURCES
TOTAL AVAILABLE RESOURCES
CURRENT REQUIREMENTS: Operations Special Projects Future Housing Projects Transfer To General Fund General Fund In-Lieu
TOTAL CURRENT REQUIREMENTS
RESERVES: Housing Mitigation Reserve
TOTAL RESERVES FUND BALANCE, JUNE 30
FY 2016/2017TO
ACTUAL CURRENT BUDGET PLAN PLAN PLAN PLAN PLAN PLAN PLAN PLAN PLAN FY 2026/20272015/2016 2016/2017 2017/2018 2018/2019 2019/2020 2020/2021 2021/2022 2022/2023 2023/2024 2024/2025 2025/2026 2026/2027 TOTAL
--------------------- --------------------- --------------------- --------------------- --------------------- --------------------- --------------------- --------------------- --------------------- --------------------- --------------------- --------------------- ----------------------16,864,214 19,338,908 14,326,876 27,314,456 35,994,891 31,390,949 27,084,283 22,672,609 18,294,842 13,895,477 9,449,401 4,980,064 19,338,908
--------------------- --------------------- --------------------- --------------------- --------------------- --------------------- --------------------- --------------------- --------------------- --------------------- --------------------- --------------------- ----------------------
8,488,706 2,439,908 21,515,745 18,297,353 4,893,666 4,991,540 5,091,370 5,193,198 5,297,062 5,403,003 5,511,063 5,550,958 84,184,866197,760 381,603 716,635 358,318 365,484 372,794 380,249 387,854 395,611 403,524 411,594 419,826 4,593,492
0 2,430,000 300,000 0 0 0 0 0 0 0 0 0 2,730,0000 0 1,000,000 0 0 0 0 0 0 0 0 0 1,000,000
148,547 155,402 250,567 549,152 667,187 864,166 735,324 605,430 475,719 344,998 213,243 204,473 5,065,661--------------------- --------------------- --------------------- --------------------- --------------------- --------------------- --------------------- --------------------- --------------------- --------------------- --------------------- --------------------- ----------------------
8,835,013 5,406,913 23,782,947 19,204,822 5,926,337 6,228,499 6,206,943 6,186,482 6,168,392 6,151,525 6,135,901 6,175,257 97,574,019--------------------- --------------------- --------------------- --------------------- --------------------- --------------------- --------------------- --------------------- --------------------- --------------------- --------------------- --------------------- ----------------------
25,699,227 24,745,821 38,109,823 46,519,278 41,921,228 37,619,448 33,291,226 28,859,091 24,463,234 20,047,002 15,585,302 11,155,321 116,912,927--------------------- --------------------- --------------------- --------------------- --------------------- --------------------- --------------------- --------------------- --------------------- --------------------- --------------------- --------------------- ----------------------
307,174 409,566 427,156 445,549 460,055 473,884 487,466 500,426 513,258 531,134 548,471 565,763 5,362,7285,973,914 9,961,137 10,320,000 29,630 20,000 10,019 0 10,424 0 10,845 0 11,394 20,373,449
0 0 0 10,000,000 10,000,000 10,000,000 10,000,000 10,000,000 10,000,000 10,000,000 10,000,000 3,500,000 83,500,0009,811 0 0 0 0 0 78,831 0 0 0 0 0 78,831
69,420 48,242 48,211 49,208 50,225 51,262 52,320 53,399 54,499 55,622 56,767 57,935 577,689--------------------- --------------------- --------------------- --------------------- --------------------- --------------------- --------------------- --------------------- --------------------- --------------------- --------------------- --------------------- ----------------------
6,360,319 10,418,945 10,795,367 10,524,387 10,530,279 10,535,165 10,618,617 10,564,249 10,567,757 10,597,601 10,605,238 4,135,092 109,892,697--------------------- --------------------- --------------------- --------------------- --------------------- --------------------- --------------------- --------------------- --------------------- --------------------- --------------------- --------------------- ----------------------
19,338,908 14,326,876 27,314,456 35,994,891 31,390,949 27,084,283 22,672,609 18,294,842 13,895,477 9,449,401 4,980,064 7,020,229 7,020,229--------------------- --------------------- --------------------- --------------------- --------------------- --------------------- --------------------- --------------------- --------------------- --------------------- --------------------- --------------------- ----------------------
19,338,908 14,326,876 27,314,456 35,994,891 31,390,949 27,084,283 22,672,609 18,294,842 13,895,477 9,449,401 4,980,064 7,020,229 7,020,229--------------------- --------------------- --------------------- --------------------- --------------------- --------------------- --------------------- --------------------- --------------------- --------------------- --------------------- --------------------- ----------------------
0 0 0 0 0 0 0 0 0 0 0 0 0============ ============ ============ ============ ============ ============ ============ ============ ============ ============ ============ ============ =============
JULY 1, 2016 TO JUNE 30, 2027LONG TERM FINANCIAL PLAN
070/100. HOUSING MITIGATION FUNDCITY OF SUNNYVALE
161
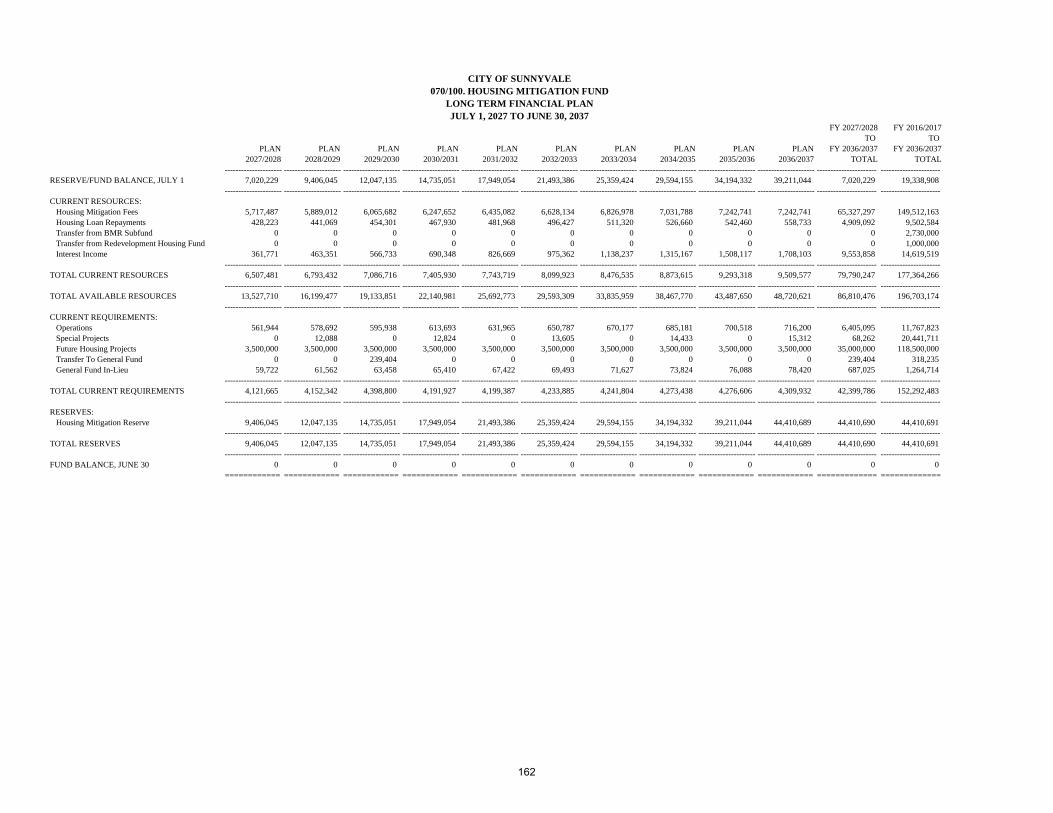
RESERVE/FUND BALANCE, JULY 1
CURRENT RESOURCES: Housing Mitigation Fees Housing Loan Repayments Transfer from BMR Subfund Transfer from Redevelopment Housing Fund Interest Income
TOTAL CURRENT RESOURCES
TOTAL AVAILABLE RESOURCES
CURRENT REQUIREMENTS: Operations Special Projects Future Housing Projects Transfer To General Fund General Fund In-Lieu
TOTAL CURRENT REQUIREMENTS
RESERVES: Housing Mitigation Reserve
TOTAL RESERVES FUND BALANCE, JUNE 30
FY 2027/2028 FY 2016/2017TO TO
PLAN PLAN PLAN PLAN PLAN PLAN PLAN PLAN PLAN PLAN FY 2036/2037 FY 2036/20372027/2028 2028/2029 2029/2030 2030/2031 2031/2032 2032/2033 2033/2034 2034/2035 2035/2036 2036/2037 TOTAL TOTAL
--------------------- --------------------- --------------------- --------------------- --------------------- --------------------- --------------------- --------------------- --------------------- --------------------- ---------------------- ----------------------7,020,229 9,406,045 12,047,135 14,735,051 17,949,054 21,493,386 25,359,424 29,594,155 34,194,332 39,211,044 7,020,229 19,338,908
--------------------- --------------------- --------------------- --------------------- --------------------- --------------------- --------------------- --------------------- --------------------- --------------------- ---------------------- ----------------------
5,717,487 5,889,012 6,065,682 6,247,652 6,435,082 6,628,134 6,826,978 7,031,788 7,242,741 7,242,741 65,327,297 149,512,163428,223 441,069 454,301 467,930 481,968 496,427 511,320 526,660 542,460 558,733 4,909,092 9,502,584
0 0 0 0 0 0 0 0 0 0 0 2,730,0000 0 0 0 0 0 0 0 0 0 0 1,000,000
361,771 463,351 566,733 690,348 826,669 975,362 1,138,237 1,315,167 1,508,117 1,708,103 9,553,858 14,619,519--------------------- --------------------- --------------------- --------------------- --------------------- --------------------- --------------------- --------------------- --------------------- --------------------- ---------------------- ----------------------
6,507,481 6,793,432 7,086,716 7,405,930 7,743,719 8,099,923 8,476,535 8,873,615 9,293,318 9,509,577 79,790,247 177,364,266--------------------- --------------------- --------------------- --------------------- --------------------- --------------------- --------------------- --------------------- --------------------- --------------------- ---------------------- ----------------------
13,527,710 16,199,477 19,133,851 22,140,981 25,692,773 29,593,309 33,835,959 38,467,770 43,487,650 48,720,621 86,810,476 196,703,174--------------------- --------------------- --------------------- --------------------- --------------------- --------------------- --------------------- --------------------- --------------------- --------------------- ---------------------- ----------------------
561,944 578,692 595,938 613,693 631,965 650,787 670,177 685,181 700,518 716,200 6,405,095 11,767,8230 12,088 0 12,824 0 13,605 0 14,433 0 15,312 68,262 20,441,711
3,500,000 3,500,000 3,500,000 3,500,000 3,500,000 3,500,000 3,500,000 3,500,000 3,500,000 3,500,000 35,000,000 118,500,0000 0 239,404 0 0 0 0 0 0 0 239,404 318,235
59,722 61,562 63,458 65,410 67,422 69,493 71,627 73,824 76,088 78,420 687,025 1,264,714--------------------- --------------------- --------------------- --------------------- --------------------- --------------------- --------------------- --------------------- --------------------- --------------------- ---------------------- ----------------------
4,121,665 4,152,342 4,398,800 4,191,927 4,199,387 4,233,885 4,241,804 4,273,438 4,276,606 4,309,932 42,399,786 152,292,483--------------------- --------------------- --------------------- --------------------- --------------------- --------------------- --------------------- --------------------- --------------------- --------------------- ---------------------- ----------------------
9,406,045 12,047,135 14,735,051 17,949,054 21,493,386 25,359,424 29,594,155 34,194,332 39,211,044 44,410,689 44,410,690 44,410,691--------------------- --------------------- --------------------- --------------------- --------------------- --------------------- --------------------- --------------------- --------------------- --------------------- ---------------------- ----------------------
9,406,045 12,047,135 14,735,051 17,949,054 21,493,386 25,359,424 29,594,155 34,194,332 39,211,044 44,410,689 44,410,690 44,410,691--------------------- --------------------- --------------------- --------------------- --------------------- --------------------- --------------------- --------------------- --------------------- --------------------- ---------------------- ----------------------
0 0 0 0 0 0 0 0 0 0 0 0============ ============ ============ ============ ============ ============ ============ ============ ============ ============ ============= =============
JULY 1, 2027 TO JUNE 30, 2037LONG TERM FINANCIAL PLAN
070/100. HOUSING MITIGATION FUNDCITY OF SUNNYVALE
162
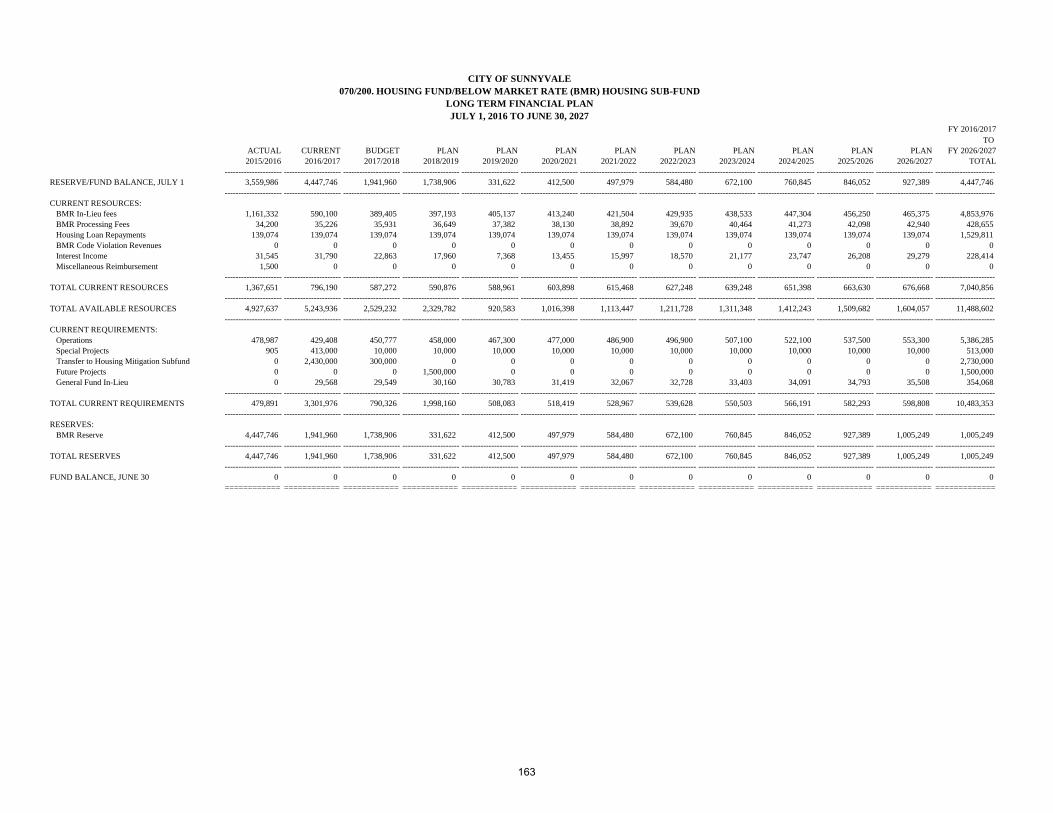
RESERVE/FUND BALANCE, JULY 1
CURRENT RESOURCES: BMR In-Lieu fees BMR Processing Fees Housing Loan Repayments BMR Code Violation Revenues Interest Income Miscellaneous Reimbursement
TOTAL CURRENT RESOURCES
TOTAL AVAILABLE RESOURCES
CURRENT REQUIREMENTS: Operations Special Projects
Transfer to Housing Mitigation Subfund Future Projects General Fund In-Lieu
TOTAL CURRENT REQUIREMENTS
RESERVES: BMR Reserve
TOTAL RESERVES FUND BALANCE, JUNE 30
FY 2016/2017TO
ACTUAL CURRENT BUDGET PLAN PLAN PLAN PLAN PLAN PLAN PLAN PLAN PLAN FY 2026/20272015/2016 2016/2017 2017/2018 2018/2019 2019/2020 2020/2021 2021/2022 2022/2023 2023/2024 2024/2025 2025/2026 2026/2027 TOTAL
--------------------- --------------------- --------------------- --------------------- --------------------- --------------------- --------------------- --------------------- --------------------- --------------------- --------------------- --------------------- ----------------------3,559,986 4,447,746 1,941,960 1,738,906 331,622 412,500 497,979 584,480 672,100 760,845 846,052 927,389 4,447,746
--------------------- --------------------- --------------------- --------------------- --------------------- --------------------- --------------------- --------------------- --------------------- --------------------- --------------------- --------------------- ----------------------
1,161,332 590,100 389,405 397,193 405,137 413,240 421,504 429,935 438,533 447,304 456,250 465,375 4,853,97634,200 35,226 35,931 36,649 37,382 38,130 38,892 39,670 40,464 41,273 42,098 42,940 428,655
139,074 139,074 139,074 139,074 139,074 139,074 139,074 139,074 139,074 139,074 139,074 139,074 1,529,8110 0 0 0 0 0 0 0 0 0 0 0 0
31,545 31,790 22,863 17,960 7,368 13,455 15,997 18,570 21,177 23,747 26,208 29,279 228,4141,500 0 0 0 0 0 0 0 0 0 0 0 0
--------------------- --------------------- --------------------- --------------------- --------------------- --------------------- --------------------- --------------------- --------------------- --------------------- --------------------- --------------------- ----------------------1,367,651 796,190 587,272 590,876 588,961 603,898 615,468 627,248 639,248 651,398 663,630 676,668 7,040,856
--------------------- --------------------- --------------------- --------------------- --------------------- --------------------- --------------------- --------------------- --------------------- --------------------- --------------------- --------------------- ----------------------4,927,637 5,243,936 2,529,232 2,329,782 920,583 1,016,398 1,113,447 1,211,728 1,311,348 1,412,243 1,509,682 1,604,057 11,488,602
--------------------- --------------------- --------------------- --------------------- --------------------- --------------------- --------------------- --------------------- --------------------- --------------------- --------------------- --------------------- ----------------------
478,987 429,408 450,777 458,000 467,300 477,000 486,900 496,900 507,100 522,100 537,500 553,300 5,386,285905 413,000 10,000 10,000 10,000 10,000 10,000 10,000 10,000 10,000 10,000 10,000 513,000
0 2,430,000 300,000 0 0 0 0 0 0 0 0 0 2,730,0000 0 0 1,500,000 0 0 0 0 0 0 0 0 1,500,0000 29,568 29,549 30,160 30,783 31,419 32,067 32,728 33,403 34,091 34,793 35,508 354,068
--------------------- --------------------- --------------------- --------------------- --------------------- --------------------- --------------------- --------------------- --------------------- --------------------- --------------------- --------------------- ----------------------479,891 3,301,976 790,326 1,998,160 508,083 518,419 528,967 539,628 550,503 566,191 582,293 598,808 10,483,353
--------------------- --------------------- --------------------- --------------------- --------------------- --------------------- --------------------- --------------------- --------------------- --------------------- --------------------- --------------------- ----------------------
4,447,746 1,941,960 1,738,906 331,622 412,500 497,979 584,480 672,100 760,845 846,052 927,389 1,005,249 1,005,249--------------------- --------------------- --------------------- --------------------- --------------------- --------------------- --------------------- --------------------- --------------------- --------------------- --------------------- --------------------- ----------------------
4,447,746 1,941,960 1,738,906 331,622 412,500 497,979 584,480 672,100 760,845 846,052 927,389 1,005,249 1,005,249--------------------- --------------------- --------------------- --------------------- --------------------- --------------------- --------------------- --------------------- --------------------- --------------------- --------------------- --------------------- ----------------------
0 0 0 0 0 0 0 0 0 0 0 0 0============ ============ ============ ============ ============ ============ ============ ============ ============ ============ ============ ============ =============
070/200. HOUSING FUND/BELOW MARKET RATE (BMR) HOUSING SUB-FUND
JULY 1, 2016 TO JUNE 30, 2027LONG TERM FINANCIAL PLAN
CITY OF SUNNYVALE
163

RESERVE/FUND BALANCE, JULY 1
CURRENT RESOURCES: BMR In-Lieu fees BMR Processing Fees Housing Loan Repayments BMR Code Violation Revenues Interest Income Miscellaneous Reimbursement
TOTAL CURRENT RESOURCES
TOTAL AVAILABLE RESOURCES
CURRENT REQUIREMENTS: Operations Special Projects
Transfer to Housing Mitigation Subfund Future Projects General Fund In-Lieu
TOTAL CURRENT REQUIREMENTS
RESERVES: BMR Reserve
TOTAL RESERVES FUND BALANCE, JUNE 30
FY 2027/2028 FY 2016/2017TO TO
PLAN PLAN PLAN PLAN PLAN PLAN PLAN PLAN PLAN PLAN FY 2036/2037 FY 2036/20372027/2028 2028/2029 2029/2030 2030/2031 2031/2032 2032/2033 2033/2034 2034/2035 2035/2036 2036/2037 TOTAL TOTAL
--------------------- --------------------- --------------------- --------------------- --------------------- --------------------- --------------------- --------------------- --------------------- --------------------- ---------------------- ----------------------1,005,249 1,093,438 1,182,533 1,272,506 1,363,235 1,454,712 1,546,842 1,639,642 1,739,282 1,846,267 1,005,249 4,447,746
--------------------- --------------------- --------------------- --------------------- --------------------- --------------------- --------------------- --------------------- --------------------- --------------------- ---------------------- ----------------------
479,336 493,716 508,528 523,784 539,497 555,682 572,353 589,523 607,209 625,425 5,495,053 10,349,02944,229 45,555 46,922 48,330 49,780 51,273 52,811 54,395 56,027 57,708 507,030 935,685
139,074 139,074 139,074 139,074 139,074 139,074 139,074 139,074 139,074 139,074 1,390,737 2,920,5480 0 0 0 0 0 0 0 0 0 0 0
42,055 45,482 48,943 52,432 55,950 59,494 63,063 66,895 71,010 75,424 580,748 809,1620 0 0 0 0 0 0 0 0 0 0 0
--------------------- --------------------- --------------------- --------------------- --------------------- --------------------- --------------------- --------------------- --------------------- --------------------- ---------------------- ----------------------704,693 723,827 743,467 763,619 784,300 805,523 827,300 849,887 873,320 897,631 7,973,569 15,014,425
--------------------- --------------------- --------------------- --------------------- --------------------- --------------------- --------------------- --------------------- --------------------- --------------------- ---------------------- ----------------------1,709,942 1,817,265 1,926,000 2,036,125 2,147,535 2,260,235 2,374,142 2,489,529 2,612,602 2,743,898 8,978,818 19,462,171
--------------------- --------------------- --------------------- --------------------- --------------------- --------------------- --------------------- --------------------- --------------------- --------------------- ---------------------- ----------------------
569,900 587,000 604,600 622,800 641,500 660,800 680,600 695,000 709,700 724,800 6,496,700 11,882,98410,000 10,000 10,000 10,000 10,000 10,000 10,000 10,000 10,000 10,000 100,000 613,000
0 0 0 0 0 0 0 0 0 0 0 2,730,0000 0 0 0 0 0 0 0 0 0 0 1,500,000
36,604 37,732 38,894 40,090 41,323 42,593 43,900 45,247 46,635 48,064 421,080 775,148--------------------- --------------------- --------------------- --------------------- --------------------- --------------------- --------------------- --------------------- --------------------- --------------------- ---------------------- ----------------------
616,504 634,732 653,494 672,890 692,823 713,393 734,500 750,247 766,335 782,864 7,017,780 17,501,132--------------------- --------------------- --------------------- --------------------- --------------------- --------------------- --------------------- --------------------- --------------------- --------------------- ---------------------- ----------------------
1,093,438 1,182,533 1,272,506 1,363,235 1,454,712 1,546,842 1,639,642 1,739,282 1,846,267 1,961,034 1,961,038 1,961,039--------------------- --------------------- --------------------- --------------------- --------------------- --------------------- --------------------- --------------------- --------------------- --------------------- ---------------------- ----------------------
1,093,438 1,182,533 1,272,506 1,363,235 1,454,712 1,546,842 1,639,642 1,739,282 1,846,267 1,961,034 1,961,038 1,961,039--------------------- --------------------- --------------------- --------------------- --------------------- --------------------- --------------------- --------------------- --------------------- --------------------- ---------------------- ----------------------
0 0 0 0 0 0 0 0 0 0 0 0============ ============ ============ ============ ============ ============ ============ ============ ============ ============ ============= =============
070/200. HOUSING FUND/BELOW MARKET RATE (BMR) HOUSING SUB-FUND
JULY 1, 2027 TO JUNE 30, 2037LONG TERM FINANCIAL PLAN
CITY OF SUNNYVALE
164

RESERVE/FUND BALANCE, JULY 1
CURRENT RESOURCES:Interest Income
TOTAL CURRENT RESOURCES
TOTAL AVAILABLE RESOURCES
CURRENT REQUIREMENTS: Operations Special Projects Transfer to Redevelopment Housing Fund
TOTAL CURRENT REQUIREMENTS
RESERVES: 20 Year RAP
TOTAL RESERVES FUND BALANCE, JUNE 30
FY 2016/2017TO
ACTUAL CURRENT BUDGET PLAN PLAN PLAN PLAN PLAN PLAN PLAN PLAN PLAN FY 2026/20272015/2016 2016/2017 2017/2018 2018/2019 2019/2020 2020/2021 2021/2022 2022/2023 2023/2024 2024/2025 2025/2026 2026/2027 TOTAL
--------------------- --------------------- --------------------- --------------------- --------------------- --------------------- ---------------------------------------------------------------- --------------------- --------------------- --------------------- ----------------------440,070 244,503 0 0 0 0 0 0 0 0 0 0 244,503
--------------------- --------------------- --------------------- --------------------- --------------------- --------------------- --------------------- --------------------- --------------------- --------------------- --------------------- --------------------- -----------------------
3,316 0 0 0 0 0 0 0 0 0 0 0 0--------------------- --------------------- --------------------- --------------------- --------------------- --------------------- --------------------- --------------------- --------------------- --------------------- --------------------- --------------------- -----------------------
3,316 0 0 0 0 0 0 0 0 0 0 0 0--------------------- --------------------- --------------------- --------------------- --------------------- --------------------- --------------------- --------------------- --------------------- --------------------- --------------------- --------------------- -----------------------
443,386 244,503 0 0 0 0 0 0 0 0 0 0 244,503--------------------- --------------------- --------------------- --------------------- --------------------- --------------------- --------------------- --------------------- --------------------- --------------------- --------------------- --------------------- -----------------------
8,752 0 0 0 0 0 0 0 0 0 0 0 0190,131 0 0 0 0 0 0 0 0 0 0 0 0
0 244,503 0 0 0 0 0 0 0 0 0 0 244,503--------------------- --------------------- --------------------- --------------------- --------------------- --------------------- --------------------- --------------------- --------------------- --------------------- --------------------- --------------------- -----------------------
198,883 244,503 0 0 0 0 0 0 0 0 0 0 244,503--------------------- --------------------- --------------------- --------------------- --------------------- --------------------- --------------------- --------------------- --------------------- --------------------- --------------------- --------------------- -----------------------
244,503 0 0 0 0 0 0 0 0 0 0 0 0--------------------- --------------------- --------------------- --------------------- --------------------- --------------------- --------------------- --------------------- --------------------- --------------------- --------------------- --------------------- -----------------------
244,503 0 0 0 0 0 0 0 0 0 0 0 0--------------------- --------------------- --------------------- --------------------- --------------------- --------------------- --------------------- --------------------- --------------------- --------------------- --------------------- --------------------- -----------------------
0 0 0 0 0 0 0 0 0 0 0 0 0============ ============ ============ ============ ============ ============ ============ ============ ============ ============ ============ ============ =============
JULY 1, 2016 TO JUNE 30, 2027LONG TERM FINANCIAL PLAN
070/400. REDEVELOPMENT HOUSING SUB-FUNDCITY OF SUNNYVALE
165

This Page Intentionally Blank
166

RESERVE/FUND BALANCE, JULY 1
CURRENT RESOURCES: HOME Grant Allocations: HUD Program Year 2010 HUD Program Year 2011 HUD Program Year 2012 HUD Program Year 2013 HUD Program Year 2014 HUD Program Year 2015 HUD Program Year 2016 HUD Program Year 2017 Future HUD Allocations Transfer From CDBG Housing Loan Repayments Interest Income
TOTAL CURRENT RESOURCES
TOTAL AVAILABLE RESOURCES
CURRENT REQUIREMENTS: Operations In-Lieu Charges Special Projects Future HOME/Housing Projects
TOTAL CURRENT REQUIREMENTS
RESERVES: HOME Reserve
TOTAL RESERVES FUND BALANCE, JUNE 30
FY 2016/2017TO
ACTUAL CURRENT BUDGET PLAN PLAN PLAN PLAN PLAN PLAN PLAN PLAN PLAN FY 2026/20272015/2016 2016/2017 2017/2018 2018/2019 2019/2020 2020/2021 2021/2022 2022/2023 2023/2024 2024/2025 2025/2026 2026/2027 TOTAL
--------------------- --------------------- --------------------- --------------------- --------------------- --------------------- --------------------- --------------------- --------------------- --------------------- --------------------- --------------------- ----------------------322,592 573,038 453,240 205,663 0 0 0 0 0 0 0 0 573,038
--------------------- --------------------- --------------------- --------------------- --------------------- --------------------- --------------------- --------------------- --------------------- --------------------- --------------------- --------------------- ----------------------
0 234,423 0 0 0 0 0 0 0 0 0 0 234,4230 349,653 0 0 0 0 0 0 0 0 0 0 349,6530 240,426 0 0 0 0 0 0 0 0 0 0 240,4260 236,560 0 0 0 0 0 0 0 0 0 0 236,560
46,364 231,992 0 0 0 0 0 0 0 0 0 0 231,99266,738 0 0 0 0 0 0 0 0 0 0 0 0
0 307,196 0 0 0 0 0 0 0 0 0 0 307,1960 0 300,000 0 0 0 0 0 0 0 0 0 300,0000 0 0 300,000 300,000 300,000 300,000 300,000 300,000 300,000 300,000 300,000 2,700,0000 600,000 0 0 0 0 0 0 0 0 0 0 600,000
528,558 82,356 0 0 0 0 0 0 0 1,994,593 0 0 2,076,9494,560 5,106 4,093 0 0 0 0 0 0 0 0 0 9,199
--------------------- --------------------- --------------------- --------------------- --------------------- --------------------- --------------------- --------------------- --------------------- --------------------- --------------------- --------------------- ----------------------646,220 2,287,711 304,093 300,000 300,000 300,000 300,000 300,000 300,000 2,294,593 300,000 300,000 7,286,397
--------------------- --------------------- --------------------- --------------------- --------------------- --------------------- --------------------- --------------------- --------------------- --------------------- --------------------- --------------------- ----------------------968,812 2,860,749 757,333 505,663 300,000 300,000 300,000 300,000 300,000 2,294,593 300,000 300,000 7,859,435
--------------------- --------------------- --------------------- --------------------- --------------------- --------------------- --------------------- --------------------- --------------------- --------------------- --------------------- --------------------- ----------------------
86,226 100,115 103,988 103,988 103,988 103,988 103,988 103,988 103,988 103,988 103,988 103,988 1,139,9931,995 8,049 6,461 6,461 6,461 6,461 6,461 6,461 6,461 6,461 6,461 6,461 72,664
307,554 2,299,345 441,221 0 0 0 0 0 0 0 0 0 2,740,5660 0 0 395,214 189,551 189,551 189,551 189,551 189,551 2,184,144 189,551 189,551 3,906,212
--------------------- --------------------- --------------------- --------------------- --------------------- --------------------- --------------------- --------------------- --------------------- --------------------- --------------------- --------------------- ----------------------395,774 2,407,509 551,670 505,663 300,000 300,000 300,000 300,000 300,000 2,294,593 300,000 300,000 7,859,435
--------------------- --------------------- --------------------- --------------------- --------------------- --------------------- --------------------- --------------------- --------------------- --------------------- --------------------- --------------------- ----------------------
573,038 453,240 205,663 0 0 0 0 0 0 0 0 0 0--------------------- --------------------- --------------------- --------------------- --------------------- --------------------- --------------------- --------------------- --------------------- --------------------- --------------------- --------------------- ----------------------
573,038 453,240 205,663 0 0 0 0 0 0 0 0 0 0--------------------- --------------------- --------------------- --------------------- --------------------- --------------------- --------------------- --------------------- --------------------- --------------------- --------------------- --------------------- ----------------------
0 0 0 0 0 0 0 0 0 0 0 0 0============ ============ ============ ============ ============ ============ ============ ============ ============ ============ ============ ============ =============
JULY 1, 2016 TO JUNE 30, 2027LONG TERM FINANCIAL PLAN
071. HOME GRANT FUNDCITY OF SUNNYVALE
167

RESERVE/FUND BALANCE, JULY 1
CURRENT RESOURCES: HOME Grant Allocations: HUD Program Year 2010 HUD Program Year 2011 HUD Program Year 2012 HUD Program Year 2013 HUD Program Year 2014 HUD Program Year 2015 HUD Program Year 2016 HUD Program Year 2017 Future HUD Allocations Transfer From CDBG Housing Loan Repayments Interest Income
TOTAL CURRENT RESOURCES
TOTAL AVAILABLE RESOURCES
CURRENT REQUIREMENTS: Operations In-Lieu Charges Special Projects Future HOME/Housing Projects
TOTAL CURRENT REQUIREMENTS
RESERVES: HOME Reserve
TOTAL RESERVES FUND BALANCE, JUNE 30
FY 2027/2028 FY 2016/2017TO TO
PLAN PLAN PLAN PLAN PLAN PLAN PLAN PLAN PLAN PLAN FY 2036/2037 FY 2036/20372027/2028 2028/2029 2029/2030 2030/2031 2031/2032 2032/2033 2033/2034 2034/2035 2035/2036 2036/2037 TOTAL TOTAL
--------------------- --------------------- --------------------- --------------------- --------------------- --------------------- --------------------- --------------------- --------------------- --------------------- ---------------------- ----------------------0 0 0 0 0 0 0 0 0 0 0 573,038
--------------------- --------------------- --------------------- --------------------- --------------------- --------------------- --------------------- --------------------- --------------------- --------------------- ---------------------- ----------------------
0 0 0 0 0 0 0 0 0 0 0 234,4230 0 0 0 0 0 0 0 0 0 0 349,6530 0 0 0 0 0 0 0 0 0 0 240,4260 0 0 0 0 0 0 0 0 0 0 236,5600 0 0 0 0 0 0 0 0 0 0 231,9920 0 0 0 0 0 0 0 0 0 0 00 0 0 0 0 0 0 0 0 0 0 307,1960 0 0 0 0 0 0 0 0 0 0 300,000
300,000 300,000 300,000 300,000 300,000 300,000 300,000 300,000 300,000 300,000 3,000,000 5,700,0000 0 0 0 0 0 0 0 0 0 0 600,0000 0 0 3,288,050 532,000 462,500 0 0 0 0 4,282,550 6,359,4990 0 0 0 0 0 0 0 0 0 0 9,199
--------------------- --------------------- --------------------- --------------------- --------------------- --------------------- --------------------- --------------------- --------------------- --------------------- ---------------------- ----------------------300,000 300,000 300,000 3,588,050 832,000 762,500 300,000 300,000 300,000 300,000 7,282,550 14,568,947
--------------------- --------------------- --------------------- --------------------- --------------------- --------------------- --------------------- --------------------- --------------------- --------------------- ---------------------- ----------------------300,000 300,000 300,000 3,588,050 832,000 762,500 300,000 300,000 300,000 300,000 7,282,550 15,141,985
--------------------- --------------------- --------------------- --------------------- --------------------- --------------------- --------------------- --------------------- --------------------- --------------------- ---------------------- ----------------------
103,988 103,988 103,988 103,988 103,988 103,988 103,988 103,988 103,988 103,988 1,039,878 2,179,8716,461 6,461 6,461 6,461 6,461 6,461 6,461 6,461 6,461 6,461 64,615 137,279
0 0 0 0 0 0 0 0 0 0 0 2,740,566189,551 189,551 189,551 3,477,601 721,551 652,051 189,551 189,551 189,551 189,551 6,178,057 10,084,269
--------------------- --------------------- --------------------- --------------------- --------------------- --------------------- --------------------- --------------------- --------------------- --------------------- ---------------------- ----------------------300,000 300,000 300,000 3,588,050 832,000 762,500 300,000 300,000 300,000 300,000 7,282,550 15,141,984
--------------------- --------------------- --------------------- --------------------- --------------------- --------------------- --------------------- --------------------- --------------------- --------------------- ---------------------- ----------------------
0 0 0 0 0 0 0 0 0 0 0 0--------------------- --------------------- --------------------- --------------------- --------------------- --------------------- --------------------- --------------------- --------------------- --------------------- ---------------------- ----------------------
0 0 0 0 0 0 0 0 0 0 0 0--------------------- --------------------- --------------------- --------------------- --------------------- --------------------- --------------------- --------------------- --------------------- --------------------- ---------------------- ----------------------
0 0 0 0 0 0 0 0 0 0 0 0============ ============ ============ ============ ============ ============ ============ ============ ============ ============ ============= =============
JULY 1, 2027 TO JUNE 30, 2037LONG TERM FINANCIAL PLAN
071. HOME GRANT FUNDCITY OF SUNNYVALE
168

RESERVE/FUND BALANCE, JULY 1
CURRENT RESOURCES:Revenue From Other AgencyInterest IncomeTransfer From Housing Fund
TOTAL CURRENT RESOURCES
TOTAL AVAILABLE RESOURCES
CURRENT REQUIREMENTS: Operations Special Projects
Transfer To Housing Fund Future Projects General Fund In Lieu
TOTAL CURRENT REQUIREMENTS
RESERVES: 20 Year RAP
TOTAL RESERVES FUND BALANCE, JUNE 30
FY 2016/2017TO
ACTUAL CURRENT BUDGET PLAN PLAN PLAN PLAN PLAN PLAN PLAN PLAN PLAN FY 2026/20272015/2016 2016/2017 2017/2018 2018/2019 2019/2020 2020/2021 2021/2022 2022/2023 2023/2024 2024/2025 2025/2026 2026/2027 TOTAL
--------------------- --------------------- --------------------- --------------------- --------------------- --------------------- ---------------------------------------------------------------- --------------------- --------------------- --------------------- ----------------------0 0 1,048,097 1,725,398 2,928,920 4,465,843 6,470,482 8,702,875 7,899,499 6,817,096 5,954,794 4,811,593 0
--------------------- --------------------- --------------------- --------------------- --------------------- --------------------- --------------------- --------------------- --------------------- --------------------- --------------------- --------------------- ----------------------
0 1,149,558 1,941,611 2,188,773 2,759,271 2,889,636 3,305,830 0 0 0 0 0 14,234,6790 3,998 29,286 59,358 73,215 161,621 224,237 245,355 217,487 188,747 159,109 128,538 1,490,9510 244,503 0 0 0 0 0 0 0 0 0 0 244,503
--------------------- --------------------- --------------------- --------------------- --------------------- --------------------- --------------------- --------------------- --------------------- --------------------- --------------------- --------------------- ----------------------0 1,398,059 1,970,897 2,248,131 2,832,486 3,051,257 3,530,067 245,355 217,487 188,747 159,109 128,538 15,970,133
--------------------- --------------------- --------------------- --------------------- --------------------- --------------------- --------------------- --------------------- --------------------- --------------------- --------------------- --------------------- ----------------------0 1,398,059 3,018,994 3,973,529 5,761,406 7,517,100 10,000,549 8,948,230 8,116,986 7,005,843 6,113,903 4,940,131 15,970,133
--------------------- --------------------- --------------------- --------------------- --------------------- --------------------- --------------------- --------------------- --------------------- --------------------- --------------------- --------------------- ----------------------
0 40,093 41,040 42,000 42,900 43,900 44,900 45,900 47,000 48,100 49,300 50,900 496,0320 309,869 250,000 0 250,000 0 250,000 0 250,000 0 250,000 0 1,559,8690 0 1,000,000 0 0 0 0 0 0 0 0 0 1,000,0000 0 0 1,000,000 1,000,000 1,000,000 1,000,000 1,000,000 1,000,000 1,000,000 1,000,000 1,000,000 9,000,0000 0 2,556 2,609 2,663 2,718 2,774 2,831 2,890 2,949 3,010 3,072 28,073
--------------------- --------------------- --------------------- --------------------- --------------------- --------------------- --------------------- --------------------- --------------------- --------------------- --------------------- --------------------- ----------------------0 349,962 1,293,596 1,044,609 1,295,563 1,046,618 1,297,674 1,048,731 1,299,890 1,051,049 1,302,310 1,053,972 12,083,974
--------------------- --------------------- --------------------- --------------------- --------------------- --------------------- --------------------- --------------------- --------------------- --------------------- --------------------- --------------------- ----------------------
0 1,048,097 1,725,398 2,928,920 4,465,843 6,470,482 8,702,875 7,899,499 6,817,096 5,954,794 4,811,593 3,886,159 3,886,159--------------------- --------------------- --------------------- --------------------- --------------------- --------------------- --------------------- --------------------- --------------------- --------------------- --------------------- --------------------- ----------------------
0 1,048,097 1,725,398 2,928,920 4,465,843 6,470,482 8,702,875 7,899,499 6,817,096 5,954,794 4,811,593 3,886,159 3,886,159--------------------- --------------------- --------------------- --------------------- --------------------- --------------------- --------------------- --------------------- --------------------- --------------------- --------------------- --------------------- ----------------------
0 0 0 0 0 0 0 0 0 0 0 0 0============ ============ ============ ============ ============ ============ ============ ============ ============ ============ ============ ============ =============
JULY 1, 2016 TO JUNE 30, 2027
CITY OF SUNNYVALE072. REDEVELOPMENT HOUSING FUND
LONG TERM FINANCIAL PLAN
169

RESERVE/FUND BALANCE, JULY 1
CURRENT RESOURCES:Revenue From Other AgencyInterest IncomeTransfer From Housing Fund
TOTAL CURRENT RESOURCES
TOTAL AVAILABLE RESOURCES
CURRENT REQUIREMENTS: Operations Special Projects
Transfer To Housing Fund Future Projects General Fund In Lieu
TOTAL CURRENT REQUIREMENTS
RESERVES: 20 Year RAP
TOTAL RESERVES FUND BALANCE, JUNE 30
FY 2027/2028 FY 2016/2017TO TO
PLAN PLAN PLAN PLAN PLAN PLAN PLAN PLAN PLAN PLAN FY 2036/2037 FY 2036/20372027/2028 2028/2029 2029/2030 2030/2031 2031/2032 2032/2033 2033/2034 2034/2035 2035/2036 2036/2037 TOTAL TOTAL
--------------------- --------------------- --------------------- --------------------- --------------------- --------------------- -------------------------------------------------------------------------------------- ---------------------- ----------------------3,886,159 2,965,131 2,005,531 1,005,812 474,265 327,511 274,939 218,313 157,773 93,159 3,886,159 0
--------------------- --------------------- --------------------- --------------------- --------------------- --------------------- --------------------- --------------------- --------------------- --------------------- ---------------------- -----------------------
0 0 0 0 0 0 0 0 0 0 0 14,234,679134,339 97,464 59,046 29,021 15,721 11,813 9,672 7,374 4,920 2,299 371,669 1,862,620
0 0 0 0 0 0 0 0 0 0 0 244,503--------------------- --------------------- --------------------- --------------------- --------------------- --------------------- --------------------- --------------------- --------------------- --------------------- ---------------------- -----------------------
134,339 97,464 59,046 29,021 15,721 11,813 9,672 7,374 4,920 2,299 371,669 16,341,802--------------------- --------------------- --------------------- --------------------- --------------------- --------------------- --------------------- --------------------- --------------------- --------------------- ---------------------- -----------------------
4,020,498 3,062,595 2,064,577 1,034,833 489,986 339,324 284,611 225,687 162,693 95,458 4,257,828 16,341,802--------------------- --------------------- --------------------- --------------------- --------------------- --------------------- --------------------- --------------------- --------------------- --------------------- ---------------------- -----------------------
52,200 53,800 55,400 57,100 58,900 60,700 62,500 64,000 65,500 67,200 597,300 1,093,3320 0 0 0 0 0 0 0 0 0 0 1,559,8690 0 0 0 0 0 0 0 0 0 0 1,000,000
1,000,000 1,000,000 1,000,000 500,000 100,000 0 0 0 0 0 3,600,000 12,600,0003,167 3,264 3,365 3,468 3,575 3,685 3,798 3,914 4,034 4,158 36,428 64,501
--------------------- --------------------- --------------------- --------------------- --------------------- --------------------- --------------------- --------------------- --------------------- --------------------- ---------------------- -----------------------1,055,367 1,057,064 1,058,765 560,568 162,475 64,385 66,298 67,914 69,534 71,358 4,233,728 16,317,702
--------------------- --------------------- --------------------- --------------------- --------------------- --------------------- --------------------- --------------------- --------------------- --------------------- ---------------------- -----------------------
2,965,131 2,005,531 1,005,812 474,265 327,511 274,939 218,313 157,773 93,159 24,100 24,100 24,100--------------------- --------------------- --------------------- --------------------- --------------------- --------------------- --------------------- --------------------- --------------------- --------------------- ---------------------- -----------------------
2,965,131 2,005,531 1,005,812 474,265 327,511 274,939 218,313 157,773 93,159 24,100 24,100 24,100--------------------- --------------------- --------------------- --------------------- --------------------- --------------------- --------------------- --------------------- --------------------- --------------------- ---------------------- -----------------------
0 0 0 0 0 0 0 0 0 0 0 0============ ============ ============ ============ ============ ============ ============ ============ ============ ============ ============= ==============
JULY 1, 2027 TO JUNE 30, 2037
CITY OF SUNNYVALE072. REDEVELOPMENT HOUSING FUND
LONG TERM FINANCIAL PLAN
170
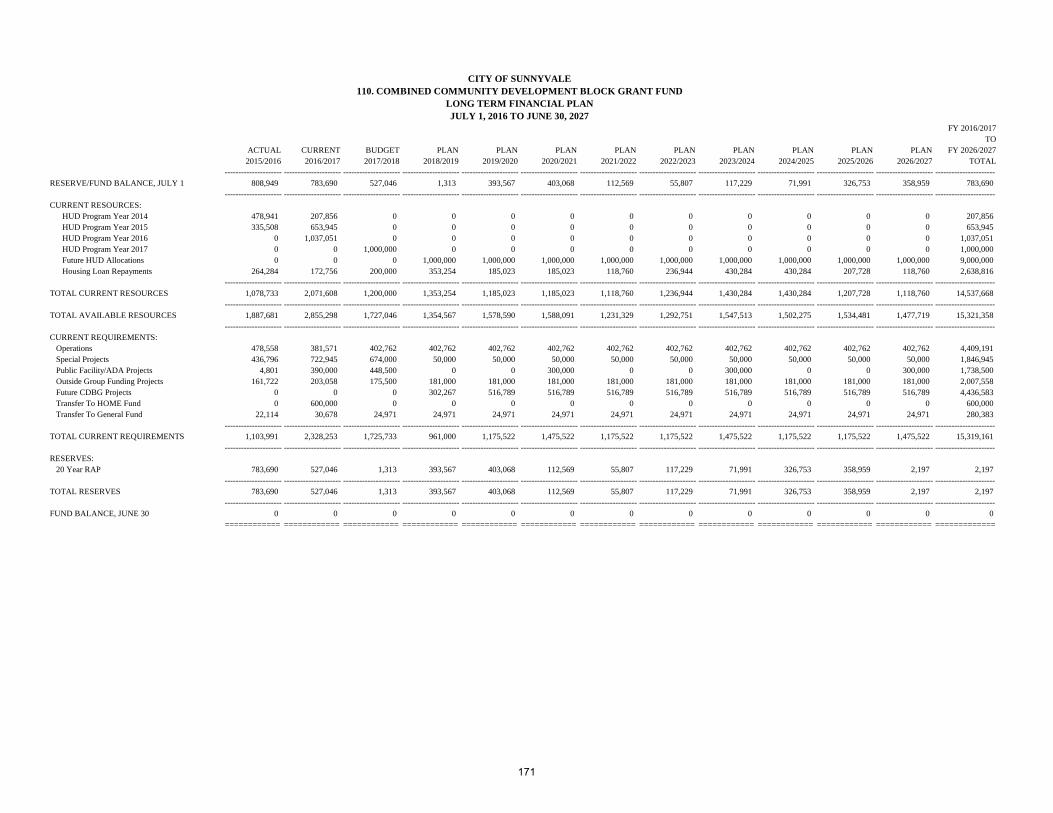
RESERVE/FUND BALANCE, JULY 1
CURRENT RESOURCES: HUD Program Year 2014 HUD Program Year 2015 HUD Program Year 2016 HUD Program Year 2017 Future HUD Allocations Housing Loan Repayments
TOTAL CURRENT RESOURCES
TOTAL AVAILABLE RESOURCES
CURRENT REQUIREMENTS: Operations Special Projects Public Facility/ADA Projects Outside Group Funding Projects Future CDBG Projects Transfer To HOME Fund Transfer To General Fund
TOTAL CURRENT REQUIREMENTS
RESERVES: 20 Year RAP
TOTAL RESERVES FUND BALANCE, JUNE 30
FY 2016/2017TO
ACTUAL CURRENT BUDGET PLAN PLAN PLAN PLAN PLAN PLAN PLAN PLAN PLAN FY 2026/20272015/2016 2016/2017 2017/2018 2018/2019 2019/2020 2020/2021 2021/2022 2022/2023 2023/2024 2024/2025 2025/2026 2026/2027 TOTAL
--------------------- --------------------- --------------------- --------------------- --------------------- --------------------- --------------------- --------------------- --------------------- --------------------- --------------------- --------------------- ----------------------808,949 783,690 527,046 1,313 393,567 403,068 112,569 55,807 117,229 71,991 326,753 358,959 783,690
--------------------- --------------------- --------------------- --------------------- --------------------- --------------------- --------------------- --------------------- --------------------- --------------------- --------------------- --------------------- ----------------------
478,941 207,856 0 0 0 0 0 0 0 0 0 0 207,856335,508 653,945 0 0 0 0 0 0 0 0 0 0 653,945
0 1,037,051 0 0 0 0 0 0 0 0 0 0 1,037,0510 0 1,000,000 0 0 0 0 0 0 0 0 0 1,000,0000 0 0 1,000,000 1,000,000 1,000,000 1,000,000 1,000,000 1,000,000 1,000,000 1,000,000 1,000,000 9,000,000
264,284 172,756 200,000 353,254 185,023 185,023 118,760 236,944 430,284 430,284 207,728 118,760 2,638,816--------------------- --------------------- --------------------- --------------------- --------------------- --------------------- --------------------- --------------------- --------------------- --------------------- --------------------- --------------------- ----------------------
1,078,733 2,071,608 1,200,000 1,353,254 1,185,023 1,185,023 1,118,760 1,236,944 1,430,284 1,430,284 1,207,728 1,118,760 14,537,668--------------------- --------------------- --------------------- --------------------- --------------------- --------------------- --------------------- --------------------- --------------------- --------------------- --------------------- --------------------- ----------------------
1,887,681 2,855,298 1,727,046 1,354,567 1,578,590 1,588,091 1,231,329 1,292,751 1,547,513 1,502,275 1,534,481 1,477,719 15,321,358--------------------- --------------------- --------------------- --------------------- --------------------- --------------------- --------------------- --------------------- --------------------- --------------------- --------------------- --------------------- ----------------------
478,558 381,571 402,762 402,762 402,762 402,762 402,762 402,762 402,762 402,762 402,762 402,762 4,409,191436,796 722,945 674,000 50,000 50,000 50,000 50,000 50,000 50,000 50,000 50,000 50,000 1,846,945
4,801 390,000 448,500 0 0 300,000 0 0 300,000 0 0 300,000 1,738,500161,722 203,058 175,500 181,000 181,000 181,000 181,000 181,000 181,000 181,000 181,000 181,000 2,007,558
0 0 0 302,267 516,789 516,789 516,789 516,789 516,789 516,789 516,789 516,789 4,436,5830 600,000 0 0 0 0 0 0 0 0 0 0 600,000
22,114 30,678 24,971 24,971 24,971 24,971 24,971 24,971 24,971 24,971 24,971 24,971 280,383--------------------- --------------------- --------------------- --------------------- --------------------- --------------------- --------------------- --------------------- --------------------- --------------------- --------------------- --------------------- ----------------------
1,103,991 2,328,253 1,725,733 961,000 1,175,522 1,475,522 1,175,522 1,175,522 1,475,522 1,175,522 1,175,522 1,475,522 15,319,161--------------------- --------------------- --------------------- --------------------- --------------------- --------------------- --------------------- --------------------- --------------------- --------------------- --------------------- --------------------- ----------------------
783,690 527,046 1,313 393,567 403,068 112,569 55,807 117,229 71,991 326,753 358,959 2,197 2,197--------------------- --------------------- --------------------- --------------------- --------------------- --------------------- --------------------- --------------------- --------------------- --------------------- --------------------- --------------------- ----------------------
783,690 527,046 1,313 393,567 403,068 112,569 55,807 117,229 71,991 326,753 358,959 2,197 2,197--------------------- --------------------- --------------------- --------------------- --------------------- --------------------- --------------------- --------------------- --------------------- --------------------- --------------------- --------------------- ----------------------
0 0 0 0 0 0 0 0 0 0 0 0 0============ ============ ============ ============ ============ ============ ============ ============ ============ ============ ============ ============ =============
JULY 1, 2016 TO JUNE 30, 2027LONG TERM FINANCIAL PLAN
CITY OF SUNNYVALE110. COMBINED COMMUNITY DEVELOPMENT BLOCK GRANT FUND
171

RESERVE/FUND BALANCE, JULY 1
CURRENT RESOURCES: HUD Program Year 2014 HUD Program Year 2015 HUD Program Year 2016 HUD Program Year 2017 Future HUD Allocations Housing Loan Repayments
TOTAL CURRENT RESOURCES
TOTAL AVAILABLE RESOURCES
CURRENT REQUIREMENTS: Operations Special Projects Public Facility/ADA Projects Outside Group Funding Projects Future CDBG Projects Transfer To HOME Fund Transfer To General Fund
TOTAL CURRENT REQUIREMENTS
RESERVES: 20 Year RAP
TOTAL RESERVES FUND BALANCE, JUNE 30
FY 2027/2028 FY 2016/2017TO TO
PLAN PLAN PLAN PLAN PLAN PLAN PLAN PLAN PLAN PLAN FY 2036/2037 FY 2036/20372027/2028 2028/2029 2029/2030 2030/2031 2031/2032 2032/2033 2033/2034 2034/2035 2035/2036 2036/2037 TOTAL TOTAL
--------------------- --------------------- --------------------- --------------------- --------------------- --------------------- --------------------- --------------------- --------------------- --------------------- ---------------------- ----------------------2,197 443,655 703,123 601,692 512,119 425,125 340,786 259,183 180,397 104,514 2,197 783,690
--------------------- --------------------- --------------------- --------------------- --------------------- --------------------- --------------------- --------------------- --------------------- --------------------- ---------------------- ----------------------
0 0 0 0 0 0 0 0 0 0 0 207,8560 0 0 0 0 0 0 0 0 0 0 653,9450 0 0 0 0 0 0 0 0 0 0 1,037,0510 0 0 0 0 0 0 0 0 0 0 1,000,000
1,000,000 1,000,000 1,000,000 1,000,000 1,000,000 1,000,000 1,000,000 1,000,000 1,000,000 1,000,000 10,000,000 19,000,000616,980 434,990 374,091 85,949 88,527 91,183 93,919 96,736 99,638 102,628 2,084,642 4,723,458
--------------------- --------------------- --------------------- --------------------- --------------------- --------------------- --------------------- --------------------- --------------------- --------------------- ---------------------- ----------------------1,616,980 1,434,990 1,374,091 1,085,949 1,088,527 1,091,183 1,093,919 1,096,736 1,099,638 1,102,628 12,084,642 26,622,310
--------------------- --------------------- --------------------- --------------------- --------------------- --------------------- --------------------- --------------------- --------------------- --------------------- ---------------------- ----------------------1,619,177 1,878,645 2,077,214 1,687,641 1,600,647 1,516,308 1,434,705 1,355,919 1,280,036 1,207,141 12,086,839 27,406,000
--------------------- --------------------- --------------------- --------------------- --------------------- --------------------- --------------------- --------------------- --------------------- --------------------- ---------------------- ----------------------
402,762 402,762 402,762 402,762 402,762 402,762 402,762 402,762 402,762 402,762 4,027,620 8,436,81150,000 50,000 50,000 50,000 50,000 50,000 50,000 50,000 50,000 50,000 500,000 2,346,945
0 0 300,000 0 0 300,000 0 0 300,000 0 900,000 2,638,500181,000 181,000 181,000 181,000 181,000 181,000 181,000 181,000 181,000 181,000 1,810,000 3,817,558516,789 516,789 516,789 516,789 516,789 216,789 516,789 516,789 216,789 517,727 4,568,833 9,005,416
0 0 0 0 0 0 0 0 0 0 0 600,00024,971 24,971 24,971 24,971 24,971 24,971 24,971 24,971 24,971 24,971 249,705 530,088
--------------------- --------------------- --------------------- --------------------- --------------------- --------------------- --------------------- --------------------- --------------------- --------------------- ---------------------- ----------------------1,175,522 1,175,522 1,475,522 1,175,522 1,175,522 1,175,522 1,175,522 1,175,522 1,175,522 1,176,460 12,056,158 27,375,318
--------------------- --------------------- --------------------- --------------------- --------------------- --------------------- --------------------- --------------------- --------------------- --------------------- ---------------------- ----------------------
443,655 703,123 601,692 512,119 425,125 340,786 259,183 180,397 104,514 30,681 30,682 30,682--------------------- --------------------- --------------------- --------------------- --------------------- --------------------- --------------------- --------------------- --------------------- --------------------- ---------------------- ----------------------
443,655 703,123 601,692 512,119 425,125 340,786 259,183 180,397 104,514 30,681 30,682 30,682--------------------- --------------------- --------------------- --------------------- --------------------- --------------------- --------------------- --------------------- --------------------- --------------------- ---------------------- ----------------------
0 0 0 0 0 0 0 0 0 0 0 0============ ============ ============ ============ ============ ============ ============ ============ ============ ============ ============= =============
110. COMBINED COMMUNITY DEVELOPMENT BLOCK GRANT FUND
JULY 1, 2027 TO JUNE 30, 2037LONG TERM FINANCIAL PLAN
CITY OF SUNNYVALE
172

RESERVE/FUND BALANCE, JULY 1
CURRENT RESOURCES: Interest Income Land Sale Proceeds Park Dedication Fees
TOTAL CURRENT RESOURCES
TOTAL AVAILABLE RESOURCES
CURRENT REQUIREMENTS: New Acquisition Special Projects Project Administration Transfer To Capital Projects Fund Transfer To Infrastructure/General Transfer To Infrastructure/Golf and Tennis
TOTAL CURRENT REQUIREMENTS
RESERVES: Capital Projects Reserve Land Acquisition Set-Aside (20%)
TOTAL RESERVES
FUND BALANCE, JUNE 30
FY 2016/2017TO
ACTUAL CURRENT BUDGET PLAN PLAN PLAN PLAN PLAN PLAN PLAN PLAN PLAN FY 2026/20272015/2016 2016/2017 2017/2018 2018/2019 2019/2020 2020/2021 2021/2022 2022/2023 2023/2024 2024/2025 2025/2026 2026/2027 TOTAL
------------------ ------------------ ------------------ ------------------ ------------------ ------------------ ------------------ ------------------ ------------------ ------------------ ------------------ ------------------ --------------------25,030,734 46,933,069 41,425,423 35,197,331 35,050,623 28,730,097 32,944,242 32,139,598 32,761,386 33,030,524 3,674,548 6,940,272 46,933,069
------------------ ------------------ ------------------ ------------------ ------------------ ------------------ ------------------ ------------------ ------------------ ------------------ ------------------ ------------------ --------------------
362,919 457,392 440,607 611,296 572,980 973,867 950,431 991,977 958,270 107,026 202,144 282,689 6,548,679754,427 0 0 0 0 0 0 0 0 0 0 0 0
23,053,336 18,320,933 16,556,388 11,282,310 8,232,840 8,397,497 8,565,447 8,736,756 8,911,491 9,089,721 9,271,515 9,456,945 116,821,842------------------ ------------------ ------------------ ------------------ ------------------ ------------------ ------------------ ------------------ ------------------ ------------------ ------------------ ------------------ --------------------
24,170,682 18,778,325 16,996,995 11,893,606 8,805,820 9,371,364 9,515,878 9,728,733 9,869,761 9,196,747 9,473,659 9,739,634 123,370,521------------------ ------------------ ------------------ ------------------ ------------------ ------------------ ------------------ ------------------ ------------------ ------------------ ------------------ ------------------ --------------------
49,201,416 65,711,394 58,422,418 47,090,937 43,856,443 38,101,461 42,460,120 41,868,331 42,631,147 42,227,271 13,148,207 16,679,906 170,303,590------------------ ------------------ ------------------ ------------------ ------------------ ------------------ ------------------ ------------------ ------------------ ------------------ ------------------ ------------------ --------------------
0 0 0 0 0 0 0 0 0 25,000,000 0 0 25,000,000385 0 0 0 0 0 0 0 0 0 0 0 0
651,185 1,046,871 1,468,944 1,237,857 686,559 413,167 919,948 139,434 713,006 1,189,548 570,580 531,054 8,916,969494,780 1,132,308 5,825,740 1,329,637 2,164,864 0 0 0 0 0 0 0 10,452,549
1,048,558 21,031,745 15,740,963 6,964,163 11,896,868 3,108,050 9,400,574 8,774,120 8,391,921 12,363,174 5,637,355 6,443,206 109,752,13973,439 1,075,047 189,440 2,508,657 378,055 1,636,002 0 193,391 495,696 0 0 0 6,476,288
------------------ ------------------ ------------------ ------------------ ------------------ ------------------ ------------------ ------------------ ------------------ ------------------ ------------------ ------------------ --------------------2,268,347 24,285,971 23,225,087 12,040,314 15,126,346 5,157,219 10,320,522 9,106,945 9,600,623 38,552,722 6,207,935 6,974,260 160,597,945
------------------ ------------------ ------------------ ------------------ ------------------ ------------------ ------------------ ------------------ ------------------ ------------------ ------------------ ------------------ --------------------
37,508,339 28,336,507 18,797,137 16,706,087 10,903,857 13,438,503 10,920,769 9,795,206 8,282,046 2,108,126 3,519,547 6,247,835 6,247,8359,424,730 13,088,916 16,400,194 18,344,536 17,826,240 19,505,739 21,218,829 22,966,180 24,748,478 1,566,422 3,420,725 3,457,811 3,457,811
------------------ ------------------ ------------------ ------------------ ------------------ ------------------ ------------------ ------------------ ------------------ ------------------ ------------------ ------------------ --------------------46,933,069 41,425,423 35,197,331 35,050,623 28,730,097 32,944,242 32,139,598 32,761,386 33,030,524 3,674,548 6,940,272 9,705,646 9,705,646
------------------ ------------------ ------------------ ------------------ ------------------ ------------------ ------------------ ------------------ ------------------ ------------------ ------------------ ------------------ --------------------0 0 0 0 0 0 0 0 0 0 0 0 0
========== ========== ========== ========== ========== ========== ========== ========== ========== ========== ========== ========== ===========
CITY OF SUNNYVALE141. PARK DEDICATION FUNDLONG TERM FINANCIAL PLANJULY 1, 2016 TO JUNE 30, 2027
173
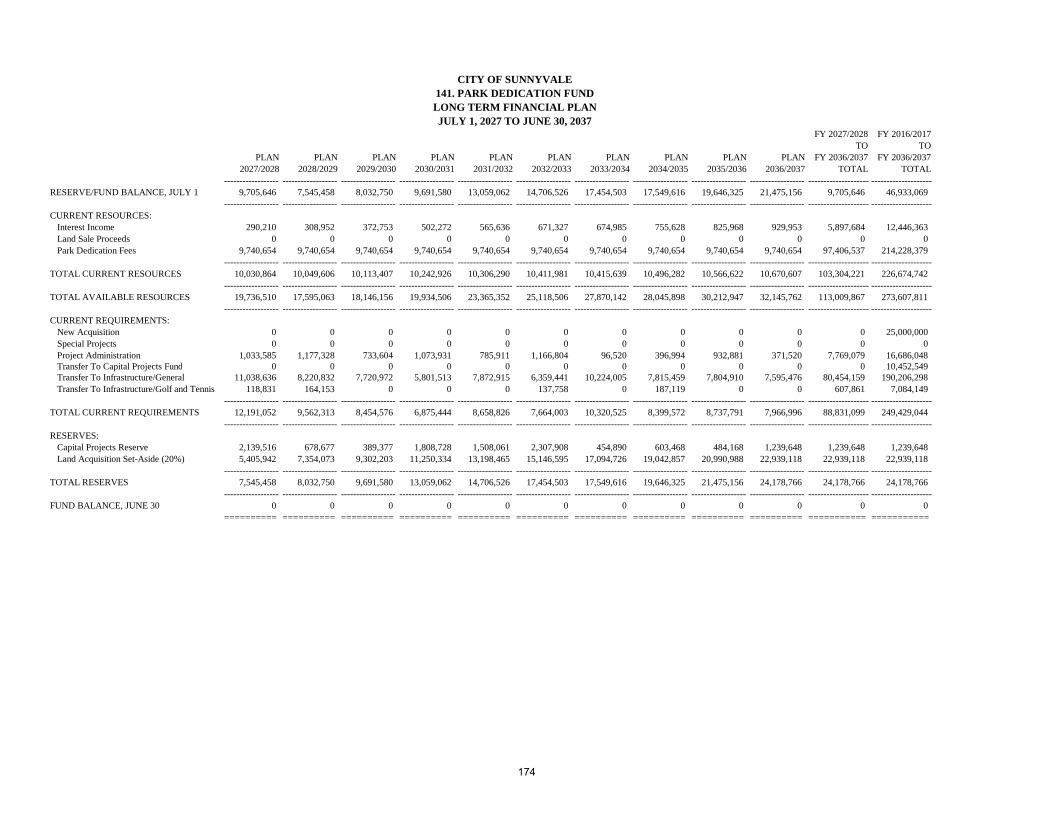
RESERVE/FUND BALANCE, JULY 1
CURRENT RESOURCES: Interest Income Land Sale Proceeds Park Dedication Fees
TOTAL CURRENT RESOURCES
TOTAL AVAILABLE RESOURCES
CURRENT REQUIREMENTS: New Acquisition Special Projects Project Administration Transfer To Capital Projects Fund Transfer To Infrastructure/General Transfer To Infrastructure/Golf and Tennis
TOTAL CURRENT REQUIREMENTS
RESERVES: Capital Projects Reserve Land Acquisition Set-Aside (20%)
TOTAL RESERVES
FUND BALANCE, JUNE 30
FY 2027/2028 FY 2016/2017TO TO
PLAN PLAN PLAN PLAN PLAN PLAN PLAN PLAN PLAN PLAN FY 2036/2037 FY 2036/20372027/2028 2028/2029 2029/2030 2030/2031 2031/2032 2032/2033 2033/2034 2034/2035 2035/2036 2036/2037 TOTAL TOTAL
------------------ ------------------ ------------------ ------------------ ------------------ ------------------ ------------------ ------------------ ------------------ ------------------ -------------------- --------------------9,705,646 7,545,458 8,032,750 9,691,580 13,059,062 14,706,526 17,454,503 17,549,616 19,646,325 21,475,156 9,705,646 46,933,069
------------------ ------------------ ------------------ ------------------ ------------------ ------------------ ------------------ ------------------ ------------------ ------------------ -------------------- --------------------
290,210 308,952 372,753 502,272 565,636 671,327 674,985 755,628 825,968 929,953 5,897,684 12,446,3630 0 0 0 0 0 0 0 0 0 0 0
9,740,654 9,740,654 9,740,654 9,740,654 9,740,654 9,740,654 9,740,654 9,740,654 9,740,654 9,740,654 97,406,537 214,228,379------------------ ------------------ ------------------ ------------------ ------------------ ------------------ ------------------ ------------------ ------------------ ------------------ -------------------- --------------------
10,030,864 10,049,606 10,113,407 10,242,926 10,306,290 10,411,981 10,415,639 10,496,282 10,566,622 10,670,607 103,304,221 226,674,742------------------ ------------------ ------------------ ------------------ ------------------ ------------------ ------------------ ------------------ ------------------ ------------------ -------------------- --------------------
19,736,510 17,595,063 18,146,156 19,934,506 23,365,352 25,118,506 27,870,142 28,045,898 30,212,947 32,145,762 113,009,867 273,607,811------------------ ------------------ ------------------ ------------------ ------------------ ------------------ ------------------ ------------------ ------------------ ------------------ -------------------- --------------------
0 0 0 0 0 0 0 0 0 0 0 25,000,0000 0 0 0 0 0 0 0 0 0 0 0
1,033,585 1,177,328 733,604 1,073,931 785,911 1,166,804 96,520 396,994 932,881 371,520 7,769,079 16,686,0480 0 0 0 0 0 0 0 0 0 0 10,452,549
11,038,636 8,220,832 7,720,972 5,801,513 7,872,915 6,359,441 10,224,005 7,815,459 7,804,910 7,595,476 80,454,159 190,206,298118,831 164,153 0 0 0 137,758 0 187,119 0 0 607,861 7,084,149
------------------ ------------------ ------------------ ------------------ ------------------ ------------------ ------------------ ------------------ ------------------ ------------------ -------------------- --------------------12,191,052 9,562,313 8,454,576 6,875,444 8,658,826 7,664,003 10,320,525 8,399,572 8,737,791 7,966,996 88,831,099 249,429,044
------------------ ------------------ ------------------ ------------------ ------------------ ------------------ ------------------ ------------------ ------------------ ------------------ -------------------- --------------------
2,139,516 678,677 389,377 1,808,728 1,508,061 2,307,908 454,890 603,468 484,168 1,239,648 1,239,648 1,239,6485,405,942 7,354,073 9,302,203 11,250,334 13,198,465 15,146,595 17,094,726 19,042,857 20,990,988 22,939,118 22,939,118 22,939,118
------------------ ------------------ ------------------ ------------------ ------------------ ------------------ ------------------ ------------------ ------------------ ------------------ -------------------- --------------------7,545,458 8,032,750 9,691,580 13,059,062 14,706,526 17,454,503 17,549,616 19,646,325 21,475,156 24,178,766 24,178,766 24,178,766
------------------ ------------------ ------------------ ------------------ ------------------ ------------------ ------------------ ------------------ ------------------ ------------------ -------------------- --------------------0 0 0 0 0 0 0 0 0 0 0 0
========== ========== ========== ========== ========== ========== ========== ========== ========== ========== =========== ===========
CITY OF SUNNYVALE141. PARK DEDICATION FUNDLONG TERM FINANCIAL PLANJULY 1, 2027 TO JUNE 30, 2037
174

RESERVES/FUND BALANCE, JULY 1
CURRENT RESOURCES: Asset Forfeiture Task Force Participation Interest Income
TOTAL CURRENT RESOURCES
TOTAL AVAILABLE RESOURCES
CURRENT REQUIREMENTS: Operations - Audit Capital Projects Transfer To General Fund TOTAL CURRENT REQUIREMENTS
RESERVES: Asset Forfeiture
TOTAL RESERVES
FUND BALANCE, JUNE 30
FY 2016/2017TO
ACTUAL CURRENT BUDGET PLAN PLAN PLAN PLAN PLAN PLAN PLAN PLAN PLAN FY 2026/20272015/2016 2016/2017 2017/2018 2018/2019 2019/2020 2020/2021 2021/2022 2022/2023 2023/2024 2024/2025 2025/2026 2026/2027 TOTAL
------------------ ------------------ ------------------ ------------------ ------------------ ------------------ ------------------ ------------------ ------------------ ------------------ ------------------ ------------------ --------------------625,301 463,875 325,794 32,539 0 0 0 0 0 0 0 0 463,875
------------------ ------------------ ------------------ ------------------ ------------------ ------------------ ------------------ ------------------ ------------------ ------------------ ------------------ ------------------ --------------------
52,803 10,491 0 0 0 0 0 0 0 0 0 0 10,4914,955 3,221 401 0 0 0 0 0 0 0 0 0 3,622
------------------ ------------------ ------------------ ------------------ ------------------ ------------------ ------------------ ------------------ ------------------ ------------------ ------------------ ------------------ --------------------57,759 13,712 401 0 0 0 0 0 0 0 0 0 14,113
------------------ ------------------ ------------------ ------------------ ------------------ ------------------ ------------------ ------------------ ------------------ ------------------ ------------------ ------------------ --------------------683,060 477,587 326,195 32,539 0 0 0 0 0 0 0 0 477,988
------------------ ------------------ ------------------ ------------------ ------------------ ------------------ ------------------ ------------------ ------------------ ------------------ ------------------ ------------------ --------------------
1,956 1,999 2,009 2,059 0 0 0 0 0 0 0 0 6,067117,082 44,639 181,235 30,480 0 0 0 0 0 0 0 0 256,354100,147 105,154 110,412 0 0 0 0 0 0 0 0 0 215,566
------------------ ------------------ ------------------ ------------------ ------------------ ------------------ ------------------ ------------------ ------------------ ------------------ ------------------ ------------------ --------------------219,185 151,792 293,656 32,539 0 0 0 0 0 0 0 0 477,987
------------------ ------------------ ------------------ ------------------ ------------------ ------------------ ------------------ ------------------ ------------------ ------------------ ------------------ ------------------ --------------------
463,875 325,794 32,539 0 0 0 0 0 0 0 0 0 0------------------ ------------------ ------------------ ------------------ ------------------ ------------------ ------------------ ------------------ ------------------ ------------------ ------------------ ------------------ --------------------
463,875 325,794 32,539 0 0 0 0 0 0 0 0 0 0------------------ ------------------ ------------------ ------------------ ------------------ ------------------ ------------------ ------------------ ------------------ ------------------ ------------------ ------------------ --------------------
0 0 0 0 0 0 0 0 0 0 0 0 0========== ========== ========== ========== ========== ========== ========== ========== ========== ========== ========== ========== ===========
JULY 1, 2016 TO JUNE 30, 2027LONG TERM FINANCIAL PLAN175. ASSET FORFEITURE FUND
CITY OF SUNNYVALE
175

This Page Intentionally Blank
176

RESERVES/FUND BALANCE, JULY 1
CURRENT RESOURCES: SLES Fund (AB3229) Interest Income
TOTAL CURRENT RESOURCES
TOTAL AVAILABLE RESOURCES
CURRENT REQUIREMENTS:OperationsSpecial Projects
TOTAL CURRENT REQUIREMENTS
RESERVES: 20 Year RAP
TOTAL RESERVES
FUND BALANCE, JUNE 30
FY 2016/2017TO
ACTUAL CURRENT BUDGET PLAN PLAN PLAN PLAN PLAN PLAN PLAN PLAN PLAN FY 2026/20272015/2016 2016/2017 2017/2018 2018/2019 2019/2020 2020/2021 2021/2022 2022/2023 2023/2024 2024/2025 2025/2026 2026/2027 TOTAL
------------------ ------------------ ------------------ ------------------ ------------------ ------------------ ------------------ ------------------ ------------------ ------------------ ------------------ ------------------ --------------------37,336 34,118 0 248 0 0 0 0 0 0 0 0 34,118
------------------ ------------------ ------------------ ------------------ ------------------ ------------------ ------------------ ------------------ ------------------ ------------------ ------------------ ------------------ --------------------
265,326 296,333 243,560 243,560 243,560 243,560 243,560 243,560 243,560 243,560 243,560 243,560 2,731,93387 0 3 0 0 0 0 0 0 0 0 0 3
------------------ ------------------ ------------------ ------------------ ------------------ ------------------ ------------------ ------------------ ------------------ ------------------ ------------------ ------------------ --------------------265,414 296,333 243,563 243,560 243,560 243,560 243,560 243,560 243,560 243,560 243,560 243,560 2,731,936
------------------ ------------------ ------------------ ------------------ ------------------ ------------------ ------------------ ------------------ ------------------ ------------------ ------------------ ------------------ --------------------302,749 330,451 243,563 243,808 243,560 243,560 243,560 243,560 243,560 243,560 243,560 243,560 2,766,054
------------------ ------------------ ------------------ ------------------ ------------------ ------------------ ------------------ ------------------ ------------------ ------------------ ------------------ ------------------ --------------------
268,632 262,600 243,316 243,808 243,560 243,560 243,560 243,560 243,560 243,560 243,560 243,560 2,698,2040 67,850 0 0 0 0 0 0 0 0 0 0 67,850
------------------ ------------------ ------------------ ------------------ ------------------ ------------------ ------------------ ------------------ ------------------ ------------------ ------------------ ------------------ --------------------268,632 330,450 243,316 243,808 243,560 243,560 243,560 243,560 243,560 243,560 243,560 243,560 2,766,054
------------------ ------------------ ------------------ ------------------ ------------------ ------------------ ------------------ ------------------ ------------------ ------------------ ------------------ ------------------ --------------------
34,118 0 248 0 0 0 0 0 0 0 0 0 0------------------ ------------------ ------------------ ------------------ ------------------ ------------------ ------------------ ------------------ ------------------ ------------------ ------------------ ------------------ --------------------
34,118 0 248 0 0 0 0 0 0 0 0 0 0------------------ ------------------ ------------------ ------------------ ------------------ ------------------ ------------------ ------------------ ------------------ ------------------ ------------------ ------------------ --------------------
0 0 0 0 0 0 0 0 0 0 0 0 0========== ========== ========== ========== ========== ========== ========== ========== ========== ========== ========== ========== ===========
190. POLICE SERVICES AUGMENTATION FUND
JULY 1, 2016 TO JUNE 30, 2027LONG TERM FINANCIAL PLAN
CITY OF SUNNYVALE
177

RESERVES/FUND BALANCE, JULY 1
CURRENT RESOURCES: SLES Fund (AB3229) Interest Income
TOTAL CURRENT RESOURCES
TOTAL AVAILABLE RESOURCES
CURRENT REQUIREMENTS:OperationsSpecial Projects
TOTAL CURRENT REQUIREMENTS
RESERVES: 20 Year RAP
TOTAL RESERVES
FUND BALANCE, JUNE 30
FY 2027/2028 FY 2016/2017TO TO
PLAN PLAN PLAN PLAN PLAN PLAN PLAN PLAN PLAN PLAN FY 2036/2037 FY 2036/20372027/2028 2028/2029 2029/2030 2030/2031 2031/2032 2032/2033 2033/2034 2034/2035 2035/2036 2036/2037 TOTAL TOTAL
------------------ ------------------ ------------------ ------------------ ------------------ ------------------ ------------------ ------------------ ------------------ ------------------ -------------------- --------------------0 0 0 0 0 0 0 0 0 0 0 34,118
------------------ ------------------ ------------------ ------------------ ------------------ ------------------ ------------------ ------------------ ------------------ ------------------ -------------------- --------------------
243,560 243,560 243,560 243,560 243,560 243,560 243,560 243,560 243,560 243,560 2,435,600 5,167,5330 0 0 0 0 0 0 0 0 0 0 3
------------------ ------------------ ------------------ ------------------ ------------------ ------------------ ------------------ ------------------ ------------------ ------------------ -------------------- --------------------243,560 243,560 243,560 243,560 243,560 243,560 243,560 243,560 243,560 243,560 2,435,600 5,167,536
------------------ ------------------ ------------------ ------------------ ------------------ ------------------ ------------------ ------------------ ------------------ ------------------ -------------------- --------------------243,560 243,560 243,560 243,560 243,560 243,560 243,560 243,560 243,560 243,560 2,435,600 5,201,654
------------------ ------------------ ------------------ ------------------ ------------------ ------------------ ------------------ ------------------ ------------------ ------------------ -------------------- --------------------
243,560 243,560 243,560 243,560 243,560 243,560 243,560 243,560 243,560 243,560 2,435,600 5,133,8040 0 0 0 0 0 0 0 0 0 0 67,850
------------------ ------------------ ------------------ ------------------ ------------------ ------------------ ------------------ ------------------ ------------------ ------------------ -------------------- --------------------243,560 243,560 243,560 243,560 243,560 243,560 243,560 243,560 243,560 243,560 2,435,600 5,201,654
------------------ ------------------ ------------------ ------------------ ------------------ ------------------ ------------------ ------------------ ------------------ ------------------ -------------------- --------------------
0 0 0 0 0 0 0 0 0 0 0 0------------------ ------------------ ------------------ ------------------ ------------------ ------------------ ------------------ ------------------ ------------------ ------------------ -------------------- --------------------
0 0 0 0 0 0 0 0 0 0 0 0------------------ ------------------ ------------------ ------------------ ------------------ ------------------ ------------------ ------------------ ------------------ ------------------ -------------------- --------------------
0 0 0 0 0 0 0 0 0 0 0 0========== ========== ========== ========== ========== ========== ========== ========== ========== ========== =========== ===========
190. POLICE SERVICES AUGMENTATION FUND
JULY 1, 2027 TO JUNE 30, 2037LONG TERM FINANCIAL PLAN
CITY OF SUNNYVALE
178

RESERVE/FUND BALANCE, JULY 1
CURRENT RESOURCES: Federal Grant State Grant Other Grants and Contributions ARRA Stimulus Funds
TOTAL CURRENT RESOURCES
TOTAL AVAILABLE RESOURCES
CURRENT REQUIREMENTS: Operations In-Lieu Charges Transfers Out Special Projects
TOTAL CURRENT REQUIREMENTS
RESERVES: 20 Year RAP
TOTAL RESERVES
FUND BALANCE, JUNE 30
FY 2016/2017TO
ACTUAL CURRENT BUDGET PLAN PLAN PLAN PLAN PLAN PLAN PLAN PLAN PLAN FY 2026/20272015/2016 2016/2017 2017/2018 2018/2019 2019/2020 2020/2021 2021/2022 2022/2023 2023/2024 2024/2025 2025/2026 2026/2027 TOTAL
------------------ ------------------ ------------------ ------------------ ------------------ ------------------ ------------------ ------------------ ------------------ ------------------ ------------------ ------------------ --------------------195,928 162,478 162,478 99,939 0 0 0 0 0 0 0 0 162,478
------------------ ------------------ ------------------ ------------------ ------------------ ------------------ ------------------ ------------------ ------------------ ------------------ ------------------ ------------------ --------------------
10,315,780 11,000,000 10,500,000 10,500,000 10,500,000 10,500,000 10,500,000 10,500,000 10,500,000 10,500,000 10,500,000 10,500,000 116,000,000125,475 0 0 0 0 0 0 0 0 0 0 0 0
73,277 0 0 0 0 0 0 0 0 0 0 0 00 0 0 0 0 0 0 0 0 0 0 0 0
------------------ ------------------ ------------------ ------------------ ------------------ ------------------ ------------------ ------------------ ------------------ ------------------ ------------------ ------------------ --------------------10,514,531 11,000,000 10,500,000 10,500,000 10,500,000 10,500,000 10,500,000 10,500,000 10,500,000 10,500,000 10,500,000 10,500,000 116,000,000
------------------ ------------------ ------------------ ------------------ ------------------ ------------------ ------------------ ------------------ ------------------ ------------------ ------------------ ------------------ --------------------10,710,459 11,162,478 10,662,478 10,599,939 10,500,000 10,500,000 10,500,000 10,500,000 10,500,000 10,500,000 10,500,000 10,500,000 116,162,478
------------------ ------------------ ------------------ ------------------ ------------------ ------------------ ------------------ ------------------ ------------------ ------------------ ------------------ ------------------ --------------------
10,111,368 10,545,460 10,249,975 10,287,375 10,187,436 10,187,436 10,187,436 10,187,436 10,187,436 10,187,436 10,187,436 10,187,436 112,582,298436,613 445,000 312,564 312,564 312,564 312,564 312,564 312,564 312,564 312,564 312,564 312,564 3,570,640
0 9,540 0 0 0 0 0 0 0 0 0 0 9,5400 0 0 0 0 0 0 0 0 0 0 0 0
------------------ ------------------ ------------------ ------------------ ------------------ ------------------ ------------------ ------------------ ------------------ ------------------ ------------------ ------------------ --------------------10,547,982 11,000,000 10,562,539 10,599,939 10,500,000 10,500,000 10,500,000 10,500,000 10,500,000 10,500,000 10,500,000 10,500,000 116,162,478
------------------ ------------------ ------------------ ------------------ ------------------ ------------------ ------------------ ------------------ ------------------ ------------------ ------------------ ------------------ --------------------
162,478 162,478 99,939 0 0 0 0 0 0 0 0 0 0------------------ ------------------ ------------------ ------------------ ------------------ ------------------ ------------------ ------------------ ------------------ ------------------ ------------------ ------------------ --------------------
162,478 162,478 99,939 0 0 0 0 0 0 0 0 0 0------------------ ------------------ ------------------ ------------------ ------------------ ------------------ ------------------ ------------------ ------------------ ------------------ ------------------ ------------------ --------------------
0 0 0 0 0 0 0 0 0 0 0 0 0========== ========== ========== ========== ========== ========== ========== ========== ========== ========== ========== ========== ===========
JULY 1, 2016 TO JUNE 30, 2027LONG TERM FINANCIAL PLAN
210. EMPLOYMENT DEVELOPMENT FUNDCITY OF SUNNYVALE
179

RESERVE/FUND BALANCE, JULY 1
CURRENT RESOURCES: Federal Grant State Grant Other Grants and Contributions ARRA Stimulus Funds
TOTAL CURRENT RESOURCES
TOTAL AVAILABLE RESOURCES
CURRENT REQUIREMENTS: Operations In-Lieu Charges
TOTAL CURRENT REQUIREMENTS
RESERVES: 20 Year RAP
TOTAL RESERVES
FUND BALANCE, JUNE 30
FY 2027/2028 FY 2016/2017TO TO
PLAN PLAN PLAN PLAN PLAN PLAN PLAN PLAN PLAN PLAN FY 2036/2037 FY 2036/20372027/2028 2028/2029 2029/2030 2030/2031 2031/2032 2032/2033 2033/2034 2034/2035 2035/2036 2036/2037 TOTAL TOTAL
------------------ ------------------ ------------------ ------------------ ------------------ ------------------ ------------------ ------------------ ------------------ ------------------ -------------------- --------------------0 0 0 0 0 0 0 0 0 0 0 162,478
------------------ ------------------ ------------------ ------------------ ------------------ ------------------ ------------------ ------------------ ------------------ ------------------ -------------------- --------------------
10,500,000 10,500,000 10,500,000 10,500,000 10,500,000 10,500,000 10,500,000 10,500,000 10,500,000 10,500,000 105,000,000 220,500,0000 0 0 0 0 0 0 0 0 0 0 00 0 0 0 0 0 0 0 0 0 0 00 0 0 0 0 0 0 0 0 0 0 0
------------------ ------------------ ------------------ ------------------ ------------------ ------------------ ------------------ ------------------ ------------------ ------------------ -------------------- --------------------10,500,000 10,500,000 10,500,000 10,500,000 10,500,000 10,500,000 10,500,000 10,500,000 10,500,000 10,500,000 105,000,000 220,500,000
------------------ ------------------ ------------------ ------------------ ------------------ ------------------ ------------------ ------------------ ------------------ ------------------ -------------------- --------------------10,500,000 10,500,000 10,500,000 10,500,000 10,500,000 10,500,000 10,500,000 10,500,000 10,500,000 10,500,000 105,000,000 220,662,478
------------------ ------------------ ------------------ ------------------ ------------------ ------------------ ------------------ ------------------ ------------------ ------------------ -------------------- --------------------
10,187,436 10,187,436 10,187,436 10,187,436 10,187,436 10,187,436 10,187,436 10,187,436 10,187,436 10,187,436 101,874,360 213,966,198312,564 312,564 312,564 312,564 312,564 312,564 312,564 312,564 312,564 312,564 3,125,640 6,696,280
------------------ ------------------ ------------------ ------------------ ------------------ ------------------ ------------------ ------------------ ------------------ ------------------ -------------------- --------------------10,500,000 10,500,000 10,500,000 10,500,000 10,500,000 10,500,000 10,500,000 10,500,000 10,500,000 10,500,000 105,000,000 220,662,478
------------------ ------------------ ------------------ ------------------ ------------------ ------------------ ------------------ ------------------ ------------------ ------------------ -------------------- --------------------
0 0 0 0 0 0 0 0 0 0 0 0------------------ ------------------ ------------------ ------------------ ------------------ ------------------ ------------------ ------------------ ------------------ ------------------ -------------------- --------------------
0 0 0 0 0 0 0 0 0 0 0 0------------------ ------------------ ------------------ ------------------ ------------------ ------------------ ------------------ ------------------ ------------------ ------------------ -------------------- --------------------
0 0 0 0 0 0 0 0 0 0 0 0========== ========== ========== ========== ========== ========== ========== ========== ========== ========== =========== ===========
210. EMPLOYMENT DEVELOPMENT FUND
JULY 1, 2027 TO JUNE 30, 2037LONG TERM FINANCIAL PLAN
CITY OF SUNNYVALE
180

RESERVE/FUND BALANCE, JULY 1
CURRENT RESOURCES:Special AssessmentAdministrative FeeInterest Income
TOTAL CURRENT RESOURCES
TOTAL AVAILABLE RESOURCES
CURRENT REQUIREMENTS:In-Lieu ChargesOperationsCapital Projects
TOTAL CURRENT REQUIREMENTS
RESERVES:20 Year RAP
TOTAL RESERVES
FUND BALANCE, JUNE 30
FY 2016/2017TO
ACTUAL CURRENT BUDGET PLAN PLAN PLAN PLAN PLAN PLAN PLAN PLAN PLAN FY 2026/20272015/2016 2016/2017 2017/2018 2018/2019 2019/2020 2020/2021 2021/2022 2022/2023 2023/2024 2024/2025 2025/2026 2026/2027 TOTAL
------------------ ------------------ ------------------ ------------------ ------------------ ------------------ ------------------ ------------------ ------------------ ------------------ ------------------ ------------------ --------------------591,994 381,577 376,692 322,347 369,746 414,117 359,034 398,346 434,482 360,809 388,678 414,042 381,577
------------------ ------------------ ------------------ ------------------ ------------------ ------------------ ------------------ ------------------ ------------------ ------------------ ------------------ ------------------ --------------------
183,370 185,987 185,987 185,987 185,987 185,987 185,987 185,987 185,987 185,987 185,987 185,987 2,045,852(1,834) (1,860) (1,860) (1,860) (1,860) (1,860) (1,860) (1,860) (1,860) (1,860) (1,860) (1,860) (20,459)4,683 3,918 4,003 6,391 8,156 10,511 11,656 12,709 10,563 11,375 12,114 9,459 100,855
------------------ ------------------ ------------------ ------------------ ------------------ ------------------ ------------------ ------------------ ------------------ ------------------ ------------------ ------------------ --------------------186,219 188,045 188,130 190,518 192,283 194,638 195,783 196,836 194,690 195,502 196,241 193,586 2,126,249
------------------ ------------------ ------------------ ------------------ ------------------ ------------------ ------------------ ------------------ ------------------ ------------------ ------------------ ------------------ --------------------778,213 569,622 564,822 512,865 562,029 608,755 554,816 595,182 629,172 556,311 584,919 607,627 2,507,826
------------------ ------------------ ------------------ ------------------ ------------------ ------------------ ------------------ ------------------ ------------------ ------------------ ------------------ ------------------ --------------------
9,239 10,202 10,773 10,996 11,223 11,454 11,691 11,932 12,178 12,429 12,685 12,945 128,507128,357 121,528 129,702 132,123 136,689 140,848 144,779 148,768 152,803 155,204 158,193 160,993 1,581,629259,039 61,200 102,000 0 0 97,419 0 0 103,382 0 0 110,785 474,786
------------------ ------------------ ------------------ ------------------ ------------------ ------------------ ------------------ ------------------ ------------------ ------------------ ------------------ ------------------ --------------------396,636 192,930 242,474 143,118 147,912 249,721 156,470 160,699 268,363 167,633 170,877 284,723 2,184,922
------------------ ------------------ ------------------ ------------------ ------------------ ------------------ ------------------ ------------------ ------------------ ------------------ ------------------ ------------------ --------------------
381,577 376,692 322,347 369,746 414,117 359,034 398,346 434,482 360,809 388,678 414,042 322,904 322,904------------------ ------------------ ------------------ ------------------ ------------------ ------------------ ------------------ ------------------ ------------------ ------------------ ------------------ ------------------ --------------------
381,577 376,692 322,347 369,746 414,117 359,034 398,346 434,482 360,809 388,678 414,042 322,904 322,904------------------ ------------------ ------------------ ------------------ ------------------ ------------------ ------------------ ------------------ ------------------ ------------------ ------------------ ------------------ --------------------
0 0 0 0 0 0 0 0 0 0 0 0 0========== ========== ========== ========== ========== ========== ========== ========== ========== ========== ========== ========== ===========
JULY 1, 2016 TO JUNE 30, 2027LONG TERM FINANCIAL PLAN245. PARKING DISTRICT FUND
CITY OF SUNNYVALE
181
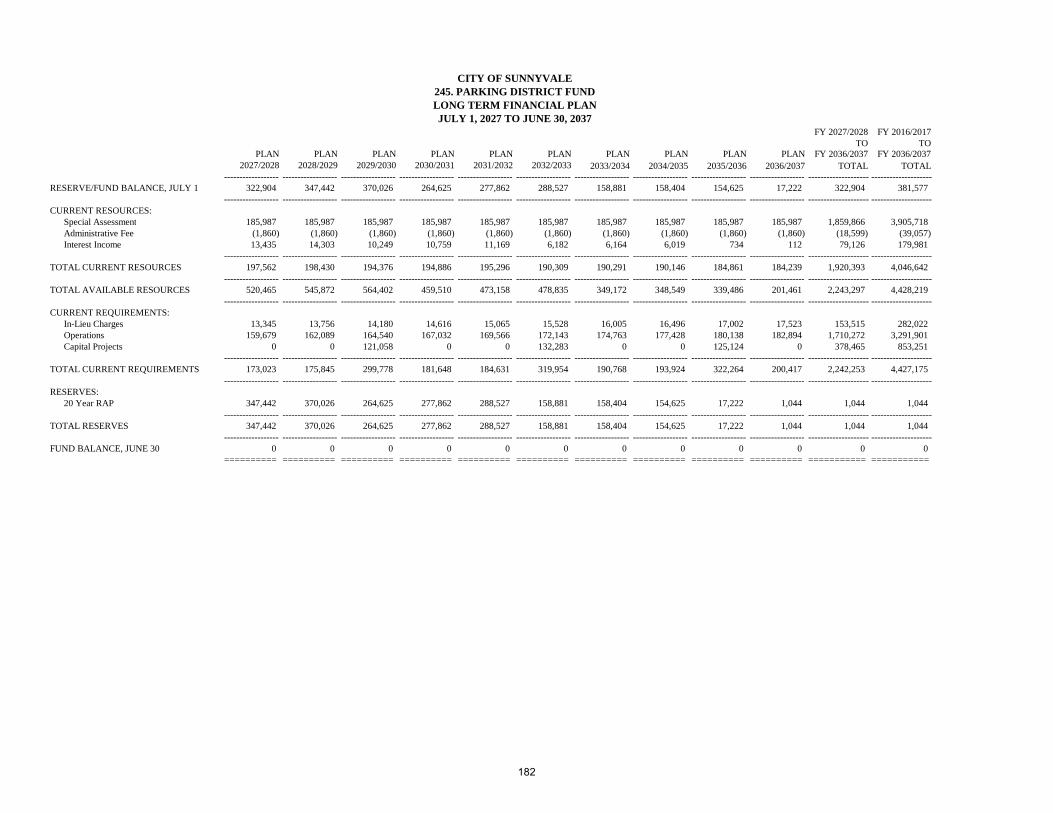
RESERVE/FUND BALANCE, JULY 1
CURRENT RESOURCES:Special AssessmentAdministrative FeeInterest Income
TOTAL CURRENT RESOURCES
TOTAL AVAILABLE RESOURCES
CURRENT REQUIREMENTS:In-Lieu ChargesOperationsCapital Projects
TOTAL CURRENT REQUIREMENTS
RESERVES:20 Year RAP
TOTAL RESERVES
FUND BALANCE, JUNE 30
FY 2027/2028 FY 2016/2017TO TO
PLAN PLAN PLAN PLAN PLAN PLAN PLAN PLAN PLAN PLAN FY 2036/2037 FY 2036/20372027/2028 2028/2029 2029/2030 2030/2031 2031/2032 2032/2033 2033/2034 2034/2035 2035/2036 2036/2037 TOTAL TOTAL
------------------ ------------------ ------------------ ------------------ ------------------ ------------------ ------------------ ------------------ ------------------ ------------------ -------------------- --------------------322,904 347,442 370,026 264,625 277,862 288,527 158,881 158,404 154,625 17,222 322,904 381,577
------------------ ------------------ ------------------ ------------------ ------------------ ------------------ ------------------ ------------------ ------------------ ------------------ -------------------- --------------------
185,987 185,987 185,987 185,987 185,987 185,987 185,987 185,987 185,987 185,987 1,859,866 3,905,718(1,860) (1,860) (1,860) (1,860) (1,860) (1,860) (1,860) (1,860) (1,860) (1,860) (18,599) (39,057)13,435 14,303 10,249 10,759 11,169 6,182 6,164 6,019 734 112 79,126 179,981
------------------ ------------------ ------------------ ------------------ ------------------ ------------------ ------------------ ------------------ ------------------ ------------------ -------------------- --------------------197,562 198,430 194,376 194,886 195,296 190,309 190,291 190,146 184,861 184,239 1,920,393 4,046,642
------------------ ------------------ ------------------ ------------------ ------------------ ------------------ ------------------ ------------------ ------------------ ------------------ -------------------- --------------------520,465 545,872 564,402 459,510 473,158 478,835 349,172 348,549 339,486 201,461 2,243,297 4,428,219
------------------ ------------------ ------------------ ------------------ ------------------ ------------------ ------------------ ------------------ ------------------ ------------------ -------------------- --------------------
13,345 13,756 14,180 14,616 15,065 15,528 16,005 16,496 17,002 17,523 153,515 282,022159,679 162,089 164,540 167,032 169,566 172,143 174,763 177,428 180,138 182,894 1,710,272 3,291,901
0 0 121,058 0 0 132,283 0 0 125,124 0 378,465 853,251------------------ ------------------ ------------------ ------------------ ------------------ ------------------ ------------------ ------------------ ------------------ ------------------ -------------------- --------------------
173,023 175,845 299,778 181,648 184,631 319,954 190,768 193,924 322,264 200,417 2,242,253 4,427,175------------------ ------------------ ------------------ ------------------ ------------------ ------------------ ------------------ ------------------ ------------------ ------------------ -------------------- --------------------
347,442 370,026 264,625 277,862 288,527 158,881 158,404 154,625 17,222 1,044 1,044 1,044------------------ ------------------ ------------------ ------------------ ------------------ ------------------ ------------------ ------------------ ------------------ ------------------ -------------------- --------------------
347,442 370,026 264,625 277,862 288,527 158,881 158,404 154,625 17,222 1,044 1,044 1,044------------------ ------------------ ------------------ ------------------ ------------------ ------------------ ------------------ ------------------ ------------------ ------------------ -------------------- --------------------
0 0 0 0 0 0 0 0 0 0 0 0========== ========== ========== ========== ========== ========== ========== ========== ========== ========== =========== ===========
JULY 1, 2027 TO JUNE 30, 2037LONG TERM FINANCIAL PLAN245. PARKING DISTRICT FUND
CITY OF SUNNYVALE
182

RESERVE/FUND BALANCE, JULY 1
CURRENT RESOURCES: Gas Tax Interest Income Transfer From Wastewater Mgmt Fund
TOTAL CURRENT RESOURCES
TOTAL AVAILABLE RESOURCES
CURRENT REQUIREMENTS: Operations Capital Projects Infrastructure Projects Project Administration Transfer To General Services Fund Transfer To Capital Projects/General Transfer To Capital Projects/Gas Tax Transfer To Infrastructure/General
TOTAL CURRENT REQUIREMENTS
RESERVES: 20 Year RAP
TOTAL RESERVES
FUND BALANCE, JUNE 30
FY 2016/2017TO
ACTUAL CURRENT BUDGET PLAN PLAN PLAN PLAN PLAN PLAN PLAN PLAN PLAN FY 2026/20272015/2016 2016/2017 2017/2018 2018/2019 2019/2020 2020/2021 2021/2022 2022/2023 2023/2024 2024/2025 2025/2026 2026/2027 TOTAL
------------------ ------------------ ------------------ ------------------ ------------------ ------------------ ------------------ ------------------ ------------------ ------------------ ------------------ ------------------ --------------------6,401,153 5,667,223 3,645,687 1,997,102 2,118,899 1,996,326 2,882,239 2,896,990 3,220,837 3,240,730 3,671,471 3,528,281 5,667,223
------------------ ------------------ ------------------ ------------------ ------------------ ------------------ ------------------ ------------------ ------------------ ------------------ ------------------ ------------------ --------------------
3,219,726 2,894,726 3,275,903 3,335,308 3,335,308 3,335,308 3,335,308 3,335,308 3,335,308 3,335,308 3,335,308 3,335,308 36,188,40147,209 45,765 37,274 49,980 59,021 103,826 116,429 121,949 125,628 133,597 136,623 133,200 1,063,29230,609 19,391 0 0 0 0 0 0 0 0 0 0 19,391
------------------ ------------------ ------------------ ------------------ ------------------ ------------------ ------------------ ------------------ ------------------ ------------------ ------------------ ------------------ --------------------3,297,544 2,959,882 3,313,177 3,385,288 3,394,329 3,439,134 3,451,737 3,457,257 3,460,936 3,468,905 3,471,931 3,468,508 37,271,084
------------------ ------------------ ------------------ ------------------ ------------------ ------------------ ------------------ ------------------ ------------------ ------------------ ------------------ ------------------ --------------------9,698,697 8,627,105 6,958,864 5,382,390 5,513,228 5,435,460 6,333,976 6,354,247 6,681,773 6,709,635 7,143,402 6,996,789 42,938,307
------------------ ------------------ ------------------ ------------------ ------------------ ------------------ ------------------ ------------------ ------------------ ------------------ ------------------ ------------------ --------------------
2,017,295 2,025,000 2,025,000 1,365,000 1,375,000 1,100,000 1,100,000 1,100,000 1,100,000 1,100,000 1,100,000 1,100,000 14,490,000122,435 254,065 561,000 0 0 0 0 0 0 0 0 0 815,065
0 10,100 5,100 5,202 5,306 5,412 5,520 5,631 5,743 5,858 5,975 6,155 66,002209,417 273,564 130,282 205,511 114,412 88,280 136,184 101,243 196,062 107,462 190,250 228,412 1,771,661
2,010 0 0 0 0 5,413 0 0 0 0 5,975 0 11,388187,194 77,467 0 0 0 0 0 0 0 0 0 0 77,467
74,180 503,294 0 0 0 0 0 0 0 0 0 0 503,2941,418,943 1,837,929 2,240,379 1,687,779 2,022,184 1,354,115 2,195,282 1,926,536 2,139,238 1,824,844 2,312,922 2,184,174 21,725,382
------------------ ------------------ ------------------ ------------------ ------------------ ------------------ ------------------ ------------------ ------------------ ------------------ ------------------ ------------------ --------------------4,031,474 4,981,419 4,961,761 3,263,492 3,516,902 2,553,220 3,436,986 3,133,410 3,441,043 3,038,164 3,615,122 3,518,741 39,460,259
------------------ ------------------ ------------------ ------------------ ------------------ ------------------ ------------------ ------------------ ------------------ ------------------ ------------------ ------------------ --------------------
5,667,223 3,645,687 1,997,102 2,118,899 1,996,326 2,882,239 2,896,990 3,220,837 3,240,730 3,671,471 3,528,281 3,478,048 3,478,048------------------ ------------------ ------------------ ------------------ ------------------ ------------------ ------------------ ------------------ ------------------ ------------------ ------------------ ------------------ --------------------
5,667,223 3,645,687 1,997,102 2,118,899 1,996,326 2,882,239 2,896,990 3,220,837 3,240,730 3,671,471 3,528,281 3,478,048 3,478,048------------------ ------------------ ------------------ ------------------ ------------------ ------------------ ------------------ ------------------ ------------------ ------------------ ------------------ ------------------ --------------------
0 0 0 0 0 0 0 0 0 0 0 0 0========== ========== ========== ========== ========== ========== ========== ========== ========== ========== ========== ========== ===========
JULY 1, 2016 TO JUNE 30, 2027LONG TERM FINANCIAL PLAN
280. GAS TAX FUNDCITY OF SUNNYVALE
183

RESERVE/FUND BALANCE, JULY 1
CURRENT RESOURCES: Gas Tax Interest Income Transfer From Wastewater Mgmt Fund
TOTAL CURRENT RESOURCES
TOTAL AVAILABLE RESOURCES
CURRENT REQUIREMENTS: Operations Capital Projects Infrastructure Projects Project Administration Transfer To General Services Fund Transfer To Capital Projects/General Transfer To Capital Projects/Gas Tax Transfer To Infrastructure/General
TOTAL CURRENT REQUIREMENTS
RESERVES: 20 Year RAP
TOTAL RESERVES
FUND BALANCE, JUNE 30
FY 2027/2028 FY 2016/2017TO TO
PLAN PLAN PLAN PLAN PLAN PLAN PLAN PLAN PLAN PLAN FY 2036/2037 FY 2036/20372027/2028 2028/2029 2029/2030 2030/2031 2031/2032 2032/2033 2033/2034 2034/2035 2035/2036 2036/2037 TOTAL TOTAL
------------------ ------------------ ------------------ ------------------ ------------------ ------------------ ------------------ ------------------ ------------------ ------------------ -------------------- --------------------3,478,048 3,327,648 2,192,871 2,195,086 652,209 661,003 364,773 827,125 1,208,961 444,303 3,478,048 5,667,223
------------------ ------------------ ------------------ ------------------ ------------------ ------------------ ------------------ ------------------ ------------------ ------------------ -------------------- --------------------
3,335,308 3,335,308 3,335,308 3,335,308 3,335,308 3,335,308 3,335,308 3,335,308 3,335,308 3,335,308 33,353,080 69,541,481177,174 151,696 128,156 98,757 68,736 83,001 81,985 98,073 92,794 100,856 1,081,228 2,144,520
0 0 0 0 0 0 0 0 0 0 0 19,391------------------ ------------------ ------------------ ------------------ ------------------ ------------------ ------------------ ------------------ ------------------ ------------------ -------------------- --------------------
3,512,482 3,487,004 3,463,464 3,434,065 3,404,044 3,418,309 3,417,293 3,433,381 3,428,102 3,436,164 34,434,308 71,705,392------------------ ------------------ ------------------ ------------------ ------------------ ------------------ ------------------ ------------------ ------------------ ------------------ -------------------- --------------------
6,990,530 6,814,652 5,656,335 5,629,151 4,056,253 4,079,312 3,782,066 4,260,506 4,637,063 3,880,467 37,912,356 77,372,615------------------ ------------------ ------------------ ------------------ ------------------ ------------------ ------------------ ------------------ ------------------ ------------------ -------------------- --------------------
950,000 950,000 950,000 950,000 950,000 0 0 0 0 0 4,750,000 19,240,0000 0 0 0 0 0 0 0 0 0 0 815,065
6,339 6,530 6,725 6,927 7,135 7,349 7,570 7,797 8,031 8,271 72,674 138,676155,137 169,346 237,312 196,007 192,962 128,029 345,970 369,685 256,084 496,783 2,547,315 4,318,977
0 0 0 6,927 0 0 0 0 0 0 6,927 18,3150 0 0 0 0 0 0 0 0 0 0 77,4670 0 0 0 0 0 0 0 0 0 0 503,294
2,551,406 3,495,905 2,267,211 3,817,082 2,245,153 3,579,161 2,601,401 2,674,063 3,928,645 1,514,583 28,674,610 50,399,992------------------ ------------------ ------------------ ------------------ ------------------ ------------------ ------------------ ------------------ ------------------ ------------------ -------------------- --------------------
3,662,882 4,621,781 3,461,248 4,976,943 3,395,250 3,714,539 2,954,941 3,051,545 4,192,760 2,019,637 36,051,526 75,511,786------------------ ------------------ ------------------ ------------------ ------------------ ------------------ ------------------ ------------------ ------------------ ------------------ -------------------- --------------------
3,327,648 2,192,871 2,195,086 652,209 661,003 364,773 827,125 1,208,961 444,303 1,860,830 1,860,830 1,860,830
------------------ ------------------ ------------------ ------------------ ------------------ ------------------ ------------------ ------------------ ------------------ ------------------ -------------------- --------------------3,327,648 2,192,871 2,195,086 652,209 661,003 364,773 827,125 1,208,961 444,303 1,860,830 1,860,830 1,860,830
------------------ ------------------ ------------------ ------------------ ------------------ ------------------ ------------------ ------------------ ------------------ ------------------ -------------------- --------------------0 0 0 0 0 0 0 0 0 0 0 0
========== ========== ========== ========== ========== ========== ========== ========== ========== ========== =========== ===========
JULY 1, 2027 TO JUNE 30, 2037LONG TERM FINANCIAL PLAN
280. GAS TAX FUNDCITY OF SUNNYVALE
184
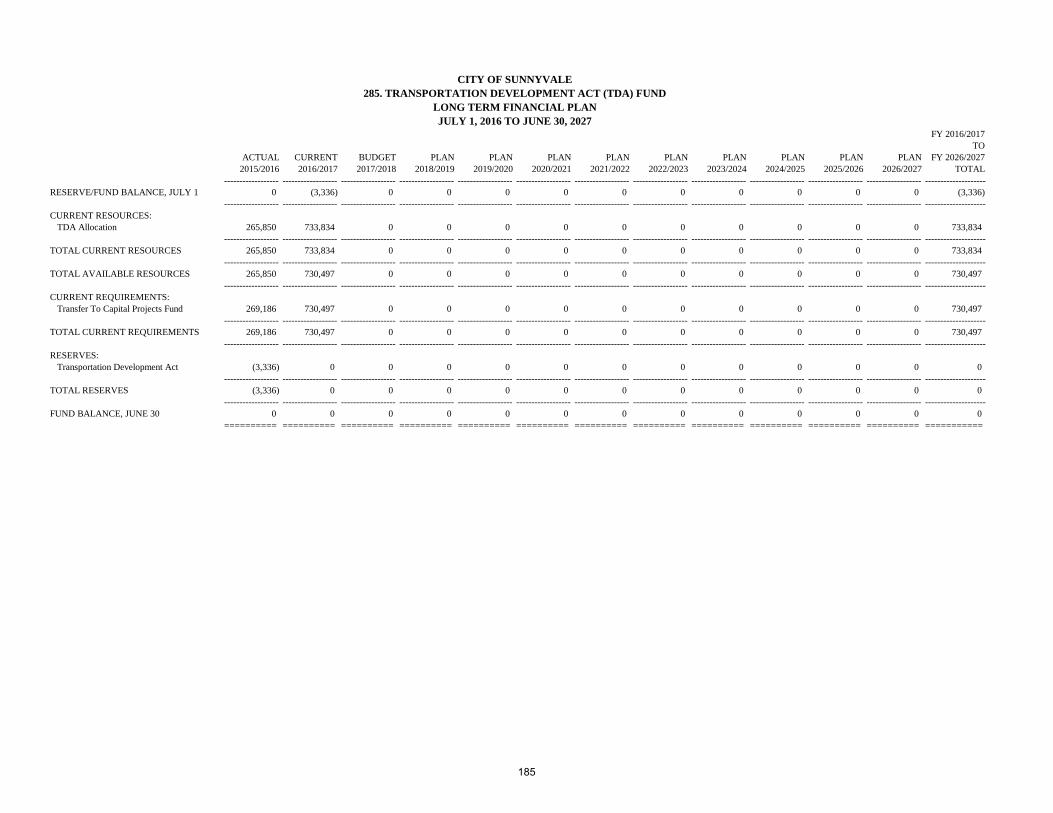
RESERVE/FUND BALANCE, JULY 1
CURRENT RESOURCES: TDA Allocation
TOTAL CURRENT RESOURCES
TOTAL AVAILABLE RESOURCES
CURRENT REQUIREMENTS: Transfer To Capital Projects Fund
TOTAL CURRENT REQUIREMENTS
RESERVES: Transportation Development Act
TOTAL RESERVES
FUND BALANCE, JUNE 30
FY 2016/2017TO
ACTUAL CURRENT BUDGET PLAN PLAN PLAN PLAN PLAN PLAN PLAN PLAN PLAN FY 2026/20272015/2016 2016/2017 2017/2018 2018/2019 2019/2020 2020/2021 2021/2022 2022/2023 2023/2024 2024/2025 2025/2026 2026/2027 TOTAL
------------------ ------------------ ------------------ ------------------ ------------------ ------------------ ------------------ ------------------ ------------------ ------------------ ------------------ ------------------ --------------------0 (3,336) 0 0 0 0 0 0 0 0 0 0 (3,336)
------------------ ------------------ ------------------ ------------------ ------------------ ------------------ ------------------ ------------------ ------------------ ------------------ ------------------ ------------------ --------------------
265,850 733,834 0 0 0 0 0 0 0 0 0 0 733,834------------------ ------------------ ------------------ ------------------ ------------------ ------------------ ------------------ ------------------ ------------------ ------------------ ------------------ ------------------ --------------------
265,850 733,834 0 0 0 0 0 0 0 0 0 0 733,834------------------ ------------------ ------------------ ------------------ ------------------ ------------------ ------------------ ------------------ ------------------ ------------------ ------------------ ------------------ --------------------
265,850 730,497 0 0 0 0 0 0 0 0 0 0 730,497------------------ ------------------ ------------------ ------------------ ------------------ ------------------ ------------------ ------------------ ------------------ ------------------ ------------------ ------------------ --------------------
269,186 730,497 0 0 0 0 0 0 0 0 0 0 730,497------------------ ------------------ ------------------ ------------------ ------------------ ------------------ ------------------ ------------------ ------------------ ------------------ ------------------ ------------------ --------------------
269,186 730,497 0 0 0 0 0 0 0 0 0 0 730,497------------------ ------------------ ------------------ ------------------ ------------------ ------------------ ------------------ ------------------ ------------------ ------------------ ------------------ ------------------ --------------------
(3,336) 0 0 0 0 0 0 0 0 0 0 0 0
------------------ ------------------ ------------------ ------------------ ------------------ ------------------ ------------------ ------------------ ------------------ ------------------ ------------------ ------------------ --------------------(3,336) 0 0 0 0 0 0 0 0 0 0 0 0
------------------ ------------------ ------------------ ------------------ ------------------ ------------------ ------------------ ------------------ ------------------ ------------------ ------------------ ------------------ --------------------0 0 0 0 0 0 0 0 0 0 0 0 0
========== ========== ========== ========== ========== ========== ========== ========== ========== ========== ========== ========== ===========
285. TRANSPORTATION DEVELOPMENT ACT (TDA) FUNDCITY OF SUNNYVALE
LONG TERM FINANCIAL PLANJULY 1, 2016 TO JUNE 30, 2027
185

This Page Intentionally Blank
186

RESERVE/FUND BALANCE, JULY 1
CURRENT RESOURCES: SB83 Revenue Interest Income
TOTAL CURRENT RESOURCES
TOTAL AVAILABLE RESOURCES
CURRENT REQUIREMENTS: Project Administration Transfer To Infrastructure Fund
TOTAL CURRENT REQUIREMENTS
RESERVES: SB83 VRF Funds
TOTAL RESERVES
FUND BALANCE, JUNE 30
FY 2016/2017TO
ACTUAL CURRENT BUDGET PLAN PLAN PLAN PLAN PLAN PLAN PLAN PLAN PLAN FY 2026/20272015/2016 2016/2017 2017/2018 2018/2019 2019/2020 2020/2021 2021/2022 2022/2023 2023/2024 2024/2025 2025/2026 2026/2027 TOTAL
------------------ ------------------ ------------------ ------------------ ------------------ ------------------ ------------------ ------------------ ------------------ ------------------ ------------------ ------------------ --------------------134,672 15,521 102,214 0 0 0 0 0 0 0 0 0 15,521
------------------ ------------------ ------------------ ------------------ ------------------ ------------------ ------------------ ------------------ ------------------ ------------------ ------------------ ------------------ --------------------
897,964 898,229 898,229 897,964 897,964 897,964 897,964 897,964 897,964 897,964 897,964 897,964 9,878,134677 4,464 0 0 0 0 0 0 0 0 0 0 4,464
------------------ ------------------ ------------------ ------------------ ------------------ ------------------ ------------------ ------------------ ------------------ ------------------ ------------------ ------------------ --------------------898,641 902,693 898,229 897,964 897,964 897,964 897,964 897,964 897,964 897,964 897,964 897,964 9,882,598
------------------ ------------------ ------------------ ------------------ ------------------ ------------------ ------------------ ------------------ ------------------ ------------------ ------------------ ------------------ --------------------1,033,313 918,214 1,000,443 897,964 897,964 897,964 897,964 897,964 897,964 897,964 897,964 897,964 9,898,119
------------------ ------------------ ------------------ ------------------ ------------------ ------------------ ------------------ ------------------ ------------------ ------------------ ------------------ ------------------ --------------------
48,748 0 0 0 0 0 0 0 0 0 0 0 0969,044 816,000 1,000,443 897,964 897,964 897,964 897,964 897,964 897,964 897,964 897,964 897,964 9,898,119
------------------ ------------------ ------------------ ------------------ ------------------ ------------------ ------------------ ------------------ ------------------ ------------------ ------------------ ------------------ --------------------1,017,792 816,000 1,000,443 897,964 897,964 897,964 897,964 897,964 897,964 897,964 897,964 897,964 9,898,119
------------------ ------------------ ------------------ ------------------ ------------------ ------------------ ------------------ ------------------ ------------------ ------------------ ------------------ ------------------ --------------------
15,521 102,214 0 0 0 0 0 0 0 0 0 0 0------------------ ------------------ ------------------ ------------------ ------------------ ------------------ ------------------ ------------------ ------------------ ------------------ ------------------ ------------------ --------------------
15,521 102,214 0 0 0 0 0 0 0 0 0 0 0------------------ ------------------ ------------------ ------------------ ------------------ ------------------ ------------------ ------------------ ------------------ ------------------ ------------------ ------------------ --------------------
0 0 0 0 0 0 0 0 0 0 0 0 0========== ========== ========== ========== ========== ========== ========== ========== ========== ========== ========== ========== ===========
290. VRF LOCAL ROAD IMPROVEMENT PROGRAM FUND
JULY 1, 2016 TO JUNE 30, 2027LONG TERM FINANCIAL PLAN
CITY OF SUNNYVALE
187

RESERVE/FUND BALANCE, JULY 1
CURRENT RESOURCES: SB83 Revenue Interest Income
TOTAL CURRENT RESOURCES
TOTAL AVAILABLE RESOURCES
CURRENT REQUIREMENTS: Project Administration Transfer To Infrastructure Fund
TOTAL CURRENT REQUIREMENTS
RESERVES: SB83 VRF Funds
TOTAL RESERVES
FUND BALANCE, JUNE 30
FY 2027/2028 FY 2016/2017TO TO
PLAN PLAN PLAN PLAN PLAN PLAN PLAN PLAN PLAN PLAN FY 2036/2037 FY 2036/20372027/2028 2028/2029 2029/2030 2030/2031 2031/2032 2032/2033 2033/2034 2034/2035 2035/2036 2036/2037 TOTAL TOTAL
------------------ ------------------ ------------------ ------------------ ------------------ ------------------ ------------------ ------------------ ------------------ ------------------ -------------------- --------------------0 0 0 0 0 0 0 0 0 0 0 15,521
------------------ ------------------ ------------------ ------------------ ------------------ ------------------ ------------------ ------------------ ------------------ ------------------ -------------------- --------------------
897,964 897,964 897,964 897,964 897,964 897,964 897,964 897,964 897,964 897,964 8,979,640 18,857,7740 0 0 0 0 0 0 0 0 0 0 4,464
------------------ ------------------ ------------------ ------------------ ------------------ ------------------ ------------------ ------------------ ------------------ ------------------ -------------------- --------------------897,964 897,964 897,964 897,964 897,964 897,964 897,964 897,964 897,964 897,964 8,979,640 18,862,238
------------------ ------------------ ------------------ ------------------ ------------------ ------------------ ------------------ ------------------ ------------------ ------------------ -------------------- --------------------897,964 897,964 897,964 897,964 897,964 897,964 897,964 897,964 897,964 897,964 8,979,640 18,877,759
------------------ ------------------ ------------------ ------------------ ------------------ ------------------ ------------------ ------------------ ------------------ ------------------ -------------------- --------------------
0 0 0 0 0 0 0 0 0 0 0 0897,964 897,964 897,964 897,964 897,964 897,964 897,964 897,964 897,964 897,964 8,979,640 18,877,759
------------------ ------------------ ------------------ ------------------ ------------------ ------------------ ------------------ ------------------ ------------------ ------------------ -------------------- --------------------897,964 897,964 897,964 897,964 897,964 897,964 897,964 897,964 897,964 897,964 8,979,640 18,877,759
------------------ ------------------ ------------------ ------------------ ------------------ ------------------ ------------------ ------------------ ------------------ ------------------ -------------------- --------------------
0 0 0 0 0 0 0 0 0 0 0 0------------------ ------------------ ------------------ ------------------ ------------------ ------------------ ------------------ ------------------ ------------------ ------------------ -------------------- --------------------
0 0 0 0 0 0 0 0 0 0 0 0------------------ ------------------ ------------------ ------------------ ------------------ ------------------ ------------------ ------------------ ------------------ ------------------ -------------------- --------------------
0 0 0 0 0 0 0 0 0 0 0 0========== ========== ========== ========== ========== ========== ========== ========== ========== ========== =========== ===========
290. VRF LOCAL ROAD IMPROVEMENT PROGRAM FUND
JULY 1, 2027 TO JUNE 30, 2037LONG TERM FINANCIAL PLAN
CITY OF SUNNYVALE
188

RESERVE/FUND BALANCE, JULY 1
CURRENT RESOURCES: Sunnyvale School Dist. Reimbursement Grants and Donations Rents and Concessions Recreation Fees Interest Income Transfer From General Fund
TOTAL CURRENT RESOURCES
TOTAL AVAILABLE RESOURCES
CURRENT REQUIREMENTS: Operations
TOTAL CURRENT REQUIREMENTS
RESERVES: Endowment Reserve
TOTAL RESERVES
FUND BALANCE, JUNE 30
FY 2016/2017TO
ACTUAL CURRENT BUDGET PLAN PLAN PLAN PLAN PLAN PLAN PLAN PLAN PLAN FY 2026/20272015/2016 2016/2017 2017/2018 2018/2019 2019/2020 2020/2021 2021/2022 2022/2023 2023/2024 2024/2025 2025/2026 2026/2027 TOTAL
------------------ ------------------ ------------------ ------------------ ------------------ ------------------ ------------------ ------------------ ------------------ ------------------ ------------------ ------------------ --------------------510,217 510,217 510,217 510,217 510,217 510,217 510,217 510,217 510,217 510,217 510,217 510,217 510,217
------------------ ------------------ ------------------ ------------------ ------------------ ------------------ ------------------ ------------------ ------------------ ------------------ ------------------ ------------------ --------------------
152,590 190,641 204,358 214,719 218,659 222,702 228,375 234,203 240,189 245,827 251,604 255,550 2,506,8283,775 3,929 4,008 4,088 4,170 4,253 4,338 4,425 4,513 4,604 4,696 4,790 47,814
35,870 31,620 32,251 32,896 33,554 34,225 34,910 35,608 36,320 37,046 37,787 38,543 384,75934,472 25,510 25,571 25,571 25,787 25,787 26,006 26,006 26,230 26,166 26,393 26,459 285,486
4,107 5,102 6,378 8,929 10,204 15,307 15,307 15,307 15,307 15,307 15,307 15,307 137,759508,598 582,886 597,586 704,563 727,392 745,391 765,382 785,676 806,454 819,216 840,714 864,304 8,239,564
------------------ ------------------ ------------------ ------------------ ------------------ ------------------ ------------------ ------------------ ------------------ ------------------ ------------------ ------------------ --------------------739,411 839,688 870,152 990,765 1,019,766 1,047,665 1,074,319 1,101,224 1,129,013 1,148,166 1,176,500 1,204,953 11,602,210
------------------ ------------------ ------------------ ------------------ ------------------ ------------------ ------------------ ------------------ ------------------ ------------------ ------------------ ------------------ --------------------1,249,629 1,349,906 1,380,369 1,500,982 1,529,983 1,557,882 1,584,536 1,611,441 1,639,230 1,658,383 1,686,717 1,715,170 12,112,427
------------------ ------------------ ------------------ ------------------ ------------------ ------------------ ------------------ ------------------ ------------------ ------------------ ------------------ ------------------ --------------------
739,411 839,688 870,152 990,765 1,019,766 1,047,665 1,074,319 1,101,224 1,129,013 1,148,166 1,176,500 1,204,953 11,602,210------------------ ------------------ ------------------ ------------------ ------------------ ------------------ ------------------ ------------------ ------------------ ------------------ ------------------ ------------------ --------------------
739,411 839,688 870,152 990,765 1,019,766 1,047,665 1,074,319 1,101,224 1,129,013 1,148,166 1,176,500 1,204,953 11,602,210------------------ ------------------ ------------------ ------------------ ------------------ ------------------ ------------------ ------------------ ------------------ ------------------ ------------------ ------------------ --------------------
510,217 510,217 510,217 510,217 510,217 510,217 510,217 510,217 510,217 510,217 510,217 510,217 510,217------------------ ------------------ ------------------ ------------------ ------------------ ------------------ ------------------ ------------------ ------------------ ------------------ ------------------ ------------------ --------------------
510,217 510,217 510,217 510,217 510,217 510,217 510,217 510,217 510,217 510,217 510,217 510,217 510,217------------------ ------------------ ------------------ ------------------ ------------------ ------------------ ------------------ ------------------ ------------------ ------------------ ------------------ ------------------ --------------------
0 0 0 0 0 0 0 0 0 0 0 0 0========== ========== ========== ========== ========== ========== ========== ========== ========== ========== ========== ========== ===========
295. YOUTH AND NEIGHBORHOOD SERVICES FUND
JULY 1, 2016 TO JUNE 30, 2027LONG TERM FINANCIAL PLAN
CITY OF SUNNYVALE
189
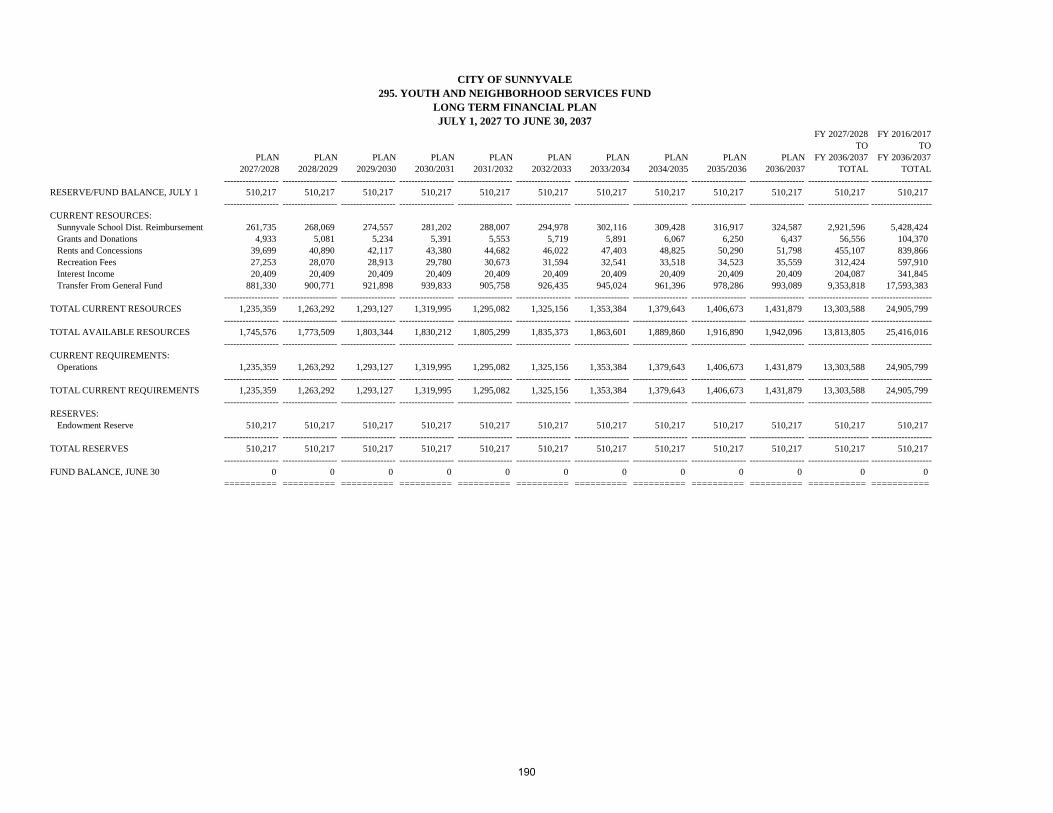
RESERVE/FUND BALANCE, JULY 1
CURRENT RESOURCES: Sunnyvale School Dist. Reimbursement Grants and Donations Rents and Concessions Recreation Fees Interest Income Transfer From General Fund
TOTAL CURRENT RESOURCES
TOTAL AVAILABLE RESOURCES
CURRENT REQUIREMENTS: Operations
TOTAL CURRENT REQUIREMENTS
RESERVES: Endowment Reserve
TOTAL RESERVES
FUND BALANCE, JUNE 30
FY 2027/2028 FY 2016/2017TO TO
PLAN PLAN PLAN PLAN PLAN PLAN PLAN PLAN PLAN PLAN FY 2036/2037 FY 2036/20372027/2028 2028/2029 2029/2030 2030/2031 2031/2032 2032/2033 2033/2034 2034/2035 2035/2036 2036/2037 TOTAL TOTAL
------------------ ------------------ ------------------ ------------------ ------------------ ------------------ ------------------ ------------------ ------------------ ------------------ -------------------- --------------------510,217 510,217 510,217 510,217 510,217 510,217 510,217 510,217 510,217 510,217 510,217 510,217
------------------ ------------------ ------------------ ------------------ ------------------ ------------------ ------------------ ------------------ ------------------ ------------------ -------------------- --------------------
261,735 268,069 274,557 281,202 288,007 294,978 302,116 309,428 316,917 324,587 2,921,596 5,428,4244,933 5,081 5,234 5,391 5,553 5,719 5,891 6,067 6,250 6,437 56,556 104,370
39,699 40,890 42,117 43,380 44,682 46,022 47,403 48,825 50,290 51,798 455,107 839,86627,253 28,070 28,913 29,780 30,673 31,594 32,541 33,518 34,523 35,559 312,424 597,91020,409 20,409 20,409 20,409 20,409 20,409 20,409 20,409 20,409 20,409 204,087 341,845
881,330 900,771 921,898 939,833 905,758 926,435 945,024 961,396 978,286 993,089 9,353,818 17,593,383------------------ ------------------ ------------------ ------------------ ------------------ ------------------ ------------------ ------------------ ------------------ ------------------ -------------------- --------------------
1,235,359 1,263,292 1,293,127 1,319,995 1,295,082 1,325,156 1,353,384 1,379,643 1,406,673 1,431,879 13,303,588 24,905,799------------------ ------------------ ------------------ ------------------ ------------------ ------------------ ------------------ ------------------ ------------------ ------------------ -------------------- --------------------
1,745,576 1,773,509 1,803,344 1,830,212 1,805,299 1,835,373 1,863,601 1,889,860 1,916,890 1,942,096 13,813,805 25,416,016------------------ ------------------ ------------------ ------------------ ------------------ ------------------ ------------------ ------------------ ------------------ ------------------ -------------------- --------------------
1,235,359 1,263,292 1,293,127 1,319,995 1,295,082 1,325,156 1,353,384 1,379,643 1,406,673 1,431,879 13,303,588 24,905,799------------------ ------------------ ------------------ ------------------ ------------------ ------------------ ------------------ ------------------ ------------------ ------------------ -------------------- --------------------
1,235,359 1,263,292 1,293,127 1,319,995 1,295,082 1,325,156 1,353,384 1,379,643 1,406,673 1,431,879 13,303,588 24,905,799------------------ ------------------ ------------------ ------------------ ------------------ ------------------ ------------------ ------------------ ------------------ ------------------ -------------------- --------------------
510,217 510,217 510,217 510,217 510,217 510,217 510,217 510,217 510,217 510,217 510,217 510,217------------------ ------------------ ------------------ ------------------ ------------------ ------------------ ------------------ ------------------ ------------------ ------------------ -------------------- --------------------
510,217 510,217 510,217 510,217 510,217 510,217 510,217 510,217 510,217 510,217 510,217 510,217------------------ ------------------ ------------------ ------------------ ------------------ ------------------ ------------------ ------------------ ------------------ ------------------ -------------------- --------------------
0 0 0 0 0 0 0 0 0 0 0 0========== ========== ========== ========== ========== ========== ========== ========== ========== ========== =========== ===========
CITY OF SUNNYVALE
LONG TERM FINANCIAL PLANJULY 1, 2027 TO JUNE 30, 2037
295. YOUTH AND NEIGHBORHOOD SERVICES FUND
190

Financial Plans – Capital and Infrastructure Funds

Capital and Infrastructure Projects FundsCapital and Infrastructure Projects Funds are used for major capital
acquisition, construction activities, and renovation or replacement of general City fixed assets. The City currently accounts for these activities in two funds: the Capital Projects Fund and the Infrastructure Renovation and Replacement Fund. Capital and Infrastructure projects related to the Utility Enterprise Funds are budgeted and accounted for within each individual utility fund.
Capital Projects FundThe Capital Projects Fund was established in FY 1997/98 to account for
financial resources to be used for new or substantially enhanced assets or for major rehabilitation of capital facilities. These projects are funded by the General Fund, other governmental funds, or outside sources. Outside revenues into the Capital Projects Fund include federal and state grants, intergovernmental revenues, developer contributions, Transportation Impact and Mitigation Fees, and Sense of Place Fees.
The Capital Projects Fund is divided into distinct sub-funds that receive direct transfers from the funds that are responsible for particular projects. Each sub-fund records revenues, interest earnings, transfers and expenses separately.
General Assets Sub-Fund
The General Assets Sub-Fund is the largest Capital Projects sub-fund. In FY 2017/18, it accounts for $38.1 million in appropriations to projects, $16.6 million of which comes from federal grant funding. This Sub-Fund accounts for The Lakewood Branch Library Facility project, which is primarily funded by the General Fund Capital Improvement Reserve. A total of $20.95 million is budgeted for the design and construction. The project budget has been adjusted to reflect the latest timeline. This Sub-Fund also includes funding for the Washington Community Swim Center renovation, which originated in FY 2015/16 with a total $7.8 million over four years.
There are also a significant number of currently funded projects that will not fully expend their appropriations in FY 2016/17, and these unspent funds will be carried over into FY 2017/18. Projects that are currently underway include the Fair Oaks Avenue Overhead Bridge project for $20.4 million, the
Safe Routes to School Pedestrian Safety Project, which is funded by a federal grant, and the Fair Oaks Bike Lanes project which is also funded by a federal grant. Beyond FY 2017/18, significant projects in this Sub-Fund include the completion of the Lakewood Branch Library Facility project, the Plaza Del Sol Phase II project, and the Synthetic Turf Sports Field project.
Gas Tax Sub-Fund
The Gas Tax Sub-Fund accounts for capital projects funded partially or fully by Gas Tax revenues. There are no new appropriations in FY 2017/18; however, carryover from FY 2016/17 is expected for the construction of the Calabazas Creek Bridge project.
Calabazas Creek Bridge Sub-Fund
A new Sub-Fund was established in the Capital Projects Fund in FY 2013/14 to account for $565,000 from the City of Santa Clara to fund its share of the Calabazas Creek Bridge renovation. The purpose of this Sub- Fund is to account for the interest allocation from the City of Santa Clara contribution that the City will be managing and administering.
Traffic Mitigation and Transportation Impact Fees Sub-Funds
The Cumulative Traffic Mitigation Fees and Transportation Impact Fees are accounted for in individual sub-funds of the Capital Projects Fund. Prior to the adoption of the Transportation Strategic Program in November 2003, an interim funding mechanism was implemented for transportation mitigation of major land development. This mechanism was known as Cumulative Traffic Mitigation Fees. The Traffic Mitigation Sub-Fund was created in order to use Cumulative Traffic Mitigation Fees for capital projects that improve traffic capacity or alternative transportation facilities. Funds are allocated to projects of local or regional significance, depending upon the nature of traffic impacts identified in association with the land development. The adoption of the Transportation Strategic Program in November 2003 replaced the interim Cumulative Traffic Mitigation Fees.
City of Sunnyvale FY 2017/18 Capital and Infrastructure Funds
191
The Traffic Mitigation Sub-Fund contains one capital project, FutureTraffic Signal Construction/Modification, which is expected to be complete in FY 2017/18. Additionally, the fund is providing grant matching funds to fund a variety of projects including Safe Routes to Schools, several intersection safety improvement projects, and the bike lane projects. All of these projects are currently underway. With these funds being available as a local match for grant funding, the City has been able to leverage significant grant dollars for these projects, although it is largely drawn down at this time.
The Transportation Impact Sub-Fund was created to account forthe Transportation Impact Fee that was adopted in November 2003 tobe applied to traffic-generating development Citywide. As noted above,this Transportation Impact Fee replaced the interim Cumulative Traffic Mitigation Fee. The City began collecting Transportation Impact Fees onnew developments in January 2004. Transportation Impact Fees are to be applied to a specific list of roadway capacity improvement projects thatwere identified using a Citywide transportation model. The Transportation Strategic Program consists of 12 projects totaling $405.3 million. These projects are largely unfunded and will move into the City’s twenty-year Projects Budget as funds are received and improvements are needed. A comprehensive listing of these projects can be found under Traffic and Transportation in Volume III – Projects Budget of the FY 2017/18 Adopted Budget.
As the local economy continues to recover, the City is seeing larger development projects that are generating significant TransportationImpact Fee revenue. $4.0 million was collected in FY 2015/16, $1.8 millionis anticipated in FY 2016/17, and $5.8 million in FY 2017/18. Beginningin FY 2019/20, revenues are budgeted at the six-year historical averageof approximately $2.9 million annually, adjusted for inflation. For thetwenty-year planning period, a total of approximately $78.7 million in Transportation Impact Fee revenue is expected.
There is one new project in the Transportation Impact Sub-Fund in FY 2017/18 for Bicycle and Pedestrian Safety Improvements. Funds are currently appropriated to the design and construction of Interchange Improvements at Mathilda/237/101.
The FY 2017/18 budget reflects a $27.75 million increase in project costs, funded by an outside grant, to cover the full construction costs. The design has been 50 percent funded by the City and 50 percent funded by a grant from the VTA. Beginning in FY 2018/19, funds have been set aside in a Future Transportation Strategic Plan Projects expenditure line item to reflect the fact that the purpose of these funds is to accumulate and be used for major roadway projects, as identified in the Transportation Strategic Program.
Sense of Place Sub-Fund
A new Sub-Fund was established in the Capital Projects Fund in FY 2008/09 to formally account for projects funded by Sense of Place Fees. Sense of Place Fees have been collected in the City for several years as conditions of approval in certain Industrial-to-Residential areas. The City has four land use areas subject to Sense of Place Fees. These are the Tasman/Fair Oaks Area, the Duane/Lawrence Expressway Industrial-to-Residential area, the Fair Oaks Junction area, and the Peery Park Area. Dwelling units constructed in these areas are each subject to a Sense of Place Fee as a condition of approval.
Sense of Place Fee revenues are projected to be approximately $3.1 million over the next two years, and then decreases to $180,000 annually, adjusted for inflation, throughout the long-term plan. Approximately $7.8 million is expected over the entire twenty-year planning period.
Staff believes that Sense of Place Fees could become more widespread in coming years. The fees would be required in areas where desired public improvements exceed the requirements of other areas of the City. Developers are normally responsible for frontage improvements, and Sense of Place Fees would help pay for other amenities that are not project specific and benefit the entire area (e.g. special signage, area entry treatments, aesthetic enhancements, etc.). Sense of Place Fees could also be required in areas with special land use or public improvement plans (Specific Plans, Precise Plans, Pedestrian and Bicycle area plans, etc.). Specific projects for future fee revenues have not yet been identified. Anticipated future expenditures are shown as Future Sense of Place Projects in the long-term plan.
City of Sunnyvale FY 2017/18 Capital and Infrastructure Funds
192

VTA Local Program Reserve Sub-Fund
A new sub-Fund was established in the Capital Projects Fund in FY 2012/13 to account for a $2 million VTA Local Program Reserve funds grant. This grant was awarded to provide 50% of the funds for the design costs of the Mathilda/237/101 Interchange Improvement project. The entire project design budget, as well as the City’s 50% share of the cost, is included in the Traffic Impact Fee Sub-Fund. The purpose of this Sub-Fund is to account for the interest allocation from the VTA grant funds that the City will be managing and administering.
Infrastructure Renovation and Replacement Fund
The Infrastructure Renovation and Replacement Fund was introduced with the FY 1996/97 budget. Its purpose is to account for revenues and expenditures associated with the rehabilitation of the City’s extensive physical infrastructure, except for utility assets, which are funded separately in the utility funds.
Similar to the Capital Projects Fund, this Fund is divided into distinct sub-funds that receive direct transfers from the funds that are responsible for the particular infrastructure projects. Each sub-fund records revenues, interest earnings, transfers and expenses separately. Currently, there are two sub-funds: General and Golf and Tennis. The General Sub-Fund accounts for the majority of City infrastructure projects. The Golf and Tennis Sub-Fund is specifically for golf and tennis projects, with funding predominantly from the Park Dedication Fund.
General Sub-Fund
There are 36 projects in the General Sub-Fund funded in FY 2017/18 totaled $24.4 million. Approximately $15.7 million is funded by a transfer from the Park Dedication Fund with the majority going to fund eight park or recreation facility related renovation projects. The fund also contains additional funding for concrete and sidewalk replacement. The increased funding is provided by anticipated revenue from the County due to the passage of Measure B, a half cent sales tax measure for transit related projects.
In addition, the City will again receive one time excess property tax revenue being programmed to sidewalks which will help to address the current backlog of repairs. Strategies and funding to address the backlog of side walk repairs will continue to be evaluated over the next several years.
A project is also funded for pavement rehabilitation, which provides the funding to maintain the City’s Pavement Condition Index (PCI) to a level in the high seventies. The City accelerated investment in its pavement over the last several years, with the intent of providing sufficient funding to maintain that level going forward. In FY 2017/18, $3.5 million is budgeted for pavement rehabilitation. Funding from Measure B is applied to maintain that funding level through the twenty year plan in order to keep the City’s PCI at the current level.
Ongoing funding to address the City’s infrastructure needs remains a particular area of concern. The City has a vast and wide array of infrastructure assets to maintain, including buildings, streets, parks, sidewalks, and utility-related infrastructure. These assets are an important part of the foundation of our service provision to the community. The City has long recognized the importance of maintaining these assets, as evidenced by the City policy of prioritizing the repair and replacement of existing infrastructure before the provision of new or expanded facilities. To this end, starting with the adopted FY 2011/12 Budget, the City has been setting aside funding for investment in its infrastructure. All of the City’s parks have funding planned to renovate them over the next twenty years. Additional funding is being allocated to sidewalk, curb, and gutter replacement. Through FY 2017/18, the General Fund will have contributed $10 million for future infrastructure projects, and has a planned appropriation of $1.5 million per year going forward. Out of this fund, $550,000 has been allocated to a project for current and future costs the Civic Center project.
Through these actions, the FY 2017/18 budget maintains this commitment to infrastructure rehabilitation.
City of Sunnyvale FY 2017/18 Capital and Infrastructure Funds
193

Golf and Tennis Sub-Fund
In the Golf and Tennis Sub-Fund, funds are budgeted in FY 2017/18 for minor renovation of golf buildings and tennis center court repairs. This fund provides for projects related to golf and tennis from Park Dedication Fee revenue. When the Golf and Tennis Enterprise Fund was established, the Council action determined that no future additional Park Dedication Fund funding would be used for the golf courses and tennis center beyond those items that were already in the budget. At this time, Park Dedication Fund support is scheduled to decrease substantially after FY 2023/24, with only minor improvements thereafter, until funding is completely discontinued in FY 2034/35. It is then expected that the Golf and Tennis Enterprise Fund would fund its own infrastructure and capital projects, however, that fund currently requires a General Fund subsidy to fund operations. It will be unlikely that the Golf and Tennis Enterprise Fund would be able to support capital projects without further fiscal strategies. Additional Council discussion on this topic is anticipated in the future.
City of Sunnyvale FY 2017/18 Capital and Infrastructure Funds
194

RESERVE/FUND BALANCE, JULY 1
CURRENT RESOURCES:Federal GrantsContributions/Misc RevenuesOther Intergovernmental RevenuesTraffic Impact FeesSense of Place FeesInterest IncomeTransfer From General FundTransfer From Park Dedication FundTransfer From Gas Tax FundTransfer From Trans. Develop. Act FundTransfer From Cap. Proj/Calabazas CreekTransfer From Cap. Proj/Traffic MitigationTransfer From Cap. Proj/Traffic ImpactTransfer From Cap. Proj/Sense of PlaceTransfer From Cap. Proj/VTA Local Prgm ReserveTransfer From Infrastructure/General Assets
TOTAL CURRENT RESOURCES
TOTAL AVAILABLE RESOURCES
CURRENT REQUIREMENTS:Capital ProjectsSpecial ProjectsGeneral Administration In-Lieu ChargesProject Administration In-Lieu ChargesFuture ProjectsFuture Fire Station Rehabilitation Transfer To General FundTransfer To Cap. Proj./General AssetsTransfer To Cap. Proj./Gas TaxTransfer To Cap. Proj./Traffic Impact
TOTAL CURRENT REQUIREMENTS
RESERVES:Capital ReserveCapital Reserve for Fire Station RehabilitationFuture Land Use & Transportation Projects
TOTAL RESERVES
FUND BALANCE, JUNE 30
FY 2016/2017TO
ACTUAL CURRENT BUDGET PLAN PLAN PLAN PLAN PLAN PLAN PLAN PLAN PLAN FY 2026/20272015/2016 2016/2017 2017/2018 2018/2019 2019/2020 2020/2021 2021/2022 2022/2023 2023/2024 2024/2025 2025/2026 2026/2027 TOTAL
------------------- ------------------- ---------------------- ------------------- ------------------- ------------------- ------------------- ------------------- ------------------- ------------------- ------------------- ------------------- --------------------27,176,010 32,771,409 34,579,783 45,293,792 14,378,059 5,378,059 5,378,059 5,378,059 5,378,059 5,378,059 5,378,059 5,378,059 32,771,409
------------------- ------------------- ---------------------- ------------------- ------------------- ------------------- ------------------- ------------------- ------------------- ------------------- ------------------- ------------------- --------------------
2,659,068 31,074,334 16,672,920 0 0 0 0 0 0 0 0 0 47,747,2543,228,100 11,250,000 0 0 0 0 0 0 0 0 0 0 11,250,000
354,941 1,727,670 28,002,811 0 0 0 0 0 0 0 0 0 29,730,4814,047,810 1,765,792 5,841,007 7,500,111 2,969,586 3,028,977 3,089,557 3,151,348 3,214,375 3,278,663 3,344,236 3,411,121 40,594,772
54,223 727,719 1,915,116 1,214,345 183,885 187,563 191,314 195,141 199,044 203,024 207,085 211,227 5,435,463231,144 200,174 44,089 0 0 0 0 0 0 0 0 0 244,26367,233 4,154,413 18,246,453 0 6,106,121 1,015,505 0 0 0 0 0 0 29,522,492
494,780 1,632,308 5,825,740 4,344,637 2,164,864 0 0 0 0 1,130,855 0 0 15,098,404261,374 386,821 0 0 0 0 0 0 0 0 0 0 386,821269,186 730,497 0 0 0 0 0 0 0 0 0 0 730,49719,281 505,184 0 0 0 0 0 0 0 0 0 0 505,184
173,188 367,053 0 0 0 0 0 0 0 0 0 0 367,05312,560 920,598 2,959,813 0 0 0 0 0 0 0 0 0 3,880,411
922 55,064 0 0 0 0 0 0 0 0 0 0 55,0641,293,405 0 0 0 0 0 0 0 0 0 0 0 0
48,840 2,499,787 0 0 0 0 0 0 0 0 0 0 2,499,787------------------- ------------------- ---------------------- ------------------- ------------------- ------------------- ------------------- ------------------- ------------------- ------------------- ------------------- ------------------- --------------------
13,216,055 57,997,416 79,507,949 13,059,093 11,424,456 4,232,046 3,280,871 3,346,489 3,413,419 4,612,542 3,551,321 3,622,347 188,047,949------------------- ------------------- ---------------------- ------------------- ------------------- ------------------- ------------------- ------------------- ------------------- ------------------- ------------------- ------------------- --------------------
40,392,065 90,768,825 114,087,732 58,352,886 25,802,515 9,610,104 8,658,930 8,724,548 8,791,477 9,990,601 8,929,379 9,000,406 220,819,358------------------- ------------------- ---------------------- ------------------- ------------------- ------------------- ------------------- ------------------- ------------------- ------------------- ------------------- ------------------- --------------------
6,035,444 54,231,384 65,780,034 10,894,637 2,920,985 1,015,505 0 0 150,000 1,780,855 0 0 136,773,40035,394 20,521 15,300 208,080 0 16,236 0 16,892 62,029 0 17,926 0 356,98413,241 13,505 13,776 14,051 14,332 14,619 15,057 15,509 15,974 16,454 16,947 17,456 167,680
0 15,814 25,017 0 0 0 0 0 0 0 0 0 40,8310 0 0 32,829,402 2,489,139 3,185,686 3,265,814 3,314,088 3,185,415 2,815,233 3,516,448 3,604,892 58,206,1170 0 0 0 15,000,000 0 0 0 0 0 0 0 15,000,000
37,222 40,678 0 0 0 0 0 0 0 0 0 0 40,678186,670 1,361,955 2,959,813 0 0 0 0 0 0 0 0 0 4,321,76819,281 505,184 0 1,043 0 0 0 0 0 0 0 0 506,227
1,293,405 0 0 27,614 0 0 0 0 0 0 0 0 27,614------------------- ------------------- ---------------------- ------------------- ------------------- ------------------- ------------------- ------------------- ------------------- ------------------- ------------------- ------------------- --------------------
7,620,657 56,189,041 68,793,940 43,974,827 20,424,456 4,232,046 3,280,871 3,346,489 3,413,419 4,612,542 3,551,321 3,622,347 215,441,299------------------- ------------------- ---------------------- ------------------- ------------------- ------------------- ------------------- ------------------- ------------------- ------------------- ------------------- ------------------- --------------------
31,714,728 25,080,281 35,862,214 5,378,059 5,378,059 5,378,059 5,378,059 5,378,059 5,378,059 5,378,059 5,378,059 5,378,059 5,378,0590 9,000,000 9,000,000 9,000,000 0 0 0 0 0 0 0 0 0
1,056,681 499,502 431,578 0 0 0 0 0 0 0 0 0 0------------------- ------------------- ---------------------- ------------------- ------------------- ------------------- ------------------- ------------------- ------------------- ------------------- ------------------- ------------------- --------------------
32,771,409 34,579,783 45,293,792 14,378,059 5,378,059 5,378,059 5,378,059 5,378,059 5,378,059 5,378,059 5,378,059 5,378,059 5,378,059------------------- ------------------- ---------------------- ------------------- ------------------- ------------------- ------------------- ------------------- ------------------- ------------------- ------------------- ------------------- --------------------
0 0 0 0 0 0 0 0 0 0 0 0 0========== ========== ============ ========== ========== ========== ========== ========== ========== ========== ========== ========== ===========
CITY OF SUNNYVALE385. COMBINED CAPITAL PROJECTS FUND
LONG TERM FINANCIAL PLANJULY 1, 2016 TO JUNE 30, 2027
195

RESERVE/FUND BALANCE, JULY 1
CURRENT RESOURCES:Federal GrantsContributions/Misc RevenuesOther Intergovernmental RevenuesTraffic Impact FeesSense of Place FeesInterest IncomeTransfer From General FundTransfer From Park Dedication FundTransfer From Gas Tax FundTransfer From Trans. Develop. Act FundTransfer From Cap. Proj/Calabazas CreekTransfer From Cap. Proj/Traffic MitigationTransfer From Cap. Proj/Traffic ImpactTransfer From Cap. Proj/Sense of PlaceTransfer From Cap. Proj/VTA Local Prgm ReserveTransfer From Infrastructure/General Assets
TOTAL CURRENT RESOURCES
TOTAL AVAILABLE RESOURCES
CURRENT REQUIREMENTS:Capital ProjectsSpecial ProjectsGeneral Administration In-Lieu ChargesProject Administration In-Lieu ChargesFuture ProjectsFuture Fire Station Rehabilitation Transfer To General FundTransfer To Cap. Proj./General AssetsTransfer To Cap. Proj./Gas TaxTransfer To Cap. Proj./Traffic Impact
TOTAL CURRENT REQUIREMENTS
RESERVES:Capital ReserveCapital Reserve for Fire Station RehabilitationFuture Land Use & Transportation Projects
TOTAL RESERVES
FUND BALANCE, JUNE 30
CITY OF SUNNYVALE385. COMBINED CAPITAL PROJECTS FUND
LONG TERM FINANCIAL PLANJULY 1, 2027 TO JUNE 30, 2037
FY 2027/2028 FY 2016/2017TO TO
PLAN PLAN PLAN PLAN PLAN PLAN PLAN PLAN PLAN PLAN FY 2036/2037 FY 2036/20372027/2028 2028/2029 2029/2030 2030/2031 2031/2032 2032/2033 2033/2034 2034/2035 2035/2036 2036/2037 TOTAL TOTAL
------------------- ------------------- ------------------- ------------------- ------------------- ------------------- ------------------- ------------------- ------------------- ------------------- -------------------- --------------------5,378,059 4,478,538 4,282,652 3,408,345 3,408,345 3,408,345 3,408,345 3,181,259 2,167,698 2,167,698 5,378,059 32,771,409
------------------- ------------------- ------------------- ------------------- ------------------- ------------------- ------------------- ------------------- ------------------- ------------------- -------------------- --------------------
193,992 0 0 0 0 0 0 0 0 0 193,992 47,941,2460 0 0 0 0 0 0 0 0 0 0 11,250,0000 0 0 0 0 0 0 0 0 0 0 29,730,481
3,479,343 3,548,930 3,619,908 3,692,307 3,766,153 3,841,476 3,918,305 3,996,671 4,076,605 4,158,137 38,097,835 78,692,607215,451 219,760 224,155 228,638 233,211 237,875 242,633 247,486 252,435 257,484 2,359,130 7,794,593
0 0 0 0 0 0 0 0 0 0 0 244,2630 0 0 92,755 0 0 0 0 0 0 92,755 29,615,2470 0 0 0 0 0 0 0 0 0 0 15,098,4040 0 0 0 0 0 0 0 0 0 0 386,8210 0 0 0 0 0 0 0 0 0 0 730,4970 0 0 0 0 0 0 0 0 0 0 505,1840 0 0 0 0 0 0 0 0 0 0 367,0530 0 0 0 0 0 0 0 0 0 0 3,847,5220 0 0 0 0 0 0 0 0 0 0 55,0640 0 0 0 0 0 0 0 0 0 0 00 0 0 0 0 0 0 0 0 0 0 2,499,787
------------------- ------------------- ------------------- ------------------- ------------------- ------------------- ------------------- ------------------- ------------------- ------------------- -------------------- --------------------3,888,786 3,768,690 3,844,064 4,013,700 3,999,364 4,079,351 4,160,938 4,244,157 4,329,040 4,415,621 40,743,712 228,758,771
------------------- ------------------- ------------------- ------------------- ------------------- ------------------- ------------------- ------------------- ------------------- ------------------- -------------------- --------------------9,266,845 8,247,228 8,126,715 7,422,045 7,407,709 7,487,696 7,569,283 7,425,416 6,496,738 6,583,319 46,121,770 261,530,180
------------------- ------------------- ------------------- ------------------- ------------------- ------------------- ------------------- ------------------- ------------------- ------------------- -------------------- --------------------
248,028 195,886 874,307 92,755 0 0 227,086 1,013,561 0 0 2,651,623 139,392,13468,465 0 20,176 0 21,405 79,370 0 0 0 0 189,416 546,40017,979 18,519 19,074 19,646 20,236 20,843 21,468 22,112 22,776 23,459 206,111 373,791
0 0 0 0 0 0 0 0 0 0 0 40,8314,039,928 3,750,171 3,804,814 3,901,299 3,957,723 3,979,138 4,139,470 4,222,045 4,306,265 4,392,162 40,493,015 98,732,022
0 0 0 0 0 0 0 0 0 0 0 15,000,0000 0 0 0 0 0 0 0 0 0 0 40,678
386,293 0 0 0 0 0 0 0 0 0 386,293 4,675,1720 0 0 0 0 0 0 0 0 0 0 506,227
27,614 0 0 0 0 0 0 0 0 0 27,614 55,228------------------- ------------------- ------------------- ------------------- ------------------- ------------------- ------------------- ------------------- ------------------- ------------------- -------------------- --------------------
4,788,307 3,964,576 4,718,371 4,013,700 3,999,364 4,079,351 4,388,024 5,257,718 4,329,040 4,415,621 43,954,073 259,362,483------------------- ------------------- ------------------- ------------------- ------------------- ------------------- ------------------- ------------------- ------------------- ------------------- -------------------- --------------------
4,478,538 4,282,652 3,408,345 3,408,345 3,408,345 3,408,345 3,181,259 2,167,698 2,167,698 2,167,698 2,167,698 2,167,6980 0 0 0 0 0 0 0 0 0 0 00 0 0 0 0 0 0 0 0 0 0 0
------------------- ------------------- ------------------- ------------------- ------------------- ------------------- ------------------- ------------------- ------------------- ------------------- -------------------- --------------------4,478,538 4,282,652 3,408,345 3,408,345 3,408,345 3,408,345 3,181,259 2,167,698 2,167,698 2,167,698 2,167,698 2,167,698
------------------- ------------------- ------------------- ------------------- ------------------- ------------------- ------------------- ------------------- ------------------- ------------------- -------------------- --------------------0 0 0 0 0 0 0 0 0 0 0 0
========== ========== ========== ========== ========== ========== ========== ========== ========== ========== =========== ===========
196

RESERVE/FUND BALANCE, JULY 1
CURRENT RESOURCES:Federal GrantsContributions/Misc RevenuesOther Intergovernmental RevenuesTransfer From General FundTransfer From Park Dedication FundTransfer From Gas Tax FundTransfer From Cap. Proj./Traffic MitigationTransfer From Cap. Proj./Traffic ImpactTransfer From Cap.Proj./Sense of PlaceTransfer From Infras./General Assets
TOTAL CURRENT RESOURCES
TOTAL AVAILABLE RESOURCES
CURRENT REQUIREMENTS:Capital ProjectsFuture Fire Station Rehab Project
TOTAL CURRENT REQUIREMENTS
RESERVES: Capital Reserve Capital Reserve for Fire Station Rehabilitation
TOTAL RESERVES
FUND BALANCE, JUNE 30
FY 2016/2017TO
ACTUAL CURRENT BUDGET PLAN PLAN PLAN PLAN PLAN PLAN PLAN PLAN PLAN FY 2026/20272015/2016 2016/2017 2017/2018 2018/2019 2019/2020 2020/2021 2021/2022 2022/2023 2023/2024 2024/2025 2025/2026 2026/2027 TOTAL
------------------- ------------------- ---------------------- ------------------- ------------------- ------------------- ------------------- ------------------- ------------------- ------------------- ------------------- ------------------- --------------------(381,723) 3,086,206 14,378,160 20,778,060 14,378,060 5,378,060 5,378,060 5,378,060 5,378,060 5,378,060 5,378,060 5,378,060 3,086,206
------------------- ------------------- ---------------------- ------------------- ------------------- ------------------- ------------------- ------------------- ------------------- ------------------- ------------------- ------------------- --------------------
2,388,838 23,261,548 16,672,920 0 0 0 0 0 0 0 0 0 39,934,4683,228,100 11,250,000 0 0 0 0 0 0 0 0 0 0 11,250,000
354,941 1,239,048 252,811 0 0 0 0 0 0 0 0 0 1,491,85967,233 4,154,413 18,246,453 0 6,106,121 1,015,505 0 0 0 0 0 0 29,522,492
494,780 1,632,308 5,825,740 4,344,637 2,164,864 0 0 0 0 1,130,855 0 0 15,098,404187,194 77,467 0 0 0 0 0 0 0 0 0 0 77,467173,188 367,053 0 0 0 0 0 0 0 0 0 0 367,05312,560 920,598 2,959,813 0 0 0 0 0 0 0 0 0 3,880,411
922 55,064 0 0 0 0 0 0 0 0 0 0 55,06448,840 2,499,787 0 0 0 0 0 0 0 0 0 0 2,499,787
------------------- ------------------- ---------------------- ------------------- ------------------- ------------------- ------------------- ------------------- ------------------- ------------------- ------------------- ------------------- --------------------7,225,782 46,187,784 43,957,737 4,344,637 8,270,985 1,015,505 0 0 0 1,130,855 0 0 104,907,503
------------------- ------------------- ---------------------- ------------------- ------------------- ------------------- ------------------- ------------------- ------------------- ------------------- ------------------- ------------------- --------------------6,844,059 49,273,990 58,335,897 25,122,697 22,649,045 6,393,565 5,378,060 5,378,060 5,378,060 6,508,915 5,378,060 5,378,060 107,993,709
------------------- ------------------- ---------------------- ------------------- ------------------- ------------------- ------------------- ------------------- ------------------- ------------------- ------------------- ------------------- --------------------
3,757,854 34,895,831 37,557,837 10,744,637 2,270,985 1,015,505 0 0 0 1,130,855 0 0 87,615,6500 0 0 0 15,000,000 0 0 0 0 0 0 0 15,000,000
------------------- ------------------- ---------------------- ------------------- ------------------- ------------------- ------------------- ------------------- ------------------- ------------------- ------------------- ------------------- --------------------3,757,854 34,895,831 37,557,837 10,744,637 17,270,985 1,015,505 0 0 0 1,130,855 0 0 102,615,650
------------------- ------------------- ---------------------- ------------------- ------------------- ------------------- ------------------- ------------------- ------------------- ------------------- ------------------- ------------------- --------------------
3,086,206 5,378,160 11,778,060 5,378,060 5,378,060 5,378,060 5,378,060 5,378,060 5,378,060 5,378,060 5,378,060 5,378,060 5,378,0600 9,000,000 9,000,000 9,000,000 0 0 0 0 0 0 0 0 0
------------------- ------------------- ---------------------- ------------------- ------------------- ------------------- ------------------- ------------------- ------------------- ------------------- ------------------- ------------------- --------------------3,086,206 14,378,160 20,778,060 14,378,060 5,378,060 5,378,060 5,378,060 5,378,060 5,378,060 5,378,060 5,378,060 5,378,060 5,378,060
------------------- ------------------- ---------------------- ------------------- ------------------- ------------------- ------------------- ------------------- ------------------- ------------------- ------------------- ------------------- --------------------0 0 0 0 0 0 0 0 0 0 0 0 0
========== ========== ============ ========== ========== ========== ========== ========== ========== ========== ========== ========== ===========
385/100. CAPITAL PROJECTS FUND/GENERAL ASSETS SUB-FUNDLONG TERM FINANCIAL PLANJULY 1, 2016 TO JUNE 30, 2027
CITY OF SUNNYVALE
197

RESERVE/FUND BALANCE, JULY 1
CURRENT RESOURCES:Federal GrantsContributions/Misc RevenuesOther Intergovernmental RevenuesTransfer From General FundTransfer From Park Dedication FundTransfer From Gas Tax FundTransfer From Cap. Proj./Traffic MitigationTransfer From Cap. Proj./Traffic ImpactTransfer From Cap.Proj./Sense of PlaceTransfer From Infras./General Assets
TOTAL CURRENT RESOURCES
TOTAL AVAILABLE RESOURCES
CURRENT REQUIREMENTS:Capital ProjectsFuture Fire Station Rehab Project
TOTAL CURRENT REQUIREMENTS
RESERVES: Capital Reserve Capital Reserve for Fire Station Rehabilitation
TOTAL RESERVES
FUND BALANCE, JUNE 30
CITY OF SUNNYVALE385/100. CAPITAL PROJECTS FUND/GENERAL ASSETS SUB-FUND
LONG TERM FINANCIAL PLANJULY 1, 2027 TO JUNE 30, 2037
FY 2027/2028 FY 2016/2017TO TO
PLAN PLAN PLAN PLAN PLAN PLAN PLAN PLAN PLAN PLAN FY 2036/2037 FY 2036/20372027/2028 2028/2029 2029/2030 2030/2031 2031/2032 2032/2033 2033/2034 2034/2035 2035/2036 2036/2037 TOTAL TOTAL
------------------- ------------------- ------------------- ------------------- ------------------- ------------------- ------------------- ------------------- ------------------- ------------------- -------------------- --------------------5,378,060 5,572,052 5,572,052 5,572,052 5,572,052 5,572,052 5,572,052 5,572,052 5,572,052 5,572,052 5,378,060 3,086,206
------------------- ------------------- ------------------- ------------------- ------------------- ------------------- ------------------- ------------------- ------------------- ------------------- -------------------- --------------------
193,992 0 0 0 0 0 0 0 0 0 193,992 40,128,4600 0 0 0 0 0 0 0 0 0 0 11,250,0000 0 0 0 0 0 0 0 0 0 0 1,491,8590 0 0 92,755 0 0 0 0 0 0 92,755 29,615,2470 0 0 0 0 0 0 0 0 0 0 15,098,4040 0 0 0 0 0 0 0 0 0 0 77,4670 0 0 0 0 0 0 0 0 0 0 367,0530 0 0 0 0 0 0 0 0 0 0 3,847,5220 0 0 0 0 0 0 0 0 0 0 55,0640 0 0 0 0 0 0 0 0 0 0 2,499,787
------------------- ------------------- ------------------- ------------------- ------------------- ------------------- ------------------- ------------------- ------------------- ------------------- -------------------- --------------------193,992 0 0 92,755 0 0 0 0 0 0 286,747 105,161,361
------------------- ------------------- ------------------- ------------------- ------------------- ------------------- ------------------- ------------------- ------------------- ------------------- -------------------- --------------------5,572,052 5,572,052 5,572,052 5,664,807 5,572,052 5,572,052 5,572,052 5,572,052 5,572,052 5,572,052 5,664,807 108,247,567
------------------- ------------------- ------------------- ------------------- ------------------- ------------------- ------------------- ------------------- ------------------- ------------------- -------------------- --------------------
0 0 0 92,755 0 0 0 0 0 0 92,755 87,675,5160 0 0 0 0 0 0 0 0 0 0 15,000,000
------------------- ------------------- ------------------- ------------------- ------------------- ------------------- ------------------- ------------------- ------------------- ------------------- -------------------- --------------------0 0 0 92,755 0 0 0 0 0 0 92,755 102,675,516
------------------- ------------------- ------------------- ------------------- ------------------- ------------------- ------------------- ------------------- ------------------- ------------------- -------------------- --------------------
5,572,052 5,572,052 5,572,052 5,572,052 5,572,052 5,572,052 5,572,052 5,572,052 5,572,052 5,572,052 5,572,052 5,572,0520 0 0 0 0 0 0 0 0 0 0 0
------------------- ------------------- ------------------- ------------------- ------------------- ------------------- ------------------- ------------------- ------------------- ------------------- -------------------- --------------------5,572,052 5,572,052 5,572,052 5,572,052 5,572,052 5,572,052 5,572,052 5,572,052 5,572,052 5,572,052 5,572,052 5,572,052
------------------- ------------------- ------------------- ------------------- ------------------- ------------------- ------------------- ------------------- ------------------- ------------------- -------------------- --------------------0 0 0 0 0 0 0 0 0 0 0 0
========== ========== ========== ========== ========== ========== ========== ========== ========== ========== =========== ===========
198
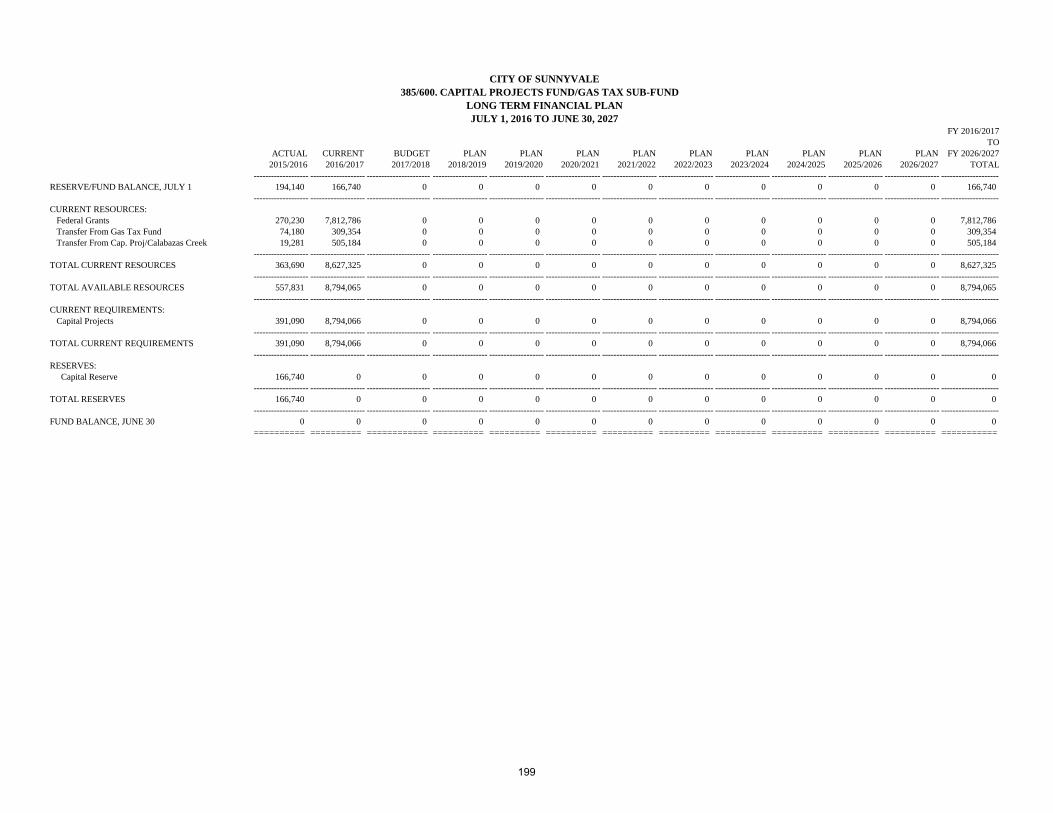
RESERVE/FUND BALANCE, JULY 1
CURRENT RESOURCES:Federal GrantsTransfer From Gas Tax FundTransfer From Cap. Proj/Calabazas Creek
TOTAL CURRENT RESOURCES
TOTAL AVAILABLE RESOURCES
CURRENT REQUIREMENTS:Capital Projects
TOTAL CURRENT REQUIREMENTS
RESERVES: Capital Reserve
TOTAL RESERVES
FUND BALANCE, JUNE 30
FY 2016/2017TO
ACTUAL CURRENT BUDGET PLAN PLAN PLAN PLAN PLAN PLAN PLAN PLAN PLAN FY 2026/20272015/2016 2016/2017 2017/2018 2018/2019 2019/2020 2020/2021 2021/2022 2022/2023 2023/2024 2024/2025 2025/2026 2026/2027 TOTAL
------------------- ------------------- ---------------------- ------------------- ------------------- ------------------- ------------------- ------------------- ------------------- ------------------- ------------------- ------------------- --------------------194,140 166,740 0 0 0 0 0 0 0 0 0 0 166,740
------------------- ------------------- ---------------------- ------------------- ------------------- ------------------- ------------------- ------------------- ------------------- ------------------- ------------------- ------------------- --------------------
270,230 7,812,786 0 0 0 0 0 0 0 0 0 0 7,812,78674,180 309,354 0 0 0 0 0 0 0 0 0 0 309,35419,281 505,184 0 0 0 0 0 0 0 0 0 0 505,184
------------------- ------------------- ---------------------- ------------------- ------------------- ------------------- ------------------- ------------------- ------------------- ------------------- ------------------- ------------------- --------------------363,690 8,627,325 0 0 0 0 0 0 0 0 0 0 8,627,325
------------------- ------------------- ---------------------- ------------------- ------------------- ------------------- ------------------- ------------------- ------------------- ------------------- ------------------- ------------------- --------------------557,831 8,794,065 0 0 0 0 0 0 0 0 0 0 8,794,065
------------------- ------------------- ---------------------- ------------------- ------------------- ------------------- ------------------- ------------------- ------------------- ------------------- ------------------- ------------------- --------------------
391,090 8,794,066 0 0 0 0 0 0 0 0 0 0 8,794,066------------------- ------------------- ---------------------- ------------------- ------------------- ------------------- ------------------- ------------------- ------------------- ------------------- ------------------- ------------------- --------------------
391,090 8,794,066 0 0 0 0 0 0 0 0 0 0 8,794,066------------------- ------------------- ---------------------- ------------------- ------------------- ------------------- ------------------- ------------------- ------------------- ------------------- ------------------- ------------------- --------------------
166,740 0 0 0 0 0 0 0 0 0 0 0 0------------------- ------------------- ---------------------- ------------------- ------------------- ------------------- ------------------- ------------------- ------------------- ------------------- ------------------- ------------------- --------------------
166,740 0 0 0 0 0 0 0 0 0 0 0 0------------------- ------------------- ---------------------- ------------------- ------------------- ------------------- ------------------- ------------------- ------------------- ------------------- ------------------- ------------------- --------------------
0 0 0 0 0 0 0 0 0 0 0 0 0========== ========== ============ ========== ========== ========== ========== ========== ========== ========== ========== ========== ===========
CITY OF SUNNYVALE385/600. CAPITAL PROJECTS FUND/GAS TAX SUB-FUND
LONG TERM FINANCIAL PLANJULY 1, 2016 TO JUNE 30, 2027
199

This Page Intentionally Blank
200

RESERVE/FUND BALANCE, JULY 1
CURRENT RESOURCES:City of Santa Clara ContributionsInterest Income
TOTAL CURRENT RESOURCES
TOTAL AVAILABLE RESOURCES
CURRENT REQUIREMENTS:Transfer To Cap. Proj./Gas Tax
TOTAL CURRENT REQUIREMENTS
RESERVES: Capital Reserve
TOTAL RESERVES
FUND BALANCE, JUNE 30
FY 2016/2017TO
ACTUAL CURRENT BUDGET PLAN PLAN PLAN PLAN PLAN PLAN PLAN PLAN PLAN FY 2026/20272015/2016 2016/2017 2017/2018 2018/2019 2019/2020 2020/2021 2021/2022 2022/2023 2023/2024 2024/2025 2025/2026 2026/2027 TOTAL
------------------- ------------------- ---------------------- ------------------- ------------------- ------------------- ------------------- ------------------- ------------------- ------------------- ------------------- ------------------- --------------------36,579 17,595 1,043 1,043 0 0 0 0 0 0 0 0 17,595
------------------- ------------------- ---------------------- ------------------- ------------------- ------------------- ------------------- ------------------- ------------------- ------------------- ------------------- ------------------- --------------------
0 488,622 0 0 0 0 0 0 0 0 0 0 488,622296 10 0 0 0 0 0 0 0 0 0 0 10
------------------- ------------------- ---------------------- ------------------- ------------------- ------------------- ------------------- ------------------- ------------------- ------------------- ------------------- ------------------- --------------------296 488,632 0 0 0 0 0 0 0 0 0 0 488,632
------------------- ------------------- ---------------------- ------------------- ------------------- ------------------- ------------------- ------------------- ------------------- ------------------- ------------------- ------------------- --------------------36,875 506,227 1,043 1,043 0 0 0 0 0 0 0 0 506,227
------------------- ------------------- ---------------------- ------------------- ------------------- ------------------- ------------------- ------------------- ------------------- ------------------- ------------------- ------------------- --------------------
19,281 505,184 0 1,043 0 0 0 0 0 0 0 0 506,227------------------- ------------------- ---------------------- ------------------- ------------------- ------------------- ------------------- ------------------- ------------------- ------------------- ------------------- ------------------- --------------------
19,281 505,184 0 1,043 0 0 0 0 0 0 0 0 506,227------------------- ------------------- ---------------------- ------------------- ------------------- ------------------- ------------------- ------------------- ------------------- ------------------- ------------------- ------------------- --------------------
17,595 1,043 1,043 0 0 0 0 0 0 0 0 0 0------------------- ------------------- ---------------------- ------------------- ------------------- ------------------- ------------------- ------------------- ------------------- ------------------- ------------------- ------------------- --------------------
17,595 1,043 1,043 0 0 0 0 0 0 0 0 0 0------------------- ------------------- ---------------------- ------------------- ------------------- ------------------- ------------------- ------------------- ------------------- ------------------- ------------------- ------------------- --------------------
0 0 0 0 0 0 0 0 0 0 0 0 0========== ========== ============ ========== ========== ========== ========== ========== ========== ========== ========== ========== ===========
CITY OF SUNNYVALE385/940. CAPITAL PROJECTS FUND/CITY OF SANTA CLARA FOR CALABAZAS CREEK BRIDGE SUB-FUND
LONG TERM FINANCIAL PLANJULY 1, 2016 TO JUNE 30, 2027
201
This Page Intentionally Blank
202

RESERVE/FUND BALANCE, JULY 1
CURRENT RESOURCES:Interest Income
TOTAL CURRENT RESOURCES
TOTAL AVAILABLE RESOURCES
CURRENT REQUIREMENTS:Capital ProjectsTransfer To Cap. Proj./General AssetsFuture Projects - Grant Matching Funds
TOTAL CURRENT REQUIREMENTS
RESERVES: Future Land Use and Transportation Projects
TOTAL RESERVES
FUND BALANCE, JUNE 30
FY 2016/2017TO
ACTUAL CURRENT BUDGET PLAN PLAN PLAN PLAN PLAN PLAN PLAN PLAN PLAN FY 2026/20272015/2016 2016/2017 2017/2018 2018/2019 2019/2020 2020/2021 2021/2022 2022/2023 2023/2024 2024/2025 2025/2026 2026/2027 TOTAL
------------------- ------------------- ---------------------- ------------------- ------------------- ------------------- ------------------- ------------------- ------------------- ------------------- ------------------- ------------------- --------------------1,589,921 1,056,681 499,502 431,578 0 0 0 0 0 0 0 0 1,056,681
------------------- ------------------- ---------------------- ------------------- ------------------- ------------------- ------------------- ------------------- ------------------- ------------------- ------------------- ------------------- --------------------
11,886 4,946 4,273 0 0 0 0 0 0 0 0 0 9,219------------------- ------------------- ---------------------- ------------------- ------------------- ------------------- ------------------- ------------------- ------------------- ------------------- ------------------- ------------------- --------------------
11,886 4,946 4,273 0 0 0 0 0 0 0 0 0 9,219------------------- ------------------- ---------------------- ------------------- ------------------- ------------------- ------------------- ------------------- ------------------- ------------------- ------------------- ------------------- --------------------
1,601,807 1,061,626 503,775 431,578 0 0 0 0 0 0 0 0 1,065,899------------------- ------------------- ---------------------- ------------------- ------------------- ------------------- ------------------- ------------------- ------------------- ------------------- ------------------- ------------------- --------------------
371,938 175,831 72,197 0 0 0 0 0 0 0 0 0 248,028173,188 386,293 0 0 0 0 0 0 0 0 0 0 386,293
0 0 0 431,578 0 0 0 0 0 0 0 0 431,578------------------- ------------------- ---------------------- ------------------- ------------------- ------------------- ------------------- ------------------- ------------------- ------------------- ------------------- ------------------- --------------------
545,126 562,124 72,197 431,578 0 0 0 0 0 0 0 0 1,065,899------------------- ------------------- ---------------------- ------------------- ------------------- ------------------- ------------------- ------------------- ------------------- ------------------- ------------------- ------------------- --------------------
1,056,681 499,502 431,578 0 0 0 0 0 0 0 0 0 0------------------- ------------------- ---------------------- ------------------- ------------------- ------------------- ------------------- ------------------- ------------------- ------------------- ------------------- ------------------- --------------------
1,056,681 499,502 431,578 0 0 0 0 0 0 0 0 0 0------------------- ------------------- ---------------------- ------------------- ------------------- ------------------- ------------------- ------------------- ------------------- ------------------- ------------------- ------------------- --------------------
0 0 0 0 0 0 0 0 0 0 0 0 0========== ========== ============ ========== ========== ========== ========== ========== ========== ========== ========== ========== ===========
JULY 1, 2016 TO JUNE 30, 2027
CITY OF SUNNYVALE385/950. CAPITAL PROJECTS FUND/TRAFFIC MITIGATION SUB-FUND
LONG TERM FINANCIAL PLAN
203

This Page Intentionally Blank
204

RESERVE/FUND BALANCE, JULY 1
CURRENT RESOURCES:Transportation Impact FeesGrant RevenueInterest IncomeTransfer From Cap. Proj/VTA Local Prgm Reserve
TOTAL CURRENT RESOURCES
TOTAL AVAILABLE RESOURCES
CURRENT REQUIREMENTS:Capital ProjectsSpecial ProjectsFuture Transportation Strategic Plan ProjectsGeneral Administration In-Lieu ChargesProject Administration In-Lieu ChargesTransfer To General FundTransfer To Cap. Proj./General Assets
TOTAL CURRENT REQUIREMENTS
RESERVES:Capital Reserve
TOTAL RESERVES
FUND BALANCE, JUNE 30
FY 2016/2017TO
ACTUAL CURRENT BUDGET PLAN PLAN PLAN PLAN PLAN PLAN PLAN PLAN PLAN FY 2026/20272015/2016 2016/2017 2017/2018 2018/2019 2019/2020 2020/2021 2021/2022 2022/2023 2023/2024 2024/2025 2025/2026 2026/2027 TOTAL
------------------- ------------------- ---------------------- ------------------- ------------------- ------------------- ------------------- ------------------- ------------------- ------------------- ------------------- ------------------- --------------------23,113,699 27,043,304 17,606,975 20,034,076 0 0 0 0 0 0 0 0 27,043,304
------------------- ------------------- ---------------------- ------------------- ------------------- ------------------- ------------------- ------------------- ------------------- ------------------- ------------------- ------------------- --------------------
4,047,810 1,765,792 5,841,007 7,500,111 2,969,586 3,028,977 3,089,557 3,151,348 3,214,375 3,278,663 3,344,236 3,411,121 40,594,7720 0 27,750,000 0 0 0 0 0 0 0 0 0 27,750,000
201,369 174,652 0 0 0 0 0 0 0 0 0 0 174,6521,293,405 0 0 0 0 0 0 0 0 0 0 0 0
------------------- ------------------- ---------------------- ------------------- ------------------- ------------------- ------------------- ------------------- ------------------- ------------------- ------------------- ------------------- --------------------5,542,584 1,940,444 33,591,007 7,500,111 2,969,586 3,028,977 3,089,557 3,151,348 3,214,375 3,278,663 3,344,236 3,411,121 68,519,424
------------------- ------------------- ---------------------- ------------------- ------------------- ------------------- ------------------- ------------------- ------------------- ------------------- ------------------- ------------------- --------------------28,656,284 28,983,748 51,197,982 27,534,187 2,969,586 3,028,977 3,089,557 3,151,348 3,214,375 3,278,663 3,344,236 3,411,121 95,562,729
------------------- ------------------- ---------------------- ------------------- ------------------- ------------------- ------------------- ------------------- ------------------- ------------------- ------------------- ------------------- --------------------
1,514,562 10,365,657 28,150,000 150,000 650,000 0 0 0 150,000 650,000 0 0 40,115,65735,394 20,521 15,300 208,080 0 16,236 0 16,892 62,029 0 17,926 0 356,984
0 0 0 27,162,056 2,305,254 2,998,123 3,074,500 3,118,947 2,986,372 2,612,209 3,309,363 3,393,665 50,960,48813,241 13,505 13,776 14,051 14,332 14,619 15,057 15,509 15,974 16,454 16,947 17,456 167,680
0 15,814 25,017 0 0 0 0 0 0 0 0 0 40,83137,222 40,678 0 0 0 0 0 0 0 0 0 0 40,67812,560 920,598 2,959,813 0 0 0 0 0 0 0 0 0 3,880,411
------------------- ------------------- ---------------------- ------------------- ------------------- ------------------- ------------------- ------------------- ------------------- ------------------- ------------------- ------------------- --------------------1,612,979 11,376,773 31,163,906 27,534,187 2,969,586 3,028,977 3,089,557 3,151,348 3,214,375 3,278,663 3,344,236 3,411,121 95,562,729
------------------- ------------------- ---------------------- ------------------- ------------------- ------------------- ------------------- ------------------- ------------------- ------------------- ------------------- ------------------- --------------------
27,043,304 17,606,975 20,034,076 0 0 0 0 0 0 0 0 0 0------------------- ------------------- ---------------------- ------------------- ------------------- ------------------- ------------------- ------------------- ------------------- ------------------- ------------------- ------------------- --------------------
27,043,304 17,606,975 20,034,076 0 0 0 0 0 0 0 0 0 0------------------- ------------------- ---------------------- ------------------- ------------------- ------------------- ------------------- ------------------- ------------------- ------------------- ------------------- ------------------- --------------------
0 0 0 0 0 0 0 0 0 0 0 0 0========== ========== ============ ========== ========== ========== ========== ========== ========== ========== ========== ========== ===========
CITY OF SUNNYVALE385/960. CAPITAL PROJECTS FUND/TRANSPORTATION IMPACT FEES SUB-FUND
LONG TERM FINANCIAL PLANJULY 1, 2016 TO JUNE 30, 2027
205

RESERVE/FUND BALANCE, JULY 1
CURRENT RESOURCES:Transportation Impact FeesGrant RevenueInterest IncomeTransfer From Cap. Proj/VTA Local Prgm Reserve
TOTAL CURRENT RESOURCES
TOTAL AVAILABLE RESOURCES
CURRENT REQUIREMENTS:Capital ProjectsSpecial ProjectsFuture Transportation Strategic Plan ProjectsGeneral Administration In-Lieu ChargesProject Administration In-Lieu ChargesTransfer To General FundTransfer To Cap. Proj./General Assets
TOTAL CURRENT REQUIREMENTS
RESERVES:Capital Reserve
TOTAL RESERVES
FUND BALANCE, JUNE 30
CITY OF SUNNYVALE85/960. CAPITAL PROJECTS FUND/TRANSPORTATION IMPACT FEES SUB-FUND
LONG TERM FINANCIAL PLANJULY 1, 2027 TO JUNE 30, 2037
FY 2027/2028 FY 2016/2017TO TO
PLAN PLAN PLAN PLAN PLAN PLAN PLAN PLAN PLAN PLAN FY 2036/2037 FY 2036/20372027/2028 2028/2029 2029/2030 2030/2031 2031/2032 2032/2033 2033/2034 2034/2035 2035/2036 2036/2037 TOTAL TOTAL
------------------- ------------------- ------------------- ------------------- ------------------- ------------------- ------------------- ------------------- ------------------- ------------------- -------------------- --------------------0 0 0 0 0 0 0 0 0 0 0 27,043,304
------------------- ------------------- ------------------- ------------------- ------------------- ------------------- ------------------- ------------------- ------------------- ------------------- -------------------- --------------------
3,479,343 3,548,930 3,619,908 3,692,307 3,766,153 3,841,476 3,918,305 3,996,671 4,076,605 4,158,137 38,097,835 78,692,6070 0 0 0 0 0 0 0 0 0 0 27,750,0000 0 0 0 0 0 0 0 0 0 0 174,6520 0 0 0 0 0 0 0 0 0 0 0
------------------- ------------------- ------------------- ------------------- ------------------- ------------------- ------------------- ------------------- ------------------- ------------------- -------------------- --------------------3,479,343 3,548,930 3,619,908 3,692,307 3,766,153 3,841,476 3,918,305 3,996,671 4,076,605 4,158,137 38,097,835 106,617,259
------------------- ------------------- ------------------- ------------------- ------------------- ------------------- ------------------- ------------------- ------------------- ------------------- -------------------- --------------------3,479,343 3,548,930 3,619,908 3,692,307 3,766,153 3,841,476 3,918,305 3,996,671 4,076,605 4,158,137 38,097,835 133,660,563
------------------- ------------------- ------------------- ------------------- ------------------- ------------------- ------------------- ------------------- ------------------- ------------------- -------------------- --------------------
0 0 0 0 0 0 0 0 0 0 0 40,115,65768,465 0 20,176 0 21,405 79,370 0 0 0 0 189,416 546,400
3,392,899 3,530,411 3,580,658 3,672,660 3,724,512 3,741,263 3,896,837 3,974,559 4,053,829 4,134,678 37,702,307 88,662,79517,979 18,519 19,074 19,646 20,236 20,843 21,468 22,112 22,776 23,459 206,111 373,791
0 0 0 0 0 0 0 0 0 0 0 40,8310 0 0 0 0 0 0 0 0 0 0 40,6780 0 0 0 0 0 0 0 0 0 0 3,880,411
------------------- ------------------- ------------------- ------------------- ------------------- ------------------- ------------------- ------------------- ------------------- ------------------- -------------------- --------------------3,479,343 3,548,930 3,619,908 3,692,307 3,766,153 3,841,476 3,918,305 3,996,671 4,076,605 4,158,137 38,097,835 133,660,563
------------------- ------------------- ------------------- ------------------- ------------------- ------------------- ------------------- ------------------- ------------------- ------------------- -------------------- --------------------
0 0 0 0 0 0 0 0 0 0 0 0------------------- ------------------- ------------------- ------------------- ------------------- ------------------- ------------------- ------------------- ------------------- ------------------- -------------------- --------------------
0 0 0 0 0 0 0 0 0 0 0 0------------------- ------------------- ------------------- ------------------- ------------------- ------------------- ------------------- ------------------- ------------------- ------------------- -------------------- --------------------
0 0 0 0 0 0 0 0 0 0 0 0========== ========== ========== ========== ========== ========== ========== ========== ========== ========== =========== ===========
206

RESERVE/FUND BALANCE, JULY 1
CURRENT RESOURCES:Sense of Place FeesInterest Income
TOTAL CURRENT RESOURCES
TOTAL AVAILABLE RESOURCES
CURRENT REQUIREMENTS:Future Sense of Place ProjectsTransfer To Cap. Proj./General Assets
TOTAL CURRENT REQUIREMENTS
RESERVES: Capital Reserve
TOTAL RESERVES
FUND BALANCE, JUNE 30
FY 2016/2017TO
ACTUAL CURRENT BUDGET PLAN PLAN PLAN PLAN PLAN PLAN PLAN PLAN PLAN FY 2026/20272015/2016 2016/2017 2017/2018 2018/2019 2019/2020 2020/2021 2021/2022 2022/2023 2023/2024 2024/2025 2025/2026 2026/2027 TOTAL
------------------- ------------------- ---------------------- ------------------- ------------------- ------------------- ------------------- ------------------- ------------------- ------------------- ------------------- ------------------- --------------------1,309,239 1,373,375 2,066,491 4,021,423 0 0 0 0 0 0 0 0 1,373,375
------------------- ------------------- ---------------------- ------------------- ------------------- ------------------- ------------------- ------------------- ------------------- ------------------- ------------------- ------------------- --------------------
54,223 727,719 1,915,116 1,214,345 183,885 187,563 191,314 195,141 199,044 203,024 207,085 211,227 5,435,46310,835 20,460 39,816 0 0 0 0 0 0 0 0 0 60,276
------------------- ------------------- ---------------------- ------------------- ------------------- ------------------- ------------------- ------------------- ------------------- ------------------- ------------------- ------------------- --------------------65,058 748,179 1,954,932 1,214,345 183,885 187,563 191,314 195,141 199,044 203,024 207,085 211,227 5,495,740
------------------- ------------------- ---------------------- ------------------- ------------------- ------------------- ------------------- ------------------- ------------------- ------------------- ------------------- ------------------- --------------------1,374,297 2,121,555 4,021,423 5,235,768 183,885 187,563 191,314 195,141 199,044 203,024 207,085 211,227 6,869,115
------------------- ------------------- ---------------------- ------------------- ------------------- ------------------- ------------------- ------------------- ------------------- ------------------- ------------------- ------------------- --------------------
0 0 0 5,235,768 183,885 187,563 191,314 195,141 199,044 203,024 207,085 211,227 6,814,051922 55,064 0 0 0 0 0 0 0 0 0 0 55,064
------------------- ------------------- ---------------------- ------------------- ------------------- ------------------- ------------------- ------------------- ------------------- ------------------- ------------------- ------------------- --------------------922 55,064 0 5,235,768 183,885 187,563 191,314 195,141 199,044 203,024 207,085 211,227 6,869,115
------------------- ------------------- ---------------------- ------------------- ------------------- ------------------- ------------------- ------------------- ------------------- ------------------- ------------------- ------------------- --------------------
1,373,375 2,066,491 4,021,423 0 0 0 0 0 0 0 0 0 0------------------- ------------------- ---------------------- ------------------- ------------------- ------------------- ------------------- ------------------- ------------------- ------------------- ------------------- ------------------- --------------------
1,373,375 2,066,491 4,021,423 0 0 0 0 0 0 0 0 0 0------------------- ------------------- ---------------------- ------------------- ------------------- ------------------- ------------------- ------------------- ------------------- ------------------- ------------------- ------------------- --------------------
0 0 0 0 0 0 0 0 0 0 0 0 0========== ========== ============ ========== ========== ========== ========== ========== ========== ========== ========== ========== ===========
CITY OF SUNNYVALE385/970. CAPITAL PROJECTS FUND/SENSE OF PLACE FEES SUB-FUND
LONG TERM FINANCIAL PLANJULY 1, 2016 TO JUNE 30, 2027
207

RESERVE/FUND BALANCE, JULY 1
CURRENT RESOURCES:Sense of Place FeesInterest Income
TOTAL CURRENT RESOURCES
TOTAL AVAILABLE RESOURCES
CURRENT REQUIREMENTS:Future Sense of Place ProjectsTransfer To Cap. Proj./General Assets
TOTAL CURRENT REQUIREMENTS
RESERVES: Capital Reserve
TOTAL RESERVES
FUND BALANCE, JUNE 30
CITY OF SUNNYVALE385/970. CAPITAL PROJECTS FUND/SENSE OF PLACE FEES SUB-FUND
LONG TERM FINANCIAL PLANJULY 1, 2027 TO JUNE 30, 2037
FY 2027/2028 FY 2016/2017TO TO
PLAN PLAN PLAN PLAN PLAN PLAN PLAN PLAN PLAN PLAN FY 2036/2037 FY 2036/20372027/2028 2028/2029 2029/2030 2030/2031 2031/2032 2032/2033 2033/2034 2034/2035 2035/2036 2036/2037 TOTAL TOTAL
------------------- ------------------- ------------------- ------------------- ------------------- ------------------- ------------------- ------------------- ------------------- ------------------- -------------------- --------------------0 0 0 0 0 0 0 0 0 0 0 1,373,375
------------------- ------------------- ------------------- ------------------- ------------------- ------------------- ------------------- ------------------- ------------------- ------------------- -------------------- --------------------
215,451 219,760 224,155 228,638 233,211 237,875 242,633 247,486 252,435 257,484 2,359,130 7,794,5930 0 0 0 0 0 0 0 0 0 0 60,276
------------------- ------------------- ------------------- ------------------- ------------------- ------------------- ------------------- ------------------- ------------------- ------------------- -------------------- --------------------215,451 219,760 224,155 228,638 233,211 237,875 242,633 247,486 252,435 257,484 2,359,130 7,854,870
------------------- ------------------- ------------------- ------------------- ------------------- ------------------- ------------------- ------------------- ------------------- ------------------- -------------------- --------------------215,451 219,760 224,155 228,638 233,211 237,875 242,633 247,486 252,435 257,484 2,359,130 9,228,245
------------------- ------------------- ------------------- ------------------- ------------------- ------------------- ------------------- ------------------- ------------------- ------------------- -------------------- --------------------
215,451 219,760 224,155 228,638 233,211 237,875 242,633 247,486 252,435 257,484 2,359,130 9,173,1810 0 0 0 0 0 0 0 0 0 0 55,064
------------------- ------------------- ------------------- ------------------- ------------------- ------------------- ------------------- ------------------- ------------------- ------------------- -------------------- --------------------215,451 219,760 224,155 228,638 233,211 237,875 242,633 247,486 252,435 257,484 2,359,130 9,228,245
------------------- ------------------- ------------------- ------------------- ------------------- ------------------- ------------------- ------------------- ------------------- ------------------- -------------------- --------------------
0 0 0 0 0 0 0 0 0 0 0 0------------------- ------------------- ------------------- ------------------- ------------------- ------------------- ------------------- ------------------- ------------------- ------------------- -------------------- --------------------
0 0 0 0 0 0 0 0 0 0 0 0------------------- ------------------- ------------------- ------------------- ------------------- ------------------- ------------------- ------------------- ------------------- ------------------- -------------------- --------------------
0 0 0 0 0 0 0 0 0 0 0 0========== ========== ========== ========== ========== ========== ========== ========== ========== ========== =========== ===========
208

RESERVE/FUND BALANCE, JULY 1
CURRENT RESOURCES:Interest Income
TOTAL CURRENT RESOURCES
TOTAL AVAILABLE RESOURCES
CURRENT REQUIREMENTS:Transfer To Cap. Proj./Traffic Impact
TOTAL CURRENT REQUIREMENTS
RESERVES: Capital Reserve
TOTAL RESERVES
FUND BALANCE, JUNE 30
FY 2016/2017TO
ACTUAL CURRENT BUDGET PLAN PLAN PLAN PLAN PLAN PLAN PLAN PLAN PLAN FY 2026/20272015/2016 2016/2017 2017/2018 2018/2019 2019/2020 2020/2021 2021/2022 2022/2023 2023/2024 2024/2025 2025/2026 2026/2027 TOTAL
------------------- ------------------- ---------------------- ------------------- ------------------- ------------------- ------------------- ------------------- ------------------- ------------------- ------------------- ------------------- --------------------1,314,155 27,509 27,614 27,614 0 0 0 0 0 0 0 0 27,509
------------------- ------------------- ---------------------- ------------------- ------------------- ------------------- ------------------- ------------------- ------------------- ------------------- ------------------- ------------------- --------------------
6,759 105 0 0 0 0 0 0 0 0 0 0 105------------------- ------------------- ---------------------- ------------------- ------------------- ------------------- ------------------- ------------------- ------------------- ------------------- ------------------- ------------------- --------------------
6,759 105 0 0 0 0 0 0 0 0 0 0 105------------------- ------------------- ---------------------- ------------------- ------------------- ------------------- ------------------- ------------------- ------------------- ------------------- ------------------- ------------------- --------------------
1,320,914 27,614 27,614 27,614 0 0 0 0 0 0 0 0 27,614------------------- ------------------- ---------------------- ------------------- ------------------- ------------------- ------------------- ------------------- ------------------- ------------------- ------------------- ------------------- --------------------
1,293,405 0 0 27,614 0 0 0 0 0 0 0 0 27,614------------------- ------------------- ---------------------- ------------------- ------------------- ------------------- ------------------- ------------------- ------------------- ------------------- ------------------- ------------------- --------------------
1,293,405 0 0 27,614 0 0 0 0 0 0 0 0 27,614------------------- ------------------- ---------------------- ------------------- ------------------- ------------------- ------------------- ------------------- ------------------- ------------------- ------------------- ------------------- --------------------
27,509 27,614 27,614 0 0 0 0 0 0 0 0 0 0------------------- ------------------- ---------------------- ------------------- ------------------- ------------------- ------------------- ------------------- ------------------- ------------------- ------------------- ------------------- --------------------
27,509 27,614 27,614 0 0 0 0 0 0 0 0 0 0------------------- ------------------- ---------------------- ------------------- ------------------- ------------------- ------------------- ------------------- ------------------- ------------------- ------------------- ------------------- --------------------
0 0 0 0 0 0 0 0 0 0 0 0 0========== ========== ============ ========== ========== ========== ========== ========== ========== ========== ========== ========== ===========
385/990. CAPITAL PROJECTS FUND/VTA LOCAL PROGRAM RESERVE SUB-FUNDLONG TERM FINANCIAL PLANJULY 1, 2016 TO JUNE 30, 2027
CITY OF SUNNYVALE
209

This Page Intentionally Blank
210

RESERVE/FUND BALANCE, JULY 1
CURRENT RESOURCES: Sunnyvale School District Reimbursement Grant Revenue Interest Income Transfer From General Fund Transfer From General Fund/Infrastructure Transfer From General Svcs./Infrastructure Transfer From VRF Fund Transfer From Gas Tax Fund Transfer From Water Supply and Dist. Fund Transfer From Solid Waste Mgmt Fund Transfer From Wastewater Mgmt Fund Transfer From General Services Fund Transfer From Park Dedication Fund One-Time ERAF Revenue
TOTAL CURRENT RESOURCES
TOTAL AVAILABLE RESOURCES
CURRENT REQUIREMENTS: Projects (Street Recon and Resurfacing) Infrastructure Projects Future Infrastructure Projects Future Facilities Infrastructure Projects Transfer To Cap. Proj. Fund/Gen.Assets Project Admin. In-Lieu Charges
TOTAL CURRENT REQUIREMENTS
RESERVES: Gen. Infrastructure Contingency Reserve
TOTAL RESERVES
FUND BALANCE, JUNE 30
FY 2016/2017TO
ACTUAL CURRENT BUDGET PLAN PLAN PLAN PLAN PLAN PLAN PLAN PLAN PLAN FY 2026/20272015/2016 2016/2017 2017/2018 2018/2019 2019/2020 2020/2021 2021/2022 2022/2023 2023/2024 2024/2025 2025/2026 2026/2027 TOTAL
------------------ ------------------ ------------------ ------------------ ------------------ ------------------ ------------------ ------------------ ------------------ ------------------ ------------------ ------------------ -------------------14,245,804 15,355,295 15,354,122 16,646,043 5,322,029 3,745,565 1,187,627 1,485,657 1,753,914 2,045,526 2,408,547 2,650,137 15,355,295
------------------ ------------------ ------------------ ------------------ ------------------ ------------------ ------------------ ------------------ ------------------ ------------------ ------------------ ------------------ -------------------
3,620 386,107 261,120 13,005 233,192 81,495 219,873 9,572 19,528 7,030 11,951 36,928 1,279,801973,525 0 0 0 0 0 0 0 0 0 0 0 0116,265 278,312 323,833 150,457 218,932 141,922 298,031 268,256 291,612 363,020 241,590 270,562 2,846,527538,328 10,290,183 3,739,007 3,739,887 3,636,334 4,380,414 5,187,002 4,160,999 5,175,687 4,222,683 5,288,500 4,246,224 54,066,920
1,500,000 1,500,000 1,500,000 1,500,000 1,500,000 1,500,000 1,500,000 1,500,000 1,500,000 1,500,000 1,500,000 1,500,000 16,500,000294,106 327,824 370,909 408,359 346,380 384,425 423,403 463,300 474,028 485,004 496,234 507,723 4,687,589969,044 816,000 1,000,443 897,964 897,964 897,964 897,964 897,964 897,964 897,964 897,964 897,964 9,898,119
1,418,943 1,837,929 2,240,379 1,687,779 2,022,184 1,354,115 2,195,282 1,926,536 2,139,238 1,824,844 2,312,922 2,184,174 21,725,3823,672 6,059 6,059 17,885 6,304 6,430 6,558 6,689 6,823 405,324 7,099 155,025 630,255
0 0 28,428 0 0 0 0 0 0 0 0 0 28,4281,856 3,060 17,274 8,973 3,184 3,247 3,312 3,379 3,446 3,515 3,585 3,693 56,668
15,405 249,813 347,889 66,653 23,814 24,290 24,775 166,042 25,776 26,292 26,818 27,623 1,009,7851,121,997 22,106,792 15,930,403 6,473,608 11,925,867 5,090,910 9,400,905 8,961,768 8,888,573 12,359,057 4,500,692 6,528,752 112,167,3271,554,399 1,070,000 0 0 0 0 0 0 0 0 0 0 1,070,000
------------------ ------------------ ------------------ ------------------ ------------------ ------------------ ------------------ ------------------ ------------------ ------------------ ------------------ ------------------ -------------------8,516,661 38,872,078 25,765,744 14,964,570 20,814,155 13,865,212 20,157,105 18,364,505 19,422,676 22,094,733 15,287,355 16,358,668 225,966,801
------------------ ------------------ ------------------ ------------------ ------------------ ------------------ ------------------ ------------------ ------------------ ------------------ ------------------ ------------------ -------------------22,762,466 54,227,373 41,119,866 31,610,613 26,136,184 17,610,777 21,344,732 19,850,162 21,176,590 24,140,260 17,695,903 19,008,806 241,322,096
------------------ ------------------ ------------------ ------------------ ------------------ ------------------ ------------------ ------------------ ------------------ ------------------ ------------------ ------------------ -------------------
3,871,645 7,899,215 5,345,290 5,461,072 5,579,392 5,597,922 5,684,880 5,773,578 5,864,050 5,962,269 6,062,628 6,207,007 65,437,3033,172,351 28,450,247 19,082,854 9,116,816 14,942,491 8,730,536 12,250,792 10,359,370 11,292,985 13,784,439 6,986,903 7,794,427 142,791,860
0 0 0 9,950,000 1,500,000 1,500,000 1,500,000 1,500,000 1,500,000 1,500,000 1,500,000 1,500,000 21,950,0000 0 0 1,693,719 346,380 384,425 423,403 463,300 474,028 485,004 496,234 507,723 5,274,217
48,840 2,499,788 0 0 0 0 0 0 0 0 0 0 2,499,788314,335 24,001 45,680 66,976 22,356 210,267 0 0 0 0 0 0 369,280
------------------ ------------------ ------------------ ------------------ ------------------ ------------------ ------------------ ------------------ ------------------ ------------------ ------------------ ------------------ -------------------7,407,171 38,873,251 24,473,824 26,288,584 22,390,618 16,423,150 19,859,075 18,096,248 19,131,063 21,731,712 15,045,765 16,009,157 238,322,448
------------------ ------------------ ------------------ ------------------ ------------------ ------------------ ------------------ ------------------ ------------------ ------------------ ------------------ ------------------ -------------------
15,355,295 15,354,122 16,646,043 5,322,029 3,745,565 1,187,627 1,485,657 1,753,914 2,045,526 2,408,547 2,650,137 2,999,649 2,999,649------------------ ------------------ ------------------ ------------------ ------------------ ------------------ ------------------ ------------------ ------------------ ------------------ ------------------ ------------------ -------------------
15,355,295 15,354,122 16,646,043 5,322,029 3,745,565 1,187,627 1,485,657 1,753,914 2,045,526 2,408,547 2,650,137 2,999,649 2,999,649------------------ ------------------ ------------------ ------------------ ------------------ ------------------ ------------------ ------------------ ------------------ ------------------ ------------------ ------------------ -------------------
0 0 0 0 0 0 0 0 0 0 0 0 0========== ========== ========== ========== ========== ========== ========== ========== ========== ========== ========== ========== ==========
CITY OF SUNNYVALE610. COMBINED INFRASTRUCTURE RENOVATION & REPLACEMENT FUND
LONG TERM FINANCIAL PLANJULY 1, 2016 TO JUNE 30, 2027
211

RESERVE/FUND BALANCE, JULY 1
CURRENT RESOURCES: Sunnyvale School District Reimbursement Grant Revenue Interest Income Transfer From General Fund Transfer From General Fund/Infrastructure Transfer From General Svcs./Infrastructure Transfer From VRF Fund Transfer From Gas Tax Fund Transfer From Water Supply and Dist. Fund Transfer From Solid Waste Mgmt Fund Transfer From Wastewater Mgmt Fund Transfer From General Services Fund Transfer From Park Dedication Fund One-Time ERAF Revenue
TOTAL CURRENT RESOURCES
TOTAL AVAILABLE RESOURCES
CURRENT REQUIREMENTS: Projects (Street Recon and Resurfacing) Infrastructure Projects Future Infrastructure Projects Future Facilities Infrastructure Projects Transfer To Cap. Proj. Fund/Gen.Assets Project Admin. In-Lieu Charges
TOTAL CURRENT REQUIREMENTS
RESERVES: Gen. Infrastructure Contingency Reserve
TOTAL RESERVES
FUND BALANCE, JUNE 30
FY 2027/2028 FY 2016/2017TO TO
PLAN PLAN PLAN PLAN PLAN PLAN PLAN PLAN PLAN PLAN FY 2036/2037 FY 2036/20372027/2028 2028/2029 2029/2030 2030/2031 2031/2032 2032/2033 2033/2034 2034/2035 2035/2036 2036/2037 TOTAL TOTAL
------------------ ------------------ ------------------ ------------------ ------------------ ------------------ ------------------ ------------------ ------------------ ------------------ ------------------- -------------------2,999,649 3,525,144 4,571,833 9,539,494 14,604,642 7,952,644 6,807,811 7,488,726 8,133,439 9,021,796 2,999,649 15,355,295
------------------ ------------------ ------------------ ------------------ ------------------ ------------------ ------------------ ------------------ ------------------ ------------------ ------------------- -------------------
465,269 23,506 8,743 1,385 1,427 2,043 6,813 7,017 2,677 7,444 526,324 1,806,1250 0 0 0 0 0 0 0 0 0 0 0
525,494 452,500 703,734 880,241 710,720 535,469 680,914 644,713 888,357 632,841 6,654,984 9,501,5115,726,060 3,422,196 5,936,316 3,759,431 9,608,451 4,702,439 6,854,638 4,602,620 7,782,190 7,884,283 60,278,624 114,345,5441,500,000 1,500,000 1,500,000 1,500,000 1,500,000 1,500,000 1,500,000 1,500,000 1,500,000 1,500,000 15,000,000 31,500,000
519,478 531,504 543,807 556,395 569,274 582,450 595,931 607,849 620,006 632,406 5,759,100 10,446,689897,964 897,964 897,964 897,964 897,964 897,964 897,964 897,964 897,964 897,964 8,979,640 18,877,759
2,551,406 3,495,905 2,267,211 3,817,082 2,245,153 3,579,161 2,601,401 4,216,759 2,385,949 1,514,583 28,674,610 50,399,99253,808 7,757 7,990 8,229 8,476 8,731 21,433 9,262 25,440 9,826 160,952 791,207
0 0 0 0 0 0 0 0 0 0 0 28,42850,082 3,918 4,035 4,156 4,281 4,409 10,825 4,678 12,849 4,963 104,196 160,86443,667 29,304 30,184 31,090 32,022 218,178 80,967 34,991 96,109 37,121 633,633 1,643,418
11,431,264 8,972,514 11,980,460 9,980,065 505,488 4,812,045 10,217,874 8,478,778 15,481,818 4,500,118 86,360,424 198,527,7510 0 0 0 0 0 0 0 0 0 0 1,070,000
------------------ ------------------ ------------------ ------------------ ------------------ ------------------ ------------------ ------------------ ------------------ ------------------ ------------------- -------------------23,764,492 19,337,068 23,880,444 21,436,038 16,083,256 16,842,889 23,468,760 21,004,631 29,693,359 17,621,550 213,132,487 439,099,288
------------------ ------------------ ------------------ ------------------ ------------------ ------------------ ------------------ ------------------ ------------------ ------------------ ------------------- -------------------26,764,141 22,862,212 28,452,277 30,975,532 30,687,898 24,795,533 30,276,570 28,493,358 37,826,799 26,643,346 216,132,135 454,454,583
------------------ ------------------ ------------------ ------------------ ------------------ ------------------ ------------------ ------------------ ------------------ ------------------ ------------------- -------------------
6,355,717 6,508,888 6,666,654 6,829,155 6,996,529 7,168,925 7,346,493 7,529,386 7,693,116 7,861,757 70,956,620 136,393,92314,863,802 9,749,987 10,202,322 7,485,340 13,669,451 8,736,348 13,345,420 10,722,683 18,991,880 6,994,546 114,761,779 257,553,639
1,500,000 1,500,000 1,500,000 1,500,000 1,500,000 1,500,000 1,500,000 1,500,000 1,500,000 1,500,000 15,000,000 36,950,000519,478 531,504 543,807 556,395 569,274 582,450 595,931 607,849 620,006 632,406 5,759,100 11,033,316
0 0 0 0 0 0 0 0 0 0 0 2,499,7880 0 0 0 0 0 0 0 0 0 0 369,280
------------------ ------------------ ------------------ ------------------ ------------------ ------------------ ------------------ ------------------ ------------------ ------------------ ------------------- -------------------23,238,997 18,290,379 18,912,783 16,370,890 22,735,254 17,987,723 22,787,844 20,359,918 28,805,002 16,988,709 206,477,499 444,799,946
------------------ ------------------ ------------------ ------------------ ------------------ ------------------ ------------------ ------------------ ------------------ ------------------ ------------------- -------------------
3,525,144 4,571,833 9,539,494 14,604,642 7,952,644 6,807,811 7,488,726 8,133,439 9,021,796 9,654,636 9,654,636 9,654,636------------------ ------------------ ------------------ ------------------ ------------------ ------------------ ------------------ ------------------ ------------------ ------------------ ------------------- -------------------
3,525,144 4,571,833 9,539,494 14,604,642 7,952,644 6,807,811 7,488,726 8,133,439 9,021,796 9,654,636 9,654,636 9,654,636------------------ ------------------ ------------------ ------------------ ------------------ ------------------ ------------------ ------------------ ------------------ ------------------ ------------------- -------------------
0 0 0 0 0 0 0 0 0 0 0 0========== ========== ========== ========== ========== ========== ========== ========== ========== ========== ========== ==========
CITY OF SUNNYVALE
LONG TERM FINANCIAL PLANJULY 1, 2027 TO JUNE 30, 2037
610. COMBINED INFRASTRUCTURE RENOVATION & REPLACEMENT FUND
212

RESERVE/FUND BALANCE, JULY 1
CURRENT RESOURCES: Grant Revenue Sunnyvale School District Reimbursement Developer Contributions Transfer From General Fund/Infrastructure Transfer From General Svcs./Infrastructure Transfer From General Fund Transfer From VRF Fund Transfer From Park Dedication Fund Transfer From Gas Tax Fund Transfer From Water Supply and Dist. Fund Transfer From Wastewater Mgmt Fund Transfer From Solid Waste Mgmt Fund Transfer From General Services Fund Interest Income One-Time Property Tax Revenue
TOTAL CURRENT RESOURCES
TOTAL AVAILABLE RESOURCES
CURRENT REQUIREMENTS: Infrastructure Projects Future Infrastructure Projects Future Facilities Infrastructure Projects Street and Sidewalk Rehab Projects Transfer To Cap. Proj. Fund/Gen. Assets Project Admin In-Lieu Charges
TOTAL CURRENT REQUIREMENTS
RESERVES: Gen. Infrastructure Contingency Reserve
TOTAL RESERVES
FUND BALANCE, JUNE 30
FY 2016/2017TO
ACTUAL CURRENT BUDGET PLAN PLAN PLAN PLAN PLAN PLAN PLAN PLAN PLAN FY 2026/20272015/2016 2016/2017 2017/2018 2018/2019 2019/2020 2020/2021 2021/2022 2022/2023 2023/2024 2024/2025 2025/2026 2026/2027 TOTAL
------------------ ------------------ ------------------ ------------------ ------------------ ------------------ ------------------ ------------------ ------------------------------------ ------------------ ------------------ -------------------14,243,457 15,471,152 15,469,760 16,761,404 5,436,999 3,860,080 1,301,444 1,598,516 1,865,778 2,156,355 2,518,299 2,758,769 15,471,152
------------------ ------------------ ------------------ ------------------ ------------------ ------------------ ------------------ ------------------ ------------------ ------------------ ------------------ ------------------ -------------------
82,000 0 0 0 0 0 0 0 0 0 0 0 03,620 386,107 261,120 13,005 233,192 81,495 219,873 9,572 19,528 7,030 11,951 36,928 1,279,8015,500 0 0 0 0 0 0 0 0 0 0 0 0
1,500,000 1,500,000 1,500,000 1,500,000 1,500,000 1,500,000 1,500,000 1,500,000 1,500,000 1,500,000 1,500,000 1,500,000 16,500,000294,106 327,824 370,909 408,359 346,380 384,425 423,403 463,300 474,028 485,004 496,234 507,723 4,687,589538,328 10,290,183 3,739,007 3,739,887 3,636,334 4,380,414 5,187,002 4,160,999 5,175,687 4,222,683 5,288,500 4,246,224 54,066,920969,044 816,000 1,000,443 897,964 897,964 897,964 897,964 897,964 897,964 897,964 897,964 897,964 9,898,119
1,048,558 21,031,745 15,740,963 3,933,207 11,547,812 3,454,908 9,400,905 8,768,377 8,392,877 12,359,057 4,500,692 6,528,752 105,659,2951,418,943 1,837,929 2,240,379 1,687,779 2,022,184 1,354,115 2,195,282 1,926,536 2,139,238 1,824,844 2,312,922 2,184,174 21,725,382
3,672 6,059 6,059 17,885 6,304 6,430 6,558 6,689 6,823 405,324 7,099 155,025 630,2551,856 3,060 17,274 8,973 3,184 3,247 3,312 3,379 3,446 3,515 3,585 3,693 56,668
0 0 28,428 0 0 0 0 0 0 0 0 0 28,42815,405 249,813 347,889 66,653 23,814 24,290 24,775 166,042 25,776 26,292 26,818 27,623 1,009,785
116,077 278,093 323,557 150,065 218,476 141,225 297,074 267,260 290,577 361,943 240,470 269,397 2,838,1371,554,399 1,070,000 0 0 0 0 0 0 0 0 0 0 1,070,000
------------------ ------------------ ------------------ ------------------ ------------------ ------------------ ------------------ ------------------ ------------------ ------------------ ------------------ ------------------ -------------------7,551,508 37,796,812 25,576,028 12,423,777 20,435,644 12,228,512 20,156,148 18,170,118 18,925,944 22,093,656 15,286,235 16,357,503 219,450,378
------------------ ------------------ ------------------ ------------------ ------------------ ------------------ ------------------ ------------------ ------------------ ------------------ ------------------ ------------------ -------------------21,794,965 53,267,964 41,045,788 29,185,181 25,872,643 16,088,592 21,457,592 19,768,635 20,791,722 24,250,011 17,804,534 19,116,272 234,921,530
------------------ ------------------ ------------------ ------------------ ------------------ ------------------ ------------------ ------------------ ------------------ ------------------ ------------------ ------------------ -------------------
2,088,993 27,375,200 18,893,414 6,576,415 14,564,436 7,094,534 12,250,792 10,165,979 10,797,289 13,784,439 6,986,903 7,794,427 136,283,8280 0 0 9,950,000 1,500,000 1,500,000 1,500,000 1,500,000 1,500,000 1,500,000 1,500,000 1,500,000 21,950,0000 0 0 1,693,719 346,380 384,425 423,403 463,300 474,028 485,004 496,234 507,723 5,274,217
3,871,645 7,899,215 5,345,290 5,461,072 5,579,392 5,597,922 5,684,880 5,773,578 5,864,050 5,962,269 6,062,628 6,207,007 65,437,30348,840 2,499,788 0 0 0 0 0 0 0 0 0 0 2,499,788
314,335 24,001 45,680 66,976 22,356 210,267 0 0 0 0 0 0 369,280------------------ ------------------ ------------------ ------------------ ------------------ ------------------ ------------------ ------------------ ------------------ ------------------ ------------------ ------------------ -------------------
6,323,813 37,798,204 24,284,384 23,748,183 22,012,563 14,787,148 19,859,075 17,902,857 18,635,367 21,731,712 15,045,765 16,009,157 231,814,415------------------ ------------------ ------------------ ------------------ ------------------ ------------------ ------------------ ------------------ ------------------ ------------------ ------------------ ------------------ -------------------
15,471,152 15,469,760 16,761,404 5,436,999 3,860,080 1,301,444 1,598,516 1,865,778 2,156,355 2,518,299 2,758,769 3,107,115 3,107,115------------------ ------------------ ------------------ ------------------ ------------------ ------------------ ------------------ ------------------ ------------------ ------------------ ------------------ ------------------ -------------------
15,471,152 15,469,760 16,761,404 5,436,999 3,860,080 1,301,444 1,598,516 1,865,778 2,156,355 2,518,299 2,758,769 3,107,115 3,107,115========== ========== ========== ========== ========== ========== ========== ========== ========== ========== ========== ========== ==========
0 0 0 0 0 0 0 0 0 0 0 0 0========== ========== ========== ========== ========== ========== ========== ========== ========== ========== ========== ========== ==========
CITY OF SUNNYVALE610/100. INFRASTRUCTURE RENOVATION & REPLACEMENT FUND/GENERAL SUB-FUND
LONG TERM FINANCIAL PLANJULY 1, 2016 TO JUNE 30, 2027
213

RESERVE/FUND BALANCE, JULY 1
CURRENT RESOURCES: Grant Revenue Sunnyvale School District Reimbursement Developer Contributions Transfer From General Fund/Infrastructure Transfer From General Svcs./Infrastructure Transfer From General Fund Transfer From VRF Fund Transfer From Park Dedication Fund Transfer From Gas Tax Fund Transfer From Water Supply and Dist. Fund Transfer From Wastewater Mgmt Fund Transfer From Solid Waste Mgmt Fund Transfer From General Services Fund Interest Income One-Time Property Tax Revenue
TOTAL CURRENT RESOURCES
TOTAL AVAILABLE RESOURCES
CURRENT REQUIREMENTS: Infrastructure Projects Future Infrastructure Projects Future Facilities Infrastructure Projects Street and Sidewalk Rehab Projects Transfer To Cap. Proj. Fund/Gen. Assets Project Admin In-Lieu Charges
TOTAL CURRENT REQUIREMENTS
RESERVES: Gen. Infrastructure Contingency Reserve
TOTAL RESERVES
FUND BALANCE, JUNE 30
FY 2027/2028 FY 2016/2017TO TO
PLAN PLAN PLAN PLAN PLAN PLAN PLAN PLAN PLAN PLAN FY 2036/2037 FY 2036/20372027/2028 2028/2029 2029/2030 2030/2031 2031/2032 2032/2033 2033/2034 2034/2035 2035/2036 2036/2037 TOTAL TOTAL
------------------ ------------------ ------------------ ------------------ ------------------ ------------------ ------------------ ------------------ ------------------ ------------------ ------------------- -------------------3,107,115 3,631,096 4,676,195 9,642,186 14,705,581 8,051,743 6,904,977 7,583,863 8,226,445 9,112,564 3,107,115 15,471,152
------------------ ------------------ ------------------ ------------------ ------------------ ------------------ ------------------ ------------------ ------------------ ------------------ ------------------- -------------------
0 0 0 0 0 0 0 0 0 0 0 0465,269 23,506 8,743 1,385 1,427 2,043 6,813 7,017 2,677 7,444 526,324 1,806,125
0 0 0 0 0 0 0 0 0 0 0 01,500,000 1,500,000 1,500,000 1,500,000 1,500,000 1,500,000 1,500,000 1,500,000 1,500,000 1,500,000 15,000,000 31,500,000
519,478 531,504 543,807 556,395 569,274 582,450 595,931 607,849 620,006 632,406 5,759,100 10,446,6895,726,060 3,422,196 5,936,316 3,759,431 9,608,451 4,702,439 6,854,638 4,602,620 7,782,190 7,884,283 60,278,624 114,345,544
897,964 897,964 897,964 897,964 897,964 897,964 897,964 897,964 897,964 897,964 8,979,640 18,877,75911,312,433 8,808,361 11,980,460 9,980,065 505,488 4,674,287 10,217,874 8,291,659 15,481,818 4,500,118 85,752,563 191,411,858
2,551,406 3,495,905 2,267,211 3,817,082 2,245,153 3,579,161 2,601,401 4,216,759 2,385,949 1,514,583 28,674,610 50,399,99253,808 7,757 7,990 8,229 8,476 8,731 21,433 9,262 25,440 9,826 160,952 791,20750,082 3,918 4,035 4,156 4,281 4,409 10,825 4,678 12,849 4,963 104,196 160,864
0 0 0 0 0 0 0 0 0 0 0 28,42843,667 29,304 30,184 31,090 32,022 218,178 80,967 34,991 96,109 37,121 633,633 1,643,418
523,980 450,910 702,064 878,488 708,879 533,537 678,884 642,582 886,119 630,492 6,635,936 9,474,0730 0 0 0 0 0 0 0 0 0 0 1,070,000
------------------ ------------------ ------------------ ------------------ ------------------ ------------------ ------------------ ------------------ ------------------ ------------------ ------------------- -------------------23,644,147 19,171,325 23,878,774 21,434,285 16,081,415 16,703,198 23,466,730 20,815,382 29,691,122 17,619,200 212,505,578 431,955,956
------------------ ------------------ ------------------ ------------------ ------------------ ------------------ ------------------ ------------------ ------------------ ------------------ ------------------- -------------------26,751,262 22,802,421 28,554,969 31,076,471 30,786,996 24,754,941 30,371,707 28,399,245 37,917,567 26,731,765 215,612,693 447,427,108
------------------ ------------------ ------------------ ------------------ ------------------ ------------------ ------------------ ------------------ ------------------ ------------------ ------------------- -------------------
14,744,971 9,585,834 10,202,322 7,485,340 13,669,451 8,598,590 13,345,420 10,535,564 18,991,880 6,994,546 114,153,918 250,437,7461,500,000 1,500,000 1,500,000 1,500,000 1,500,000 1,500,000 1,500,000 1,500,000 1,500,000 1,500,000 15,000,000 36,950,000
519,478 531,504 543,807 556,395 569,274 582,450 595,931 607,849 620,006 632,406 5,759,100 11,033,3166,355,717 6,508,888 6,666,654 6,829,155 6,996,529 7,168,925 7,346,493 7,529,386 7,693,116 7,861,757 70,956,620 136,393,923
0 0 0 0 0 0 0 0 0 0 0 2,499,7880 0 0 0 0 0 0 0 0 0 0 369,280
------------------ ------------------ ------------------ ------------------ ------------------ ------------------ ------------------ ------------------ ------------------ ------------------ ------------------- -------------------23,120,166 18,126,226 18,912,783 16,370,890 22,735,254 17,849,965 22,787,844 20,172,799 28,805,002 16,988,709 205,869,638 437,684,053
------------------ ------------------ ------------------ ------------------ ------------------ ------------------ ------------------ ------------------ ------------------ ------------------ ------------------- -------------------
3,631,096 4,676,195 9,642,186 14,705,581 8,051,743 6,904,977 7,583,863 8,226,445 9,112,564 9,743,055 9,743,055 9,743,055------------------ ------------------ ------------------ ------------------ ------------------ ------------------ ------------------ ------------------ ------------------ ------------------ ------------------- -------------------
3,631,096 4,676,195 9,642,186 14,705,581 8,051,743 6,904,977 7,583,863 8,226,445 9,112,564 9,743,055 9,743,055 9,743,055========== ========== ========== ========== ========== ========== ========== ========== ========== ========== ========== ==========
0 0 0 0 0 0 0 0 0 0 0 0========== ========== ========== ========== ========== ========== ========== ========== ========== ========== ========== ==========
CITY OF SUNNYVALE
JULY 1, 2027 TO JUNE 30, 2037LONG TERM FINANCIAL PLAN
610/100. INFRASTRUCTURE RENOVATION & REPLACEMENT FUND/GENERAL SUB-FUND
214

RESERVE/FUND BALANCE, JULY 1
CURRENT RESOURCES: Interest Income Transfer From Park Dedication Fund
TOTAL CURRENT RESOURCES
TOTAL AVAILABLE RESOURCES
CURRENT REQUIREMENTS: Infrastructure Projects
TOTAL CURRENT REQUIREMENTS
RESERVES: Comm.Rec.Infrast.Contingency Reserve
TOTAL RESERVES
FUND BALANCE, JUNE 30
FY 2016/2017TO
ACTUAL CURRENT BUDGET PLAN PLAN PLAN PLAN PLAN PLAN PLAN PLAN PLAN FY 2026/20272015/2016 2016/2017 2017/2018 2018/2019 2019/2020 2020/2021 2021/2022 2022/2023 2023/2024 2024/2025 2025/2026 2026/2027 TOTAL
------------------ ------------------ ------------------ ------------------ ------------------ ------------------ ------------------ ------------------ ------------------ ------------------ ------------------ ------------------ -------------------21,707 21,895 22,115 22,391 22,783 23,239 23,936 24,893 25,889 26,924 28,001 29,121 21,895
------------------ ------------------ ------------------ ------------------ ------------------ ------------------ ------------------ ------------------ ------------------ ------------------ ------------------ ------------------ -------------------
189 219 276 392 456 697 957 996 1,036 1,077 1,120 1,165 8,39173,439 1,075,048 189,440 2,540,401 378,055 1,636,002 0 193,391 495,696 0 0 0 6,508,033
------------------ ------------------ ------------------ ------------------ ------------------ ------------------ ------------------ ------------------ ------------------ ------------------ ------------------ ------------------ -------------------73,628 1,075,267 189,716 2,540,793 378,511 1,636,699 957 194,387 496,732 1,077 1,120 1,165 6,516,423
------------------ ------------------ ------------------ ------------------ ------------------ ------------------ ------------------ ------------------ ------------------ ------------------ ------------------ ------------------ -------------------95,335 1,097,162 211,831 2,563,184 401,294 1,659,938 24,893 219,280 522,620 28,001 29,121 30,286 6,538,319
------------------ ------------------ ------------------ ------------------ ------------------ ------------------ ------------------ ------------------ ------------------ ------------------ ------------------ ------------------ -------------------
73,439 1,075,047 189,440 2,540,401 378,055 1,636,002 0 193,391 495,696 0 0 0 6,508,032------------------ ------------------ ------------------ ------------------ ------------------ ------------------ ------------------ ------------------ ------------------ ------------------ ------------------ ------------------ -------------------
73,439 1,075,047 189,440 2,540,401 378,055 1,636,002 0 193,391 495,696 0 0 0 6,508,032------------------ ------------------ ------------------ ------------------ ------------------ ------------------ ------------------ ------------------ ------------------ ------------------ ------------------ ------------------ -------------------
21,895 22,115 22,391 22,783 23,239 23,936 24,893 25,889 26,924 28,001 29,121 30,286 30,286------------------ ------------------ ------------------ ------------------ ------------------ ------------------ ------------------ ------------------ ------------------ ------------------ ------------------ ------------------ -------------------
21,895 22,115 22,391 22,783 23,239 23,936 24,893 25,889 26,924 28,001 29,121 30,286 30,286------------------ ------------------ ------------------ ------------------ ------------------ ------------------ ------------------ ------------------ ------------------ ------------------ ------------------ ------------------ -------------------
0 0 0 0 0 0 0 0 0 0 0 0 0========== ========== ========== ========== ========== ========== ========== ========== ========== ========== ========== ========== ==========
JULY 1, 2016 TO JUNE 30, 2027
610/500. INFRASTRUCTURE RENOVATION & REPLACEMENT FUND/GOLF AND TENNIS SUB-FUNDCITY OF SUNNYVALE
LONG TERM FINANCIAL PLAN
215

RESERVE/FUND BALANCE, JULY 1
CURRENT RESOURCES: Interest Income Transfer From Park Dedication Fund
TOTAL CURRENT RESOURCES
TOTAL AVAILABLE RESOURCES
CURRENT REQUIREMENTS: Infrastructure Projects
TOTAL CURRENT REQUIREMENTS
RESERVES: Comm.Rec.Infrast.Contingency Reserve
TOTAL RESERVES
FUND BALANCE, JUNE 30
CITY OF SUNNYVALE610/500. INFRASTRUCTURE RENOVATION & REPLACEMENT FUND/GOLF AND TENNIS SUB-FUND
LONG TERM FINANCIAL PLANJULY 1, 2027 TO JUNE 30, 2037
FY 2027/2028 FY 2016/2017TO TO
PLAN PLAN PLAN PLAN PLAN PLAN PLAN PLAN PLAN PLAN FY 2036/2037 FY 2036/20372027/2028 2028/2029 2029/2030 2030/2031 2031/2032 2032/2033 2033/2034 2034/2035 2035/2036 2036/2037 TOTAL TOTAL
------------------ ------------------ ------------------ ------------------ ------------------ ------------------ ------------------ ------------------ ------------------ ------------------ ------------------- -------------------30,286 31,801 33,391 35,060 36,813 38,654 40,587 42,616 44,747 46,984 30,286 21,895
------------------ ------------------ ------------------ ------------------ ------------------ ------------------ ------------------ ------------------ ------------------ ------------------ ------------------- -------------------
1,514 1,590 1,670 1,753 1,841 1,933 2,029 2,131 2,237 2,349 19,047 27,438118,831 164,153 0 0 0 137,758 0 187,119 0 0 607,861 7,115,894
------------------ ------------------ ------------------ ------------------ ------------------ ------------------ ------------------ ------------------ ------------------ ------------------ ------------------- -------------------120,345 165,743 1,670 1,753 1,841 139,691 2,029 189,250 2,237 2,349 626,908 7,143,331
------------------ ------------------ ------------------ ------------------ ------------------ ------------------ ------------------ ------------------ ------------------ ------------------ ------------------- -------------------150,632 197,544 35,060 36,813 38,654 178,345 42,616 231,866 46,984 49,333 657,194 7,165,227
------------------ ------------------ ------------------ ------------------ ------------------ ------------------ ------------------ ------------------ ------------------ ------------------ ------------------- -------------------
118,831 164,153 0 0 0 137,758 0 187,119 0 0 607,861 7,115,893------------------ ------------------ ------------------ ------------------ ------------------ ------------------ ------------------ ------------------ ------------------ ------------------ ------------------- -------------------
118,831 164,153 0 0 0 137,758 0 187,119 0 0 607,861 7,115,893------------------ ------------------ ------------------ ------------------ ------------------ ------------------ ------------------ ------------------ ------------------ ------------------ ------------------- -------------------
31,801 33,391 35,060 36,813 38,654 40,587 42,616 44,747 46,984 49,333 49,333 49,333------------------ ------------------ ------------------ ------------------ ------------------ ------------------ ------------------ ------------------ ------------------ ------------------ ------------------- -------------------
31,801 33,391 35,060 36,813 38,654 40,587 42,616 44,747 46,984 49,333 49,333 49,333------------------ ------------------ ------------------ ------------------ ------------------ ------------------ ------------------ ------------------ ------------------ ------------------ ------------------- -------------------
0 0 0 0 0 0 0 0 0 0 0 0========== ========== ========== ========== ========== ========== ========== ========== ========== ========== ========== ==========
216

RESERVE/FUND BALANCE, JULY 1
CURRENT RESOURCES: Grant Revenue Interest Income
TOTAL CURRENT RESOURCES
TOTAL AVAILABLE RESOURCES
CURRENT REQUIREMENTS: Infrastructure Projects
TOTAL CURRENT REQUIREMENTS
RESERVES: Gen. Infrastructure Contingency Reserve
TOTAL RESERVES
FUND BALANCE, JUNE 30
FY 2016/2017TO
ACTUAL CURRENT BUDGET PLAN PLAN PLAN PLAN PLAN PLAN PLAN PLAN PLAN FY 2026/20272015/2016 2016/2017 2017/2018 2018/2019 2019/2020 2020/2021 2021/2022 2022/2023 2023/2024 2024/2025 2025/2026 2026/2027 TOTAL
------------------ ------------------ ------------------ ------------------ ------------------ ------------------ ------------------ ------------------ ------------------------------------ ------------------ ------------------ -------------------(19,358) (55,751) 0 0 0 0 0 0 0 0 0 0 (55,751)
------------------ ------------------ ------------------ ------------------ ------------------ ------------------ ------------------ ------------------ ------------------ ------------------ ------------------ ------------------ -------------------
973,525 1,020,800 0 0 0 0 0 0 0 0 0 0 1,020,8000 0 0 0 0 0 0 0 0 0 0 0 0
------------------ ------------------ ------------------ ------------------ ------------------ ------------------ ------------------ ------------------ ------------------ ------------------ ------------------ ------------------ -------------------973,525 1,020,800 0 0 0 0 0 0 0 0 0 0 1,020,800
------------------ ------------------ ------------------ ------------------ ------------------ ------------------ ------------------ ------------------ ------------------ ------------------ ------------------ ------------------ -------------------954,167 965,049 0 0 0 0 0 0 0 0 0 0 965,049
------------------ ------------------ ------------------ ------------------ ------------------ ------------------ ------------------ ------------------ ------------------ ------------------ ------------------ ------------------ -------------------
1,009,918 965,049 0 0 0 0 0 0 0 0 0 0 965,049------------------ ------------------ ------------------ ------------------ ------------------ ------------------ ------------------ ------------------ ------------------ ------------------ ------------------ ------------------ -------------------
1,009,918 965,049 0 0 0 0 0 0 0 0 0 0 965,049------------------ ------------------ ------------------ ------------------ ------------------ ------------------ ------------------ ------------------ ------------------ ------------------ ------------------ ------------------ -------------------
(55,751) 0 0 0 0 0 0 0 0 0 0 0 0------------------ ------------------ ------------------ ------------------ ------------------ ------------------ ------------------ ------------------ ------------------ ------------------ ------------------ ------------------ -------------------
(55,751) 0 0 0 0 0 0 0 0 0 0 0 0------------------ ------------------ ------------------ ------------------ ------------------ ------------------ ------------------ ------------------ ------------------ ------------------ ------------------ ------------------ -------------------
0 0 0 0 0 0 0 0 0 0 0 0 0========== ========== ========== ========== ========== ========== ========== ========== ========== ========== ========== ========== ==========
CITY OF SUNNYVALE610/700. INFRASTRUCTURE RENOVATION & REPLACEMENT FUND/HCD SUB-FUND
LONG TERM FINANCIAL PLANJULY 1, 2016 TO JUNE 30, 2027
217

This Page Intentionally Blank
218

Financial Plans -
Enterprise Funds

Enterprise FundsThe City budgets and accounts for business like activities in Enterprise
Funds. Each fund reflects a service or group of related services that are generally fee supported and independent of the City’s General Fund or other funds. These include six funds related to the City’s water, wastewater, and solid waste business operations, the operation of the Sunnyvale Materials Recovery and Transfer Station (SMaRT Station), the Development Enterprise Fund, and the Golf and Tennis Operations Fund. Each of these service areas are discussed in detail below.
Utility Enterprise Funds and Utility Rate ProcessThe following across-the-board changes to current rates for the Water,
Wastewater, and Solid Waste Utility enterprises were approved by Council approval for FY 2017/18:
Utility Rate Change
Water 12.5%
Wastewater 10.0%
Solid Waste 3.0%
Each increase and the contributing factors are discussed below. The major reasons for the required increases in rates are the lower-than-forecast water revenues and continuing rise in costs for wholesale water due to changing patterns of water consumption after years of drought, major wastewater infrastructure needs, particularly at the City’s Water Pollution Control Plant, and the City’s Zero Waste project to increase landfill diversion rates.
Monthly costs associated with water, solid waste, and wastewater services for an average residential customer will increase by 8.7% or $12.37, from $142.21 to $154.53, per month. It is important to note that even with these increases, Sunnyvale utility rates and services are competitive with our surrounding communities.
Water Supply and Distribution Fund
The Water Supply and Distribution Fund (Water Fund) accounts for all revenues and expenses related to the City-operated water utility. Expenses include costs for wholesale water, capital and infrastructure project-related costs, debt service, and other operating costs. Revenues consist of service fees for water and recycled water, water-related public works and construction fees, and interest income. Once expenditure levels are developed, water rates are set to collect enough revenue to maintain a sustainable financial position. The annual review and use of long-range financial planning and projections help minimize utility rate swings.
The largest expense of the Water Fund is the cost of purchasing water. Sunnyvale currently receives water from four different sources, the San Francisco Public Utilities Commission (SFPUC), the Santa Clara Valley Water District (SCVWD), City-owned wells, and recycled water produced by the City’s Water Pollution Control Plant. The majority of the water supply is provided by SFPUC and SCVWD, with the quantity provided established by contracts with each agency. Approximately three-quarters of a percent will come from well water, which is adequate to keep the wells fresh and operating.
The City’s water demand is extremely volatile, previously due to the drought and now because of consumer conservation as well as the impact of a very wet winter keeping demand low. While the five-year drought emergency is now declared over, consumption patterns have permanently changed due to adjustments made by consumers in response to the cut backs on the amount of water use mandated during the drought years. Throughout the twenty-year financial plan, it is assumed that water conservation efforts will continue, and that sales will not return to the levels seen in FY 2013/14 until FY 2022/23. This anticipated reduction in demand will impact both the revenue and expenses of the Fund.
City of Sunnyvale FY 2017/18 Enterprise Funds
219

The City has agreements with both SCVWD and SFPUC to purchase a minimum quantity of water each year, which are known as “take or pay” provisions in the agreement. During the ongoing drought, both wholesalers were concerned about water supplies, and chose to ease up on the take or pay provisions to encourage customers to conserve as much as possible. Effective July 1, 2017 the City’s two suppliers will resume enforcement of their contractual minimums. Even though both wholesalers plan to enforce these provisions, it is unlikely that the City will be able to meet the minimums at one or both of the wholesalers at their current levels, as our customers continue to conserve water. The City has requested a lower “take or pay” amount and revised downward its Three Year Delivery Schedules with SCVWD in anticipation of this situation. Nevertheless, the City is projecting overall water purchases costs to rise a further 17%.
The City is currently paying the SFPUC approximately $1,786 per acre foot of water, and paying SCVWD $1,178 per acre foot, including a treated water charge. The City is also paying approximately $1.5 million in FY 2017/18 to the SFPUC for the Bay Area Water Supply and Conservation Agency (BAWSCA) Surcharge which makes up Sunnyvale’s share of the debt service on bonds issued by BAWSCA in FY 2012/13. BAWSCA issued the bonds on behalf of its 26 member agencies in its effort to restructure capital debt owed to the SFPUC for facilities constructed by the SFPUC that benefit the regional customers.
Both the SFPUC and the SCVWD provided wholesale rate projections for the next ten years. Their projections have changed significantly over the previous year, as they expect to need additional revenue to make up for lost sales due to water conservation. These projections serve as a base for the long-term rate projections in the twenty-year financial plan.
The table below reflects the projections included in the financial plan for both agencies. The projected increases in the table do not reflect changes in the BAWSCA Surcharge or any other costs related to purchasing water.
Additionally, the SFPUC is projecting no rate increase for FY 2018/19. It is the City’s practice to take a conservative approach to planning for potential rate increases. Since FY 2018/19 is still two years out, the budget assumes a rate increase for that year, given the uncertainty regarding future water demand.
Projected Increases in Base Wholesale Rates
Fiscal Year SFPUC SCVWD
2017/18 0% 9.9%
2018/19 2.8% 9.9%
2019/20 3.2% 10.9%
2020/21 10.1% 10.9%
2021/22 9.9% 10.9%
2022/23 3.8% 10.9%
2023/24 4.0% 9.8%
2024/25 3.8% 7.6%
2025/26 3.8% 2.7%
2026/27 0.8% 2.7%
The projected well water total unit cost for FY 2017/18 is $1,178 per acre foot, an increase of 9.9% over the current year unit cost of $1,072. This cost includes a charge from SCVWD for pumping ground water from City wells, as well as the power costs associated with running the pumps.
The City attempts to purchase water at the lowest possible cost. The City’s water system allows the movement of water from one portion of the City to another, and this allows staff to monitor and adjust water purchases to utilize the most cost effective source or meet contractual minimums as appropriate. Water rates have risen significantly over the past four years due to ongoing drought conditions. Now that the drought is over, there is still much uncertainty regarding water demand, but the wholesalers were able to ease up on the rate increases for the coming year. For FY 2017/18, SFPUC indicated that its rate would stay flat at $1,786 per acre foot, while SCVWD is proposing to increase rates 9.9% to $1,178 per acre foot. While these rate increases are lower than those seen in recent years, both wholesalers are resuming enforcement of minimum purchase requirements, which could increase the City’s cost for purchased water if there is insufficient demand to meet our contractual obligations. Due to the lower rate increases from the
City of Sunnyvale FY 2017/18 Enterprise Funds
220

City’s wholesalers, the rate increase for FY 2017/18 of 12.5% is lower than the previous financial plan’s rate of 15%.
Lastly, the City’s Water Pollution Control Plant (WPCP) provides recycled water, which is wastewater that has been treated to very high standards.
Due to production limitations and increased chemical requirements, the City has scaled back its recycled water production. Construction is nearing completion to improve recycled water production reliability and is scheduled to be commissioned in late summer or early fall of 2017. Additionally, staff and SCVWD have ongoing discussions to partner in significant capital improvement projects that may bring recycled water to more areas of the City. The first of those projects, the Wolfe Road Recycled Water Pipeline, is nearing completion and will begin providing recycled water to use at Apple’s new campus in the coming months.
Operations and Capital Expenses
The FY 2017/18 budget for the Water Fund includes approximately $6.9 million for personnel and other costs related to operating and maintaining the water supply and distribution system. The Water Fund contains annual debt service of approximately $2.0 million in FY 2017/18. This consists of two components, the majority of which is for debt service on the City’s thirty-year Water Revenue Bonds, Series 2010, terminating in FY 2040 outside the City’s planning window. The remainder of the debt service is the Water Fund’s portion of the Certificates of Participation issued in 2001 for purchase of the 505 West Olive Avenue Government Center property. This latter debt service ends in FY 2029/30.
Like many municipalities in the state and the country, Sunnyvale’s water storage and distribution systems are over fifty years old and in need of significant rehabilitation. The Environmental Services Department prioritizes projects to address this aging water utility infrastructure. The highest priority is being placed on water pipe replacements. The FY 2017/18 financial plan continues to provide funding for infrastructure projects including main pipe replacements, the refurbishments of water tanks across the City.
Additionally, an emphasis has been placed on the City’s recycled water production and distribution system. Funding for this effort crosses both the water utility and the wastewater utility. $2.1 million has been budgeted for
Sunnyvale’s share of a regional project that includes upgrades to the San Lucar Pump Station and extension of the recycled water system along Wolfe Road to Homestead Road. Sunnyvale entered into a partnership agreement with SCVWD to fund this significant expansion of the recycled water system, which is nearing completion. Recycled water deliveries through the new extension will begin in the coming months.
By City policy, the Water Fund maintains a Contingency Reserve of 25% of operations and a Rate Stabilization Reserve to normalize rates and provide for the effect of economic cycles. This Fund also contains reserves for revenue and debt funded projects to manage the naturally uneven flow of these funds against project expenditures.
Wastewater Management FundThe Wastewater Management Fund (Wastewater Fund) accounts for
revenues and expenses related to the provision of the safe and reliable removal of wastewater from all residences and businesses in Sunnyvale. Storm water operations and infrastructure improvements, non-point source pollution prevention, and other critical public service activities are accounted for in this fund, however, funded through General Fund transfers.
The City owns and operates an extensive system for management of wastewater within City limits and in a small area in the northern portions of Cupertino and San Jose. The system includes approximately 283 miles of sewer pipes, a storm drainage system consisting of 330 miles of storm drainage pipes, and a 29.5 million gallon per day (MGD design capacity) Grade V Water Pollution Control Plant (WPCP). Operations include the transport of sewage to the treatment plant, wastewater treatment, recycled water production, industrial discharge inspection and enforcement, stormwater management, and many other services related to wastewater.
Operations and Capital Expenses
The FY 2017/18 operations expenses in the Wastewater Fund reflect personnel, chemicals, and other costs necessary to maintain the City’s sewer system and operate the Water Pollution Control Plan.
City of Sunnyvale FY 2017/18 Enterprise Funds
221

The Wastewater Utility recently completed a master planning effort for the Water Pollution Control Plant (WPCP) which consists of a number of projects that will renovate the City’s existing wastewater treatment. The Master Plan, which was approved by City Council in August of 2016, will serve as a long-term guide for replacing the WPCP’s facilities and operations. The FY 2017/18 Adopted Budget includes planned infrastructure expenditures of approximately $723 million over twenty years, with 91% (or $658 million) allocated to the WPCP Master Plan.
The first phase of the Master Plan is underway with site demolition and grading work which is nearing completion and the construction contract of the Primary Treatment Facility was awarded in Spring 2017. This includes a new headworks facility, which removes large debris from incoming sewage and pumps the sewage into new primary treatment tanks which, in turn, slow down the wastewater to settle out large solids. The existing primary treatment facilities are structurally deficient, deteriorated, and susceptible to significant failure during a seismic event. The current influent sewage pump station includes gas-powered influent engines that will not meet future emissions limits and need replacement. The new headworks and primary facilities will be located at the previous biosolids drying operation site, adjacent to the current influent pump station. Currently, biosolids drying operations are being performed mechanically by a vendor contract until new biosolids facilities are constructed. Other phase 1 projects include new parking on Caribbean Drive and Bay Trail access enhancements, and rehabilitation of influent pipelines to the treatment facility.
The second phase of the Master Plan includes new buildings for maintenance, administration staff and a laboratory, new secondary treatment, as well as a new thickening and dewatering facility and other piping and draining upgrades. Pre-construction and design activities are underway.
The WPCP Master Plan also includes $46.5 million for Program Management Services and $33 million for Construction Management. The Program Management Consultant (PMC) is responsible for quality assurance related to project design documents and will assist the City in evaluating design consultant recommendations for equipment selection and design features. The PMC provides oversight and coordination for the overall program implementation of the reconstruction program including
establishing, maintaining, and tracking project budgets and schedule. The construction management consultant provides additional technical, engineering and project support such as contractibility reviews, construction oversight, inspection services, quality assurance testing, construction schedule and budget management, construction coordination, meeting management and records management to deliver the projects in the program.
The City’s wastewater collection systems are also in need of significant rehabilitation due to their age. The FY 2017/18 Adopted Budget includes projects related to sewer and stormwater collection. The wastewater collection system consists of approximately 613 miles of sewer and storm mains, and seven pump or lift stations. The system has five major sewer trunk lines that terminate at the WPCP, where sewage is treated. Major projects include $17 million for sanitary sewer pipe improvements and $10.7 million for storm water infrastructure. Funding of $1.4 million is allocated for immediate repairs and further analysis of the Lawrence Expressway trunk line. Additional funding may be necessary based upon the conclusion of additional analysis on that sewer project.
There are over $45 million in the financial plan for stormwater program costs. The City stormwater system operates under the terms of a Municipal Stormwater National Pollutant Discharge Elimination System (NPDES) permit. These projects would implement trash reduction programs and other maintenance activities in order to meet permit requirements. The funds will provide for outreach and enforcement efforts, and fund retrofit projects that would redirect stormwater to biotreatment areas.
The Wastewater Fund has two inter-fund loans advanced from the General Fund. The first loan was to finance the remodel of the primary facilities of the WPCP, expanding the capacity from 22.5 million gallons per day to 29.5 million gallons per day. The loan was made by the General Fund in FY 1980/81 for a total of $10.7 million. The original term was for twenty years; however, payments were periodically deferred or delayed to help balance cash needs in the Wastewater Fund. Regular payments have been made as scheduled since FY 2004/05. The second loan was made to assist the Wastewater Fund with cash flow issues by providing needed cash to stabilize rates. The loan was advanced in FY 1995/96 for a total of $2.4 million. The term was for twenty years with ongoing payments also periodically deferred
City of Sunnyvale FY 2017/18 Enterprise Funds
222

until FY 2004/05. These loans were refinanced at lower interest rates for FY 2017/18 with no changes to pay-off schedules in FY 2019/20 and FY 2028/29 respectively.
Approximately $3 million annual debt service payments are largely for the Wastewater Revenue Bonds, issued in 2010 for $35 million, to refund the existing bonds and provide $22.5 million in new funds for capital and infrastructure projects. These new funds have been spent, with some of the proceeds funding the initial efforts for the renovation of the WPCP. Future debt is reflected in the New WPCP Debt Service line item. In April 2017, the City finalized documents obtaining a $127 million loan from the Clean Water State Revolving Fund Loan Program. The payments on this loan are reflected in this line item, with additional payments projected in the future for upcoming project phases. The actual amount and structure of the financing will be determined as the plan is further defined. However, it is important to note that over time, the City will be issuing bonds to fund the WPCP renovation. At its completion, the City will be paying significant annual debt service, anticipated to be approximately $41.4 million each year, accounting for almost half of the Fund’s total resource requirements. This level of debt service will require multiple years of rate increases to fund the scheduled projects in the immediate fiscal years. However, mid and long-term rate assumptions are forecast to decline to low single digits, reaching as low as 1%, starting from FY 2026/27, and rise again as additional phases of the reconstruction projects are implemented.
Debt service is also included for the Wastewater Fund’s portion of the Certificates of Participation issued in 2001 for purchase of the 505 West Olive Avenue Government Center property.
In order to help the Solid Waste Management Fund with cash flow issues, the Wastewater Fund loaned the Solid Waste Fund $2 million in FY 2011/12. Payment is deferred to FY 2017/18 and then repaid over a seven-year period. This helped the Solid Waste Fund with cash it needed and helps the Wastewater Fund in the future as its cash needs increase to fund the new WPCP. As part of the FY 2017/18 Adopted Budget, the interest rate to this loans has been amended to reflect an average of the assumed pooled investment rate earned by the City over the remaining term of the loan. This loan is anticipated to be repaid in FY 2020/21.
By City policy, the Wastewater Fund maintains a Contingency Reserve of 25% of operations and a Rate Stabilization Reserve to normalize rates and provide for the effect of economic cycles. This Fund also contains a capital and infrastructure reserve at 10% of service fee revenue and a debt service reserve based upon bond covenants of issued or anticipated debt.
Solid Waste Management Fund
The Solid Waste Management Fund (Solid Waste Fund) accounts for the revenues and expenses related to collection, recycling, and disposal of solid waste generated within the City of Sunnyvale. A private company, Bay Counties Waste Services, doing business in Sunnyvale as Specialty Solid Waste & Recycling (Specialty), has an exclusive franchise for collection of solid waste and recyclable materials through 2021, and these contract costs are reflected here. Operation of the Sunnyvale Materials Recovery and Transfer (SMaRT®) Station and disposal of refuse at the Kirby Canyon Landfill are captured in their own fund, but the City’s share of these activities is reflected in the Solid Waste Fund.
The City’s franchise with Specialty is the largest single expense within the Solid Waste Fund and makes up 43% of the total expenses in the FY 2017/18 Adopted Budget for the solid waste system. The City’s payment for the following fiscal year is driven primarily by actual expenditures from the last full fiscal year, adjusted by various indexes as identified in the contract. The projected FY 2017/18 contractor payment is $21 million, which is a 3.7% increase from the current FY 2016/17 contractor payment. This increase is in line with San Francisco Bay Area December 2016 CPI-U rate, driven by a combination of equipment fees related to new food scrap collection service and rising fuel charges.
The Solid Waste Fund has two inter-fund loans from the General Fund. The first loan provided a total of $3.68 million during 1985, 1988 and 1989 for construction of a system to convert methane gas to a marketable form of energy. The second loan, for $10.5 million, was to stabilize solid waste rates between FY 1994/95 and FY 1998/99. Both loans were refinanced this year, generating interest savings of over $4.8 million for the remaining term of the loan, with no changes to payoff schedule.
City of Sunnyvale FY 2017/18 Enterprise Funds
223

Additionally, in order to help with cash flow purposes, the Solid Waste Fund reflects a $2 million loan made in FY 2011/12 from the Wastewater Fund. Payment was deferred to FY 2015/16 and then repaid over a seven-year period. This helps the Solid Waste Fund with short term cash flow, and the Wastewater Fund with cash it needs in the future to fund the new WPCP. This was also refinanced, reflecting interest savings of over $161,000 over the repayment period.
Debt service expenditures reflect Sunnyvale’s portion of the debt service for the original cost of the SMaRT Station facility and replacement equipment, as well as the estimated portion of debt which will be issued in FY 2021/22 and FY 2022/23 for a new materials recovery system. Debt service also includes the Solid Waste Fund’s portion of the Certificates of Participation issued in 2001 for purchase of the 505 West Olive Avenue Government Center property.
The Fund also includes a project to implement the City’s Zero Waste policy. The project includes $35 million to fund new practices aimed at meeting the Zero Waste Strategic Plan goals of 75% diversion by 2020. This project does not incorporate the costs necessary to reach the goal of 90% diversion by 2030 due to uncertainty regarding legal and technical barriers to meeting the 90% goal. Methods planned to increase the diversion rate include implementation of new SMaRT equipment, programs related to food scraps and commercial yard trimmings, and the implementation of City-wide multi-family recycling. The additional diversion is expected to generate approximately $889,000 per year in operating savings due to a reduction in landfill expenditures.
In FY 2017/18, a residential split cart program called FoodCycle will be implemented. The new carts will accommodate a smaller garbage volume than the current carts, but there will be an additional separate compartment for food scrap collection. This program is being implemented following a successful pilot of the carts during FY 2016/17. Food scraps make up approximately 30 percent of the garbage collected from Sunnyvale homes and contribute to greenhouse gas production when they decompose in a landfill. Through FoodCycle, residents will separate this valuable resource and place it in the food scraps side of the new cart. The carts will be emptied into a two-compartment truck that keeps food scraps and garbage separate. Then,
instead of sending food scraps to the landfill, they will be taken to a local facility to be made into a protein-rich ingredient for pig, fish and chicken feed. Participation in FoodCycle will help Sunnyvale reach its Zero Waste goal of keeping 75% of our waste out of the landfill by 2020.
By fiscal policy, the Solid Waste Fund maintains a Contingency Reserve of 10% of operations. This is less than the 25% required for the Water and Wastewater Funds to reflect the fact that this operation has less City-owned infrastructure at risk for damage or disaster. The Fund also maintains a Rate Stabilization Reserve similar to the other utilities.
Sunnyvale Materials Recovery and Transfer (SMaRT) Station Fund
The Sunnyvale Materials Recovery and Transfer (SMaRT) Station began operations in October 1993. The costs of building, maintaining, and operating the SMaRT Station® are shared by the cities of Sunnyvale, Mountain View and Palo Alto as specified by a Memorandum of Understanding (MOU) among the cities. Operating costs and revenues from the sale of recyclables are charged to or distributed to the cities based on the total tons of solid waste each community brings to the SMaRT Station for materials recovery, transfer, and disposal. At current garbage delivery rates, Sunnyvale is responsible for about half of the SMaRT Station operating expenditures and receives about half of the revenues earned by the cities from recyclables removed from the garbage. The capital cost of the SMaRT Station was financed by the sale of revenue bonds by Sunnyvale. Those bonds were refinanced in FY 2014/15 to take advantage of the lower interest rates available, generating a savings to the City’s debt service obligations of approximately $956,000. The debt service on the bonds is shared among the three cities as specified in the MOU. The SMaRT Station MOU expires in FY 2021/22.
The SMaRT Station Operations Fund was established to account for operations at the facility. It receives revenue from charges to the cities of Sunnyvale (Solid Waste Fund), Mountain View, and Palo Alto, and from the sale of recyclables. Major operating cost components include the SMaRT Station operator contract and disposal fees and taxes collected by the Kirby Canyon Landfill. The Fund is managed so that annual revenues and expenditures are in balance and that no fund balance is carried forward to the next year.
City of Sunnyvale FY 2017/18 Enterprise Funds
224

The SMaRT Station is operated by a private company under contract with the City. A Request for Proposals (RFP) process was completed in 2014 for the operation of the SMaRT Station. The City Council awarded the contract to Bay Counties Waste Services on June 24, 2014. Bay Counties Waste Services held the previous agreement as well, and began operations on January 1, 2008. The FY 2017/18 Adopted Budget incorporates SMaRT Station expenses based on these contractual terms.
The SMaRT Station Replacement Fund provides for the replacement of City-owned SMaRT Station equipment. The three participating cities contribute to these efforts and to payment of debt service based on fixed percentages established by the SMaRT Station MOU. Debt service reflects payment through FY 2017/18 for debt issued for the original cost of the facility, and through FY 2020/21 for replacement of materials recovery facility equipment.
Staff anticipates that while most of the facility’s equipment and the overall SMaRT Station can be maintained in good working order through the term of the MOU, there will come a point when the facility and equipment will need replacement or rehabilitation. In order to allow for the cost impact of this eventuality, funding is projected for a new materials recovery system and any other improvements needed to the SMaRT Station Facility in FY 2021/22, with annual debt service of $2 million. Funding is provided for planning and inter-jurisdictional coordination in FY 2017/18 through FY 2019/20, with design and construction following in FY 2020/21 through FY 2022/23. This project could replace the SMaRT station, or it could implement some other solution for the management of solid waste and recyclables in the City. The Adopted Budget is based on the initial construction cost of the SMaRT Station. It is anticipated that the cost for the ultimate replacement will be refined during the planning phase of the project.
Development Enterprise Fund
This fund was established with the FY 2014/15 Budget in order to better align development-related revenues and expenses. Prior to the creation of this fund, development-related activities and associated revenues were included in the General Fund across a range of operating activities, focused primarily within the Building and Planning divisions of the Community Development Department.
Development-related revenues include the major fees for permits and licenses that the City collects, as well as from Plan Check Fees and Engineering Fees. These revenue sources tend to increase and decrease with development cycles, and over the past eight years (five in the General Fund and three in the Development Enterprise Fund), the City has seen significant fluctuations in the amount of development-related revenue received. When the recession hit in FY 2008/09, activity slowed considerably with revenues declining to $5.2 million in FY 2009/10. The rebound, however, began the following year and continued to accelerate through FY 2015/16 which ended the year with $15.8 million in revenue. FY 2016/17 total development-related revenues are estimated to end the year at $14.3 million, and staff is projecting that the anticipated level of development activity will moderate beginning in FY 2017/18, with planned revenues of $11.7 million and $11.1 million for FY 2017/18 and FY 2018/19, respectively. Revenues from FY 2019/20 forward are based on the historical average of $10.5 million. It should be noted that this historical average has increased significantly over recent years, with six consecutive years of record high development activity.
Operating expenditures support the administration and regulation of development related activity in the City. This includes activities and services across multiple departments. Building Safety and Planning activities in the Community Development Department comprise approximately 60% of the total operating costs in this fund. Operations are also budgeted for fire prevention and hazardous material service program activities in the Department of Public Safety, development-related transportation and traffic services and land development-engineering services in the Department of Public Works; as well as very specific operating activities in the Environmental Services Department, Department of Library and Community Services, and the Office of the City Attorney that relate to development in the City. Additionally, the operation budget includes resources for limited term staffing to address peak workloads. Staffing is planned through FY 2018/19 with the need to extend being regularly reviewed.
The Projects in the Development Enterprise Fund are for temporary staffing for the five divisions (Planning, Building, Traffic & Transportation, Fire Prevention, and Engineering) to address the peak demand which these divisions continue to experience. Additionally, $50,000 is programmed in FY 2016/17 to repair the City’s aging One Stop Permit Center. Program In-Lieu
City of Sunnyvale FY 2017/18 Enterprise Funds
225

Charges reflect indirect costs charged to the Development Enterprise Fund for program overhead expenses. The Transfer to the General Services Fund provides funding for the project to replace the City’s Permitting System.
The direct and indirect costs in the Development Enterprise Fund exceed the historical average level of development revenues, which represents a structural challenge for the Fund. The operating expenses are predominantly fixed. However, some of the costs are variable and will fluctuate with the level of development activity. Fund balance will be drawn down, as intended, in years where the development revenue declines to the historical average or lower. Given that this fund will enable visibility toward the actual revenue and expenses over time, fee levels will need to be reviewed and adjusted on an ongoing basis to ensure full cost recovery over the long term and fiscal stability for the fund.
Golf and Tennis Operations Fund
Golf and tennis operations have been operating as a stand-alone enterprise fund since FY 2012/13, following the dissolution of the Community Recreation Fund, with all activities intended to be self- supporting. However, the golf operations of the Golf and Tennis Enterprise Fund has struggled to operate as a true enterprise fund due to a number of reasons including the overall decline in popularity in golf, the closure of the golf course restaurants while the City transitioned to new operators, and the quality of the golf buildings. This has affected the number of rounds played at the golf courses, which have continued to decline, and additional General Fund transfers were made or approved during the last two and current fiscal years in the amount of $1.44 million to account for the loss in revenue (FY 2014/15: $140,000; FY 2015/16: $450,000; FY 2016/17: $850,000). This has kept the Golf and Tennis Operations Fund in a positive cash position, allow for the establishment of new concessions, explore creative marketing strategies to attract new patrons and maximize revenue opportunities.
Golf and tennis operations continue to face challenges over the twenty-year financial plan. These challenges include rising costs including water and retirement costs, continued deferred capital maintenance, and the continued decline in the interest in golf nationally. Revenues are projected to grow at a modest rate of 2% per year. Cost reduction efforts will continue through operational efficiencies, including water conservation and a restructure plan that will reduce labor costs through personnel attrition. Although positive strides in reducing operating costs are being made, expenses are projected to grow faster than 2% per year. An additional concern over the longer term is that existing capital improvement projects at the golf courses will only be funded by Park Dedication Fees, which is scheduled to decrease substantially after FY 2023/24, with only minor improvements thereafter, until FY 2034/35, which was directed by Council in RTC 11-082. After this, golf and tennis revenues are expected to fund any new capital or infrastructure projects.
The FY 2017/18 Adopted Budget includes General Fund contribution averaging $1.4 million annually until FY 2023/24 when substantial capital contributions are planned to end, in order to maintain the fund in a positive position, with fiscal strategies required beyond that point to fund operations and deferred capital infrastructure maintenance. As reported to Council at the April 18, 2017 Meeting, Staff plans to evaluate options regarding golf course operations during the next fiscal year and will bring forward recommendations for Council consideration.
City of Sunnyvale FY 2017/18 Enterprise Funds
226

RESERVE/FUND BALANCE, JULY 1
CURRENT RESOURCES:Water Sales and Water Service FeesDevelopment and Connection FeesMiscellaneous RevenuesInterest IncomeTransfer From Other Funds
TOTAL CURRENT RESOURCES
TOTAL AVAILABLE RESOURCES
CURRENT REQUIREMENTS:OPERATING REQUIREMENTS:
OperationsPurchased WaterProject Operating CostsIn-Lieu Charges
TOTAL OPERATING REQUIREMENTS
NON-OPERATING REQUIREMENTS:Debt ServiceTransfer To General FundTransfer To General Services FundTransfer To Infrastructure FundTransfer To Solid Waste FundTransfer To Wastewater Fund
TOTAL NON-OPERATING REQUIREMENTS
CAPITAL AND INFRASTRUCTURE REQ.:Projects - Debt FundedProjects - Revenue Funded
TOTAL CAPITAL AND INFRASTRUCTURE REQ.
TOTAL CURRENT REQUIREMENTS
RESERVES:Debt ServiceContingenciesCapital and Infrastructure ReserveRate Stabilization Reserve
TOTAL RESERVES
FUND BALANCE, JUNE 30
STATISTICS:Recommended Water Rate IncreasePrior Year Water Rate Increase
FY 2016/2017TO
ACTUAL CURRENT BUDGET PLAN PLAN PLAN PLAN PLAN PLAN PLAN PLAN PLAN FY 2026/20272015/2016 2016/2017 2017/2018 2018/2019 2019/2020 2020/2021 2021/2022 2022/2023 2023/2024 2024/2025 2025/2026 2026/2027 TOTAL
-------------------- -------------------- -------------------- -------------------- -------------------- -------------------- -------------------- -------------------- -------------------- -------------------- -------------------- -------------------- ----------------------22,982,779 22,320,515 15,972,026 16,375,581 23,237,075 25,397,891 26,684,499 25,264,368 22,658,253 23,215,400 25,384,783 25,642,626 22,320,515
-------------------- -------------------- -------------------- -------------------- -------------------- -------------------- -------------------- -------------------- -------------------- -------------------- -------------------- -------------------- ----------------------
34,887,330 42,031,021 47,284,899 50,831,266 53,372,830 56,041,471 58,843,545 63,256,810 68,317,355 71,247,469 74,329,487 75,865,440 661,421,5931,048,252 1,303,874 1,611,244 1,643,469 1,631,633 1,664,266 1,697,551 1,731,502 1,766,133 1,801,455 1,837,484 1,875,652 18,564,264
364,566 359,199 328,913 341,675 352,134 362,984 374,241 389,434 406,260 418,157 430,591 439,340 4,202,928156,764 111,027 202,168 399,655 497,998 777,218 735,855 659,949 676,177 739,363 746,873 831,631 6,377,914
62,809 93,949 0 0 79,591 0 0 0 0 0 0 0 173,540-------------------- -------------------- -------------------- -------------------- -------------------- -------------------- -------------------- -------------------- -------------------- -------------------- -------------------- -------------------- ----------------------
36,519,720 43,899,069 49,427,224 53,216,065 55,934,186 58,845,939 61,651,193 66,037,696 71,165,925 74,206,444 77,344,435 79,012,062 690,740,239-------------------- -------------------- -------------------- -------------------- -------------------- -------------------- -------------------- -------------------- -------------------- -------------------- -------------------- -------------------- ----------------------
59,502,499 66,219,584 65,399,250 69,591,646 79,171,261 84,243,830 88,335,692 91,302,064 93,824,179 97,421,844 102,729,218 104,654,688 713,060,753-------------------- -------------------- -------------------- -------------------- -------------------- -------------------- -------------------- -------------------- -------------------- -------------------- -------------------- -------------------- ----------------------
6,297,990 6,316,385 6,955,883 7,194,669 7,422,908 7,642,008 7,854,552 8,058,312 8,260,651 8,303,984 8,523,463 8,673,227 85,206,04323,072,760 25,907,037 30,255,070 32,007,351 34,006,881 38,397,742 42,774,819 46,079,700 49,631,726 52,972,722 55,152,554 56,606,080 463,791,682
0 (58,634) 0 0 0 0 0 0 0 0 0 0 (58,634)3,435,660 3,769,477 3,975,923 3,840,575 4,113,212 3,875,857 4,164,930 4,966,784 4,436,314 4,200,722 4,834,821 4,582,955 46,761,570
-------------------- -------------------- -------------------- -------------------- -------------------- -------------------- -------------------- -------------------- -------------------- -------------------- -------------------- -------------------- ----------------------32,806,411 35,934,265 41,186,876 43,042,595 45,543,002 49,915,607 54,794,301 59,104,795 62,328,691 65,477,428 68,510,839 69,862,263 595,700,662
-------------------- -------------------- -------------------- -------------------- -------------------- -------------------- -------------------- -------------------- -------------------- -------------------- -------------------- -------------------- ----------------------
1,927,706 1,936,286 1,937,426 1,435,580 1,437,018 1,442,984 1,447,115 1,446,346 1,449,246 1,449,498 1,448,081 1,449,994 16,879,574130,000 0 0 0 92,819 94,675 0 0 0 0 0 0 187,494
0 0 597,940 0 0 0 0 0 0 0 0 6,155 604,0953,672 28,357 6,180 18,243 6,430 6,558 6,689 6,823 6,960 7,099 7,312 7,531 108,182
0 513,000 432,562 0 0 0 0 0 0 0 0 0 945,562798,248 155,000 0 0 0 0 0 0 0 0 0 0 155,000
-------------------- -------------------- -------------------- -------------------- -------------------- -------------------- -------------------- -------------------- -------------------- -------------------- -------------------- -------------------- ----------------------2,859,626 2,632,643 2,974,108 1,453,823 1,536,267 1,544,217 1,453,804 1,453,169 1,456,206 1,456,597 1,455,393 1,463,680 18,879,907
-------------------- -------------------- -------------------- -------------------- -------------------- -------------------- -------------------- -------------------- -------------------- -------------------- -------------------- -------------------- ----------------------
409,394 0 0 0 0 0 0 0 0 0 0 0 01,106,553 11,680,650 4,862,685 1,858,154 6,694,101 6,099,507 6,823,218 8,085,846 6,823,882 5,103,036 7,120,361 4,776,068 69,927,508
-------------------- -------------------- -------------------- -------------------- -------------------- -------------------- -------------------- -------------------- -------------------- -------------------- -------------------- -------------------- ----------------------1,515,947 11,680,650 4,862,685 1,858,154 6,694,101 6,099,507 6,823,218 8,085,846 6,823,882 5,103,036 7,120,361 4,776,068 69,927,508
-------------------- -------------------- -------------------- -------------------- -------------------- -------------------- -------------------- -------------------- -------------------- -------------------- -------------------- -------------------- ----------------------37,181,984 50,247,558 49,023,669 46,354,571 53,773,370 57,559,331 63,071,324 68,643,810 70,608,779 72,037,061 77,086,592 76,102,011 684,508,077
-------------------- -------------------- -------------------- -------------------- -------------------- -------------------- -------------------- -------------------- -------------------- -------------------- -------------------- -------------------- ----------------------
1,008,651 1,009,552 1,007,764 754,819 755,166 755,827 756,418 756,940 757,394 758,055 758,005 758,679 758,6797,342,688 8,055,855 9,302,738 9,800,505 10,357,447 11,509,938 12,657,343 13,534,503 14,473,094 15,319,177 15,919,004 16,319,827 16,319,827
11,680,650 1,862,685 4,922,506 5,281,641 5,535,660 5,806,872 6,091,534 6,537,775 7,048,975 7,346,708 7,659,756 7,818,043 7,818,0432,288,525 5,043,933 1,142,573 7,400,110 8,749,617 8,611,863 5,759,074 1,829,036 935,937 1,960,843 1,305,860 3,656,127 3,656,127
-------------------- -------------------- -------------------- -------------------- -------------------- -------------------- -------------------- -------------------- -------------------- -------------------- -------------------- -------------------- ----------------------22,320,515 15,972,026 16,375,581 23,237,075 25,397,891 26,684,499 25,264,368 22,658,253 23,215,400 25,384,783 25,642,626 28,552,677 28,552,677
-------------------- -------------------- -------------------- -------------------- -------------------- -------------------- -------------------- -------------------- -------------------- -------------------- -------------------- -------------------- ----------------------0 0 0 0 0 0 0 0 0 0 0 0 0
============ ============ ============ ============ ============ ============ ============ ============ ============ ============ ============ ============ ============
20.0% 25.0% 12.5% 7.5% 5.0% 5.0% 5.0% 7.5% 8.0% 7.5% 7.5% 2.0%20.0% 25.0% 15.0% 10.0% 7.0% 4.0% 3.5% 3.5% 3.0% 2.0% 2.0% 2.0%
460. WATER SUPPLY AND DISTRIBUTION FUND
JULY 1, 2016 TO JUNE 30, 2027LONG TERM FINANCIAL PLAN
CITY OF SUNNYVALE
227

RESERVE/FUND BALANCE, JULY 1
CURRENT RESOURCES:Water Sales and Water Service FeesDevelopment and Connection FeesMiscellaneous RevenuesInterest IncomeTransfer From Other Funds
TOTAL CURRENT RESOURCES
TOTAL AVAILABLE RESOURCES
CURRENT REQUIREMENTS:OPERATING REQUIREMENTS:
OperationsPurchased WaterProject Operating CostsIn-Lieu Charges
TOTAL OPERATING REQUIREMENTS
NON-OPERATING REQUIREMENTS:Debt ServiceTransfer To General FundTransfer To General Services FundTransfer To Infrastructure FundTransfer To Solid Waste FundTransfer To Wastewater Fund
TOTAL NON-OPERATING REQUIREMENTS
CAPITAL AND INFRASTRUCTURE REQ.:Projects - Debt FundedProjects - Revenue Funded
TOTAL CAPITAL AND INFRASTRUCTURE REQ.
TOTAL CURRENT REQUIREMENTS
RESERVES:Debt ServiceContingenciesCapital and Infrastructure ReserveRate Stabilization Reserve
TOTAL RESERVES
FUND BALANCE, JUNE 30
STATISTICS:Recommended Water Rate IncreasePrior Year Water Rate Increase
FY 2027/2028 FY 2016/2017TO TO
PLAN PLAN PLAN PLAN PLAN PLAN PLAN PLAN PLAN PLAN FY 2036/2037 FY 2036/20372027/2028 2028/2029 2029/2030 2030/2031 2031/2032 2032/2033 2033/2034 2034/2035 2035/2036 2036/2037 TOTAL TOTAL
-------------------- -------------------- -------------------- -------------------- -------------------- -------------------- -------------------- -------------------- ----------------------------------------- ---------------------- ----------------------28,552,677 28,722,474 31,827,876 29,842,337 33,262,423 30,268,306 33,121,412 31,396,871 36,890,198 34,192,295 28,552,677 22,320,515
-------------------- -------------------- -------------------- -------------------- -------------------- -------------------- -------------------- -------------------- -------------------- -------------------- ---------------------- ----------------------
77,433,147 78,207,479 78,989,554 80,569,345 82,583,578 84,648,168 88,880,576 90,658,188 92,170,121 97,496,800 851,636,957 1,513,058,5491,931,921 1,989,879 2,049,575 2,111,062 2,174,394 2,239,626 2,306,140 2,375,324 2,445,888 2,519,265 22,143,073 40,707,337
450,825 460,649 470,729 482,955 496,469 510,365 529,609 543,364 556,653 568,948 5,070,568 9,273,4961,104,711 1,224,149 1,147,782 1,279,324 1,164,166 1,273,900 1,207,572 1,418,854 1,315,088 1,614,713 12,750,259 19,128,173
0 0 100,882 0 0 0 0 0 0 0 100,882 274,422-------------------- -------------------- -------------------- -------------------- -------------------- -------------------- -------------------- -------------------- -------------------- -------------------- ---------------------- ----------------------
80,920,605 81,882,156 82,758,522 84,442,686 86,418,608 88,672,059 92,923,897 94,995,730 96,487,750 102,199,726 891,701,739 1,582,441,978-------------------- -------------------- -------------------- -------------------- -------------------- -------------------- -------------------- -------------------- -------------------- -------------------- ---------------------- ----------------------
109,473,282 110,604,630 114,586,399 114,285,023 119,681,031 118,940,364 126,045,308 126,392,601 133,377,948 136,392,021 920,254,416 1,604,762,492-------------------- -------------------- -------------------- -------------------- -------------------- -------------------- -------------------- -------------------- -------------------- -------------------- ---------------------- ----------------------
8,636,364 8,818,194 9,003,887 9,193,524 9,387,191 9,584,975 9,786,963 9,993,246 10,203,917 10,419,069 95,027,331 180,233,37358,142,346 59,737,743 61,447,371 63,188,180 65,049,921 67,050,863 69,069,348 70,792,781 72,578,604 74,815,847 661,873,004 1,125,664,686
0 0 0 0 0 0 0 0 0 0 0 (58,634)4,884,443 4,642,621 5,261,519 4,979,324 5,438,830 5,261,970 6,065,818 5,643,768 6,223,440 6,010,348 54,412,082 101,173,652
-------------------- -------------------- -------------------- -------------------- -------------------- -------------------- -------------------- -------------------- -------------------- -------------------- ---------------------- ----------------------71,663,154 73,198,558 75,712,777 77,361,029 79,875,942 81,897,808 84,922,129 86,429,795 89,005,960 91,245,264 811,312,416 1,407,013,077
-------------------- -------------------- -------------------- -------------------- -------------------- -------------------- -------------------- -------------------- -------------------- -------------------- ---------------------- ----------------------
1,450,346 1,448,754 1,450,216 1,449,470 1,364,525 1,369,375 1,366,600 1,366,463 1,368,700 1,368,050 14,002,498 30,882,0720 0 0 70,048 122,366 0 0 0 0 0 192,414 379,9080 0 0 0 7,135 0 0 0 0 0 7,135 611,230
55,422 7,990 8,229 8,476 8,731 8,993 8,993 22,075 9,540 9,540 147,989 256,1710 0 0 0 0 0 0 0 0 0 0 945,5620 0 0 0 0 0 0 0 0 0 0 155,000
-------------------- -------------------- -------------------- -------------------- -------------------- -------------------- -------------------- -------------------- -------------------- -------------------- ---------------------- ----------------------1,505,768 1,456,744 1,458,445 1,527,994 1,502,757 1,378,368 1,375,593 1,388,538 1,378,240 1,377,591 14,350,036 33,229,943
-------------------- -------------------- -------------------- -------------------- -------------------- -------------------- -------------------- -------------------- -------------------- -------------------- ---------------------- ----------------------
0 0 0 0 0 0 0 0 0 0 0 07,581,885 4,121,452 7,572,840 2,133,578 8,034,026 2,542,777 8,350,715 1,684,071 8,801,452 1,786,631 52,609,427 122,536,935
-------------------- -------------------- -------------------- -------------------- -------------------- -------------------- -------------------- -------------------- -------------------- -------------------- ---------------------- ----------------------7,581,885 4,121,452 7,572,840 2,133,578 8,034,026 2,542,777 8,350,715 1,684,071 8,801,452 1,786,631 52,609,427 122,536,935
-------------------- -------------------- -------------------- -------------------- -------------------- -------------------- -------------------- -------------------- -------------------- -------------------- ---------------------- ----------------------80,750,808 78,776,753 84,744,062 81,022,601 89,412,725 85,818,953 94,648,437 89,502,404 99,185,652 94,409,486 878,271,880 1,562,779,957
-------------------- -------------------- -------------------- -------------------- -------------------- -------------------- -------------------- -------------------- -------------------- -------------------- ---------------------- ----------------------
759,186 760,064 761,458 762,059 762,059 762,059 761,721 761,721 761,721 761,397 761,397 761,39716,694,678 17,138,984 17,612,814 18,095,426 18,609,278 19,158,959 19,714,078 20,196,507 20,695,630 21,308,729 21,308,729 21,308,729
7,981,589 8,065,801 8,150,986 8,316,336 8,525,444 8,739,816 9,171,632 9,357,688 9,517,266 10,058,501 10,058,501 10,058,5013,287,021 5,863,027 3,317,079 6,088,602 2,371,525 4,460,578 1,749,440 6,574,282 3,217,678 9,853,908 9,853,908 9,853,908
-------------------- -------------------- -------------------- -------------------- -------------------- -------------------- -------------------- -------------------- -------------------- -------------------- ---------------------- ----------------------28,722,474 31,827,876 29,842,337 33,262,423 30,268,306 33,121,412 31,396,871 36,890,198 34,192,295 41,982,536 41,982,536 41,982,536
-------------------- -------------------- -------------------- -------------------- -------------------- -------------------- -------------------- -------------------- -------------------- -------------------- ---------------------- ----------------------0 0 0 0 0 0 0 0 0 0 0 0
============ ============ ============ ============ ============ ============ ============ ============ ======================== ============ ============
2.0% 1.0% 1.0% 2.0% 2.5% 2.5% 5.0% 2.0% 2.0% 1.0%2.0% 2.0% 2.0% 2.0% 2.0% 2.0% 2.5% 2.5% 2.5% 0.0%
LONG TERM FINANCIAL PLAN460. WATER SUPPLY AND DISTRIBUTION FUND
CITY OF SUNNYVALE
JULY 1, 2027 TO JUNE 30, 2037
228
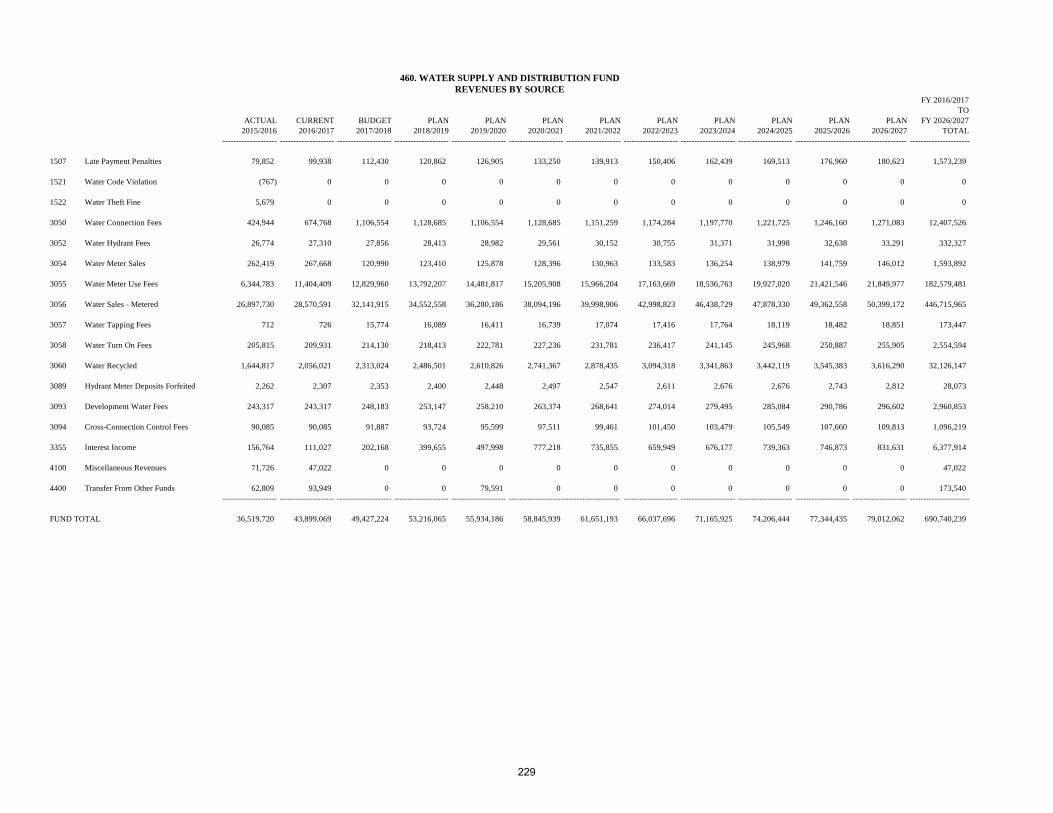
1507 Late Payment Penalties
1521 Water Code Violation
1522 Water Theft Fine
3050 Water Connection Fees
3052 Water Hydrant Fees
3054 Water Meter Sales
3055 Water Meter Use Fees
3056 Water Sales - Metered
3057 Water Tapping Fees
3058 Water Turn On Fees
3060 Water Recycled
3089 Hydrant Meter Deposits Forfeited
3093 Development Water Fees
3094 Cross-Connection Control Fees
3355 Interest Income
4100 Miscellaneous Revenues
4400 Transfer From Other Funds
FUND TOTAL
FY 2016/2017TO
ACTUAL CURRENT BUDGET PLAN PLAN PLAN PLAN PLAN PLAN PLAN PLAN PLAN FY 2026/20272015/2016 2016/2017 2017/2018 2018/2019 2019/2020 2020/2021 2021/2022 2022/2023 2023/2024 2024/2025 2025/2026 2026/2027 TOTAL
-------------------- -------------------- -------------------- -------------------- -------------------- -------------------- -------------------- -------------------- -------------------- -------------------- ----------------------------------------- ----------------------
79,852 99,938 112,430 120,862 126,905 133,250 139,913 150,406 162,439 169,513 176,960 180,623 1,573,239
(767) 0 0 0 0 0 0 0 0 0 0 0 0
5,679 0 0 0 0 0 0 0 0 0 0 0 0
424,944 674,768 1,106,554 1,128,685 1,106,554 1,128,685 1,151,259 1,174,284 1,197,770 1,221,725 1,246,160 1,271,083 12,407,526
26,774 27,310 27,856 28,413 28,982 29,561 30,152 30,755 31,371 31,998 32,638 33,291 332,327
262,419 267,668 120,990 123,410 125,878 128,396 130,963 133,583 136,254 138,979 141,759 146,012 1,593,892
6,344,783 11,404,409 12,829,960 13,792,207 14,481,817 15,205,908 15,966,204 17,163,669 18,536,763 19,927,020 21,421,546 21,849,977 182,579,481
26,897,730 28,570,591 32,141,915 34,552,558 36,280,186 38,094,196 39,998,906 42,998,823 46,438,729 47,878,330 49,362,558 50,399,172 446,715,965
712 726 15,774 16,089 16,411 16,739 17,074 17,416 17,764 18,119 18,482 18,851 173,447
205,815 209,931 214,130 218,413 222,781 227,236 231,781 236,417 241,145 245,968 250,887 255,905 2,554,594
1,644,817 2,056,021 2,313,024 2,486,501 2,610,826 2,741,367 2,878,435 3,094,318 3,341,863 3,442,119 3,545,383 3,616,290 32,126,147
2,262 2,307 2,353 2,400 2,448 2,497 2,547 2,611 2,676 2,676 2,743 2,812 28,073
243,317 243,317 248,183 253,147 258,210 263,374 268,641 274,014 279,495 285,084 290,786 296,602 2,960,853
90,085 90,085 91,887 93,724 95,599 97,511 99,461 101,450 103,479 105,549 107,660 109,813 1,096,219
156,764 111,027 202,168 399,655 497,998 777,218 735,855 659,949 676,177 739,363 746,873 831,631 6,377,914
71,726 47,022 0 0 0 0 0 0 0 0 0 0 47,022
62,809 93,949 0 0 79,591 0 0 0 0 0 0 0 173,540-------------------- -------------------- -------------------- -------------------- -------------------- ----------------------------------------- -------------------- -------------------- -------------------- -------------------- -------------------- ----------------------
36,519,720 43,899,069 49,427,224 53,216,065 55,934,186 58,845,939 61,651,193 66,037,696 71,165,925 74,206,444 77,344,435 79,012,062 690,740,239
460. WATER SUPPLY AND DISTRIBUTION FUNDREVENUES BY SOURCE
229

This Page Intentionally Blank
230

RESERVE/FUND BALANCE, JULY 1
CURRENT RESOURCES: Service Fees Connection and Development Fees Other Revenues Interest Income Transfer From General Fund (Storm Sewer) Transfer From Solid Waste Management Fund Transfer From Water Fund State Revolving Fund Loan New WPCP Bond Proceeds
TOTAL CURRENT RESOURCES
TOTAL AVAILABLE RESOURCES
CURRENT REQUIREMENTS: OPERATING REQUIREMENTS: Operations In-Lieu Charges and Fund Transfers Project Operating
TOTAL CURRENT OPERATING REQUIREMENTS
NON-OPERATING REQUIREMENTS: Interfund Loan Repayment Debt Service New WPCP Debt Service Water Pollution Control Plant Rent Transfer To Water Supply and Distribution Fund Wastewater Equipment Replacement Transfer To General Fund (Power Generation Facility) Transfer To Solid Waste Management Fund
TOTAL NON-OPERATING REQUIREMENTS
CAPITAL AND INFRASTRUCTURE REQ.: Projects - Revenue Funded Replacement of WPCP Replacement of WPCP - Revenue Funded
TOTAL CAPITAL AND INFRASTRUCTURE REQ.
TOTAL CURRENT REQUIREMENTS
RESERVES: Debt Service Contingencies Capital and Infrastructure Reserve Rate Stabilization Reserve
TOTAL RESERVES
FUND BALANCE, JUNE 30
STATISTICS: Sewer Rate Increase Prior Year Sewer Rate Increase
FY 2016/2017TO
ACTUAL CURRENT BUDGET PLAN PLAN PLAN PLAN PLAN PLAN PLAN PLAN PLAN FY 2026/20272015/2016 2016/2017 2017/2018 2018/2019 2019/2020 2020/2021 2021/2022 2022/2023 2023/2024 2024/2025 2025/2026 2026/2027 TOTAL
--------------------- --------------------- --------------------- --------------------- --------------------- --------------------- --------------------- --------------------- --------------------- --------------------- --------------------- --------------------- -----------------------26,537,989 25,781,949 17,632,469 22,977,804 27,910,406 29,231,556 31,686,041 31,287,996 34,645,847 33,598,969 35,284,869 34,861,678 25,781,949
--------------------- --------------------- --------------------- --------------------- --------------------- --------------------- --------------------- --------------------- --------------------- --------------------- --------------------- --------------------- -----------------------
31,311,298 34,079,842 37,487,826 41,236,608 44,947,903 48,993,214 53,402,604 56,606,760 59,720,132 61,511,736 62,126,853 62,748,121 562,861,5984,574,323 1,701,500 835,530 852,241 869,285 886,671 904,405 922,493 940,942 959,761 988,554 1,018,211 10,879,5931,185,132 140,048 368,150 618,631 217,941 228,221 239,331 247,817 256,132 261,568 265,209 268,932 3,111,979
193,244 180,000 244,836 416,031 521,672 817,478 822,925 946,186 914,132 956,497 923,134 1,009,890 7,752,7810 0 3,146,100 3,721,202 2,626,308 3,619,298 3,034,222 2,160,133 2,213,760 2,445,132 3,167,411 2,387,791 28,521,357
410,911 404,744 404,744 404,744 404,744 404,744 243,614 0 0 0 0 0 2,267,334798,248 155,000 0 0 0 0 0 0 0 0 0 0 155,000
0 51,798,600 15,760,000 32,836,399 24,700,000 2,005,227 0 0 0 0 0 0 127,100,2260 0 37,840,000 18,840,000 20,910,000 66,434,773 84,390,000 41,650,000 13,700,000 8,870,000 16,000,000 11,480,000 320,114,773
--------------------- --------------------- --------------------- --------------------- --------------------- --------------------- --------------------- --------------------- --------------------- --------------------- --------------------- --------------------- -----------------------38,473,156 88,459,734 96,087,186 98,925,856 95,197,853 123,389,626 143,037,100 102,533,388 77,745,098 75,004,695 83,471,161 78,912,944 1,062,764,641
--------------------- --------------------- --------------------- --------------------- --------------------- --------------------- --------------------- --------------------- --------------------- --------------------- --------------------- --------------------- -----------------------65,011,145 114,241,682 113,719,655 121,903,660 123,108,259 152,621,183 174,723,141 133,821,384 112,390,945 108,603,664 118,756,030 113,774,623 1,088,546,590
--------------------- --------------------- --------------------- --------------------- --------------------- --------------------- --------------------- --------------------- --------------------- --------------------- --------------------- --------------------- -----------------------
15,701,830 18,093,139 19,043,809 19,946,041 20,377,776 20,966,167 21,529,248 21,602,263 22,178,411 22,808,331 23,436,778 24,036,018 234,017,9813,773,135 4,123,190 4,743,352 3,836,475 3,884,131 3,584,432 3,341,656 3,395,083 3,526,358 3,539,265 3,632,478 3,711,956 41,318,376
0 0 45,900 93,030 163,569 166,541 291,020 296,541 302,171 307,914 313,772 322,737 2,303,195--------------------- --------------------- --------------------- --------------------- --------------------- --------------------- --------------------- --------------------- --------------------- --------------------- --------------------- --------------------- -----------------------
19,474,965 22,216,329 23,833,062 23,875,546 24,425,476 24,717,140 25,161,924 25,293,887 26,006,939 26,655,510 27,383,029 28,070,710 277,639,551--------------------- --------------------- --------------------- --------------------- --------------------- --------------------- --------------------- --------------------- --------------------- --------------------- --------------------- --------------------- -----------------------
1,264,380 1,264,380 1,316,438 1,316,438 1,316,438 949,615 949,615 949,615 949,615 949,615 949,615 949,615 11,861,0012,899,391 2,897,444 2,904,316 2,327,103 2,329,788 2,334,853 7,602,702 7,609,610 7,608,213 7,605,790 7,609,889 7,614,987 58,444,696
0 0 0 6,241,360 6,241,360 6,241,360 17,549,576 17,549,576 22,520,481 22,520,481 22,520,481 25,080,580 146,465,255365,174 372,478 502,797 645,778 794,278 810,163 826,366 842,894 859,752 885,544 912,110 939,474 8,391,63362,809 0 0 0 79,591 0 0 0 0 0 0 0 79,591
285,188 729,371 1,191,317 609,006 549,364 1,007,647 477,207 697,108 668,330 526,174 688,948 688,948 7,833,421908,081 926,243 944,767 963,663 982,936 1,002,595 1,022,647 1,043,100 1,063,961 1,095,880 1,128,757 1,162,619 11,337,167
0 0 166,954 0 0 0 0 0 0 0 0 0 166,954--------------------- --------------------- --------------------- --------------------- --------------------- --------------------- --------------------- --------------------- --------------------- --------------------- --------------------- --------------------- -----------------------
5,785,023 6,189,915 7,026,589 12,103,349 12,293,755 12,346,233 28,428,113 28,691,903 33,670,353 33,583,485 33,809,801 36,436,223 244,579,718--------------------- --------------------- --------------------- --------------------- --------------------- --------------------- --------------------- --------------------- --------------------- --------------------- --------------------- --------------------- -----------------------
7,220,986 28,821,400 6,282,200 6,337,960 5,547,472 5,431,769 5,455,108 3,539,748 5,414,684 4,209,800 2,701,522 727,020 74,468,6836,455,771 38,782,162 53,600,000 51,676,399 45,610,000 68,440,000 84,390,000 41,650,000 13,700,000 8,870,000 16,000,000 11,480,000 434,198,561
292,450 599,407 0 0 6,000,000 10,000,000 0 0 0 0 4,000,000 0 20,599,407--------------------- --------------------- --------------------- --------------------- --------------------- --------------------- --------------------- --------------------- --------------------- --------------------- --------------------- --------------------- -----------------------
13,969,208 68,202,969 59,882,200 58,014,359 57,157,472 83,871,769 89,845,108 45,189,748 19,114,684 13,079,800 22,701,522 12,207,020 529,266,651--------------------- --------------------- --------------------- --------------------- --------------------- --------------------- --------------------- --------------------- --------------------- --------------------- --------------------- --------------------- -----------------------
39,229,196 96,609,213 90,741,851 93,993,254 93,876,703 120,935,142 143,435,145 99,175,537 78,791,976 73,318,795 83,894,351 76,713,954 1,051,485,921--------------------- --------------------- --------------------- --------------------- --------------------- --------------------- --------------------- --------------------- --------------------- --------------------- --------------------- --------------------- -----------------------
3,804,945 3,804,945 9,075,879 12,196,559 12,196,559 12,196,559 17,850,667 17,850,667 20,336,119 20,336,119 19,915,608 21,195,657 21,195,6573,925,457 4,523,285 4,760,952 4,986,510 5,094,444 5,241,542 5,382,312 5,400,566 5,544,603 5,702,083 5,859,195 6,009,004 6,009,004
14,410,700 6,282,200 3,748,783 4,123,661 4,494,790 4,899,321 5,340,260 5,660,676 5,972,013 6,151,174 6,212,685 6,274,812 6,274,8123,640,846 3,022,040 5,392,190 6,603,676 7,445,763 9,348,619 2,714,757 5,733,938 1,746,234 3,095,493 2,874,191 3,581,195 3,581,195
--------------------- --------------------- --------------------- --------------------- --------------------- --------------------- --------------------- --------------------- --------------------- --------------------- --------------------- --------------------- -----------------------25,781,949 17,632,469 22,977,804 27,910,406 29,231,556 31,686,041 31,287,996 34,645,847 33,598,969 35,284,869 34,861,678 37,060,669 37,060,669
--------------------- --------------------- --------------------- --------------------- --------------------- --------------------- --------------------- --------------------- --------------------- --------------------- --------------------- --------------------- -----------------------0 0 0 0 0 0 0 0 0 0 0 0 0
============ ============ ============ ============ ============ ============ ============ ============ ============ ============ ============ ============ ==============
8.0% 10.0% 10.0% 9.0% 9.0% 9.0% 6.0% 5.5% 3.0% 1.0% 1.0%8.0% 8.0% 8.0% 7.5% 7.5% 7.0% 4.5% 4.5% 4.5% 4.5% 4.0% 1.5%
465. WASTEWATER MANAGEMENT FUND
JULY 1, 2016 TO JUNE 30, 2027LONG TERM FINANCIAL PLAN
CITY OF SUNNYVALE
231

RESERVE/FUND BALANCE, JULY 1
CURRENT RESOURCES: Service Fees Connection and Development Fees Other Revenues Interest Income Transfer From General Fund (Storm Sewer) Transfer From Solid Waste Management Fund Transfer From Water Fund State Revolving Fund Loan New WPCP Bond Proceeds
TOTAL CURRENT RESOURCES
TOTAL AVAILABLE RESOURCES
CURRENT REQUIREMENTS: OPERATING REQUIREMENTS: Operations In-Lieu Charges and Fund Transfers Project Operating
TOTAL CURRENT OPERATING REQUIREMENTS
NON-OPERATING REQUIREMENTS: Interfund Loan Repayment Debt Service New WPCP Debt Service Water Pollution Control Plant Rent Transfer To Water Supply and Distribution Fund Wastewater Equipment Replacement Transfer To General Fund (Power Generation Facility) Transfer To Solid Waste Management Fund
TOTAL NON-OPERATING REQUIREMENTS
CAPITAL AND INFRASTRUCTURE REQ.: Projects - Revenue Funded Replacement of WPCP Replacement of WPCP - Revenue Funded
TOTAL CAPITAL AND INFRASTRUCTURE REQ.
TOTAL CURRENT REQUIREMENTS
RESERVES: Debt Service Contingencies Capital and Infrastructure Reserve Rate Stabilization Reserve
TOTAL RESERVES
FUND BALANCE, JUNE 30
STATISTICS: Sewer Rate Increase Prior Year Sewer Rate Increase
FY 2027/2028 FY 2016/2017TO TO
PLAN PLAN PLAN PLAN PLAN PLAN PLAN PLAN PLAN PLAN FY 2036/2037 FY 2036/20372027/2028 2028/2029 2029/2030 2030/2031 2031/2032 2032/2033 2033/2034 2034/2035 2035/2036 2036/2037 TOTAL TOTAL
-------------------- -------------------- -------------------- -------------------- -------------------- -------------------- -------------------- -------------------- -------------------- -------------------- ----------------------- -----------------------37,060,669 39,135,904 42,698,161 41,513,873 43,221,254 45,293,767 45,127,447 47,252,405 47,485,803 47,973,771 37,060,669 25,781,949
-------------------- -------------------- -------------------- -------------------- -------------------- -------------------- -------------------- -------------------- -------------------- -------------------- ----------------------- -----------------------
63,375,603 64,009,359 64,649,452 65,295,947 65,948,906 68,586,863 73,387,943 79,258,978 81,636,748 82,861,299 709,011,097 1,271,872,6951,048,757 1,080,220 1,112,626 1,146,005 1,180,385 1,215,797 1,252,271 1,289,839 1,328,534 1,368,390 12,022,825 22,902,418
272,739 276,632 280,615 284,689 288,856 297,473 310,933 326,833 335,138 340,999 3,014,907 6,126,8861,411,346 1,544,625 1,490,894 1,524,919 1,640,181 1,637,663 1,717,368 1,715,542 1,698,491 1,835,866 16,216,895 23,969,6762,440,896 2,537,907 2,750,636 3,573,368 2,649,068 2,548,209 2,600,849 2,881,703 3,813,012 2,730,922 28,526,570 57,047,927
0 0 0 0 0 0 0 0 0 0 0 2,267,3340 0 0 0 0 0 0 0 0 0 0 155,0000 0 0 0 0 0 0 0 0 0 0 127,100,226
5,680,000 4,900,001 15,620,000 11,950,000 10,449,999 64,860,000 102,700,000 13,670,000 4,270,000 8,120,000 242,220,000 562,334,773-------------------- -------------------- -------------------- -------------------- -------------------- -------------------- -------------------- -------------------- -------------------- -------------------- ----------------------- -----------------------
74,229,341 74,348,744 85,904,223 83,774,928 82,157,396 139,146,004 181,969,363 99,142,895 93,081,923 97,257,476 1,011,012,295 2,073,776,936-------------------- -------------------- -------------------- -------------------- -------------------- -------------------- -------------------- -------------------- -------------------- -------------------- ----------------------- -----------------------
111,290,010 113,484,648 128,602,385 125,288,801 125,378,650 184,439,771 227,096,811 146,395,301 140,567,726 145,231,247 1,048,072,964 2,099,558,884-------------------- -------------------- -------------------- -------------------- -------------------- -------------------- -------------------- -------------------- -------------------- -------------------- ----------------------- -----------------------
24,681,337 25,264,745 25,892,979 26,447,207 25,736,458 26,365,632 26,948,088 27,480,814 28,030,641 28,534,209 265,382,109 499,400,0903,733,134 3,789,723 4,080,128 4,281,625 4,302,742 4,541,649 4,958,434 4,859,655 4,823,767 4,999,572 44,370,428 85,688,804
331,968 341,478 351,271 361,360 371,751 382,453 393,478 404,831 416,527 428,571 3,783,688 6,086,883-------------------- -------------------- -------------------- -------------------- -------------------- -------------------- -------------------- -------------------- -------------------- -------------------- ----------------------- -----------------------
28,746,439 29,395,945 30,324,378 31,090,191 30,410,951 31,289,734 32,300,000 32,745,299 33,270,935 33,962,352 313,536,225 591,175,777-------------------- -------------------- -------------------- -------------------- -------------------- -------------------- -------------------- -------------------- -------------------- -------------------- ----------------------- -----------------------
949,615 552,537 0 0 0 0 0 0 0 0 1,502,153 13,363,1546,766,074 6,767,512 6,766,776 6,768,867 6,712,234 6,709,459 6,709,322 6,711,559 6,710,909 6,712,372 67,335,083 125,779,779
25,080,580 25,080,580 27,436,743 27,436,743 27,436,743 32,587,841 32,587,841 41,403,611 41,403,611 41,403,611 321,857,904 468,323,159967,658 996,688 1,026,588 1,057,386 1,089,108 1,121,781 1,155,434 1,190,097 1,225,800 1,262,574 11,093,115 19,484,748
0 0 100,882 0 0 0 0 0 0 0 100,882 180,473706,662 1,111,138 746,651 376,152 447,550 636,516 618,363 753,955 753,955 753,955 6,904,896 14,738,317
1,197,498 1,233,423 1,270,426 1,308,538 1,347,795 1,388,228 1,429,875 1,472,772 1,516,955 1,562,463 13,727,973 25,065,1400 0 0 0 0 0 0 0 0 0 0 166,954
-------------------- -------------------- -------------------- -------------------- -------------------- -------------------- -------------------- -------------------- -------------------- -------------------- ----------------------- -----------------------35,668,087 35,741,878 37,348,066 36,947,686 37,033,429 42,443,825 42,500,835 51,531,994 51,611,230 51,694,975 422,522,005 667,101,724
-------------------- -------------------- -------------------- -------------------- -------------------- -------------------- -------------------- -------------------- -------------------- -------------------- ----------------------- -----------------------
2,059,580 748,662 3,796,068 2,079,669 2,190,504 718,765 2,343,570 962,205 3,441,790 990,494 19,331,307 93,799,9905,680,000 4,900,001 15,620,000 11,950,000 10,449,999 64,860,000 102,700,000 13,670,000 4,270,000 8,120,000 242,220,000 676,418,561
0 0 0 0 0 0 0 0 0 0 0 20,599,407-------------------- -------------------- -------------------- -------------------- -------------------- -------------------- -------------------- -------------------- -------------------- -------------------- ----------------------- -----------------------
7,739,580 5,648,663 19,416,068 14,029,669 12,640,503 65,578,765 105,043,570 14,632,205 7,711,790 9,110,494 261,551,307 790,817,958-------------------- -------------------- -------------------- -------------------- -------------------- -------------------- -------------------- -------------------- -------------------- -------------------- ----------------------- -----------------------
72,154,106 70,786,486 87,088,512 82,067,547 80,084,883 139,312,324 179,844,405 98,909,498 92,593,955 94,767,821 997,609,538 2,049,095,458-------------------- -------------------- -------------------- -------------------- -------------------- -------------------- -------------------- -------------------- -------------------- -------------------- ----------------------- -----------------------
21,195,657 21,195,657 22,373,739 22,345,492 22,345,492 24,921,041 24,921,041 29,328,926 29,328,926 29,328,926 29,328,926 29,328,9266,170,334 6,316,186 6,473,245 6,611,802 6,434,115 6,591,408 6,737,022 6,870,203 7,007,660 7,133,552 7,133,552 7,133,5526,337,560 6,400,936 6,464,945 6,529,595 6,594,891 6,858,686 7,338,794 7,925,898 8,163,675 8,286,130 8,286,130 8,286,1305,432,352 8,785,382 6,201,944 7,734,366 9,919,270 6,756,312 8,255,548 3,360,776 3,473,511 5,714,818 5,714,818 5,714,818
-------------------- -------------------- -------------------- -------------------- -------------------- -------------------- -------------------- -------------------- -------------------- -------------------- ----------------------- -----------------------39,135,904 42,698,161 41,513,873 43,221,254 45,293,767 45,127,447 47,252,405 47,485,803 47,973,771 50,463,426 50,463,426 50,463,426
-------------------- -------------------- -------------------- -------------------- -------------------- -------------------- -------------------- -------------------- -------------------- -------------------- ----------------------- -----------------------0 0 0 0 0 0 0 0 0 0 0 0
============ ============ ============ ============ ============ ============ ============ ============ ============ ============ ============= =============
1.0% 1.0% 1.0% 1.0% 1.0% 4.0% 7.0% 8.0% 3.0% 1.5%1.5% 1.5% 1.5% 1.5% 1.5% 1.5% 1.5% 1.5% 1.5% 1.5%
CITY OF SUNNYVALE
JULY 1, 2027 TO JUNE 30, 2037LONG TERM FINANCIAL PLAN
465. WASTEWATER MANAGEMENT FUND
232

1114 Other Agencies - Reimbursement
1216 Miscellaneous Grants
1367 Permit - Waste Discharge
1507 Late Payment Penalties
3066 Sewer Fees - City
3067 Sewer Fees - Non-City
3068 Sewer Connection Fees
3090 Sales from PGF Electricity
3355 Interest Income
4400 Transfer From Water Fund
4400 Transfer From Solid Waste Mgmt Fund
4400 Transfer From General Fund
4490 Bond Proceeds
5065 Construction Services
5070 Consultants
9680 CAFR Adjustment
FUND TOTAL
FY 2016/2017TO
ACTUAL CURRENT BUDGET PLAN PLAN PLAN PLAN PLAN PLAN PLAN PLAN PLAN FY 2026/20272015/2016 2016/2017 2017/2018 2018/2019 2019/2020 2020/2021 2021/2022 2022/2023 2023/2024 2024/2025 2025/2026 2026/2027 TOTAL
--------------------- --------------------- --------------------- --------------------- --------------------- --------------------- --------------------- --------------------- --------------------- --------------------- --------------------- --------------------- ----------------------
REVENUES BY SOURCE465. WASTEWATER MANAGEMENT FUND
268,946 0 50,000 50,000 50,000 50,000 50,000 50,000 50,000 50,000 50,000 50,000 500,000
800,054 0 169,303 410,209 0 0 0 0 0 0 0 0 579,512
14,884 15,300 15,606 15,918 16,236 16,561 16,892 17,230 17,575 17,926 18,464 19,018 186,728
73,292 74,976 82,473 90,721 98,885 107,785 117,486 124,535 131,384 135,326 136,679 138,046 1,238,296
30,371,396 33,056,026 36,361,629 39,997,792 43,597,593 47,521,376 51,798,300 54,906,198 57,926,039 59,663,820 60,260,459 60,863,063 545,952,296
943,453 1,023,815 1,126,197 1,238,817 1,350,310 1,471,838 1,604,303 1,700,562 1,794,092 1,847,915 1,866,394 1,885,058 16,909,302
4,572,922 1,700,000 834,000 850,680 867,694 885,047 902,748 920,803 939,219 958,004 986,744 1,016,346 10,861,286
27,955 49,772 50,768 51,783 52,819 53,875 54,953 56,052 57,173 58,316 60,066 61,868 607,444
193,244 180,000 244,836 416,031 521,672 817,478 822,925 946,186 914,132 956,497 923,134 1,009,890 7,752,781
798,248 155,000 0 0 0 0 0 0 0 0 0 0 155,000
410,911 404,744 404,744 404,744 404,744 404,744 243,614 0 0 0 0 0 2,267,334
0 0 3,146,100 3,721,202 2,626,308 3,619,298 3,034,222 2,160,133 2,213,760 2,445,132 3,167,411 2,387,791 28,521,357
0 0 37,840,000 18,840,000 20,910,000 66,434,773 84,390,000 41,650,000 13,700,000 8,870,000 16,000,000 11,480,000 320,114,773
0 49,177,761 13,030,000 29,726,399 21,330,000 0 0 0 0 0 0 0 113,264,160
0 2,620,839 2,730,000 3,110,000 3,370,000 2,005,227 0 0 0 0 0 0 13,836,066
(3,551) 0 0 0 0 0 0 0 0 0 0 0 0--------------------- --------------------- --------------------- --------------------- --------------------- --------------------- --------------------- --------------------- --------------------- --------------------- --------------------- --------------------- ----------------------
38,473,156 88,459,734 96,087,186 98,925,856 95,197,853 123,389,626 143,037,100 102,533,388 77,745,098 75,004,695 83,471,161 78,912,944 1,062,764,641
233

This Page Intentionally Blank
234

RESERVE/FUND BALANCE, JULY 1
CURRENT RESOURCES: Rental Income Service Fees Miscellaneous Revenues Transfers In SMaRT Station Revenues County Wide AB939 Fee Interest Income
TOTAL CURRENT RESOURCES
TOTAL AVAILABLE RESOURCES
CURRENT REQUIREMENTS: Interfund Loan Repayment Debt Service Operations Solid Waste Collection Contract Special Projects Infrastructure Projects Project Operating Project Administration SMaRT Capital Replacement In-Lieu Charges SMaRT Expense Share (Sunnyvale) Long Term Rent - SMaRT and Landfill Transfer To General Fund Transfer To Infrastructure Fund Transfer To General Services Fund Transfer To Water Supply & Dist. Fund
TOTAL CURRENT REQUIREMENTS
RESERVES: Contingencies Rate Stabilization Reserve
TOTAL RESERVES
FUND BALANCE, JUNE 30
STATISTICS: Refuse Rate Increase Prior Year Refuse Rate Increase
FY 2016/2017TO
ACTUAL CURRENT BUDGET PLAN PLAN PLAN PLAN PLAN PLAN PLAN PLAN PLAN FY 2026/20272015/2016 2016/2017 2017/2018 2018/2019 2019/2020 2020/2021 2021/2022 2022/2023 2023/2024 2024/2025 2025/2026 2026/2027 TOTAL
--------------------- --------------------- --------------------- --------------------- --------------------- --------------------- --------------------- --------------------- --------------------- --------------------- --------------------- --------------------- ----------------------7,346,972 9,851,140 7,238,437 6,797,694 8,038,932 9,981,565 10,727,700 11,206,278 11,949,970 12,515,449 15,439,244 17,705,524 9,851,140
--------------------- --------------------- --------------------- --------------------- --------------------- --------------------- --------------------- --------------------- --------------------- --------------------- --------------------- --------------------- ----------------------
195,812 202,635 207,701 212,893 218,216 223,671 229,263 234,995 240,869 246,891 253,063 259,390 2,529,58844,784,062 45,529,589 46,904,122 47,842,204 48,799,048 49,531,034 50,273,999 50,776,739 51,284,507 51,797,352 52,315,325 52,838,478 547,892,397
745,213 227,523 229,356 232,835 236,375 239,436 242,540 245,132 298,131 250,409 253,095 255,813 2,710,6450 812,000 684,678 0 0 0 0 0 0 0 0 0 1,496,678
736,023 739,362 708,385 722,010 735,935 750,166 764,712 779,579 794,776 810,309 826,187 845,076 8,476,498156,656 133,012 130,511 130,511 130,511 130,511 130,511 130,511 130,511 130,511 130,511 130,511 1,438,118
77,755 45,444 83,922 138,262 195,717 312,457 326,396 348,057 364,528 449,687 515,695 549,871 3,330,036--------------------- --------------------- --------------------- --------------------- --------------------- --------------------- --------------------- --------------------- --------------------- --------------------- --------------------- --------------------- ----------------------
46,695,522 47,689,565 48,948,674 49,278,716 50,315,801 51,187,275 51,967,421 52,515,013 53,113,321 53,685,159 54,293,877 54,879,138 567,873,960--------------------- --------------------- --------------------- --------------------- --------------------- --------------------- --------------------- --------------------- --------------------- --------------------- --------------------- --------------------- ----------------------
54,042,494 57,540,705 56,187,111 56,076,409 58,354,733 61,168,840 62,695,122 63,721,291 65,063,291 66,200,607 69,733,120 72,584,662 577,725,101--------------------- --------------------- --------------------- --------------------- --------------------- --------------------- --------------------- --------------------- --------------------- --------------------- --------------------- --------------------- ----------------------
4,504,300 4,504,300 3,874,946 3,874,946 3,874,946 3,874,946 3,713,816 3,470,202 3,048,003 0 0 0 30,236,1061,519,481 1,524,025 466,274 577,168 580,750 586,965 1,185,897 1,186,131 1,186,284 1,186,730 1,187,081 1,187,336 10,854,6402,142,422 2,606,968 2,701,133 2,774,063 2,856,548 2,936,441 3,013,382 3,091,331 3,171,820 3,258,279 3,340,204 3,422,678 33,172,846
19,600,121 20,437,174 21,197,428 21,833,351 22,488,352 23,163,002 23,857,892 24,573,629 25,310,838 26,070,163 26,852,268 27,657,836 263,441,934348,632 2,736,486 2,869,409 1,879,813 929,577 2,079,757 2,149,564 2,000,861 1,908,048 1,900,107 1,862,357 2,000,051 22,316,030
0 1,500,000 1,264,800 0 0 0 0 0 0 0 0 0 2,764,8000 0 (667,420) (850,388) (1,071,956) (1,075,609) (1,079,335) (1,083,136) (1,087,012) (1,090,966) (1,095,000) (1,101,171) (10,201,993)
2,102 115,703 47,285 0 0 0 0 0 0 0 0 0 162,987152,020 207,300 138,200 124,380 124,380 0 0 0 63,572 64,843 66,140 68,124 856,939
2,557,907 2,783,099 2,981,043 3,043,058 3,106,329 3,170,882 3,236,743 3,303,479 3,371,549 3,440,981 3,512,290 3,585,044 35,534,49712,685,270 13,200,825 13,456,843 13,696,644 14,123,653 14,316,952 14,075,565 13,866,799 14,179,308 14,500,283 14,828,385 15,367,777 155,613,035
672,931 686,389 885,415 1,084,441 1,283,467 1,309,136 1,335,319 1,362,025 1,389,266 1,430,944 1,473,872 1,518,088 13,758,3640 0 0 0 77,123 78,666 0 0 0 0 0 0 155,7890 0 28,997 0 0 0 0 0 0 0 0 0 28,9970 0 145,064 0 0 0 0 0 0 0 0 0 145,064
6,167 0 0 0 0 0 0 0 6,167 0 0 0 6,167--------------------- --------------------- --------------------- --------------------- --------------------- --------------------- --------------------- --------------------- --------------------- --------------------- --------------------- --------------------- ----------------------
44,191,353.87 50,302,269 49,389,417 48,037,477 48,373,168 50,441,139 51,488,843 51,771,321 52,547,842 50,761,364 52,027,596 53,705,764 558,846,203--------------------- --------------------- --------------------- --------------------- --------------------- --------------------- --------------------- --------------------- --------------------- --------------------- --------------------- --------------------- ----------------------
3,442,781 3,624,497 3,735,540 3,830,406 3,946,855 4,041,640 4,094,684 4,153,176 4,266,197 4,382,873 4,502,086 4,644,829 4,644,8296,408,359 3,613,940 3,062,153 4,208,526 6,034,710 6,686,061 7,111,594 7,796,794 8,249,252 11,056,371 13,203,438 14,234,069 14,234,069
--------------------- --------------------- --------------------- --------------------- --------------------- --------------------- --------------------- --------------------- --------------------- --------------------- --------------------- --------------------- ----------------------9,851,140 7,238,437 6,797,694 8,038,932 9,981,565 10,727,700 11,206,278 11,949,970 12,515,449 15,439,244 17,705,524 18,878,898 18,878,898
--------------------- --------------------- --------------------- --------------------- --------------------- --------------------- --------------------- --------------------- --------------------- --------------------- --------------------- --------------------- ----------------------0 0 0 0 0 0 0 0 0 0 0 0 0
============ ============ ============ ============ ============ ============ ============ ============ ============ ============ ============ ============ =============
3.5% 3.0% 2.0% 2.0% 1.5% 1.5% 1.0% 1.0% 1.0% 1.0% 1.0%5.0% 3.5% 3.0% 2.0% 2.0% 1.5% 1.5% 1.0% 1.0% 1.0% 1.0% 1.0%
CITY OF SUNNYVALE485. SOLID WASTE MANAGEMENT FUND
LONG TERM FINANCIAL PLANJULY 1, 2016 TO JUNE 30, 2027
235

RESERVE/FUND BALANCE, JULY 1
CURRENT RESOURCES: Rental Income Service Fees Miscellaneous Revenues Transfers In SMaRT Station Revenues County Wide AB939 Fee Interest Income
TOTAL CURRENT RESOURCES
TOTAL AVAILABLE RESOURCES
CURRENT REQUIREMENTS: Interfund Loan Repayment Debt Service Operations Solid Waste Collection Contract Special Projects Infrastructure Projects Project Operating Project Administration SMaRT Capital Replacement In-Lieu Charges SMaRT Expense Share (Sunnyvale) Long Term Rent - SMaRT and Landfill Transfer To General Fund Transfer To Infrastructure Fund Transfer To General Services Fund Transfer To Water Supply & Dist. Fund
TOTAL CURRENT REQUIREMENTS
RESERVES: Contingencies Rate Stabilization Reserve
TOTAL RESERVES
FUND BALANCE, JUNE 30
STATISTICS: Refuse Rate Increase Prior Year Refuse Rate Increase
FY 2027/2028 FY 2016/2017TO TO
PLAN PLAN PLAN PLAN PLAN PLAN PLAN PLAN PLAN PLAN FY 2036/2037 FY 2036/20372027/2028 2028/2029 2029/2030 2030/2031 2031/2032 2032/2033 2033/2034 2034/2035 2035/2036 2036/2037 TOTAL TOTAL
--------------------- --------------------- --------------------- --------------------- --------------------- --------------------- --------------------- --------------------- ------------------------------------------- ---------------------- ----------------------18,878,898 19,611,387 19,872,538 19,682,588 19,001,493 17,992,646 16,510,112 14,290,696 12,089,215 9,581,673 18,878,898 9,851,140
--------------------- --------------------- --------------------- --------------------- --------------------- --------------------- --------------------- ---------------------------------------------------------------- ---------------------- ----------------------
265,875 272,522 279,335 286,318 293,476 300,813 308,333 316,042 323,943 332,041 2,978,697 5,508,28553,366,863 54,434,201 55,522,885 56,633,342 57,766,009 58,921,329 60,394,362 61,904,222 63,451,827 65,672,641 588,067,681 1,135,960,078
258,830 263,073 267,400 271,810 276,307 280,892 286,218 291,666 297,238 304,342 2,797,776 5,508,4210 0 0 0 0 0 0 0 0 0 0 1,496,678
864,471 884,389 904,845 925,853 947,430 969,593 992,358 1,012,205 1,032,449 1,053,098 9,586,690 18,063,189130,511 130,511 130,511 130,511 130,511 130,511 130,511 130,511 130,511 130,511 1,305,106 2,743,224754,284 764,328 757,023 730,827 692,025 635,004 549,642 464,970 368,526 288,928 6,005,557 9,335,593
--------------------- --------------------- --------------------- --------------------- --------------------- --------------------- --------------------- --------------------- --------------------- --------------------- ---------------------- ----------------------55,640,833 56,749,023 57,861,997 58,978,661 60,105,758 61,238,141 62,661,424 64,119,615 65,604,496 67,781,562 610,741,510 1,178,615,470
--------------------- --------------------- --------------------- --------------------- --------------------- --------------------- --------------------- --------------------- --------------------- --------------------- ---------------------- ----------------------74,519,731 76,360,410 77,734,535 78,661,249 79,107,251 79,230,787 79,171,536 78,410,311 77,693,710 77,363,235 629,620,407 1,188,466,610
--------------------- --------------------- --------------------- --------------------- --------------------- --------------------- --------------------- --------------------- --------------------- --------------------- ---------------------- ----------------------
0 0 0 0 0 0 0 0 0 0 0 30,236,1061,187,872 1,188,298 1,188,615 1,188,823 1,105,600 1,105,600 1,105,600 1,105,600 1,105,601 1,105,601 11,387,210 22,241,8503,514,538 3,600,526 3,691,910 3,776,185 3,727,832 3,821,446 3,910,887 3,995,857 4,086,027 4,172,271 38,297,480 71,470,326
28,487,571 29,342,198 30,222,464 31,129,138 32,063,012 33,024,903 34,015,650 35,036,119 36,087,203 37,169,819 326,578,077 590,020,0101,856,357 1,916,023 1,911,551 1,857,257 1,856,357 1,857,257 2,100,987 1,914,286 1,855,357 1,697,151 18,822,583 41,138,613
0 0 0 0 0 0 0 0 0 0 0 2,764,800(1,107,527) (1,114,073) (1,120,816) (1,127,762) (1,134,915) (1,142,284) (1,149,873) (1,157,690) (1,165,742) (1,174,035) (11,394,717) (21,596,710)
0 0 0 0 0 0 0 0 0 0 0 162,98770,168 72,273 74,441 76,674 78,974 81,344 83,784 86,298 88,887 91,553 804,396 1,661,335
3,695,597 3,809,194 3,926,193 4,046,697 4,170,810 4,299,230 4,431,514 4,567,142 4,706,833 4,850,376 42,503,586 78,038,08315,640,137 16,062,893 16,498,732 16,946,044 17,385,381 17,860,502 18,515,234 18,850,414 19,367,109 19,898,196 177,024,643 332,637,678
1,563,631 1,610,540 1,658,856 1,708,622 1,759,881 1,812,677 1,867,057 1,923,069 1,980,761 2,040,184 17,925,278 31,683,6420 0 0 58,078 101,674 0 0 0 0 0 159,752 315,5410 0 0 0 0 0 0 0 0 0 0 28,9970 0 0 0 0 0 0 0 0 0 0 145,0640 0 0 0 0 0 0 0 0 0 0 6,167
--------------------- --------------------- --------------------- --------------------- --------------------- --------------------- --------------------- --------------------- --------------------- --------------------- ---------------------- ----------------------54,908,344 56,487,872 58,051,947 59,659,756 61,114,605 62,720,675 64,880,840 66,321,096 68,112,037 69,851,116 622,108,290 1,180,954,492
--------------------- --------------------- --------------------- --------------------- --------------------- --------------------- --------------------- --------------------- --------------------- --------------------- ---------------------- ----------------------
4,764,225 4,900,562 5,041,311 5,185,137 5,317,622 5,470,685 5,644,177 5,788,239 5,954,034 6,124,029 6,124,029 6,124,02914,847,162 14,971,977 14,641,278 13,816,356 12,675,023 11,039,427 8,646,519 6,300,976 3,627,639 1,388,091 1,388,091 1,388,091
--------------------- --------------------- --------------------- --------------------- --------------------- --------------------- --------------------- --------------------- --------------------- --------------------- ---------------------- ----------------------19,611,387 19,872,538 19,682,588 19,001,493 17,992,646 16,510,112 14,290,696 12,089,215 9,581,673 7,512,119 7,512,119 7,512,119
--------------------- --------------------- --------------------- --------------------- --------------------- --------------------- --------------------- --------------------- --------------------- --------------------- ---------------------- ----------------------0 0 0 0 0 0 0 0 0 0 0 0
============ ============ ============ ============ ============ ============ ============ ============ ============ ============ ============= =============
1.0% 2.0% 2.0% 2.0% 2.0% 2.0% 2.5% 2.5% 2.5% 3.5%1.0% 1.0% 2.0% 2.0% 2.0% 2.0% 2.5% 2.5% 2.5% 0.0%
485. SOLID WASTE MANAGEMENT FUND
JULY 1, 2027 TO JUNE 30, 2037LONG TERM FINANCIAL PLAN
CITY OF SUNNYVALE
236

0751-06 Long Term Rent
0955 0955 Alternative Fuel User Tax Credit
1004 County Wide AB939 Fee
1027 Misc. State Grants/Reimbursements
1507 Late Payment Penalties
1519 Code Violations
3061 Refuse Service Fees - City
3062 Refuse Service Fees - Specialty
3071 MRF Revenues - SMaRT
3080 Kirby Canyon SMaRT Operator
3083 Curbside
3084 Curbside Sales - General
3086 Yardwaste Sales - SMaRT
3091 Green Ticket Revenue
3355 Interest Income
3073-01 Sale of Garbage Tags - Retailer
3073-02 Sale of Garbage Tags - In House
4190 Third Party Compressed Natural Gas Sales
xxxx Accrued Franchise Depreciation Savings
FUND TOTAL
FY 2016/2017TO
ACTUAL CURRENT BUDGET PLAN PLAN PLAN PLAN PLAN PLAN PLAN PLAN PLAN FY 2026/20272015/2016 2016/2017 2017/2018 2018/2019 2019/2020 2020/2021 2021/2022 2022/2023 2023/2024 2024/2025 2025/2026 2026/2027 TOTAL
-------------------- -------------------- -------------------- -------------------- -------------------- -------------------- -------------------- -------------------- -------------------- -------------------- -------------------- -------------------- ----------------------
195,812 202,635 207,701 212,893 218,216 223,671 229,263 234,995 240,869 246,891 253,063 259,390 2,529,588
319,867 0 0 0 0 0 0 0 0 0 0 0 0
156,656 133,012 130,511 130,511 130,511 130,511 130,511 130,511 130,511 130,511 130,511 130,511 1,438,118
50,376 0 0 0 0 0 0 0 50,376 0 0 0 50,376
103,232 100,741 103,764 105,839 107,956 109,575 111,219 112,331 113,454 114,589 115,735 116,892 1,212,094
31 0 0 0 0 0 0 0 0 0 0 0 0
43,065,224 43,800,636 45,114,655 46,016,948 46,937,287 47,641,347 48,355,967 48,839,526 49,327,922 49,821,201 50,319,413 50,822,607 526,997,509
1,718,838 1,728,953 1,789,466 1,825,256 1,861,761 1,889,687 1,918,033 1,937,213 1,956,585 1,976,151 1,995,912 2,015,871 20,894,888
(119,201) (134,891) (152,454) (153,979) (155,518) (157,074) (158,644) (160,231) (161,833) (163,451) (165,086) (166,737) (1,729,898)
549,301 567,732 584,944 599,568 614,557 629,921 645,669 661,811 678,356 695,315 712,698 734,079 7,124,649
455,167 450,319 424,769 429,016 433,307 437,640 442,016 446,436 450,901 455,410 459,964 464,563 4,894,340
257,522 94,810 95,758 96,715 97,682 98,659 99,646 100,642 101,649 102,665 103,692 104,729 1,096,647
(149,244) (143,798) (148,874) (152,595) (156,410) (160,321) (164,329) (168,437) (172,648) (176,964) (181,388) (186,830) (1,812,592)
0 2,575 0 0 0 0 0 0 0 0 0 0 2,575
77,755 45,444 83,922 138,262 195,717 312,457 326,396 348,057 364,528 449,687 515,695 549,871 3,330,036
13,274 7,000 7,000 7,000 7,000 7,000 7,000 7,000 7,000 7,000 7,000 7,000 77,000
636 500 500 500 500 500 500 500 500 500 500 500 5,500
0 21,897 22,335 22,781 23,237 23,702 24,176 24,659 25,152 25,655 26,168 26,692 266,453
0 812,000 684,678 0 0 0 0 0 0 0 0 0 1,496,678-------------------- -------------------- -------------------- -------------------- -------------------- -------------------- -------------------- -------------------- -------------------- -------------------- -------------------- -------------------- ----------------------
46,695,522 47,689,565 48,948,674 49,278,716 50,315,801 51,187,275 51,967,421 52,515,013 53,113,321 53,685,159 54,293,877 54,879,138 567,873,960
REVENUES BY SOURCE485. SOLID WASTE MANAGEMENT FUND
237

This Page Intentionally Blank
238
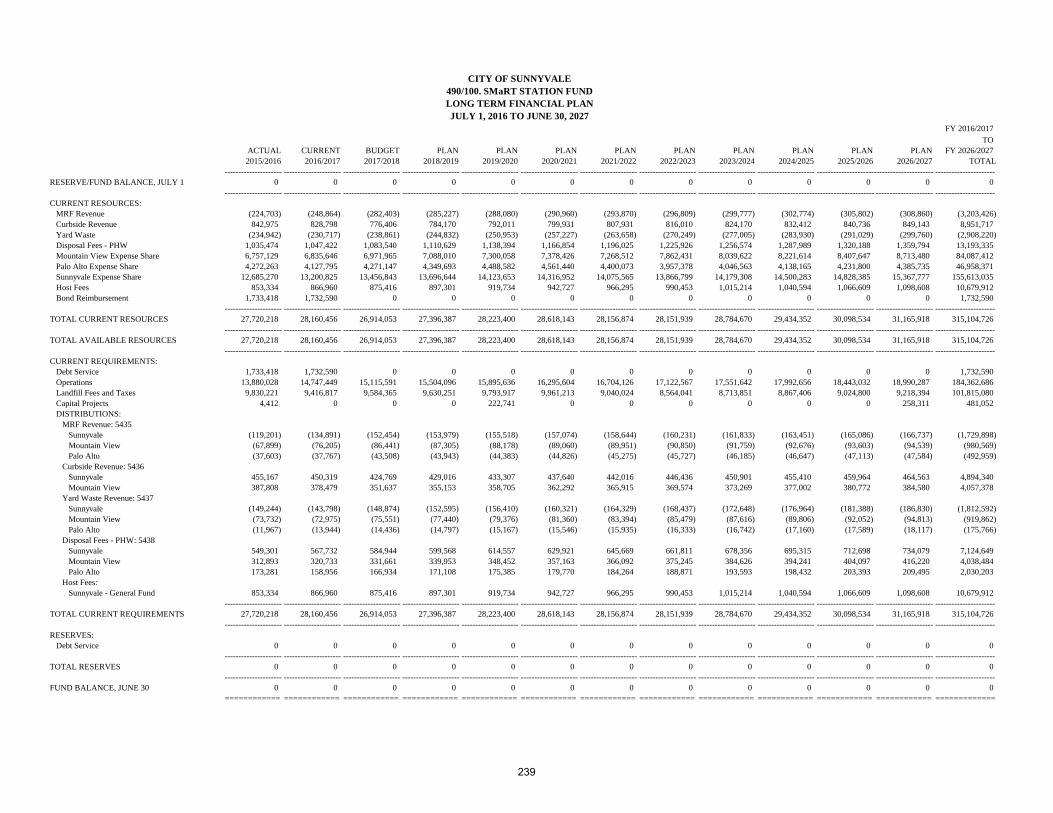
RESERVE/FUND BALANCE, JULY 1
CURRENT RESOURCES: MRF Revenue Curbside Revenue Yard Waste Disposal Fees - PHW Mountain View Expense Share Palo Alto Expense Share Sunnyvale Expense Share Host Fees Bond Reimbursement
TOTAL CURRENT RESOURCES
TOTAL AVAILABLE RESOURCES
CURRENT REQUIREMENTS: Debt Service Operations Landfill Fees and Taxes Capital Projects DISTRIBUTIONS: MRF Revenue: 5435 Sunnyvale Mountain View Palo Alto Curbside Revenue: 5436 Sunnyvale Mountain View Yard Waste Revenue: 5437 Sunnyvale Mountain View Palo Alto Disposal Fees - PHW: 5438 Sunnyvale Mountain View Palo Alto Host Fees: Sunnyvale - General Fund
TOTAL CURRENT REQUIREMENTS RESERVES: Debt Service
TOTAL RESERVES
FUND BALANCE, JUNE 30
FY 2016/2017TO
ACTUAL CURRENT BUDGET PLAN PLAN PLAN PLAN PLAN PLAN PLAN PLAN PLAN FY 2026/20272015/2016 2016/2017 2017/2018 2018/2019 2019/2020 2020/2021 2021/2022 2022/2023 2023/2024 2024/2025 2025/2026 2026/2027 TOTAL
--------------------- --------------------- --------------------- --------------------- --------------------- --------------------- --------------------- --------------------- --------------------- --------------------- ------------------------------------------- ----------------------0 0 0 0 0 0 0 0 0 0 0 0 0
--------------------- --------------------- --------------------- --------------------- --------------------- --------------------- --------------------- --------------------- --------------------- ------------------------------------------- --------------------- ----------------------
(224,703) (248,864) (282,403) (285,227) (288,080) (290,960) (293,870) (296,809) (299,777) (302,774) (305,802) (308,860) (3,203,426)842,975 828,798 776,406 784,170 792,011 799,931 807,931 816,010 824,170 832,412 840,736 849,143 8,951,717
(234,942) (230,717) (238,861) (244,832) (250,953) (257,227) (263,658) (270,249) (277,005) (283,930) (291,029) (299,760) (2,908,220)1,035,474 1,047,422 1,083,540 1,110,629 1,138,394 1,166,854 1,196,025 1,225,926 1,256,574 1,287,989 1,320,188 1,359,794 13,193,3356,757,129 6,835,646 6,971,965 7,088,010 7,300,058 7,378,426 7,268,512 7,862,431 8,039,622 8,221,614 8,407,647 8,713,480 84,087,4124,272,263 4,127,795 4,271,147 4,349,693 4,488,582 4,561,440 4,400,073 3,957,378 4,046,563 4,138,165 4,231,800 4,385,735 46,958,371
12,685,270 13,200,825 13,456,843 13,696,644 14,123,653 14,316,952 14,075,565 13,866,799 14,179,308 14,500,283 14,828,385 15,367,777 155,613,035853,334 866,960 875,416 897,301 919,734 942,727 966,295 990,453 1,015,214 1,040,594 1,066,609 1,098,608 10,679,912
1,733,418 1,732,590 0 0 0 0 0 0 0 0 0 0 1,732,590--------------------- --------------------- --------------------- --------------------- --------------------- --------------------- --------------------- --------------------- --------------------- --------------------- --------------------- --------------------- ----------------------
27,720,218 28,160,456 26,914,053 27,396,387 28,223,400 28,618,143 28,156,874 28,151,939 28,784,670 29,434,352 30,098,534 31,165,918 315,104,726--------------------- --------------------- --------------------- --------------------- --------------------- --------------------- --------------------- --------------------- --------------------- --------------------- --------------------- --------------------- ----------------------
27,720,218 28,160,456 26,914,053 27,396,387 28,223,400 28,618,143 28,156,874 28,151,939 28,784,670 29,434,352 30,098,534 31,165,918 315,104,726--------------------- --------------------- --------------------- --------------------- --------------------- --------------------- --------------------- --------------------- --------------------- --------------------- --------------------- --------------------- ----------------------
1,733,418 1,732,590 0 0 0 0 0 0 0 0 0 0 1,732,59013,880,028 14,747,449 15,115,591 15,504,096 15,895,636 16,295,604 16,704,126 17,122,567 17,551,642 17,992,656 18,443,032 18,990,287 184,362,686
9,830,221 9,416,817 9,584,365 9,630,251 9,793,917 9,961,213 9,040,024 8,564,041 8,713,851 8,867,406 9,024,800 9,218,394 101,815,0804,412 0 0 0 222,741 0 0 0 0 0 0 258,311 481,052
(119,201) (134,891) (152,454) (153,979) (155,518) (157,074) (158,644) (160,231) (161,833) (163,451) (165,086) (166,737) (1,729,898)(67,899) (76,205) (86,441) (87,305) (88,178) (89,060) (89,951) (90,850) (91,759) (92,676) (93,603) (94,539) (980,569)(37,603) (37,767) (43,508) (43,943) (44,383) (44,826) (45,275) (45,727) (46,185) (46,647) (47,113) (47,584) (492,959)
455,167 450,319 424,769 429,016 433,307 437,640 442,016 446,436 450,901 455,410 459,964 464,563 4,894,340387,808 378,479 351,637 355,153 358,705 362,292 365,915 369,574 373,269 377,002 380,772 384,580 4,057,378
(149,244) (143,798) (148,874) (152,595) (156,410) (160,321) (164,329) (168,437) (172,648) (176,964) (181,388) (186,830) (1,812,592)(73,732) (72,975) (75,551) (77,440) (79,376) (81,360) (83,394) (85,479) (87,616) (89,806) (92,052) (94,813) (919,862)(11,967) (13,944) (14,436) (14,797) (15,167) (15,546) (15,935) (16,333) (16,742) (17,160) (17,589) (18,117) (175,766)
549,301 567,732 584,944 599,568 614,557 629,921 645,669 661,811 678,356 695,315 712,698 734,079 7,124,649312,893 320,733 331,661 339,953 348,452 357,163 366,092 375,245 384,626 394,241 404,097 416,220 4,038,484173,281 158,956 166,934 171,108 175,385 179,770 184,264 188,871 193,593 198,432 203,393 209,495 2,030,203
853,334 866,960 875,416 897,301 919,734 942,727 966,295 990,453 1,015,214 1,040,594 1,066,609 1,098,608 10,679,912--------------------- --------------------- --------------------- --------------------- --------------------- --------------------- --------------------- --------------------- --------------------- --------------------- --------------------- --------------------- ----------------------
27,720,218 28,160,456 26,914,053 27,396,387 28,223,400 28,618,143 28,156,874 28,151,939 28,784,670 29,434,352 30,098,534 31,165,918 315,104,726--------------------- --------------------- --------------------- --------------------- --------------------- --------------------- --------------------- --------------------- --------------------- --------------------- --------------------- --------------------- ----------------------
0 0 0 0 0 0 0 0 0 0 0 0 0--------------------- --------------------- --------------------- --------------------- --------------------- --------------------- --------------------- --------------------- --------------------- --------------------- --------------------- --------------------- ----------------------
0 0 0 0 0 0 0 0 0 0 0 0 0--------------------- --------------------- --------------------- --------------------- --------------------- --------------------- --------------------- --------------------- --------------------- --------------------- --------------------- --------------------- ----------------------
0 0 0 0 0 0 0 0 0 0 0 0 0============ ============ ============ ============ ============ ============ ============ ============ ============ ============ ============ ============ =============
JULY 1, 2016 TO JUNE 30, 2027LONG TERM FINANCIAL PLAN490/100. SMaRT STATION FUND
CITY OF SUNNYVALE
239

RESERVE/FUND BALANCE, JULY 1
CURRENT RESOURCES: MRF Revenue Curbside Revenue Yard Waste Disposal Fees - PHW Mountain View Expense Share Palo Alto Expense Share Sunnyvale Expense Share Host Fees Bond Reimbursement
TOTAL CURRENT RESOURCES
TOTAL AVAILABLE RESOURCES
CURRENT REQUIREMENTS: Debt Service Operations Landfill Fees and Taxes Capital Projects DISTRIBUTIONS: MRF Revenue: 5435 Sunnyvale Mountain View Palo Alto Curbside Revenue: 5436 Sunnyvale Mountain View Yard Waste Revenue: 5437 Sunnyvale Mountain View Palo Alto Disposal Fees - PHW: 5438 Sunnyvale Mountain View Palo Alto Host Fees: Sunnyvale - General Fund
TOTAL CURRENT REQUIREMENTS RESERVES: Debt Service
TOTAL RESERVES
FUND BALANCE, JUNE 30
FY 2027/2028 FY 2016/2017TO TO
PLAN PLAN PLAN PLAN PLAN PLAN PLAN PLAN PLAN PLAN FY 2036/2037 FY 2036/20372027/2028 2028/2029 2029/2030 2030/2031 2031/2032 2032/2033 2033/2034 2034/2035 2035/2036 2036/2037 TOTAL TOTAL
--------------------- --------------------- --------------------- --------------------- --------------------- --------------------- --------------------- --------------------- ------------------------------------------- ---------------------- ----------------------0 0 0 0 0 0 0 0 0 0 0 0
--------------------- --------------------- --------------------- --------------------- --------------------- --------------------- --------------------- --------------------- --------------------- --------------------- ---------------------- ----------------------
(311,949) (315,068) (318,219) (321,401) (324,615) (327,861) (331,140) (334,451) (337,796) (341,174) (3,263,675) (6,467,101)857,635 866,211 874,873 883,622 892,458 901,383 910,397 919,500 928,695 937,982 8,972,756 17,924,474
(308,752) (318,015) (327,555) (337,382) (347,503) (357,929) (368,666) (379,726) (391,118) (402,852) (3,539,499) (6,447,720)1,400,588 1,442,605 1,485,884 1,530,460 1,576,374 1,623,665 1,672,375 1,722,546 1,774,223 1,827,449 16,056,169 29,249,5048,867,908 9,107,609 9,354,728 9,608,353 9,857,455 10,126,848 10,498,078 10,688,125 10,981,089 11,282,213 100,372,406 184,459,8184,463,462 4,584,111 4,708,492 4,836,149 4,961,529 5,097,121 5,283,972 5,379,628 5,527,085 5,678,649 50,520,198 97,478,569
15,640,137 16,062,893 16,498,732 16,946,044 17,385,381 17,860,502 18,515,234 18,850,414 19,367,109 19,898,196 177,024,643 332,637,6781,131,566 1,165,513 1,200,478 1,236,492 1,273,587 1,311,795 1,351,149 1,391,683 1,433,434 1,476,437 12,972,134 23,652,045
0 0 0 0 0 0 0 0 0 0 0 1,732,590--------------------- --------------------- --------------------- --------------------- --------------------- --------------------- --------------------- --------------------- --------------------- --------------------- ---------------------- ----------------------
31,740,594 32,595,859 33,477,413 34,382,337 35,274,665 36,235,524 37,531,398 38,237,719 39,282,721 40,356,901 359,115,131 674,219,857--------------------- --------------------- --------------------- --------------------- --------------------- --------------------- --------------------- --------------------- --------------------- --------------------- ---------------------- ----------------------
31,740,594 32,595,859 33,477,413 34,382,337 35,274,665 36,235,524 37,531,398 38,237,719 39,282,721 40,356,901 359,115,131 674,219,857--------------------- --------------------- --------------------- --------------------- --------------------- --------------------- --------------------- --------------------- --------------------- --------------------- ---------------------- ----------------------
0 0 0 0 0 0 0 0 0 0 0 1,732,59019,553,711 20,131,432 20,727,227 21,337,928 21,927,318 22,576,262 23,242,541 23,926,621 24,631,141 25,354,741 223,408,923 407,771,609
9,417,796 9,623,180 9,834,726 10,052,618 10,277,047 10,508,209 10,746,306 10,991,545 11,244,142 11,504,317 104,199,887 206,014,9670 0 0 0 0 0 308,437 0 0 0 308,437 789,489
(168,404) (170,088) (171,789) (173,507) (175,242) (176,994) (178,764) (180,552) (182,358) (184,181) (1,761,880) (3,491,779)(95,485) (96,439) (97,404) (98,378) (99,362) (100,355) (101,359) (102,372) (103,396) (104,430) (998,980) (1,979,550)(48,060) (48,541) (49,026) (49,516) (50,011) (50,512) (51,017) (51,527) (52,042) (52,563) (502,814) (995,773)
469,209 473,901 478,640 483,426 488,261 493,143 498,075 503,056 508,086 513,167 4,908,964 9,803,304388,426 392,310 396,233 400,195 404,197 408,239 412,322 416,445 420,609 424,816 4,063,793 8,121,170
(192,434) (198,208) (204,154) (210,278) (216,587) (223,084) (229,777) (236,670) (243,770) (251,083) (2,206,046) (4,018,637)(97,658) (100,587) (103,605) (106,713) (109,914) (113,212) (116,608) (120,106) (123,710) (127,421) (1,119,534) (2,039,396)(18,660) (19,220) (19,797) (20,391) (21,002) (21,632) (22,281) (22,950) (23,638) (24,347) (213,920) (389,686)
756,101 778,784 802,148 826,212 850,998 876,528 902,824 929,909 957,806 986,540 8,667,850 15,792,499428,707 441,568 454,815 468,460 482,513 496,989 511,898 527,255 543,073 559,365 4,914,643 8,953,127215,780 222,253 228,921 235,789 242,862 250,148 257,653 265,382 273,344 281,544 2,473,675 4,503,878
1,131,566 1,165,513 1,200,478 1,236,492 1,273,587 1,311,795 1,351,149 1,391,683 1,433,434 1,476,437 12,972,134 23,652,045--------------------- --------------------- --------------------- --------------------- --------------------- --------------------- --------------------- --------------------- --------------------- --------------------- ---------------------- ----------------------
31,740,594 32,595,859 33,477,413 34,382,337 35,274,665 36,235,524 37,531,398 38,237,719 39,282,721 40,356,901 359,115,131 674,219,857--------------------- --------------------- --------------------- --------------------- --------------------- --------------------- --------------------- --------------------- --------------------- --------------------- ---------------------- ----------------------
0 0 0 0 0 0 0 0 0 0 0 0--------------------- --------------------- --------------------- --------------------- --------------------- --------------------- --------------------- --------------------- --------------------- --------------------- ---------------------- ----------------------
0 0 0 0 0 0 0 0 0 0 0 0--------------------- --------------------- --------------------- --------------------- --------------------- --------------------- --------------------- --------------------- --------------------- --------------------- ---------------------- ----------------------
0 0 0 0 0 0 0 0 0 0 0 0============ ============ ============ ============ ============ ============ ============ ============ ============ ============ ============= =============
JULY 1, 2027 TO JUNE 30, 2037LONG TERM FINANCIAL PLAN490/100. SMaRT STATION FUND
CITY OF SUNNYVALE
240

RESERVE/FUND BALANCE, JULY 1
CURRENT RESOURCES: Contribution - Mountain View Contribution - Palo Alto Contribution - Sunnyvale Bond Reimbursement Interest Income Bond Proceeds
TOTAL CURRENT RESOURCES
TOTAL AVAILABLE RESOURCES
CURRENT REQUIREMENTS: Capital Replacement 2007 Solid Waste Bonds Debt Service New SMaRT Station Debt Service
TOTAL CURRENT REQUIREMENTS
RESERVES: Debt Service Reserve Capital Replacement
TOTAL RESERVES
FUND BALANCE, JUNE 30
FY 2016/2017TO
ACTUAL CURRENT PLAN PLAN PLAN PLAN PLAN PLAN PLAN PLAN PLAN PLAN FY 2026/20272015/2016 2016/2017 2017/2018 2018/2019 2019/2020 2020/2021 2021/2022 2022/2023 2023/2024 2024/2025 2025/2026 2026/2027 TOTAL
--------------------- --------------------- --------------------- --------------------- --------------------- --------------------- --------------------- --------------------- --------------------- --------------------- --------------------- --------------------- ----------------------2,933,584 2,919,417 841,386 1,037,410 1,207,426 787,824 14,032,717 16,493,500 2,953,904 3,075,839 3,205,165 3,342,252 2,919,417
--------------------- --------------------- --------------------- --------------------- --------------------- --------------------- --------------------- --------------------- --------------------- --------------------- --------------------- --------------------- ----------------------
64,488 87,938 105,525 99,663 99,663 0 0 0 21,105 21,738 22,390 23,062 481,08358,493 79,763 95,715 90,398 90,398 0 0 0 19,143 19,717 20,309 20,918 436,360
152,020 207,300 248,760 234,941 234,941 0 0 0 49,752 51,245 52,782 54,365 1,134,085707,715 706,436 560,047 706,368 704,800 707,122 2,000,000 2,000,000 2,000,000 2,000,000 2,000,000 2,000,000 15,384,772
24,288 18,710 18,602 33,175 39,123 9,152 9,002 8,848 39,799 44,726 49,949 55,485 326,5710 0 0 0 0 16,000,000 16,000,000 0 0 0 0 0 32,000,000
--------------------- --------------------- --------------------- --------------------- --------------------- --------------------- --------------------- --------------------- --------------------- --------------------- --------------------- --------------------- ----------------------1,007,003 1,100,146 1,028,649 1,164,544 1,168,923 16,716,274 18,009,002 2,008,848 2,129,799 2,137,426 2,145,430 2,153,831 49,762,872
--------------------- --------------------- --------------------- --------------------- --------------------- --------------------- --------------------- --------------------- --------------------- --------------------- --------------------- --------------------- ----------------------3,940,586 4,019,563 1,870,035 2,201,954 2,376,349 17,504,098 32,041,719 18,502,348 5,083,703 5,213,265 5,350,595 5,496,082 52,682,289
--------------------- --------------------- --------------------- --------------------- --------------------- --------------------- --------------------- --------------------- --------------------- --------------------- --------------------- --------------------- ----------------------
313,455 2,471,741 272,578 288,160 883,726 2,764,259 13,548,219 13,548,444 7,864 8,100 8,343 8,593 33,810,027707,715 706,436 560,047 706,368 704,800 707,122 0 0 0 0 0 0 3,384,772
0 0 0 0 0 0 2,000,000 2,000,000 2,000,000 2,000,000 2,000,000 2,000,000 12,000,000--------------------- --------------------- --------------------- --------------------- --------------------- --------------------- --------------------- --------------------- --------------------- --------------------- --------------------- --------------------- ----------------------
1,021,169 3,178,177 832,625 994,528 1,588,526 3,471,381 15,548,219 15,548,444 2,007,864 2,008,100 2,008,343 2,008,593 49,194,799--------------------- --------------------- --------------------- --------------------- --------------------- --------------------- --------------------- --------------------- --------------------- --------------------- --------------------- --------------------- ----------------------
0 0 0 0 0 2,000,000 2,000,000 2,000,000 2,000,000 2,000,000 2,000,000 2,000,000 2,000,0002,919,417 841,386 1,037,410 1,207,426 787,824 12,032,717 14,493,500 953,904 1,075,839 1,205,165 1,342,252 1,487,489 1,487,489
--------------------- --------------------- --------------------- --------------------- --------------------- --------------------- --------------------- --------------------- --------------------- --------------------- --------------------- --------------------- ----------------------2,919,417 841,386 1,037,410 1,207,426 787,824 14,032,717 16,493,500 2,953,904 3,075,839 3,205,165 3,342,252 3,487,489 3,487,489
--------------------- --------------------- --------------------- --------------------- --------------------- --------------------- --------------------- --------------------- --------------------- --------------------- --------------------- --------------------- ----------------------0 0 0 0 0 0 0 0 0 0 0 0 0
============ ============ ============ ============ ============ ============ ============ ============ ============ ============ ============ ============ =============
JULY 1, 2016 TO JUNE 30, 2027LONG TERM FINANCIAL PLAN
490/200. SMaRT STATION REPLACEMENT FUNDCITY OF SUNNYVALE
241

RESERVE/FUND BALANCE, JULY 1
CURRENT RESOURCES: Contribution - Mountain View Contribution - Palo Alto Contribution - Sunnyvale Bond Reimbursement Interest Income Bond Proceeds
TOTAL CURRENT RESOURCES
TOTAL AVAILABLE RESOURCES
CURRENT REQUIREMENTS: Capital Replacement 2007 Solid Waste Bonds Debt Service New SMaRT Station Debt Service
TOTAL CURRENT REQUIREMENTS
RESERVES: Debt Service Reserve Capital Replacement
TOTAL RESERVES
FUND BALANCE, JUNE 30
FY 2027/2028 FY 2016/2017TO TO
PLAN PLAN PLAN PLAN PLAN PLAN PLAN PLAN PLAN PLAN FY 2036/2037 FY 2036/20372027/2028 2028/2029 2029/2030 2030/2031 2031/2032 2032/2033 2033/2034 2034/2035 2035/2036 2036/2037 TOTAL TOTAL
--------------------- --------------------- --------------------- --------------------- --------------------- --------------------- --------------------- --------------------- ------------------------------------------- ---------------------- ----------------------3,487,489 3,656,620 3,298,208 2,805,712 2,949,540 2,763,349 2,781,865 2,934,101 2,942,401 2,429,007 3,487,489 2,919,417
--------------------- --------------------- --------------------- --------------------- --------------------- --------------------- --------------------- --------------------- ------------------------------------------- ---------------------- ----------------------
23,754 24,466 25,200 25,956 26,735 27,537 28,363 29,214 29,214 29,214 269,655 750,73921,546 22,192 22,858 23,543 24,250 24,977 25,727 26,498 26,498 26,498 244,587 680,94755,996 57,676 59,406 61,189 63,024 64,915 66,863 68,868 68,868 68,868 635,674 1,769,759
2,000,000 2,000,000 2,000,000 2,000,000 2,000,000 2,000,000 2,000,000 2,000,000 2,000,000 2,000,000 20,000,000 35,384,77276,686 72,069 51,315 42,811 41,778 37,688 41,853 45,768 33,449 12,368 455,785 782,356
0 0 0 0 0 0 0 0 0 0 0 32,000,000--------------------- --------------------- --------------------- --------------------- --------------------- --------------------- --------------------- --------------------- --------------------- --------------------- ---------------------- ----------------------
2,177,981 2,176,404 2,158,780 2,153,500 2,155,787 2,155,118 2,162,805 2,170,349 2,158,029 2,136,948 21,605,701 71,368,573--------------------- --------------------- --------------------- --------------------- --------------------- --------------------- --------------------- --------------------- --------------------- --------------------- ---------------------- ----------------------
5,665,471 5,833,024 5,456,987 4,959,212 5,105,327 4,918,467 4,944,670 5,104,451 5,100,430 4,565,955 25,093,190 74,287,990--------------------- --------------------- --------------------- --------------------- --------------------- --------------------- --------------------- --------------------- --------------------- --------------------- ---------------------- ----------------------
8,851 534,816 651,275 9,672 341,978 136,602 10,569 162,050 671,422 487,886 3,015,122 36,825,1490 0 0 0 0 0 0 0 0 0 0 3,384,772
2,000,000 2,000,000 2,000,000 2,000,000 2,000,000 2,000,000 2,000,000 2,000,000 2,000,000 2,000,000 20,000,000 32,000,000--------------------- --------------------- --------------------- --------------------- --------------------- --------------------- --------------------- --------------------- --------------------- --------------------- ---------------------- ----------------------
2,008,851 2,534,816 2,651,275 2,009,672 2,341,978 2,136,602 2,010,569 2,162,050 2,671,422 2,487,886 23,015,122 72,209,921--------------------- --------------------- --------------------- --------------------- --------------------- --------------------- --------------------- --------------------- --------------------- --------------------- ---------------------- ----------------------
2,000,000 2,000,000 2,000,000 2,000,000 2,000,000 2,000,000 2,000,000 2,000,000 2,000,000 2,000,000 2,000,000 2,000,0001,656,620 1,298,208 805,712 949,540 763,349 781,865 934,101 942,401 429,007 78,069 78,069 78,069
--------------------- --------------------- --------------------- --------------------- --------------------- --------------------- --------------------- --------------------- --------------------- --------------------- ---------------------- ----------------------3,656,620 3,298,208 2,805,712 2,949,540 2,763,349 2,781,865 2,934,101 2,942,401 2,429,007 2,078,069 2,078,069 2,078,069
--------------------- --------------------- --------------------- --------------------- --------------------- --------------------- --------------------- --------------------- --------------------- --------------------- ---------------------- ----------------------0 0 0 0 0 0 0 0 0 0 0 0
============ ============ ============ ============ ============ ============ ============ ====================================== ============= =============
490/200. SMaRT STATION REPLACEMENT FUND
JULY 1, 2027 TO JUNE 30, 2037LONG TERM FINANCIAL PLAN
CITY OF SUNNYVALE
242

RESERVE/FUND BALANCE, JULY 1
CURRENT RESOURCES:Development RevenuesInterest Income
TOTAL CURRENT RESOURCES
TOTAL AVAILABLE RESOURCES
CURRENT REQUIREMENTS:Operating CostsProjectsProgram In-Lieu ChargesTransfer To General FundTransfer To General Services FundFiscal Strategies
TOTAL CURRENT REQUIREMENTS
RESERVES:Development Enterprise Reserve
TOTAL RESERVES
FUND BALANCE, JUNE 30
FY 2016/2017TO
ACTUAL CURRENT BUDGET PLAN PLAN PLAN PLAN PLAN PLAN PLAN PLAN PLAN FY 2026/20272015/2016 2016/2017 2017/2018 2018/2019 2019/2020 2020/2021 2021/2022 2022/2023 2023/2024 2024/2025 2025/2026 2026/2027 TOTAL
------------------ ------------------ ------------------ ------------------ ------------------ ------------------ ------------------ ------------------ ------------------ ------------------ ------------------ ------------------ --------------------13,952,385 20,150,347 21,042,413 18,163,857 16,522,378 14,624,880 12,780,857 10,793,466 8,675,076 6,416,433 3,983,371 1,418,947 20,150,347
------------------ ------------------ ------------------ ------------------ ------------------ ------------------ ------------------ ------------------ ------------------ ------------------ ------------------ ------------------ --------------------
15,850,274 14,334,878 11,691,999 11,130,878 10,552,915 10,869,461 11,141,177 11,419,685 11,705,155 11,997,762 12,297,683 12,605,102 129,746,694150,491 208,341 263,030 317,868 330,448 438,746 383,426 323,804 260,252 192,493 119,501 42,568 2,880,477
------------------ ------------------ ------------------ ------------------ ------------------ ------------------ ------------------ ------------------ ------------------ ------------------ ------------------ ------------------ --------------------16,000,765 14,543,219 11,955,029 11,448,746 10,883,362 11,308,208 11,524,602 11,743,489 11,965,407 12,190,255 12,417,184 12,647,670 132,627,171
------------------ ------------------ ------------------ ------------------ ------------------ ------------------ ------------------ ------------------ ------------------ ------------------ ------------------ ------------------ --------------------29,953,149 34,693,566 32,997,442 29,612,603 27,405,740 25,933,087 24,305,460 22,536,954 20,640,483 18,606,688 16,400,555 14,066,617 152,777,518
------------------ ------------------ ------------------ ------------------ ------------------ ------------------ ------------------ ------------------ ------------------ ------------------ ------------------ ------------------ --------------------
8,202,537 10,709,123 11,347,884 11,382,108 11,190,857 11,529,700 11,867,324 12,183,667 12,511,626 12,875,996 13,210,554 13,524,084 132,332,924466,129 1,347,800 221,400 222,828 74,285 75,770 66,245 67,570 68,921 70,300 59,755 61,547 2,336,421
1,005,697 1,334,229 1,455,461 1,485,290 1,515,719 1,546,760 1,578,424 1,610,641 1,643,503 1,677,021 1,711,299 1,746,267 17,304,614128,440 0 0 0 0 0 0 0 0 0 0 0 0
0 260,000 1,808,840 0 0 0 0 0 0 0 0 0 2,068,8400 0 0 0 0 0 0 0 0 0 0 (1,265,281) (1,265,281)
------------------ ------------------ ------------------ ------------------ ------------------ ------------------ ------------------ ------------------ ------------------ ------------------ ------------------ ------------------ --------------------9,802,802 13,651,153 14,833,585 13,090,225 12,780,860 13,152,230 13,511,994 13,861,879 14,224,050 14,623,317 14,981,608 14,066,617 152,777,518
------------------ ------------------ ------------------ ------------------ ------------------ ------------------ ------------------ ------------------ ------------------ ------------------ ------------------ ------------------ --------------------
20,150,347 21,042,413 18,163,857 16,522,378 14,624,880 12,780,857 10,793,466 8,675,076 6,416,433 3,983,371 1,418,947 0 0------------------ ------------------ ------------------ ------------------ ------------------ ------------------ ------------------ ------------------ ------------------ ------------------ ------------------ ------------------ --------------------
20,150,347 21,042,413 18,163,857 16,522,378 14,624,880 12,780,857 10,793,466 8,675,076 6,416,433 3,983,371 1,418,947 0 0------------------ ------------------ ------------------ ------------------ ------------------ ------------------ ------------------ ------------------ ------------------ ------------------ ------------------ ------------------ --------------------
0 0 0 0 0 0 0 0 0 0 0 0 0========== ========== ========== ========== ========== ========== ========== ========== ========== ========== ========== ========== ===========
CITY OF SUNNYVALE510. DEVELOPMENT ENTERPRISE FUND
LONG TERM FINANCIAL PLANJULY 1, 2016 TO JUNE 30, 2027
243

RESERVE/FUND BALANCE, JULY 1
CURRENT RESOURCES:Development RevenuesInterest Income
TOTAL CURRENT RESOURCES
TOTAL AVAILABLE RESOURCES
CURRENT REQUIREMENTS:Operating CostsProjectsProgram In-Lieu ChargesTransfer To General FundTransfer To General Services FundFiscal Strategies
TOTAL CURRENT REQUIREMENTS
RESERVES:Development Enterprise Reserve
TOTAL RESERVES
FUND BALANCE, JUNE 30
FY 2027/2028 FY 2016/2017TO TO
PLAN PLAN PLAN PLAN PLAN PLAN PLAN PLAN PLAN PLAN FY 2036/2037 FY 2036/20372027/2028 2028/2029 2029/2030 2030/2031 2031/2032 2032/2033 2033/2034 2034/2035 2035/2036 2036/2037 TOTAL TOTAL
------------------ ------------------ ------------------ ------------------ ------------------ ------------------ ------------------ ------------------ ------------------ ------------------ -------------------- --------------------0 0 0 0 0 0 0 0 0 0 0 20,150,347
------------------ ------------------ ------------------ ------------------ ------------------ ------------------ ------------------ ------------------ ------------------ ------------------ -------------------- --------------------
12,983,255 13,372,753 13,773,935 14,187,153 14,612,768 15,051,151 15,502,685 15,967,766 16,446,799 16,940,203 148,838,467 278,585,1610 0 0 0 0 0 0 0 0 0 0 2,880,477
------------------ ------------------ ------------------ ------------------ ------------------ ------------------ ------------------ ------------------ ------------------ ------------------ -------------------- --------------------12,983,255 13,372,753 13,773,935 14,187,153 14,612,768 15,051,151 15,502,685 15,967,766 16,446,799 16,940,203 148,838,467 281,465,638
------------------ ------------------ ------------------ ------------------ ------------------ ------------------ ------------------ ------------------ ------------------ ------------------ -------------------- --------------------12,983,255 13,372,753 13,773,935 14,187,153 14,612,768 15,051,151 15,502,685 15,967,766 16,446,799 16,940,203 148,838,467 301,615,985
------------------ ------------------ ------------------ ------------------ ------------------ ------------------ ------------------ ------------------ ------------------ ------------------ -------------------- --------------------
13,810,050 14,090,549 14,413,884 14,681,362 14,054,404 14,321,581 14,596,982 14,856,349 15,113,055 15,376,438 145,314,653 277,647,57763,394 65,295 67,254 69,272 71,350 73,491 75,695 77,966 80,305 82,714 726,736 3,063,157
1,799,628 1,854,540 1,911,098 1,969,352 2,029,353 2,091,261 2,155,028 2,220,593 2,288,124 2,357,620 20,676,598 37,981,2130 0 0 0 0 0 0 0 0 0 0 00 0 0 0 0 0 0 0 0 0 0 2,068,840
(2,689,818) (2,637,632) (2,618,301) (2,532,833) (1,542,339) (1,435,182) (1,325,019) (1,187,142) (1,034,686) (876,569) (17,879,521) (19,144,802)------------------ ------------------ ------------------ ------------------ ------------------ ------------------ ------------------ ------------------ ------------------ ------------------ -------------------- --------------------
12,983,255 13,372,753 13,773,935 14,187,153 14,612,768 15,051,151 15,502,685 15,967,766 16,446,799 16,940,203 148,838,467 301,615,985------------------ ------------------ ------------------ ------------------ ------------------ ------------------ ------------------ ------------------ ------------------ ------------------ -------------------- --------------------
0 0 0 0 0 0 0 0 0 0 0 0
------------------ ------------------ ------------------ ------------------ ------------------ ------------------ ------------------ ------------------ ------------------ ------------------ -------------------- --------------------0 0 0 0 0 0 0 0 0 0 0 0
------------------ ------------------ ------------------ ------------------ ------------------ ------------------ ------------------ ------------------ ------------------ ------------------ -------------------- --------------------0 0 0 0 0 0 0 0 0 0 0 0
========== ========== ========== ========== ========== ========== ========== ========== ========== ========== =========== ===========
JULY 1, 2027 TO JUNE 30, 2037
CITY OF SUNNYVALE510. DEVELOPMENT ENTERPRISE FUND
LONG TERM FINANCIAL PLAN
244
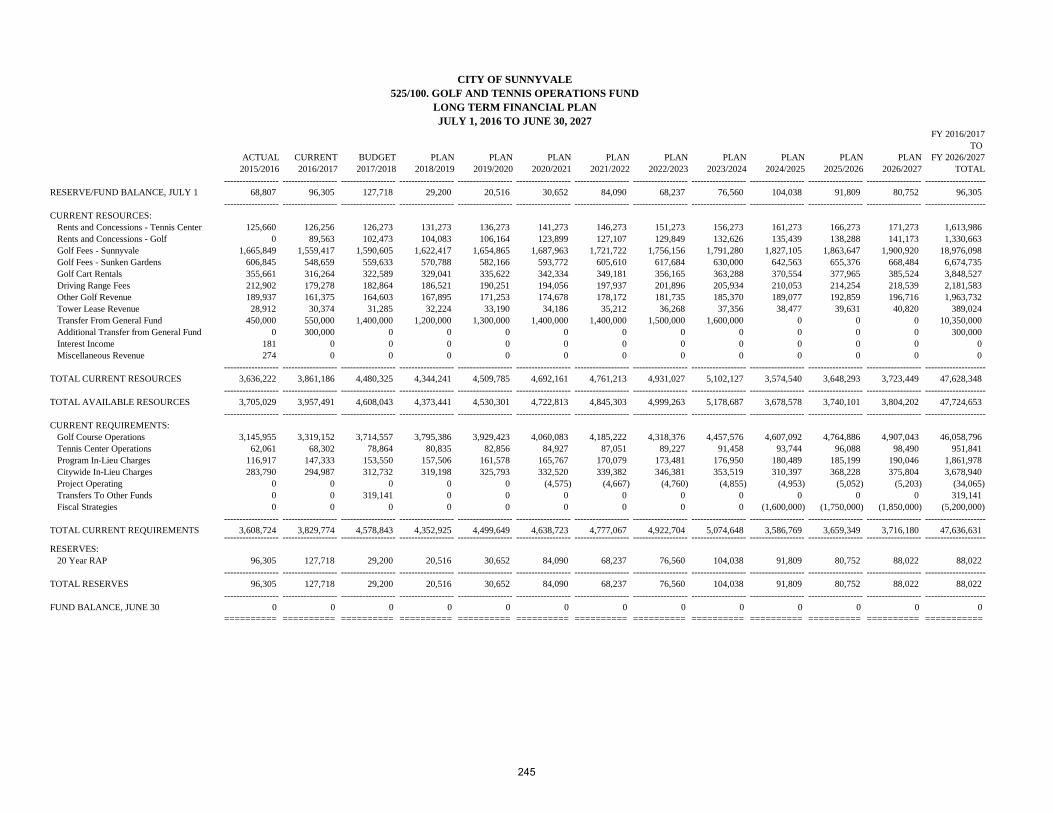
FY 2016/2017TO
ACTUAL CURRENT BUDGET PLAN PLAN PLAN PLAN PLAN PLAN PLAN PLAN PLAN FY 2026/20272015/2016 2016/2017 2017/2018 2018/2019 2019/2020 2020/2021 2021/2022 2022/2023 2023/2024 2024/2025 2025/2026 2026/2027 TOTAL
------------------ ------------------ ------------------ ------------------ ------------------ ------------------ ------------------ ------------------ ------------------ ------------------ ------------------ ------------------ --------------------RESERVE/FUND BALANCE, JULY 1 68,807 96,305 127,718 29,200 20,516 30,652 84,090 68,237 76,560 104,038 91,809 80,752 96,305
------------------ ------------------ ------------------ ------------------ ------------------ ------------------ ------------------ ------------------ ------------------ ------------------ ------------------ ------------------ --------------------CURRENT RESOURCES: Rents and Concessions - Tennis Center 125,660 126,256 126,273 131,273 136,273 141,273 146,273 151,273 156,273 161,273 166,273 171,273 1,613,986 Rents and Concessions - Golf 0 89,563 102,473 104,083 106,164 123,899 127,107 129,849 132,626 135,439 138,288 141,173 1,330,663 Golf Fees - Sunnyvale 1,665,849 1,559,417 1,590,605 1,622,417 1,654,865 1,687,963 1,721,722 1,756,156 1,791,280 1,827,105 1,863,647 1,900,920 18,976,098 Golf Fees - Sunken Gardens 606,845 548,659 559,633 570,788 582,166 593,772 605,610 617,684 630,000 642,563 655,376 668,484 6,674,735 Golf Cart Rentals 355,661 316,264 322,589 329,041 335,622 342,334 349,181 356,165 363,288 370,554 377,965 385,524 3,848,527 Driving Range Fees 212,902 179,278 182,864 186,521 190,251 194,056 197,937 201,896 205,934 210,053 214,254 218,539 2,181,583 Other Golf Revenue 189,937 161,375 164,603 167,895 171,253 174,678 178,172 181,735 185,370 189,077 192,859 196,716 1,963,732 Tower Lease Revenue 28,912 30,374 31,285 32,224 33,190 34,186 35,212 36,268 37,356 38,477 39,631 40,820 389,024 Transfer From General Fund 450,000 550,000 1,400,000 1,200,000 1,300,000 1,400,000 1,400,000 1,500,000 1,600,000 0 0 0 10,350,000 Additional Transfer from General Fund 0 300,000 0 0 0 0 0 0 0 0 0 0 300,000 Interest Income 181 0 0 0 0 0 0 0 0 0 0 0 0 Miscellaneous Revenue 274 0 0 0 0 0 0 0 0 0 0 0 0
------------------ ------------------ ------------------ ------------------ ------------------ ------------------ ------------------ ------------------ ------------------ ------------------ ------------------ ------------------ --------------------TOTAL CURRENT RESOURCES 3,636,222 3,861,186 4,480,325 4,344,241 4,509,785 4,692,161 4,761,213 4,931,027 5,102,127 3,574,540 3,648,293 3,723,449 47,628,348
------------------ ------------------ ------------------ ------------------ ------------------ ------------------ ------------------ ------------------ ------------------ ------------------ ------------------ ------------------ --------------------TOTAL AVAILABLE RESOURCES 3,705,029 3,957,491 4,608,043 4,373,441 4,530,301 4,722,813 4,845,303 4,999,263 5,178,687 3,678,578 3,740,101 3,804,202 47,724,653
------------------ ------------------ ------------------ ------------------ ------------------ ------------------ ------------------ ------------------ ------------------ ------------------ ------------------ ------------------ --------------------CURRENT REQUIREMENTS: Golf Course Operations 3,145,955 3,319,152 3,714,557 3,795,386 3,929,423 4,060,083 4,185,222 4,318,376 4,457,576 4,607,092 4,764,886 4,907,043 46,058,796 Tennis Center Operations 62,061 68,302 78,864 80,835 82,856 84,927 87,051 89,227 91,458 93,744 96,088 98,490 951,841 Program In-Lieu Charges 116,917 147,333 153,550 157,506 161,578 165,767 170,079 173,481 176,950 180,489 185,199 190,046 1,861,978 Citywide In-Lieu Charges 283,790 294,987 312,732 319,198 325,793 332,520 339,382 346,381 353,519 310,397 368,228 375,804 3,678,940 Project Operating 0 0 0 0 0 (4,575) (4,667) (4,760) (4,855) (4,953) (5,052) (5,203) (34,065) Transfers To Other Funds 0 0 319,141 0 0 0 0 0 0 0 0 0 319,141 Fiscal Strategies 0 0 0 0 0 0 0 0 0 (1,600,000) (1,750,000) (1,850,000) (5,200,000)
------------------ ------------------ ------------------ ------------------ ------------------ ------------------ ------------------ ------------------ ------------------ ------------------ ------------------ ------------------ --------------------TOTAL CURRENT REQUIREMENTS 3,608,724 3,829,774 4,578,843 4,352,925 4,499,649 4,638,723 4,777,067 4,922,704 5,074,648 3,586,769 3,659,349 3,716,180 47,636,631
------------------ ------------------ ------------------ ------------------ ------------------ ------------------ ------------------ ------------------ ------------------ ------------------ ------------------ ------------------ --------------------RESERVES: 20 Year RAP 96,305 127,718 29,200 20,516 30,652 84,090 68,237 76,560 104,038 91,809 80,752 88,022 88,022
------------------ ------------------ ------------------ ------------------ ------------------ ------------------ ------------------ ------------------ ------------------ ------------------ ------------------ ------------------ --------------------TOTAL RESERVES 96,305 127,718 29,200 20,516 30,652 84,090 68,237 76,560 104,038 91,809 80,752 88,022 88,022
------------------ ------------------ ------------------ ------------------ ------------------ ------------------ ------------------ ------------------ ------------------ ------------------ ------------------ ------------------ --------------------FUND BALANCE, JUNE 30 0 0 0 0 0 0 0 0 0 0 0 0 0
========== ========== ========== ========== ========== ========== ========== ========== ========== ========== ========== ========== ===========
JULY 1, 2016 TO JUNE 30, 2027
CITY OF SUNNYVALE525/100. GOLF AND TENNIS OPERATIONS FUND
LONG TERM FINANCIAL PLAN
245
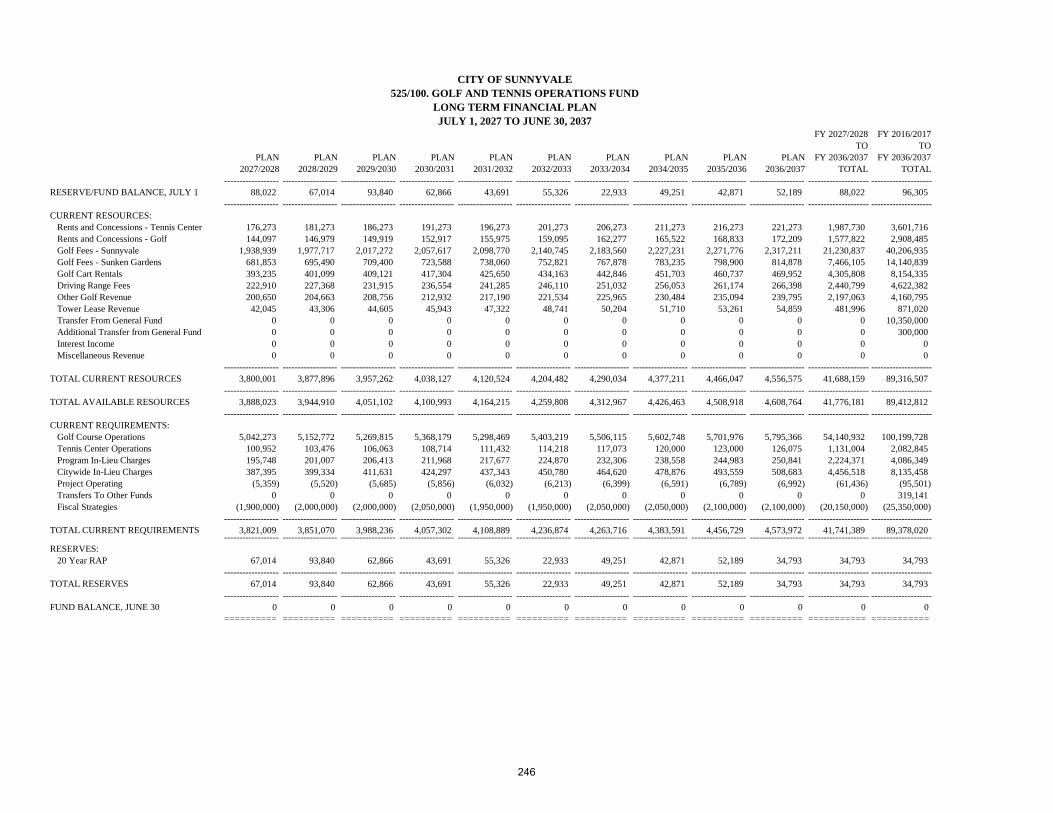
RESERVE/FUND BALANCE, JULY 1
CURRENT RESOURCES: Rents and Concessions - Tennis Center Rents and Concessions - Golf Golf Fees - Sunnyvale Golf Fees - Sunken Gardens Golf Cart Rentals Driving Range Fees Other Golf Revenue Tower Lease Revenue Transfer From General Fund Additional Transfer from General Fund Interest Income Miscellaneous Revenue
TOTAL CURRENT RESOURCES
TOTAL AVAILABLE RESOURCES
CURRENT REQUIREMENTS: Golf Course Operations Tennis Center Operations Program In-Lieu Charges Citywide In-Lieu Charges Project Operating Transfers To Other Funds Fiscal Strategies
TOTAL CURRENT REQUIREMENTS
RESERVES: 20 Year RAP
TOTAL RESERVES
FUND BALANCE, JUNE 30
FY 2027/2028 FY 2016/2017TO TO
PLAN PLAN PLAN PLAN PLAN PLAN PLAN PLAN PLAN PLAN FY 2036/2037 FY 2036/20372027/2028 2028/2029 2029/2030 2030/2031 2031/2032 2032/2033 2033/2034 2034/2035 2035/2036 2036/2037 TOTAL TOTAL
------------------ ------------------ ------------------ ------------------ ------------------ ------------------ ------------------ ------------------ ------------------ ------------------ -------------------- --------------------88,022 67,014 93,840 62,866 43,691 55,326 22,933 49,251 42,871 52,189 88,022 96,305
------------------ ------------------ ------------------ ------------------ ------------------ ------------------ ------------------ ------------------ ------------------ ------------------ -------------------- --------------------
176,273 181,273 186,273 191,273 196,273 201,273 206,273 211,273 216,273 221,273 1,987,730 3,601,716144,097 146,979 149,919 152,917 155,975 159,095 162,277 165,522 168,833 172,209 1,577,822 2,908,485
1,938,939 1,977,717 2,017,272 2,057,617 2,098,770 2,140,745 2,183,560 2,227,231 2,271,776 2,317,211 21,230,837 40,206,935681,853 695,490 709,400 723,588 738,060 752,821 767,878 783,235 798,900 814,878 7,466,105 14,140,839393,235 401,099 409,121 417,304 425,650 434,163 442,846 451,703 460,737 469,952 4,305,808 8,154,335222,910 227,368 231,915 236,554 241,285 246,110 251,032 256,053 261,174 266,398 2,440,799 4,622,382200,650 204,663 208,756 212,932 217,190 221,534 225,965 230,484 235,094 239,795 2,197,063 4,160,795
42,045 43,306 44,605 45,943 47,322 48,741 50,204 51,710 53,261 54,859 481,996 871,0200 0 0 0 0 0 0 0 0 0 0 10,350,0000 0 0 0 0 0 0 0 0 0 0 300,0000 0 0 0 0 0 0 0 0 0 0 00 0 0 0 0 0 0 0 0 0 0 0
------------------ ------------------ ------------------ ------------------ ------------------ ------------------ ------------------ ------------------ ------------------ ------------------ -------------------- --------------------3,800,001 3,877,896 3,957,262 4,038,127 4,120,524 4,204,482 4,290,034 4,377,211 4,466,047 4,556,575 41,688,159 89,316,507
------------------ ------------------ ------------------ ------------------ ------------------ ------------------ ------------------ ------------------ ------------------ ------------------ -------------------- --------------------3,888,023 3,944,910 4,051,102 4,100,993 4,164,215 4,259,808 4,312,967 4,426,463 4,508,918 4,608,764 41,776,181 89,412,812
------------------ ------------------ ------------------ ------------------ ------------------ ------------------ ------------------ ------------------ ------------------ ------------------ -------------------- --------------------
5,042,273 5,152,772 5,269,815 5,368,179 5,298,469 5,403,219 5,506,115 5,602,748 5,701,976 5,795,366 54,140,932 100,199,728100,952 103,476 106,063 108,714 111,432 114,218 117,073 120,000 123,000 126,075 1,131,004 2,082,845195,748 201,007 206,413 211,968 217,677 224,870 232,306 238,558 244,983 250,841 2,224,371 4,086,349387,395 399,334 411,631 424,297 437,343 450,780 464,620 478,876 493,559 508,683 4,456,518 8,135,458
(5,359) (5,520) (5,685) (5,856) (6,032) (6,213) (6,399) (6,591) (6,789) (6,992) (61,436) (95,501)0 0 0 0 0 0 0 0 0 0 0 319,141
(1,900,000) (2,000,000) (2,000,000) (2,050,000) (1,950,000) (1,950,000) (2,050,000) (2,050,000) (2,100,000) (2,100,000) (20,150,000) (25,350,000)------------------ ------------------ ------------------ ------------------ ------------------ ------------------ ------------------ ------------------ ------------------ ------------------ -------------------- --------------------
3,821,009 3,851,070 3,988,236 4,057,302 4,108,889 4,236,874 4,263,716 4,383,591 4,456,729 4,573,972 41,741,389 89,378,020------------------ ------------------ ------------------ ------------------ ------------------ ------------------ ------------------ ------------------ ------------------ ------------------ -------------------- --------------------
67,014 93,840 62,866 43,691 55,326 22,933 49,251 42,871 52,189 34,793 34,793 34,793------------------ ------------------ ------------------ ------------------ ------------------ ------------------ ------------------ ------------------ ------------------ ------------------ -------------------- --------------------
67,014 93,840 62,866 43,691 55,326 22,933 49,251 42,871 52,189 34,793 34,793 34,793------------------ ------------------ ------------------ ------------------ ------------------ ------------------ ------------------ ------------------ ------------------ ------------------ -------------------- --------------------
0 0 0 0 0 0 0 0 0 0 0 0 ========== ========== ========== ========== ========== ========== ========== ========== ========== ========== =========== ===========
JULY 1, 2027 TO JUNE 30, 2037
CITY OF SUNNYVALE525/100. GOLF AND TENNIS OPERATIONS FUND
LONG TERM FINANCIAL PLAN
246

0750-01 License Fee Tennis Center
0750-04 Lookout Rental
0750-08 Tennis Center Garbage Fee
0752-03 Rental - Park Buildings
0754-09 Tower/Antenna Rental - Verizon
1372 Permit - Liquidambar Street T
TOTAL RENTS AND CONCESSIONS
1950-11 Sunnyvale Weekday
1950-12 Sunnyvale Weekday Twilight
1950 -13 Sunnyvale Weekend/Holiday
1950-14 Sunnyvale W/E Holiday Twilight
1950-15 Sunnyvale S.A.C.
1950-16 Sunnyvale Golf Discount
1950-17 Sunnyvale 10-Play Card
1950-18 Smart Card Fee Sunnyvale
1950-19 Weekday Super Twilight
1950-20 Weekend Super Twilight
1951 SM Gift Certificates
1952 School Group Play
1954-01 Tournament Fee - Sunnyvale
1954-02 Tournament Fee - Sunken Gardens
1963-11 Sunken Garden Weekday
1963-13 Sunken Garden Weekend/Holiday
1963-14 Sunken Garden Weekend Twilight Replay
1963-15 Sunken Garden 10 Play
FY 2016/2017TO
ACTUAL CURRENT BUDGET PLAN PLAN PLAN PLAN PLAN PLAN PLAN PLAN PLAN FY 2026/20272015/2016 2016/2017 2017/2018 2018/2019 2019/2020 2020/2021 2021/2022 2022/2023 2023/2024 2024/2025 2025/2026 2026/2027 TOTAL
------------------- ------------------- ------------------- ------------------- ------------------- ------------------- ------------------- ------------------- ------------------- ------------------- ------------------- ------------------- --------------------
121,256 126,256 126,273 131,273 136,273 141,273 146,273 151,273 156,273 161,273 166,273 171,273 1,613,986
0 10,664 21,996 21,996 22,436 38,496 39,996 40,996 41,996 42,996 43,996 44,996 370,564
4,224 0 0 0 0 0 0 0 0 0 0 0 0
0 78,899 80,477 82,087 83,728 85,403 87,111 88,853 90,630 92,443 94,292 96,177 960,099
28,912 30,374 31,285 32,224 33,190 34,186 35,212 36,268 37,356 38,477 39,631 40,820 389,024
180 0 0 0 0 0 0 0 0 0 0 0 0------------------- ------------------- ------------------- ------------------- ------------------- ------------------- ------------------- ------------------- ------------------- ------------------- ------------------- ------------------- --------------------
154,572 246,193 260,031 267,579 275,628 299,358 308,592 317,390 326,255 335,189 344,192 353,267 3,333,673------------------- ------------------- ------------------- ------------------- ------------------- ------------------- ------------------- ------------------- ------------------- ------------------- ------------------- ------------------- --------------------
502,807 470,682 480,096 489,698 499,492 509,482 519,671 530,065 540,666 551,479 562,509 573,759 5,727,597
190,679 178,496 182,066 185,708 189,422 193,210 197,074 201,016 205,036 209,137 213,320 217,586 2,172,071
538,301 503,908 513,987 524,266 534,752 545,447 556,356 567,483 578,832 590,409 602,217 614,262 6,131,918
163,306 152,872 155,930 159,048 162,229 165,474 168,783 172,159 175,602 179,114 182,696 186,350 1,860,259
20,466 19,159 19,542 19,933 20,331 20,738 21,153 21,576 22,007 22,447 22,896 23,354 233,135
117,122 109,639 111,832 114,068 116,350 118,677 121,050 123,471 125,941 128,460 131,029 133,649 1,334,165
3,995 3,740 3,815 3,891 3,969 4,048 4,129 4,212 4,296 4,382 4,470 4,559 45,512
615 576 587 599 611 623 636 648 661 675 688 702 7,006
91,923 86,050 87,771 89,526 91,317 93,143 95,006 96,906 98,844 100,821 102,838 104,894 1,047,117
27,878 26,097 26,619 27,151 27,694 28,248 28,813 29,389 29,977 30,577 31,188 31,812 317,565
957 896 914 932 951 970 989 1,009 1,029 1,050 1,071 1,092 10,900
2,000 1,872 1,910 1,948 1,987 2,027 2,067 2,108 2,151 2,194 2,237 2,282 22,782
5,800 5,429 5,538 5,649 5,762 5,877 5,995 6,114 6,237 6,361 6,489 6,618 66,069
455 425 434 443 452 461 470 479 489 498 508 519 5,177
285,204 257,851 263,008 268,269 273,634 279,107 284,689 290,382 296,190 302,114 308,156 314,319 3,137,719
235,185 212,629 216,882 221,220 225,644 230,157 234,760 239,455 244,244 249,129 254,112 259,194 2,587,428
260 235 240 245 249 254 260 265 270 275 281 287 2,860
17,883 16,168 16,491 16,821 17,158 17,501 17,851 18,208 18,572 18,943 19,322 19,709 196,743
525/100 GOLF AND TENNIS OPERATIONS FUNDREVENUES BY SOURCE
247

1963-16 Sunken Garden Golf Discount
1963-17 Sunken Garden Advantage Card
1963-18 Sunken Garden Smart Card Fee
1964 Sunken Gardens Gift Certificates
TOTAL GOLF FEES
1955 Golf Cart Rental
1956 Driving Range Fees
1957 Golf Miscellaneous Rentals
4100 Miscellaneous Golf Revenues
4114 Miscellaneous Golf Revenues
4175 Golf Merchandise Sales
4180 Golf Instruction
TOTAL GOLF AND TENNIS SHOP REVENUE
4100 Miscellaneous Revenue
TOTAL MISCELLANEOUS REVENUE
3355 Interest Income
TOTAL INTEREST INCOME
4400-03 Transfer From General Fund
TOTAL TRANSFERS IN
FUND TOTAL
FY 2016/2017TO
ACTUAL CURRENT BUDGET PLAN PLAN PLAN PLAN PLAN PLAN PLAN PLAN PLAN FY 2026/20272015/2016 2016/2017 2017/2018 2018/2019 2019/2020 2020/2021 2021/2022 2022/2023 2023/2024 2024/2025 2025/2026 2026/2027 TOTAL
------------------- ------------------- ------------------- ------------------- ------------------- ------------------- ------------------- ------------------- ------------------- ------------------- ------------------- ------------------- --------------------
525/100 GOLF AND TENNIS OPERATIONS FUNDREVENUES BY SOURCE
58,028 52,463 53,512 54,582 55,674 56,787 57,923 59,082 60,263 61,469 62,698 63,952 638,405
7,790 7,043 7,184 7,327 7,474 7,623 7,776 7,931 8,090 8,252 8,417 8,585 85,703
710 642 655 655 655 655 655 655 655 655 655 668 7,202
1,331 1,203 1,227 1,227 1,227 1,227 1,227 1,227 1,227 1,227 1,227 1,251 13,497------------------- ------------------- ------------------- ------------------- ------------------- ------------------- ------------------- ------------------- ------------------- ------------------- ------------------- ------------------- --------------------
2,272,694 2,108,076 2,150,238 2,193,205 2,237,032 2,281,735 2,327,332 2,373,841 2,421,280 2,469,668 2,519,024 2,569,404 25,650,833------------------- ------------------- ------------------- ------------------- ------------------- ------------------- ------------------- ------------------- ------------------- ------------------- ------------------- ------------------- --------------------
355,661 316,264 322,589 329,041 335,622 342,334 349,181 356,165 363,288 370,554 377,965 385,524 3,848,527
212,902 179,278 182,864 186,521 190,251 194,056 197,937 201,896 205,934 210,053 214,254 218,539 2,181,583
34,556 0 0 0 0 0 0 0 0 0 0 0 0
274 0 0 0 0 0 0 0 0 0 0 0 0
(89) 0 0 0 0 0 0 0 0 0 0 0 0
131,743 136,988 139,728 142,523 145,373 148,281 151,247 154,272 157,357 160,504 163,714 166,988 1,666,976
23,453 24,387 24,875 25,372 25,879 26,397 26,925 27,464 28,013 28,573 29,144 29,727 296,756------------------- ------------------- ------------------- ------------------- ------------------- ------------------- ------------------- ------------------- ------------------- ------------------- ------------------- ------------------- --------------------
758,500 656,917 670,056 683,457 697,126 711,069 725,290 739,796 754,592 769,684 785,077 800,779 7,993,842------------------- ------------------- ------------------- ------------------- ------------------- ------------------- ------------------- ------------------- ------------------- ------------------- ------------------- ------------------- --------------------
274 0 0 0 0 0 0 0 0 0 0 0 0------------------- ------------------- ------------------- ------------------- ------------------- ------------------- ------------------- ------------------- ------------------- ------------------- ------------------- ------------------- --------------------
274 0 0 0 0 0 0 0 0 0 0 0 0------------------- ------------------- ------------------- ------------------- ------------------- ------------------- ------------------- ------------------- ------------------- ------------------- ------------------- ------------------- --------------------
181 0 0 0 0 0 0 0 0 0 0 0 0------------------- ------------------- ------------------- ------------------- ------------------- ------------------- ------------------- ------------------- ------------------- ------------------- ------------------- ------------------- --------------------
181 0 0 0 0 0 0 0 0 0 0 0 0------------------- ------------------- ------------------- ------------------- ------------------- ------------------- ------------------- ------------------- ------------------- ------------------- ------------------- ------------------- --------------------
450,000 850,000 1,400,000 1,200,000 1,300,000 1,400,000 1,400,000 1,500,000 1,600,000 0 0 0 10,650,000------------------- ------------------- ------------------- ------------------- ------------------- ------------------- ------------------- ------------------- ------------------- ------------------- ------------------- ------------------- --------------------
450,000 850,000 1,400,000 1,200,000 1,300,000 1,400,000 1,400,000 1,500,000 1,600,000 0 0 0 10,650,000------------------- ------------------- ------------------- ------------------- ------------------- ------------------- ------------------- ------------------- ------------------- ------------------- ------------------- ------------------- --------------------
3,636,222 3,861,186 4,480,325 4,344,241 4,509,785 4,692,161 4,761,213 4,931,027 5,102,127 3,574,540 3,648,293 3,723,449 47,628,348
248
Financial Plans - Internal Services and
Other Funds

Internal Service FundsThe City utilizes internal service funds to account for the financing
of goods and services provided by one department or agency to other departments or agencies of the City. There are three such funds that operate on a cost reimbursement basis: the General Services Fund, the Employee Benefits and Insurance Fund, and the Liability and Property Insurance Fund. These funds play an important role in the overall ability of the City to conduct business. The General Services Fund includes the City’s Fleet Services, Facilities Management Services, Technology and Communication Services, Sunnyvale Office Center, and Project Management Services. The Employee Benefits Fund serves to capture the costs associated with employer provided benefits including pension costs, employee insurance plans, workers’ compensation, and paid leave time. The Property and Liability Insurance Fund accounts for the costs related to the City’s liability and property insurance.
Sunnyvale’s full cost accounting methodology results in all the costs of these funds being charged back to user activities on a rental rate basis for general services, an additive rate basis for employee benefits, and a usage basis for liability and property insurance. Therefore, the total expenditures of these funds are not added to the overall budget, as they are already captured within the City’s programs and funds.
The three other funds presented in this section include the Dorolou P. Swirsky Youth Opportunity Fund, the Fremont Pool Endowment (Trust) Fund, and the Community Facilities District No. 3 Fund. While these funds are not internal service funds, they are grouped with the internal service funds just for presentation purposes in the budget document. These are funds that separately account for assets that the City holds in a trust or are used to benefit a specified purpose. It should be noted that the Redevelopment Successor Agency Obligations, previously reported in this section, is now discussed in the Budget and Fiscal Policies Section of this document.
General Services FundFleet, Facilities, and Technology Services
The combined General Services Fund financial plan has three sub-funds that provide a wide range of important support services to programs within the City. The sub-funds are: Fleet Services, Facilities Management, and Technology Services. Funding for these services is provided through internal service charges to benefiting program operating budgets. Internal service charges include not only the cost of operations, but are also set to recover the cost of replacement for depreciable equipment. This assures the availability of funds to replace equipment at the most cost-effective time.
Aggregate internal service charge increases for the combined General Services Fund activities in FY 2017/18 are 11.5%, which is up 10.3% from what had been projected for FY 2017/18 during last year’s budget cycle. For the remainder of the front ten years of the plan, the average annual increase is 3.4%, which is up from the 3.2% average increase in the prior budget. These increases are primarily due to Information Technology investments. The City’s Enterprise Resource Management System, previously budgeted in the General Fund, is now accounted for in in the General Services Fund. In the final ten years of the long-term plan charges are scheduled to increase 2.2% annually which is a decrease of 0.9% from the prior year. A more detailed narrative on the changes is provided in the sections below that cover the individual sub-funds.
Fleet Services Sub-Fund
The Fleet Services Program reflects the cost of ownership of City vehicles and equipment. The main source of funding within this sub-fund is internal service charge revenue for Fleet Services provided to other programs, which is primarily based on specific vehicle usage. Fleet Services charges are scheduled to increase by 5.0% for FY 2017/18, equal with prior year budget estimates for FY 2017/18 and a projected average annual increase of 3.2% for the remainder of the first ten years in the long-term plan, a slight increase from prior year budget
City of Sunnyvale FY 2017/18 Internal Services and Other Funds
249

estimates of 2.9%. Increases in the second ten years are set at 4.0% annually, increased from the 3.0% set in the same period in the prior year budget.
The Sale of Property line item of the Financial Plan represents the sale of surplus or replaced vehicles or pieces of equipment. The projection for FY 2017/18 and out-years are based on historical averages for the surplus sales of vehicles and equipment.
The Intrafund Loan Repayment line item represents scheduled payments from the Facilities Services Sub-Fund. This loan was initially made in FY 1999/00 to alleviate cash flow issues experienced by the Facilities Services Sub-Fund. The initial terms of the loan were for a principal amount of $1.6 million to be repaid over ten years with final payment scheduled for FY 2015/16. In FY 2005/06, a large payment was made against the principal. Payments were then deferred several years due to insufficient reserves in the Facilities Services Sub-Fund. The current schedule restarted repayments in FY 2012/13 and concludes with the final payment scheduled in FY 2016/17.
The Transfer In from the General Fund in FY 2016/17 accounts for a portion of the capital project, Upgrading of the Fuel Stations. The Transfer In from the Water Fund is to pay for the acquisition of one new full service/crew truck for Water division, to be utilized for the installation, maintenance, and repair of water distribution and transmission pipelines. As an addition to the fleet, this truck is funded via fund transfers. The ongoing maintenance and eventual replacement of the truck will also be funded by the Water program via internal service charges in the operating budget.
The two major current requirements deal with equipment replacement and operation of the Fleet Services program. The Equipment Replacement line item fluctuates each year, as various items of equipment reach the end of their useful life and must be replaced. Overall equipment replacement expenditures are up approximately $3.4 million in the first ten years of the twenty-year plan in comparison to the prior twenty-year plan. This is predominantly the result of updating fleet vehicle cost assumptions based on current bids experienced during recent procurements.
Operations expenditures in FY 2017/18 are approximately $180,000 higher than the amount planned in the FY 2016/17 Adopted Budget, due to increased salaries and benefits, and fuel costs.
The Fleet Services Reserve (formerly Equipment Reserve) represents the accumulation of annual revenue received from City programs, net of replacements purchased during the current fiscal year, for future replacement of vehicles and equipment. This reserve works in tandem with the Equipment Replacement line item under the Current Requirements section of the Sub- Fund. For example, when a large-value item is scheduled to be replaced such as a street sweeper or a fire apparatus, the equipment replacement reserve will be drawn down as funds are used to purchase the vehicle or apparatus. In this manner, operating programs do not experience large swings in expenditures due to fleet replacement.
Facilities Management Services Sub-Fund
The Facilities Management Program reflects the cost of maintaining City facilities, including costs for janitorial service, building maintenance, utilities, carpets and blinds, modular furniture, and building equipment.
The Facilities Management Sub-Fund has two internal service charge revenue items, one relating to space and the other relating to equipment. Spacecharges are based upon the total square footage of building space throughout the City. This square footage is then divided amongst the various City programs, and operating charges are allocated out based on a program’s proportion of the total square footage. The equipment charge accounts for replacement costs associated with modular furniture, carpet and blinds, and building maintenance equipment.
The aggregate charges for Facilities Management are to remain flat for FY 2017/18, with annual charges increasing to 3.4% through FY 2023/24 before returning to an average of increase of 2.8% for the remaining years of the plan. This compares to a 2.8% average over the twenty-year plan in the FY 2016/17 Adopted Budget. While there is uncertainty on a plan for rehabilitation or replacement of the City’s large administrative facilities, limited funds have been expended on these facilities. This is not a realistic long-term plan and, therefore, increases have been set at a moderate level. The City has begun work on a project to address the aging Civic Center. However, as of the adoption of this budget, the project has not yet resulted in a plan for the Civic Center. Until plans are determined, the financial plan will reflect only the existing planned requirements. Over the twenty years, a total of $10.4 million in additional facility internal service charge collections
City of Sunnyvale FY 2017/18 Internal Services and Other Funds
250
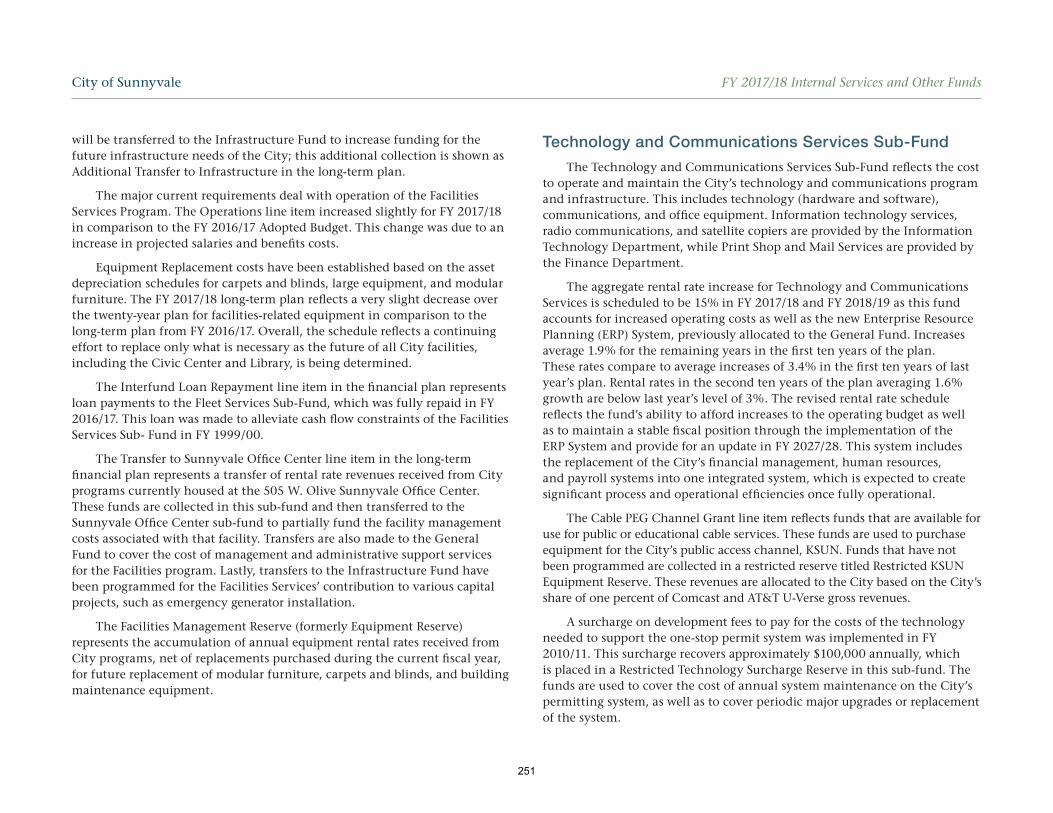
will be transferred to the Infrastructure Fund to increase funding for the future infrastructure needs of the City; this additional collection is shown as Additional Transfer to Infrastructure in the long-term plan.
The major current requirements deal with operation of the Facilities Services Program. The Operations line item increased slightly for FY 2017/18 in comparison to the FY 2016/17 Adopted Budget. This change was due to an increase in projected salaries and benefits costs.
Equipment Replacement costs have been established based on the asset depreciation schedules for carpets and blinds, large equipment, and modular furniture. The FY 2017/18 long-term plan reflects a very slight decrease over the twenty-year plan for facilities-related equipment in comparison to the long-term plan from FY 2016/17. Overall, the schedule reflects a continuing effort to replace only what is necessary as the future of all City facilities, including the Civic Center and Library, is being determined.
The Interfund Loan Repayment line item in the financial plan represents loan payments to the Fleet Services Sub-Fund, which was fully repaid in FY 2016/17. This loan was made to alleviate cash flow constraints of the Facilities Services Sub- Fund in FY 1999/00.
The Transfer to Sunnyvale Office Center line item in the long-term financial plan represents a transfer of rental rate revenues received from City programs currently housed at the 505 W. Olive Sunnyvale Office Center. These funds are collected in this sub-fund and then transferred to the Sunnyvale Office Center sub-fund to partially fund the facility management costs associated with that facility. Transfers are also made to the General Fund to cover the cost of management and administrative support services for the Facilities program. Lastly, transfers to the Infrastructure Fund have been programmed for the Facilities Services’ contribution to various capital projects, such as emergency generator installation.
The Facilities Management Reserve (formerly Equipment Reserve) represents the accumulation of annual equipment rental rates received from City programs, net of replacements purchased during the current fiscal year, for future replacement of modular furniture, carpets and blinds, and building maintenance equipment.
Technology and Communications Services Sub-Fund
The Technology and Communications Services Sub-Fund reflects the cost to operate and maintain the City’s technology and communications program and infrastructure. This includes technology (hardware and software), communications, and office equipment. Information technology services, radio communications, and satellite copiers are provided by the Information Technology Department, while Print Shop and Mail Services are provided by the Finance Department.
The aggregate rental rate increase for Technology and Communications Services is scheduled to be 15% in FY 2017/18 and FY 2018/19 as this fund accounts for increased operating costs as well as the new Enterprise Resource Planning (ERP) System, previously allocated to the General Fund. Increases average 1.9% for the remaining years in the first ten years of the plan. These rates compare to average increases of 3.4% in the first ten years of last year’s plan. Rental rates in the second ten years of the plan averaging 1.6% growth are below last year’s level of 3%. The revised rental rate schedule reflects the fund’s ability to afford increases to the operating budget as well as to maintain a stable fiscal position through the implementation of the ERP System and provide for an update in FY 2027/28. This system includes the replacement of the City’s financial management, human resources, and payroll systems into one integrated system, which is expected to create significant process and operational efficiencies once fully operational.
The Cable PEG Channel Grant line item reflects funds that are available for use for public or educational cable services. These funds are used to purchase equipment for the City’s public access channel, KSUN. Funds that have not been programmed are collected in a restricted reserve titled Restricted KSUN Equipment Reserve. These revenues are allocated to the City based on the City’s share of one percent of Comcast and AT&T U-Verse gross revenues.
A surcharge on development fees to pay for the costs of the technology needed to support the one-stop permit system was implemented in FY 2010/11. This surcharge recovers approximately $100,000 annually, which is placed in a Restricted Technology Surcharge Reserve in this sub-fund. The funds are used to cover the cost of annual system maintenance on the City’s permitting system, as well as to cover periodic major upgrades or replacement of the system.
City of Sunnyvale FY 2017/18 Internal Services and Other Funds
251

The Transfer from the General Fund line item represents the General Fund support to cover the costs of the City’s participation in the Silicon Valley Regional Interoperability Authority (SVRIA) and ERP System Replacement project. The Transfer from the Development Enterprise Fund shows the funding provided for the Permitting System Replacement project.
The major current requirements of the Technology and Communications Services Sub-Fund deal with equipment replacement and operation of the programs in the Information Technology Department and the Office of the City Manager. Equipment replacement for technology, communications, and office assets reflect the equipment replacement schedules for each type of equipment, and equipment replacement costs will fluctuate year-over- year based on the useful lives of the individual pieces of equipment on the replacement schedules. Overall, equipment replacement costs over the twenty-year plan are up $15.8 million in comparison to last year’s long-term plan due to updated cost assumptions for future replacements and the inclusion of the ERP System.
Total operating costs for the Technology and Communications programs are up 9.1% in the FY 2017/18 long-term plan in comparison to the prior long-term plan. This is predominantly the result of adding of four additional positions (1.0 Help Desk Technician, 1.0 Principal Network Engineer, 1.0 Network Engineer and 1.0 Network Engineer Limited-Term) to provide enhanced technology resources needed to deliver the additional technology projects planned over the next few years. It is anticipated that once the technology projects have been significantly delivered, a re-evaluation of IT staffing would be made to determine if efficiencies from the new ERP and other technology investments could be realized.
The Technology and Communications Reserve (formerly Equipment Reserve) represents the accumulation of annual internal service charges received from City programs, net of replacements purchased during the current fiscal year, for future replacement and maintenance of network infrastructure, central and desktop computers, communication equipment, software applications, office equipment, and mail and print shop equipment.
The Restricted KSUN Equipment Reserve reflects PEG Grant revenues that have been collected but not appropriated for specific expenditures. PEG Grant funds can only be utilized for the purchase of KSUN equipment.
The Restricted Tech Surcharge Reserve reflects funds collected from the Technology Surcharge that is added to development. Funds are collected in this reserve to cover the cost of ongoing maintenance and replacement of the permit system.
Sunnyvale Office Center Sub-Fund
This sub-fund accounts for the activities of the Sunnyvale Office Center located at 505 W. Olive Avenue, across from the main City Hall. The Sunnyvale Office Center was purchased in April 2001 by the issuance of variable rate Certificates of Participation (COPs) to provide expansion opportunities for the Civic Center Complex. Activities included in this fund are maintenance and operations of the office facility, infrastructure projects, and debt service. Revenues to this sub-fund consist of rental from outside tenants and City operations, and interest on reserves.
When the sub-fund was established, it was projected that the existing office buildings would be operated and leased through FY 2005/06, when a long-term solution to the City’s office space problem would be in place. Subsequently, plans for a new civic center complex were put on hold because of the City’s financial situation. Currently, options for the development and implementation of a long-term solution to the City’s office space issues are continuing to be explored. As such, the FY 2017/18 long-term financial plan continues to reflect the complex being operated for the entire twenty-year planning period. Increasing the length of operation causes the office complex to generate more net income than originally anticipated, and this allows the Sunnyvale Office Center Fund to offset debt service costs and contribute to the Capital Projects Reserve starting in FY 2031/32 when the debt service is paid off.
The age and general condition of the office buildings, coupled with the extended life of the building due to the delay in the Civic Center Complex planning, has required some infrastructure improvements be programmed over the twenty-year planning period. While the Civic Center Complex planning is underway, these projects are necessary in order to keep the facility in working order in the interim.
City of Sunnyvale FY 2017/18 Internal Services and Other Funds
252

The interest paid on our COPs is variable and based on market conditions, but since their issuance has averaged 3% annually. More recently, interest rates have been extremely low, resulting in lower than projected debt service payments. The assumption for the remainder of FY 2016/17 is that interest rates will increase but remain low at 0.75%, increasing to 1.25% in FY 2017/18. For future years, incremental 0.5% increases are projected until returning to 3% in FY 2021/22 and remaining at that level until the debt is paid off. The remaining principal amount is $12.8 million as of the end of FY 2015/16, with the balance scheduled to be fully repaid by 2031.
This Sunnyvale Office Center Sub-Fund has two reserves. The first is the required Debt Service Reserve, which maintains a balance of approximately $1.1 million. The second reserve is the Capital Projects Reserve. This reserve was funded by an $11 million transfer of surplus revenues from the General Fund in 2002. These funds were originally to be used to purchase the Office Center before the City decided to finance the purchase. The purpose of this reserve is to generate interest to offset debt service, as well as to fund ongoing capital improvements. The Capital Projects reserve balance at the end of FY 2017/18 is projected to be $9.1 million. When the debt service payments end in 2031, the reserve is projected to be approximately $7.9 million.
Project Management Sub-Fund
The Project Management Sub-Fund represents project management services provided by staff within the Department of Public Works Capital Project Management Program. These services are associated with the various capital and infrastructure projects currently incorporated within the City’s projects budget. The transfers into this fund represent a fund’s proportionate share based on the current schedule of projects budgeted for a given year in that fund.
The Capital Project Management Program is responsible for administrative oversight efforts on all City projects that involve the development and management of construction contracts. Budgeting for project management administration is based upon the timing of projects by funding source over the twenty-year long-term plan. Major projects, such as the reconstruction of the Water Pollution Control Plant, and larger, grant- funded projects are excluded because program staff charge their time directly to these projects, which allows staff to take advantage of eligible grant reimbursement opportunities for project administration charges.
Operations for the Project Administration Sub-Fund are budgeted to increase 7.8% in FY 2017/18. The Program has added positions for the past five years to help address the backlog of projects that require the services of the capital project administration group. One Senior Management Analyst position was added to the FY 2017/18 Public Works budget, and approximately 25% of this position is allocated to this fund. The remainder of the position is budgeted in the Development Enterprise and General Funds.
Employee Benefits and Insurance FundThe Employee Benefits and Insurance Fund provides a mechanism
to cover expenditures related to pension costs, insurance plans, workers’ compensation costs, and leave time while applying the principles of full-cost accounting. This is accomplished by charging a rate to staff salaries wherever personnel hours are budgeted and expended. To better track and analyze expenditures, the Fund is separated into four sub-funds: Leaves, Retirement Benefits, Workers’ Compensation, and Insurance and Other Benefits.
In general, the rate charged to cover the costs of employee benefits is calculated by determining the amount of the benefit to be accrued, and dividing that amount into total budgeted salaries. Depending on total hours worked over the course of the fiscal year, the Employee Benefits Fund may over-collect in some years and under-collect in other years in comparison to budgeted amounts. Annual rate adjustments take this into account, and reserves in this Fund are set to factor in year-over-year fluctuations. The overall rate for both Miscellaneous (non-sworn) and Safety employees is higher than the current budget. This is primarily due to an increase in the long-term retirement employer contribution rates, which is discussed in further detail below.
Leaves Benefits
The Leaves program accounts for all City employees’ leave time, including accrual of leave benefits earned but not taken. This method of accruing for leave benefits as they are earned and recognizing the liability up- front is fiscally prudent, as it provides the City with adequate funding to pay off significant earned leave amounts at employee separations and eliminates the long term liability that many jurisdictions carry on their financial statements.
City of Sunnyvale FY 2017/18 Internal Services and Other Funds
253

The FY 2017/18 budget and twenty-year financial plan now incorporates a comprehensive Paid Time Off (PTO) leave bank to the Public Safety Officers Association, which replaces the previous structure of various leave categories and conforms to all other bargaining units. Other adjustments included bringing the salary base for leaves current and updating the anticipated leaves based on actual experience. No other significant changes were made to Leaves.
Retirement Benefits
Retirement Benefits consist of the costs for the City’s retirement plans. By City Charter, Sunnyvale has contracted with the California Public Employees Retirement System (CalPERS) to provide retirement benefits for its employees. With the California Public Employees’ Pension Reform Act of 2013 (PEPRA), effective January 1, 2013, the City now has three pension tiers for Miscellaneous and Safety employees. The first tier consists of existing employees who were employed with the City prior to December 23, 2012. These employees remain on the Miscellaneous 2.7% @ 55 plan, or the Safety 3% @ 50 plan. The second tier consists of new employees that are existing CalPERS members who were hired after December 23, 2012 (Miscellaneous) and July 1, 2012 (Safety). These employees are on the Miscellaneous 2% @ 60 plan, or the Safety 3% @ 55 plan. Finally, the third tier consists of new members to CalPERS as of January 1, 2013. These employees are on the Miscellaneous 2% @ 62 plan, or the Safety 2% @ 50 plan.
The cost to fund the CalPERS retirement benefit is broken down into two contributions, the employer contribution and the employee contribution. For current Miscellaneous and Safety employees (tiers one and two), the employee contribution rate is set by law: 8% of pay for the Miscellaneous 2.7% @ 55 plan, 7% for the Miscellaneous 2% @ 60 plan, and 9% for the Safety 3% at 50 and 3% @ 55 plans. For many years, the City has paid the employee contribution but employees have begun to pick up a part of their contribution in the last several years. The FY 2017/18 Budget plans to hold the City’s contribution for the tiers one and two employee share at 4% (Miscellaneous) and 8.25% (Safety) of pay. New contract for Sunnyvale Employees’ Association expires on June 30, 2019. Service Employees International Union, Local 521’s contract, expires on June 30, 2021. The contract for the Communication Officers Association expires December 31,
2017. The remaining three bargaining group contracts are settled beyond FY 2017/18. Beginning on January 1, 2018, PEPRA allows a public agency to unilaterally require all members to pay employee contribution of their pension benefits, after bargaining in good faith and impasse procedures have completed. While the employee contribution rate can be increased up to 8% for miscellaneous members and 12% for Safety members, these contributions would be subject to meet and confer discussions with the City’s labor groups. Tier three employees, under PEPRA, must pay half their normal cost at the end of any existing contracts, or by January 1, 2018.
While the employee contribution rate is set by law, the employer contribution rate is adjusted annually by CalPERS through an actuarial analysis which considers demographic information and investment earnings. Total employer contribution rates are applied against employee salaries (PERSable earnings) in order to calculate the dollar amounts the City must contribute. It should be noted, starting in FY 2017/18, the required contribution for the unfunded actuarial liability is paid in a fixed dollar amount to CalPERS. For purposes of discussion, the fixed dollar amount is converted to a contribution rate that is applied to salaries.
Over the past decade, employer contribution rates have increased significantly, predominantly due to the significant market losses experienced in the early 2000s and in FY 2008/09. Other factors contributing to the sharp increase in contribution rates have been enhanced pension benefits for employees, applied retroactively, and changes in actuarial experience (i.e. employees retiring earlier at higher salaries and living longer in retirement). In March 2012, CalPERS lowered the long-term rate of return from 7.75% to 7.5%. Prior to FY 2014/15, CalPERS’ actuarial methodology phased in investment gains and losses over a rolling thirty-year period, that did not pay off the unfunded liability. As such, the City worked with our consulting actuary to minimize rate volatility and pay down our unfunded liability over a fixed period. From FY 2011/12 through FY 2013/14, the City paid CalPERS more than the required contribution with rates developed with the City’s consulting actuary. For FY 2013/14, staff requested a “fresh start” with CalPERS that took all the unfunded liability to date and amortized it over a fixed number of years. For the City’s Miscellaneous Plan it was 18 years and for the Safety Plan it was 28 years.
City of Sunnyvale FY 2017/18 Internal Services and Other Funds
254
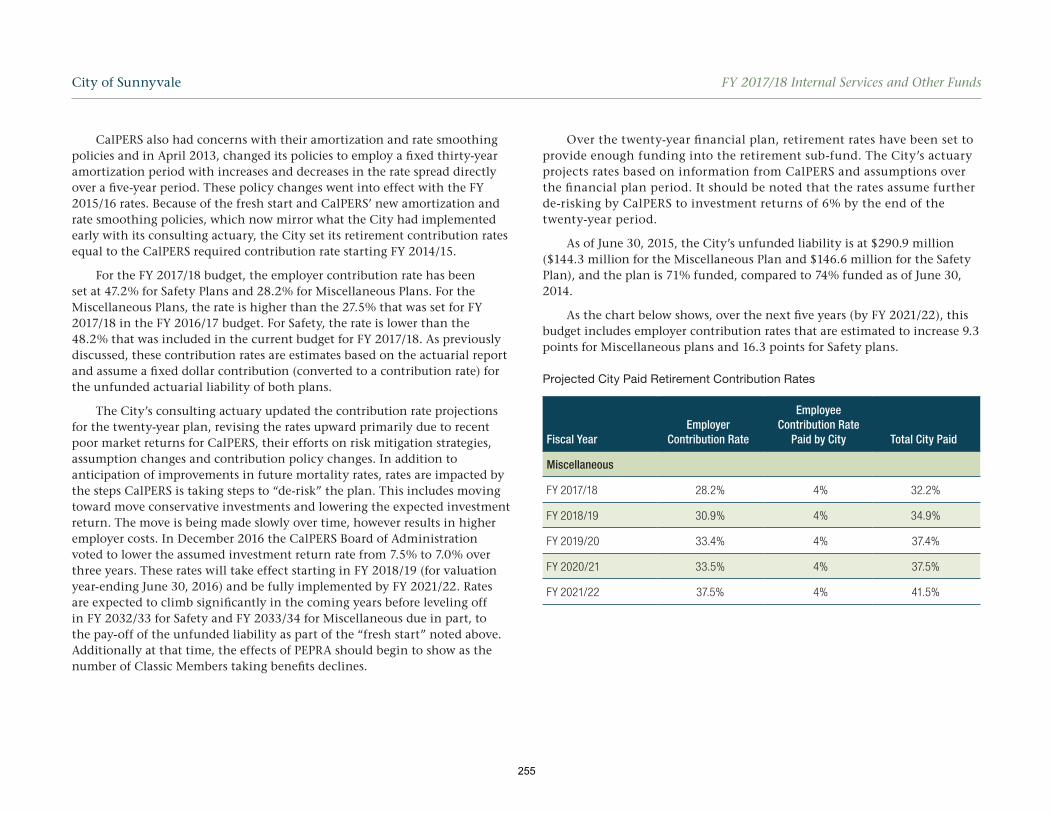
CalPERS also had concerns with their amortization and rate smoothing policies and in April 2013, changed its policies to employ a fixed thirty-year amortization period with increases and decreases in the rate spread directly over a five-year period. These policy changes went into effect with the FY 2015/16 rates. Because of the fresh start and CalPERS’ new amortization and rate smoothing policies, which now mirror what the City had implemented early with its consulting actuary, the City set its retirement contribution rates equal to the CalPERS required contribution rate starting FY 2014/15.
For the FY 2017/18 budget, the employer contribution rate has been set at 47.2% for Safety Plans and 28.2% for Miscellaneous Plans. For the Miscellaneous Plans, the rate is higher than the 27.5% that was set for FY 2017/18 in the FY 2016/17 budget. For Safety, the rate is lower than the 48.2% that was included in the current budget for FY 2017/18. As previously discussed, these contribution rates are estimates based on the actuarial report and assume a fixed dollar contribution (converted to a contribution rate) for the unfunded actuarial liability of both plans.
The City’s consulting actuary updated the contribution rate projections for the twenty-year plan, revising the rates upward primarily due to recent poor market returns for CalPERS, their efforts on risk mitigation strategies, assumption changes and contribution policy changes. In addition to anticipation of improvements in future mortality rates, rates are impacted by the steps CalPERS is taking steps to “de-risk” the plan. This includes moving toward move conservative investments and lowering the expected investment return. The move is being made slowly over time, however results in higher employer costs. In December 2016 the CalPERS Board of Administration voted to lower the assumed investment return rate from 7.5% to 7.0% over three years. These rates will take effect starting in FY 2018/19 (for valuation year-ending June 30, 2016) and be fully implemented by FY 2021/22. Rates are expected to climb significantly in the coming years before leveling off in FY 2032/33 for Safety and FY 2033/34 for Miscellaneous due in part, to the pay-off of the unfunded liability as part of the “fresh start” noted above. Additionally at that time, the effects of PEPRA should begin to show as the number of Classic Members taking benefits declines.
Over the twenty-year financial plan, retirement rates have been set to provide enough funding into the retirement sub-fund. The City’s actuary projects rates based on information from CalPERS and assumptions over the financial plan period. It should be noted that the rates assume further de-risking by CalPERS to investment returns of 6% by the end of the twenty-year period.
As of June 30, 2015, the City’s unfunded liability is at $290.9 million ($144.3 million for the Miscellaneous Plan and $146.6 million for the Safety Plan), and the plan is 71% funded, compared to 74% funded as of June 30, 2014.
As the chart below shows, over the next five years (by FY 2021/22), this budget includes employer contribution rates that are estimated to increase 9.3 points for Miscellaneous plans and 16.3 points for Safety plans.
Projected City Paid Retirement Contribution Rates
Fiscal YearEmployer
Contribution Rate
Employee Contribution Rate
Paid by City Total City Paid
Miscellaneous
FY 2017/18 28.2% 4% 32.2%
FY 2018/19 30.9% 4% 34.9%
FY 2019/20 33.4% 4% 37.4%
FY 2020/21 33.5% 4% 37.5%
FY 2021/22 37.5% 4% 41.5%
City of Sunnyvale FY 2017/18 Internal Services and Other Funds
255

Fiscal YearEmployer
Contribution Rate
Employee Contribution Rate
Paid by City Total City Paid
Safety
FY 2017/18 47.2% 8.25% 55.45%
FY 2018/19 51.9% 8.25% 60.15%
FY 2019/20 56.3% 8.25% 64.55%
FY 2020/21 60.0% 8.25% 68.25%
FY 2021/22 63.5% 8.25% 71.75%
The PERS Rate Uncertainty Reserve is budgeted to end with $3.3 million over the twenty-year plan to mitigate for any further unanticipated increases to the contribution rates. While these are one-time funds that are gone once drawn down, they do allow large rate increases to be smoothed in over several years, which helps maintain stable operating costs.
Workers’ Compensation
Workers’ Compensation benefits are funded through the use of a rate that is applied to all staff salaries. This rate is based upon actual usage of the City’s Workers’ Compensation program. For this reason, the City charges a variable rate depending upon the classification of the employee. Job classifications that perform higher risk work, such as a Public Safety Officer, carry a higher rate than administrative employees based on a projected fair share of these costs.
For FY 2017/18, projections have increased in response to rising number of claims during FY 2016/17 when compared to a lower levels of leaves and claims made in prior years.
The cost per claim has risen due to rising medical costs and severity of the claims. The FY 2017/18 Adopted Budget project the total cost of claims will be approximately $3.2 million in FY 2017/18. The total budget in FY 2017/18 for claims and workers’ compensation leaves is based upon the City’s
most recent actuarial analysis. Going forward, the long-term plan reflects a 2.5% annual increase in the cost of claims.
Workers’ compensation leave costs are projected throughout the long- term financial plan based on historical actual usage. Leave hours have fluctuated historically and underscore the importance of managing these leaves closely to minimize time off and ensure timely resolution of issues. The expense related to leave hours increases with projected salary increases, weighted by employee group, throughout the twenty-year plan.
Because Workers’ Compensation Insurance is based on total salary, the costs for this expense over the long-term increase in accordance with the assumed increase in salaries throughout the planning period. The cost of claims administration, which is performed by a third-party administrator, is assumed to go up approximately 3% annually based on the contract. Due to the continuing trend of increasing average claim costs, FY 2017/18 reserve requirements have increased from FY 2016/17 level at approximately $14.1 million. The Worker’s Compensation reserve requirement is based on the most recent actuarial analysis. Similar to prior year budgets, this reserve gradually increases to the actuarially determined amount of $17.4 million by FY 2021/22 to avoid a significant increase to rates in any one year. Actuarial valuations of the Workers’ Compensation Program are conducted each year in order to satisfy the City’s financial reporting requirements, and future reserve amounts will be adjusted, as appropriate.
Insurance and Other Benefits
The Insurance and Other Benefits Program includes costs for all the employee insurance plans including medical, dental, vision and life insurance. As with the other employee benefits programs, costs for their administration are contained in a Human Resources program in the General Fund and supported by indirect general administration overhead charges to the other funds.
The largest cost in this program is medical insurance for City employees, which is provided by CalPERS. While insurance rate increases averaged 7% in the past five years, actual City costs have risen less due to fluctuating number of enrollees. Projected medical premium increases are, 2.7% in FY 2017/18, based on estimated enrollment using historical turnover data, 6.5% in FY
City of Sunnyvale FY 2017/18 Internal Services and Other Funds
256

2018/19, and decrease by 0.5% each year until it reaches 5% in FY 2021/22; increases are flat at 5% for the remainder of the twenty-year plan starting FY 2021/22.
FY 2017/18 retiree medical insurance premiums budgeted expenditures total $6 million. For the twenty-year plan, retiree medical premiums projection has been revised downward by approximately $26 million over the twenty-year plan in the FY 2017/18 budget compared to the FY 2016/17 budget, using the actuarial valuation calculated based on employee data as of June 30, 2016. Steps have been taken to contain medical costs for both active and retired employees. Caps on City contributions were placed on both active and retired management employees beginning in FY 2007/08, and a 5% cap on increases to medical premiums is in effect for Sunnyvale Employees Association (SEA) retirees.
This latest actuarial valuation for the City’s retiree medical costs, also referred to as “other post-employment benefits” (OPEB), reflected total unfunded liability, including implied subsidy, of $85.7 million, which is a decrease of $6.6 million over the current unfunded liability of $92.3 million (valued using June 30, 2014 data).
CalPERS charges the same premium for pre-Medicare retirees and actives, younger employees, who utilize less medical services on average, are essentially subsidizing older employees who, on average, have higher medical expenditures. This amount of subsidy is referred to as the “implied subsidy.” The Governmental Accounting Standards Board (GASB) requires cities to recognize implied subsidy as a retiree medical cost on the financial statements starting FY 2016/17 (GASBE 45, which will be replaced by GASB 75 effective June 15, 2017). We are recognizing the implied subsidy in this latest OPEB valuation. To address the growing long-term medical costs seen in our actuarial valuations for our retiree medical liability and to pay down our unfunded liability, the City began funding a retiree medical trust fund in FY 2010/11 with an initial $32.6 million contribution. At the end of FY 2015/16, the City will have contributed a total of $55.3 million to the trust, with an additional $57.1 million budgeted for contributions through the twenty-year plan. The FY 2017/18 budget maintains the current annual contributions to the OPEB trust. As of March 2017, the trust has a market value of $79.5 million.
By contributing to a retiree medical trust fund, the City will derive many benefits, including the reduction of future employer OPEB costs, as the earnings generated from trust fund investments will eventually be utilized to offset ongoing costs for the retiree medical insurance. Additionally, it will prevent OPEB obligations from being a significant liability on our balance sheets. It is also fiscally prudent in the City’s current aging demographic situation, where the number of retirees is almost the same as the number of active employees. Projected contributions to the OPEB Trust are calculated by the City’s actuary; these transfers are projected to increase $35.3 million over the twenty-year plan when compared to the plan included in the FY 2016/17 Adopted Budget. These transfers, combined with the projected contributions for retiree medical benefits are expected to be 95% funded by the end of the twenty-year financial plan.
There is also an Insurance Rate Uncertainty Reserve that provides funds for several uncertainties, including unanticipated changes in premium costs and adjustments to the City’s contribution costs. This assists in stabilizing rates charged over the long term plan.
Liability and Property Insurance Fund
This fund was established to separate liability and property insurance costs from the Employee Benefits and Insurance Fund. Managing these costs in a separate fund provides better accountability of expenditures and allows the City to recover costs based on usage rather than on salary expenditures.
The Liability and Property Insurance Fund is funded through direct transfers from its dependent funds rather than on a rate charged to salaries. The transfers are based on liability claims experience in recent years for liability costs and City property valuations for property insurance related costs. The property valuations have been updated to reflect the latest actuarial valuation, which was used to determine the premium for the FY 2015/16 policy year. Insurance coverage is applied to the maintenance of the City’s infrastructure and covers the City against claims such as trip and fall, vehicle damage, and damage caused by City trees. Currently, the City participates in a risk pool administered by the California Joint Powers Risk Management Authority (CJPRMA), which provides insurance over the City’s Self Insured Retention (SIR) level of $500,000 per claim. The total amount paid for liability claims under $500,000 can vary significantly from year-to-year.
City of Sunnyvale FY 2017/18 Internal Services and Other Funds
257

In the FY 2017/18 budget, $320,000 is budgeted for claims litigation; this amount is inflated and budgeted as an ongoing annual legal expense. In addition, a legal contingency is budgeted for $140,000. While actual expenditures on claims litigation in the past five years have averaged $339,200 a year, with the immediate prior two fiscal years around $50,000, there can be significant volatility in any given year. As such, this legal contingency serves to absorb cost overages in any year. This is intended to be a lump sum appropriation used when legal costs exceed the $320,000 annual budget, with the remaining amount to be carried over annually until it is completely expended.
It should be noted that, starting in the FY 2017/18 budget, a liability insurance rebate has been budgeted at $100,000 a year. The City has consistently received this annual rebate in the past, which varies every year depending on the equity balance in the program. CJPRMA’s actuary determines the liabilities and the equity, and determines the amount of “excess equity” to be distributed to members.
The reserve in this fund meets the recommended actuarially acceptable funding level as provided in an actuarial review of the program completed in December 2016.
Community Facilities District No. 3 Fund
In FY 2012/13, a new community facilities district (CFD) was formed. This new CFD (City of Sunnyvale Community Facilities District No. 3, Estates at Sunnyvale) will finance the maintenance and replacement of publicly- owned infrastructure and other improvements planned for in a ten-acre residential subdivision located at 770 Timberpine Avenue.
The developer contribution in FY 2012/13 totaled $49,455. These were appropriated to a new project, Formation of Community Facilities District No. 3 to cover any non-contingent startup costs of forming the CFD, as well as the first six months of the annual operations, maintenance, and servicing costs of the bio-retention basins and associated facilities.
Ongoing annual operating costs of $22,866 are included in the operating budget for FY 2017/18. These are funded by annual assessment revenues, which cover the annual operating cost and provide for replacement costs scheduled in ten, thirty, and sixty year intervals. For the FY 2017/18 twenty-
year plan, the reserves are strategically increased to cover two ten-year infrastructure replacement improvements, the first of which is planned for FY 2022/23 and the second in FY 2032/33.
Fremont Pool Endowment (Trust) Fund
The Fremont Pool Trust Fund was established by the City in FY 2002/03 to account for the receipt of monies raised by The Friends of Fremont Pool, a group of residents who lobbied City Council regarding the need for a new pool in Sunnyvale. The Fund has an Endowment Reserve balance of $1,048,435 as of the fiscal year ending June 30, 2016. The basic premise of this fund is that the corpus, or principal, is never expended, but invested with the interest generated each year used to help offset the City’s cost of operating the 50-meter pool constructed in partnership with the Fremont Union High School District at Fremont High School. The City has contracted with California Sports Center (CSC), which has operated the Fremont Pool under a license agreement since 2002. City staff conducted a competitive Request for Proposals (RFP) to select a provider for pool operations beginning September 2013 and found CSC to be the most qualified operator for continuing pool operations.
The City’s cost is determined by adding 50% of the cost of maintaining the pool itself (performed by the School District, which subsequently bills the City), 100% of the City’s cost of maintaining the public shower/ locker facility, and staff costs related to oversight of the contract. The City’s projected cost for Fremont Pool maintenance for FY 2017/18 is $214,032. Interest earnings on the Fremont Pool Trust Fund are projected to be $13,105 and reflect a rising interest environment from near-zero interest. The Trust earnings pay approximately 6.1% of the City’s annual costs. Revenues from operation of the Fremont Pool are projected to be $56,569 for FY 2016/17 or 26.43% of total cost. The General Fund makes up the difference. In addition to operations and maintenance costs, the City also funds a project for the City’s share of Fremont Pool infrastructure improvements.
It should also be noted that while the corpus of this fund may grow a it in future years (assuming continued contributions), it is not expected to increase markedly over time. As a result, it is not expected to keep up with inflation and the purchasing power of the interest it generates will likely erode over time. In this context, it is critical to note the importance
City of Sunnyvale FY 2017/18 Internal Services and Other Funds
258

of allowing the pool’s operator to charge market rates for use of the pool. It is also important to allow the operator to determine effective revenue- producing programming. The net revenue received by the City and the interest generated by the Fremont Pool Trust Fund are critical factors in allowing the pool to partially support itself financially.
Dorolou P. Swirsky Youth Opportunity Fund
In August 1993, City Council accepted Dorolou Swirsky’s intent to donate her house upon her death to provide an endowment to specifically address sports, recreational, social, cultural, and educational activities for disadvantaged youth living in Sunnyvale.
The Dorolou Swirsky Trust Estate was donated to the City upon her death in March 2000. The estate consisted of a single-family home located at 1133 Hollenbeck Road. Following the donation, the City established the Swirsky
Youth Opportunity Fund to account for the proceeds. Ms. Swirsky had taken a reverse mortgage on the property which the City paid upon her death using General Fund monies. The property was rented out until August 2003 with net proceeds used to help pay back the General Fund for the reverse mortgage.
In November 2003, Council approved a resolution authorizing the sale of 1133 Hollenbeck Road. The house was subsequently sold, the remainder of the General Fund advance was paid, and an endowment of $526,595 was established. The fund has gained interest which, in some years, exceeded the current year requirement resulting in an increased current fund balance of $552,016. For FY 2017/18, the full amount of interest earned from the Swirsky Trust (approximately $6,900) be used toward youth- at-risk programming in the Columbia Neighborhood service area, operated by the Department of Library and Community Services.
City of Sunnyvale FY 2017/18 Internal Services and Other Funds
259

This Page Intentionally Blank
260

RESERVES/FUND BALANCE, JULY 1
CURRENT RESOURCES: Equipment Rental Facilities Rental SUNGIS - Equipment and Maintenance Comcast PEG Channel Grant Sale of Property Miscellaneous Revenues Interest Income Intrafund Loan Repayment Transfer From Other Funds
TOTAL CURRENT RESOURCES
TOTAL AVAILABLE RESOURCES
CURRENT REQUIREMENTS: Equipment Replacement SUNGIS - Equipment and Maintenance Operations Capital Projects Special Projects Project Operating Transfer To SV Office Center Sub-Fund Intrafund Loan Repayment Transfer To Other Funds Additional Transfer To Infrastructure
TOTAL CURRENT REQUIREMENTS
RESERVES: Fleet Services Reserve Facilities Management Reserve Technology and Communications Reserve Restricted KSUN Equipment Reserve Restricted Tech Surcharge Reserve
TOTAL RESERVES
FUND BALANCE, JUNE 30
FY 2017/18 Rental Rate IncreaseFY 2016/17 Rental Rate Increase
FY 2016/2017TO
ACTUAL CURRENT BUDGET PLAN PLAN PLAN PLAN PLAN PLAN PLAN PLAN PLAN FY 2026/20272015/2016 2016/2017 2017/2018 2018/2019 2019/2020 2020/2021 2021/2022 2022/2023 2023/2024 2024/2025 2025/2026 2026/2027 TOTAL
----------------- ----------------- ----------------- ----------------- ----------------- ----------------- ----------------- ----------------- ----------------- ----------------- ----------------- ----------------- -------------------14,521,074 13,561,532 8,300,273 8,332,571 6,693,242 6,702,447 9,147,943 10,496,335 10,572,813 13,251,831 13,650,188 16,795,004 13,561,532
----------------- ----------------- ----------------- ----------------- ----------------- ----------------- ----------------- ----------------- ----------------- ----------------- ----------------- ----------------- -------------------
14,311,871 14,768,174 16,462,557 18,284,311 18,447,846 18,618,018 19,184,287 19,769,339 20,373,736 21,008,864 21,664,142 22,154,827 210,736,1014,756,670 4,946,955 4,956,849 5,115,468 5,289,394 5,479,812 5,666,126 5,858,774 6,057,972 6,209,422 6,364,657 6,555,597 62,501,025
125,733 96,360 98,769 101,238 103,769 106,363 109,022 111,748 114,541 115,100 117,978 121,517 1,196,405249,813 451,622 296,884 302,821 308,878 315,055 321,356 327,784 334,339 341,026 347,847 354,804 3,702,416
33,617 136,691 73,679 75,521 77,409 79,344 81,328 83,361 85,445 87,581 89,771 92,464 962,59448,012 33,511 37,885 30,209 30,209 30,209 30,209 30,209 30,209 30,209 30,209 30,209 343,281
114,565 203,117 72,023 132,776 156,201 272,600 309,802 329,365 391,501 421,968 495,801 561,774 3,346,928500,000 444,292 0 0 0 0 0 0 0 0 0 0 444,292140,720 3,250,482 12,256,627 1,025,000 1,025,000 923,228 0 0 0 0 0 0 18,480,337
----------------- ----------------- ----------------- ----------------- ----------------- ----------------- ----------------- ----------------- ----------------- ----------------- ----------------- ----------------- -------------------20,281,391 24,331,203 34,255,272 25,067,345 25,438,706 25,824,630 25,702,130 26,510,580 27,387,744 28,214,171 29,110,404 29,871,192 301,713,378
----------------- ----------------- ----------------- ----------------- ----------------- ----------------- ----------------- ----------------- ----------------- ----------------- ----------------- ----------------- -------------------34,802,465 37,892,736 42,555,545 33,399,916 32,131,948 32,527,077 34,850,074 37,006,915 37,960,557 41,466,002 42,760,592 46,666,196 315,274,910
----------------- ----------------- ----------------- ----------------- ----------------- ----------------- ----------------- ----------------- ----------------- ----------------- ----------------- ----------------- -------------------
5,523,318 6,556,154 7,541,851 5,315,760 4,550,246 2,664,961 2,610,429 5,573,642 3,356,521 5,784,612 2,800,086 5,020,213 51,774,4741,200 260,000 1,040,000 0 0 0 0 0 0 0 0 0 1,300,000
14,483,497 16,127,339 17,807,518 18,161,521 18,701,223 19,223,165 19,725,083 19,846,178 20,314,111 20,852,769 21,422,734 21,853,217 214,034,8570 360,352 178,500 0 0 108,243 607,244 0 0 117,166 657,301 0 2,028,806
1,950 4,803,214 6,615,819 2,309,903 1,361,336 516,726 494,617 46,388 47,547 48,736 49,955 152,883 16,447,1230 0 20,808 21,224 21,649 22,082 22,523 22,974 23,433 23,902 24,619 25,357 228,571
110,573 110,573 110,794 114,340 118,227 122,483 126,648 130,954 135,406 138,791 142,261 142,955 1,393,432500,000 444,292 0 0 0 0 0 0 0 0 0 0 444,292326,289 602,715 536,776 375,568 330,441 337,049 343,791 350,666 357,679 364,833 372,399 380,122 4,352,039294,106 327,824 370,909 408,359 346,380 384,425 423,403 463,300 474,028 485,004 496,234 507,723 4,687,589
----------------- ----------------- ----------------- ----------------- ----------------- ----------------- ----------------- ----------------- ----------------- ----------------- ----------------- ----------------- -------------------21,240,932 29,592,462 34,222,974 26,706,674 25,429,501 23,379,134 24,353,739 26,434,102 24,708,726 27,815,814 25,965,588 28,082,471 296,691,184
----------------- ----------------- ----------------- ----------------- ----------------- ----------------- ----------------- ----------------- ----------------- ----------------- ----------------- ----------------- -------------------
1,802,611 1,320,558 176,362 643,071 858,535 1,634,359 1,526,644 1,411,755 1,887,357 578,525 663,240 521,714 521,7141,929,670 1,409,051 741,559 552,793 427,977 447,175 511,636 482,979 763,223 882,404 955,503 1,137,785 1,137,7858,408,752 3,665,624 5,116,784 2,798,351 2,312,544 3,555,533 4,777,404 4,561,095 6,038,664 7,625,290 10,163,232 11,514,468 11,514,468
989,654 1,377,834 1,671,891 1,971,814 2,272,410 2,573,532 2,634,286 2,958,871 3,289,931 3,290,755 3,622,398 3,897,609 3,897,609430,845 527,205 625,974 727,212 830,981 937,344 1,046,366 1,158,114 1,272,655 1,273,214 1,390,633 1,512,150 1,512,150
----------------- ----------------- ----------------- ----------------- ----------------- ----------------- ----------------- ----------------- ----------------- ----------------- ----------------- ----------------- -------------------13,561,532 8,300,273 8,332,571 6,693,242 6,702,447 9,147,943 10,496,335 10,572,813 13,251,831 13,650,188 16,795,004 18,583,726 18,583,726
----------------- ----------------- ----------------- ----------------- ----------------- ----------------- ----------------- ----------------- ----------------- ----------------- ----------------- ----------------- -------------------0 0 0 0 0 0 0 0 0 0 0 0 0
========== ========== ========== ========== ========== ========== ========== ========== ========== ========== ========== ========== ===========
11.5% 11.1% 0.9% 0.9% 3.0% 3.0% 3.1% 3.1% 3.1% 2.3%1.2% 3.1% 3.0% 2.9% 3.4% 3.4% 3.4% 3.1% 3.1% 3.2%
FLEET/FACILITIES/TECHNOLOGY AND COMMUNICATIONS595. COMBINED GENERAL SERVICES FUND
JULY 1, 2016 TO JUNE 30, 2027LONG TERM FINANCIAL PLAN
CITY OF SUNNYVALE
261

RESERVES/FUND BALANCE, JULY 1
CURRENT RESOURCES: Equipment Rental Facilities Rental SUNGIS - Equipment and Maintenance Comcast PEG Channel Grant Sale of Property Miscellaneous Revenues Interest Income Intrafund Loan Repayment Transfer From Other Funds
TOTAL CURRENT RESOURCES
TOTAL AVAILABLE RESOURCES
CURRENT REQUIREMENTS: Equipment Replacement SUNGIS - Equipment and Maintenance Operations Capital Projects Special Projects Project Operating Transfer To SV Office Center Sub-Fund Intrafund Loan Repayment Transfer To Other Funds Additional Transfer To Infrastructure
TOTAL CURRENT REQUIREMENTS
RESERVES: Fleet Services Reserve Facilities Management Reserve Technology and Communications Reserve Restricted KSUN Equipment Reserve Restricted Tech Surcharge Reserve
TOTAL RESERVES
FUND BALANCE, JUNE 30
FY 2017/18 Rental Rate IncreaseFY 2016/17 Rental Rate Increase
FY 2027/2028 FY 2016/2017TO TO
PLAN PLAN PLAN PLAN PLAN PLAN PLAN PLAN PLAN PLAN FY 2036/2037 FY 2036/20372027/2028 2028/2029 2029/2030 2030/2031 2031/2032 2032/2033 2033/2034 2034/2035 2035/2036 2036/2037 TOTAL TOTAL
----------------- ----------------- ----------------- ----------------- ----------------- ----------------- ----------------- ----------------- ----------------- ----------------- ------------------- -------------------18,583,726 10,287,250 14,086,928 15,254,956 18,692,653 20,206,817 20,527,446 22,491,244 22,012,736 25,810,524 18,583,726 13,561,532
----------------- ----------------- ----------------- ----------------- ----------------- ----------------- ----------------- ----------------- ----------------- ----------------- ------------------- -------------------
22,731,126 23,206,477 23,695,483 24,198,627 24,716,410 25,249,351 25,797,991 26,362,891 26,944,634 27,543,826 250,446,815 461,182,9166,752,265 6,941,328 7,135,685 7,335,485 7,540,878 7,752,023 7,969,079 8,192,214 8,421,596 8,657,400 76,697,952 139,198,977
125,163 128,917 132,785 136,768 140,872 145,098 149,451 153,934 158,552 163,309 1,434,848 2,631,253361,900 369,138 376,520 384,051 391,732 399,566 407,558 415,709 424,023 432,504 3,962,699 7,665,116
95,238 98,095 101,038 104,069 107,191 110,407 113,719 117,130 120,644 124,264 1,091,794 2,054,38830,209 30,209 30,209 30,209 30,209 30,209 30,209 30,209 30,209 30,209 302,094 645,375
413,532 555,725 616,590 736,992 805,117 834,293 899,237 908,148 1,022,720 1,112,282 7,904,635 11,251,5630 0 0 0 0 0 0 0 0 0 0 444,2920 0 0 0 0 0 0 0 0 0 0 18,480,337
----------------- ----------------- ----------------- ----------------- ----------------- ----------------- ----------------- ----------------- ----------------- ----------------- ------------------- -------------------30,509,432 31,329,889 32,088,311 32,926,201 33,732,408 34,520,947 35,367,244 36,180,235 37,122,378 38,063,793 341,840,838 643,554,216
----------------- ----------------- ----------------- ----------------- ----------------- ----------------- ----------------- ----------------- ----------------- ----------------- ------------------- -------------------49,093,158 41,617,139 46,175,239 48,181,157 52,425,061 54,727,763 55,894,690 58,671,480 59,135,114 63,874,317 360,424,564 657,115,748
----------------- ----------------- ----------------- ----------------- ----------------- ----------------- ----------------- ----------------- ----------------- ----------------- ------------------- -------------------
8,103,172 3,963,687 6,788,307 4,396,310 5,390,046 8,285,807 6,816,371 9,482,141 5,496,131 7,623,635 66,345,607 118,120,0810 0 0 380,651 1,522,604 0 0 0 0 0 1,903,255 3,203,255
21,877,472 22,398,894 22,933,260 23,480,905 24,042,172 24,617,414 25,206,993 25,811,281 26,430,658 27,065,518 243,864,568 457,899,4260 0 0 0 0 0 0 0 0 0 0 2,028,806
7,733,504 54,587 56,224 57,911 59,648 61,438 63,281 65,179 67,135 69,149 8,288,056 24,735,17926,118 26,902 27,709 28,540 29,396 30,278 31,186 32,122 32,122 33,086 297,459 526,030
147,244 151,367 155,605 159,962 164,441 169,045 173,778 178,644 183,646 188,788 1,672,519 3,065,9510 0 0 0 0 0 0 0 0 0 0 444,292
398,921 403,271 415,371 427,830 440,664 453,885 515,906 481,527 494,892 508,658 4,540,924 8,892,963519,478 531,504 543,807 556,395 569,274 582,450 595,931 607,849 620,006 620,006 5,746,700 10,434,289
----------------- ----------------- ----------------- ----------------- ----------------- ----------------- ----------------- ----------------- ----------------- ----------------- ------------------- -------------------38,805,909 27,530,210 30,920,283 29,488,504 32,218,244 34,200,317 33,403,446 36,658,744 33,324,590 36,108,840 332,659,087 629,350,271
----------------- ----------------- ----------------- ----------------- ----------------- ----------------- ----------------- ----------------- ----------------- ----------------- ------------------- -------------------
1,318,977 1,526,135 1,000,672 1,860,616 2,647,773 3,863,122 3,594,231 2,744,917 2,575,556 2,398,079 2,398,079 2,398,0791,382,069 1,171,462 1,158,150 1,444,701 1,860,406 1,999,424 2,462,009 3,084,377 3,765,554 4,522,047 4,522,047 4,522,0471,692,947 5,001,692 6,209,737 8,378,601 10,015,001 8,440,733 9,658,086 8,849,108 11,573,173 12,357,951 12,357,951 12,357,9514,255,943 4,621,408 4,987,382 5,353,603 5,410,236 5,805,669 6,208,969 6,612,452 7,015,805 7,443,657 7,443,657 7,443,6571,637,312 1,766,230 1,899,015 1,655,132 273,400 418,498 567,949 721,883 880,435 1,043,744 1,043,744 1,043,744
----------------- ----------------- ----------------- ----------------- ----------------- ----------------- ----------------- ----------------- ----------------- ----------------- ------------------- -------------------10,287,250 14,086,928 15,254,956 18,692,653 20,206,817 20,527,446 22,491,244 22,012,736 25,810,524 27,765,477 27,765,477 27,765,477
----------------- ----------------- ----------------- ----------------- ----------------- ----------------- ----------------- ----------------- ----------------- ----------------- ------------------- -------------------0 0 0 0 0 0 0 0 0 0 0 0
========== ========== ========== ========== ========== ========== ========== ========== ========== ========== =========== ===========
2.6% 2.1% 2.1% 2.1% 2.1% 2.2% 2.2% 2.2% 2.2% 2.2%3.3% 3.3% 3.3% 3.0% 3.0% 3.0% 3.0% 3.0% 3.0% 0.0%
FLEET/FACILITIES/TECHNOLOGY AND COMMUNICATIONS595. COMBINED GENERAL SERVICES FUND
JULY 1, 2027 TO JUNE 30, 2037LONG TERM FINANCIAL PLAN
CITY OF SUNNYVALE
262
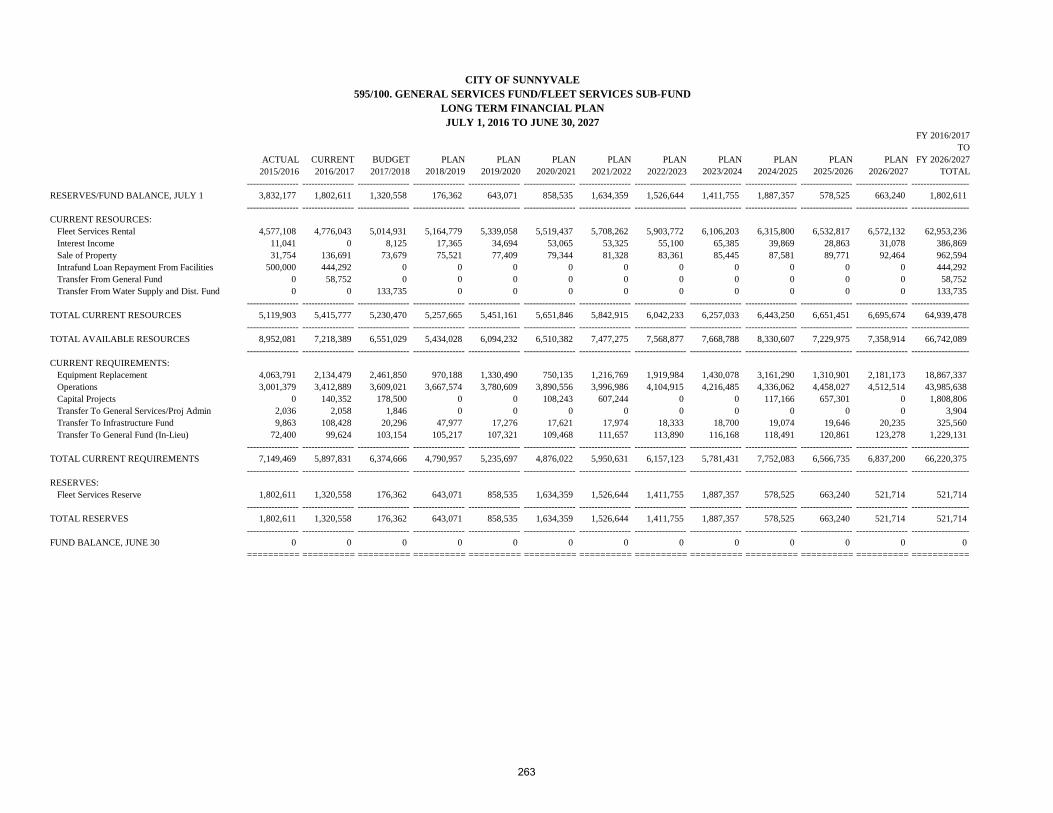
RESERVES/FUND BALANCE, JULY 1
CURRENT RESOURCES: Fleet Services Rental Interest Income Sale of Property Intrafund Loan Repayment From Facilities Transfer From General Fund Transfer From Water Supply and Dist. Fund
TOTAL CURRENT RESOURCES
TOTAL AVAILABLE RESOURCES
CURRENT REQUIREMENTS: Equipment Replacement Operations Capital Projects Transfer To General Services/Proj Admin Transfer To Infrastructure Fund Transfer To General Fund (In-Lieu)
TOTAL CURRENT REQUIREMENTS
RESERVES: Fleet Services Reserve
TOTAL RESERVES
FUND BALANCE, JUNE 30
FY 2016/2017TO
ACTUAL CURRENT BUDGET PLAN PLAN PLAN PLAN PLAN PLAN PLAN PLAN PLAN FY 2026/20272015/2016 2016/2017 2017/2018 2018/2019 2019/2020 2020/2021 2021/2022 2022/2023 2023/2024 2024/2025 2025/2026 2026/2027 TOTAL
----------------- ----------------- ----------------- ----------------- ----------------- ----------------- ----------------- ----------------- ----------------- ----------------- ----------------- ----------------- -------------------3,832,177 1,802,611 1,320,558 176,362 643,071 858,535 1,634,359 1,526,644 1,411,755 1,887,357 578,525 663,240 1,802,611
----------------- ----------------- ----------------- ----------------- ----------------- ----------------- ----------------- ----------------- ----------------- ----------------- ----------------- ----------------- -------------------
4,577,108 4,776,043 5,014,931 5,164,779 5,339,058 5,519,437 5,708,262 5,903,772 6,106,203 6,315,800 6,532,817 6,572,132 62,953,23611,041 0 8,125 17,365 34,694 53,065 53,325 55,100 65,385 39,869 28,863 31,078 386,86931,754 136,691 73,679 75,521 77,409 79,344 81,328 83,361 85,445 87,581 89,771 92,464 962,594
500,000 444,292 0 0 0 0 0 0 0 0 0 0 444,2920 58,752 0 0 0 0 0 0 0 0 0 0 58,7520 0 133,735 0 0 0 0 0 0 0 0 0 133,735
----------------- ----------------- ----------------- ----------------- ----------------- ----------------- ----------------- ----------------- ----------------- ----------------- ----------------- ----------------- -------------------5,119,903 5,415,777 5,230,470 5,257,665 5,451,161 5,651,846 5,842,915 6,042,233 6,257,033 6,443,250 6,651,451 6,695,674 64,939,478
----------------- ----------------- ----------------- ----------------- ----------------- ----------------- ----------------- ----------------- ----------------- ----------------- ----------------- ----------------- -------------------8,952,081 7,218,389 6,551,029 5,434,028 6,094,232 6,510,382 7,477,275 7,568,877 7,668,788 8,330,607 7,229,975 7,358,914 66,742,089
----------------- ----------------- ----------------- ----------------- ----------------- ----------------- ----------------- ----------------- ----------------- ----------------- ----------------- ----------------- -------------------
4,063,791 2,134,479 2,461,850 970,188 1,330,490 750,135 1,216,769 1,919,984 1,430,078 3,161,290 1,310,901 2,181,173 18,867,3373,001,379 3,412,889 3,609,021 3,667,574 3,780,609 3,890,556 3,996,986 4,104,915 4,216,485 4,336,062 4,458,027 4,512,514 43,985,638
0 140,352 178,500 0 0 108,243 607,244 0 0 117,166 657,301 0 1,808,8062,036 2,058 1,846 0 0 0 0 0 0 0 0 0 3,9049,863 108,428 20,296 47,977 17,276 17,621 17,974 18,333 18,700 19,074 19,646 20,235 325,560
72,400 99,624 103,154 105,217 107,321 109,468 111,657 113,890 116,168 118,491 120,861 123,278 1,229,131----------------- ----------------- ----------------- ----------------- ----------------- ----------------- ----------------- ----------------- ----------------- ----------------- ----------------- ----------------- -------------------
7,149,469 5,897,831 6,374,666 4,790,957 5,235,697 4,876,022 5,950,631 6,157,123 5,781,431 7,752,083 6,566,735 6,837,200 66,220,375----------------- ----------------- ----------------- ----------------- ----------------- ----------------- ----------------- ----------------- ----------------- ----------------- ----------------- ----------------- -------------------
1,802,611 1,320,558 176,362 643,071 858,535 1,634,359 1,526,644 1,411,755 1,887,357 578,525 663,240 521,714 521,714----------------- ----------------- ----------------- ----------------- ----------------- ----------------- ----------------- ----------------- ----------------- ----------------- ----------------- ----------------- -------------------
1,802,611 1,320,558 176,362 643,071 858,535 1,634,359 1,526,644 1,411,755 1,887,357 578,525 663,240 521,714 521,714----------------- ----------------- ----------------- ----------------- ----------------- ----------------- ----------------- ----------------- ----------------- ----------------- ----------------- ----------------- -------------------
0 0 0 0 0 0 0 0 0 0 0 0 0========== ========== ========== ========== ========== ========== ========== ========== ========== ========== ========== ========== ===========
JULY 1, 2016 TO JUNE 30, 2027
CITY OF SUNNYVALE
LONG TERM FINANCIAL PLAN595/100. GENERAL SERVICES FUND/FLEET SERVICES SUB-FUND
263

RESERVES/FUND BALANCE, JULY 1
CURRENT RESOURCES: Fleet Services Rental Interest Income Sale of Property Intrafund Loan Repayment From Facilities Transfer From General Fund Transfer From Water Supply and Dist. Fund
TOTAL CURRENT RESOURCES
TOTAL AVAILABLE RESOURCES
CURRENT REQUIREMENTS: Equipment Replacement Operations Capital Projects Transfer To General Services/Proj Admin Transfer To Infrastructure Fund Transfer To General Fund (In-Lieu)
TOTAL CURRENT REQUIREMENTS
RESERVES: Fleet Services Reserve
TOTAL RESERVES
FUND BALANCE, JUNE 30
FY 2027/2028 FY 2016/2017TO TO
PLAN PLAN PLAN PLAN PLAN PLAN PLAN PLAN PLAN PLAN FY 2036/2037 FY 2036/20372027/2028 2028/2029 2029/2030 2030/2031 2031/2032 2032/2033 2033/2034 2034/2035 2035/2036 2036/2037 TOTAL TOTAL
----------------- ----------------- ----------------- ----------------- ----------------- ----------------- ----------------- ----------------- ----------------- ----------------- ------------------- -------------------521,714 1,318,977 1,526,135 1,000,672 1,860,616 2,647,773 3,863,122 3,594,231 2,744,917 2,575,556 521,714 1,802,611
----------------- ----------------- ----------------- ----------------- ----------------- ----------------- ----------------- ----------------- ----------------- ----------------- ------------------- -------------------
6,837,646 7,113,887 7,401,288 7,700,300 8,011,393 8,335,053 8,671,789 9,022,129 9,386,623 9,765,843 82,245,953 145,199,18949,428 80,804 69,197 90,914 124,051 169,045 174,729 149,866 138,953 134,515 1,181,501 1,568,37095,238 98,095 101,038 104,069 107,191 110,407 113,719 117,130 120,644 124,264 1,091,794 2,054,388
0 0 0 0 0 0 0 0 0 0 0 444,2920 0 0 0 0 0 0 0 0 0 0 58,7520 0 0 0 0 0 0 0 0 0 0 133,735
----------------- ----------------- ----------------- ----------------- ----------------- ----------------- ----------------- ----------------- ----------------- ----------------- ------------------- -------------------6,982,312 7,292,786 7,571,523 7,895,283 8,242,635 8,614,505 8,960,237 9,289,126 9,646,220 10,024,621 84,519,248 149,458,725
----------------- ----------------- ----------------- ----------------- ----------------- ----------------- ----------------- ----------------- ----------------- ----------------- ------------------- -------------------7,504,026 8,611,764 9,097,659 8,895,955 10,103,250 11,262,278 12,823,359 12,883,357 12,391,137 12,600,178 85,040,961 151,261,337
----------------- ----------------- ----------------- ----------------- ----------------- ----------------- ----------------- ----------------- ----------------- ----------------- ------------------- -------------------
1,512,168 2,299,047 3,193,825 2,012,641 2,310,205 2,128,196 3,794,856 4,606,429 4,148,803 4,397,121 30,403,291 49,270,6284,525,062 4,634,327 4,746,340 4,861,173 4,978,900 5,099,597 5,223,341 5,350,213 5,480,294 5,613,669 50,512,917 94,498,555
0 0 0 0 0 0 0 0 0 0 0 1,808,8060 0 0 0 0 0 0 0 0 0 0 3,904
20,842 21,468 22,112 22,775 23,458 24,162 59,314 25,633 25,633 25,633 271,030 596,590126,977 130,786 134,709 138,751 142,913 147,201 151,617 156,165 160,850 165,676 1,455,644 2,684,775
----------------- ----------------- ----------------- ----------------- ----------------- ----------------- ----------------- ----------------- ----------------- ----------------- ------------------- -------------------6,185,049 7,085,628 8,096,987 7,035,340 7,455,477 7,399,156 9,229,128 10,138,440 9,815,580 10,202,099 82,642,883 148,863,258
----------------- ----------------- ----------------- ----------------- ----------------- ----------------- ----------------- ----------------- ----------------- ----------------- ------------------- -------------------
1,318,977 1,526,135 1,000,672 1,860,616 2,647,773 3,863,122 3,594,231 2,744,917 2,575,556 2,398,079 2,398,079 2,398,079----------------- ----------------- ----------------- ----------------- ----------------- ----------------- ----------------- ----------------- ----------------- ----------------- ------------------- -------------------
1,318,977 1,526,135 1,000,672 1,860,616 2,647,773 3,863,122 3,594,231 2,744,917 2,575,556 2,398,079 2,398,079 2,398,079----------------- ----------------- ----------------- ----------------- ----------------- ----------------- ----------------- ----------------- ----------------- ----------------- ------------------- -------------------
0 0 0 0 0 0 0 0 0 0 0 0========== ========== ========== ========== ========== ========== ========== ========== ========== ========== =========== ===========
JULY 1, 2027 TO JUNE 30, 2037LONG TERM FINANCIAL PLAN
CITY OF SUNNYVALE595/100. GENERAL SERVICES FUND/FLEET SERVICES SUB-FUND
264

RESERVES/FUND BALANCE, JULY 1
CURRENT RESOURCES:Facilities RentalEquipment RentalInterest IncomeMiscellaneous Revenues
TOTAL CURRENT RESOURCES
TOTAL AVAILABLE RESOURCES
CURRENT REQUIREMENTS:Carpets and BlindsEquipment ReplacementModular FurnitureOperationsIntrafund Loan RepaymentTransfer To SV Office Ctr FundTransfer To General Fund (In-Lieu)Transfer To Project AdministrationTransfer To Infrastructure FundAdditional Transfer To Infrastructure
TOTAL CURRENT REQUIREMENTS
RESERVES:Facilities Management Reserve
TOTAL RESERVES
FUND BALANCE, JUNE 30
FY 2016/2017TO
ACTUAL CURRENT BUDGET PLAN PLAN PLAN PLAN PLAN PLAN PLAN PLAN PLAN FY 2026/20272015/2016 2016/2017 2017/2018 2018/2019 2019/2020 2020/2021 2021/2022 2022/2023 2023/2024 2024/2025 2025/2026 2026/2027 TOTAL
----------------- ----------------- ----------------- ----------------- ----------------- ----------------- ----------------- ----------------- ----------------- ----------------- ----------------- ----------------- ------------------1,718,684 1,929,670 1,409,051 741,559 552,793 427,977 447,175 511,636 482,979 763,223 882,404 955,503 1,929,670
----------------- ----------------- ----------------- ----------------- ----------------- ----------------- ----------------- ----------------- ----------------- ----------------- ----------------- ----------------- ------------------
4,756,670 4,946,955 4,956,849 5,115,468 5,289,394 5,479,812 5,666,126 5,858,774 6,057,972 6,209,422 6,364,657 6,555,597 62,501,025250,622 238,091 226,187 214,877 204,133 193,927 184,230 175,019 166,268 168,762 171,293 173,863 2,116,650
28,556 37,552 10,922 10,817 10,134 14,702 16,357 16,325 22,644 27,367 29,883 35,545 232,248390 0 0 0 0 0 0 0 0 0 0 0 0
----------------- ----------------- ----------------- ----------------- ----------------- ----------------- ----------------- ----------------- ----------------- ----------------- ----------------- ----------------- ------------------5,036,238 5,222,598 5,193,957 5,341,162 5,503,661 5,688,441 5,866,713 6,050,118 6,246,884 6,405,550 6,565,833 6,765,005 64,849,923
----------------- ----------------- ----------------- ----------------- ----------------- ----------------- ----------------- ----------------- ----------------- ----------------- ----------------- ----------------- ------------------6,754,922 7,152,268 6,603,009 6,082,722 6,056,455 6,116,418 6,313,888 6,561,753 6,729,863 7,168,774 7,448,238 7,720,507 66,779,593
----------------- ----------------- ----------------- ----------------- ----------------- ----------------- ----------------- ----------------- ----------------- ----------------- ----------------- ----------------- ------------------
31,275 133,896 210,598 138,130 0 200,003 13,196 85,234 37,133 185,680 85,698 15,228 1,104,7972,688 313,568 361,782 159,180 348,187 22,976 179,028 217,024 11,844 34,977 187,881 306,455 2,142,903
0 0 0 0 0 0 0 0 0 0 0 0 03,798,590 4,244,268 4,463,314 4,554,441 4,678,074 4,798,993 4,916,807 5,036,229 5,159,275 5,289,984 5,425,611 5,452,131 54,019,127
500,000 444,292 0 0 0 0 0 0 0 0 0 0 444,292110,573 110,573 110,794 114,340 118,227 122,483 126,648 130,954 135,406 138,791 142,261 142,955 1,393,432
83,199 123,893 125,525 128,036 130,596 133,208 135,872 138,590 141,361 144,189 147,072 150,014 1,498,356816 871 11,784 7,434 0 0 0 0 0 0 0 0 20,090
4,005 44,032 206,742 20,009 7,014 7,154 7,298 7,443 7,592 7,744 7,977 8,216 331,221294,106 327,824 370,909 408,359 346,380 384,425 423,403 463,300 474,028 485,004 496,234 507,723 4,687,589
----------------- ----------------- ----------------- ----------------- ----------------- ----------------- ----------------- ----------------- ----------------- ----------------- ----------------- ----------------- ------------------4,825,252 5,743,216 5,861,449 5,529,928 5,628,478 5,669,242 5,802,253 6,078,774 5,966,640 6,286,369 6,492,735 6,582,722 65,641,808
----------------- ----------------- ----------------- ----------------- ----------------- ----------------- ----------------- ----------------- ----------------- ----------------- ----------------- ----------------- ------------------
1,929,670 1,409,051 741,559 552,793 427,977 447,175 511,636 482,979 763,223 882,404 955,503 1,137,785 1,137,785----------------- ----------------- ----------------- ----------------- ----------------- ----------------- ----------------- ----------------- ----------------- ----------------- ----------------- ----------------- ------------------
1,929,670 1,409,051 741,559 552,793 427,977 447,175 511,636 482,979 763,223 882,404 955,503 1,137,785 1,137,785----------------- ----------------- ----------------- ----------------- ----------------- ----------------- ----------------- ----------------- ----------------- ----------------- ----------------- ----------------- ------------------
0 0 0 0 0 0 0 0 0 0 0 0 0========== ========== ========== ========== ========== ========== ========== ========== ========== ========== ========== ========== ==========
CITY OF SUNNYVALE595/200. GENERAL SERVICES FUND/FACILITIES MANAGEMENT SERVICES SUB-FUND
LONG TERM FINANCIAL PLANJULY 1, 2016 TO JUNE 30, 2027
265

RESERVES/FUND BALANCE, JULY 1
CURRENT RESOURCES:Facilities RentalEquipment RentalInterest IncomeMiscellaneous Revenues
TOTAL CURRENT RESOURCES
TOTAL AVAILABLE RESOURCES
CURRENT REQUIREMENTS:Carpets and BlindsEquipment ReplacementModular FurnitureOperationsIntrafund Loan RepaymentTransfer To SV Office Ctr FundTransfer To General Fund (In-Lieu)Transfer To Project AdministrationTransfer To Infrastructure FundAdditional Transfer To Infrastructure
TOTAL CURRENT REQUIREMENTS
RESERVES:Facilities Management Reserve
TOTAL RESERVES
FUND BALANCE, JUNE 30
FY 2027/2028 FY 2016/2017TO TO
PLAN PLAN PLAN PLAN PLAN PLAN PLAN PLAN PLAN PLAN FY 2036/2037 FY 2036/20372027/2028 2028/2029 2029/2030 2030/2031 2031/2032 2032/2033 2033/2034 2034/2035 2035/2036 2036/2037 TOTAL TOTAL
----------------- ----------------- ----------------- ----------------- ----------------- ----------------- ----------------- ----------------- ----------------- ----------------- ------------------ ------------------1,137,785 1,382,069 1,171,462 1,158,150 1,444,701 1,860,406 1,999,424 2,462,009 3,084,377 3,765,554 1,137,785 1,929,670
----------------- ----------------- ----------------- ----------------- ----------------- ----------------- ----------------- ----------------- ----------------- ----------------- ------------------ ------------------
6,752,265 6,941,328 7,135,685 7,335,485 7,540,878 7,752,023 7,969,079 8,192,214 8,421,596 8,657,400 76,697,952 139,198,977176,471 179,118 181,804 184,532 187,300 190,109 192,961 195,855 198,793 201,775 1,888,716 4,005,366
40,810 50,479 48,271 56,722 75,425 83,869 98,928 122,085 148,387 177,590 902,566 1,134,8140 0 0 0 0 0 0 0 0 0 0 0
----------------- ----------------- ----------------- ----------------- ----------------- ----------------- ----------------- ----------------- ----------------- ----------------- ------------------ ------------------6,969,545 7,170,925 7,365,761 7,576,738 7,803,603 8,026,001 8,260,968 8,510,154 8,768,775 9,036,765 79,489,234 144,339,157
----------------- ----------------- ----------------- ----------------- ----------------- ----------------- ----------------- ----------------- ----------------- ----------------- ------------------ ------------------8,107,331 8,552,994 8,537,223 8,734,888 9,248,304 9,886,407 10,260,392 10,972,163 11,853,153 12,802,319 80,627,020 146,268,827
----------------- ----------------- ----------------- ----------------- ----------------- ----------------- ----------------- ----------------- ----------------- ----------------- ------------------ ------------------
36,743 356,753 179,189 24,269 49,118 326,459 140,181 51,040 52,571 54,149 1,270,472 2,375,26930,585 198,033 198,982 86,265 343,424 387,876 289,634 297,305 306,224 315,411 2,453,739 4,596,642
326,759 336,562 346,659 357,058 0 0 0 0 0 0 1,367,037 1,367,0375,500,611 5,639,449 5,781,929 5,928,149 6,078,211 6,232,219 6,390,281 6,552,506 6,719,008 6,889,904 61,712,267 115,731,394
0 0 0 0 0 0 0 0 0 0 0 444,292147,244 151,367 155,605 159,962 164,441 169,045 173,778 178,644 183,646 188,788 1,672,519 3,065,951154,514 159,150 163,924 168,842 173,907 179,124 184,498 190,033 195,734 201,606 1,771,331 3,269,688
866 0 0 0 0 0 0 0 0 0 866 20,9558,462 8,716 8,978 9,247 9,524 9,810 24,081 10,408 10,408 10,408 110,042 441,263
519,478 531,504 543,807 556,395 569,274 582,450 595,931 607,849 620,006 620,006 5,746,700 10,434,289----------------- ----------------- ----------------- ----------------- ----------------- ----------------- ----------------- ----------------- ----------------- ----------------- ------------------ ------------------
6,725,261 7,381,532 7,379,073 7,290,187 7,387,898 7,886,983 7,798,383 7,887,785 8,087,598 8,280,272 76,104,973 141,746,780----------------- ----------------- ----------------- ----------------- ----------------- ----------------- ----------------- ----------------- ----------------- ----------------- ------------------ ------------------
1,382,069 1,171,462 1,158,150 1,444,701 1,860,406 1,999,424 2,462,009 3,084,377 3,765,554 4,522,047 4,522,047 4,522,047----------------- ----------------- ----------------- ----------------- ----------------- ----------------- ----------------- ----------------- ----------------- ----------------- ------------------ ------------------
1,382,069 1,171,462 1,158,150 1,444,701 1,860,406 1,999,424 2,462,009 3,084,377 3,765,554 4,522,047 4,522,047 4,522,047----------------- ----------------- ----------------- ----------------- ----------------- ----------------- ----------------- ----------------- ----------------- ----------------- ------------------ ------------------
0 0 0 0 0 0 0 0 0 0 0 0========== ========== ========== ========== ========== ========== ========== ========== ========== ========== ========== ==========
595/200. GENERAL SERVICES FUND/FACILITIES MANAGEMENT SERVICES SUB-FUNDCITY OF SUNNYVALE
LONG TERM FINANCIAL PLANJULY 1, 2027 TO JUNE 30, 2037
266

RESERVES/FUND BALANCE, JULY 1
CURRENT RESOURCES: Facilities Rental Interest Income Transfer From Gen. Svcs./Facilities Mgmt
TOTAL CURRENT RESOURCES
TOTAL AVAILABLE RESOURCES
CURRENT REQUIREMENTS: Operations Infrastructure Projects Transfer To Debt Service Transfer To Infrastructure Fund
TOTAL CURRENT REQUIREMENTS
RESERVES: Debt Service Capital Projects
TOTAL RESERVES
FUND BALANCE, JUNE 30
FY 2016/2017TO
ACTUAL CURRENT BUDGET PLAN PLAN PLAN PLAN PLAN PLAN PLAN PLAN PLAN FY 2026/20272015/2016 2016/2017 2017/2018 2018/2019 2019/2020 2020/2021 2021/2022 2022/2023 2023/2024 2024/2025 2025/2026 2026/2027 TOTAL
----------------- ----------------- ----------------- ----------------- ----------------- ----------------- ----------------- ----------------- ----------------- ----------------- ----------------- ----------------- ------------------10,398,899 10,341,017 10,265,504 10,156,787 10,048,375 9,942,694 9,894,858 9,805,265 9,568,171 9,477,564 9,390,908 9,298,596 10,341,017
----------------- ----------------- ----------------- ----------------- ----------------- ----------------- ----------------- ----------------- ----------------- ----------------- ----------------- ----------------- ------------------
577,644 595,459 601,414 607,428 613,502 619,637 625,833 632,092 638,413 644,797 651,245 651,245 6,881,06375,647 103,067 127,164 175,292 197,568 292,080 289,471 285,175 286,832 294,028 290,785 276,523 2,617,986
110,573 110,573 110,794 114,340 118,227 122,483 126,648 130,954 135,406 138,791 142,261 142,955 1,393,432----------------- ----------------- ----------------- ----------------- ----------------- ----------------- ----------------- ----------------- ----------------- ----------------- ----------------- ----------------- ------------------
763,864 809,099 839,371 897,060 929,297 1,034,200 1,041,952 1,048,221 1,060,651 1,077,616 1,084,291 1,070,723 10,892,481----------------- ----------------- ----------------- ----------------- ----------------- ----------------- ----------------- ----------------- ----------------- ----------------- ----------------- ----------------- ------------------
11,162,764 11,150,116 11,104,875 11,053,847 10,977,672 10,976,895 10,936,810 10,853,485 10,628,822 10,555,180 10,475,199 10,369,319 21,233,498----------------- ----------------- ----------------- ----------------- ----------------- ----------------- ----------------- ----------------- ----------------- ----------------- ----------------- ----------------- ------------------
257,424 268,576 275,438 280,990 288,557 296,117 303,660 311,350 319,258 327,521 336,120 344,373 3,351,96130,208 27,669 25,500 26,010 0 0 0 0 0 0 0 0 79,179
534,115 588,367 647,150 698,471 746,421 785,920 827,885 830,379 832,000 836,750 840,483 843,198 8,477,0240 0 0 0 0 0 0 143,586 0 0 0 0 143,586
----------------- ----------------- ----------------- ----------------- ----------------- ----------------- ----------------- ----------------- ----------------- ----------------- ----------------- ----------------- ------------------821,747 884,612 948,088 1,005,472 1,034,978 1,082,037 1,131,545 1,285,314 1,151,258 1,164,272 1,176,603 1,187,571 12,051,750
----------------- ----------------- ----------------- ----------------- ----------------- ----------------- ----------------- ----------------- ----------------- ----------------- ----------------- ----------------- ------------------
1,097,300 1,097,300 1,097,300 1,097,300 1,097,300 1,097,300 1,097,300 1,097,300 1,097,300 1,097,300 1,097,300 1,097,300 1,097,3009,243,717 9,168,204 9,059,487 8,951,075 8,845,394 8,797,558 8,707,965 8,470,871 8,380,264 8,293,608 8,201,296 8,084,448 8,084,448
----------------- ----------------- ----------------- ----------------- ----------------- ----------------- ----------------- ----------------- ----------------- ----------------- ----------------- ----------------- ------------------10,341,017 10,265,504 10,156,787 10,048,375 9,942,694 9,894,858 9,805,265 9,568,171 9,477,564 9,390,908 9,298,596 9,181,748 9,181,748
----------------- ----------------- ----------------- ----------------- ----------------- ----------------- ----------------- ----------------- ----------------- ----------------- ----------------- ----------------- ------------------0 0 0 0 0 0 0 0 0 0 0 0 0
========== ========== ========== ========== ========== ========== ========== ========== ========== ========== ========== ========== ==========
595/210. GENERAL SERVICES FUND/SUNNYVALE OFFICE CENTER SUB-FUND
JULY 1, 2016 TO JUNE 30, 2027LONG TERM FINANCIAL PLAN
CITY OF SUNNYVALE
267

RESERVES/FUND BALANCE, JULY 1
CURRENT RESOURCES: Facilities Rental Interest Income Transfer From Gen. Svcs./Facilities Mgmt
TOTAL CURRENT RESOURCES
TOTAL AVAILABLE RESOURCES
CURRENT REQUIREMENTS: Operations Infrastructure Projects Transfer To Debt Service Transfer To Infrastructure Fund
TOTAL CURRENT REQUIREMENTS
RESERVES: Debt Service Capital Projects
TOTAL RESERVES
FUND BALANCE, JUNE 30
FY 2027/2028 FY 2016/2017TO TO
PLAN PLAN PLAN PLAN PLAN PLAN PLAN PLAN PLAN PLAN FY 2036/2037 FY 2036/20372027/2028 2028/2029 2029/2030 2030/2031 2031/2032 2032/2033 2033/2034 2034/2035 2035/2036 2036/2037 TOTAL TOTAL
----------------- ----------------- ----------------- ----------------- ----------------- ----------------- ----------------- ----------------- ----------------- ----------------- ------------------ ------------------9,181,748 9,053,997 9,015,886 8,973,793 8,928,671 9,766,847 10,484,810 11,430,517 12,414,581 13,438,421 9,181,748 10,341,017
----------------- ----------------- ----------------- ----------------- ----------------- ----------------- ----------------- ----------------- ----------------- ----------------- ------------------ ------------------
657,757 664,335 670,978 677,688 684,465 691,309 698,223 705,205 712,257 719,379 6,881,595 13,762,659267,589 351,889 350,270 348,534 380,772 450,590 486,963 524,812 564,190 605,155 4,330,768 6,948,754147,244 151,367 155,605 159,962 164,441 169,045 173,778 178,644 183,646 188,788 1,672,519 3,065,951
----------------- ----------------- ----------------- ----------------- ----------------- ----------------- ----------------- ----------------- ----------------- ----------------- ------------------ ------------------1,072,590 1,167,591 1,176,853 1,186,184 1,229,678 1,310,945 1,358,964 1,408,661 1,460,093 1,513,323 12,884,882 23,777,364
----------------- ----------------- ----------------- ----------------- ----------------- ----------------- ----------------- ----------------- ----------------- ----------------- ------------------ ------------------10,254,338 10,221,587 10,192,740 10,159,977 10,158,349 11,077,791 11,843,774 12,839,178 13,874,675 14,951,744 22,066,630 34,118,380
----------------- ----------------- ----------------- ----------------- ----------------- ----------------- ----------------- ----------------- ----------------- ----------------- ------------------ ------------------
351,444 361,047 370,919 381,068 391,502 402,229 413,258 424,596 436,254 448,240 3,980,558 7,332,5190 0 0 0 0 0 0 0 0 0 0 79,179
848,897 844,654 848,027 850,238 0 0 0 0 0 0 3,391,816 11,868,8410 0 0 0 0 190,752 0 0 0 0 190,752 334,338
----------------- ----------------- ----------------- ----------------- ----------------- ----------------- ----------------- ----------------- ----------------- ----------------- ------------------ ------------------1,200,341 1,205,701 1,218,946 1,231,306 391,502 592,981 413,258 424,596 436,254 448,240 7,563,126 19,614,876
----------------- ----------------- ----------------- ----------------- ----------------- ----------------- ----------------- ----------------- ----------------- ----------------- ------------------ ------------------
1,097,300 1,097,300 1,097,300 1,097,300 0 0 0 0 0 0 0 07,956,697 7,918,586 7,876,493 7,831,371 9,766,847 10,484,810 11,430,517 12,414,581 13,438,421 14,503,504 14,503,504 14,503,504
----------------- ----------------- ----------------- ----------------- ----------------- ----------------- ----------------- ----------------- ----------------- ----------------- ------------------ ------------------9,053,997 9,015,886 8,973,793 8,928,671 9,766,847 10,484,810 11,430,517 12,414,581 13,438,421 14,503,504 14,503,504 14,503,504
----------------- ----------------- ----------------- ----------------- ----------------- ----------------- ----------------- ----------------- ----------------- ----------------- ------------------ ------------------0 0 0 0 0 0 0 0 0 0 0 0
========== ========== ========== ========== ========== ========== ========== ========== ========== ========== ========== ==========
595/210. GENERAL SERVICES FUND/SUNNYVALE OFFICE CENTER SUB-FUND
JULY 1, 2027 TO JUNE 30, 2037LONG TERM FINANCIAL PLAN
CITY OF SUNNYVALE
268
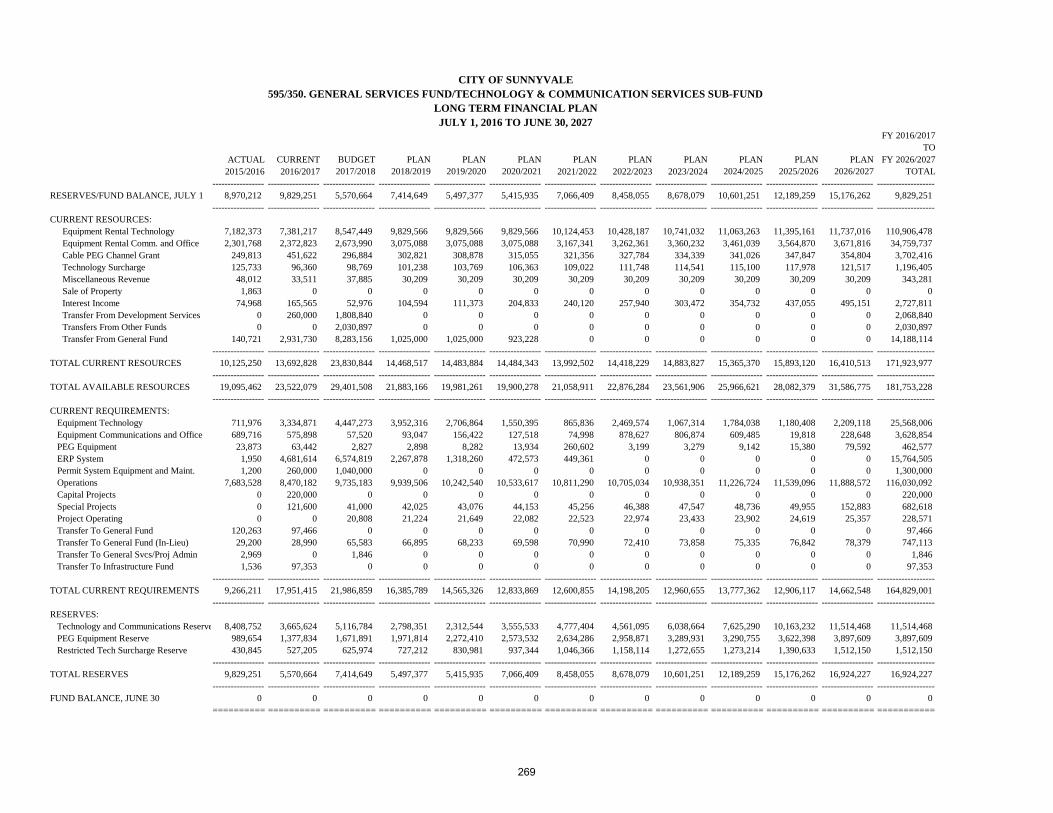
RESERVES/FUND BALANCE, JULY 1
CURRENT RESOURCES:Equipment Rental TechnologyEquipment Rental Comm. and OfficeCable PEG Channel GrantTechnology SurchargeMiscellaneous RevenueSale of PropertyInterest IncomeTransfer From Development ServicesTransfers From Other FundsTransfer From General Fund
TOTAL CURRENT RESOURCES
TOTAL AVAILABLE RESOURCES
CURRENT REQUIREMENTS: Equipment Technology Equipment Communications and Office PEG Equipment ERP System Permit System Equipment and Maint. Operations Capital Projects Special Projects Project Operating Transfer To General Fund Transfer To General Fund (In-Lieu) Transfer To General Svcs/Proj Admin Transfer To Infrastructure Fund
TOTAL CURRENT REQUIREMENTS
RESERVES: Technology and Communications Reserve PEG Equipment Reserve Restricted Tech Surcharge Reserve
TOTAL RESERVES
FUND BALANCE, JUNE 30
595/350. GENERAL SERVICES FUND/TECHNOLOGY & COMMUNICATION SERVICES SUB-FUND
FY 2016/2017TO
ACTUAL CURRENT BUDGET PLAN PLAN PLAN PLAN PLAN PLAN PLAN PLAN PLAN FY 2026/20272015/2016 2016/2017 2017/2018 2018/2019 2019/2020 2020/2021 2021/2022 2022/2023 2023/2024 2024/2025 2025/2026 2026/2027 TOTAL
----------------- ----------------- ----------------- ----------------- ----------------- ----------------- ----------------- ----------------- ----------------- ----------------- ----------------- ----------------- -------------------8,970,212 9,829,251 5,570,664 7,414,649 5,497,377 5,415,935 7,066,409 8,458,055 8,678,079 10,601,251 12,189,259 15,176,262 9,829,251
----------------- ----------------- ----------------- ----------------- ----------------- ----------------- ----------------- ----------------- ----------------- ----------------- ----------------- ----------------- -------------------
7,182,373 7,381,217 8,547,449 9,829,566 9,829,566 9,829,566 10,124,453 10,428,187 10,741,032 11,063,263 11,395,161 11,737,016 110,906,4782,301,768 2,372,823 2,673,990 3,075,088 3,075,088 3,075,088 3,167,341 3,262,361 3,360,232 3,461,039 3,564,870 3,671,816 34,759,737
249,813 451,622 296,884 302,821 308,878 315,055 321,356 327,784 334,339 341,026 347,847 354,804 3,702,416125,733 96,360 98,769 101,238 103,769 106,363 109,022 111,748 114,541 115,100 117,978 121,517 1,196,405
48,012 33,511 37,885 30,209 30,209 30,209 30,209 30,209 30,209 30,209 30,209 30,209 343,2811,863 0 0 0 0 0 0 0 0 0 0 0 0
74,968 165,565 52,976 104,594 111,373 204,833 240,120 257,940 303,472 354,732 437,055 495,151 2,727,8110 260,000 1,808,840 0 0 0 0 0 0 0 0 0 2,068,8400 0 2,030,897 0 0 0 0 0 0 0 0 0 2,030,897
140,721 2,931,730 8,283,156 1,025,000 1,025,000 923,228 0 0 0 0 0 0 14,188,114----------------- ----------------- ----------------- ----------------- ----------------- ----------------- ----------------- ----------------- ----------------- ----------------- ----------------- ----------------- -------------------
10,125,250 13,692,828 23,830,844 14,468,517 14,483,884 14,484,343 13,992,502 14,418,229 14,883,827 15,365,370 15,893,120 16,410,513 171,923,977----------------- ----------------- ----------------- ----------------- ----------------- ----------------- ----------------- ----------------- ----------------- ----------------- ----------------- ----------------- -------------------
19,095,462 23,522,079 29,401,508 21,883,166 19,981,261 19,900,278 21,058,911 22,876,284 23,561,906 25,966,621 28,082,379 31,586,775 181,753,228----------------- ----------------- ----------------- ----------------- ----------------- ----------------- ----------------- ----------------- ----------------- ----------------- ----------------- ----------------- -------------------
711,976 3,334,871 4,447,273 3,952,316 2,706,864 1,550,395 865,836 2,469,574 1,067,314 1,784,038 1,180,408 2,209,118 25,568,006689,716 575,898 57,520 93,047 156,422 127,518 74,998 878,627 806,874 609,485 19,818 228,648 3,628,854
23,873 63,442 2,827 2,898 8,282 13,934 260,602 3,199 3,279 9,142 15,380 79,592 462,5771,950 4,681,614 6,574,819 2,267,878 1,318,260 472,573 449,361 0 0 0 0 0 15,764,5051,200 260,000 1,040,000 0 0 0 0 0 0 0 0 0 1,300,000
7,683,528 8,470,182 9,735,183 9,939,506 10,242,540 10,533,617 10,811,290 10,705,034 10,938,351 11,226,724 11,539,096 11,888,572 116,030,0920 220,000 0 0 0 0 0 0 0 0 0 0 220,0000 121,600 41,000 42,025 43,076 44,153 45,256 46,388 47,547 48,736 49,955 152,883 682,6180 0 20,808 21,224 21,649 22,082 22,523 22,974 23,433 23,902 24,619 25,357 228,571
120,263 97,466 0 0 0 0 0 0 0 0 0 0 97,46629,200 28,990 65,583 66,895 68,233 69,598 70,990 72,410 73,858 75,335 76,842 78,379 747,113
2,969 0 1,846 0 0 0 0 0 0 0 0 0 1,8461,536 97,353 0 0 0 0 0 0 0 0 0 0 97,353
----------------- ----------------- ----------------- ----------------- ----------------- ----------------- ----------------- ----------------- ----------------- ----------------- ----------------- ----------------- -------------------9,266,211 17,951,415 21,986,859 16,385,789 14,565,326 12,833,869 12,600,855 14,198,205 12,960,655 13,777,362 12,906,117 14,662,548 164,829,001
----------------- ----------------- ----------------- ----------------- ----------------- ----------------- ----------------- ----------------- ----------------- ----------------- ----------------- ----------------- -------------------
8,408,752 3,665,624 5,116,784 2,798,351 2,312,544 3,555,533 4,777,404 4,561,095 6,038,664 7,625,290 10,163,232 11,514,468 11,514,468989,654 1,377,834 1,671,891 1,971,814 2,272,410 2,573,532 2,634,286 2,958,871 3,289,931 3,290,755 3,622,398 3,897,609 3,897,609430,845 527,205 625,974 727,212 830,981 937,344 1,046,366 1,158,114 1,272,655 1,273,214 1,390,633 1,512,150 1,512,150
----------------- ----------------- ----------------- ----------------- ----------------- ----------------- ----------------- ----------------- ----------------- ----------------- ----------------- ----------------- -------------------9,829,251 5,570,664 7,414,649 5,497,377 5,415,935 7,066,409 8,458,055 8,678,079 10,601,251 12,189,259 15,176,262 16,924,227 16,924,227
----------------- ----------------- ----------------- ----------------- ----------------- ----------------- ----------------- ----------------- ----------------- ----------------- ----------------- ----------------- -------------------0 0 0 0 0 0 0 0 0 0 0 0 0
========== ========== ========== ========== ========== ========== ========== ========== ========== ========== ========== ========== ===========
CITY OF SUNNYVALE
LONG TERM FINANCIAL PLANJULY 1, 2016 TO JUNE 30, 2027
269

RESERVES/FUND BALANCE, JULY 1
CURRENT RESOURCES:Equipment Rental TechnologyEquipment Rental Comm. and OfficeCable PEG Channel GrantTechnology SurchargeMiscellaneous RevenueSale of PropertyInterest IncomeTransfer From Development ServicesTransfers From Other FundsTransfer From General Fund
TOTAL CURRENT RESOURCES
TOTAL AVAILABLE RESOURCES
CURRENT REQUIREMENTS: Equipment Technology Equipment Communications and Office PEG Equipment ERP System Permit System Equipment and Maint. Operations Capital Projects Special Projects Project Operating Transfer To General Fund Transfer To General Fund (In-Lieu) Transfer To General Svcs/Proj Admin Transfer To Infrastructure Fund
TOTAL CURRENT REQUIREMENTS
RESERVES: Technology and Communications Reserve PEG Equipment Reserve Restricted Tech Surcharge Reserve
TOTAL RESERVES
FUND BALANCE, JUNE 30
595/350. GENERAL SERVICES FUND/TECHNOLOGY & COMMUNICATION SERVICES SUB-FUND
FY 2027/2028 FY 2016/2017TO TO
PLAN PLAN PLAN PLAN PLAN PLAN PLAN PLAN PLAN PLAN FY 2036/2037 FY 2036/20372027/2028 2028/2029 2029/2030 2030/2031 2031/2032 2032/2033 2033/2034 2034/2035 2035/2036 2036/2037 TOTAL TOTAL
----------------- ----------------- ----------------- ----------------- ----------------- ----------------- ----------------- ----------------- ----------------- ----------------- ------------------- -------------------16,924,227 7,586,203 11,389,331 13,096,134 15,387,336 15,698,637 14,664,900 16,435,004 16,183,442 19,469,413 16,924,227 9,829,251
----------------- ----------------- ----------------- ----------------- ----------------- ----------------- ----------------- ----------------- ----------------- ----------------- ------------------- -------------------
11,971,756 12,121,403 12,272,921 12,426,332 12,581,662 12,738,932 12,898,169 13,059,396 13,222,639 13,387,922 126,681,133 237,587,6113,745,253 3,792,068 3,839,469 3,887,462 3,936,056 3,985,256 4,035,072 4,085,511 4,136,579 4,188,287 39,631,013 74,390,750
361,900 369,138 376,520 384,051 391,732 399,566 407,558 415,709 424,023 432,504 3,962,699 7,665,116125,163 128,917 132,785 136,768 140,872 145,098 149,451 153,934 158,552 163,309 1,434,848 2,631,253
30,209 30,209 30,209 30,209 30,209 30,209 30,209 30,209 30,209 30,209 302,094 645,3750 0 0 0 0 0 0 0 0 0 0 0
323,294 424,442 499,122 589,356 605,641 581,379 625,580 636,197 735,380 800,177 5,820,568 8,548,3790 0 0 0 0 0 0 0 0 0 0 2,068,8400 0 0 0 0 0 0 0 0 0 0 2,030,8970 0 0 0 0 0 0 0 0 0 0 14,188,114
----------------- ----------------- ----------------- ----------------- ----------------- ----------------- ----------------- ----------------- ----------------- ----------------- ------------------- -------------------16,557,575 16,866,178 17,151,027 17,454,180 17,686,171 17,880,441 18,146,039 18,380,956 18,707,383 19,002,407 177,832,356 349,756,333
----------------- ----------------- ----------------- ----------------- ----------------- ----------------- ----------------- ----------------- ----------------- ----------------- ------------------- -------------------33,481,802 24,452,381 28,540,357 30,550,314 33,073,507 33,579,078 32,810,939 34,815,960 34,890,825 38,471,820 194,756,583 359,585,584
----------------- ----------------- ----------------- ----------------- ----------------- ----------------- ----------------- ----------------- ----------------- ----------------- ------------------- -------------------
5,225,989 576,819 1,561,380 1,826,993 2,322,563 3,982,433 1,548,339 3,709,279 932,135 2,220,290 23,906,218 49,474,224967,363 192,801 1,297,726 71,254 29,637 1,456,711 1,039,104 805,862 35,728 632,012 6,528,198 10,157,052
3,565 3,672 10,547 17,830 335,099 4,133 4,257 12,226 20,670 4,652 416,652 879,2297,680,507 0 0 0 0 0 0 0 0 0 7,680,507 23,445,012
0 0 0 380,651 1,522,604 0 0 0 0 0 1,903,255 3,203,25511,851,799 12,125,118 12,404,991 12,691,583 12,985,061 13,285,598 13,593,372 13,908,562 14,231,356 14,561,945 131,639,384 247,669,476
0 0 0 0 0 0 0 0 0 0 0 220,00052,997 54,587 56,224 57,911 59,648 61,438 63,281 65,179 67,135 69,149 607,548 1,290,16726,118 26,902 27,709 28,540 29,396 30,278 31,186 32,122 32,122 33,086 297,459 526,030
0 0 0 0 0 0 0 0 0 0 0 97,46680,730 83,152 85,647 88,216 90,862 93,588 96,396 99,288 102,267 105,335 925,481 1,672,594
0 0 0 0 0 0 0 0 0 0 0 1,8466,530 0 0 0 0 0 0 0 0 0 6,530 103,883
----------------- ----------------- ----------------- ----------------- ----------------- ----------------- ----------------- ----------------- ----------------- ----------------- ------------------- -------------------25,895,599 13,063,050 15,444,223 15,162,978 17,374,870 18,914,178 16,375,935 18,632,518 15,421,412 17,626,469 173,911,232 338,740,233
----------------- ----------------- ----------------- ----------------- ----------------- ----------------- ----------------- ----------------- ----------------- ----------------- ------------------- -------------------
1,692,947 5,001,692 6,209,737 8,378,601 10,015,001 8,440,733 9,658,086 8,849,108 11,573,173 12,357,951 12,357,951 12,357,9514,255,943 4,621,408 4,987,382 5,353,603 5,410,236 5,805,669 6,208,969 6,612,452 7,015,805 7,443,657 7,443,657 7,443,6571,637,312 1,766,230 1,899,015 1,655,132 273,400 418,498 567,949 721,883 880,435 1,043,744 1,043,744 1,043,744
----------------- ----------------- ----------------- ----------------- ----------------- ----------------- ----------------- ----------------- ----------------- ----------------- ------------------- -------------------7,586,203 11,389,331 13,096,134 15,387,336 15,698,637 14,664,900 16,435,004 16,183,442 19,469,413 20,845,351 20,845,351 20,845,351
----------------- ----------------- ----------------- ----------------- ----------------- ----------------- ----------------- ----------------- ----------------- ----------------- ------------------- -------------------0 0 0 0 0 0 0 0 0 0 0 0
========== ========== ========== ========== ========== ========== ========== ========== ========== ========== =========== ===========
LONG TERM FINANCIAL PLANJULY 1, 2027 TO JUNE 30, 2037
CITY OF SUNNYVALE
270

RESERVES/FUND BALANCE, JULY 1
CURRENT RESOURCES: Transfer From General Fund Transfer From Park Dedication Fund Transfer From VRF Fund Transfer From Gas Tax Fund Transfer From Transportation Impact Fund Transfer From Water Supply and Dist. Fund Transfer From Solid Waste Mgmt Fund Transfer From Wastewater Mgmt Fund Transfer From Gen. Services/Fleet Transfer From Infrastructure Fund Transfer From Gen. Svcs./Facilities Mgmt. Transfer From Gen. Svcs./IT
TOTAL CURRENT RESOURCES
TOTAL AVAILABLE RESOURCES
CURRENT REQUIREMENTS: Operations Special Projects
TOTAL CURRENT REQUIREMENTS
RESERVES: 20 Year RAP
TOTAL RESERVES
FUND BALANCE, JUNE 30
FY 2016/2017TO
ACTUAL CURRENT BUDGET PLAN PLAN PLAN PLAN PLAN PLAN PLAN PLAN PLAN FY 2026/20272015/2016 2016/2017 2017/2018 2018/2019 2019/2020 2020/2021 2021/2022 2022/2023 2023/2024 2024/2025 2025/2026 2026/2027 TOTAL
----------------- ----------------- ----------------- ----------------- ----------------- ----------------- ----------------- ----------------- ----------------- ----------------- ----------------- ----------------- ------------------0 0 0 0 0 0 0 0 0 0 0 0 0
----------------- ----------------- ----------------- ----------------- ----------------- ----------------- ----------------- ----------------- ----------------- ----------------- ----------------- ----------------- ------------------
519,508 402,979 485,395 754,049 206,553 508,974 192,780 332,020 245,469 266,511 289,428 657,520 4,341,678651,185 1,046,871 1,468,944 1,237,857 686,559 413,167 919,948 139,434 713,006 1,189,548 570,580 531,054 8,916,969
48,748 0 0 0 0 0 0 0 0 0 0 0 0211,427 273,564 130,282 205,511 114,412 93,800 136,184 101,243 196,062 107,462 196,405 228,412 1,783,336
0 15,814 25,017 0 0 0 0 0 0 0 0 0 40,831405,153 518,805 483,893 272,237 466,871 155,295 357,328 1,080,814 470,410 153,284 705,095 356,651 5,020,682
2,102 115,703 47,285 0 0 0 0 0 0 0 0 0 162,987885,218 860,209 766,083 923,566 271,741 444,440 233,698 223,226 289,326 235,754 254,720 257,802 4,760,564
2,036 2,058 1,846 0 0 0 0 0 0 0 0 0 3,904314,335 24,001 45,679 66,976 22,356 210,267 0 0 0 0 0 0 369,280
816 871 11,784 7,434 0 0 0 0 0 0 0 0 20,0892,969 0 1,846 0 0 0 0 0 0 0 0 0 1,846
----------------- ----------------- ----------------- ----------------- ----------------- ----------------- ----------------- ----------------- ----------------- ----------------- ----------------- ----------------- ------------------3,043,497 3,260,874 3,468,054 3,467,631 1,768,492 1,825,944 1,839,939 1,876,737 1,914,272 1,952,558 2,016,228 2,031,440 25,422,167
----------------- ----------------- ----------------- ----------------- ----------------- ----------------- ----------------- ----------------- ----------------- ----------------- ----------------- ----------------- ------------------3,043,497 3,260,874 3,468,054 3,467,631 1,768,492 1,825,944 1,839,939 1,876,737 1,914,272 1,952,558 2,016,228 2,031,440 25,422,167
----------------- ----------------- ----------------- ----------------- ----------------- ----------------- ----------------- ----------------- ----------------- ----------------- ----------------- ----------------- ------------------
2,949,460 3,223,164 3,468,054 3,467,631 1,768,492 1,803,862 1,839,939 1,876,737 1,914,272 1,952,558 1,991,609 2,031,440 25,337,75694,037 37,710 0 0 0 22,082 0 0 0 0 24,619 0 84,411
----------------- ----------------- ----------------- ----------------- ----------------- ----------------- ----------------- ----------------- ----------------- ----------------- ----------------- ----------------- ------------------3,043,497 3,260,874 3,468,054 3,467,631 1,768,492 1,825,944 1,839,939 1,876,737 1,914,272 1,952,558 2,016,228 2,031,440 25,422,167
----------------- ----------------- ----------------- ----------------- ----------------- ----------------- ----------------- ----------------- ----------------- ----------------- ----------------- ----------------- ------------------
0 0 0 0 0 0 0 0 0 0 0 0 0----------------- ----------------- ----------------- ----------------- ----------------- ----------------- ----------------- ----------------- ----------------- ----------------- ----------------- ----------------- ------------------
0 0 0 0 0 0 0 0 0 0 0 0 0----------------- ----------------- ----------------- ----------------- ----------------- ----------------- ----------------- ----------------- ----------------- ----------------- ----------------- ----------------- ------------------
0 0 0 0 0 0 0 0 0 0 0 0 0========== ========== ========== ========== ========== ========== ========== ========== ========== ========== ========== ========== ==========
CITY OF SUNNYVALE595/800. GENERAL SERVICES FUND/PROJECT MANAGEMENT SERVICES SUB-FUND
LONG TERM FINANCIAL PLANJULY 1, 2016 TO JUNE 30, 2027
271

RESERVES/FUND BALANCE, JULY 1
CURRENT RESOURCES: Transfer From General Fund Transfer From Park Dedication Fund Transfer From VRF Fund Transfer From Gas Tax Fund Transfer From Transportation Impact Fund Transfer From Water Supply and Dist. Fund Transfer From Solid Waste Mgmt Fund Transfer From Wastewater Mgmt Fund Transfer From Gen. Services/Fleet Transfer From Infrastructure Fund Transfer From Gen. Svcs./Facilities Mgmt. Transfer From Gen. Svcs./IT
TOTAL CURRENT RESOURCES
TOTAL AVAILABLE RESOURCES
CURRENT REQUIREMENTS: Operations Special Projects
TOTAL CURRENT REQUIREMENTS
RESERVES: 20 Year RAP
TOTAL RESERVES
FUND BALANCE, JUNE 30
FY 2027/2028 FY 2016/2017TO TO
PLAN PLAN PLAN PLAN PLAN PLAN PLAN PLAN PLAN PLAN FY 2036/2037 FY 2036/20372027/2028 2028/2029 2029/2030 2030/2031 2031/2032 2032/2033 2033/2034 2034/2035 2035/2036 2036/2037 TOTAL TOTAL
----------------- ----------------- ----------------- ----------------- ----------------- ----------------- ----------------- ----------------- ----------------- ----------------- ------------------ ------------------0 0 0 0 0 0 0 0 0 0 0 0
----------------- ----------------- ----------------- ----------------- ----------------- ----------------- ----------------- ----------------- ----------------- ----------------- ------------------ ------------------
207,272 487,490 334,716 501,945 495,078 466,640 464,976 1,011,268 419,691 1,138,831 5,527,908 9,869,5861,033,585 1,177,328 733,604 1,073,931 785,911 1,166,804 96,520 396,994 932,881 371,520 7,769,079 16,686,048
0 0 0 0 0 0 0 0 0 0 0 0155,137 169,346 237,312 203,142 192,962 128,029 345,970 369,685 256,084 496,783 2,554,450 4,337,787
0 0 0 0 0 0 0 0 0 0 0 40,831528,028 155,129 639,078 225,080 534,406 203,907 849,380 270,955 689,630 314,363 4,409,956 9,430,639
0 0 0 0 0 0 0 0 0 0 0 162,987126,469 123,603 231,574 266,014 300,463 412,704 692,580 474,004 300,310 355,054 3,282,774 8,043,338
0 0 0 0 0 0 0 0 0 0 0 3,9040 0 0 0 0 0 0 0 0 0 0 369,280
866 0 0 0 0 0 0 0 0 0 866 20,9550 0 0 0 0 0 0 0 0 0 0 1,846
----------------- ----------------- ----------------- ----------------- ----------------- ----------------- ----------------- ----------------- ----------------- ----------------- ------------------ ------------------2,051,357 2,112,896 2,176,284 2,270,112 2,308,820 2,378,084 2,449,426 2,522,907 2,598,597 2,676,551 23,545,033 48,967,200
----------------- ----------------- ----------------- ----------------- ----------------- ----------------- ----------------- ----------------- ----------------- ----------------- ------------------ ------------------2,051,357 2,112,896 2,176,284 2,270,112 2,308,820 2,378,084 2,449,426 2,522,907 2,598,597 2,676,551 23,545,033 48,967,200
----------------- ----------------- ----------------- ----------------- ----------------- ----------------- ----------------- ----------------- ----------------- ----------------- ------------------ ------------------
2,051,357 2,112,896 2,176,284 2,241,572 2,308,820 2,378,084 2,449,426 2,522,907 2,598,597 2,676,551 23,516,493 48,854,2490 0 0 28,540 0 0 0 0 0 0 28,540 112,951
----------------- ----------------- ----------------- ----------------- ----------------- ----------------- ----------------- ----------------- ----------------- ----------------- ------------------ ------------------2,051,357 2,112,896 2,176,284 2,270,112 2,308,820 2,378,084 2,449,426 2,522,907 2,598,597 2,676,551 23,545,033 48,967,200
----------------- ----------------- ----------------- ----------------- ----------------- ----------------- ----------------- ----------------- ----------------- ----------------- ------------------ ------------------
0 0 0 0 0 0 0 0 0 0 0 0----------------- ----------------- ----------------- ----------------- ----------------- ----------------- ----------------- ----------------- ----------------- ----------------- ------------------ ------------------
0 0 0 0 0 0 0 0 0 0 0 0----------------- ----------------- ----------------- ----------------- ----------------- ----------------- ----------------- ----------------- ----------------- ----------------- ------------------ ------------------
0 0 0 0 0 0 0 0 0 0 0 0========== ========== ========== ========== ========== ========== ========== ========== ========== ========== ========== ==========
JULY 1, 2027 TO JUNE 30, 2037
595/800. GENERAL SERVICES FUND/PROJECT MANAGEMENT SERVICES SUB-FUNDCITY OF SUNNYVALE
LONG TERM FINANCIAL PLAN
272

RESERVE/FUND BALANCE, JULY 1
CURRENT RESOURCES: Employee Leaves Miscellaneous PERS Public Safety PERS Workers' Compensation Insurance and Incentives Transfer From Other Funds Interest Income
TOTAL CURRENT RESOURCES
TOTAL AVAILABLE RESOURCES
CURRENT REQUIREMENTS: Employee Leave Benefits PERS Retirement Benefits Workers' Compensation Program Insurance Benefits Retiree Medical Transfer To OPEB Trust Additional Contribution To PERS Directors Home Mortgage Program
TOTAL CURRENT REQUIREMENTS
RESERVES: RESTRICTED: Employee Leaves PERS Rate Uncertainty Workers' Compensation Insurance Rate Uncertainty
TOTAL RESERVES
FUND BALANCE, JUNE 30
FY 2016/2017TO
ACTUAL CURRENT BUDGET PLAN PLAN PLAN PLAN PLAN PLAN PLAN PLAN PLAN FY 2026/20272015/2016 2016/2017 2017/2018 2018/2019 2019/2020 2020/2021 2021/2022 2022/2023 2023/2024 2024/2025 2025/2026 2026/2027 TOTAL
------------------ ------------------ ------------------ ------------------ ------------------ ------------------ ------------------ ------------------ ------------------ ------------------ ------------------------------------- --------------------17,231,883 17,398,661 17,782,765 19,115,786 20,461,499 21,503,092 22,552,033 22,722,847 22,227,506 21,829,084 21,742,876 21,828,630 17,398,661
------------------ ------------------ ------------------ ------------------ ------------------ ------------------ ------------------ ------------------ ------------------ ------------------ ------------------------------------- --------------------
14,127,579 16,687,810 17,488,882 17,817,775 18,214,043 18,502,540 18,955,210 19,419,244 19,894,935 20,377,611 20,872,304 21,379,319 209,609,67416,283,275 17,013,264 19,139,922 21,245,313 23,263,618 25,124,707 26,380,943 27,831,894 28,945,170 30,392,429 31,456,164 32,399,849 283,193,27214,699,590 16,156,442 17,852,869 19,905,949 21,996,073 23,975,720 25,654,020 27,706,342 28,814,595 30,255,325 31,162,985 32,097,875 275,578,195
4,665,847 4,024,084 6,056,047 6,114,171 6,204,161 6,175,701 6,300,130 5,549,368 5,706,066 5,866,841 6,032,970 6,203,448 64,232,98724,331,149 26,457,666 26,457,666 26,457,666 27,251,396 28,068,938 29,191,695 30,359,363 31,877,331 33,471,198 35,144,758 36,550,548 331,288,224
0 800,000 0 0 0 0 0 0 0 0 0 0 800,000243,695 321,504 406,221 597,188 715,419 1,113,561 1,154,399 1,169,080 1,163,968 1,166,929 1,215,386 1,259,936 10,283,591
------------------ ------------------ ------------------ ------------------ ------------------ ------------------ ------------------ ------------------ ------------------ ------------------ ------------------ ------------------ --------------------74,351,134 81,460,770 87,401,606 92,138,061 97,644,709 102,961,166 107,636,397 112,035,292 116,402,066 121,530,333 125,884,566 129,890,974 1,174,985,941
------------------ ------------------ ------------------ ------------------ ------------------ ------------------ ------------------ ------------------ ------------------ ------------------ ------------------ ------------------ --------------------91,583,018 98,859,432 105,184,372 111,253,847 118,106,209 124,464,259 130,188,430 134,758,139 138,629,572 143,359,417 147,627,442 151,719,604 1,192,384,602
------------------ ------------------ ------------------ ------------------ ------------------ ------------------ ------------------ ------------------ ------------------ ------------------ ------------------ ------------------ --------------------
14,560,067 17,306,743 17,672,819 18,080,437 18,520,232 18,971,008 19,433,048 19,906,639 20,392,078 20,889,668 21,399,722 21,922,560 214,494,95330,387,172 33,818,614 36,513,770 40,613,009 44,727,680 48,511,014 52,269,093 55,619,808 58,081,697 60,956,665 63,238,165 65,536,483 559,885,998
3,830,886 5,085,350 5,381,946 5,520,918 5,662,876 5,808,705 5,958,321 6,072,238 6,228,936 6,389,711 6,555,840 6,726,318 65,391,15814,182,218 14,791,960 15,465,051 16,355,984 17,225,329 17,959,499 18,754,121 19,585,948 20,456,778 21,368,497 22,323,085 23,322,619 207,608,869
5,403,913 5,437,629 5,976,000 6,403,000 6,855,000 7,287,000 7,636,000 8,082,000 8,522,000 8,984,000 9,464,000 9,893,000 84,539,6294,420,100 4,636,371 4,059,000 3,819,000 3,612,000 3,375,000 3,415,000 3,264,000 3,119,000 3,028,000 2,818,000 2,819,000 37,964,3711,400,000 0 0 0 0 0 0 0 0 0 0 0 0
0 0 1,000,000 0 0 0 0 0 0 0 0 0 1,000,000------------------ ------------------ ------------------ ------------------ ------------------ ------------------ ------------------ ------------------ ------------------ ------------------ ------------------ ------------------ --------------------
74,184,356 81,076,666 86,068,586 90,792,348 96,603,116 101,912,226 107,465,583 112,530,633 116,800,488 121,616,541 125,798,812 130,219,979 1,170,884,978------------------ ------------------ ------------------ ------------------ ------------------ ------------------ ------------------ ------------------ ------------------ ------------------ ------------------ ------------------ --------------------
(325,331) 0 0 0 0 0 0 0 0 0 0 0 02,315,188 1,689,432 2,189,570 2,766,140 3,353,474 4,043,491 3,930,665 3,967,013 3,764,093 3,568,104 3,091,812 2,207,643 2,207,643
14,151,276 13,231,523 14,071,018 14,910,514 15,750,009 16,589,505 17,429,000 17,429,000 17,429,000 17,429,000 17,429,000 17,429,001 17,429,0011,257,529 2,861,810 2,855,198 2,784,846 2,399,610 1,919,037 1,363,182 831,493 635,991 745,772 1,307,818 1,862,981 1,862,981
------------------ ------------------ ------------------ ------------------ ------------------ ------------------ ------------------ ------------------ ------------------ ------------------ ------------------ ------------------ --------------------17,398,661 17,782,765 19,115,786 20,461,499 21,503,092 22,552,033 22,722,847 22,227,506 21,829,084 21,742,876 21,828,630 21,499,625 21,499,625
------------------ ------------------ ------------------ ------------------ ------------------ ------------------ ------------------ ------------------ ------------------ ------------------ ------------------ ------------------ --------------------0 0 0 0 0 0 0 0 0 0 0 0 0
========== ========== ========== ========== ========== ========== ========== ========== ========== ========== ===================== ============
640. COMBINED EMPLOYEE BENEFITS FUND
JULY 1, 2016 TO JUNE 30, 2027LONG TERM FINANCIAL PLAN
CITY OF SUNNYVALE
273

RESERVE/FUND BALANCE, JULY 1
CURRENT RESOURCES: Employee Leaves Miscellaneous PERS Public Safety PERS Workers' Compensation Insurance and Incentives Transfer From Other Funds Interest Income
TOTAL CURRENT RESOURCES
TOTAL AVAILABLE RESOURCES
CURRENT REQUIREMENTS: Employee Leave Benefits PERS Retirement Benefits Workers' Compensation Program Insurance Benefits Retiree Medical Transfer To OPEB Trust Additional Contribution To PERS Directors Home Mortgage Program
TOTAL CURRENT REQUIREMENTS
RESERVES: RESTRICTED: Employee Leaves PERS Rate Uncertainty Workers' Compensation Insurance Rate Uncertainty
TOTAL RESERVES
FUND BALANCE, JUNE 30
FY 2027/2028 FY 2016/2017TO TO
PLAN PLAN PLAN PLAN PLAN PLAN PLAN PLAN PLAN PLAN FY 2036/2037 FY 2036/20372027/2028 2028/2029 2029/2030 2030/2031 2031/2032 2032/2033 2033/2034 2034/2035 2035/2036 2036/2037 TOTAL TOTAL
------------------ ------------------ ------------------ ------------------ ------------------ ------------------ ------------------ ------------------ ------------------ -------------------- -------------------- --------------------21,499,625 22,231,363 22,749,621 23,149,946 22,878,326 21,486,907 21,314,737 21,923,264 22,152,269 22,629,778 21,499,625 17,398,661
------------------ ------------------ ------------------ ------------------ ------------------ ------------------ ------------------ ------------------ ------------------ -------------------- -------------------- --------------------
21,751,385 22,316,866 22,897,571 23,493,921 24,106,349 24,735,303 25,381,241 26,044,634 26,725,969 27,425,743 244,878,982 454,488,65534,019,841 35,380,635 36,795,860 37,531,777 27,773,515 28,051,250 28,051,250 27,770,738 27,493,030 26,668,240 309,536,137 592,729,40933,702,768 35,050,879 36,452,914 37,728,766 37,728,766 38,106,054 38,106,054 37,724,993 37,347,743 36,227,311 368,176,249 643,754,443
6,209,037 6,393,767 6,583,485 6,778,328 6,978,434 7,183,946 7,395,014 7,611,787 7,834,422 8,063,079 71,031,298 135,264,28538,012,570 38,772,821 39,936,006 41,134,086 42,368,109 44,910,195 47,155,705 49,041,933 51,003,610 53,043,755 445,378,790 776,667,014
0 0 0 0 0 0 0 0 0 0 0 800,0001,606,036 1,657,687 1,701,470 1,741,228 1,754,820 1,724,354 1,743,413 1,794,479 1,831,166 1,878,618 17,433,272 27,716,863
------------------ ------------------ ------------------ ------------------ ------------------ ------------------ ------------------ ------------------ ------------------ -------------------- -------------------- --------------------135,301,636 139,572,655 144,367,307 148,408,106 140,709,993 144,711,103 147,832,677 149,988,565 152,235,941 153,306,746 1,456,434,727 2,631,420,669
------------------ ------------------ ------------------ ------------------ ------------------ ------------------ ------------------ ------------------ ------------------ -------------------- -------------------- --------------------156,801,262 161,804,018 167,116,928 171,558,052 163,588,319 166,198,010 169,147,414 171,911,829 174,388,210 175,936,524 1,477,934,353 2,648,819,330
------------------ ------------------ ------------------ ------------------ ------------------ ------------------ ------------------ ------------------ ------------------ -------------------- -------------------- --------------------
22,497,436 23,085,299 23,689,056 24,309,151 24,946,036 25,600,181 26,272,065 26,962,183 27,671,044 28,399,170 253,431,620 467,926,57367,702,579 70,057,828 72,656,245 74,926,758 65,998,863 66,279,355 66,029,484 65,958,011 65,292,938 63,024,536 677,926,597 1,237,812,595
6,906,197 7,090,927 7,280,646 7,475,488 7,675,594 7,881,106 8,092,174 8,308,947 8,531,582 8,760,239 78,002,899 143,394,05624,390,687 25,509,344 26,681,035 27,908,329 29,193,919 30,540,631 31,951,427 33,429,419 34,977,867 36,600,196 301,182,854 508,791,72310,373,000 10,773,000 11,252,000 11,748,000 12,285,000 12,738,000 13,157,000 13,595,000 14,027,000 14,582,110 124,530,110 209,069,739
2,700,000 2,538,000 2,408,000 2,312,000 2,002,000 1,844,000 1,722,000 1,506,000 1,258,000 888,137 19,178,137 57,142,5080 0 0 0 0 0 0 0 0 0 0 00 0 0 0 0 0 0 0 0 0 0 1,000,000
------------------ ------------------ ------------------ ------------------ ------------------ ------------------ ------------------ ------------------ ------------------ -------------------- -------------------- --------------------134,569,899 139,054,397 143,966,982 148,679,725 142,101,412 144,883,273 147,224,150 149,759,560 151,758,432 152,254,388 1,454,252,217 2,625,137,195
------------------ ------------------ ------------------ ------------------ ------------------ ------------------ ------------------ ------------------ ------------------ -------------------- -------------------- --------------------
0 0 0 0 0 0 0 0 0 0 0 02,315,979 2,782,304 3,486,125 3,959,356 3,621,149 3,643,944 3,917,522 3,611,943 3,304,256 3,307,440 3,307,440 3,307,440
17,429,001 17,429,001 17,429,001 17,429,001 17,429,001 17,429,001 17,429,001 17,429,001 17,429,001 17,429,001 17,429,001 17,429,0012,486,383 2,538,316 2,234,820 1,489,969 436,758 241,792 576,742 1,111,326 1,896,522 2,945,695 2,945,695 2,945,695
------------------ ------------------ ------------------ ------------------ ------------------ ------------------ ------------------ ------------------ ------------------ -------------------- -------------------- --------------------22,231,363 22,749,621 23,149,946 22,878,326 21,486,907 21,314,737 21,923,264 22,152,269 22,629,778 23,682,136 23,682,136 23,682,136
------------------ ------------------ ------------------ ------------------ ------------------ ------------------ ------------------ ------------------ ------------------ -------------------- -------------------- --------------------0 0 0 0 0 0 0 0 0 0 0 0
========== ========== ========== ========== ========== ========== ========== ========== ========== ============ ============ ============
CITY OF SUNNYVALE
LONG TERM FINANCIAL PLANJULY 1, 2027 TO JUNE 30, 2037
640. COMBINED EMPLOYEE BENEFITS FUND
274
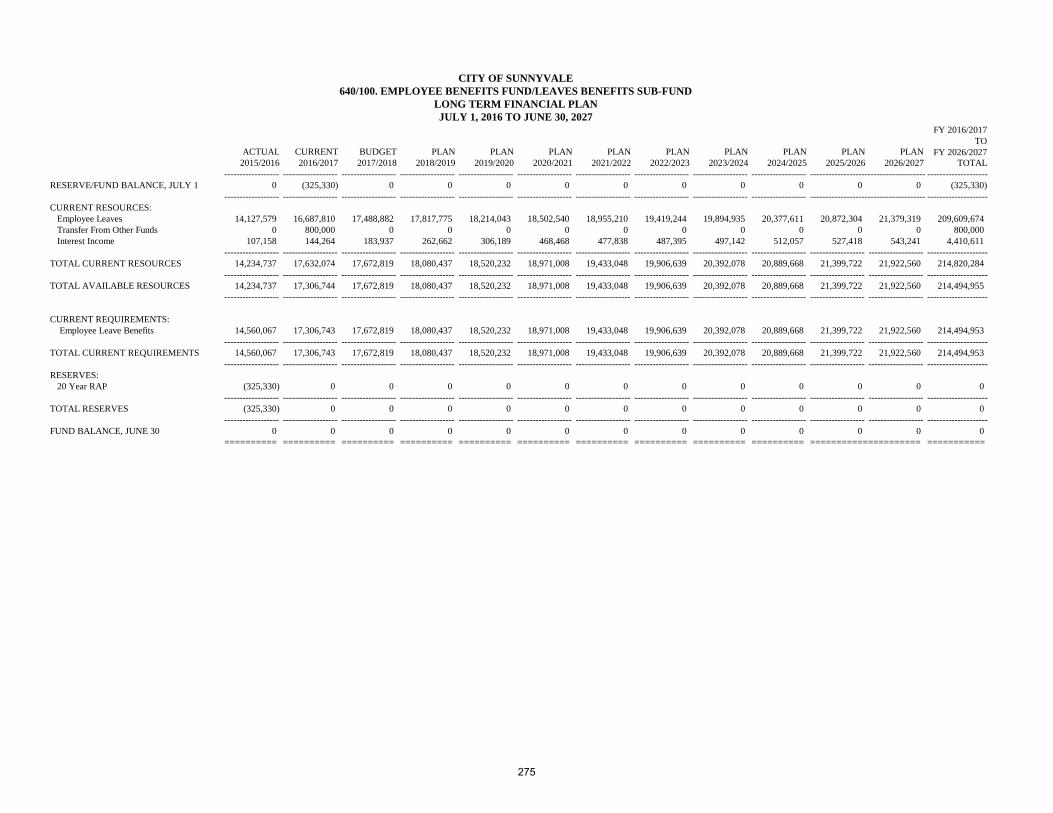
RESERVE/FUND BALANCE, JULY 1
CURRENT RESOURCES: Employee Leaves Transfer From Other Funds Interest Income
TOTAL CURRENT RESOURCES
TOTAL AVAILABLE RESOURCES
CURRENT REQUIREMENTS: Employee Leave Benefits
TOTAL CURRENT REQUIREMENTS
RESERVES: 20 Year RAP
TOTAL RESERVES
FUND BALANCE, JUNE 30
FY 2016/2017TO
ACTUAL CURRENT BUDGET PLAN PLAN PLAN PLAN PLAN PLAN PLAN PLAN PLAN FY 2026/20272015/2016 2016/2017 2017/2018 2018/2019 2019/2020 2020/2021 2021/2022 2022/2023 2023/2024 2024/2025 2025/2026 2026/2027 TOTAL
------------------ ------------------ ------------------ ------------------ ------------------ ------------------ ------------------ ------------------ ------------------ ------------------ -------------------------------------- --------------------0 (325,330) 0 0 0 0 0 0 0 0 0 0 (325,330)
------------------ ------------------ ------------------ ------------------ ------------------ ------------------ ------------------ ------------------ ------------------ ------------------ -------------------------------------- --------------------
14,127,579 16,687,810 17,488,882 17,817,775 18,214,043 18,502,540 18,955,210 19,419,244 19,894,935 20,377,611 20,872,304 21,379,319 209,609,6740 800,000 0 0 0 0 0 0 0 0 0 0 800,000
107,158 144,264 183,937 262,662 306,189 468,468 477,838 487,395 497,142 512,057 527,418 543,241 4,410,611------------------ ------------------ ------------------ ------------------ ------------------ ------------------ ------------------ ------------------ ------------------ ------------------ ------------------ ------------------ --------------------
14,234,737 17,632,074 17,672,819 18,080,437 18,520,232 18,971,008 19,433,048 19,906,639 20,392,078 20,889,668 21,399,722 21,922,560 214,820,284------------------ ------------------ ------------------ ------------------ ------------------ ------------------ ------------------ ------------------ ------------------ ------------------ ------------------ ------------------ ---------------------
14,234,737 17,306,744 17,672,819 18,080,437 18,520,232 18,971,008 19,433,048 19,906,639 20,392,078 20,889,668 21,399,722 21,922,560 214,494,955------------------ ------------------ ------------------ ------------------ ------------------ ------------------ ------------------ ------------------ ------------------ ------------------ ------------------ ------------------ --------------------
14,560,067 17,306,743 17,672,819 18,080,437 18,520,232 18,971,008 19,433,048 19,906,639 20,392,078 20,889,668 21,399,722 21,922,560 214,494,953------------------ ------------------ ------------------ ------------------ ------------------ ------------------ ------------------ ------------------ ------------------ ------------------ ------------------ ------------------ --------------------
14,560,067 17,306,743 17,672,819 18,080,437 18,520,232 18,971,008 19,433,048 19,906,639 20,392,078 20,889,668 21,399,722 21,922,560 214,494,953------------------ ------------------ ------------------ ------------------ ------------------ ------------------ ------------------ ------------------ ------------------ ------------------ ------------------ ------------------ --------------------
(325,330) 0 0 0 0 0 0 0 0 0 0 0 0------------------ ------------------ ------------------ ------------------ ------------------ ------------------ ------------------ ------------------ ------------------ ------------------ ------------------ ------------------ --------------------
(325,330) 0 0 0 0 0 0 0 0 0 0 0 0------------------ ------------------ ------------------ ------------------ ------------------ ------------------ ------------------ ------------------ ------------------ ------------------ ------------------ ------------------ --------------------
0 0 0 0 0 0 0 0 0 0 0 0 0========== ========== ========== ========== ========== ========== ========== ========== ========== ========== ===================== ===========
640/100. EMPLOYEE BENEFITS FUND/LEAVES BENEFITS SUB-FUND
JULY 1, 2016 TO JUNE 30, 2027LONG TERM FINANCIAL PLAN
CITY OF SUNNYVALE
275

RESERVE/FUND BALANCE, JULY 1
CURRENT RESOURCES: Employee Leaves Transfer From Other Funds Interest Income
TOTAL CURRENT RESOURCES
TOTAL AVAILABLE RESOURCES
CURRENT REQUIREMENTS: Employee Leave Benefits
TOTAL CURRENT REQUIREMENTS
RESERVES: 20 Year RAP
TOTAL RESERVES
FUND BALANCE, JUNE 30
FY 2027/2028 FY 2016/2017TO TO
PLAN PLAN PLAN PLAN PLAN PLAN PLAN PLAN PLAN PLAN FY 2036/2037 FY 2036/20372027/2028 2028/2029 2029/2030 2030/2031 2031/2032 2032/2033 2033/2034 2034/2035 2035/2036 2036/2037 TOTAL TOTAL
------------------ ------------------ ------------------ ------------------ ------------------ ------------------ ------------------ ------------------ ------------------ ------------------ -------------------- --------------------0 0 0 0 0 0 0 0 0 0 0 (325,330)
------------------ ------------------ ------------------ ------------------ ------------------ ------------------ ------------------ ------------------ ------------------ ------------------ -------------------- --------------------
21,751,385 22,316,866 22,897,571 23,493,921 24,106,349 24,735,303 25,381,241 26,044,634 26,725,969 27,425,743 244,878,982 454,488,6550 0 0 0 0 0 0 0 0 0 0 800,000
746,051 768,433 791,486 815,230 839,687 864,878 890,824 917,549 945,075 973,427 8,552,639 12,963,249------------------ ------------------ ------------------ ------------------ ------------------ ------------------ ------------------ ------------------ ------------------ ------------------ -------------------- --------------------
22,497,436 23,085,299 23,689,056 24,309,151 24,946,036 25,600,181 26,272,065 26,962,183 27,671,044 28,399,170 253,431,620 468,251,904------------------ ------------------ ------------------ ------------------ ------------------ ------------------ ------------------ ------------------ ------------------ ------------------ -------------------- --------------------
22,497,436 23,085,299 23,689,056 24,309,151 24,946,036 25,600,181 26,272,065 26,962,183 27,671,044 28,399,170 253,431,620 467,926,575------------------ ------------------ ------------------ ------------------ ------------------ ------------------ ------------------ ------------------ ------------------ ------------------ -------------------- --------------------
22,497,436 23,085,299 23,689,056 24,309,151 24,946,036 25,600,181 26,272,065 26,962,183 27,671,044 28,399,170 253,431,620 467,926,573------------------ ------------------ ------------------ ------------------ ------------------ ------------------ ------------------ ------------------ ------------------ ------------------ -------------------- --------------------
22,497,436 23,085,299 23,689,056 24,309,151 24,946,036 25,600,181 26,272,065 26,962,183 27,671,044 28,399,170 253,431,620 467,926,573------------------ ------------------ ------------------ ------------------ ------------------ ------------------ ------------------ ------------------ ------------------ ------------------ -------------------- --------------------
0 0 0 0 0 0 0 0 0 0 0 0------------------ ------------------ ------------------ ------------------ ------------------ ------------------ ------------------ ------------------ ------------------ ------------------ -------------------- --------------------
0 0 0 0 0 0 0 0 0 0 0 0------------------ ------------------ ------------------ ------------------ ------------------ ------------------ ------------------ ------------------ ------------------ ------------------ -------------------- --------------------
0 0 0 0 0 0 0 0 0 0 0 0========== ========== ========== ========== ========== ========== ========== ========== ========== ========== =========== ===========
CITY OF SUNNYVALE640/100. EMPLOYEE BENEFITS FUND/LEAVES BENEFITS SUB-FUND
LONG TERM FINANCIAL PLANJULY 1, 2027 TO JUNE 30, 2037
276

RESERVE/FUND BALANCE, JULY 1
CURRENT RESOURCES: Miscellaneous PERS Public Safety PERS Interest Income
TOTAL CURRENT RESOURCES
TOTAL AVAILABLE RESOURCES
CURRENT REQUIREMENTS:
Miscellaneous PERS Normal Contribution Unfunded Actuarial Accrued Liabilities Employer Paid Member Contribution
Subtotal: Miscellaneous Contribution
Public Safety PERS Normal Contribution Unfunded Actuarial Accrued Liabilities Employer Paid Member Contribution
Subtotal: Safety Contribution
Additional Contribution to PERS
TOTAL CURRENT REQUIREMENTS
RESERVES: PERS Rate Uncertainty
TOTAL RESERVES
FUND BALANCE, JUNE 30
FY 2016/2017TO
ACTUAL CURRENT BUDGET PLAN PLAN PLAN PLAN PLAN PLAN PLAN PLAN PLAN FY 2026/20272015/2016 2016/2017 2017/2018 2018/2019 2019/2020 2020/2021 2021/2022 2022/2023 2023/2024 2024/2025 2025/2026 2026/2027 TOTAL
------------------ ------------------ ------------------ ------------------ ------------------ ------------------ ------------------ ------------------ ------------------ ------------------ ------------------------------------- --------------------3,099,307 2,315,188 1,689,432 2,189,570 2,766,140 3,353,474 4,043,491 3,930,665 3,967,013 3,764,093 3,568,104 3,091,812 2,315,188
------------------ ------------------ ------------------ ------------------ ------------------ ------------------ ------------------ ------------------ ------------------ ------------------ ------------------------------------- --------------------
16,283,275 17,013,264 19,139,922 21,245,313 23,263,618 25,124,707 26,380,943 27,831,894 28,945,170 30,392,429 31,456,164 32,399,849 283,193,27214,699,590 16,156,442 17,852,869 19,905,949 21,996,073 23,975,720 25,654,020 27,706,342 28,814,595 30,255,325 31,162,985 32,097,875 275,578,195
20,188 23,152 21,118 38,317 55,323 100,604 121,305 117,920 119,010 112,923 142,724 154,591 1,006,987------------------ ------------------ ------------------ ------------------ ------------------ ------------------ ------------------ ------------------ ------------------ ------------------ ------------------ ------------------ --------------------
31,003,053 33,192,858 37,013,908 41,189,579 45,315,014 49,201,031 52,156,267 55,656,156 57,878,776 60,760,677 62,761,873 64,652,314 559,778,453------------------ ------------------ ------------------ ------------------ ------------------ ------------------ ------------------ ------------------ ------------------ ------------------ ------------------ ------------------ --------------------
34,102,360 35,508,046 38,703,340 43,379,149 48,081,154 52,554,505 56,199,758 59,586,821 61,845,789 64,524,769 66,329,977 67,744,126 562,093,641------------------ ------------------ ------------------ ------------------ ------------------ ------------------ ------------------ ------------------ ------------------ ------------------ ------------------ ------------------ --------------------
5,595,672 5,979,816 5,978,294 6,292,958 6,585,399 7,161,395 7,084,124 7,131,113 7,279,988 7,314,668 7,353,944 7,380,036 75,541,7358,324,946 9,182,835 10,730,322 12,519,003 14,327,608 15,671,662 17,652,522 19,306,105 20,430,129 21,895,917 23,026,330 24,214,189 188,956,6232,049,585 2,167,547 2,224,796 2,162,950 2,129,475 2,094,253 2,020,833 1,950,990 1,877,543 1,801,487 1,727,068 1,645,693 21,802,635
------------------ ------------------ ------------------ ------------------ ------------------ ------------------ ------------------ ------------------ ------------------ ------------------ ------------------ ------------------ --------------------15,970,204 17,330,199 18,933,412 20,974,911 23,042,482 24,927,309 26,757,479 28,388,208 29,587,661 31,012,072 32,107,341 33,239,919 286,300,993
------------------ ------------------ ------------------ ------------------ ------------------ ------------------ ------------------ ------------------ ------------------ ------------------ ------------------ ------------------ --------------------
5,593,482 6,230,804 6,291,725 6,658,152 7,001,700 7,637,494 7,716,054 7,895,721 8,186,346 8,333,801 8,482,522 8,616,970 83,051,2906,341,875 7,796,660 8,753,854 10,453,188 12,180,223 13,476,835 15,335,372 16,899,207 17,903,543 19,253,566 20,340,323 21,429,502 163,822,2722,481,611 2,460,950 2,534,779 2,526,758 2,503,275 2,469,377 2,460,189 2,436,672 2,404,147 2,357,227 2,307,978 2,250,092 26,711,443
------------------ ------------------ ------------------ ------------------ ------------------ ------------------ ------------------ ------------------ ------------------ ------------------ ------------------ ------------------ --------------------14,416,968 16,488,415 17,580,358 19,638,098 21,685,198 23,583,705 25,511,614 27,231,600 28,494,036 29,944,594 31,130,823 32,296,564 273,585,005
------------------ ------------------ ------------------ ------------------ ------------------ ------------------ ------------------ ------------------ ------------------ ------------------ ------------------ ------------------ --------------------1,400,000 0 0 0 0 0 0 0 0 0 0 0 0
------------------ ------------------ ------------------ ------------------ ------------------ ------------------ ------------------ ------------------ ------------------ ------------------ ------------------ ------------------ --------------------31,787,172 33,818,614 36,513,770 40,613,009 44,727,680 48,511,014 52,269,093 55,619,808 58,081,697 60,956,665 63,238,165 65,536,483 559,885,998
------------------ ------------------ ------------------ ------------------ ------------------ ------------------ ------------------ ------------------ ------------------ ------------------ ------------------ ------------------ --------------------
2,315,188 1,689,432 2,189,570 2,766,140 3,353,474 4,043,491 3,930,665 3,967,013 3,764,093 3,568,104 3,091,812 2,207,643 2,207,643------------------ ------------------ ------------------ ------------------ ------------------ ------------------ ------------------ ------------------ ------------------ ------------------ ------------------ ------------------ --------------------
2,315,188 1,689,432 2,189,570 2,766,140 3,353,474 4,043,491 3,930,665 3,967,013 3,764,093 3,568,104 3,091,812 2,207,643 2,207,643------------------ ------------------ ------------------ ------------------ ------------------ ------------------ ------------------ ------------------ ------------------ ------------------ ------------------ ------------------ --------------------
0 0 0 0 0 0 0 0 0 0 0 0 0========== ========== ========== ========== ========== ========== ========== ========== ========== ========== ===================== ===========
640/200. EMPLOYEE BENEFITS FUND/RETIREMENT BENEFITS SUB-FUND
JULY 1, 2016 TO JUNE 30, 2027LONG TERM FINANCIAL PLAN
CITY OF SUNNYVALE
277

RESERVE/FUND BALANCE, JULY 1
CURRENT RESOURCES: Miscellaneous PERS Public Safety PERS Interest Income
TOTAL CURRENT RESOURCES
TOTAL AVAILABLE RESOURCES
CURRENT REQUIREMENTS:
Miscellaneous PERS Normal Contribution Unfunded Actuarial Accrued Liabilities Employer Paid Member Contribution
Subtotal: Miscellaneous Contribution
Public Safety PERS Normal Contribution Unfunded Actuarial Accrued Liabilities Employer Paid Member Contribution
Subtotal: Safety Contribution
Additional Contribution to PERS
TOTAL CURRENT REQUIREMENTS
RESERVES: PERS Rate Uncertainty
TOTAL RESERVES
FUND BALANCE, JUNE 30
FY 2027/2028 FY 2016/2017TO TO
PLAN PLAN PLAN PLAN PLAN PLAN PLAN PLAN PLAN PLAN FY 2036/2037 FY 2036/20372027/2028 2028/2029 2029/2030 2030/2031 2031/2032 2032/2033 2033/2034 2034/2035 2035/2036 2036/2037 TOTAL TOTAL
------------------ ------------------ ------------------ ------------------ ------------------ ------------------ ------------------ ------------------ ------------------ ------------------ -------------------- --------------------2,207,643 2,315,979 2,782,304 3,486,125 3,959,356 3,621,149 3,643,944 3,917,522 3,611,943 3,304,256 2,207,643 2,315,188
------------------ ------------------ ------------------ ------------------ ------------------ ------------------ ------------------ ------------------ ------------------ ------------------ -------------------- --------------------
34,019,841 35,380,635 36,795,860 37,531,777 27,773,515 28,051,250 28,051,250 27,770,738 27,493,030 26,668,240 309,536,137 592,729,40933,702,768 35,050,879 36,452,914 37,728,766 37,728,766 38,106,054 38,106,054 37,724,993 37,347,743 36,227,311 368,176,249 643,754,443
88,306 92,639 111,292 139,445 158,374 144,846 145,758 156,701 144,478 132,170 1,314,009 2,320,996------------------ ------------------ ------------------ ------------------ ------------------ ------------------ ------------------ ------------------ ------------------ ------------------ -------------------- --------------------
67,810,915 70,524,153 73,360,066 75,399,988 65,660,656 66,302,150 66,303,062 65,652,432 64,985,251 63,027,721 679,026,394 1,238,804,848------------------ ------------------ ------------------ ------------------ ------------------ ------------------ ------------------ ------------------ ------------------ ------------------ -------------------- --------------------
70,018,558 72,840,131 76,142,370 78,886,113 69,620,011 69,923,299 69,947,005 69,569,954 68,597,194 66,331,976 681,234,037 1,241,120,035------------------ ------------------ ------------------ ------------------ ------------------ ------------------ ------------------ ------------------ ------------------ ------------------ -------------------- --------------------
7,416,748 7,455,789 7,502,219 7,551,848 7,605,960 7,570,970 7,632,653 7,697,182 7,766,226 7,844,501 76,044,097 151,585,83225,304,355 26,550,172 27,940,585 29,080,859 18,986,428 18,930,607 18,684,963 18,498,271 17,878,844 16,404,415 218,259,498 407,216,121
1,568,995 1,492,909 1,419,839 1,347,728 1,277,156 1,205,199 1,136,198 1,067,901 1,001,061 938,723 12,455,709 34,258,344------------------ ------------------ ------------------ ------------------ ------------------ ------------------ ------------------ ------------------ ------------------ ------------------ -------------------- --------------------
34,290,098 35,498,870 36,862,644 37,980,435 27,869,544 27,706,777 27,453,813 27,263,354 26,646,131 25,187,638 306,759,304 593,060,297------------------ ------------------ ------------------ ------------------ ------------------ ------------------ ------------------ ------------------ ------------------ ------------------ -------------------- --------------------
8,735,493 8,841,223 8,950,770 9,053,865 9,163,706 9,163,419 9,280,684 9,401,368 9,529,628 9,640,087 91,760,242 174,811,53122,493,894 23,608,843 24,807,066 25,933,793 27,081,781 27,600,156 27,560,168 27,632,410 27,528,291 26,689,294 260,935,697 424,757,969
2,183,094 2,108,892 2,035,765 1,958,664 1,883,832 1,809,003 1,734,819 1,660,879 1,588,889 1,507,517 18,471,354 45,182,797------------------ ------------------ ------------------ ------------------ ------------------ ------------------ ------------------ ------------------ ------------------ ------------------ -------------------- --------------------
33,412,481 34,558,958 35,793,601 36,946,322 38,129,319 38,572,578 38,575,671 38,694,657 38,646,808 37,836,898 371,167,293 644,752,298------------------ ------------------ ------------------ ------------------ ------------------ ------------------ ------------------ ------------------ ------------------ ------------------ -------------------- --------------------
0 0 0 0 0 0 0 0 0 0 0 0------------------ ------------------ ------------------ ------------------ ------------------ ------------------ ------------------ ------------------ ------------------ ------------------ -------------------- --------------------
67,702,579 70,057,828 72,656,245 74,926,758 65,998,863 66,279,355 66,029,484 65,958,011 65,292,938 63,024,536 677,926,597 1,237,812,595------------------ ------------------ ------------------ ------------------ ------------------ ------------------ ------------------ ------------------ ------------------ ------------------ -------------------- --------------------
2,315,979 2,782,304 3,486,125 3,959,356 3,621,149 3,643,944 3,917,522 3,611,943 3,304,256 3,307,440 3,307,440 3,307,440------------------ ------------------ ------------------ ------------------ ------------------ ------------------ ------------------ ------------------ ------------------ ------------------ -------------------- --------------------
2,315,979 2,782,304 3,486,125 3,959,356 3,621,149 3,643,944 3,917,522 3,611,943 3,304,256 3,307,440 3,307,440 3,307,440------------------ ------------------ ------------------ ------------------ ------------------ ------------------ ------------------ ------------------ ------------------ ------------------ -------------------- --------------------
0 0 0 0 0 0 0 0 0 0 0 0========== ========== ========== ========== ========== ========== ========== ========== ========== ========== =========== ===========
640/200. EMPLOYEE BENEFITS FUND/RETIREMENT BENEFITS SUB-FUND
JULY 1, 2027 TO JUNE 30, 2037LONG TERM FINANCIAL PLAN
CITY OF SUNNYVALE
278

RESERVE/FUND BALANCE, JULY 1
CURRENT RESOURCES: Workers' Compensation Interest Income
TOTAL CURRENT RESOURCES
TOTAL AVAILABLE RESOURCES
CURRENT REQUIREMENTS: Workers' Compensation Claims Workers' Compensation Leaves Workers' Compensation Insurance Claims Administration
TOTAL CURRENT REQUIREMENTS
RESERVES: RESTRICTED: Workers' Compensation
TOTAL RESERVES
FUND BALANCE, JUNE 30
FY 2016/2017TO
ACTUAL CURRENT BUDGET PLAN PLAN PLAN PLAN PLAN PLAN PLAN PLAN PLAN FY 2026/20272015/2016 2016/2017 2017/2018 2018/2019 2019/2020 2020/2021 2021/2022 2022/2023 2023/2024 2024/2025 2025/2026 2026/2027 TOTAL
------------------ ------------------ ------------------ ------------------ ------------------ ------------------ ------------------ ------------------ ------------------ ------------------ ------------------------------------- --------------------13,208,759 14,151,276 13,231,523 14,071,018 14,910,514 15,750,009 16,589,505 17,429,000 17,429,000 17,429,000 17,429,000 17,429,000 14,151,276
------------------ ------------------ ------------------ ------------------ ------------------ ------------------ ------------------ ------------------ ------------------ ------------------ ------------------ ------------------ --------------------
4,665,847 4,024,084 6,056,047 6,114,171 6,204,161 6,175,701 6,300,130 5,549,368 5,706,066 5,866,841 6,032,970 6,203,448 64,232,987107,556 141,513 165,394 246,243 298,210 472,500 497,685 522,870 522,870 522,870 522,870 522,870 4,435,895
------------------ ------------------ ------------------ ------------------ ------------------ ------------------ ------------------ ------------------ ------------------ ------------------ ------------------ ------------------ --------------------4,773,403 4,165,597 6,221,441 6,360,414 6,502,371 6,648,201 6,797,816 6,072,238 6,228,936 6,389,711 6,555,840 6,726,319 68,668,882
------------------ ------------------ ------------------ ------------------ ------------------ ------------------ ------------------ ------------------ ------------------ ------------------ ------------------ ------------------ --------------------17,982,162 18,316,873 19,452,964 20,431,432 21,412,885 22,398,210 23,387,321 23,501,238 23,657,936 23,818,711 23,984,840 24,155,319 82,820,158
------------------ ------------------ ------------------ ------------------ ------------------ ------------------ ------------------ ------------------ ------------------ ------------------ ------------------ ------------------ --------------------
2,057,830 3,078,976 3,265,629 3,347,270 3,430,952 3,516,726 3,604,644 3,694,760 3,787,129 3,881,807 3,978,852 4,078,324 39,665,068693,175 809,024 877,371 901,798 927,554 954,057 981,328 1,009,390 1,038,266 1,067,980 1,098,556 1,130,019 10,795,343661,133 766,000 788,980 808,705 828,922 849,645 870,886 892,658 914,975 937,849 961,296 985,328 9,605,244418,748 431,350 449,966 463,145 475,448 488,277 501,462 475,430 488,566 502,075 517,137 532,647 5,325,502
------------------ ------------------ ------------------ ------------------ ------------------ ------------------ ------------------ ------------------ ------------------ ------------------ ------------------ ------------------ --------------------3,830,886 5,085,350 5,381,946 5,520,918 5,662,876 5,808,705 5,958,321 6,072,238 6,228,936 6,389,711 6,555,840 6,726,318 65,391,158
------------------ ------------------ ------------------ ------------------ ------------------ ------------------ ------------------ ------------------ ------------------ ------------------ ------------------ ------------------ --------------------
14,151,276 13,231,523 14,071,018 14,910,514 15,750,009 16,589,505 17,429,000 17,429,000 17,429,000 17,429,000 17,429,000 17,429,001 17,429,001------------------ ------------------ ------------------ ------------------ ------------------ ------------------ ------------------ ------------------ ------------------ ------------------ ------------------ ------------------ --------------------
14,151,276 13,231,523 14,071,018 14,910,514 15,750,009 16,589,505 17,429,000 17,429,000 17,429,000 17,429,000 17,429,000 17,429,001 17,429,001------------------ ------------------ ------------------ ------------------ ------------------ ------------------ ------------------ ------------------ ------------------ ------------------ ------------------ ------------------ --------------------
0 0 0 0 0 0 0 0 0 0 0 0 0========== ========== ========== ========== ========== ========== ========== ========== ========== ========== ===================== ===========
640/300. EMPLOYEE BENEFITS FUND/WORKERS' COMPENSATION SUB-FUND
JULY 1, 2016 TO JUNE 30, 2027LONG TERM FINANCIAL PLAN
CITY OF SUNNYVALE
279

RESERVE/FUND BALANCE, JULY 1
CURRENT RESOURCES: Workers' Compensation Interest Income
TOTAL CURRENT RESOURCES
TOTAL AVAILABLE RESOURCES
CURRENT REQUIREMENTS: Workers' Compensation Claims Workers' Compensation Leaves Workers' Compensation Insurance Claims Administration
TOTAL CURRENT REQUIREMENTS
RESERVES: RESTRICTED: Workers' Compensation
TOTAL RESERVES
FUND BALANCE, JUNE 30
FY 2027/2028 FY 2016/2017TO TO
PLAN PLAN PLAN PLAN PLAN PLAN PLAN PLAN PLAN PLAN FY 2036/2037 FY 2036/20372027/2028 2028/2029 2029/2030 2030/2031 2031/2032 2032/2033 2033/2034 2034/2035 2035/2036 2036/2037 TOTAL TOTAL
------------------ ------------------ ------------------ ------------------ ------------------ ------------------ ------------------ ------------------ ------------------ ------------------ -------------------- --------------------17,429,001 17,429,001 17,429,001 17,429,001 17,429,001 17,429,001 17,429,001 17,429,001 17,429,001 17,429,001 17,429,001 14,151,276
------------------ ------------------ ------------------ ------------------ ------------------ ------------------ ------------------ ------------------ ------------------ ------------------ -------------------- --------------------
6,209,037 6,393,767 6,583,485 6,778,328 6,978,434 7,183,946 7,395,014 7,611,787 7,834,422 8,063,079 71,031,298 135,264,285697,160 697,160 697,160 697,160 697,160 697,160 697,160 697,160 697,160 697,160 6,971,600 11,407,496
------------------ ------------------ ------------------ ------------------ ------------------ ------------------ ------------------ ------------------ ------------------ ------------------ -------------------- --------------------6,906,197 7,090,927 7,280,646 7,475,488 7,675,594 7,881,106 8,092,174 8,308,947 8,531,582 8,760,239 78,002,899 146,671,781
------------------ ------------------ ------------------ ------------------ ------------------ ------------------ ------------------ ------------------ ------------------ ------------------ -------------------- --------------------24,335,198 24,519,928 24,709,647 24,904,489 25,104,595 25,310,107 25,521,175 25,737,948 25,960,583 26,189,240 95,431,900 160,823,056
------------------ ------------------ ------------------ ------------------ ------------------ ------------------ ------------------ ------------------ ------------------ ------------------ -------------------- --------------------
4,180,282 4,284,789 4,391,908 4,501,706 4,614,249 4,729,605 4,847,845 4,969,041 5,093,267 5,220,599 46,833,292 86,498,3601,162,397 1,195,715 1,230,001 1,265,283 1,301,591 1,338,955 1,377,406 1,416,975 1,457,697 1,499,603 13,245,622 24,040,9651,014,888 1,045,334 1,076,694 1,108,995 1,142,265 1,176,533 1,211,829 1,248,184 1,285,629 1,324,198 11,634,551 21,239,795
548,631 565,089 582,042 599,503 617,488 636,013 655,094 674,746 694,989 715,838 6,289,434 11,614,936------------------ ------------------ ------------------ ------------------ ------------------ ------------------ ------------------ ------------------ ------------------ ------------------ -------------------- --------------------
6,906,197 7,090,927 7,280,646 7,475,488 7,675,594 7,881,106 8,092,174 8,308,947 8,531,582 8,760,239 78,002,899 143,394,056------------------ ------------------ ------------------ ------------------ ------------------ ------------------ ------------------ ------------------ ------------------ ------------------ -------------------- --------------------
17,429,001 17,429,001 17,429,001 17,429,001 17,429,001 17,429,001 17,429,001 17,429,001 17,429,001 17,429,001 17,429,001 17,429,001------------------ ------------------ ------------------ ------------------ ------------------ ------------------ ------------------ ------------------ ------------------ ------------------ -------------------- --------------------
17,429,001 17,429,001 17,429,001 17,429,001 17,429,001 17,429,001 17,429,001 17,429,001 17,429,001 17,429,001 17,429,001 17,429,001------------------ ------------------ ------------------ ------------------ ------------------ ------------------ ------------------ ------------------ ------------------ ------------------ -------------------- --------------------
0 0 0 0 0 0 0 0 0 0 0 0========== ========== ========== ========== ========== ========== ========== ========== ========== ========== =========== ===========
CITY OF SUNNYVALE
LONG TERM FINANCIAL PLANJULY 1, 2027 TO JUNE 30, 2037
640/300. EMPLOYEE BENEFITS FUND/WORKERS' COMPENSATION SUB-FUND
280

RESERVE/FUND BALANCE, JULY 1
CURRENT RESOURCES: Insurance and Incentives Interest Income
TOTAL CURRENT RESOURCES
TOTAL AVAILABLE RESOURCES
CURRENT REQUIREMENTS: Medical Insurance - Active Employees Medical Insurance - Retirees Dental Insurance Benefits Medicare Payments Other Insurance Benefits Transfer To OPEB Trust Home Loan Program
TOTAL CURRENT REQUIREMENTS
RESERVES: Insurance Rate Uncertainty
TOTAL RESERVES
FUND BALANCE, JUNE 30
FY 2016/2017TO
ACTUAL CURRENT BUDGET PLAN PLAN PLAN PLAN PLAN PLAN PLAN PLAN PLAN FY 2026/20272015/2016 2016/2017 2017/2018 2018/2019 2019/2020 2020/2021 2021/2022 2022/2023 2023/2024 2024/2025 2025/2026 2026/2027 TOTAL
------------------ ------------------ ------------------ ------------------ ------------------ ------------------ ------------------ ------------------ ------------------------------------- ------------------------------------- --------------------923,818 1,257,529 2,861,810 2,855,198 2,784,846 2,399,610 1,919,037 1,363,182 831,493 635,991 745,772 1,307,818 1,257,529
------------------ ------------------ ------------------ ------------------ ------------------ ------------------ ------------------ ------------------ ------------------ ------------------ ------------------------------------- --------------------
24,331,149 26,457,666 26,457,666 26,457,666 27,251,396 28,068,938 29,191,695 30,359,363 31,877,331 33,471,198 35,144,758 36,550,548 331,288,2248,793 12,575 35,773 49,966 55,697 71,988 57,571 40,895 24,945 19,080 22,373 39,235 430,098
------------------ ------------------ ------------------ ------------------ ------------------ ------------------ ------------------ ------------------ ------------------ ------------------ ------------------ ------------------ --------------------24,339,942 26,470,241 26,493,438 26,507,632 27,307,093 28,140,926 29,249,266 30,400,258 31,902,276 33,490,277 35,167,131 36,589,782 331,718,322
------------------ ------------------ ------------------ ------------------ ------------------ ------------------ ------------------ ------------------ ------------------ ------------------ ------------------ ------------------ --------------------25,263,760 27,727,770 29,355,248 29,362,829 30,091,938 30,540,536 31,168,303 31,763,441 32,733,769 34,126,269 35,912,902 37,897,600 332,975,850
------------------ ------------------ ------------------ ------------------ ------------------ ------------------ ------------------ ------------------ ------------------ ------------------ ------------------ ------------------ --------------------
10,654,298 11,186,779 11,691,867 12,490,271 13,264,810 13,901,841 14,596,933 15,326,780 16,093,119 16,897,775 17,742,664 18,629,797 161,822,6365,403,913 5,437,629 5,976,000 6,403,000 6,855,000 7,287,000 7,636,000 8,082,000 8,522,000 8,984,000 9,464,000 9,893,000 84,539,6291,012,191 991,086 1,009,744 1,034,988 1,060,862 1,087,384 1,114,568 1,142,433 1,170,993 1,200,268 1,230,275 1,261,032 12,303,6341,356,038 1,411,222 1,481,783 1,518,827 1,556,798 1,595,718 1,635,611 1,676,501 1,718,414 1,761,374 1,805,408 1,850,544 18,012,1991,159,691 1,202,873 1,281,657 1,311,898 1,342,858 1,374,556 1,407,008 1,440,234 1,474,252 1,509,080 1,544,738 1,581,246 15,470,4004,420,100 4,636,371 4,059,000 3,819,000 3,612,000 3,375,000 3,415,000 3,264,000 3,119,000 3,028,000 2,818,000 2,819,000 37,964,371
0 0 1,000,000 0 0 0 0 0 0 0 0 0 1,000,000------------------ ------------------ ------------------ ------------------ ------------------ ------------------ ------------------ ------------------ ------------------ ------------------ ------------------ ------------------ --------------------
24,006,231 24,865,960 26,500,051 26,577,984 27,692,329 28,621,499 29,805,121 30,931,948 32,097,778 33,380,497 34,605,085 36,034,619 331,112,869------------------ ------------------ ------------------ ------------------ ------------------ ------------------ ------------------ ------------------ ------------------ ------------------ ------------------ ------------------ --------------------
1,257,529 2,861,810 2,855,198 2,784,846 2,399,610 1,919,037 1,363,182 831,493 635,991 745,772 1,307,818 1,862,981 1,862,981------------------ ------------------ ------------------ ------------------ ------------------ ------------------ ------------------ ------------------ ------------------ ------------------ ------------------ ------------------ --------------------
1,257,529 2,861,810 2,855,198 2,784,846 2,399,610 1,919,037 1,363,182 831,493 635,991 745,772 1,307,818 1,862,981 1,862,981------------------ ------------------ ------------------ ------------------ ------------------ ------------------ ------------------ ------------------ ------------------ ------------------ ------------------ ------------------ --------------------
0 0 0 0 0 0 0 0 0 0 0 0 0========== ========== ========== ========== ========== ========== ========== ========== ========== ========== ===================== ===========
CITY OF SUNNYVALE
LONG TERM FINANCIAL PLANJULY 1, 2016 TO JUNE 30, 2027
640/400. EMPLOYEE BENEFITS FUND/INSURANCE & OTHER BENEFITS SUB-FUND
281

RESERVE/FUND BALANCE, JULY 1
CURRENT RESOURCES: Insurance and Incentives Interest Income
TOTAL CURRENT RESOURCES
TOTAL AVAILABLE RESOURCES
CURRENT REQUIREMENTS: Medical Insurance - Active Employees Medical Insurance - Retirees Dental Insurance Benefits Medicare Payments Other Insurance Benefits Transfer To OPEB Trust Home Loan Program
TOTAL CURRENT REQUIREMENTS
RESERVES: Insurance Rate Uncertainty
TOTAL RESERVES
FUND BALANCE, JUNE 30
FY 2027/2028 FY 2016/2017TO TO
PLAN PLAN PLAN PLAN PLAN PLAN PLAN PLAN PLAN PLAN FY 2036/2037 FY 2036/20372027/2028 2028/2029 2029/2030 2030/2031 2031/2032 2032/2033 2033/2034 2034/2035 2035/2036 2036/2037 TOTAL TOTAL
------------------ ------------------ ------------------ ------------------ ------------------ ------------------ ------------------ ------------------ ------------------ ------------------ -------------------- --------------------1,862,981 2,486,383 2,538,316 2,234,820 1,489,969 436,758 241,792 576,742 1,111,326 1,896,522 1,862,981 1,257,529
------------------ ------------------ ------------------ ------------------ ------------------ ------------------ ------------------ ------------------ ------------------ ------------------ -------------------- --------------------
38,012,570 38,772,821 39,936,006 41,134,086 42,368,109 44,910,195 47,155,705 49,041,933 51,003,610 53,043,755 445,378,790 776,667,01474,519 99,455 101,533 89,393 59,599 17,470 9,672 23,070 44,453 75,861 595,024 1,025,122
------------------ ------------------ ------------------ ------------------ ------------------ ------------------ ------------------ ------------------ ------------------ ------------------ -------------------- --------------------38,087,089 38,872,277 40,037,539 41,223,479 42,427,707 44,927,665 47,165,377 49,065,003 51,048,063 53,119,616 445,973,814 777,692,136
------------------ ------------------ ------------------ ------------------ ------------------ ------------------ ------------------ ------------------ ------------------ ------------------ -------------------- --------------------39,950,071 41,358,660 42,575,855 43,458,299 43,917,677 45,364,423 47,407,169 49,641,744 52,159,389 55,016,137 447,836,796 778,949,665
------------------ ------------------ ------------------ ------------------ ------------------ ------------------ ------------------ ------------------ ------------------ ------------------ -------------------- --------------------
19,561,287 20,539,351 21,566,319 22,644,634 23,776,866 24,965,709 26,213,995 27,524,695 28,900,929 30,345,976 246,039,761 407,862,39810,373,000 10,773,000 11,252,000 11,748,000 12,285,000 12,738,000 13,157,000 13,595,000 14,027,000 14,582,110 124,530,110 209,069,739
1,298,863 1,337,829 1,377,964 1,419,303 1,461,882 1,505,738 1,550,910 1,597,437 1,645,361 1,694,721 14,890,007 27,193,6401,906,060 1,963,242 2,022,139 2,082,803 2,145,287 2,209,646 2,275,935 2,344,213 2,414,540 2,486,976 21,850,840 39,863,0401,624,478 1,668,922 1,714,614 1,761,589 1,809,884 1,859,537 1,910,587 1,963,073 2,017,038 2,072,523 18,402,246 33,872,6452,700,000 2,538,000 2,408,000 2,312,000 2,002,000 1,844,000 1,722,000 1,506,000 1,258,000 888,137 19,178,137 57,142,508
0 0 0 0 0 0 0 0 0 0 0 1,000,000------------------ ------------------ ------------------ ------------------ ------------------ ------------------ ------------------ ------------------ ------------------ ------------------ -------------------- --------------------
37,463,687 38,820,344 40,341,035 41,968,329 43,480,919 45,122,631 46,830,427 48,530,419 50,262,867 52,070,442 444,891,101 776,003,970------------------ ------------------ ------------------ ------------------ ------------------ ------------------ ------------------ ------------------ ------------------ ------------------ -------------------- --------------------
2,486,383 2,538,316 2,234,820 1,489,969 436,758 241,792 576,742 1,111,326 1,896,522 2,945,695 2,945,695 2,945,695------------------ ------------------ ------------------ ------------------ ------------------ ------------------ ------------------ ------------------ ------------------ ------------------ -------------------- --------------------
2,486,383 2,538,316 2,234,820 1,489,969 436,758 241,792 576,742 1,111,326 1,896,522 2,945,695 2,945,695 2,945,695------------------ ------------------ ------------------ ------------------ ------------------ ------------------ ------------------ ------------------ ------------------ ------------------ -------------------- --------------------
0 0 0 0 0 0 0 0 0 0 0 0========== ========== ========== ========== ========== ========== ========== ========== ========== ========== =========== ===========
CITY OF SUNNYVALE
LONG TERM FINANCIAL PLANJULY 1, 2027 TO JUNE 30, 2037
640/400. EMPLOYEE BENEFITS FUND/INSURANCE & OTHER BENEFITS SUB-FUND
282

RESERVE/FUND BALANCE, JULY 1
CURRENT RESOURCES: Transfer From Other Funds Other Revenue Interest Income
TOTAL CURRENT RESOURCES
TOTAL AVAILABLE RESOURCES
CURRENT REQUIREMENTS: Liability Insurance Liability Insurance - Rebate Property Insurance Fidelity Insurance Legal Services Liability Claims Paid Administration Legal Contingency
TOTAL CURRENT REQUIREMENTS
RESERVES: Liability and Property Insurance
TOTAL RESERVES
FUND BALANCE, JUNE 30
FY 2016/2017TO
ACTUAL CURRENT BUDGET PLAN PLAN PLAN PLAN PLAN PLAN PLAN PLAN PLAN FY 2026/20272015/2016 2016/2017 2017/2018 2018/2019 2019/2020 2020/2021 2021/2022 2022/2023 2023/2024 2024/2025 2025/2026 2026/2027 TOTAL
------------------ ------------------ ------------------ ------------------ ------------------ ------------------ ------------------ ------------------ ------------------ ------------------ ------------------ ------------------ --------------------669,626 1,071,396 1,037,759 818,790 761,067 724,951 717,521 733,544 736,899 726,578 701,519 701,374 1,071,396
------------------ ------------------ ------------------ ------------------ ------------------ ------------------ ------------------ ------------------ ------------------ ------------------ ------------------ ------------------ --------------------
1,503,705 1,578,891 1,642,046 1,707,728 1,776,037 1,847,079 1,920,962 1,959,381 1,998,569 2,038,540 2,120,082 2,204,885 20,794,199139 0 0 0 0 0 0 0 0 0 0 0 0
10,105 10,714 12,972 14,329 15,221 21,749 21,526 22,006 22,107 21,797 21,046 21,041 204,508------------------ ------------------ ------------------ ------------------ ------------------ ------------------ ------------------ ------------------ ------------------ ------------------ ------------------ ------------------ --------------------
1,513,950 1,589,605 1,655,018 1,722,057 1,791,259 1,868,827 1,942,487 1,981,387 2,020,676 2,060,337 2,141,127 2,225,926 20,998,707------------------ ------------------ ------------------ ------------------ ------------------ ------------------ ------------------ ------------------ ------------------ ------------------ ------------------ ------------------ --------------------
2,183,576 2,661,000 2,692,777 2,540,847 2,552,326 2,593,779 2,660,008 2,714,931 2,757,575 2,786,916 2,842,646 2,927,300 22,070,103------------------ ------------------ ------------------ ------------------ ------------------ ------------------ ------------------ ------------------ ------------------ ------------------ ------------------ ------------------ --------------------
543,465 645,657 712,141 733,505 755,510 778,176 801,521 825,567 850,334 875,844 902,119 929,182 8,809,555(122,090) (114,250) (100,000) (102,500) (105,063) (107,689) (110,381) (113,141) (115,969) (118,869) (121,840) (124,886) (1,234,588)192,233 231,937 237,735 243,679 249,771 256,015 262,415 268,976 275,700 282,592 289,657 296,899 2,895,375
15,276 15,000 17,350 17,784 18,228 18,684 19,151 19,630 20,121 20,624 21,139 21,668 209,379257,313 326,400 328,000 336,200 344,605 353,220 362,051 371,102 380,379 389,889 399,636 409,627 4,001,109
52,731 312,120 320,000 328,000 336,200 344,605 353,220 362,051 371,102 380,379 389,889 399,636 3,897,202173,252 206,378 218,761 223,112 228,123 233,247 238,488 243,848 249,330 254,937 260,672 266,537 2,623,433
0 0 140,000 0 0 0 0 0 0 0 0 0 140,000------------------ ------------------ ------------------ ------------------ ------------------ ------------------ ------------------ ------------------ ------------------ ------------------ ------------------ ------------------ --------------------
1,112,180 1,623,242 1,873,987 1,779,780 1,827,374 1,876,258 1,926,465 1,978,032 2,030,997 2,085,397 2,141,272 2,198,663 21,341,466------------------ ------------------ ------------------ ------------------ ------------------ ------------------ ------------------ ------------------ ------------------ ------------------ ------------------ ------------------ --------------------
1,071,396 1,037,759 818,790 761,067 724,951 717,521 733,544 736,899 726,578 701,519 701,374 728,637 728,637------------------ ------------------ ------------------ ------------------ ------------------ ------------------ ------------------ ------------------ ------------------ ------------------ ------------------ ------------------ --------------------
1,071,396 1,037,759 818,790 761,067 724,951 717,521 733,544 736,899 726,578 701,519 701,374 728,637 728,637------------------ ------------------ ------------------ ------------------ ------------------ ------------------ ------------------ ------------------ ------------------ ------------------ ------------------ ------------------ --------------------
0 0 0 0 0 0 0 0 0 0 0 0 0========== ========== ========== ========== ========== ========== ========== ========== ========== ========== ========== ========== ===========
645. LIABILITY & PROPERTY INSURANCE FUND
JULY 1, 2016 TO JUNE 30, 2027LONG TERM FINANCIAL PLAN
CITY OF SUNNYVALE
283

RESERVE/FUND BALANCE, JULY 1
CURRENT RESOURCES: Transfer From Other Funds Other Revenue Interest Income
TOTAL CURRENT RESOURCES
TOTAL AVAILABLE RESOURCES
CURRENT REQUIREMENTS: Liability Insurance Liability Insurance - Rebate Property Insurance Fidelity Insurance Legal Services Liability Claims Paid Administration Legal Contingency
TOTAL CURRENT REQUIREMENTS
RESERVES: Liability and Property Insurance
TOTAL RESERVES
FUND BALANCE, JUNE 30
FY 2027/2028 FY 2016/2017TO TO
PLAN PLAN PLAN PLAN PLAN PLAN PLAN PLAN PLAN PLAN FY 2036/2037 FY 2036/20372027/2028 2028/2029 2029/2030 2030/2031 2031/2032 2032/2033 2033/2034 2034/2035 2035/2036 2036/2037 TOTAL TOTAL
------------------ ------------------ ------------------ ------------------ ------------------ ------------------ ------------------ ------------------ ------------------ ------------------ -------------------- --------------------728,637 771,203 800,345 814,791 813,189 794,109 805,197 849,762 878,173 888,914 728,637 1,071,396
------------------ ------------------ ------------------ ------------------ ------------------ ------------------ ------------------ ------------------ ------------------ ------------------ -------------------- --------------------
2,271,032 2,316,452 2,362,781 2,410,037 2,458,238 2,556,567 2,658,830 2,712,006 2,766,246 2,793,909 25,306,098 46,100,2970 0 0 0 0 0 0 0 0 0 0 0
29,145 30,848 32,014 32,592 32,528 31,764 32,208 33,990 35,127 35,557 325,773 530,281------------------ ------------------ ------------------ ------------------ ------------------ ------------------ ------------------ ------------------ ------------------ ------------------ -------------------- --------------------
2,300,177 2,347,300 2,394,795 2,442,628 2,490,765 2,588,331 2,691,038 2,745,997 2,801,373 2,829,465 25,631,871 46,630,578------------------ ------------------ ------------------ ------------------ ------------------ ------------------ ------------------ ------------------ ------------------ ------------------ -------------------- --------------------
3,028,814 3,118,504 3,195,140 3,257,419 3,303,954 3,382,441 3,496,235 3,595,758 3,679,546 3,718,380 26,360,508 47,701,974------------------ ------------------ ------------------ ------------------ ------------------ ------------------ ------------------ ------------------ ------------------ ------------------ -------------------- --------------------
957,058 985,770 1,015,343 1,045,803 1,077,177 1,109,492 1,142,777 1,177,061 1,212,372 1,248,744 10,971,597 19,781,152(128,008) (131,209) (134,489) (137,851) (141,297) (144,830) (148,451) (152,162) (155,966) (159,865) (1,434,128) (2,668,716)304,321 311,929 319,727 327,721 335,914 344,311 352,919 361,742 370,786 380,055 3,409,426 6,304,801
22,209 22,765 23,334 23,917 24,515 25,128 25,756 26,400 27,060 27,737 248,821 458,200419,868 430,364 441,124 452,152 463,455 475,042 486,918 499,091 511,568 524,357 4,703,938 8,705,048409,627 419,868 430,364 441,124 452,152 463,455 475,042 486,918 499,091 511,568 4,589,208 8,486,410272,536 278,671 284,947 291,365 297,930 304,644 311,512 318,536 325,721 333,069 3,018,930 5,642,363
0 0 0 0 0 0 0 0 0 0 0 140,000------------------ ------------------ ------------------ ------------------ ------------------ ------------------ ------------------ ------------------ ------------------ ------------------ -------------------- --------------------
2,257,611 2,318,158 2,380,350 2,444,230 2,509,845 2,577,243 2,646,473 2,717,586 2,790,632 2,865,665 25,507,793 46,849,259------------------ ------------------ ------------------ ------------------ ------------------ ------------------ ------------------ ------------------ ------------------ ------------------ -------------------- --------------------
771,203 800,345 814,791 813,189 794,109 805,197 849,762 878,173 888,914 852,715 852,715 852,715------------------ ------------------ ------------------ ------------------ ------------------ ------------------ ------------------ ------------------ ------------------ ------------------ -------------------- --------------------
771,203 800,345 814,791 813,189 794,109 805,197 849,762 878,173 888,914 852,715 852,715 852,715------------------ ------------------ ------------------ ------------------ ------------------ ------------------ ------------------ ------------------ ------------------ ------------------ -------------------- --------------------
0 0 0 0 0 0 0 0 0 0 0 0========== ========== ========== ========== ========== ========== ========== ========== ========== ========== =========== ===========
CITY OF SUNNYVALE645. LIABILITY & PROPERTY INSURANCE FUND
LONG TERM FINANCIAL PLANJULY 1, 2027 TO JUNE 30, 2037
284

RESERVE/FUND BALANCE, JULY 1
CURRENT RESOURCES: Assessment Revenue Interest Income
TOTAL CURRENT RESOURCES
TOTAL AVAILABLE RESOURCES
CURRENT REQUIREMENTS: Operating Costs In Lieu Charges Infrastructure Projects
TOTAL CURRENT REQUIREMENTS
RESERVES: Infrastructure Replacement Reserve
TOTAL RESERVES
FUND BALANCE, JUNE 30
FY 2016/2017TO
ACTUAL CURRENT BUDGET PLAN PLAN PLAN PLAN PLAN PLAN PLAN PLAN PLAN FY 2026/20272015/2016 2016/2017 2017/2018 2018/2019 2019/2020 2020/2021 2021/2022 2022/2023 2023/2024 2024/2025 2025/2026 2026/2027 TOTAL
------------------ ------------------ ------------------ ------------------ ------------------ ------------------ ------------------ ------------------ ------------------ ------------------ ------------------ ------------------ --------------------45,919 59,165 53,582 54,965 56,802 58,981 61,980 65,256 22,534 25,025 26,700 29,646 59,165
------------------ ------------------ ------------------ ------------------ ------------------ ------------------ ------------------ ------------------ ------------------ ------------------ ------------------ ------------------ --------------------
24,107 25,032 25,783 26,556 27,353 28,173 29,018 29,889 30,786 30,636 31,555 32,344 317,125408 496 679 977 1,156 1,805 1,901 656 729 778 863 969 11,009
------------------ ------------------ ------------------ ------------------ ------------------ ------------------ ------------------ ------------------ ------------------ ------------------ ------------------ ------------------ --------------------24,515 25,528 26,461 27,533 28,509 29,978 30,919 30,545 31,515 31,414 32,419 33,313 328,134
------------------ ------------------ ------------------ ------------------ ------------------ ------------------ ------------------ ------------------ ------------------ ------------------ ------------------ ------------------ --------------------70,434 84,692 80,043 82,498 85,311 88,959 92,900 95,801 54,049 56,439 59,119 62,959 387,298
------------------ ------------------ ------------------ ------------------ ------------------ ------------------ ------------------ ------------------ ------------------ ------------------ ------------------ ------------------ --------------------
9,981 29,156 23,055 23,632 24,222 24,828 25,449 26,085 26,737 27,405 27,091 27,268 284,9281,289 1,954 2,023 2,065 2,107 2,151 2,195 2,241 2,287 2,334 2,382 2,431 24,169
0 0 0 0 0 0 0 44,941 0 0 0 0 44,941------------------ ------------------ ------------------ ------------------ ------------------ ------------------ ------------------ ------------------ ------------------ ------------------ ------------------ ------------------ --------------------
11,270 31,110 25,078 25,696 26,330 26,979 27,644 73,266 29,024 29,739 29,472 29,699 354,038------------------ ------------------ ------------------ ------------------ ------------------ ------------------ ------------------ ------------------ ------------------ ------------------ ------------------ ------------------ --------------------
59,165 53,582 54,965 56,802 58,981 61,980 65,256 22,534 25,025 26,700 29,646 33,260 33,260
------------------ ------------------ ------------------ ------------------ ------------------ ------------------ ------------------ ------------------ ------------------ ------------------ ------------------ ------------------ --------------------59,165 53,582 54,965 56,802 58,981 61,980 65,256 22,534 25,025 26,700 29,646 33,260 33,260
------------------ ------------------ ------------------ ------------------ ------------------ ------------------ ------------------ ------------------ ------------------ ------------------ ------------------ ------------------ --------------------0 0 0 0 0 0 0 0 0 0 0 0 0
========== ========== ========== ========== ========== ========== ========== ========== ========== ========== ========== ========== ===========
255. COMMUNITY FACILITIES DISTRICT NO. 3 (ESTATES AT SUNNYVALE) FUND
JULY 1, 2016 TO JUNE 30, 2027LONG TERM FINANCIAL PLAN
CITY OF SUNNYVALE
285

RESERVE/FUND BALANCE, JULY 1
CURRENT RESOURCES: Assessment Revenue Interest Income
TOTAL CURRENT RESOURCES
TOTAL AVAILABLE RESOURCES
CURRENT REQUIREMENTS: Operating Costs In Lieu Charges Infrastructure Projects
TOTAL CURRENT REQUIREMENTS
RESERVES: Infrastructure Replacement Reserve
TOTAL RESERVES
FUND BALANCE, JUNE 30
FY 2027/2028 FY 2016/2017TO TO
PLAN PLAN PLAN PLAN PLAN PLAN PLAN PLAN PLAN PLAN FY 2036/2037 FY 2036/20372027/2028 2028/2029 2029/2030 2030/2031 2031/2032 2032/2033 2033/2034 2034/2035 2035/2036 2036/2037 TOTAL TOTAL
------------------ ------------------ ------------------ ------------------ ------------------ ------------------ ------------------ ------------------ ------------------ ------------------ -------------------- --------------------33,260 37,396 41,752 46,338 51,165 56,242 2,499 5,748 9,189 12,830 33,260 59,165
------------------ ------------------ ------------------ ------------------ ------------------ ------------------ ------------------ ------------------ ------------------ ------------------ -------------------- --------------------
33,153 33,982 34,831 35,702 36,594 40,509 38,447 39,408 40,393 41,403 374,423 691,5481,438 1,606 1,782 1,968 2,163 96 221 353 493 641 10,763 21,772
------------------ ------------------ ------------------ ------------------ ------------------ ------------------ ------------------ ------------------ ------------------ ------------------ -------------------- --------------------34,591 35,587 36,613 37,670 38,758 40,605 38,668 39,762 40,887 42,045 385,186 713,320
------------------ ------------------ ------------------ ------------------ ------------------ ------------------ ------------------ ------------------ ------------------ ------------------ -------------------- --------------------67,851 72,983 78,365 84,008 89,922 96,848 41,167 45,510 50,076 54,875 418,446 772,484
------------------ ------------------ ------------------ ------------------ ------------------ ------------------ ------------------ ------------------ ------------------ ------------------ -------------------- --------------------
27,950 28,648 29,365 30,099 30,851 31,622 32,413 33,223 34,054 34,905 313,130 598,0582,506 2,583 2,663 2,745 2,829 2,916 3,005 3,098 3,193 3,290 28,827 52,995
0 0 0 0 0 59,811 0 0 0 0 59,811 104,752------------------ ------------------ ------------------ ------------------ ------------------ ------------------ ------------------ ------------------ ------------------ ------------------ -------------------- --------------------
30,455 31,231 32,027 32,843 33,680 94,349 35,418 36,321 37,246 38,196 401,768 755,806------------------ ------------------ ------------------ ------------------ ------------------ ------------------ ------------------ ------------------ ------------------ ------------------ -------------------- --------------------
37,396 41,752 46,338 51,165 56,242 2,499 5,748 9,189 12,830 16,679 16,679 16,679
------------------ ------------------ ------------------ ------------------ ------------------ ------------------ ------------------ ------------------ ------------------ ------------------ -------------------- --------------------37,396 41,752 46,338 51,165 56,242 2,499 5,748 9,189 12,830 16,679 16,679 16,679
------------------ ------------------ ------------------ ------------------ ------------------ ------------------ ------------------ ------------------ ------------------ ------------------ -------------------- --------------------0 0 0 0 0 0 0 0 0 0 0 0
========== ========== ========== ========== ========== ========== ========== ========== ========== ========== =========== ===========
255. COMMUNITY FACILITIES DISTRICT NO. 3 (ESTATES AT SUNNYVALE) FUND
JULY 1, 2027 TO JUNE 30, 2037LONG TERM FINANCIAL PLAN
CITY OF SUNNYVALE
286

RESERVE/FUND BALANCE, JULY 1
CURRENT RESOURCES:Interest Income
TOTAL CURRENT RESOURCES
TOTAL AVAILABLE RESOURCES
CURRENT REQUIREMENTS:Transfer To General Fund/Fremont Pool
TOTAL CURRENT REQUIREMENTS
RESERVES:Endowment Reserve
TOTAL RESERVES
FUND BALANCE, JUNE 30
FY 2016/2017TO
ACTUAL CURRENT BUDGET PLAN PLAN PLAN PLAN PLAN PLAN PLAN PLAN PLAN FY 2026/20272015/2016 2016/2017 2017/2018 2018/2019 2019/2020 2020/2021 2021/2022 2022/2023 2023/2024 2024/2025 2025/2026 2026/2027 TOTAL
------------------ ------------------ ------------------ ------------------ ------------------ ------------------ ------------------ ------------------ ------------------ ------------------ ------------------ ------------------ --------------------1,048,435 1,048,435 1,048,435 1,048,435 1,048,435 1,048,435 1,048,435 1,048,435 1,048,435 1,048,435 1,048,435 1,048,435 1,048,435
------------------ ------------------ ------------------ ------------------ ------------------ ------------------ ------------------ ------------------ ------------------ ------------------ ------------------ ------------------ --------------------
8,468 9,458 13,105 18,348 20,969 31,453 31,453 31,453 31,453 31,453 31,453 31,453 282,051------------------ ------------------ ------------------ ------------------ ------------------ ------------------ ------------------ ------------------ ------------------ ------------------ ------------------ ------------------ --------------------
8,468 9,458 13,105 18,348 20,969 31,453 31,453 31,453 31,453 31,453 31,453 31,453 282,051------------------ ------------------ ------------------ ------------------ ------------------ ------------------ ------------------ ------------------ ------------------ ------------------ ------------------ ------------------ --------------------
1,056,903 1,057,893 1,061,540 1,066,782 1,069,403 1,079,888 1,079,888 1,079,888 1,079,888 1,079,888 1,079,888 1,079,888 1,330,486------------------ ------------------ ------------------ ------------------ ------------------ ------------------ ------------------ ------------------ ------------------ ------------------ ------------------ ------------------ --------------------
8,468 9,458 13,105 18,348 20,969 31,453 31,453 31,453 31,453 31,453 31,453 31,453 282,051------------------ ------------------ ------------------ ------------------ ------------------ ------------------ ------------------ ------------------ ------------------ ------------------ ------------------ ------------------ --------------------
8,468 9,458 13,105 18,348 20,969 31,453 31,453 31,453 31,453 31,453 31,453 31,453 282,051------------------ ------------------ ------------------ ------------------ ------------------ ------------------ ------------------ ------------------ ------------------ ------------------ ------------------ ------------------ --------------------
1,048,435 1,048,435 1,048,435 1,048,435 1,048,435 1,048,435 1,048,435 1,048,435 1,048,435 1,048,435 1,048,435 1,048,435 1,048,435------------------ ------------------ ------------------ ------------------ ------------------ ------------------ ------------------ ------------------ ------------------ ------------------ ------------------ ------------------ --------------------
1,048,435 1,048,435 1,048,435 1,048,435 1,048,435 1,048,435 1,048,435 1,048,435 1,048,435 1,048,435 1,048,435 1,048,435 1,048,435------------------ ------------------ ------------------ ------------------ ------------------ ------------------ ------------------ ------------------ ------------------ ------------------ ------------------ ------------------ --------------------
0 0 0 0 0 0 0 0 0 0 0 0 0========== ========== ========== ========== ========== ========== ========== ========== ========== ========== ========== ========== ===========
JULY 1, 2016 TO JUNE 30, 2027LONG TERM FINANCIAL PLAN
727. FREMONT POOL TRUST FUNDCITY OF SUNNYVALE
287
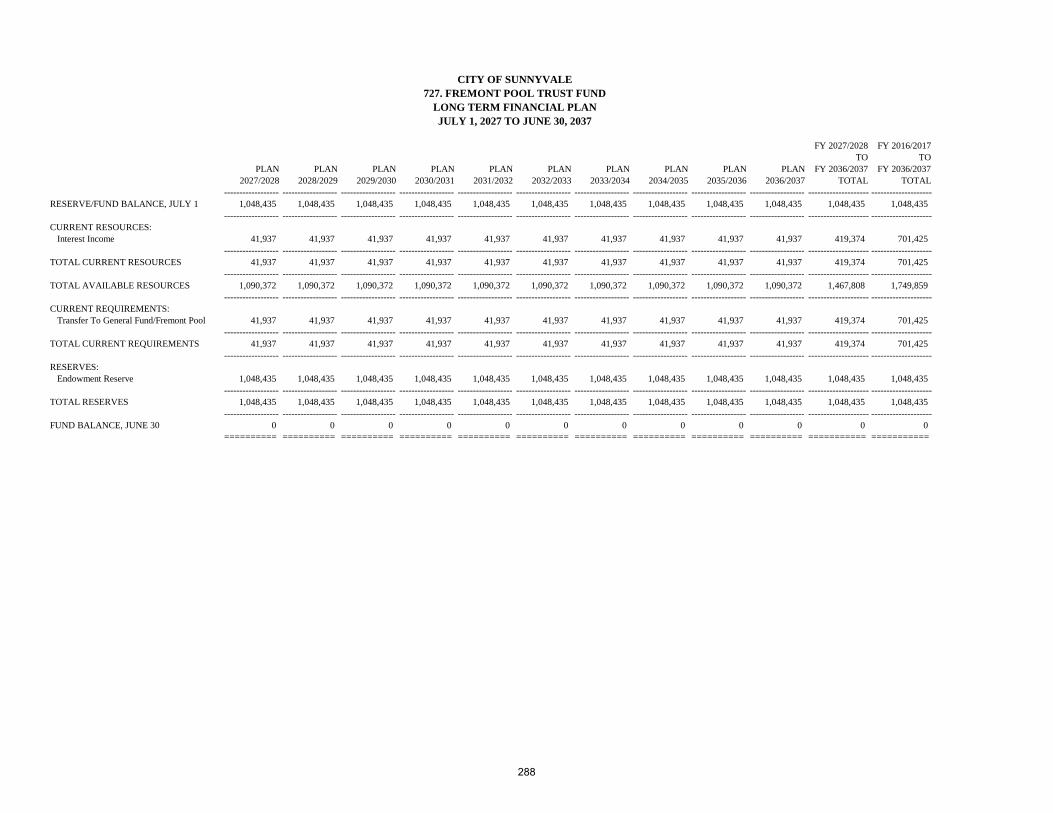
RESERVE/FUND BALANCE, JULY 1
CURRENT RESOURCES:Interest Income
TOTAL CURRENT RESOURCES
TOTAL AVAILABLE RESOURCES
CURRENT REQUIREMENTS:Transfer To General Fund/Fremont Pool
TOTAL CURRENT REQUIREMENTS
RESERVES:Endowment Reserve
TOTAL RESERVES
FUND BALANCE, JUNE 30
FY 2027/2028 FY 2016/2017TO TO
PLAN PLAN PLAN PLAN PLAN PLAN PLAN PLAN PLAN PLAN FY 2036/2037 FY 2036/20372027/2028 2028/2029 2029/2030 2030/2031 2031/2032 2032/2033 2033/2034 2034/2035 2035/2036 2036/2037 TOTAL TOTAL
------------------ ------------------ ------------------ ------------------ ------------------ ------------------ ------------------ ------------------ ------------------ ------------------ -------------------- --------------------1,048,435 1,048,435 1,048,435 1,048,435 1,048,435 1,048,435 1,048,435 1,048,435 1,048,435 1,048,435 1,048,435 1,048,435
------------------ ------------------ ------------------ ------------------ ------------------ ------------------ ------------------ ------------------ ------------------ ------------------ -------------------- --------------------
41,937 41,937 41,937 41,937 41,937 41,937 41,937 41,937 41,937 41,937 419,374 701,425------------------ ------------------ ------------------ ------------------ ------------------ ------------------ ------------------ ------------------ ------------------ ------------------ -------------------- --------------------
41,937 41,937 41,937 41,937 41,937 41,937 41,937 41,937 41,937 41,937 419,374 701,425------------------ ------------------ ------------------ ------------------ ------------------ ------------------ ------------------ ------------------ ------------------ ------------------ -------------------- --------------------
1,090,372 1,090,372 1,090,372 1,090,372 1,090,372 1,090,372 1,090,372 1,090,372 1,090,372 1,090,372 1,467,808 1,749,859------------------ ------------------ ------------------ ------------------ ------------------ ------------------ ------------------ ------------------ ------------------ ------------------ -------------------- --------------------
41,937 41,937 41,937 41,937 41,937 41,937 41,937 41,937 41,937 41,937 419,374 701,425------------------ ------------------ ------------------ ------------------ ------------------ ------------------ ------------------ ------------------ ------------------ ------------------ -------------------- --------------------
41,937 41,937 41,937 41,937 41,937 41,937 41,937 41,937 41,937 41,937 419,374 701,425------------------ ------------------ ------------------ ------------------ ------------------ ------------------ ------------------ ------------------ ------------------ ------------------ -------------------- --------------------
1,048,435 1,048,435 1,048,435 1,048,435 1,048,435 1,048,435 1,048,435 1,048,435 1,048,435 1,048,435 1,048,435 1,048,435------------------ ------------------ ------------------ ------------------ ------------------ ------------------ ------------------ ------------------ ------------------ ------------------ -------------------- --------------------
1,048,435 1,048,435 1,048,435 1,048,435 1,048,435 1,048,435 1,048,435 1,048,435 1,048,435 1,048,435 1,048,435 1,048,435------------------ ------------------ ------------------ ------------------ ------------------ ------------------ ------------------ ------------------ ------------------ ------------------ -------------------- --------------------
0 0 0 0 0 0 0 0 0 0 0 0========== ========== ========== ========== ========== ========== ========== ========== ========== ========== =========== ===========
JULY 1, 2027 TO JUNE 30, 2037LONG TERM FINANCIAL PLAN
727. FREMONT POOL TRUST FUNDCITY OF SUNNYVALE
288

RESERVE/FUND BALANCE, JULY 1
CURRENT RESOURCES:Interest Income
TOTAL CURRENT RESOURCES
TOTAL AVAILABLE RESOURCES
CURRENT REQUIREMENTS:Transfer To General Fund (Comm Rec.)
TOTAL CURRENT REQUIREMENTS
RESERVES:Endowment Reserve
TOTAL RESERVES
FUND BALANCE, JUNE 30
FY 2016/2017TO
ACTUAL CURRENT BUDGET PLAN PLAN PLAN PLAN PLAN PLAN PLAN PLAN PLAN FY 2026/20272015/2016 2016/2017 2017/2018 2018/2019 2019/2020 2020/2021 2021/2022 2022/2023 2023/2024 2024/2025 2025/2026 2026/2027 TOTAL
------------------ ------------------ ------------------ ------------------ ------------------ ------------------ ------------------ ------------------ ------------------ ------------------ ------------------ ------------------ --------------------552,016 552,016 552,016 552,016 552,016 552,016 552,016 552,016 552,016 552,016 552,016 552,016 552,016
------------------ ------------------ ------------------ ------------------ ------------------ ------------------ ------------------ ------------------ ------------------ ------------------ ------------------ ------------------ --------------------
4,459 5,520 6,900 9,660 11,040 16,560 16,560 16,560 16,560 16,560 16,560 16,560 149,044------------------ ------------------ ------------------ ------------------ ------------------ ------------------ ------------------ ------------------ ------------------ ------------------ ------------------ ------------------ --------------------
4,459 5,520 6,900 9,660 11,040 16,560 16,560 16,560 16,560 16,560 16,560 16,560 149,044------------------ ------------------ ------------------ ------------------ ------------------ ------------------ ------------------ ------------------ ------------------ ------------------ ------------------ ------------------ --------------------
556,475 557,536 558,916 561,676 563,057 568,577 568,577 568,577 568,577 568,577 568,577 568,577 701,061------------------ ------------------ ------------------ ------------------ ------------------ ------------------ ------------------ ------------------ ------------------ ------------------ ------------------ ------------------ --------------------
4,459 5,520 6,900 9,660 11,040 16,560 16,560 16,560 16,560 16,560 16,560 16,560 149,044------------------ ------------------ ------------------ ------------------ ------------------ ------------------ ------------------ ------------------ ------------------ ------------------ ------------------ ------------------ --------------------
4,459 5,520 6,900 9,660 11,040 16,560 16,560 16,560 16,560 16,560 16,560 16,560 149,044------------------ ------------------ ------------------ ------------------ ------------------ ------------------ ------------------ ------------------ ------------------ ------------------ ------------------ ------------------ --------------------
552,016 552,016 552,016 552,016 552,016 552,016 552,016 552,016 552,016 552,016 552,016 552,016 552,016------------------ ------------------ ------------------ ------------------ ------------------ ------------------ ------------------ ------------------ ------------------ ------------------ ------------------ ------------------ --------------------
552,016 552,016 552,016 552,016 552,016 552,016 552,016 552,016 552,016 552,016 552,016 552,016 552,016------------------ ------------------ ------------------ ------------------ ------------------ ------------------ ------------------ ------------------ ------------------ ------------------ ------------------ ------------------ --------------------
0 0 0 0 0 0 0 0 0 0 0 0 0========== ========== ========== ========== ========== ========== ========== ========== ========== ========== ========== ========== ===========
730. DOROLOU SWIRSKY YOUTH OPPORTUNITY FUND
JULY 1, 2016 TO JUNE 30, 2027LONG TERM FINANCIAL PLAN
CITY OF SUNNYVALE
289

RESERVE/FUND BALANCE, JULY 1
CURRENT RESOURCES:Interest Income
TOTAL CURRENT RESOURCES
TOTAL AVAILABLE RESOURCES
CURRENT REQUIREMENTS:Transfer To General Fund (Comm Rec.)
TOTAL CURRENT REQUIREMENTS
RESERVES:Endowment Reserve
TOTAL RESERVES
FUND BALANCE, JUNE 30
FY 2027/2028 FY 2016/2017TO TO
PLAN PLAN PLAN PLAN PLAN PLAN PLAN PLAN PLAN PLAN FY 2036/2037 FY 2036/20372027/2028 2028/2029 2029/2030 2030/2031 2031/2032 2032/2033 2033/2034 2034/2035 2035/2036 2036/2037 TOTAL TOTAL
------------------ ------------------ ------------------ ------------------ ------------------ ------------------ ------------------ ------------------ ------------------------------------- -------------------- --------------------552,016 552,016 552,016 552,016 552,016 552,016 552,016 552,016 552,016 552,016 552,016 552,016
------------------ ------------------ ------------------ ------------------ ------------------ ------------------ ------------------ ------------------ ------------------ ------------------ -------------------- --------------------
22,081 22,081 22,081 22,081 22,081 22,081 22,081 22,081 22,081 22,081 220,806 369,851------------------ ------------------ ------------------ ------------------ ------------------ ------------------ ------------------ ------------------ ------------------ ------------------ -------------------- --------------------
22,081 22,081 22,081 22,081 22,081 22,081 22,081 22,081 22,081 22,081 220,806 369,851------------------ ------------------ ------------------ ------------------ ------------------ ------------------ ------------------ ------------------ ------------------ ------------------ -------------------- --------------------
574,097 574,097 574,097 574,097 574,097 574,097 574,097 574,097 574,097 574,097 772,823 921,867------------------ ------------------ ------------------ ------------------ ------------------ ------------------ ------------------ ------------------ ------------------ ------------------ -------------------- --------------------
22,081 22,081 22,081 22,081 22,081 22,081 22,081 22,081 22,081 22,081 220,806 369,851------------------ ------------------ ------------------ ------------------ ------------------ ------------------ ------------------ ------------------ ------------------ ------------------ -------------------- --------------------
22,081 22,081 22,081 22,081 22,081 22,081 22,081 22,081 22,081 22,081 220,806 369,851------------------ ------------------ ------------------ ------------------ ------------------ ------------------ ------------------ ------------------ ------------------------------------- -------------------- --------------------
552,016 552,016 552,016 552,016 552,016 552,016 552,016 552,016 552,016 552,016 552,016 552,016------------------ ------------------ ------------------ ------------------ ------------------ ------------------ ------------------ ------------------ ------------------------------------- -------------------- --------------------
552,016 552,016 552,016 552,016 552,016 552,016 552,016 552,016 552,016 552,016 552,016 552,016------------------ ------------------ ------------------ ------------------ ------------------ ------------------ ------------------ ------------------ ------------------ ------------------ -------------------- --------------------
0 0 0 0 0 0 0 0 0 0 0 0========== ========== ========== ========== ========== ========== ========== ========== ===================== =========== ===========
CITY OF SUNNYVALE730. DOROLOU SWIRSKY YOUTH OPPORTUNITY FUND
LONG TERM FINANCIAL PLANJULY 1, 2027 TO JUNE 30, 2037
290

Budget Supplements

FY 2017/18 Budget Supplements
No. Title Cost Fund Status
1 Evaluation of New Revenue Strategies to Fund New and Increasing Service Demands and/or Unfunded Capital Investments Needs
$20,000 one-time General Fund Approved for Funding
2 2017 Housing Strategy $200,000 one-time General Fund Approved for Funding
3 Downtown Development Policies for Parking $60,000 one-time General Fund Approved for Funding
4 Funding for Consultant and/or Legal Services to Develop a Program for Implementation of a Wage Theft Ordinance
$20,000 one-time General Fund Approved for Funding
5 Public Access Programming for KSUN2 $15,000 each, for 2.5 years General Fund Approved for Funding
6 Accelerating Climate Action $250,000 one-time General Fund Approved for Funding
7 Increased Supplemental Human Services Funding in FY 2017/18
$50,000 one-time General Fund Not Approved
8 Feasibility Study for Development of a Class 1 Cycle and Pedestrian Trail Along Evelyn Avenue
$100,000 one-time Traffic Impact Fees Fund Not Approved
9 Parkland/Open Space Policy/Initiative $250,000 one-time General Fund Approved for Funding
10 Lawrence Station Area Plan - Increased Housing Study and Sense of Place Plan
$200,000 one-time General Fund Approved for Funding
20 Year Total $1,037,500
City of Sunnyvale FY 2017/18 Adopted Budget and Resource Allocation Plan
291

This Page Intentionally Blank
292

City of Sunnyvale
Agenda Item
17-0432 Agenda Date: 5/4/2017
BUDGET SUPPLEMENT NO. 1
SUBJECTEvaluation of New Revenue Strategies to Fund New and Increasing Service Demands and/orUnfunded Capital Investment Needs
BUDGET SUPPLEMENT REQUEST SUMMARYStaff recommends approval of Budget Supplement No. 1 for funding of $20,000 to hire a consultantwith expertise to help guide a revenue strategy evaluation.
BACKGROUNDLike many cities across the country, the City of Sunnyvale faces increasing costs to deliver projectsas well as increased costs and demands for service. The need to invest in projects and replace theCity’s aging infrastructure that have been deferred or unfunded is critical. Additionally, this work effortexists in the context of projected increases of existing personnel and operating costs. As these costsare projected to outpace revenue growth, and to find capacity to invest in projects and expand theservices expected from the community, new and existing revenue sources should be evaluated. Inparallel, as an ongoing effort, staff continues to create service efficiencies to use of technology aswell as evaluate service delivery alternatives.
EXISTING POLICYCouncil Policy, Chapter 7, Planning and Management, Policy B.1.1 - The City will maintain adiversified and stable revenue base, not overly dependent on any land use or external fundingsource.
Council Policy, Chapter 7, Planning and Management, Policy B.1.4 - When considering a newtax or revenue source or an increase in an existing tax or revenue source, the following criteriashould be considered:
• Community/voter acceptance• Competitiveness with surrounding communities• Efficiency of revenue collection and enforcement• Effectiveness in generating sufficient revenues in the short and long-term to justify its
establishment• Enhancement of revenue diversity to promote stability and provide protection from downturns
in business cycles• Equity/Fairness in distribution of the revenue burden on various segments of the community
DISCUSSIONThe objective is to develop new revenue strategies that the City can implement, including a greaterdiversification of the City’s revenues based on locally controlled revenue sources to address
Page 1 of 3
293
17-0432 Agenda Date: 5/4/2017
unfunded or underfunded programs and projects. As the City continues to grow and evolve, thedemand for services has also increased and changed. However, the growth of traditional revenuesources has not kept pace with the resources necessary to meet the service expectations of thecommunity and to address delayed/deferred capital projects. Identification of new and the review ofexisting revenue sources, particularly those which can be under the sole control of the City, isparamount in maintaining the existing service level and potentially funding changing and futureservice and capital investment needs.
As noted in the City Manager’s FY2016/17 Recommended Budget, the City is in the process ofdeveloping and implementing a number of budgetary strategies to ensure the long-term health of theCity. These efforts include changes to a total compensation model and assumptions to set asidelimited funding to cover projected personnel cost increases, such as pensions and other post-employment benefits. In addition, efforts also include, tax and fee structure studies, enterprise fundreviews, identifying unfunded or underfunded programs and projects, potentially establishing apension trust, establishing community benefit programs, utilizing third-party expert investors tomanage a portion of the City’s investment portfolio, and making investments in key areas (e.g.technology).
Some examples of near-term unfunded services/projects that need to be addressed, as well asneeded operating expenditures and infrastructure improvements over the next 20 years, include:
• Branch Library Operating and Maintenance Costs• Transportation Strategic Plan Projects• Downtown Specific Plan Projects• Sidewalk Repair• Water, Wastewater, Stormwater Infrastructure• Civic Center Modernization• Fire Station Replacements/Rehabilitation• Emergency Operations Center
One component of the budgetary strategy to ensure long-term fiscal sustainability is securing stablerevenue sources and to further diversity the City’s revenue portfolio to fund the items noted above.This study would look at a wide variety of potential revenue sources and evaluate the potentialincome, future sustainability of the funding source, impact on residents, and potential for success;ultimately resulting in recommendations to Council for consideration.
Some of the strategies, among others that may be examined, include reviewing current taxes such asTransient Occupancy Tax (TOT), Sales Tax, and Business License Tax for modernization andincrease; a Phase 2 of the Utility Users Tax (UUT); parking and franchise fees increases; a RealProperty Transfer Tax increase, and a dedicated fee for stormwater program and infrastructure costs.Staff plans to examine these and other potential revenue generating opportunities and bring the mostviable options back to Council for consideration prior to the development of the FY 2018/2019 bi-annual operating budget.
SERVICE LEVEL IMPACTThere would be no impact to service levels with this budget supplement. Funds would be used to hirean outside consultant with specialized knowledge in evaluating revenue strategies.
Page 2 of 3
294

17-0432 Agenda Date: 5/4/2017
FISCAL IMPACT
Subject/Title Funding FY 2017/18 20-year Total
Evaluation of New RevenueStrategies to Fund New andIncreasing Service Demandsand/or Unfunded CapitalInvestments
General Fund $20,000 $20,000
The cost associated with this study is for consultant services that may be needed to guide a revenuestrategy and provide expertise in areas that the City has not explored. Staff time required to researchand evaluate the options and fiscal impacts will be absorbed.
ALTERNATIVES1. Approve the supplement as proposed.2. Approve the supplement for a different dollar amount or timing.3. Do not approve the supplement.4. Other directions provided by Council.
STAFF RECOMMENDATIONAlternative 1: Approve the supplement as proposed.
As the City continues to face increased costs, demands for service, and aging infrastructure,strategic and creative approaches to ensuring long term fiscal sustainability are required. This studywill take a detailed look at existing and potential new, ongoing revenue sources that could help fundthese needs.
Prepared by: Brice McQueen, Senior Management AnalystReviewed by: Timothy J. Kirby, Director of FinanceReviewed by: Walter C. Rossmann, Assistant City ManagerApproved by: Deanna J. Santana, City Manager
Page 3 of 3
295

This Page Intentionally Blank
296
City of Sunnyvale
Agenda Item
17-0434 Agenda Date: 5/4/2017
BUDGET SUPPLEMENT NO. 2
SUBJECTSupplemental Budget Request for 2017 Housing Strategy
BUDGET SUPPLEMENT REQUEST SUMMARYThis budget supplement provides funding for the 2017 Housing Strategy (Study Issue CDD 17-09).Approve Budget Supplement No. 2 for $200,000.
BACKGROUNDCDD 17-09, 2017 Housing Strategy, was the top-ranked CDD Study Issue for 2017. On March 28,Council referred Budget Supplement No. 2 for consideration as part of the budget. This budgetsupplement would fund the estimated $200,000 project cost for expenses such as: consultant studiesof housing market dynamics, possible mobile home park rent stabilization programs, pros and consof various affordable housing policies, and other issues addressed by the study issue paper, as wellas limited term/contract staff and/or staff overtime to manage the project, including leading the publicengagement process, and related administrative and noticing costs. See Study Issue Paper CDD 17-09 for further information on the Housing Strategy.
EXISTING POLICYGeneral Plan, Housing ElementGoal A: Assist in the provision of adequate housing to meet the diverse needs of Sunnyvale’shouseholds of all income levels.Goal B: Maintain and enhance the condition and affordability of existing housing in Sunnyvale.
DISCUSSIONOn February 17, 2017, Council ranked CDD 17-09 to provide a comprehensive review of options forimproving the production and availability of affordable housing and addressing other areas of publicconcern related to housing. This Study Issue would complement several other planned policy studiesfor the Housing Division in 2017, such as study of accessory dwelling unit policies.
The intended outcome of this study issue would be a comprehensive strategy that would offer theCity guidance in using its limited funding and staffing resources in the most effective way to positivelyimpact current local housing conditions for residents and workers, focusing on issues such asaffordability, accessibility, quality, and sustainability. If this budget supplement is approved, staff willreturn to Council shortly after the adoption of the Budget with a scope of work for the study.
SERVICE LEVEL IMPACTThis budget supplement will not have a significant impact on ongoing service levels, as it will onlyfund a one-time policy study to be completed within approximately one year; it is not intended toprovide service level enhancements.
Page 1 of 2
297

17-0434 Agenda Date: 5/4/2017
FISCAL IMPACTThe short-term fiscal impact would consist of a General Fund expenditure of $200,000 in FY 2017/18.Any costs to implement Housing Strategy options are unknown at this time. The study would includeassessment of potential implementation costs and existing revenue sources for housing programsand projects, and whether changes in how the various housing activities are administered and/orcurrent City codes or policies could be modified to reduce implementation costs.
Subject/Title Funding FY 2017/18 20-year Total
Supplemental Budget Requestfor 2017 Housing Strategy
General Fund $200,000 $200,000
ALTERNATIVES1. Approve the supplement as proposed.2. Approve the supplement for a different dollar amount or timing.3. Do not approve the supplement.4. Other directions provided by Council.
STAFF RECOMMENDATIONAlternative 1: Approve Budget Supplement No. 2 in the amount of $200,000 as proposed.
This study issue was ranked #1 in this year’s study issues workshop among all CDD study issues. Itwas recommended as an alternative to the other housing-related study issues proposed for 2017 toprovide a more comprehensive review of options for improving the production and availability ofaffordable housing and addressing other areas of public concern related to housing. Council referredthis supplement for consideration on March 28.
Prepared by: Shila Behzadiaria, Assistant PlannerReviewed by: Suzanne Isé, Housing OfficerReviewed by: Trudi Ryan, Director, Community Development DepartmentReviewed by: Timothy J. Kirby, Director of FinanceReviewed by: Kent Steffens, Assistant City ManagerApproved by: Deanna J. Santana, City Manager
Page 2 of 2
298

City of Sunnyvale
Agenda Item
17-0472 Agenda Date: 5/4/2017
BUDGET SUPPLEMENT NO. 3
SUBJECTCDD 11-02 Downtown Development Policies for Parking
BUDGET SUPPLEMENT REQUEST SUMMARYThis Budget Supplement requests $60,000 to hire a consultant with specialized knowledge toexamine the City’s downtown development policies to identify and explore alternative solutions formeeting future downtown parking needs, including alternative ways to achieve effective off-siteparking downtown, such as shared and joint-use parking and use of smart technology to managepublic parking.
BACKGROUNDRedevelopment of sites within the downtown is governed by both the Downtown Specific Plan (DSP)and the development standards contained within the Zoning Code. For individual projects, there maybe difficulty in accomplishing the vision of the DSP and meeting the standards in the Zoning Code.The Downtown Specific Plan requires that non-residential developments provide all net new requiredparking on site (i.e., minus any credit for spaces in the Parking District). Downtown parking is apotential barrier to the redevelopment of smaller individual sites in the downtown parking district,which may be more constrained in their options for locating the required on-site parking facilities.
EXISTING POLICYLand Use and Transportation Element (as adopted April 11, 2017)Policy 19, Action 2: Establish reduced parking requirements for transit, corridor, and village mixed-use developments and for developments with comprehensive TDM programs that are consistent withthe City’s established goals.
Policy 31: Move progressively toward eliminating direct and hidden subsidies of motor vehicleparking and driving, making the true costs of parking and driving visible to motorists.
Action 2: Manage City-provided public parking though pricing and location strategies in orderto match supply and demand, shift the market costs to users of vehicle parking, maintainmobility and access to Sunnyvale businesses, and reduce vehicle trips.
DISCUSSIONSCOPE OF THE STUDYThis study would consider options available to address current and future parking alternatives,including how to mesh private parking areas with the downtown Parking Maintenance AssessmentDistrict. The study will consider the City’s downtown development policies to identify and explorealternative solutions, including shared and joint-use parking and use of smart technology to managepublic parking. It could also examine the potential for providing additional parking supply in the
Page 1 of 3
299

17-0472 Agenda Date: 5/4/2017
Parking Maintenance Assessment District, including a current needs assessment, exploration offinancing options, and consideration of legal issues. The effect of recent downtown development onparking demand and parking patterns would also be considered in thisstudy.
With the Town Center project resuming construction, the new developer team may proposemodifications to the land use mix for the project that will require an updated parking analysis. It wouldbe appropriate to combine or coordinate this study issue with the project-level parking analysis whilethe project modifications are being evaluated. A combined study could explore possible options andsolutions to meet the parking needs for the Town Center project as well as the overall downtownarea.
Recent proposals for redevelopment projects in the downtown have highlighted tensions between theDSP and the Zoning Code. Parking is a challenge, as the City’s Parking Maintenance AssessmentDistrict has limited capacity and there are no plans for expansion under current policies. Thus,redevelopment projects are required to use on-site parking to satisfy all additional parkingrequirements resulting from intensification of the site. This requirement has the potential toencourage development patterns that are not consistent with the City’s overall vision for downtown,such as increased land area devoted to surface parking.
SERVICE LEVEL IMPACTThere would be no impact to service levels with this budget supplement because the money wouldbe used to hire an outside consultant with specialized knowledge on parking options in a downtownarea. Staff management of the study and the consultant contract is covered in the operating budgetfor land use policy planning (General Fund).
FISCAL IMPACT
Subject/Title Funding FY 2017/18 20-year Total
Downtown Development Policiesfor Parking
General Fund $60,000 $60,000
The $60,000 requested as a budget supplement will be used to hire an outside consultantexperienced in exploring alternative solutions for meeting future downtown parking needs, includingalternative ways to achieve effective off-site parking. Potential solutions resulting from study thathave a policy or fiscal impact to the City would require future action by Council and is not a part ofthis study, which is meant to review options.
ALTERNATIVES1. Approve the supplement as proposed.2. Approve the supplement for a different dollar amount or timing.3. Do not approve the supplement.4. Other directions provided by Council.
STAFF RECOMMENDATIONAlternative 1: Approve the budget supplement request of $60,000 to examine the downtown parkingoptions and alternatives.
Page 2 of 3
300
17-0472 Agenda Date: 5/4/2017
Prepared by: Andrew Miner, Planning OfficerReviewed by: Trudi Ryan, Director, Community DevelopmentReviewed by: Timothy J. Kirby, Director of FinanceReviewed by: Kent Steffens, Assistant City ManagerApproved by: Deanna J. Santana, City Manager
Page 3 of 3
301
This Page Intentionally Blank
302

City of Sunnyvale
Agenda Item
17-0436 Agenda Date: 5/4/2017
BUDGET SUPPLEMENT NO. 4
SUBJECTFunding for Consultant and/or Legal Services to Develop a Program for Implementation of a WageTheft Ordinance
BUDGET SUPPLEMENT REQUEST SUMMARYAs part of its annual Study Issue process, the City Council approved Study Issue OCM 16-02,Consider Adoption of a Wage Theft Ordinance, to examine existing wage theft laws, ordinances andpolicies at the State level as well as in other local jurisdictions. Staff anticipates a minimum of 120hours of staff time as well as consultant and/or legal services that may be needed to develop acomprehensive program. Staff recommends that Council Approve Budget Supplement No. 4 forfunding of $20,000 for costs associated with consultant and/or legal services.
BACKGROUNDA wage theft study issue was introduced in 2016 and again during the 2017 study issue process.Council approved the item to be studied in 2017. The study issue is in response to complaints thatemployees working in Sunnyvale are not being properly compensated for wages earned. TheDivision of Labor Standards Enforcement and a division of the State of California Department ofIndustrial Relations enforce laws against wage theft violators. State law allows for local jurisdictionsto establish standards and enforcement procedures in addition to what the State provides.
EXISTING POLICYSunnyvale Municipal Code, Chapter 3.80. Minimum Wage
DISCUSSIONThis study will determine the City’s authority in developing a wage theft enforcement program andwhether additional local remedies to the statewide issue would be a viable and/or effective option.One specific action will be reviewing and amending the City’s bidding policies to protect the City fromcontracting for services from businesses that have unpaid wage theft judgments. The study willreview the business license and permit process to establish specific guidelines to provide the Citywith tools that may be used to enforce regulations on wage theft issues.
If the Council approves a future wage theft ordinance with an accompanying enforcement program,staff may have to return to Council to request funding for the enforcement program during futurebudget cycles.
SERVICE LEVEL IMPACTThe study would include staff from City Manager, City Attorney, Finance and Public WorksDepartment. A minimum of 120 staff hours is expected.
Page 1 of 2
303

17-0436 Agenda Date: 5/4/2017
FISCAL IMPACTThe requested funds would be used to hire a consultant to assist in reviewing existing City policies aswell as review existing programs in other cities to determine if the City can suspend or revoke permitsfor businesses that have unpaid wage theft judgments.
Subject/Title Funding FY 2017/18 20-year Total
Funding for Consultant and/orLegal Services to Develop aProgram for Implementation ofthe Wage Theft Ordinance
General Fund $20,000 $20,000
ALTERNATIVES1. Approve the supplement as proposed.2. Approve the supplement for a different dollar amount.3. Do not approve the supplement.4. Other directions provided by Council.
STAFF RECOMMENDATIONStaff recommends Alternative 1: Approve the supplement as proposed.
Staff assigned to this study may not be able to accomplish other tasks and may not have theexpertise to develop an enforcement program. The $20,000 will allow the City to hire a consultantand/or legal service representative to provide staff with the expertise and ability to complete acomprehensive report.
Prepared by: Connie Verceles, Economic Development ManagerReviewed by: Timothy J. Kirby, Director of FinanceReviewed by: Walter C. Rossmann, Assistant City ManagerApproved by: Deanna J. Santana, City Manager
Page 2 of 2
304

City of Sunnyvale
Agenda Item
17-0482 Agenda Date: 5/4/2017
BUDGET SUPPLEMENT NO. 5
SUBJECTPublic Access Programming for KSUN2
BUDGET SUPPLEMENT REQUEST SUMMARYProvide funds in the amount of $15,000 annually to continue an agreement with Mountain ViewCommunity Television doing business as KMVT) for public access programming for a period of up totwo and half years and approve Budget Supplement No. 5 for $37,500.
BACKGROUNDThe City currently operates two cable channels, KSUN-15 and KSUN2. KSUN-15 is used to televiseCity Council and Planning Commission meetings (AT&T U-Verse channel 99, Comcast channel 15)and until recently, KSUN2 (Comcast channel 26) broadcast that same content. As part of the FY2015/16 budget adoption, the City Council approved a project to contract with the City’s existingbroadcast provider, KMVT, to provide 24-hour public access programming drawn from regional andSunnyvale producers on KSUN2 (Project 831700). The initial term of the contract with KMVT is forthree years (January 1, 2015, through December 31, 2017) with an option to renew annually for up totwo additional years. This project was approved for a two-year pilot, and now, with the pilot nearingcompletion, staff is presenting this budget supplement for City Council to evaluate the service anddecide whether to continue or discontinue it.
EXISTING POLICYPolicy 7.2.1 Community Engagement- Goals and Policies
Goal A Achieve a community in which all community members are well informed about local issues,City Programs and Services.
Policy A.1 Assure that all community members have reasonable access to City information,services and programs within budgeted resources.Policy A.3 Ensure an integrated approach to informing community members about localissues, City programs and services that reaches segments of a diverse community.
Goal B Achieve a community in which all community members can be actively involved in shapingthe quality of life and participate in local community and government activities.
Policy B.3 Promote the importance and benefits of community involvement.Policy B.6 Provide opportunities for and encourage involvement from community membersthat reflect the diversity of the City.
DISCUSSION
Page 1 of 3
305
17-0482 Agenda Date: 5/4/2017
Since the pilot program began, KSUN2 went from simply duplicating the City's KSUN governmentchannel to offering a channel with unique public programming, filling 24 hours a day with shows bylocal independent producers from Sunnyvale and neighboring cities. The channel also expandedKMVT's ability to offer educational workshops and air these productions on channel 26. Neighboringcities offer this service as well; Mountain View for over 30 years and Cupertino/Los Altos for 15years.
Some statistics from the two-year pilot project include:
· Five Sunnyvale producers are creating unique shows, with one more on track to air by May2017.
· Shows with Sunnyvale producers have grown from four shows during the first quarter of thepilot (November 2015) to ten for the most recent (April 2017).
· Eighteen Sunnyvale residents volunteer as crew members for various shows.
· KMVT has included Sunnyvale public schools in their sports coverage by broadcasting threeFremont High games and two Homestead High games.
· Education programs are serving Sunnyvale residents: 1) Studio Production workshops wereattended by 16 adults and 30 youth from Sunnyvale since the beginning of the pilot; 2) apartnership with Summit Denali in Sunnyvale provides an after-school workshop for videoproduction. 43 students enrolled last year over four sessions; enrollment continues this year.Projects completed by the students air on Channel 26.
· KMVT assisted with the production, airing and online distribution of election programming onChannel 26. They hosted candidate statement recordings and worked with the League ofWomen Voters to cover candidate forums and local measure education.
SERVICE LEVEL IMPACTCouncil approval of this supplement would continue funding public access programming on the City’sKSUN2 cable channel beyond the two-year pilot. This project has been successful in that is allowsopportunities for and encourages involvement from community members that reflect the diversity ofthe City.
FISCAL IMPACTThe current annual cost is $15,000 and, is not expected to increase. Staff recommends continuingfunding for two and a half years, for a total of $37,500, at which time staff will present a report toCouncil for review and action regarding continuous funding for public access programming. TheCity's contract with KMTV for existing broadcasting services includes these public accessprogramming services as an optional service, allowing the City to efficiently provide the service.
Subject/Title Funding FY 2017/18 20-year Total
Public Access Programming forKSUN2
General Fund $15,000 $37,500
ALTERNATIVES
Page 2 of 3
306

17-0482 Agenda Date: 5/4/2017
1. Approve the Budget Supplement No. 5 to provide funds in the amount of $37,500 to continuean agreement with Mountain View Community Television dba KMVT for public accessprogramming for a period of up to two and half years.
2. Approve the supplement for a different dollar amount or term.3. Do not approve the supplement.4. Other directions provided by Council.
STAFF RECOMMENDATIONAlternative 1: Approve the Budget Supplement No. 5 to provide funds in the amount of $37,500 tocontinue an agreement with Mountain View Community Television dba KMVT for public accessprogramming for a period of up to two and half years.
These funds will enable KMVT to continue providing public access programming over a signaldedicated for Sunnyvale. The two-year pilot project has met its objective of allowing opportunities forand encouraging involvement from community members.
Prepared by: Catlin Ivanetich, Senior Management AnalystReviewed by: Timothy J. Kirby, Director of FinanceReviewed by: Walter C. Rossmann, Assistant City ManagerApproved by: Deanna J. Santana, City Manager
Page 3 of 3
307

This Page Intentionally Blank
308

City of Sunnyvale
Agenda Item
17-0390 Agenda Date: 5/4/2017
BUDGET SUPPLEMENT NO. 6
SUBJECTAccelerating Climate Action
BUDGET SUPPLEMENT REQUEST SUMMARYThis Budget Supplement requests $250,000 for consultant services and other expenses to implementa CAP 2.0 Initiative, aimed to establish new greenhouse gas reduction targets for Sunnyvale,conduct broad community engagement, and create a framework for accelerated Climate Action Plan(CAP) implementation.
BACKGROUNDAccelerating Climate Action was added as a Council Policy Priority at the January 2017 StrategicWorkshop, following a November 2016 Council Study Session regarding CAP progress andopportunities to advance climate action.
The City’s current Climate Action Plan was adopted in May 2014, and the first biennial report andupdated workplan for CAP implementation through 2020 was approved by the Council in May 2016.That report concluded that Sunnyvale is on track to meet or exceed the reduction target of achieving1990 emissions levels by 2020 (which is deemed equivalent to a 15% reduction from a measurablebase year - 2008 for Sunnyvale). However, the CAP was not designed to meet the State targets of40% GHG reduction by 2030 (adopted by the Legislature via SB 350 in 2016) and 80% by 2050(Governor’s Executive Order S-3-05). In addition, new approaches and technologies continue toemerge, which offer opportunities to further modernize Sunnyvale’s approach to climate action.
EXISTING POLICYThe 2007 Sunnyvale Community Vision calls for the City to be a regional leader in environmentalsustainability.
The Climate Action Plan was adopted by Council on May 20, 2014, and the CAP Work Plan 2020was approved by the City Council on November 25, 2014 and updated on May 3, 2016 as part of thefirst biennial CAP report.
DISCUSSIONAt the January 2017 Strategic Workshop, staff presented options to enhance climate action, includingthe opportunity for Sunnyvale to assertively plan for longer term climate action goals. The Statetargets compel significant action. Particularly the 2050 target to achieve an 80% reduction in GHGemissions will require significant shifts in the areas of transportation, energy use, and energysourcing. Staff has developed a workplan (Attachment 1) for a planning initiative, CAP 2.0, to conductthe research, analysis, and community engagement necessary to support Council policy setting andresource allocation for advancing and accelerating climate action. As outlined in the workplan, the
Page 1 of 3
309

17-0390 Agenda Date: 5/4/2017
CAP 2.0 Initiative includes:1) Benchmarking programs and policy approaches;2) Evaluating potential strategies, particularly in the key areas of transportation and energy;3) Updating Sunnyvale’s GHG projections for 2030 to determine the gap between planned
actions and the 40% reduction target;4) Evaluating prospective scenarios for a suite of strategies to meet or exceed the 80% reduction
target;5) Designing a framework for the CAP 2.0 including key strategies, decision-making, and an
approach to future work planning and resource planning;6) Identifying funding and financing strategies to support implementation; and7) Engaging the community through various mechanisms such as workshops, surveys, and the
creation and engagement of a CAP Advisory Committee.
Staff proposes an 18-month initiative with the proposed CAP 2.0 to be presented to the City Councilin December 2018. To preserve that timeline, staff has begun work and released an RFP forconsultant services to support the initiative. The RFP process allows sufficient flexibility toincorporate Council direction on the initiative scope and workplan prior to awarding a contract.
Based on Council’s direction on this Budget Supplement, staff plans to return to Council for thefollowing to launch the work of CAP 2.0:
June 20 Recommendation to form at CAP Advisory Committee (CAC) and appoint a CouncilSubcommittee to select members for the CAC.
July 11 or 25 Award of consultant services agreement.
SERVICE LEVEL IMPACTStaff management of the initiative and the consultant contract will be done by Environmental Services(ESD), but engagement in the substance of the initiative will require participation from service leadersin Public Works (DPW) and Community Development (CDD) as well as ESD, Finance, and the Officeof the City Manager. Engagement will include participation from executives, managers, and othersubject matter experts from the departments in information and data gathering, benchmarkingworkshops, strategy setting sessions, elements of community engagement, and review of draft andfinal products. Given the formative stage of the initiative and the broad scope of participation acrossvarious individuals, it is not yet practical to identify specific resource additions that would address thestaff impacts of conducting this initiative. As the initiative progresses, staff will continue to evaluatethe need for additional staff in strategic areas and keep the Council apprised of impacts to otherprojects as the workload implications of this initiative are better realized.
FISCAL IMPACT
Subject/Title Funding FY 2017/18 20-year Total
Accelerating Climate Action General Fund $250,000 $250,000
Funding for implementation of the current CAP includes $476,000 in the current year. An additional$520,000 is included in the recommended Projects Budget (Project 831290). This budget supplementrequests an additional $250,000 to support planning beyond the current CAP. The funding requestedas a budget supplement will be used to hire an outside consultant experienced in climate action
Page 2 of 3
310

17-0390 Agenda Date: 5/4/2017
strategies and GHG accounting methodologies. It is anticipated that additional workplan-scale effortswould be needed subsequent to this initiative to provide more detailed actions steps or to addressadditional strategy areas beyond those covered by this initiative. Such additional efforts as well aspotential service and program solutions resulting from this initiative that have a policy or fiscal impactto the City would require future action by Council.
ALTERNATIVES1. Approve the supplement as proposed.2. Approve the supplement for a different dollar amount or timing.3. Do not approve the supplement.4. Other direction provided by Council.
STAFF RECOMMENDATIONStaff recommends Alternative 1.
Staff recommends approval of the budget supplement request of $250,000 to implement the CAP 2.0Initiative in response to Council’s interests to accelerate climate action in Sunnyvale.
Prepared by: Melody Tovar, Regulatory Programs Division ManagerReviewed by: Kent Steffens, Assistant City Manager and Interim Director, Environmental ServicesReviewed by: Timothy J. Kirby, Director of FinanceReviewed by: Walter C. Rossmann, Assistant City ManagerApproved by: Deanna J. Santana, City Manager
ATTACHMENTS1. CAP 2.0 Workplan
Page 3 of 3
311

CAP 2.0 Initiative - Workplan PLANNING FOR CLIMATE ACTION BEYOND 2020
City of Sunnyvale April 2017
I. Introduction
Sunnyvale’s first Climate Action Plan (CAP) was adopted by the City Council in May 2014. Two years later, in
May 2016, the first biennial report and updated workplan for CAP implementation was presented to and
approved by the Council. That report concluded that Sunnyvale is on track to meet or exceed the greenhouse
gas (GHG) emissions reduction target of achieving 1990 emissions levels by 2020 (which is deemed equivalent to
achieving at least a 15% reduction from a measurable base year - 2008 for Sunnyvale).
Since Sunnyvale approved its CAP, the State legislature adopted a target of achieving 40% GHG reduction by
2030 (SB 32, 2016). Sunnyvale’s CAP was not designed to meet this target nor the Governor’s target of 80%
reduction by 2050 (Executive Order S-3-05). In addition, new approaches and technologies continue to emerge,
which offer additional opportunities to modernize Sunnyvale’s approach to climate action.
These changes prompted interest amid the community and City Council to revisit Sunnyvale’s CAP for the
potential to accelerate progress and to achieve reductions greater than those contemplated in the current CAP.
In November 2016, the City Council held a joint study session with the Sustainability Commission to discuss CAP
progress, observations about other Bay Area communities’ approaches, and ways that Sunnyvale may be more
assertive in climate action. At the January 2017 Strategic Workshop, Accelerating Climate Action was added as a
Council Policy Priority.
There are two overarching components for addressing Council’s policy priority: 1) Assertively implement the
City’s current CAP, including integrating climate action into the DNA of how Sunnyvale provides services and 2)
Begin planning for what is next, beyond the scope and timeframe of the current CAP, to address the bolder
reductions needed for climate action. These two components operate in tandem. The CAP 2.0 Initiative
addresses the second component. CAP 2.0 will not be a full task “work plan” through 2050, but rather a
“framework” with guiding principles, key strategies, and a decision-making model. It is anticipated that some
actions will be identified for near-term action but full work plans would be developed over a subsequent period,
with every effort made to accelerate planning for the most impactful strategies.
312
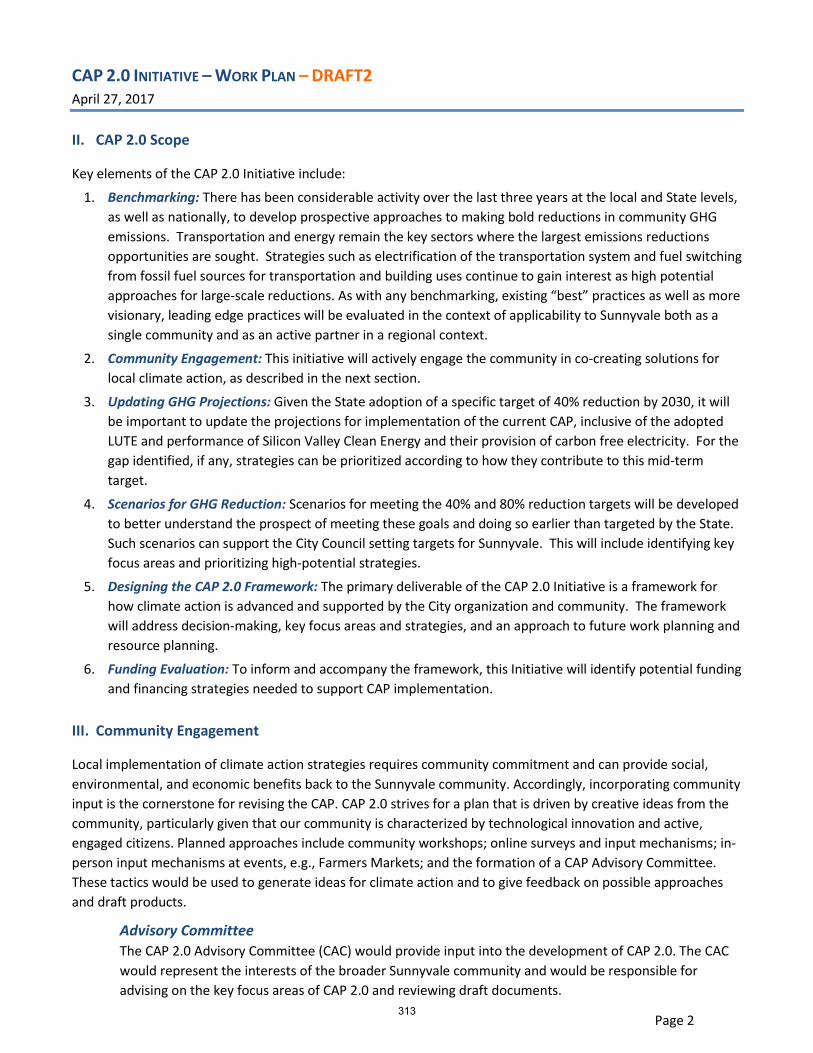
CAP 2.0 INITIATIVE – WORK PLAN – DRAFT2 April 27, 2017
Page 2
II. CAP 2.0 Scope
Key elements of the CAP 2.0 Initiative include:
1. Benchmarking: There has been considerable activity over the last three years at the local and State levels,
as well as nationally, to develop prospective approaches to making bold reductions in community GHG
emissions. Transportation and energy remain the key sectors where the largest emissions reductions
opportunities are sought. Strategies such as electrification of the transportation system and fuel switching
from fossil fuel sources for transportation and building uses continue to gain interest as high potential
approaches for large-scale reductions. As with any benchmarking, existing “best” practices as well as more
visionary, leading edge practices will be evaluated in the context of applicability to Sunnyvale both as a
single community and as an active partner in a regional context.
2. Community Engagement: This initiative will actively engage the community in co-creating solutions for
local climate action, as described in the next section.
3. Updating GHG Projections: Given the State adoption of a specific target of 40% reduction by 2030, it will
be important to update the projections for implementation of the current CAP, inclusive of the adopted
LUTE and performance of Silicon Valley Clean Energy and their provision of carbon free electricity. For the
gap identified, if any, strategies can be prioritized according to how they contribute to this mid-term
target.
4. Scenarios for GHG Reduction: Scenarios for meeting the 40% and 80% reduction targets will be developed
to better understand the prospect of meeting these goals and doing so earlier than targeted by the State.
Such scenarios can support the City Council setting targets for Sunnyvale. This will include identifying key
focus areas and prioritizing high-potential strategies.
5. Designing the CAP 2.0 Framework: The primary deliverable of the CAP 2.0 Initiative is a framework for
how climate action is advanced and supported by the City organization and community. The framework
will address decision-making, key focus areas and strategies, and an approach to future work planning and
resource planning.
6. Funding Evaluation: To inform and accompany the framework, this Initiative will identify potential funding
and financing strategies needed to support CAP implementation.
III. Community Engagement
Local implementation of climate action strategies requires community commitment and can provide social,
environmental, and economic benefits back to the Sunnyvale community. Accordingly, incorporating community
input is the cornerstone for revising the CAP. CAP 2.0 strives for a plan that is driven by creative ideas from the
community, particularly given that our community is characterized by technological innovation and active,
engaged citizens. Planned approaches include community workshops; online surveys and input mechanisms; in-
person input mechanisms at events, e.g., Farmers Markets; and the formation of a CAP Advisory Committee.
These tactics would be used to generate ideas for climate action and to give feedback on possible approaches
and draft products.
Advisory Committee
The CAP 2.0 Advisory Committee (CAC) would provide input into the development of CAP 2.0. The CAC
would represent the interests of the broader Sunnyvale community and would be responsible for
advising on the key focus areas of CAP 2.0 and reviewing draft documents.
313

CAP 2.0 INITIATIVE – WORK PLAN – DRAFT2 April 27, 2017
Page 3
CAC Composition
The CAC is proposed to be a Council-appointed task force, comprised of representatives from various
community sectors as proposed below:
Type Organization/Interest Group No. of Members
Boards/Commissions
Sustainability Commission 2
Planning Commission 1
Bicycle and Pedestrian Advisory Commission 1
Businesses Large businesses 1
Small businesses 1
Real estate developer 1
Residents Residents 2
Volunteer Community Group (Sunnyvale Cool, SUFA, Livable Sunnyvale, etc.)
2
Total (some members may represent >1 interest) 11
Alternates (if primary representative cannot attend/participate) 3
Outreach to Solicit CAC Applicants
A variety of tactics would be used to seek applicants:
Open City Hall/Peak Democracy
Project web page on City website
City website homepage Banner
City & ESD social media accounts
Newspaper advertisements (large
display)
City bulletin boards
Mailing/Email to Associations
Neighborhood Associations (email)
Non-profit groups (email)
Moffett Park Business Group
Chamber of Commerce
City Manager’s Biweekly Report
Sustainable Sunnyvale e-newsletter
IV. Implementation Team
Consultant Support
The initiative would be supported by a consultant firm or team with experience in climate action
planning with an emphasis on community engagement, sound technical evaluation, and innovation. Key
elements of consultant scope would include:
Refinement of work plan approach, leveraging their expertise with similar efforts
Technical execution on the various elements described in Section II
Development and implementation of engagement strategies, including those targeting the
community, City staff, and the City Council
Staffing
CAP 2.0 will be guided by the Executive Leadership Team members of the departments involved in the
initiative. ESD will facilitate implementation of the Initiative and manage the consultant resources. The
Department of Public Works (DPW) and the Community Development Department (CDD) will be the
primary service partners, with the Department of Finance and the Office of the City Manager also
participating. Engagement of these departments is expected to include participation from executives,
managers, and other subject matter experts. Key activities will likely include information and data
314

CAP 2.0 INITIATIVE – WORK PLAN – DRAFT2 April 27, 2017
Page 4
gathering, benchmarking workshops, strategy setting sessions, elements of community engagement,
and review of draft and final products.
Implementing this initiative will take considerable effort from the various departments. ESD’s role as
facilitator is expected to take approximately 85% of a position in total, split across several positions in
the ESD Regulatory Programs Division. As the community outreach component of the current CAP and
this Initiative are better defined, additional staff resources may be proposed in FY 2017-18. DPW and
CDD are each expected to spend at least 150 hours on the Initiative, without considering the
implementation of any new CAP strategies. As the CAP 2.0 Initiative progresses, the Executive Team will
continue to evaluate resource needs and potential impacts to this and other priority projects.
V. Timeline & Budget
The Initiative is expected to take place over 18 months, beginning July 1 with the provision of funding through a
proposed Budget Supplement. The CAP 2.0 Framework is planned to be brought to City Council for
consideration in December 2018. The CAP 2.0 Initiative timeline follows. In addition to key steps for this
initiative, the timeline includes closely related efforts, to acknowledge intersectionality of resources and
products.
A Budget Supplement is included in the proposed budget for FY 2017/18. The supplement requests $250,000 to
cover non-staffing costs including consultant support and implementation of community engagement as part of
the initiative.
In March, staff submitted a grant application for the California Energy Commission’s Local Government
Leadership Challenge. The application included funding to support active implementation of climate action
programs as well as fully funding the CAP 2.0 Initiative. In April, staff were notified that the City’s application
was among the finalists but was not selected for funding.
315

CAP 2.0 INITIATIVE – WORK PLAN – DRAFT2 April 27, 2017
Page 5
CAP 2.0 Timeline
2017 2018
Task A M J J A S O N D J F M A M J J A S O N D
Release Consultant RFP
* Budget Supplement & Workplan to CC
* Consultant Contract Award to CC
Consultant Startup
Research and Idea Gathering
Technical Analysis & Evaluation
* Council Appointment of Advisory Committee
Advisory Committee Meetings (3-6)
Community Workshop(s)
Consider 80% Scenarios
Develop Draft CAP 2.0 (Framework +)
CAP 2.0 Draft for Comment
CAP 2.0 to Commissions
* CAP 2.0 to City Council
Related Initiatives:
Biennial CAP Report Draft
Biennial CAP Report to Sustainability Commission
* Biennial CAP Report to City Council
Sustainability Speaker Series
* EcoDistrict Study Issue to City Council
* Council Action Required
316

City of Sunnyvale
Agenda Item
17-0452 Agenda Date: 5/4/2017
BUDGET SUPPLEMENT NO. 7
SUBJECTBudget Supplement for Increased Supplemental Human Services Funding in Fiscal Year 2017/18
BUDGET SUPPLEMENT REQUEST SUMMARYIncrease Supplemental Human Services Funding and Approve Budget Supplement No. 7 for fundingof up to $50,000
BACKGROUNDFor many years, the City has provided “supplemental human services funding” pursuant to CouncilPolicy on human services. These services were funded by the General Fund, rather than CommunityDevelopment Block Grant (CDBG) funds, the original source of funding for the human services grantprogram. In 2008, Council directed staff to include an annual planned expenditure of $100,000 inGeneral Funds in the City’s 20-year financial plan. The City allocates these funds every two years fora term of up to two years for each grantee. In the past two grant cycles, the Housing and HumanServices Commission (HHSC) has recommended and Council has approved funding in excess of$100,000 for this program. For the past two-year cycle funding totaled $135,000 per year. In the priorcycle, this funding totaled $115,000 per year. In March 2017, the HHSC recommended $150,000 forthis program for each year in the next two-year cycle (2017/18 and 2018/19).
EXISTING POLICYCouncil Policy 5.1.3 Human Services, Policy Statement IIThe City seeks to meet as many Human Service needs as possible using its limited availableresources. The primary resource utilized for funding human services is theFederal Community Development Block Grant (CDBG) which permits up to 15% of the annual grantentitlement to be utilized for such purposes. The City Council may choose to supplement CDBGfunding of human services through the annual Operating Budget process.
DISCUSSIONThe FY 2016/17 Adopted Budget included a project (819720 Outside Group Funding Support [GF])with a planned expenditure of $100,000 starting in FY 2017/18 and through the twenty years of thefinancial plan. As part of the biennial funding cycle for human services Housing and Human ServicesCommission (HHSC) considers and makes recommendations for allocation of 2017 CDBG funds andsupplemental funding in the General Fund. On March 22, 2017, staff provided an evaluation ofhuman services proposals and a recommendation to the HHSC regarding allocation of the plannedsupplemental funding for the next two fiscal years ($100,000, consistent with the financial plan). Staffrecommended that ten human services proposals be funded at the minimum grant amount of$10,000 each. This recommendation does not require a budget supplement, as it does not exceedthe planned funding amount of $100,000; it is contingent on Council approval of the FY 2017/18Recommended Budget, which includes General Fund funding for this project in FY 2017/18.
Page 1 of 4
317

17-0452 Agenda Date: 5/4/2017
At its March 2017 meeting (minutes attached in Attachment 1), the HHSC recommended threealternatives regarding the supplemental human services funding: its preferred scenario was torecommend that Council provide an additional $50,000 in supplemental funding, which would fundtwo additional proposals at $10,000 each (Mayview Health Clinic and Vision First screeningprogram), and would also increase six of the grants from $10,000 to $15,000 (as shown onAttachment 2). If Council did not wish to increase the funding by $50,000, the HHSC recommendedan increase of $20,000, which would be used to provide two additional grants of $10,000 each(Mayview and Vision First), as well as the ten original grants recommended by staff. The thirdscenario was to recommend the staff recommendation, which does not require a budget supplement.
Based on the HHSC recommendation, there are two options for this budget supplement, one for$20,000 and one for $50,000, at Council’s discretion.
Arguments against the SupplementThe two agencies that were not recommended for any FY 2017/18 funding by staff (Mayview Clinicand Healthier Kids Foundation), nor any of their clients or other supporters, attended the MarchHHSC meeting or submitted any comment letter, although staff sent reminders of the meeting andlinks to the agenda packet to all applicants. Mayview submitted a comment letter following themeeting, for consideration at the Council hearing on this matter. In addition, none of the applicantswho attended and spoke at the hearing that had been recommended for funding asked for additionalfunding, although one (Downtown Streets Team) noted that they could provide a higher service levelwith more funding. The speakers thanked the City for its past support and were thankful for the staff-recommended funding amounts.
Many of the applicant agencies have total annual budgets of several million dollars or more. Only fourof the applicants (SALA, Vision Literacy, Friends for Youth, and Sunnyvale Senior Nutrition Program)have annual budgets of less than one million dollars, while one has a budget of nearly $40 million(Catholic Charities). However, many of these agencies serve a large region, and would not commit toproviding a certain increment of services in Sunnyvale if not for the City grants. Nonetheless, many ofthe applicants have stated on multiple occasions that the main importance of the City grants to theiragencies is how it helps them raise additional funding, due to the perception of the city funding as a“seal of approval”, rather than the actual monetary value of the grant itself. This applies primarily tothe General Fund grantees, not the CDBG applicants, where significantly larger grant amounts areinvolved.
Another issue related to this matter is the uncertainty regarding HUD funding in future years. TheWhite House has proposed to eliminate the CDBG program entirely in FY 2018, apparentlypermanently. This may not happen given bipartisan support of the program in Congress, but it ishighly possible that federal funding may be reduced significantly from prior years. If this occurs, theamount of annual CDBG funding that the City receives for administration and CDBG human servicesgrants would be reduced. This funding subsidizes the City’s cost to administer all of the humanservices grants, as a small part of the larger annual Action Plan process and CDBG programadministration. If the CDBG funding is significantly reduced, staff does not recommend increasing thenumber of General Fund grantees when funding in future years for the administration of this programis uncertain, unless General Funds are allocated for human services grant administration, which hasnot previously been part of the Housing Division’s budget.
Page 2 of 4
318

17-0452 Agenda Date: 5/4/2017
Arguments for the SupplementThe HHSC has for several cycles requested that the supplemental funding amount be indexed toinflation (CPI) so that the City can maintain a consistent level of human services provision year toyear. Costs to provide services increase, so if the funding is not increased, the amount of servicedelivered will decrease over time.
Regarding Mayview Clinic, which provides health services at the Columbia Neighborhood Center,potential reforms in federal health care could affect Mayview’s fiscal situation.
SERVICE LEVEL IMPACTThe supplement could potentially provide grants to two additional agencies, and at the higher level,increase funding amounts to several of the recommended agencies. These grants would requireadditional staff time to administer and monitor. As explained above, this administrative expense canbe absorbed with CDBG administrative funds, if levels are similar to prior years. If CDBG funding isreduced, monitoring of all the human services grants could be affected. Service levels of programsprovided directly by city staff would not be impacted by this supplement, however human servicesprovided by the grantee agencies to Sunnyvale clients could be augmented by the additional funds.
FISCAL IMPACTThese grants are awarded on a two-year basis, with automatic renewal-provided the grantee meetsperformance objectives and complies with all grant terms. If the same supplement was not approvedthe following year, staff would not be able to provide the second year’s grant to several agencies dueto a lack of funds and because there is a minimum grant amount of $10,000. Grants of less than thatare not worth it to the agency or the City due to the administrative burden each entails. In the fiscalimpact table below, the 20-year total cost includes just two years of this supplement because if thesupplement is approved, it is reasonable to assume it will be requested for the second funding yearas well, as occurred in the last two-year cycle. However, once the additional or increased grantsbecome established, it is likely the grantees will continue to request grants in subsequent years aswell.
Subject/Title Funding FY 2017/18 20-year Total
Budget Supplement forIncreased Supplemental HumanServices Funding in FY 2017/18
General Funds $20,000 or$50,000
$40,000 or$100,000*
*the supplement would only apply to FY 2017/18 and FY 2018/19
ALTERNATIVES1. Approve Budget Supplement No. 7 in the amount of $50,000.2. Approve Budget Supplement No. 7 for a different dollar amount or timing.3. Do not approve Budget Supplement No. 7.4. Other directions provided by Council.
STAFF RECOMMENDATIONStaff recommends Alternative 3: Do not approve Budget Supplement No. 7.
Staff recommends Alternative 3. Requests for human services funding will always exceed the amountof funding available. If the funding amount is continually increased to meet all requests, the number
Page 3 of 4
319
17-0452 Agenda Date: 5/4/2017
of proposals and/or requested funding amounts will continue to increase each cycle. In addition, theuncertainty regarding the future of the federal CDBG Program is reason for caution in expanding thisprogram at this time. Other sources of funding, including philanthropic foundations, charitabledonations, and so on, may be available to these agencies to allow them to meet local needs forhuman services.
Prepared by: Suzanne Isé, Housing OfficerReviewed by: Trudi Ryan, Director, Community Development DepartmentReviewed by: Timothy J. Kirby, Director of FinanceReviewed by: Kent Steffens, Assistant City ManagerApproved by: Deanna J. Santana, City Manager
ATTACHMENTS1. Meeting Minutes of March 22, 2017 Housing and Human Services Commission2. Human Services Grant Recommendations
Page 4 of 4
320

City of Sunnyvale
Meeting Minutes - Final
Housing and Human Services
Commission
7:00 PM West Conference Room, City Hall, 456 W.
Olive Ave., Sunnyvale, CA 94086
Wednesday, March 22, 2017
CALL TO ORDER
Chair Evans called the meeting to order at 7:02 p.m.
SALUTE TO THE FLAG
Chair Evans led the salute to the flag.
ROLL CALL
Chair Patti Evans
Vice Chair Minjung Kwok
Commissioner Diana Gilbert
Commissioner Joshua Grossman
Commissioner Ken Hiremath
Commissioner Avaninder Singh
Commissioner Elinor Stetson
Present: 7 -
Council Liaison Glenn Hendricks (absent)
ORAL COMMUNICATIONS
None.
CONSENT CALENDAR
Chair Evans asked if anyone wanted to discuss any of the items on the consent
calendar. No one did.
1.A 17-0282 Approve the Housing and Human Services Commission
Meeting Minutes of November 16, 2016
1.B 17-0284 Approve the Housing and Human Services Commission
Meeting Minutes of February 22, 2017
Approve the Housing and Human Services Commission Minutes of February 22,
2017 as submitted.
Page 1City of Sunnyvale
Attachment 1
321

March 22, 2017Housing and Human Services
Commission
Meeting Minutes - Final
1.C 17-0283 Approve 2017 Draft Master Work Plan
Chair Evans asked for a motion.
MOTION: Commissioner Gilbert moved and Commissioner Singh seconded the
motion to approve the consent calendar as submitted.
The motion carried by the following vote:
Yes: Chair Evans
Vice Chair Kwok
Commissioner Gilbert
Commissioner Grossman
Commissioner Hiremath
Commissioner Singh
Commissioner Stetson
7 -
No: 0
PUBLIC HEARINGS/GENERAL BUSINESS
2 17-0300 Evaluations and Funding Recommendations for FY 2017-18
Human Services Grants and CDBG Capital Project Loans
Housing Officer Suzanne Isé gave a short presentation and an explanation about
how the federal budget affected staff’s approach to the recommendations due to
the high level of uncertainty.
The commissioners asked some questions of staff about the process before Chair
Evans opened the public hearing at 7:36 p.m.
The following representatives spoke on behalf of their programs and thanked staff
and the commissioners for their funding recommendations and past support.
● Pilar Furlong, Bill Wilson Center: Counseling Services for At-Risk Youth.
● Teresa Johnson, the Health Trust: Meals on Wheels Program
● Marie Bernard, Sunnyvale Community Services: Food Assistance Program
● Greg Pensinger, Downtown Town Streets Team: WorkFirst Sunnyvale Program.
● Martin Chavez and Amanda Olsen, Downtown Streets Team: Community
Outreach Program
● Wanda Hale, Catholic Charities of Santa Clara County: Long Term Care
Ombudsman Program.
Page 2City of Sunnyvale
Attachment 1
322
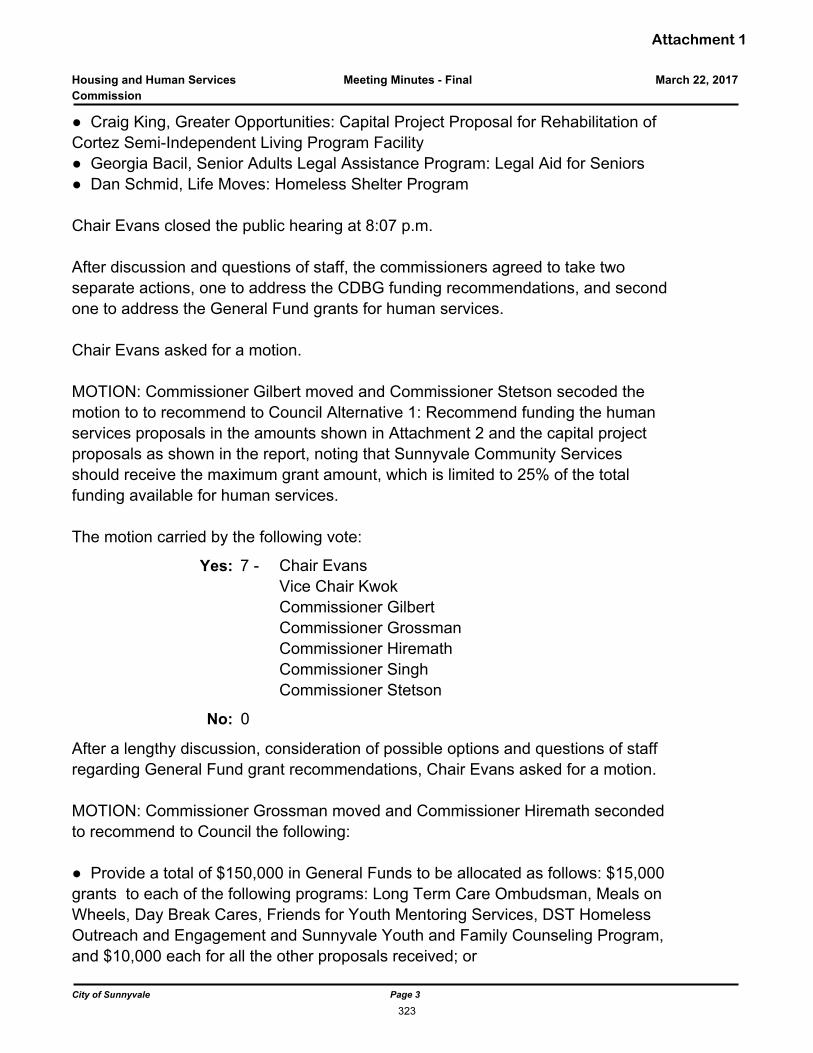
March 22, 2017Housing and Human Services
Commission
Meeting Minutes - Final
● Craig King, Greater Opportunities: Capital Project Proposal for Rehabilitation of
Cortez Semi-Independent Living Program Facility
● Georgia Bacil, Senior Adults Legal Assistance Program: Legal Aid for Seniors
● Dan Schmid, Life Moves: Homeless Shelter Program
Chair Evans closed the public hearing at 8:07 p.m.
After discussion and questions of staff, the commissioners agreed to take two
separate actions, one to address the CDBG funding recommendations, and second
one to address the General Fund grants for human services.
Chair Evans asked for a motion.
MOTION: Commissioner Gilbert moved and Commissioner Stetson secoded the
motion to to recommend to Council Alternative 1: Recommend funding the human
services proposals in the amounts shown in Attachment 2 and the capital project
proposals as shown in the report, noting that Sunnyvale Community Services
should receive the maximum grant amount, which is limited to 25% of the total
funding available for human services.
The motion carried by the following vote:
Yes: Chair Evans
Vice Chair Kwok
Commissioner Gilbert
Commissioner Grossman
Commissioner Hiremath
Commissioner Singh
Commissioner Stetson
7 -
No: 0
After a lengthy discussion, consideration of possible options and questions of staff
regarding General Fund grant recommendations, Chair Evans asked for a motion.
MOTION: Commissioner Grossman moved and Commissioner Hiremath seconded
to recommend to Council the following:
● Provide a total of $150,000 in General Funds to be allocated as follows: $15,000
grants to each of the following programs: Long Term Care Ombudsman, Meals on
Wheels, Day Break Cares, Friends for Youth Mentoring Services, DST Homeless
Outreach and Engagement and Sunnyvale Youth and Family Counseling Program,
and $10,000 each for all the other proposals received; or
Page 3City of Sunnyvale
Attachment 1
323
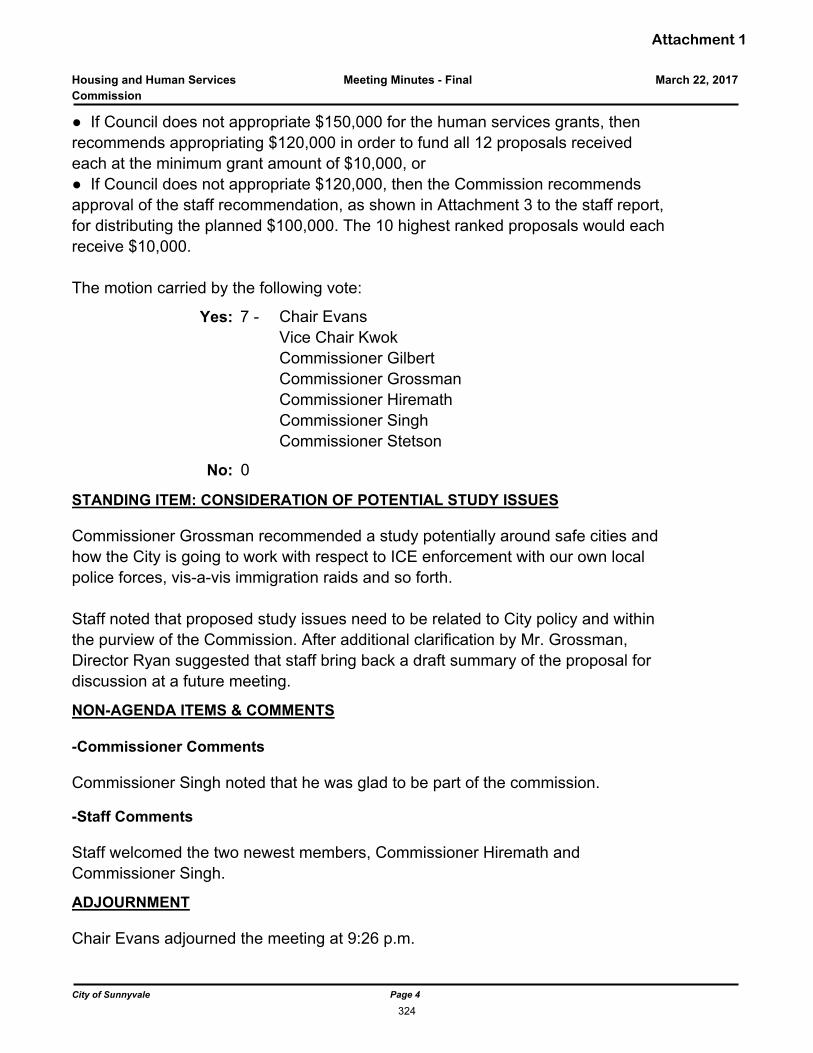
March 22, 2017Housing and Human Services
Commission
Meeting Minutes - Final
● If Council does not appropriate $150,000 for the human services grants, then
recommends appropriating $120,000 in order to fund all 12 proposals received
each at the minimum grant amount of $10,000, or
● If Council does not appropriate $120,000, then the Commission recommends
approval of the staff recommendation, as shown in Attachment 3 to the staff report,
for distributing the planned $100,000. The 10 highest ranked proposals would each
receive $10,000.
The motion carried by the following vote:
Yes: Chair Evans
Vice Chair Kwok
Commissioner Gilbert
Commissioner Grossman
Commissioner Hiremath
Commissioner Singh
Commissioner Stetson
7 -
No: 0
STANDING ITEM: CONSIDERATION OF POTENTIAL STUDY ISSUES
Commissioner Grossman recommended a study potentially around safe cities and
how the City is going to work with respect to ICE enforcement with our own local
police forces, vis-a-vis immigration raids and so forth.
Staff noted that proposed study issues need to be related to City policy and within
the purview of the Commission. After additional clarification by Mr. Grossman,
Director Ryan suggested that staff bring back a draft summary of the proposal for
discussion at a future meeting.
NON-AGENDA ITEMS & COMMENTS
-Commissioner Comments
Commissioner Singh noted that he was glad to be part of the commission.
-Staff Comments
Staff welcomed the two newest members, Commissioner Hiremath and
Commissioner Singh.
ADJOURNMENT
Chair Evans adjourned the meeting at 9:26 p.m.
Page 4City of Sunnyvale
Attachment 1
324

Human Services:General Fund Grant Recommendations
Attachment 2
GF Applicant Program
3/22 Staff Recommend-
ationAmount
Requested DifferenceAverage
Score
FY16/17 Grant
Contract HHSC Alt A HHSC Alt BCatholic Charities of Santa Clara County Long-term Care Ombudsman 10,000$ 20,000$ (10,000)$ 86 $ 10,000 15,000$ 10,000$ The Health Trust Meals on Wheels 10,000$ $ 24,000 (14,000)$ 85 $ 16,000 15,000$ 10,000$ Abilities United Adult Services 10,000$ $ 12,073 (2,073)$ 85 $ 10,000 10,000$ 10,000$
Live Oak Adult Day ServicesAdult Day Care, Cupertino Center 10,000$ $ 10,000 -$ 82 $ 5,000 10,000$ 10,000$
SALALegal Assistance for Sunnyvale Elders 10,000$ 10,000$ -$ 81 $ 10,000 10,000$ 10,000$
Catholic Charities of Santa Clara County
Day Break Cares: Adult Day Care Program 10,000$ $ 15,000 (5,000)$ 81 $ 10,000 15,000$ 10,000$
Friends for Youth
Mentoring Services: A Positive Alternative for Sunnyvale Youth 10,000$ 24,650$ (14,650)$ 76 $ 15,000 15,000$ 10,000$
Friends of Vision LiteracyEnglish Language Development Class 10,000$ 10,500$ (500)$ 74 $ 10,000 10,000$ 10,000$
Downtown Streets, IncHomeless Outreach & Community Engagement 10,000$ 24,177$ (14,177)$ 72 -$ 15,000$ 10,000$
Family & Children Services of Silicon Valley
Youth & Family Counseling Program 10,000$ 24,480$ (14,480)$ 72 $ 14,000 15,000$ 10,000$
Healthier Kids Foundation of Santa Clara County VisionFirst Screenings -$ $ 14,000 (14,000)$ 68 $ 10,000 10,000$ 10,000$
MayView Community Health CenterLab Services for Uninsured / Low-Income Residents -$ $ 24,999 (24,999)$ 65 $ - 10,000$ 10,000$
100,000$ 213,879$ (113,879)$ 150,000$ 120,000$ 100,000$ (50,000)$ (20,000)$ Total Funds Available (Deficit)
Total
The Commission's full recommendation regarding supplemental funding (General Funds) for human services grants are provided in its March meeting minutes. In brief, the Commission recommended a total of $150,000 in General Funds allocated to the proposals as shown under Alternative A, above. If Council does not approve the budget at that level, the Commission's next preference was to allocate $120,000, as shown in Alternative B. If Council does not approve the budget at that level, the Commission recommended approval of the 3/22 staff recommendation for distributing the planned $100,000, as shown above. Please see the minutes for further detail.
325

This Page Intentionally Blank
326

City of Sunnyvale
Agenda Item
17-0456 Agenda Date: 5/4/2017
BUDGET SUPPLEMENT NO. 8
SUBJECTFeasibility Study for Development of a Class 1 Bicycle and Pedestrian Trail Along Evelyn Avenue
BUDGET SUPPLEMENT REQUEST SUMMARYThis Budget Supplement requests $100,000 for consultant services to examine the feasibility ofdeveloping of a Class 1 Bicycle Trail along Evelyn Avenue adjacent to the Caltrain Railroad tracksthat will connect Downtown Sunnyvale with Mountain View.
BACKGROUNDThe study in coordination with the City of Mountain View and Caltrain would examine the feasibility ofthe proposed implementation of Class 1 Bike Trail (separate from the road), that will connectDowntown Sunnyvale with Mountain View. The study will also review safety concerns if any,including clearance requirements of the Caltrain railroad facilities, assessment of the required right-of-way and development of conceptual cost estimates. The removal of existing Class II Bicycle Laneson Evelyn Avenue, and restriping of Evelyn Avenue may be needed to accommodate the proposedtrail.
The study was proposed by Councilmember Klein and co-sponsored by Vice Mayor Larsson andCouncilmember Melton as part of the 2017 Study/Budget Issues process and subsequently rankedfor study by the City Council (Study Issue DPW 17-12). Council directed staff to include the study forconsideration with FY 2017/18 Recommended Budget as a Budget Supplement.
EXISTING POLICYGeneral Plan, Chapter 3, Land Use and Transportation, Policy LT-1.9b:Promote modes of travel and actions that reduce single-occupant vehicle trips and trip lengths.
General Plan, Chapter 3, Land Use and Transportation, Policy LT-5.5:Support a variety of transportation modes.
General Plan, Chapter 3, Land Use and Transportation, Policy LT-5.8:Provide a safe and comfortable system of pedestrian and bicycle pathways.
General Plan, Chapter 5, Housing, Policy HE-6.3: Continue a high quality of maintenance forpublic streets, rights-of-way, and recreational areas, and provide safe pedestrian, bike, and transitlinkages (accessibility) between jobs, residences, transportation hubs, and goods and services.
DISCUSSIONThe City has a goal to increase the bike ridership, and to achieve this goal new standards and bicyclefacilities are being introduced between various activity centers. The new bike facilities will make
Page 1 of 2
327
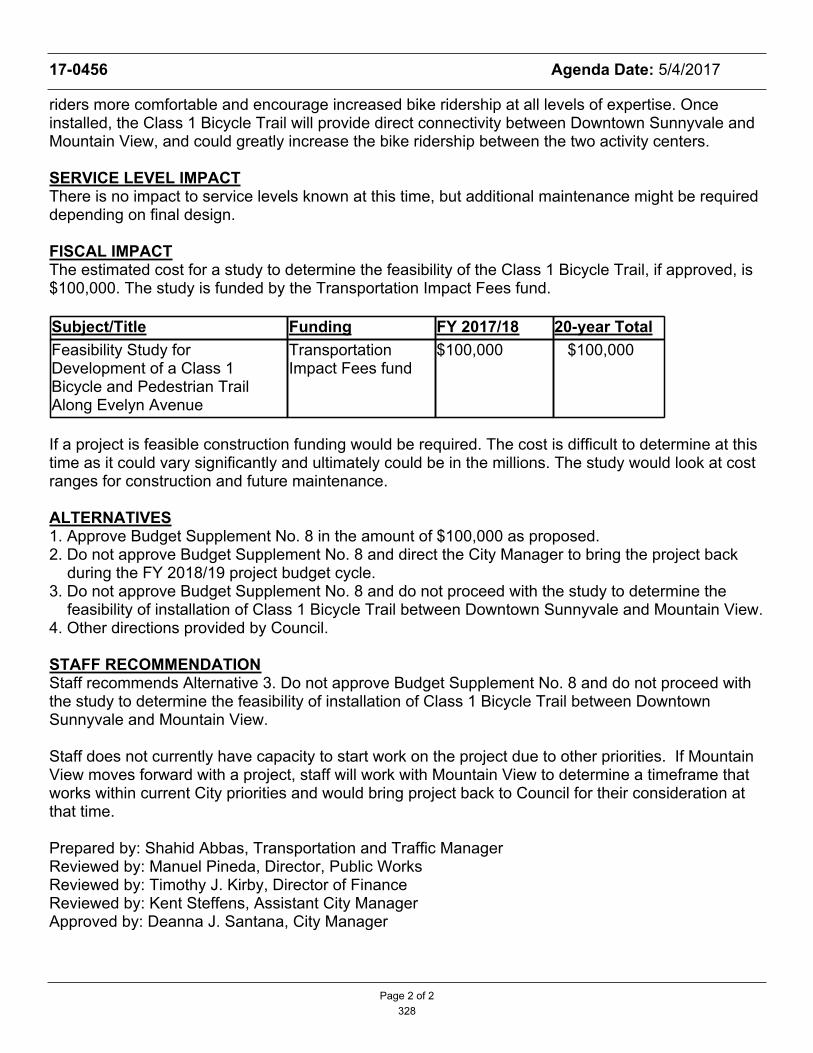
17-0456 Agenda Date: 5/4/2017
riders more comfortable and encourage increased bike ridership at all levels of expertise. Onceinstalled, the Class 1 Bicycle Trail will provide direct connectivity between Downtown Sunnyvale andMountain View, and could greatly increase the bike ridership between the two activity centers.
SERVICE LEVEL IMPACTThere is no impact to service levels known at this time, but additional maintenance might be requireddepending on final design.
FISCAL IMPACTThe estimated cost for a study to determine the feasibility of the Class 1 Bicycle Trail, if approved, is$100,000. The study is funded by the Transportation Impact Fees fund.
Subject/Title Funding FY 2017/18 20-year Total
Feasibility Study forDevelopment of a Class 1Bicycle and Pedestrian TrailAlong Evelyn Avenue
TransportationImpact Fees fund
$100,000 $100,000
If a project is feasible construction funding would be required. The cost is difficult to determine at thistime as it could vary significantly and ultimately could be in the millions. The study would look at costranges for construction and future maintenance.
ALTERNATIVES1. Approve Budget Supplement No. 8 in the amount of $100,000 as proposed.2. Do not approve Budget Supplement No. 8 and direct the City Manager to bring the project back
during the FY 2018/19 project budget cycle.3. Do not approve Budget Supplement No. 8 and do not proceed with the study to determine the
feasibility of installation of Class 1 Bicycle Trail between Downtown Sunnyvale and Mountain View.4. Other directions provided by Council.
STAFF RECOMMENDATIONStaff recommends Alternative 3. Do not approve Budget Supplement No. 8 and do not proceed withthe study to determine the feasibility of installation of Class 1 Bicycle Trail between DowntownSunnyvale and Mountain View.
Staff does not currently have capacity to start work on the project due to other priorities. If MountainView moves forward with a project, staff will work with Mountain View to determine a timeframe thatworks within current City priorities and would bring project back to Council for their consideration atthat time.
Prepared by: Shahid Abbas, Transportation and Traffic ManagerReviewed by: Manuel Pineda, Director, Public WorksReviewed by: Timothy J. Kirby, Director of FinanceReviewed by: Kent Steffens, Assistant City ManagerApproved by: Deanna J. Santana, City Manager
Page 2 of 2
328

City of Sunnyvale
Agenda Item
17-0500 Agenda Date: 5/4/2017
BUDGET SUPPLEMENT NO. 9
SUBJECTParkland/Open Space Initiative
BUDGET SUPPLEMENT REQUEST SUMMARYProvide funds for consultant services and other expenses to assist with the analysis, scoping,planning, and community engagement necessary to support a Parkland/Open Space Policy/Initiativewith the goal to capture the public’s interest in establishing a policy relative to preserving and/or landuse of the City’s parkland and approve Budget Supplement No. 9 for funding of $250,000.
BACKGROUNDThe Parkland/Open Space Policy/Initiative was identified as a Budget Issue at the January 27, 2017Strategic Session on Council Policy Priorities to help establish the City’s scope and resources forsetting new Parkland/Open Space Policy/Initiative. It originated from the Open Space Acquisition andPlanning: Future of Golf Courses policy priority established by Council in 2014.
EXISTING POLICYGeneral Plan, Chapter 3, Land Use and Transportation - Open Space
Policy LT-2.2 Encourage nodes of interest and activity, such as parks, public open spaces,well planned development, mixed use projects, and other desirable uses, locations andphysical attractions
Goal LT 8 Adequate and Balanced Open SpaceProvide and maintain adequate and balanced open space and recreation facilities for thebenefit of maintaining a healthy community based on community needs and the ability of thecity to finance, construct, maintain and operate these facilities now and in the future.
Goal LT 9 Regional Approach to Providing and Preserving Open SpaceThe City embraces a regional approach to providing and preserving open space and providingopen space and recreational services, facilities and amenities for the broader community
General Plan, Chapter 4, Housing Element, Policy HE-6.2. Promote neighborhood vitality byproviding adequate community facilities, infrastructure, landscaping and open space, parking, andpublic health and safety within new and existing neighborhoods.
DISCUSSIONThis comprehensive effort would include a service contract from a consultant firm or the hiring of alimited duration staff member to assist with the analysis, scoping, planning, and communityengagement necessary to support the Parkland/Open Space Policy/Initiative. The scoping of this
Page 1 of 3
329

17-0500 Agenda Date: 5/4/2017
effort is undetermined and requires further refinement; however, given staff changes and workload,the organization is not well positioned to absorb an effort that requires significant coordination,examination of land use implications, and community outreach. Preliminarily, based on City Councildiscussion, the purpose of this effort would be to capture the public’s interest in establishing a policyrelative to preserving and/or land use of the City’s parkland. Community engagement efforts wouldinclude community meetings, online and in-person forums/surveys, keeping the public informed ofkey milestones of this effort, social media channel outreach, focus groups, and outreach withstakeholders, including appropriate boards/commissions.
SERVICE LEVEL IMPACTCouncil approval of this supplement would cause no direct impact on service levels as consultantservices and/or hiring limited duration staff will eliminate the need to refocus existing City resourceson this effort. However, any policy setting will have a future impact of existing service levels, whichwill be included in the analysis included in this effort.
FISCAL IMPACTThis proposed budget supplement is an estimate for the one-time costs associated with this effort.Due to competing priorities, the scoping of this effort has not yet been fully developed and requiresfurther refinement. The estimated fiscal impact is based on City Council discussion during theJanuary 27, 2017 Strategic Session on Council Policy Priorities when this item was identified as aBudget Issue.
Subject/Title Funding FY 2017/18 20-year Total
Parkland/Open SpacePolicy/Initiative
General Fund $250,000 $250,000
ALTERNATIVES1. Approve Budget Supplement No. 9 to provide funds in the amount of $250,000 for consultant
services and other expenses to assist with the analysis, scoping, planning, and communityengagement necessary to support a Parkland/Open Space Policy/Initiative.
2. Approve the supplement for a different dollar amount or timing.3. Do not approve the supplement.4. Other directions provided by Council.
STAFF RECOMMENDATIONAlternative 1: Approve Budget Supplement No. 9 to provide funds in the amount of $250,000 forconsultant services and other expenses to assist with the analysis, scoping, planning, and communityengagement necessary to support a Parkland/Open Space Policy/Initiative.
Parkland and open space is highly valued by all segments and members of the Sunnyvalecommunities, and engaging them in our efforts to establish policy relative to preserving and/or landuse of the City’s parkland is a logical and necessary first step. As mentioned in January and again atthe February Study Issues Workshop and in related materials, existing resources cannot absorb theworkload associated with a robust and thorough engagement process.
Prepared by: Catlin Ivanetich, Senior Management Analyst
Page 2 of 3
330

17-0500 Agenda Date: 5/4/2017
Reviewed by: Timothy J. Kirby, Director of FinanceReviewed by: Walter C. Rossmann, Assistant City ManagerApproved by: Deanna J. Santana, City Manager
Page 3 of 3
331

This Page Intentionally Blank
332
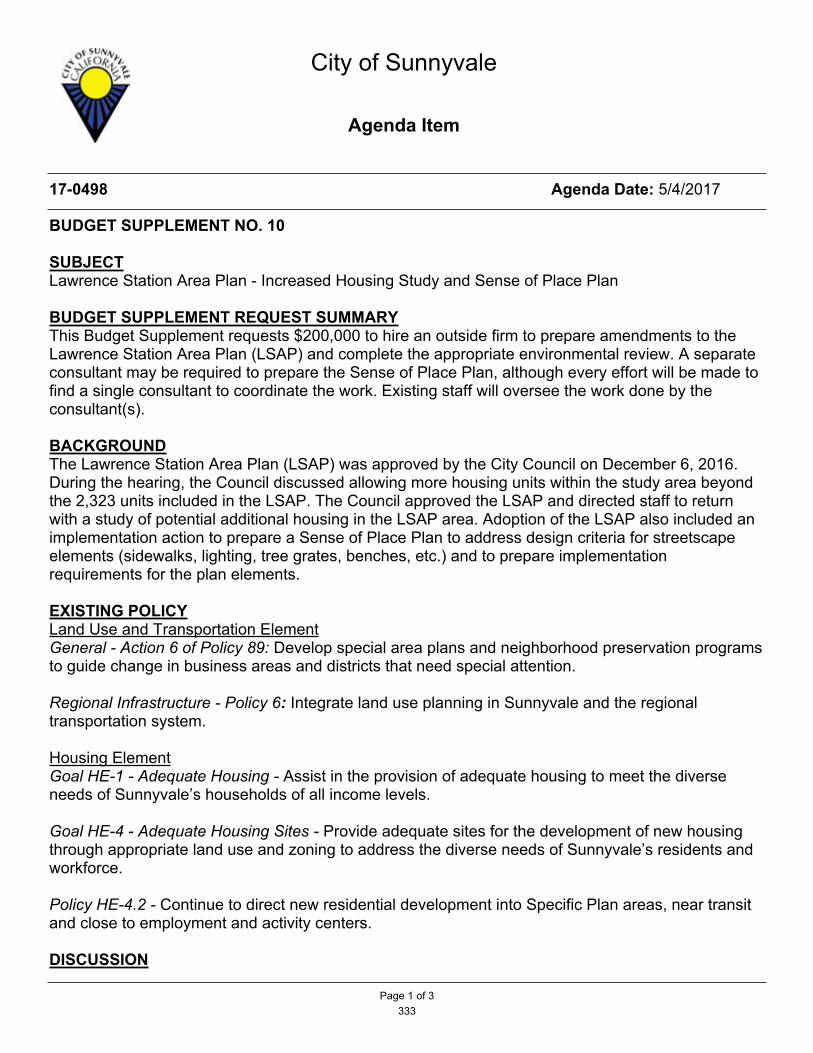
City of Sunnyvale
Agenda Item
17-0498 Agenda Date: 5/4/2017
BUDGET SUPPLEMENT NO. 10
SUBJECTLawrence Station Area Plan - Increased Housing Study and Sense of Place Plan
BUDGET SUPPLEMENT REQUEST SUMMARYThis Budget Supplement requests $200,000 to hire an outside firm to prepare amendments to theLawrence Station Area Plan (LSAP) and complete the appropriate environmental review. A separateconsultant may be required to prepare the Sense of Place Plan, although every effort will be made tofind a single consultant to coordinate the work. Existing staff will oversee the work done by theconsultant(s).
BACKGROUNDThe Lawrence Station Area Plan (LSAP) was approved by the City Council on December 6, 2016.During the hearing, the Council discussed allowing more housing units within the study area beyondthe 2,323 units included in the LSAP. The Council approved the LSAP and directed staff to returnwith a study of potential additional housing in the LSAP area. Adoption of the LSAP also included animplementation action to prepare a Sense of Place Plan to address design criteria for streetscapeelements (sidewalks, lighting, tree grates, benches, etc.) and to prepare implementationrequirements for the plan elements.
EXISTING POLICYLand Use and Transportation ElementGeneral - Action 6 of Policy 89: Develop special area plans and neighborhood preservation programsto guide change in business areas and districts that need special attention.
Regional Infrastructure - Policy 6: Integrate land use planning in Sunnyvale and the regionaltransportation system.
Housing ElementGoal HE-1 - Adequate Housing - Assist in the provision of adequate housing to meet the diverseneeds of Sunnyvale’s households of all income levels.
Goal HE-4 - Adequate Housing Sites - Provide adequate sites for the development of new housingthrough appropriate land use and zoning to address the diverse needs of Sunnyvale’s residents andworkforce.
Policy HE-4.2 - Continue to direct new residential development into Specific Plan areas, near transitand close to employment and activity centers.
DISCUSSION
Page 1 of 3
333

17-0498 Agenda Date: 5/4/2017
SCOPE OF THE STUDYThis study would consider options available to increase housing opportunities and create the senseof place plan within the LSAP area.
The LSAP Housing Study may include options, such as:· Raising the cap on allowable dwelling units in the plan area (without any other changes to the
development standards);· Increase of the maximum dwelling units per acre allowance for properties where residential
development is already allowed;· Allow residential development in plan areas that were not originally zoned for residential units;
· Studying the conversion of existing industrial condominium units to allow for live/worksituations; and,
· Additional environmental review for the increased number of housing units being considered inthe LSAP.
The LSAP Sense of Place Plan will:· Identify desirable unifying streetscape elements;
· Determine which elements are developer requirements and which may require a fee forcoordinated off-site improvement; and
· Determine the Sense of Place fee amount for new development and changes of use.
Both the housing study and sense of place plan will include community outreach as well as studysessions and public hearings with the Planning Commission and City Council.
SERVICE LEVEL IMPACTThere would be no impact to service levels with this budget supplement because the money wouldbe used to hire an outside consultant(s) with specialized knowledge on area plans, sense of placeplans and environmental review. The City collects General Plan Maintenance fees that can be usedto fund this study.FISCAL IMPACT
Subject/Title Funding FY 2017/18 20-year Total
Lawrence Station Area Plan -Housing Study and Sense ofPlace Plan
General Fund $200,000 $200,000
ALTERNATIVES1. Approve Budget Supplement No. 10 in the amount of $200,000 as proposed.2. Approve Budget Supplement No. 10 for a different dollar amount or timing.3. Do not approve Budget Supplement No. 10.4. Other directions provided by Council.
STAFF RECOMMENDATIONAlternative 1: Approve Budget Supplement No. 10 in the amount of $200,000 to conduct the LSAPHousing Study and create the LSAP Sense of Place Plan.
Page 2 of 3
334
17-0498 Agenda Date: 5/4/2017
Creating housing near transit is in keeping with the goals of the General Plan and responds to thehigh housing demand in the Bay Area. Additional housing units could be provided with a higher capon total residential units, on portions of the plan that currently do not contemplate housing, or athigher densities within the LSAP to increase the housing options in the City of Sunnyvale. Additionalenvironmental review would be necessary to study increased housing in the LSAP and would enablethe City to make informed decisions on where housing is best suited.
The Sense of Place Plan will ensure public improvements are coordinated and completed throughoutthe LSAP area in a distinctive and well-designed manner.
Prepared by: Amber Blizinski, Principal PlannerReviewed by: Andrew Miner, Planning OfficerReviewed by: Trudi Ryan, Director, Community DevelopmentReviewed by: Timothy J. Kirby, Director of FinanceReviewed by: Kent Steffens, Assistant City ManagerApproved by: Deanna J. Santana, City Manager
Page 3 of 3
335

This Page Intentionally Blank
336

Glossary of Budget Terms

GLOSSARY OF BUDGET TERMS Accrual The basis of accounting that recognizes revenues when earned and expenses when incurred, regardless of
when cash changes hands. Activity Under the City’s Performance Based Budget structure, an activity is the lowest level cost center within an
operating program. It incorporates quantity and/or cycle time, and costs to provide a specific service. Allocated Costs A method for allocating overhead time and other expenses to activities that provide direct services. Appropriations Expenditure authority created by City Council. Asset Forfeiture Fund This fund accounts for the proceeds from sale of assets seized primarily from illegal narcotics activities.
Asset Forfeiture funds are used for law enforcement purposes. Basis of Budgeting Basis of budgeting refers to the method used for recognizing revenues and expenditures in the budget. The
City uses the modified accrual basis of accounting for budgetary purposes, which is in compliance with Generally Accepted Accounting Principles.
Base Budget Those resources necessary to meet an established and existing service level. Budget A financial plan consisting of an estimate of proposed expenditures, the proposed means of financing those
expenditures and the corresponding purposes for a given time period. Budget Issue A request to add a new service or increase/decrease an existing service level. Budget Issues referred for
consideration by City Council to the City Manager become Budget Supplements. Budget Modification A change in expenditure levels and corresponding resources needed to accomplish an existing service level
or unanticipated service. All budget modifications are reflected in the current year budget and have been approved by City Council.
Budget Supplement A proposal for an increase or decrease in an existing service level (over and above the base budget) or to
add a new service. All Budget Supplements are considered with the City Manager’s Recommended Budget.
Business License Tax This two-year tax is based on the number of employees or rental units (for rental properties). Beginning in
337

GLOSSARY OF BUDGET TERMS
2010, this tax was annually adjusted for inflation. Comprehensive Annual Financial Report (CAFR)
A set of governmental financial statements that complies with the accounting standards set by the Governmental Accounting Standards Board.
Capital Project A capital improvement that usually requires a major initial investment, and results in a new asset for the
City. Capital Projects Fund Funds that are used to account for financial resources to be used for the acquisition or construction of major
capital projects (other than those financed by enterprise funds). Community Condition Indicator A statistical measure of existing conditions within the City. These provide tangible and quantitative
expressions of the General Plan’s goals, while some indicators directly impact City services.
Community Development Block Grant Fund (CDBG)
This fund accounts for use of community development block grant funds received from the federal government. Other revenues in this fund include repayments of commercial and residential loans and rental income from City property. Funds are used for programs or projects that increase affordable housing and benefit people with special needs such as senior and handicapped citizens.
Construction Tax This tax is levied by City ordinance at a rate of $0.0054 of the building permit valuation. Debt Service Principal and interest requirements on outstanding debt. Depreciation A method of allocating the cost of an asset over its useful life. Development Enterprise Fund This fund contains development-related activities, expenses, and associated revenues. This includes
operating activities primarily within the Building and Planning divisions of the Community Development Department.
Employment Development Fund This fund accounts for various Federal funds and program revenues used for workforce development
activities conducted by the North Valley Job Training Consortium (NOVA). Employee Benefits Fund This fund accounts for charges to City salary expenditures for leave time, employee benefits, workers
compensation and retirement benefits on a cost reimbursement basis.
338

GLOSSARY OF BUDGET TERMS Enterprise Fund These funds are used to account for operations that are financed and operated in a manner similar to private
business where the intent of the governing body is that the costs of providing goods or services to the general public on a continuing basis be financed or recovered primarily through user charges (eg: Utility and Golf and Tennis activities).
Expenditure The actual outlay of funds from the City treasury. Fiscal Year A 12-month period of time, from July 1 through June 30. Full Cost Accounting A managerial accounting technique that accumulates both direct and indirect costs for financial reporting
and decision making purposes. This technique helps the City assess the true cost of providing a service in relation to the associated benefits.
Fund A fiscal and accounting entity that has a self-balancing set of accounts that comprise its assets, liabilities,
fund equity, revenues, and expenditures. City resources are allocated to and accounted for in individual funds based upon the purpose for which they are to be spent and the means by which spending activities are controlled.
Funding Sources Identifies resources that will support City expenditures. Gas Tax Fund This fund is required by state law to account for gas tax revenues received from the state and expended for
construction and maintenance of City streets. General Fund A fund that accounts for all financial resources necessary to carry out basic governmental activities of the
City that are not accounted for in another fund. The General Fund supports essential City services such as police and fire protection, street maintenance, libraries, and parks and open space maintenance. Revenues to support the General Fund are derived from sources such as property tax, sales tax, franchise fees and service fees.
General Plan The General Plan is a long range planning document that provides the City a framework for action and the
direction in which to focus that action. General Plan chapters address the delivery of services to the community.
339

GLOSSARY OF BUDGET TERMS General Plan Goal A long-term condition or end result that the City will work toward. Broad goals are set to maintain or affect
community conditions. General Services Fund This fund accounts for charges to City Programs for use of fleet equipment, building space, print shop
services and computer services on a cost reimbursement basis. Golf and Tennis Fund This fund is used to account for all of the revenues and expenses related to the two city-operated golf
courses and the tennis center. Governmental Funds Governmental funds are used to account for functions of the City that are principally supported by taxes and
intergovernmental revenues. The governmental activities of the City include planning and management, public safety, community development, transportation, socioeconomic, cultural and environmental management.
Grant A contribution by a government or other organization to support a particular function.
Housing Fund This fund is used to account for housing mitigation revenue and Below Market Rate (BMR) program funds for the City’s affordable housing needs. Funds are expended on special and capital projects designed to achieve the City’s goal of affordable housing and community development.
In-Lieu Charges
Each fund’s share of Citywide overhead costs for programs such as: Finance, Human Resources, Office of the City Attorney, and Office of the City Manager.
Infrastructure Renovation and Replacement Fund
A fund used to account for resources used for the City’s long-term infrastructure renovation and replacement program.
Infrastructure Project A project that is designed for the renovation and/or replacement of infrastructure assets. Interfund Transfer Amounts transferred from one fund to another. Internal Service Funds These are funds used to account for the financing of goods or services provided by one department or
program to other departments or programs of the City on a cost-reimbursement basis.
340

GLOSSARY OF BUDGET TERMS Liability and Property Insurance Fund
This fund accounts for charges to City Funds for property and liability insurance on a cost reimbursement basis.
Legislative Issues Major policy decisions made by the City Council on matters such as General Plan policies, ordinances, and
resolutions requiring study that need to be scheduled on Council's calendar. Operating Budget A financial plan for the provision of direct services and support functions. Operating Program The City manages under a performance budget concept organized by programs, service delivery plans and
activities. There are two fundamental types of programs - direct services, which produce results directly affecting constituents or the environment; and support, which serve the direct services programs.
Origination Year The origination year is the fiscal year a project and its related costs were put into the Resource Allocation
Plan. This is not necessarily the year the project is started. Outside Group Funding Project A project that captures City contributions made to local community-based organizations. These projects are
funded from Community Development Block Grant (CDBG) and General funds.
Park Dedication Fund This fund is used to account for funds that developers contribute towards the acquisition, construction, or renovation of neighborhood and community parks and park facilities.
Parking District Fund This fund accounts for special assessments levied on the real property located in the City’s downtown
parking district. The revenues in this fund are used to maintain parking lots located within the district. Performance Based Budget A budget wherein expenditures are based primarily upon measurable performance of activities. Police Services Augmentation Fund
This fund accounts for monies received from the federal and state governments, which are expended to enhance law enforcement services.
Products In the City’s Performance Based Budget structure, products are the end results of activities that support
program performance and workload indicators. Program Performance and Define the program’s quantifiable and measurable results that are expected to be produced by completing
341

GLOSSARY OF BUDGET TERMS Workload Indicators the work or activities included in the program. Program Manager A supervisor or manager who plans and manages the execution of one or more of the City's operating
programs. Project Category Projects are categorized into four areas: Capital, Special, Outside Group Funding, and Infrastructure. Project Coordinator A person who coordinates the project for the user department.
Project Costs All the costs associated with a project. These costs include prior year actual expenditures, current year
budgeted expenditures and future year planned expenditures over a 20 year planning period. Project Description/Scope/ Purpose
Provides a summary description of a project, including the results to be accomplished, timeframe and basis for project costs.
Project Evaluation and Analysis Provides a discussion of the financial and operational justifications for the project. Addresses any cost
savings or efficiency gains by completing this project and any other alternatives that were considered in the decision to fund the project.
Project Manager A supervisor or manager who plans and manages the execution of one or more of the City’s projects. Project Number/Name Existing number and title in the City’s financial system that identifies a particular project. Project Operating Costs /Savings
If applicable, estimated operating costs or savings associated with the completion of a project are budgeted into the resource allocation plan.
Property Tax California State Constitution Article XIII A provides that the combined maximum property tax rate on any
given property may not exceed 1% of its assessed value unless an additional amount has been approved by voters. Santa Clara County assesses properties, bills and collects these property taxes. The City’s share including all penalties and interest is remitted by the County.
342

GLOSSARY OF BUDGET TERMS
Property Transfer Tax This tax is levied at a rate of $0.55 per $500 of equity value transferred. The County collects the tax and the City receives one-half. Revenues are dependent on how frequently the property is transferred and on the accrued value at the time of transfer.
Proprietary Fund Proprietary Funds consist of Enterprise Funds and Internal Service Funds, defined above. The City uses
enterprise funds to account for its Water, Wastewater, Solid Waste, SMaRT Station, and Community Recreation operations. Internal service funds are an accounting device used to accumulate and allocate costs internally among the City’s various functions.
Redevelopment Successor Agency Fund
This fund accounts for the activities of the Redevelopment Successor Agency as a result of the dissolution of Redevelopment Agencies (RDAs) on February 1, 2012.
Reserve Amount in a fund representing the difference between resources and requirements, taking into account all
transfers in and out of the fund. Reserves can be restricted or unrestricted, and reserve levels may be mandated by law or by policy.
Revenue Funds the City receives as income such as tax payments, fees for services, grants, fines, forfeitures and
interest income. Sales Tax The City receives one percent of the County taxes on retail sales. The sales tax is one of the City's largest
General Fund revenue sources. Service Delivery Plans Under the Performance Based Budget structure, these plans describe specific programming of targeted
services to meet the program goals and measures. SMaRT Station Fund This fund was established to account for the revenues and expenses of the Sunnyvale Materials and
Recovery and Transfer (SMaRT) Station operations. The SMaRT Station is a three wary partnership between the cities of Sunnyvale, Palo Alto and Mountain View.
Solid Waste Management Fund This fund accounts for revenues and expenses related to refuse collection and solid waste disposal services. Special Assessment Fund A fund used to account for the financing of public improvements or services deemed to benefit primarily
the properties against which special assessments are levied.
343

GLOSSARY OF BUDGET TERMS Special Revenue Funds
These funds are used to account for the proceeds of specific revenue sources (other than special assessments, expendable trusts or for major capital projects) that are legally restricted to expenditures for specified purposes.
Spending Limitation (GANN LIMIT)
Article XIIIB of the California Constitution establishes a spending limitation on government agencies within California. The spending limit is a mandated calculation of how much the City is allowed to expend in one fiscal year. Annually, local governments may increase this limit by a factor comprised of the change in population combined with the California inflation rate and determined by the State finance department.
Sub-Fund Number A three-digit number attached to a fund number that identifies a sub-division of the fund, thus capturing
specific information as required. Planned Completion Year This is the fiscal year a project is planned to be finished. For projects that are continuous, "ongoing" is the
designated planned completion year. Transient Occupancy Tax A 9.5 percent tax is levied on charges for occupancy of hotel and motel rooms for stays. The City's lodging
industry is largely dedicated to serving its industrial base. Twenty-Year Resource Allocation Plan
The Twenty-Year Resource Allocation Plan is the backbone of the City's financial planning process. This long-range planning gives the Council a tool with which it can project revenues, operating requirements and capital spending and identify trends. It allows the cost of any policy decision to be measured in terms of long-range expenditure requirements, thereby raising "red flags" in areas where financial conditions may be unacceptable in the future. The 20-Year Resource Allocation Plan has helped the City fund a pay-as-you-go philosophy, allowing money to be set aside in reserve funds for future service expansion or major projects.
User Department The department that initiated the project. User Fee A fee for direct receipt of a service paid by the party benefiting from the service. Utility Users Tax A two-percent tax on utility billings for gas and electric and intra-state telephone services.
344

GLOSSARY OF BUDGET TERMS Water Supply and Distribution Fund
This fund accounts for all revenues and expenses related to the City-operated water utility.
Wastewater Management Fund This fund accounts for all the revenues and expenses related to the city-operated sewer collection and Water
Pollution Control Plant systems. Youth and Neighborhood Services Fund
This fund accounts for revenues and operating program expenditures of the Columbia Neighborhood Center, a partnership between the City of Sunnyvale, the Sunnyvale School District and a private corporation.
345

This Page Intentionally Blank
346

Adopted Budget and Resource Allocation PlanCity of Sunnyvale, California – Fiscal Year 2017/18
Volume IIOperating Budget

City of SunnyvaleADOPTED BUDGET and RESOURCE ALLOCATION PLAN
Fiscal Year 2017/18VOLUME II
Operating BudgetTABLE OF CONTENTS
PageOperating Budget
Office of the City Attorney:Department Narrative 351Department Performance Indicators 353
355750 Comprehensive Legal Services
Office of the City Manager:Department Narrative 359Department Performance Indicators 363702 Office of the City Manager 365723 Office of the City Manager (FY 2015/16 Actual) 371
381748 Print, Copy, Bindery, and Mail Services and Support (FY 2015/16 Actual)
Community Development:Department Narrative 385Department Performance Indicators 391233 Building Safety 397234 Planning 401235 Housing and CDBG Program 407237 Community Development Department Management 411
Environmental Services:Department Narrative 413Department Performance Indicators 421360 Water Resources 425363 Solid Waste Management 431364 SMaRT Station 435365 Wastewater Management 437366 Regulatory Programs 443367 Wastewater Collection Systems 453369 Wholesale Water Purchase 463
347

City of SunnyvaleADOPTED BUDGET and RESOURCE ALLOCATION PLAN
Fiscal Year 2017/18VOLUME II
Operating BudgetTABLE OF CONTENTS
Page
Finance:Department Narrative 465Department Performance Indicators 473703 Budget Management 477704 Purchasing 481705 Financial Management and Analysis 487706 Accounting and Financial Services 491707 Revenue Collection and Audit 499708 Utility Billing 505
Human Resources:Department Narrative 513Department Performance Indicators 519
521754 Human Resources
Information Technology:Department Narrative 527Department Performance Indicators 531
533746 IT Services and Support
Library and Community Services:Department Narrative 537Department Performance Indicators 543527 Youth and Family Services 545620 Library 551
563626 Arts and Recreation Programs
NOVA Workforce Services:Department Narrative 579Department Performance Indicators 583510 Employment Development 585
348

City of SunnyvaleADOPTED BUDGET and RESOURCE ALLOCATION PLAN
Fiscal Year 2017/18VOLUME II
Operating BudgetTABLE OF CONTENTS
Page Public Safety:
Department Narrative 591Department Performance Indicators 599471 Police Services 603472 Fire Services 613473 Community Safety Services 617474 Personnel & Training 627475 Investigation Services 633476 Communication Services 635477 Public Safety Administrative Services 639478 Records Management & Property Services 647
651479 Fire Prevention & Hazardous Material Services
Public Works:Department Narrative 659Department Performance Indicators 669119 Transportation and Traffic Services 677120 Pavement, Maintenance, Traffic Signs and Markings 685121 Street Lights 695219 Street Tree Services 699256 Downtown Parking Lot Maintenance 703267 Neighborhood Parks and Open Space Management 705308 Public Works Administration 711309 Capital Project Management 715310 Land Development - Engineering Services 719647 Golf Course Operations 723709 Facility Services 727763 Fleet Services 731
349

This Page Intentionally Blank
350

Office of the City Attorney

Office of the City AttorneyDepartment Description
The Office of the City Attorney (OCA) provides legal advice and services to the City Council, City officials, staff, departments, boards, commissions, and related City bodies; protects the interests of the City; and ensures that actions by or on behalf of the City and its related bodies are in accordance with applicable legal requirements. The OCA represents the City, its officers, and its employees in administrative and civil litigation matters involving official City business. It also prepares contracts, ordinances, resolutions, and other legal documents involving the City, and prosecutes violations of the Municipal Code. Office staff consists of the City Attorney, two Senior Assistant City Attorneys, an Assistant City Attorney, a paralegal and a legal secretary.
Programs and ServicesThe OCA has three main areas of responsibility – Provide Legal Advice, Provide Representation, and Management
and Administration.
Provide Legal Advice
The OCA advises and counsels the City Council, the Redevelopment Successor Agency, Boards, Commissions, and City staff on legal issues in all City operations, including property development, zoning, redevelopment, housing, public utilities, administrative, environmental, liability, and general matters. The OCA prepares ordinances, resolutions, contracts, and franchises. The OCA also monitors changes and developments in laws concerning the City, communicates pertinent changes to the City Council and affected departments, and drafts amendments to City ordinances and documents to comply with changes to the law.
Provide Representation
The OCA is responsible for representing the City in all legal actions and administrative proceedings in which the City is concerned, or to which it is a party. The OCA represents City officials and employees in civil litigation arising out of or connected to City employment, and prosecutes all charges of violation of municipal ordinances and regulations.
Management and Administrative Support Services
Management and administrative support staff for the OCA monitor overall office performance, prepare and administer the office budget, and update and maintain the Department’s website. As necessary, the OCA directs and monitors the work and costs of outside counsel. Personnel attend programs and training consistent with State requirements for continuing legal education.
City of Sunnyvale FY 2017/18 Adopted Budget and Resource Allocation Plan
351

Department Budget Summary
Office of the City Attorney
Fund/Program Actual
2014/15Budget
2015/16Actual
2015/16Budget
2016/17Budget
2017/18
General Fund
Comprehensive Legal Services 1,409,724 1,457,386 1,357,779 1,463,589 1,797,659
RDA Successor Agency
Comprehensive Legal Services 32,205 65,366 107,620 43,536 9,406
Development Enterprise Fund
Comprehensive Legal Services 296,990 333,390 308,336 449,674 458,812
TOTAL EXPENDITURES 1,738,919 1,856,142 1,773,735 1,956,799 2,265,877
Budget Overview and Significant ChangesFY 2017/18 is the second year of a two-year operating cycle. As such, there are minimal changes to the OCA’s
operating budget for FY 2017/18.
The addition of 1.0 Assistant City Attorney is included to provide additional capacity to the OCA to work with various City departments to enforce City Fire, Building, Property Maintenance, and Planning and Zoning Codes, the City’s Minimum Wage Ordinance, to abate public nuisance violations that negatively affect neighborhoods and enforce City permits (e.g., Massage Establishment and Use Permits).
Department Position Allocation
ClassificationFY 2016/17
Budgeted PositionsFY 2017/18
Budgeted Positions Change
City Attorney 1 1 —
Senior Assistant City Attorney 2 2 —
Assistant City Attorney 1 2 1
Paralegal 1 1 —
Legal Secretary 1 1 —
Office of the City Attorney Total 6 7 1
City of Sunnyvale FY 2017/18 Adopted Budget and Resource Allocation Plan
352
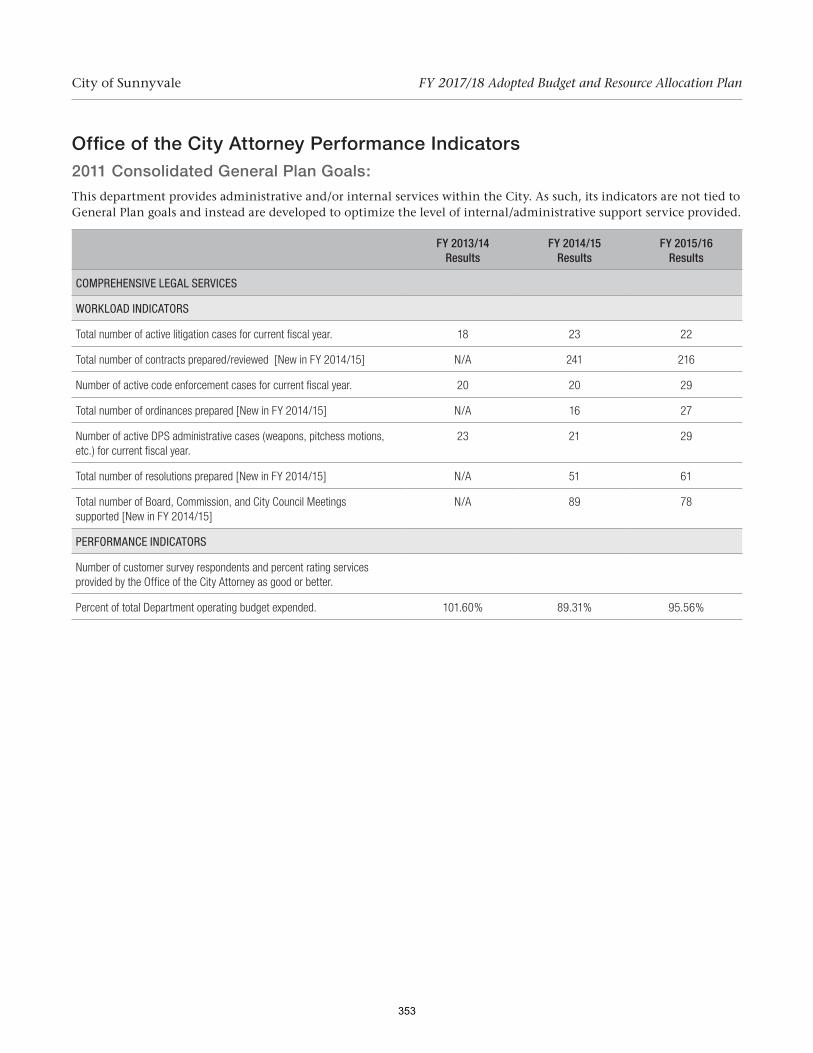
Office of the City Attorney Performance Indicators2011 Consolidated General Plan Goals:
This department provides administrative and/or internal services within the City. As such, its indicators are not tied to General Plan goals and instead are developed to optimize the level of internal/administrative support service provided.
FY 2013/14 Results
FY 2014/15 Results
FY 2015/16 Results
COMPREHENSIVE LEGAL SERVICES
WORKLOAD INDICATORS
Total number of active litigation cases for current fiscal year. 18 23 22
Total number of contracts prepared/reviewed [New in FY 2014/15] N/A 241 216
Number of active code enforcement cases for current fiscal year. 20 20 29
Total number of ordinances prepared [New in FY 2014/15] N/A 16 27
Number of active DPS administrative cases (weapons, pitchess motions, etc.) for current fiscal year.
23 21 29
Total number of resolutions prepared [New in FY 2014/15] N/A 51 61
Total number of Board, Commission, and City Council Meetings supported [New in FY 2014/15]
N/A 89 78
PERFORMANCE INDICATORS
Number of customer survey respondents and percent rating services provided by the Office of the City Attorney as good or better.
Percent of total Department operating budget expended. 101.60% 89.31% 95.56%
City of Sunnyvale FY 2017/18 Adopted Budget and Resource Allocation Plan
353

This Page Intentionally Blank
354
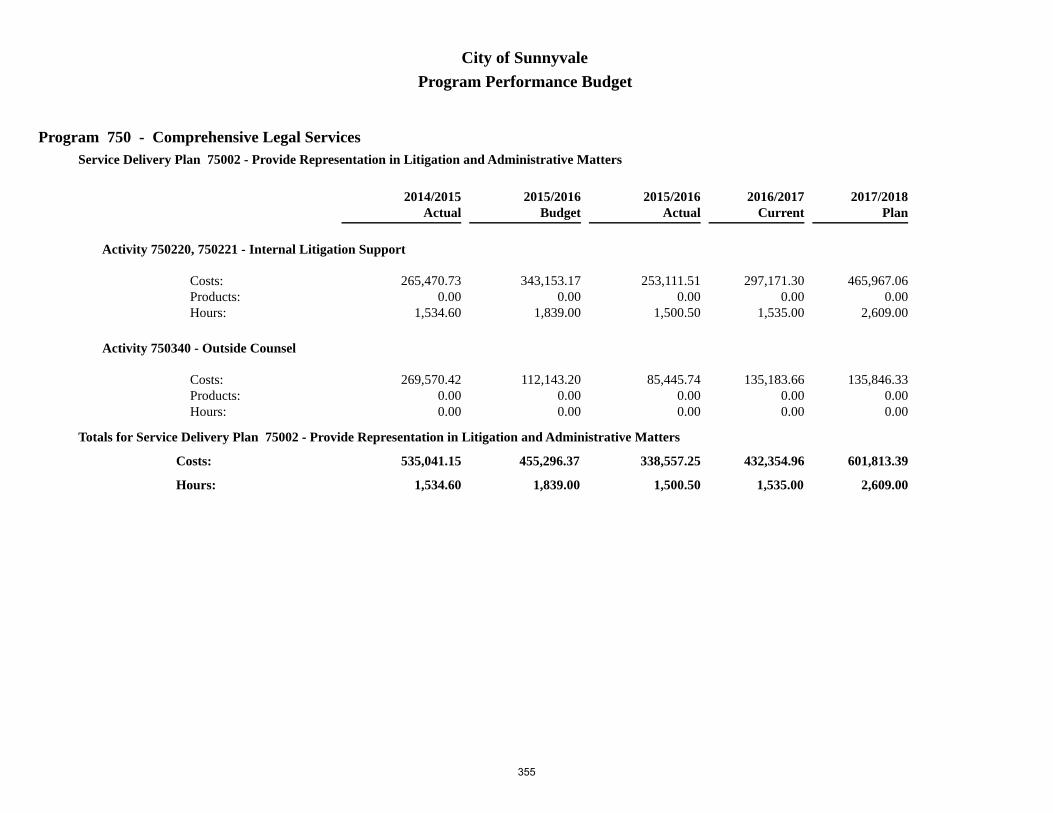
Program 750 - Comprehensive Legal Services
Program Performance BudgetCity of Sunnyvale
Service Delivery Plan 75002 - Provide Representation in Litigation and Administrative Matters
Budget2015/2016
Actual2014/2015
Actual2015/2016
Current2016/2017 2017/2018
Plan
Activity 750220, 750221 - Internal Litigation Support
343,153.170.00
1,839.00
253,111.510.00
1,500.50
297,171.300.00
1,535.00
465,967.060.00
2,609.00
265,470.730.00
1,534.60
Costs:Products: Hours:
Activity 750340 - Outside Counsel
112,143.200.000.00
85,445.740.000.00
135,183.660.000.00
135,846.330.000.00
269,570.420.000.00
Costs:Products: Hours:
1,839.00
455,296.37 338,557.25
1,500.50
432,354.96 601,813.39
Totals for Service Delivery Plan 75002 - Provide Representation in Litigation and Administrative Matters
535,041.15
1,534.60Hours:
Costs:
1,535.00 2,609.00
355

Program 750 - Comprehensive Legal Services
Program Performance BudgetCity of Sunnyvale
Service Delivery Plan 75004 - Legal Services
Budget2015/2016
Actual2014/2015
Actual2015/2016
Current2016/2017 2017/2018
Plan
Activity 750500 - Provide Transactional (Non-Litigation) Legal AdviceProduct: A Response (Written or Oral) [Deleted]
709,138.98915.00
4,103.00
677,188.990.00
4,335.00
748,903.870.00
4,252.50
905,698.510.00
5,113.50
516,465.900.00
3,429.40
Costs:Products: Hours:
Activity 750510 - Legal Advice for RDA Issues - ROPS Administration
65,365.870.00
200.00
107,620.350.00
166.00
43,536.200.00
185.00
9,406.270.00
40.00
32,204.720.00
75.00
Costs:Products: Hours:
Activity 750520 - Provide Legal Advice for Development Activities
333,389.670.00
1,790.00
308,336.220.00
1,727.50
449,674.020.00
2,625.00
458,812.450.00
2,625.00
296,990.100.00
1,664.00
Costs:Products: Hours:
Activity 750530 - Management, Administrative, and Clerical
292,950.820.00
2,888.00
342,032.680.00
3,221.60
282,329.860.00
2,312.50
290,147.440.00
2,312.50
358,216.490.00
3,063.20
Costs:Products: Hours:
8,981.00
1,400,845.34 1,435,178.24
9,450.10
1,524,443.95 1,664,064.67
Totals for Service Delivery Plan 75004 - Legal Services
1,203,877.21
8,231.60Hours:
Costs:
9,375.00 10,091.00
356

Program 750 - Comprehensive Legal Services
Program Performance BudgetCity of Sunnyvale
1,856,141.71
10,820.00
1,773,735.49
10,950.60
1,738,918.36
9,766.20
Costs:
Hours: 10,910.00 12,700.00
1,956,798.91 2,265,878.06
Totals for Program 750
357

This Page Intentionally Blank
358

Office of the City Manager

Office of the City Manager
Department DescriptionThe City Manager serves as the City’s Chief Executive Officer (CEO) responsible to the City Council and City
Charter for the proper administration of all affairs of the City.
Programs and ServicesThe Office of the City Manager (OCM) budget structure focuses resources on the overall management of the City,
grouped by service areas.
City Council Support
City Council strategic policy setting and planning occurs within this service area. OCM efforts to support the City Council with establishing policies and priorities; deciding on regional, state, and federal legislative support positions; and executing its legislative responsibilities are captured here. Resources to conduct Council business, such as memberships, conference and travel expenses, technology allowances, and general supplies are budgeted here.
Citywide Leadership and Management Services
The City Manager is charged with implementing Council direction, management and leadership, oversight of day-to-day operations, strategic planning, and upholding the City Charter. The City Manager and her team focus most on strategic planning and policy development; oversight of City operations and department resources; the planning and execution of highly complex, citywide projects such as the modernization of the Civic Center and the Downtown/Town Center development; as well as regional, state, and federal legislative coordination and advocacy. Resources for this service area include minimal funding for responding to unanticipated initiatives.
City Clerk’s Office
The city clerk is the local official for elections, local legislation, the Public Records Act, the Political Reform Act, Boards and Commissions coordination and recruiting, and open meeting laws (Brown Act). Routine responsibilities include supporting City Council meetings with meeting management and minute production, overseeing the City’s Boards and Commissions Program, coordinating responses to Public Records Act requests, and storage of legally mandated records. The Clerk’s Office also provides administrative services related to municipal elections and local candidate and voter information as outlined in the State of California Elections Code.
Administration
These activities capture the services necessary to support the departmental functions of OCM, such as procurement and personnel. Support services are coordinated throughout the Office to eliminate duplicative work, enhance our environmental awareness, and allow us to streamline and modernize some of our processes.
City of Sunnyvale FY 2017/18 Adopted Budget and Resource Allocation Plan
359

Department Budget Summary
Office of the City Manager
Fund/Program Actual
2014/15Budget
2015/16Actual
2015/16Budget
2016/17Budget
2017/18
General Fund
Office of the City Manager 3,600,344 3,931,608 3,881,179 5,836,609 4,840,753
RDA Successor Agency
Office of the City Manager 1,749 0 4,166 0 0
General Services
Office of the City Manager 0 0 0 632,469 0
Print, Copy, Bindery and Mail Services 580,547 592,231 649,680 0 0
Development Enterprise Fund
Office of the City Manager 120,431 102,833 125,738 0 0
TOTAL EXPENDITURES 4,303,071 4,626,672 4,660,763 6,469,078 4,840,753
Budget Overview and Significant ChangesThe main reason for the year-to-year budget fluctuation is election costs. In 2013, voters approved an amendment
to the City Charter to provide for even-year elections, in line with Statewide General and Presidential elections. Due to this shift in the election of Council seats, the City did not incur any election costs for two fiscal years (FY 2014/15 and FY 2015/16). The FY 2016/17 budget for elections included approximately $1,233,200 based on cost information from the Santa Clara County Registrar of Voters (SCCROV) for electing four Council seats and putting three measures on the November 2016 ballot; SCCROV costs estimates of $772,000 to run an August 2016 special election as required by City Charter to fill the recently vacated Council seat; and approximately $40,000 for election related operational costs, such as legally required public notices and publications.
During FY 2016/17, the OCM budget includes the addition of 1.0 Senior Management Analyst to provide additional analytical and administrative capacity in the OCM. With the recent addition of various high profile policy priorities and a grassroots succession planning effort, the Office of the City Manager required more capacity to absorb these new efforts, in addition to successfully maintaining basic operations. Further, this additional capacity was needed for OCM to be able to respond to high-level and urgent policy issues, while still maintaining important efforts such as airplane noise, implementation and ongoing administration of a new Customer Relationship Management system, water resources and allocations, federal funding for programs such as NOVA and CDBG, as well as to restore resources for intergovernmental relations and advocacy so that the City may strategically plan for and develop policies for local, regional and national issues. An Assistant City Manager position, which exclusively managed the City’s Town Center development, expired at end of calendar year 2016. The FY 2017/18 budget also reflects the transfer of print and mail services management to the Finance Department where the City can leverage existing Central Stores resources to support these services. Since this is the second year of the two-year operating budget cycle, other changes are minimal and mirror the moderate increases included in the FY 2016/17 budget such as new funds for a pilot program to procure services to produce the Quarterly Report; additional productive hours to match current trends; and, similar to all other departments, investment in professional development for OCM staff. Additionally, the budget includes $75,000 annually for unanticipated initiatives that occur throughout the year that were previously absorbed at the expense of reducing or eliminating operational and/or other competing resource needs.
City of Sunnyvale FY 2017/18 Adopted Budget and Resource Allocation Plan
360

Department Position Allocation
ClassificationFY 2016/17
Budgeted PositionsFY 2017/18
Budgeted Positions Change
City Manager 1 1 —
Assistant City Manager 3 2 (1)
City Clerk 1 1 —
Economic Development Manager 1 1 —
Communications Officer 1 1 —
Senior Management Analyst 2 2 —
Administrative Analyst 1 1 —
Deputy City Clerk 1 1 —
Web and Communications Specialist 1 1 —
Web and Communications Specialist – Term Limited 1 1 —
Executive Assistant 2 2 —
Senior Office Assistant 2 2 —
Staff Office Assistant 1 1 —
Office of the City Manager Total 18 17 (1)
City of Sunnyvale FY 2017/18 Adopted Budget and Resource Allocation Plan
361

This Page Intentionally Blank
362

Office of the City Manager Performance Indicators2011 Consolidated General Plan Goals: Chapter 2, Community Vision (CV)
Goal CV-1: Achieve a Community in Which Citizens and Businesses Are Informed About Local Issues and City Programs and Services
Please refer to the General Plan Executive Summary for further details on goals
General Plan Goal
FY 2013/14 Results
FY 2014/15 Results
FY 2015/16 Results
OFFICE OF THE CITY MANAGER
WORKLOAD INDICATORS
Number of Council Agendas prepared. CV-1 41 35 41
Number of Reports to Council processed. CV-1 299 293 333
Number of Council candidates filing nomination papers (election years only).
CV-1 7 0 13
Number of board and commission applicants. CV-1 36 33 34
Number of public records act requests processed. CV-1 146 98 64
Number of press releases created and distributed. CV-1 37 30 36
PERFORMANCE INDICATORS
Number of Council minutes and percent prepared without error and by next Council meeting. [Deleted in FY 2015/16]
CV-1 26 84%
34 N/A
Number of Councilmember survey respondents and percent rating support from the Office of the City Clerk as good or better. [Deleted in FY 2015/16]
CV-1 5 100%
5 100%
N/A
Number of Councilmember survey respondents and percent rating clerical and administrative support to Council as good or better. [Deleted in FY 2015/16]
CV-1 5 100%
6 100%
N/A
Number of resident survey respondents and percent rating the overall quality of information provided by Quarterly Report as good or better.
CV-1 189* 98%
203** 82%
203** 82%
Percent of total Department operating budget expended. 94.1% 99.0% 99.40%
* 2013 question (survey done every other year). Question = Please indicate the extent to which you agree or disagree with this statement: Information provided by the City of Sunnyvale is accessible, timely and relevant for The City’s newsletter (Quarterly Report). Measurement is strongly agree and somewhat agree.
2011 question = To what extent do you agree or disagree with this statement: Information provided by the City of Sunnyvale (on KSUN-15, the City’s Web site, contained in the Quarterly Report, etc.) is accessible, timely and relevant? Measurement is strongly agree and somewhat agree.
** 2015 question = Please rate the overall quality of information available in each of the following City information sources: The City’s mailed newsletter (Quarterly Report). Measurement is excellent or good.
City of Sunnyvale FY 2017/18 Adopted Budget and Resource Allocation Plan
363

This Page Intentionally Blank
364

Program 702 - Office of the City Manager
Program Performance BudgetCity of Sunnyvale
Service Delivery Plan 70201 - City Council Support
Budget2015/2016
Actual2014/2015
Actual2015/2016
Current2016/2017 2017/2018
Plan
Activity 702100 - Conduct Council Business
0.000.000.00
0.000.000.00
389,584.940.000.00
388,852.620.000.00
0.000.000.00
Costs:Products: Hours:
Activity 702110 - Council Support
0.000.000.00
0.000.000.00
415,640.100.00
3,380.00
445,631.710.00
3,380.00
0.000.000.00
Costs:Products: Hours:
Activity 702120 - Advocacy and Intergovernmental Relations
0.000.000.00
0.000.000.00
206,103.910.00
1,460.00
218,300.000.00
1,460.00
0.000.000.00
Costs:Products: Hours:
Activity 702130 - Policy Support for Decision Making
0.000.000.00
0.000.000.00
265,311.010.00
1,640.00
290,429.710.00
1,732.50
0.000.000.00
Costs:Products: Hours:
0.00
0.00 0.00
0.00
1,276,639.96 1,343,214.04
Totals for Service Delivery Plan 70201 - City Council Support
0.00
0.00Hours:
Costs:
6,480.00 6,572.50
365

Program 702 - Office of the City Manager
Program Performance BudgetCity of Sunnyvale
Service Delivery Plan 70202 - Citywide Leadership and Management Services
Budget2015/2016
Actual2014/2015
Actual2015/2016
Current2016/2017 2017/2018
Plan
Activity 702200, 702201 - Day-to-Day Operations
0.000.000.00
0.000.000.00
1,078,268.310.00
7,490.00
1,266,146.520.00
8,600.00
0.000.000.00
Costs:Products: Hours:
Activity 702210, 702211 - Strategic Planning and Policy Development
0.000.000.00
0.000.000.00
184,716.770.00
1,090.00
215,937.820.00
1,275.00
0.000.000.00
Costs:Products: Hours:
Activity 702220, 702221, 702222 - Special Projects
0.000.000.00
0.000.000.00
843,668.700.00
3,750.00
687,844.950.00
3,035.00
0.000.000.00
Costs:Products: Hours:
Activity 702230 - Regional/Legislative Coordination
0.000.000.00
0.000.000.00
94,805.720.00
370.00
120,500.440.00
555.00
0.000.000.00
Costs:Products: Hours:
0.00
0.00 0.00
0.00
2,201,459.50 2,290,429.73
Totals for Service Delivery Plan 70202 - Citywide Leadership and Management Services
0.00
0.00Hours:
Costs:
12,700.00 13,465.00
366

Program 702 - Office of the City Manager
Program Performance BudgetCity of Sunnyvale
Service Delivery Plan 70203 - City Clerk's Office
Budget2015/2016
Actual2014/2015
Actual2015/2016
Current2016/2017 2017/2018
Plan
Activity 702300, 702301 - Council Meetings Management
0.000.000.00
0.000.000.00
195,623.110.00
1,655.00
209,738.290.00
1,655.00
0.000.000.00
Costs:Products: Hours:
Activity 702310 - Boards and Commissions Program Oversight
0.000.000.00
0.000.000.00
89,068.000.00
890.00
97,593.810.00
890.00
0.000.000.00
Costs:Products: Hours:
Activity 702320 - Records Management
0.000.000.00
0.000.000.00
131,063.890.00
1,070.00
141,652.260.00
1,070.00
0.000.000.00
Costs:Products: Hours:
Activity 702330 - Administrative Services for Elections and Ballot Initiatives
0.000.000.00
0.000.000.00
1,363,405.870.00
1,080.00
125,071.510.00
1,080.00
0.000.000.00
Costs:Products: Hours:
Activity 702340, 702341, 702342, 702343 - Print and Mail Services [Deleted]
0.000.000.00
0.000.000.00
632,469.220.00
4,910.00
0.000.000.00
0.000.000.00
Costs:Products: Hours:
367

Program 702 - Office of the City Manager
Program Performance BudgetCity of Sunnyvale
0.00
0.00 0.00
0.00
2,411,630.09 574,055.87
Totals for Service Delivery Plan 70203 - City Clerk's Office
0.00
0.00Hours:
Costs:
9,605.00 4,695.00
368

Program 702 - Office of the City Manager
Program Performance BudgetCity of Sunnyvale
Service Delivery Plan 70204 - OCM Office Administration
Budget2015/2016
Actual2014/2015
Actual2015/2016
Current2016/2017 2017/2018
Plan
Activity 702400 - Management and Support Services
0.000.000.00
0.000.000.00
375,923.710.00
3,470.00
408,820.290.00
3,470.00
0.000.000.00
Costs:Products: Hours:
Activity 702410 - Professional Development
0.000.000.00
0.000.000.00
203,425.280.00
880.00
224,233.400.00
972.50
0.000.000.00
Costs:Products: Hours:
0.00
0.00 0.00
0.00
579,348.99 633,053.69
Totals for Service Delivery Plan 70204 - OCM Office Administration
0.00
0.00Hours:
Costs:
4,350.00 4,442.50
0.00
0.00
0.00
0.00
0.00
0.00
Costs:
Hours: 33,135.00 29,175.00
6,469,078.54 4,840,753.33
Totals for Program 702
369

This Page Intentionally Blank
370

Program 723 - Office of the City Manager
Program Performance BudgetCity of Sunnyvale
Service Delivery Plan 72301 - City Clerk's Office
Budget2015/2016
Actual2014/2015
Actual2015/2016
Current2016/2017 2017/2018
Plan
Activity 723100 - Elections [Deleted]
42,144.830.00
328.00
35,183.500.00
242.50
0.000.000.00
0.000.000.00
11,693.420.00
91.00
Costs:Products: Hours:
Activity 723110 - Boards and Commissions Oversight [Deleted]
66,308.050.00
675.00
39,659.900.00
382.60
0.000.000.00
0.000.000.00
30,274.220.00
292.50
Costs:Products: Hours:
Activity 723120 - Council Meetings Preparation and Minutes [Deleted]
133,485.950.00
1,236.00
175,193.470.00
1,503.90
0.000.000.00
0.000.000.00
168,362.970.00
1,530.70
Costs:Products: Hours:
Activity 723130 - Records Management [Deleted]
176,632.090.00
1,510.00
148,076.950.00
1,246.80
0.000.000.00
0.000.000.00
160,673.480.00
1,435.90
Costs:Products: Hours:
Activity 723140 - Management Services [Deleted]
103,644.350.00
750.00
102,267.390.00
741.50
0.000.000.00
0.000.000.00
99,526.930.00
742.00
Costs:Products: Hours:
371

Program 723 - Office of the City Manager
Program Performance BudgetCity of Sunnyvale
Service Delivery Plan 72301 - City Clerk's Office
Budget2015/2016
Actual2014/2015
Actual2015/2016
Current2016/2017 2017/2018
Plan
Activity 723150 - Administrative Support Services [Deleted]
81,748.390.00
926.00
102,560.020.00
1,144.50
0.000.000.00
0.000.000.00
104,087.080.00
1,181.60
Costs:Products: Hours:
Activity 723125 - RSA Oversight Board Meeting and Minutes [Deleted]
0.000.000.00
4,165.760.00
33.50
0.000.000.00
0.000.000.00
1,749.450.00
15.50
Costs:Products: Hours:
5,425.00
603,963.66 607,106.99
5,295.30
0.00 0.00
Totals for Service Delivery Plan 72301 - City Clerk's Office
576,367.55
5,289.20Hours:
Costs:
0.00 0.00
372

Program 723 - Office of the City Manager
Program Performance BudgetCity of Sunnyvale
Service Delivery Plan 72302 - Public Information
Budget2015/2016
Actual2014/2015
Actual2015/2016
Current2016/2017 2017/2018
Plan
Activity 723200 - Mass Media [Deleted]
91,179.010.00
790.00
66,133.270.00
572.00
0.000.000.00
0.000.000.00
89,914.610.00
694.00
Costs:Products: Hours:
Activity 723210 - Quarterly Report [Deleted]Product: A Report Printed
166,336.414.00
770.00
104,086.372.00
421.00
0.000.000.00
0.000.000.00
103,015.824.00
421.00
Costs:Products: Hours:
Activity 723220, 723221 - City Web Site [Deleted]
161,559.060.00
1,655.00
247,030.150.00
2,495.00
0.000.000.00
0.000.000.00
248,863.860.00
2,601.00
Costs:Products: Hours:
Activity 723230 - Cable Television [Deleted]
83,158.250.00
165.00
62,908.470.00
165.00
0.000.000.00
0.000.000.00
62,656.530.00
173.50
Costs:Products: Hours:
Activity 723240 - Assist Staff with Communications-related Issues [Deleted]
72,141.340.00
635.00
74,213.050.00
621.00
0.000.000.00
0.000.000.00
67,751.100.00
574.00
Costs:Products: Hours:
373

Program 723 - Office of the City Manager
Program Performance BudgetCity of Sunnyvale
Service Delivery Plan 72302 - Public Information
Budget2015/2016
Actual2014/2015
Actual2015/2016
Current2016/2017 2017/2018
Plan
Activity 723250 - Management Services [Deleted]
29,724.440.00
225.00
20,252.030.00
136.50
0.000.000.00
0.000.000.00
11,959.730.00
93.00
Costs:Products: Hours:
Activity 723260 - Administrative Support Services [Deleted]
58,426.340.00
720.00
60,123.620.00
723.50
0.000.000.00
0.000.000.00
57,336.130.00
703.00
Costs:Products: Hours:
4,960.00
662,524.85 634,746.96
5,134.00
0.00 0.00
Totals for Service Delivery Plan 72302 - Public Information
641,497.78
5,259.50Hours:
Costs:
0.00 0.00
374

Program 723 - Office of the City Manager
Program Performance BudgetCity of Sunnyvale
Service Delivery Plan 72304 - Economic Development/Business Attraction and Retention
Budget2015/2016
Actual2014/2015
Actual2015/2016
Current2016/2017 2017/2018
Plan
Activity 723410 - Locate Sites for Businesses [Deleted]
49,395.680.00
420.00
42,593.610.00
349.10
0.000.000.00
0.000.000.00
58,031.470.00
471.00
Costs:Products: Hours:
Activity 723420 - Marketing and Public Relations for Businesses [Deleted]
68,073.400.00
556.00
92,617.170.00
723.70
0.000.000.00
0.000.000.00
84,206.110.00
716.50
Costs:Products: Hours:
Activity 723440 - Business Community Connections and Support [Deleted]
103,125.490.00
770.00
114,314.210.00
950.00
0.000.000.00
0.000.000.00
108,002.900.00
956.30
Costs:Products: Hours:
Activity 723450 - Business Recognition [Deleted]
36,857.490.00
330.00
31,252.990.00
233.00
0.000.000.00
0.000.000.00
34,948.820.00
270.00
Costs:Products: Hours:
Activity 723460 - Management Services [Deleted]
21,451.230.00
160.00
35,801.830.00
246.70
0.000.000.00
0.000.000.00
20,625.210.00
149.00
Costs:Products: Hours:
375

Program 723 - Office of the City Manager
Program Performance BudgetCity of Sunnyvale
Service Delivery Plan 72304 - Economic Development/Business Attraction and Retention
Budget2015/2016
Actual2014/2015
Actual2015/2016
Current2016/2017 2017/2018
Plan
Activity 723470 - Administrative Support Services [Deleted]
7,406.670.00
80.00
7,156.250.00
69.00
0.000.000.00
0.000.000.00
8,184.520.00
85.70
Costs:Products: Hours:
Activity 723480 - Assist Businesses With Permits [Deleted]
102,832.720.00
860.00
125,737.880.00
916.50
0.000.000.00
0.000.000.00
120,431.130.00
942.40
Costs:Products: Hours:
3,176.00
389,142.68 449,473.94
3,488.00
0.00 0.00
Totals for Service Delivery Plan 72304 - Economic Development/Business Attraction and Retention
434,430.16
3,590.90Hours:
Costs:
0.00 0.00
376

Program 723 - Office of the City Manager
Program Performance BudgetCity of Sunnyvale
Service Delivery Plan 72305 - City Council
Budget2015/2016
Actual2014/2015
Actual2015/2016
Current2016/2017 2017/2018
Plan
Activity 723500 - Conduct Council Business [Deleted]
365,966.500.000.00
301,252.610.000.00
0.000.000.00
0.000.000.00
295,381.400.000.00
Costs:Products: Hours:
Activity 723510 - Administrative Support for Council [Deleted]
171,174.120.00
1,790.00
187,478.250.00
1,980.80
0.000.000.00
0.000.000.00
183,837.150.00
1,942.30
Costs:Products: Hours:
1,790.00
537,140.62 488,730.86
1,980.80
0.00 0.00
Totals for Service Delivery Plan 72305 - City Council
479,218.55
1,942.30Hours:
Costs:
0.00 0.00
377

Program 723 - Office of the City Manager
Program Performance BudgetCity of Sunnyvale
Service Delivery Plan 72306 - Administration
Budget2015/2016
Actual2014/2015
Actual2015/2016
Current2016/2017 2017/2018
Plan
Activity 723600, 723601 - Citywide Management Services [Deleted]
1,502,670.190.00
7,160.00
1,504,377.550.00
7,208.50
0.000.000.00
0.000.000.00
1,281,696.910.00
6,138.60
Costs:Products: Hours:
Activity 723610 - Department-wide Administrative Support [Deleted]
281,490.170.00
3,210.00
304,296.310.00
3,559.70
0.000.000.00
0.000.000.00
282,294.060.00
3,470.90
Costs:Products: Hours:
Activity 723620 - Study Issues and Non-Routines [Deleted]
37,389.570.00
525.00
9,140.140.00
128.30
0.000.000.00
0.000.000.00
11,349.030.00
167.50
Costs:Products: Hours:
Activity 723630 - City Policy Updates [Deleted]
20,118.790.00
265.00
13,209.590.00
162.50
0.000.000.00
0.000.000.00
15,670.180.00
196.00
Costs:Products: Hours:
11,160.00
1,841,668.72 1,831,023.59
11,059.00
0.00 0.00
Totals for Service Delivery Plan 72306 - Administration
1,591,010.18
9,973.00Hours:
Costs:
0.00 0.00
378

Program 723 - Office of the City Manager
Program Performance BudgetCity of Sunnyvale
4,034,440.53
26,511.00
4,011,082.34
26,957.10
3,722,524.22
26,054.90
Costs:
Hours: 0.00 0.00
0.00 0.00
Totals for Program 723
379

This Page Intentionally Blank
380
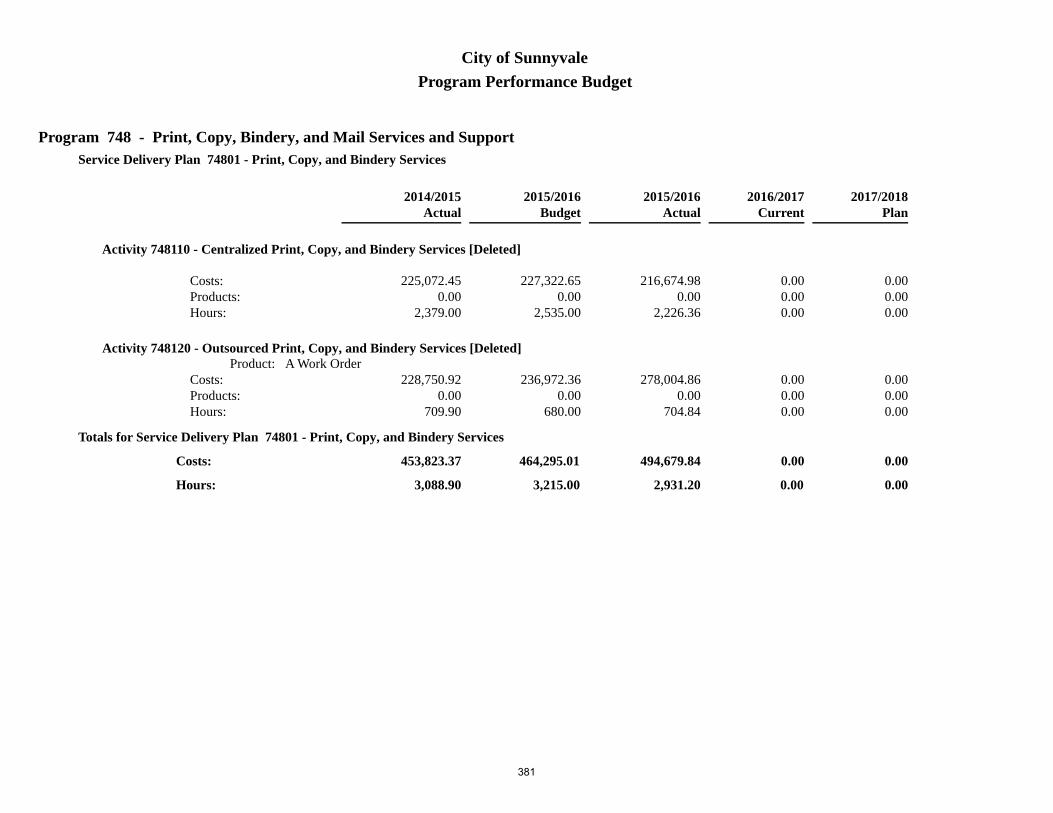
Program 748 - Print, Copy, Bindery, and Mail Services and Support
Program Performance BudgetCity of Sunnyvale
Service Delivery Plan 74801 - Print, Copy, and Bindery Services
Budget2015/2016
Actual2014/2015
Actual2015/2016
Current2016/2017 2017/2018
Plan
Activity 748110 - Centralized Print, Copy, and Bindery Services [Deleted]
227,322.650.00
2,535.00
216,674.980.00
2,226.36
0.000.000.00
0.000.000.00
225,072.450.00
2,379.00
Costs:Products: Hours:
Activity 748120 - Outsourced Print, Copy, and Bindery Services [Deleted]Product: A Work Order
236,972.360.00
680.00
278,004.860.00
704.84
0.000.000.00
0.000.000.00
228,750.920.00
709.90
Costs:Products: Hours:
3,215.00
464,295.01 494,679.84
2,931.20
0.00 0.00
Totals for Service Delivery Plan 74801 - Print, Copy, and Bindery Services
453,823.37
3,088.90Hours:
Costs:
0.00 0.00
381

Program 748 - Print, Copy, Bindery, and Mail Services and Support
Program Performance BudgetCity of Sunnyvale
Service Delivery Plan 74802 - Centralized Mail Services
Budget2015/2016
Actual2014/2015
Actual2015/2016
Current2016/2017 2017/2018
Plan
Activity 748200 - Deliver Mail, Supplies, and Print Shop Jobs [Deleted]Product: A Mail Stop
56,729.010.00
806.00
78,776.570.00
1,150.54
0.000.000.00
0.000.000.00
75,250.450.00
1,081.80
Costs:Products: Hours:
Activity 748210 - Process Incoming Mail [Deleted]
24,888.770.00
338.00
24,992.350.00
301.96
0.000.000.00
0.000.000.00
19,832.560.00
231.80
Costs:Products: Hours:
Activity 748220 - Process Outgoing Mail [Deleted]Product: A Piece of Mail
27,447.79160,000.00
300.00
34,877.010.00
366.48
0.000.000.00
0.000.000.00
24,183.93231,115.00
326.50
Costs:Products: Hours:
1,444.00
109,065.57 138,645.93
1,818.98
0.00 0.00
Totals for Service Delivery Plan 74802 - Centralized Mail Services
119,266.94
1,640.10Hours:
Costs:
0.00 0.00
382

Program 748 - Print, Copy, Bindery, and Mail Services and Support
Program Performance BudgetCity of Sunnyvale
Service Delivery Plan 74803 - Management and Administrative Support Services
Budget2015/2016
Actual2014/2015
Actual2015/2016
Current2016/2017 2017/2018
Plan
Activity 748300 - Management and Administrative Support Services [Deleted]
16,629.010.00
200.00
16,237.120.00
131.93
0.000.000.00
0.000.000.00
7,007.490.00
75.20
Costs:Products: Hours:
Activity 748310 - Staff Training and Development [Deleted]
2,241.510.00
30.00
117.440.001.99
0.000.000.00
0.000.000.00
449.470.007.50
Costs:Products: Hours:
230.00
18,870.52 16,354.56
133.92
0.00 0.00
Totals for Service Delivery Plan 74803 - Management and Administrative Support Services
7,456.96
82.70Hours:
Costs:
0.00 0.00
592,231.10
4,889.00
649,680.33
4,884.10
580,547.27
4,811.70
Costs:
Hours: 0.00 0.00
0.00 0.00
Totals for Program 748
383

This Page Intentionally Blank
384

Community Development
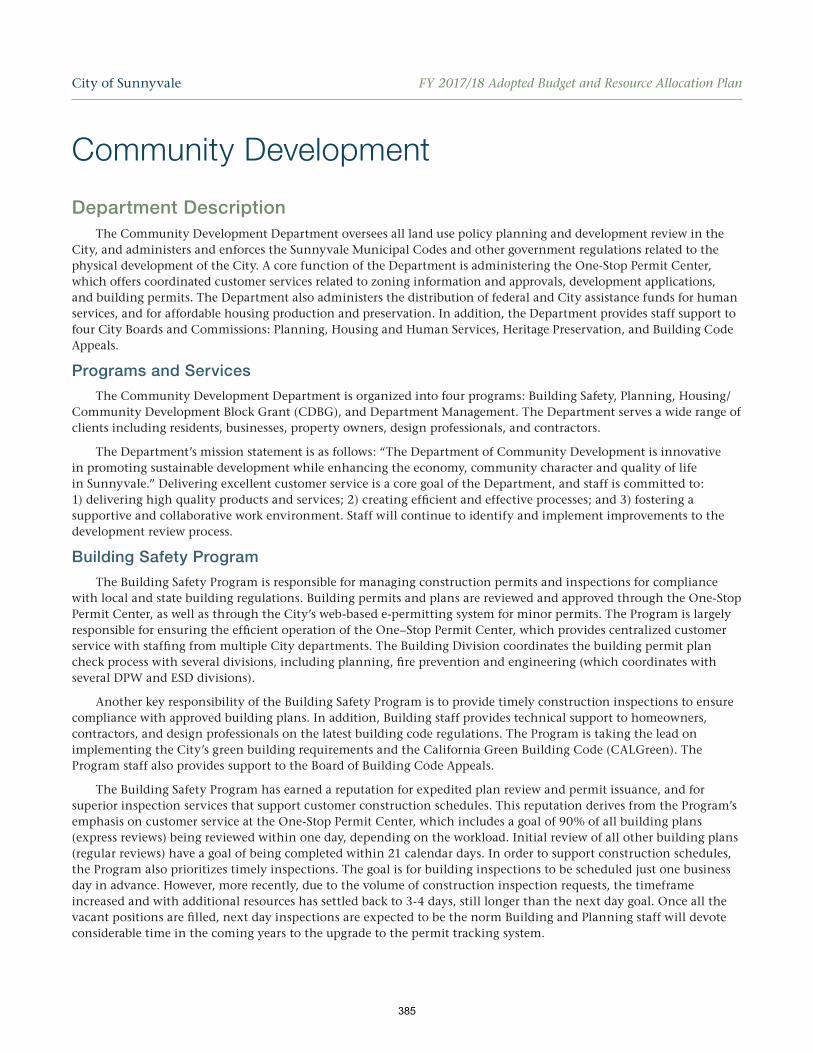
Community Development
Department DescriptionThe Community Development Department oversees all land use policy planning and development review in the
City, and administers and enforces the Sunnyvale Municipal Codes and other government regulations related to the physical development of the City. A core function of the Department is administering the One-Stop Permit Center, which offers coordinated customer services related to zoning information and approvals, development applications, and building permits. The Department also administers the distribution of federal and City assistance funds for human services, and for affordable housing production and preservation. In addition, the Department provides staff support to four City Boards and Commissions: Planning, Housing and Human Services, Heritage Preservation, and Building Code Appeals.
Programs and Services
The Community Development Department is organized into four programs: Building Safety, Planning, Housing/ Community Development Block Grant (CDBG), and Department Management. The Department serves a wide range of clients including residents, businesses, property owners, design professionals, and contractors.
The Department’s mission statement is as follows: “The Department of Community Development is innovative in promoting sustainable development while enhancing the economy, community character and quality of life in Sunnyvale.” Delivering excellent customer service is a core goal of the Department, and staff is committed to: 1) delivering high quality products and services; 2) creating efficient and effective processes; and 3) fostering a supportive and collaborative work environment. Staff will continue to identify and implement improvements to the development review process.
Building Safety Program
The Building Safety Program is responsible for managing construction permits and inspections for compliance with local and state building regulations. Building permits and plans are reviewed and approved through the One-Stop Permit Center, as well as through the City’s web-based e-permitting system for minor permits. The Program is largely responsible for ensuring the efficient operation of the One–Stop Permit Center, which provides centralized customer service with staffing from multiple City departments. The Building Division coordinates the building permit plan check process with several divisions, including planning, fire prevention and engineering (which coordinates with several DPW and ESD divisions).
Another key responsibility of the Building Safety Program is to provide timely construction inspections to ensure compliance with approved building plans. In addition, Building staff provides technical support to homeowners, contractors, and design professionals on the latest building code regulations. The Program is taking the lead on implementing the City’s green building requirements and the California Green Building Code (CALGreen). The Program staff also provides support to the Board of Building Code Appeals.
The Building Safety Program has earned a reputation for expedited plan review and permit issuance, and for superior inspection services that support customer construction schedules. This reputation derives from the Program’s emphasis on customer service at the One-Stop Permit Center, which includes a goal of 90% of all building plans (express reviews) being reviewed within one day, depending on the workload. Initial review of all other building plans (regular reviews) have a goal of being completed within 21 calendar days. In order to support construction schedules, the Program also prioritizes timely inspections. The goal is for building inspections to be scheduled just one business day in advance. However, more recently, due to the volume of construction inspection requests, the timeframe increased and with additional resources has settled back to 3-4 days, still longer than the next day goal. Once all the vacant positions are filled, next day inspections are expected to be the norm Building and Planning staff will devote considerable time in the coming years to the upgrade to the permit tracking system.
City of Sunnyvale FY 2017/18 Adopted Budget and Resource Allocation Plan
385

Planning Program
The Planning Program encompasses all policy planning and zoning approvals for the conservation and physical development of the City. The goal of the Program is to improve the quality of life and physical appearance of the City, and to foster orderly development through comprehensive and effective policy planning. Program activities include preparing and administering the City’s General Plan, as well as preparing and overseeing specific plans and other land use policy documents. Additionally, lead responsibility for researching and reporting on many of the City Council adopted study issues rests with this Program. Most studies and planning efforts include significant time on outreach to the community and finding new ways to make information available. Planning staff collects and monitors community condition indicators to measure the City’s progress in achieving its goals and policies.
Major functions of the Program are coordinating and processing development applications for planning permits, administering and enforcing the City’s Zoning Code including reviewing building permit applications for zoning and planning permit compliance. The addition of 1.0 Associate Planner term-limited is planned in this budget to provide Planning Program development services support for the increased workload and to cover during staff leaves.
Housing/CDBG Program
The primary objectives of the Housing/CDBG (Community Development Block Grant) Program are to: 1) increase the development of new and renovated affordable housing; 2) preserve and improve housing conditions for lower income residents; and 3) provide support to human service organizations that serve low income and special needs populations in the community.
The Housing Division administers various housing programs, including the Home Improvement, Below Market Rate Housing, First-time Home Buyer, and Tenant-Based Rental Assistance programs. The Division also manages three special revenue funds and their associated loan portfolios: the Housing Mitigation Fund, the CDBG Fund (which includes the CDBG Housing Rehabilitation Revolving Loan Fund), and the Home Investment Partnerships HOME Program Fund. Two of these funds, CDBG and HOME, were established to receive the City’s federal entitlement grants, which have provided an average of nearly $2 million annually for the past decade. These grants fund affordable housing projects and community development programs for the City’s lower-income residents and neighborhoods.
The Division ensures that the grants are used in a timely manner in accordance with their terms. The long-term availability of CDBG and HOME funding is uncertain; City staff will be monitoring and advocating, where appropriate, federal, state and regional efforts related to funding.
In addition to operating housing programs, the Division manages a number of large capital projects funded by the three special revenue funds. These projects primarily consist of multi-family housing development, acquisition, or rehabilitation. The Division also manages smaller public infrastructure and public facility projects, and annual grants for human services and other miscellaneous community development activities. The Housing Division provides staff support to the Housing and Human Services Commission, and coordinates with other divisions on housing policy development and on long-range planning to meet regional housing needs.
Department Management
Department Management provides overall leadership and management of the Community Development Department. Activities include budgeting, work programming, personnel administration, and general support to the City Manager’s Office, City Clerk, and the City Executive Leadership Team.
City of Sunnyvale FY 2017/18 Adopted Budget and Resource Allocation Plan
386

Department Budget Summary
Community Development
Fund/Program Actual
2014/15Budget
2015/16Actual
2015/16Budget
2016/17Budget
2017/18
General Fund
Department Management 403,254 434,379 439,316 526,103 544,238
Planning 596,803 594,896 577,698 628,439 671,644
Housing Fund
Housing and CDBG 711,651 842,025 794,913 838,974 877,933
HOME Grant Fund
Housing and CDBG 90,694 85,487 86,226 100,115 103,988
Community Development Block Grant
Housing and CDBG 379,350 411,539 365,700 381,571 402,762
Development Enterprise Fund
Building Safety 3,189,121 3,344,479 3,288,959 3,832,882 4,082,326
Planning 1,835,431 1,884,170 2,083,944 2,244,812 2,563,075
Redevelopment Housing
Housing and CDBG 0 0 0 40,093 41,040
General Services
Planning 0 0 0 89,232 95,862
TOTAL EXPENDITURES 7,206,304 7,596,975 7,636,757 8,682,219 9,382,868
Budget Overview and Significant ChangesFY 2017/2018 is the second year of a two-year operating cycle. As such, only modest changes were made to the
Department’s operating budget for FY 2017/2018.
FY 2016/17 was the first year of a two-year operating budget cycle. Toward the end of FY 2015/16 two positions were added to the Building Division. The addition of 1.0 Associate Planner term-limited is included to provide supplemental staffing for Planning Program development services support. The operating budget for the Community Development Department primarily funds personnel costs, which account for approximately 86% of its total budget. Revenue from planning and building fees support a large portion of the Department’s operations. Additionally, operational costs for the Housing/CDBG Program are funded with special purpose federal and City funds.
Development activity in FY 2017/18 is projected to continue at a high level, similar to the past several years as commercial and residential development continues at a robust pace. Despite predictions of modest easing of economic pace, there is sufficient evidence that development activity will continue in our region. This continuing activity reflects the strength of the Silicon Valley economy and the desirability of Sunnyvale as a place for business and residential growth and reinvestment. Based on historical records, it is rare to see this level of development activity sustained for multiple years; development activity is expected to continue at this pace based on the projects that are currently undergoing Planning and Building Division review.
City of Sunnyvale FY 2017/18 Adopted Budget and Resource Allocation Plan
387

Building Safety Program
The Building Program continues to be fully funded (100% cost recovery) by plan check and construction inspection fees collected from building permit activity. The Building Division will operate at a base level of staffing of 19 full-time employees, supplemented with part-time and contract hours to respond to the sustained level of construction activity as reflected in the table below.
Building Construction Valuation
Residential
Commercial
Industrial
FY04/05
FY03/04
FY02/03
FY01/02
FY05/06
FY06/07
FY07/08
FY08/09
FY09/10
FY10/11
FY11/12
FY12/13
FY13/14
FY14/15
FY15/16
FY16/17*
0
100,000,000
200,000,000
300,000,000
400,000,000
500,000,000
600,000,000
700,000,000
800,000,000
* Through February
Planning Program
Over time the annual number of planning permits has increased slightly. This increase has continued even though some regulations have changed to reduce the number of land uses that require permits (e.g. certain front yard fences). At the same time, new procedures and regulations have been adopted making planning reviews more complex (e.g. stormwater, land use near streams, larger noticing areas, more detailed environmental reviews, parking management plans, etc.). The following chart shows planning permit activity since FY 2003/04.
Planning Permits
Heritage
Rez/GPA
PC Hearing
ZA Hearing
Design Review
Tree Removal
Misc. Staff Level
FY04/05
FY03/04
FY05/06
FY06/07
FY07/08
FY08/09
FY09/10
FY10/11
FY11/12
FY12/13
FY13/14
FY14/15
FY15/16
FY16/17
Projected
0
200
400
600
800
1000
1200
1400
1600
City of Sunnyvale FY 2017/18 Adopted Budget and Resource Allocation Plan
388
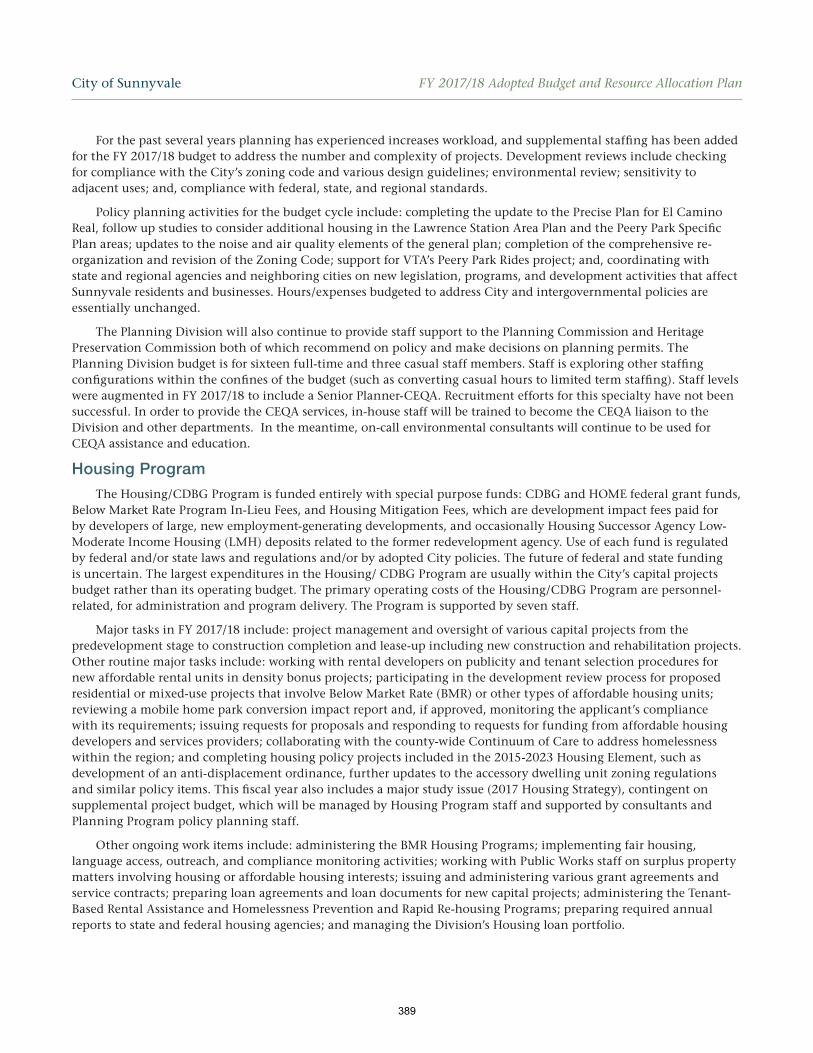
For the past several years planning has experienced increases workload, and supplemental staffing has been added for the FY 2017/18 budget to address the number and complexity of projects. Development reviews include checking for compliance with the City’s zoning code and various design guidelines; environmental review; sensitivity to adjacent uses; and, compliance with federal, state, and regional standards.
Policy planning activities for the budget cycle include: completing the update to the Precise Plan for El Camino Real, follow up studies to consider additional housing in the Lawrence Station Area Plan and the Peery Park Specific Plan areas; updates to the noise and air quality elements of the general plan; completion of the comprehensive re- organization and revision of the Zoning Code; support for VTA’s Peery Park Rides project; and, coordinating withstate and regional agencies and neighboring cities on new legislation, programs, and development activities that affect Sunnyvale residents and businesses. Hours/expenses budgeted to address City and intergovernmental policies are essentially unchanged.
The Planning Division will also continue to provide staff support to the Planning Commission and Heritage Preservation Commission both of which recommend on policy and make decisions on planning permits. The Planning Division budget is for sixteen full-time and three casual staff members. Staff is exploring other staffing configurations within the confines of the budget (such as converting casual hours to limited term staffing). Staff levels were augmented in FY 2017/18 to include a Senior Planner-CEQA. Recruitment efforts for this specialty have not been successful. In order to provide the CEQA services, in-house staff will be trained to become the CEQA liaison to the Division and other departments. In the meantime, on-call environmental consultants will continue to be used for CEQA assistance and education.
Housing Program
The Housing/CDBG Program is funded entirely with special purpose funds: CDBG and HOME federal grant funds, Below Market Rate Program In-Lieu Fees, and Housing Mitigation Fees, which are development impact fees paid forby developers of large, new employment-generating developments, and occasionally Housing Successor Agency Low- Moderate Income Housing (LMH) deposits related to the former redevelopment agency. Use of each fund is regulated by federal and/or state laws and regulations and/or by adopted City policies. The future of federal and state fundingis uncertain. The largest expenditures in the Housing/ CDBG Program are usually within the City’s capital projects budget rather than its operating budget. The primary operating costs of the Housing/CDBG Program are personnel- related, for administration and program delivery. The Program is supported by seven staff.
Major tasks in FY 2017/18 include: project management and oversight of various capital projects from the predevelopment stage to construction completion and lease-up including new construction and rehabilitation projects.Other routine major tasks include: working with rental developers on publicity and tenant selection procedures fornew affordable rental units in density bonus projects; participating in the development review process for proposed residential or mixed-use projects that involve Below Market Rate (BMR) or other types of affordable housing units;reviewing a mobile home park conversion impact report and, if approved, monitoring the applicant’s compliancewith its requirements; issuing requests for proposals and responding to requests for funding from affordable housing developers and services providers; collaborating with the county-wide Continuum of Care to address homelessness within the region; and completing housing policy projects included in the 2015-2023 Housing Element, such as development of an anti-displacement ordinance, further updates to the accessory dwelling unit zoning regulationsand similar policy items. This fiscal year also includes a major study issue (2017 Housing Strategy), contingent on supplemental project budget, which will be managed by Housing Program staff and supported by consultants and Planning Program policy planning staff.
Other ongoing work items include: administering the BMR Housing Programs; implementing fair housing, language access, outreach, and compliance monitoring activities; working with Public Works staff on surplus property matters involving housing or affordable housing interests; issuing and administering various grant agreements and service contracts; preparing loan agreements and loan documents for new capital projects; administering the Tenant- Based Rental Assistance and Homelessness Prevention and Rapid Re-housing Programs; preparing required annualreports to state and federal housing agencies; and managing the Division’s Housing loan portfolio.
City of Sunnyvale FY 2017/18 Adopted Budget and Resource Allocation Plan
389
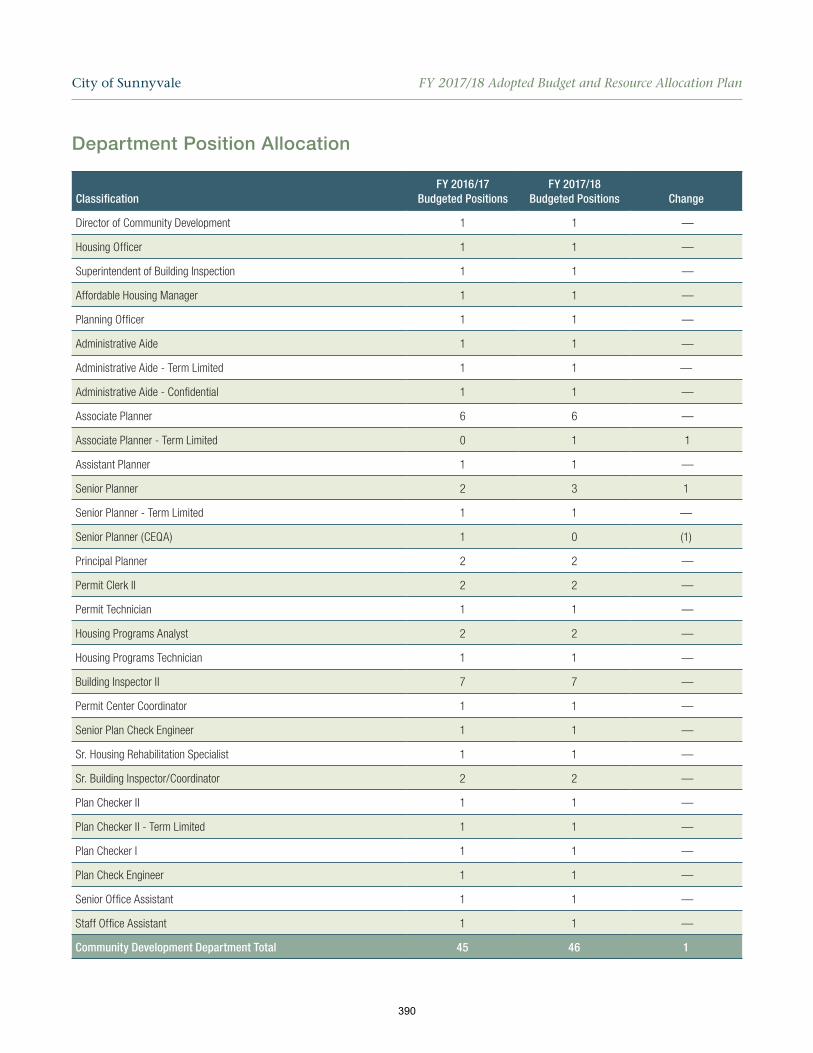
Department Position Allocation
ClassificationFY 2016/17
Budgeted PositionsFY 2017/18
Budgeted Positions Change
Director of Community Development 1 1 —
Housing Officer 1 1 —
Superintendent of Building Inspection 1 1 —
Affordable Housing Manager 1 1 —
Planning Officer 1 1 —
Administrative Aide 1 1 —
Administrative Aide - Term Limited 1 1 —
Administrative Aide - Confidential 1 1 —
Associate Planner 6 6 —
Associate Planner - Term Limited 0 1 1
Assistant Planner 1 1 —
Senior Planner 2 3 1
Senior Planner - Term Limited 1 1 —
Senior Planner (CEQA) 1 0 (1)
Principal Planner 2 2 —
Permit Clerk II 2 2 —
Permit Technician 1 1 —
Housing Programs Analyst 2 2 —
Housing Programs Technician 1 1 —
Building Inspector II 7 7 —
Permit Center Coordinator 1 1 —
Senior Plan Check Engineer 1 1 —
Sr. Housing Rehabilitation Specialist 1 1 —
Sr. Building Inspector/Coordinator 2 2 —
Plan Checker II 1 1 —
Plan Checker II - Term Limited 1 1 —
Plan Checker I 1 1 —
Plan Check Engineer 1 1 —
Senior Office Assistant 1 1 —
Staff Office Assistant 1 1 —
Community Development Department Total 45 46 1
City of Sunnyvale FY 2017/18 Adopted Budget and Resource Allocation Plan
390

Community Development Department Performance Indicators2011 Consolidated General Plan Goals:
Chapter 2, Community Vision (CV)Goal CV-1: Achieve a Community in Which Citizens and BusinessesAre Informed About Local Issues and City Programs and Services
Chapter 3, Land Use and Transportation (LT)Goal LT-1: Coordinated Land Use Planning Goal LT-2: Attractive CommunityGoal LT-3: Appropriate HousingGoal LT-4: Quality Neighborhoods and DistrictsGoal LT-6: Supportive Economic Development Environment Goal LT-7: Balanced Economic Base
Chapter 4, Community Character (CC)Goal CC-1: Distinguished City ImageGoal CC-3: Well-Designed Sites and Buildings Goal CC-5: Protection of Sunnyvale’s Heritage
Chapter 5, Housing (HE)Goal HE-1: Adequate HousingGoal HE-2: Enhanced Housing Conditions and Affordability Goal HE-3: Minimize Government Constraints on Housing Goal HE-4: Adequate Housing SitesGoal HE-5: Equal Housing Opportunities Goal HE-6: Sustainable Neighborhoods
Please refer to the General Plan Executive Summary for further details on goals.
General Plan Goal
FY 2013/14 Results
FY 2014/15 Results
FY 2015/16 Results
BUILDING SAFETY
WORKLOAD INDICATORS
Number of customers served at the One-Stop Permit Center. LT-1, LT-2, LT-3, LT-4, LT-6, LT-7,
CV-1
18,093 16,316 16,612
Number of construction permits issued (regular, express and minor). LT-1, LT-2, LT-3, LT-4, LT-6, LT-7
5,027 5,387 6,020
Total valuation of construction permits. LT-1, LT-2, LT-3, LT-4, LT-6, LT-7
$603,754,563 $588,854,806 $690,537,976
PERFORMANCE INDICATORS
ONE-STOP PERMIT CENTER
Number of customer phone calls. LT-1, LT-2, LT-3, LT-4, LT-6, LT-7,
CV-1
34,209 40,077 37,339
City of Sunnyvale FY 2017/18 Adopted Budget and Resource Allocation Plan
391

General Plan Goal
FY 2013/14 Results
FY 2014/15 Results
FY 2015/16 Results
Average time to answer (including queue time) customer phone calls, with a goal of 45 seconds.
LT-1, LT-2, LT-3, LT-4, LT-6, LT-7,
CV-1
47 seconds 44 seconds 39 seconds
Number of customer survey respondents and percent rating the services provided at the One-Stop Permit Center as good or better.
LT-1, LT-2, LT-3, LT-4, LT-6, LT-7,
CV-1
88 Received 100.0%
46 Received91.3%
19 Received 89.5%
PLAN REVIEW
Number of express and minor permit applications and percent reviewed on the same day.
LT-1, LT-2, LT-3, LT-4, LT-6, LT-7
4,403 91.0%
4,854 90.4%
5,605 65.5%
Number of regular building plan checks received and percent completed within 21 days by:
LT-1, LT-2, LT-3, LT-4, LT-6, LT-7
Building Safety 144 74.3%
127 68.5%
17955.3%
Planning 139 72.7%
111 85.6%
16570.9%
Fire Prevention 130 57.7%
118 63.6%
17067.6%
Public Works 103 82.5%
93 89.2%
13482.8%
Number of resubmittal regular building plan checks received and percent completed within 14 days by:
LT-1, LT-2, LT-3, LT-4, LT-6, LT-7
Building Safety 305 87.9%
398 81.4%
47971.6%
Planning 280 85.0%
313 84.0%
41171.2%
Fire Prevention 269 82.9%
332 81.9%
42078.1%
Public Works 211 87.7%
247 87.0%
31891.8%
Number of customer surveys mailed, number of customer survey respondents, and percent rating Plan Review services as good or better.
LT-1, LT-2, LT-3, LT-4, LT-6, LT-7
180 mailed 27 returned
92.6%
247 mailed 52 returned
76.92%
>250 mailed 71 returned
73.0%
BUILDING INSPECTIONS
Number of inspections scheduled and percent completed as scheduled. LT-1, LT-2, LT-3, LT-4, LT-6, LT-7
20,528 99.89%
14,996 99.87%
21,460 99.8%
Number of inspections requested for the next business day and percent completed as requested.
LT-1, LT-2, LT-3, LT-4, LT-6, LT-7
12,234 88.65%
23,232 84.48%
15,407 24.4%
City of Sunnyvale FY 2017/18 Adopted Budget and Resource Allocation Plan
392

General Plan Goal
FY 2013/14 Results
FY 2014/15 Results
FY 2015/16 Results
Number of customer surveys mailed, number of customer survey respondents, and percent rating Building Inspection services as good or better.
LT-1, LT-2, LT-3, LT-4, LT-6, LT-7
660 mailed 108 returned
96.3%
819 mailed 176 returned
67.61%
>900 mailed 123 returned
82.0%
FIRE INSPECTIONS
Number of inspections scheduled and percent completed as scheduled. LT-1, LT-2, LT-3, LT-4, LT-6, LT-7
3,332 99.76%
3,690 98.81%
3,847 99.2%
Number of inspections requested for within the next two business days and percent completed as requested.
LT-1, LT-2, LT-3, LT-4, LT-6, LT-7
2,493 18.89%
2,949 16.34%
919 11.1%
Number of customer surveys mailed, number of customer survey respondents, and percent rating Fire Inspection services as good or better.
LT-1, LT-2, LT-3, LT-4, LT-6, LT-7
N/A 158 mailed 12 returned
83.33%
>150 mailed 3 returned
66.6%
PLANNING
WORKLOAD INDICATORS
Number of phone and counter planning/zoning inquiries. LT-1, LT-2, LT-3, LT-4, LT-6, LT-7,
CC-3, CV-1
11,141 11,516 12,012
Number of administrative zoning reviews (including MPPs, tree removal permits, sign permits, building permits, home occupations, and other business license reviews).
LT-1, LT-2, LT-3, LT-4, LT-6, LT-7,
CC-3
5,072 5,650 5,025
Number of staff reports to Planning Commission, Heritage Preservation Commission, other city advisory bodies and City Council.
LT-1, LT-2, LT-3, LT-4, LT-6, LT-7, CC-1, CC-3, CC-5, HE-1, HE-4,
HE-6, CV-1
110 132 124
Number of inter-agency projects and assignments. LT-1, LT-2, LT-3, LT-4, LT-6, HE-3
41 54 62
Total land use permit application fees. $555,926 $766,352 $721,983
PERFORMANCE INDICATORS
Number of staff decision planning permit applications (excluding Design Review) submitted and percent receiving 1st set of staff comments in 14 or fewer calendar days. [New for FY 2014/15]
LT-1, LT-2, LT-3, LT-4, LT-6, LT-7,
CC-1, CC-3, HE-1,HE-3, HE-4
N/A 676 84%
789 73%
Number of staff decision planning permit applications (excluding Design Review) resubmitted and percent receiving staff comments in 14 or fewer calendar days. [New for FY 2014/15]
LT-1, LT-2, LT-3, LT-4, LT-6, LT-7,
CC-1, CC-3, HE-1,HE-3, HE-4
N/A 234 97%
253 98%
Number of staff decision Design Review applications submitted and percent receiving 1st set of staff comments in 14 or fewer calendar days. [New for FY 2014/15]
LT-1, LT-2, LT-3, LT-4, LT-6, LT-7,
CC-1, CC-3, HE-1,HE-3, HE-4
N/A 208 84%
234 82%
City of Sunnyvale FY 2017/18 Adopted Budget and Resource Allocation Plan
393

General Plan Goal
FY 2013/14 Results
FY 2014/15 Results
FY 2015/16 Results
Number of staff decision Design Review applications resubmitted and percent receiving staff comments in 14 or fewer calendar days. [New for FY 2014/15]
LT-1, LT-2, LT-3, LT-4, LT-6, LT-7,
CC-1, CC-3, HE-1,HE-3, HE-4
N/A 205 97%
229 98%
Number of public hearing planning applications reviewed; and percent sent a letter within 21 calendar days stating completeness status. [New for FY 2014/15]
LT-1, LT-2, LT-3, LT-4, LT-6, LT-7,
CC-1, CC-3, HE-1,HE-3, HE-4
N/A 90 75%
No information
Total number of Zoning Administrator decision planning applications; and percent decided within 60 calendar days of a complete application. [New for FY 2014/15]
LT-1, LT-2, LT-3, LT-4, LT-6, LT-7,
CC-1, CC-3, HE-1,HE-3, HE-4
N/A 29 80%
25 76%
Total number of Planning Commission and Heritage Preservation Commission decision planning applications; and percent decided within 90 calendar days of a complete application. [New for FY 2014/15]
LT-1, LT-2, LT-3, LT-4, LT-6, LT-7,
CC-1, CC-3, HE-1,HE-3, HE-4
N/A 45 93%
No information
Number of surveys sent to applicants of completed planning permit applications, number of respondents and percent rating the services provided by Planning as good or better. [New for FY 2014/15]
LT-1, LT-2, LT-3, LT-4, LT-6, LT-7,
CC-1, CC-3, HE-1,HE-3, HE-4
N/A N/A (Survey not sent
due to staff vacancies)
598 surveys 384 responded
84% rating good or better
Number of land use permit applications without public hearing and percent processed within 14 days. [Deleted in FY 2014/15]
LT-1, LT-2, LT-3, LT-4, LT-6, LT-7,
CC-1, CC-3, HE-1, HE-4
917 87.2%
N/A N/A
Number of adminstrative zoning permit reviews (including tree removal permits, sign permits, and other non-public hearing planning permits). [New in FY 2012/13, Deleted in FY 2014/15]
LT-1, LT-2, LT-3, LT-4, LT-6
917 87.2%
N/A N/A
Number of adminstrative zoning permit applicant survey respondents and percent rating the services provided by Planning as good or better. [New in FY 2012/13, Deleted in FY 2014/15]
LT-1, LT-2, LT-3, LT-4, LT-6, CC-3
106 95%
N/A N/A
Number of land use permit applications with Zoning Administrator public hearing and percent processed within 60 days. [Deleted in FY 2014/15]
LT-1, LT-2, LT-3, LT-4, LT-6, LT-7, CC-1, CC-3, CC-5, HE-1, HE-4,
HE-6, CV-1
27 76%
N/A N/A
Number of land use permit applications with Planning Commission and Heritage Preservation Commission public hearing and percent processed within 90 days. [Deleted in FY 2014/15]
LT-1, LT-2, LT-3, LT-4, LT-6, LT-7,
CC-1, CC-3, CC-5, HE-1, HE-4, HE-6, CV-1
20 61%
N/A N/A
City of Sunnyvale FY 2017/18 Adopted Budget and Resource Allocation Plan
394

General Plan Goal
FY 2013/14 Results
FY 2014/15 Results
FY 2015/16 Results
Number of public hearing zoning permit reviews (including Zoning Adminstrator, Planning Commission, Heritage Perseravation Commission and City Council hearing applications). [New in FY 2012/13, Deleted in FY 2014/15]
LT-1, LT-2, LT-3, LT-4, LT-6, LT-7,
CC-1, CC-3, CC-5, HE-1, HE-4, HE-6,
CV-1
114 N/A N/A
Number of public hearing zoning permit applicant survey respondents and percent rating the services provided by Planning as good or better. [New in FY 2012/13, Deleted in FY 2014/15]
LT-1, LT-2, LT-3, LT-4, LT-6, LT-7,
CC-1, CC-3, CC-5, HE-1, HE-4, HE-6,
CV-1
10 100%
N/A N/A
HOUSING & CDBG
WORKLOAD INDICATORS
Number of inquiries for housing and human services information. HE-1, CV-1 2,853 3,088 2,650
Number of CDBG, HOME and HMF activities implemented (including capital projects, sub-recipient agreements, and housing program activities).
HE-1, HE-2, HE-5, HE-6
46 50 49
Number of first-time homebuyer loans and rehabilitation grants/loans closed.
HE-1, HE-2, HE-5 17 12 21
Number of BMR/HOME/CDBG rental and owner-occupied units audited annually.
HE-1, HE-2, HE-5 732 719 716
Number of staff reports to Housing and Human Services Commission, other city advisory bodies and City Council.
HE-1, HE-2, HE-5, HE-6,
CV-1
13 16 22
Number of annual HUD reports (CAPER, Action Plan, Consolidated Plan) completed.
HE-1, HE-2, HE-3, HE-5
4 6 5
PERFORMANCE INDICATORS
Number of housing program applications (including BMR, first-time homebuyer and rehabilitation) and percent processed within 21 days.
LT-3, HE-1, HE-2, HE-4, HE-5
67 100%
46 100%
98 100%
Number of developer agreements and percent reviewed within 21 days. LT-3, HE-1, HE-2, HE-4
8 100%
7 100%
5 100%
CDBG credit line does not exceed 1.5 times the City’s annual CDBG grant amount on April 30 (HUD requirement).
HE-1, HE-2, HE-5 0.62 0.99 1.19
Amount of CDBG funds expended and percent benefiting lower income households (HUD requirement >70%).
HE-1, HE-2, HE-5, HE-6
$1,388,531 100%
$1,180,157 100%
$1,217,348 100%
Number of HOME assisted units, and LT-3, HE-1, HE-2, HE-4, HE-5
34* 39 38
a. Percent of assisted units restricted to households earning at or below 60% of area median income (HUD requirement >90%); and
100%* 100% 100%
City of Sunnyvale FY 2017/18 Adopted Budget and Resource Allocation Plan
395

General Plan Goal
FY 2013/14 Results
FY 2014/15 Results
FY 2015/16 Results
b. For projects with five or more units, percent of assisted units restricted to households earning less than 50% of area median income (HUD requirement >20%).
100%* 100% 51%
Number of customer survey respondents (including program beneficiaries, non-profit grantees and development partners) and percent rating the services provided by Housing as good or better.
HE-1, HE-2, HE-4, HE-5
57 100%
124 100%
167 100%
DEPARTMENT MANAGEMENT
PERFORMANCE INDICATORS
Percent of total Department operating budget expended. 99.8% 99.0% 100.5%
*These are revised numbers.
City of Sunnyvale FY 2017/18 Adopted Budget and Resource Allocation Plan
396

Program 233 - Building Safety
Program Performance BudgetCity of Sunnyvale
Service Delivery Plan 23301 - Plan Review
Budget2015/2016
Actual2014/2015
Actual2015/2016
Current2016/2017 2017/2018
Plan
Activity 233150 - Land Use Permit ApplicationsProduct: Application Reviewed
7,653.60110.0065.00
14,500.47155.00117.00
14,948.66150.00125.00
15,926.10150.00125.00
15,184.15146.00122.00
Costs:Products: Hours:
Activity 233160 - Minor Building PermitsProduct: Minor Permit Issued
69,727.632,950.00
725.00
76,419.564,107.00
716.00
97,777.703,100.00
975.00
106,634.843,100.00
975.00
98,968.073,045.00
953.00
Costs:Products: Hours:
Activity 233170 - Express Building Plan PermitsProduct: Express Permit Issued
420,484.291,300.003,666.00
490,527.761,498.004,017.50
510,170.331,350.004,605.00
555,873.931,350.004,605.00
396,306.951,328.003,267.00
Costs:Products: Hours:
Activity 233180 - Regular Building Plan PermitsProduct: Regular Permit Issued
323,843.36500.00
2,708.00
402,636.46415.00
3,207.00
437,150.35700.00
3,720.00
472,052.05700.00
3,720.00
374,350.691,014.003,071.50
Costs:Products: Hours:
7,164.00
821,708.88 984,084.25
8,057.50
1,060,047.04 1,150,486.92
Totals for Service Delivery Plan 23301 - Plan Review
884,809.86
7,413.50Hours:
Costs:
9,425.00 9,425.00
397
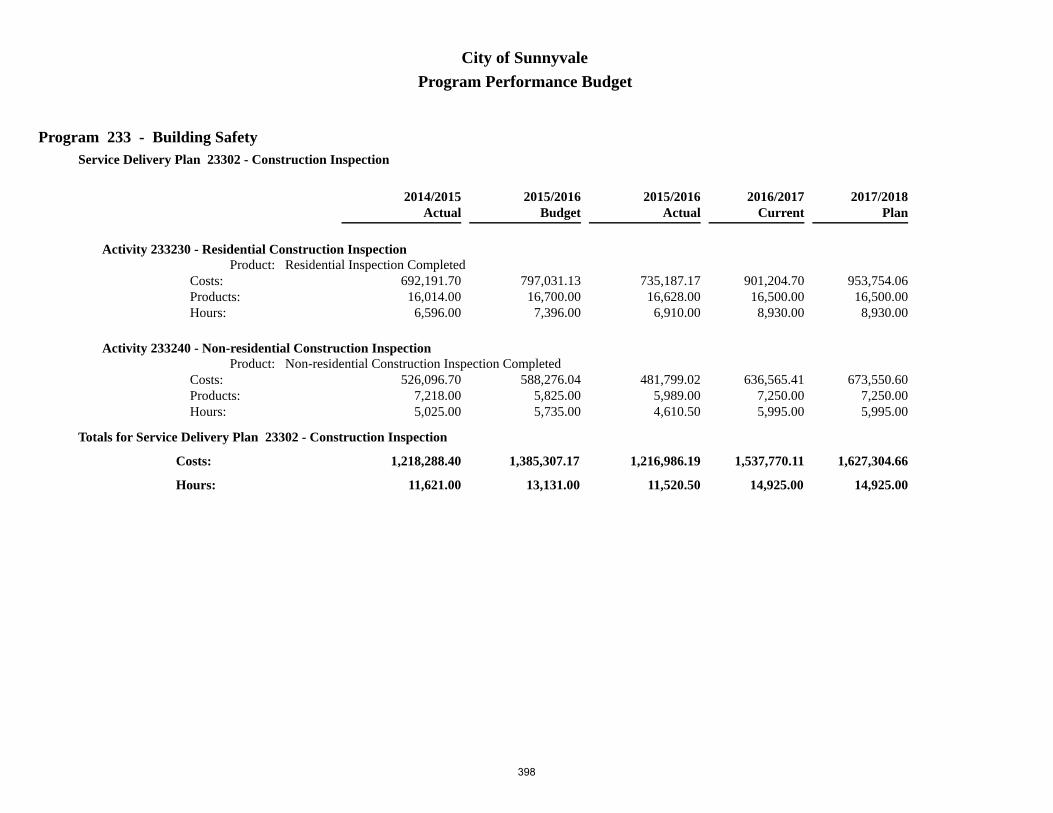
Program 233 - Building Safety
Program Performance BudgetCity of Sunnyvale
Service Delivery Plan 23302 - Construction Inspection
Budget2015/2016
Actual2014/2015
Actual2015/2016
Current2016/2017 2017/2018
Plan
Activity 233230 - Residential Construction InspectionProduct: Residential Inspection Completed
797,031.1316,700.00
7,396.00
735,187.1716,628.00
6,910.00
901,204.7016,500.00
8,930.00
953,754.0616,500.00
8,930.00
692,191.7016,014.00
6,596.00
Costs:Products: Hours:
Activity 233240 - Non-residential Construction InspectionProduct: Non-residential Construction Inspection Completed
588,276.045,825.005,735.00
481,799.025,989.004,610.50
636,565.417,250.005,995.00
673,550.607,250.005,995.00
526,096.707,218.005,025.00
Costs:Products: Hours:
13,131.00
1,385,307.17 1,216,986.19
11,520.50
1,537,770.11 1,627,304.66
Totals for Service Delivery Plan 23302 - Construction Inspection
1,218,288.40
11,621.00Hours:
Costs:
14,925.00 14,925.00
398

Program 233 - Building Safety
Program Performance BudgetCity of Sunnyvale
Service Delivery Plan 23303 - One-Stop Permit Center
Budget2015/2016
Actual2014/2015
Actual2015/2016
Current2016/2017 2017/2018
Plan
Activity 233340 - Reception and Cashier ServicesProduct: Customer Served
152,507.6915,900.00
2,050.00
180,176.8516,612.00
2,352.70
189,655.0316,500.00
2,380.00
201,094.8516,500.00
2,380.00
165,399.2016,316.00
2,262.65
Costs:Products: Hours:
Activity 233350 - Building and Fire Inspections SchedulingProduct: Inspection Scheduled
88,562.7922,000.00
1,125.00
129,021.5020,242.00
1,555.50
112,757.7822,000.00
1,400.00
119,571.1922,000.00
1,400.00
103,710.3121,945.00
1,336.50
Costs:Products: Hours:
Activity 233360 - Building Permitting InformationProduct: Customer Served
554,825.7248,000.00
5,300.00
454,835.2451,192.00
4,193.00
588,844.7749,000.00
5,455.00
626,491.9849,000.00
5,455.00
472,203.7748,841.00
4,445.50
Costs:Products: Hours:
8,475.00
795,896.20 764,033.59
8,101.20
891,257.58 947,158.02
Totals for Service Delivery Plan 23303 - One-Stop Permit Center
741,313.28
8,044.65Hours:
Costs:
9,235.00 9,235.00
399
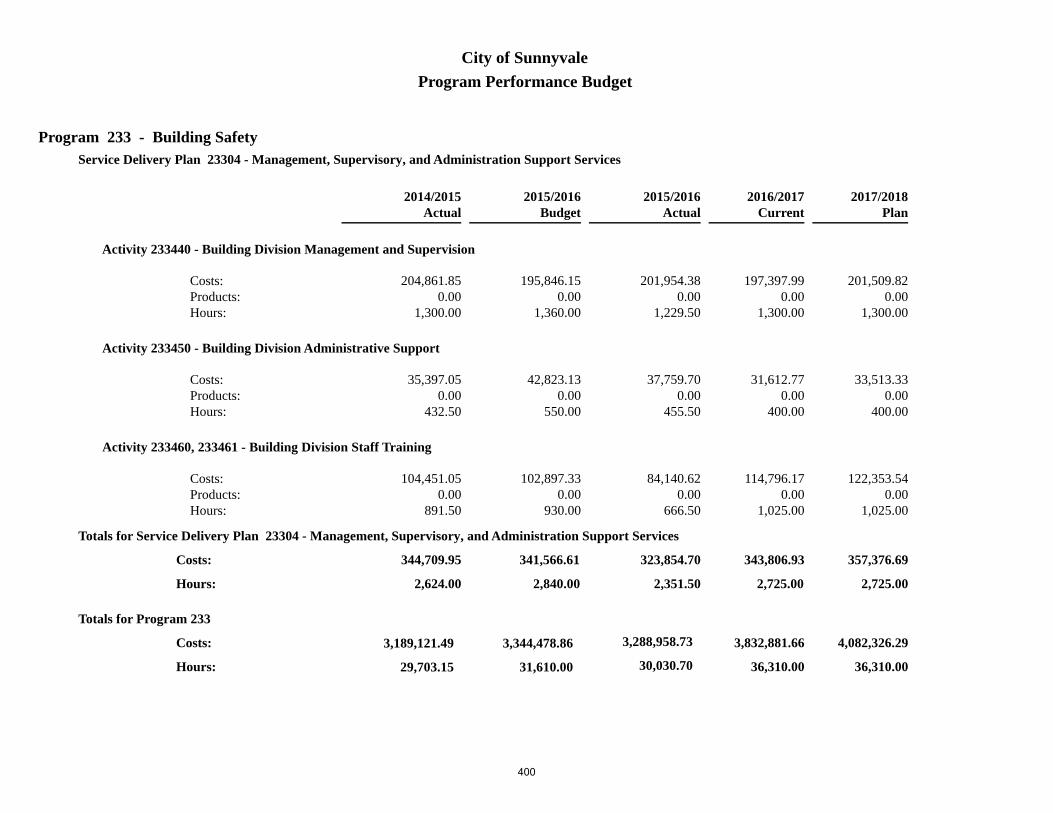
Program 233 - Building Safety
Program Performance BudgetCity of Sunnyvale
Service Delivery Plan 23304 - Management, Supervisory, and Administration Support Services
Budget2015/2016
Actual2014/2015
Actual2015/2016
Current2016/2017 2017/2018
Plan
Activity 233440 - Building Division Management and Supervision
195,846.150.00
1,360.00
201,954.380.00
1,229.50
197,397.990.00
1,300.00
201,509.820.00
1,300.00
204,861.850.00
1,300.00
Costs:Products: Hours:
Activity 233450 - Building Division Administrative Support
42,823.130.00
550.00
37,759.700.00
455.50
31,612.770.00
400.00
33,513.330.00
400.00
35,397.050.00
432.50
Costs:Products: Hours:
Activity 233460, 233461 - Building Division Staff Training
102,897.330.00
930.00
84,140.620.00
666.50
114,796.170.00
1,025.00
122,353.540.00
1,025.00
104,451.050.00
891.50
Costs:Products: Hours:
2,840.00
341,566.61 323,854.70
2,351.50
343,806.93 357,376.69
Totals for Service Delivery Plan 23304 - Management, Supervisory, and Administration Support Services
344,709.95
2,624.00Hours:
Costs:
2,725.00 2,725.00
3,344,478.86
31,610.00
3,288,958.73
30,030.70
3,189,121.49
29,703.15
Costs:
Hours: 36,310.00 36,310.00
3,832,881.66 4,082,326.29
Totals for Program 233
400

Program 234 - Planning
Program Performance BudgetCity of Sunnyvale
Service Delivery Plan 23401 - Policy Planning
Budget2015/2016
Actual2014/2015
Actual2015/2016
Current2016/2017 2017/2018
Plan
Activity 234101, 234102, 234110, 234111, 234112, 234113, 234114, 234115, 234116, 234117, 234118, 234119 - Policy ReportsProduct: A Report to Council
532,397.4130.00
4,736.00
534,447.6824.00
3,428.46
560,297.1930.00
4,748.00
598,340.3730.00
4,748.00
550,952.5925.00
4,460.58
Costs:Products: Hours:
Activity 234120, 234121, 234122, 234123 - Intergovernmental Planning Issues
62,498.530.00
335.00
42,960.700.00
236.10
68,141.980.00
430.00
73,303.940.00
430.00
45,850.870.00
285.56
Costs:Products: Hours:
5,071.00
594,895.94 577,408.38
3,664.56
628,439.17 671,644.31
Totals for Service Delivery Plan 23401 - Policy Planning
596,803.46
4,746.14Hours:
Costs:
5,178.00 5,178.00
401

Program 234 - Planning
Program Performance BudgetCity of Sunnyvale
Service Delivery Plan 23402 - Development Review
Budget2015/2016
Actual2014/2015
Actual2015/2016
Current2016/2017 2017/2018
Plan
Activity 234220, 234221, 234222, 234223, 234224, 234225, 234226 - Public Hearing Land Use Permits [Deleted]Product: Permit Approved or Denied
0.000.000.00
289.820.005.50
0.000.000.00
0.000.000.00
0.000.000.00
Costs:Products: Hours:
0.00
0.00 289.82
5.50
0.00 0.00
Totals for Service Delivery Plan 23402 - Development Review
0.00
0.00Hours:
Costs:
0.00 0.00
402

Program 234 - Planning
Program Performance BudgetCity of Sunnyvale
Service Delivery Plan 23403 - Management, Supervisory, and Administration Support Services
Budget2015/2016
Actual2014/2015
Actual2015/2016
Current2016/2017 2017/2018
Plan
Activity 234340 - Planning Division Management and Supervision
74,958.620.00
595.00
67,827.320.00
571.24
85,664.020.00
615.00
88,066.100.00
615.00
113,223.710.00
794.16
Costs:Products: Hours:
Activity 234350 - Planning Division Administration
52,653.650.00
580.00
84,436.530.00
1,173.09
59,019.200.00
595.00
71,019.150.00
683.00
60,172.620.00
763.25
Costs:Products: Hours:
Activity 234360 - Planning Division Staff Training and Development
51,146.150.00
522.00
46,593.320.00
577.04
60,938.890.00
560.00
64,775.400.00
560.00
34,480.570.00
391.08
Costs:Products: Hours:
1,697.00
178,758.42 198,857.17
2,321.37
205,622.11 223,860.65
Totals for Service Delivery Plan 23403 - Management, Supervisory, and Administration Support Services
207,876.90
1,948.49Hours:
Costs:
1,770.00 1,858.00
403

Program 234 - Planning
Program Performance BudgetCity of Sunnyvale
Service Delivery Plan 23404 - Development Review
Budget2015/2016
Actual2014/2015
Actual2015/2016
Current2016/2017 2017/2018
Plan
Activity 234410, 234411, 234412, 234413, 234414 - Staff-level Land Use PermitsProduct: Permit Approved or Denied
277,625.401,000.003,545.00
382,290.851,019.004,663.12
416,312.28950.00
4,711.00
555,960.10950.00
5,855.00
334,772.41897.00
4,425.47
Costs:Products: Hours:
Activity 234420, 234421, 234422, 234423, 234424, 234425, 234426 - Public Hearing Land Use PermitsProduct: Permit Approved or Denied
779,030.11125.00
8,860.00
985,138.15117.00
10,815.37
890,110.39125.00
9,395.00
976,524.09125.00
9,659.00
783,130.47102.00
10,073.18
Costs:Products: Hours:
Activity 234430, 234431, 234432, 234433 - Land Use and Zoning InformationProduct: Customer Served
493,119.5013,500.00
5,375.00
375,146.4414,146.00
4,254.98
566,477.6014,000.00
5,395.00
611,888.0814,000.00
5,483.00
380,095.1014,219.00
4,336.65
Costs:Products: Hours:
Activity 234440, 234441 - Regular Building PlansProduct: Regular Building Plan Permit Reviewed
83,741.85495.00865.00
94,281.33400.00922.08
76,959.80590.00760.00
99,409.75590.00936.00
86,989.41794.00913.68
Costs:Products: Hours:
Activity 234450 - Express Building PlansProduct: Minor Building Permit Reviewed
71,894.721,235.00
777.00
48,230.441,394.00
496.72
89,329.341,200.00
901.00
95,432.691,200.00
901.00
42,313.951,256.00
445.39
Costs:Products: Hours:
404

Program 234 - Planning
Program Performance BudgetCity of Sunnyvale
Service Delivery Plan 23404 - Development Review
Budget2015/2016
Actual2014/2015
Actual2015/2016
Current2016/2017 2017/2018
Plan
Activity 234460 - Redevelopment Agency Support
0.000.000.00
0.000.000.00
0.000.000.00
0.000.000.00
252.720.002.00
Costs:Products: Hours:
Activity 234470 - CEQA Support for Other Programs
0.000.000.00
0.000.000.00
89,231.890.00
880.00
95,861.590.00
880.00
0.000.000.00
Costs:Products: Hours:
19,422.00
1,705,411.58 1,885,087.21
21,152.27
2,128,421.30 2,435,076.30
Totals for Service Delivery Plan 23404 - Development Review
1,627,554.06
20,196.37Hours:
Costs:
22,042.00 23,714.00
2,479,065.94
26,190.00
2,661,642.58
27,143.70
2,432,234.42
26,891.00
Costs:
Hours: 28,990.00 30,750.00
2,962,482.58 3,330,581.26
Totals for Program 234
405

This Page Intentionally Blank
406

Program 235 - Housing and CDBG Program
Program Performance BudgetCity of Sunnyvale
Service Delivery Plan 23501 - Community Development Block Grant (CDBG)
Budget2015/2016
Actual2014/2015
Actual2015/2016
Current2016/2017 2017/2018
Plan
Activity 235110 - CDBG Planning and Administration (20% Cap)
226,173.130.00
1,984.00
222,705.580.00
1,964.30
229,419.950.00
1,931.00
238,739.380.00
1,931.00
239,998.840.00
2,102.50
Costs:Products: Hours:
Activity 235120 - Housing Improvement Program Operations (CDBG-RLF)Product: Housing Unit Improved
185,365.7542.00
2,020.00
142,994.7819.00
1,561.00
152,151.2161.00
1,640.00
164,022.6261.00
1,640.00
139,350.998.00
1,544.50
Costs:Products: Hours:
4,004.00
411,538.88 365,700.36
3,525.30
381,571.16 402,762.00
Totals for Service Delivery Plan 23501 - Community Development Block Grant (CDBG)
379,349.83
3,647.00Hours:
Costs:
3,571.00 3,571.00
407

Program 235 - Housing and CDBG Program
Program Performance BudgetCity of Sunnyvale
Service Delivery Plan 23502 - Lower Income Housing (HOME)
Budget2015/2016
Actual2014/2015
Actual2015/2016
Current2016/2017 2017/2018
Plan
Activity 235210 - HOME Administration and Monitoring (10%)Product: Assisted Unit Monitored
71,982.0469.00
721.00
73,714.13129.00768.00
74,409.6969.00
680.00
77,585.7169.00
680.00
76,848.45154.00803.00
Costs:Products: Hours:
Activity 235230 - Rental Housing Assistance: Project ManagementProduct: Affordable Rental Unit Built or Rehabilitiated
13,504.7810.00
125.00
12,511.5710.00
134.00
25,704.9618.00
215.00
26,402.2418.00
215.00
13,845.2710.00
122.00
Costs:Products: Hours:
846.00
85,486.82 86,225.70
902.00
100,114.65 103,987.95
Totals for Service Delivery Plan 23502 - Lower Income Housing (HOME)
90,693.72
925.00Hours:
Costs:
895.00 895.00
408

Program 235 - Housing and CDBG Program
Program Performance BudgetCity of Sunnyvale
Service Delivery Plan 23503 - Local Housing Activities (up to moderate-income: Housing Mitigation Fund)
Budget2015/2016
Actual2014/2015
Actual2015/2016
Current2016/2017 2017/2018
Plan
Activity 235310 - Administer Below Market Rate Housing ProgramProduct: BMR Unit
470,701.71543.00
4,808.00
460,930.54539.00
4,309.60
409,379.50548.00
3,871.00
429,603.21584.00
3,871.00
433,517.29533.00
4,273.40
Costs:Products: Hours:
Activity 235320 - Homebuyer Assistance Program DeliveryProduct: Assistance Loan Processed
19,820.394.00
200.00
18,056.042.00
179.50
20,028.813.00
200.00
21,173.833.00
200.00
23,271.514.00
229.00
Costs:Products: Hours:
Activity 235330 - Affordable Housing Capital Project ManagementProduct: Housing Unit Created or Preserved
117,053.4198.00
747.00
115,952.1657.00
734.00
237,152.82153.00
1,763.00
247,021.69153.00
1,763.00
104,935.01129.00784.50
Costs:Products: Hours:
Activity 235340, 235341, 235342 - Management, Supervision, and Administration
211,772.510.00
1,731.00
191,222.130.00
1,791.00
172,412.870.00
1,551.00
180,134.170.00
1,551.00
149,927.380.00
1,462.30
Costs:Products: Hours:
7,486.00
819,348.02 786,160.87
7,014.10
838,974.00 877,932.90
Totals for Service Delivery Plan 23503 - Local Housing Activities (up to moderate-income: Housing Mitigation Fund)
711,651.19
6,749.20Hours:
Costs:
7,385.00 7,385.00
409
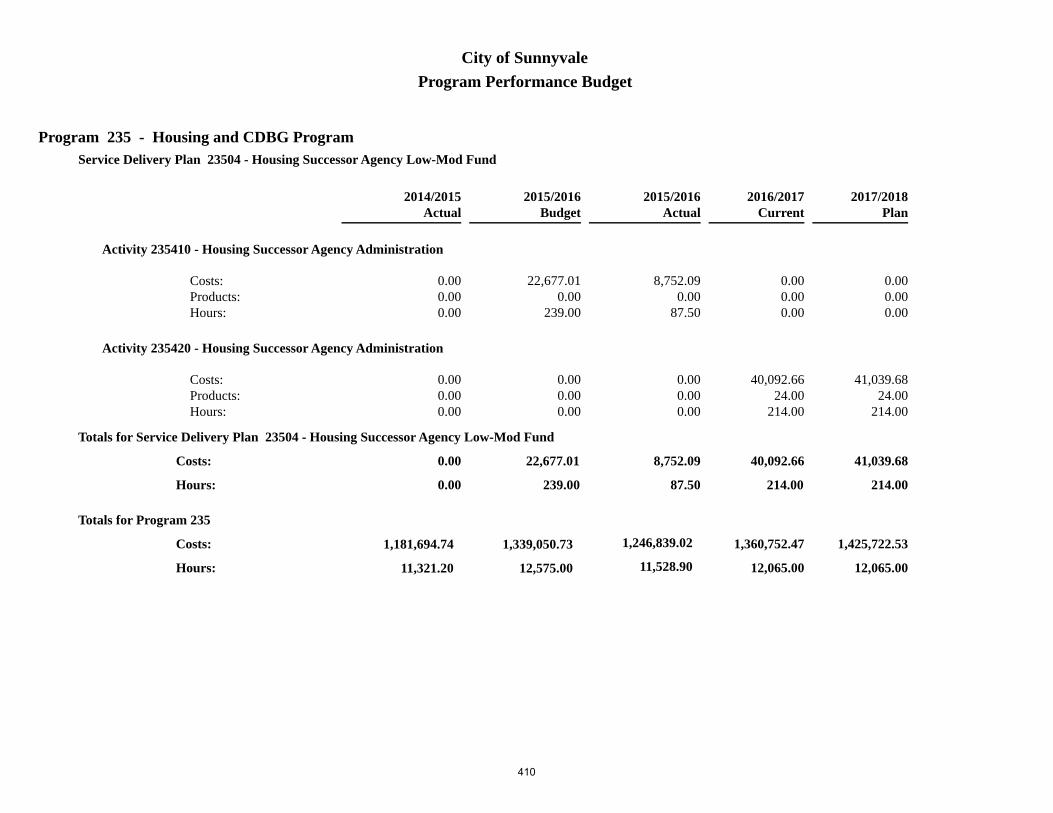
Program 235 - Housing and CDBG Program
Program Performance BudgetCity of Sunnyvale
Service Delivery Plan 23504 - Housing Successor Agency Low-Mod Fund
Budget2015/2016
Actual2014/2015
Actual2015/2016
Current2016/2017 2017/2018
Plan
Activity 235410 - Housing Successor Agency Administration
22,677.010.00
239.00
8,752.090.00
87.50
0.000.000.00
0.000.000.00
0.000.000.00
Costs:Products: Hours:
Activity 235420 - Housing Successor Agency Administration
0.000.000.00
0.000.000.00
40,092.6624.00
214.00
41,039.6824.00
214.00
0.000.000.00
Costs:Products: Hours:
239.00
22,677.01 8,752.09
87.50
40,092.66 41,039.68
Totals for Service Delivery Plan 23504 - Housing Successor Agency Low-Mod Fund
0.00
0.00Hours:
Costs:
214.00 214.00
1,339,050.73
12,575.00
1,246,839.02
11,528.90
1,181,694.74
11,321.20
Costs:
Hours: 12,065.00 12,065.00
1,360,752.47 1,425,722.53
Totals for Program 235
410

Program 237 - Community Development Department Management
Program Performance BudgetCity of Sunnyvale
Service Delivery Plan 23701 - Department Management, Supervisory, and Administration Support Services
Budget2015/2016
Actual2014/2015
Actual2015/2016
Current2016/2017 2017/2018
Plan
Activity 237110 - Department Management and Supervision
282,418.190.00
1,415.00
277,134.590.00
1,438.00
369,262.580.00
1,790.00
377,474.240.00
1,790.00
251,202.740.00
1,241.00
Costs:Products: Hours:
Activity 237120 - Department Administration
151,961.260.00
1,845.00
162,181.800.00
1,824.50
156,839.950.00
1,810.00
166,764.230.00
1,810.00
152,051.190.00
1,767.10
Costs:Products: Hours:
3,260.00
434,379.45 439,316.39
3,262.50
526,102.53 544,238.47
Totals for Service Delivery Plan 23701 - Department Management, Supervisory, and Administration Support Services
403,253.93
3,008.10Hours:
Costs:
3,600.00 3,600.00
434,379.45
3,260.00
439,316.39
3,262.50
403,253.93
3,008.10
Costs:
Hours: 3,600.00 3,600.00
526,102.53 544,238.47
Totals for Program 237
411
This Page Intentionally Blank
412

Environmental Services

Environmental Services DepartmentDepartment Description
The Environmental Services Department is responsible for maintaining the City’s potable and recycled water systems, the sanitary and storm sewer systems, the treatment of wastewater at the City’s Water Pollution Control Plant (WPCP), the collection of garbage and recyclables from City residents and business, and the diversion of recyclables through the operation of the Sunnyvale Materials Recovery and Transfer Station (SMaRT Station®). The Department, in cooperation with the Public Works Department, constructs, maintains and improves City infrastructure, with resources allocated from Water, Wastewater, and Solid Waste enterprise funds, and provides timely and cost-effective quality services to the residents and businesses of Sunnyvale; while ensuring the City complies with all applicable regulatory requirements. The Department also leads coordination of the City’s sustainability initiatives as outlined in the Climate Action Plan.
General Information
Number of Miles of Sanitary Sewer Lines: 310
Number of Water Accounts Serviced: 28,791
Number of Tons of Garbage and Recyclable Materials Collected Annually: 119,931
Programs and ServicesWater Resources
The Department’s Water and Sewer Division is responsible for supplying water to City residents. The City purchases and distributes water from two main suppliers – the Santa Clara Valley Water District and the San Francisco Public Utility Commission. These sources are supplemented by water pumped from groundwater aquifers (wells) and by recycled water from the Sunnyvale Water Pollution Control Plant. The Department provides potable water to residents through a network of distribution pipes, service laterals, including individual meters, and pressure and flow regulating valves and controls. Recycled water is provided through a separate network of pipes, valves, hydrants, and controls, all distinguishable by their purple color coding. The Department is responsible for constructing, maintaining, and improving this infrastructure in order to optimize service to City residents. The Department is also responsible for ensuring that the City’s water system is compliant with all applicable regulatory requirements.
City of Sunnyvale FY 2017/18 Adopted Budget and Resource Allocation Plan
413

The following graph illustrates a history of the consumption of water in the City by source:
15-1
6
97-9
8
98-9
9
99-0
0
00-0
1
01-0
2
02-0
3
03-0
4
04-0
5
05-0
6
06-0
7
07-0
8
08-0
9
09-1
0
10-1
1
11-1
2
12-1
3
13-1
4
14-1
5
SFPUC SCVWD Wells Recycled
0
5000
10000
15000
20000
25000
30000
Acre
Fee
t (AF
)
Years
Stormwater Collection System
The Department maintains and operates the City’s storm drainage collection system, which is comprised of approximately 300 miles of pipe, 4,200 drain inlets, two high volume pump stations, and associated appurtenances. The Water and Sewer Division is responsible for this system. Field crews provide emergency response to localized flooding, as well as general system maintenance. Overall collection and management of storm water for the City is regulated under the terms of a Bay Area-wide National Pollutant Discharge Elimination System (NPDES), Municipal Separate Storm Sewer System (MS4) Permit. The Department ensures the City is in compliance with NPDES regulations.
Sanitary Sewer Collection System
The Department’s Water and Sewer Division maintains and operates the City’s sanitary sewer collection system, which is comprised of 310 miles of pipe, approximately 29,500 lateral connections, five lift stations, and associated appurtenances. Field crews provide emergency response to system overflows, as well as general system maintenance. The sewer system and treatment plant operate under an NPDES Permit, and the collection system is regulated by the State Water Resources Control Board. The Department is responsible for maintaining compliance with all applicable regulations.
Wastewater Management
The Water Pollution Control Plant Division provides for the treatment of wastewater in the City. This includes providing treatment and discharge of wastewater from within the City and from the Rancho Rinconada residential development within the city limits of Cupertino. An additional service is the production of recycled water for use by residents, businesses, and institutions in the northern part of Sunnyvale, primarily for landscape irrigation. Another key component is generation of electrical energy from biogenic gas (methane) produced in the closed landfill and in the treatment plant digesters. The Regulatory Programs Division is responsible for management of urban runoff (storm water), including implementation of the National Pollutant Discharge Elimination System (NPDES) permit for urban runoff (storm water), as well as the laboratory and the industrial waste inspectors.
City of Sunnyvale FY 2017/18 Adopted Budget and Resource Allocation Plan
414

Solid Waste Management
The Solid Waste Division provides for collection of garbage from homes, businesses, and institutions, as well as recyclables from single- and multi-family residences, City facilities, schools and businesses, and yard trimmings from single-family homes. A food scraps collection service for single-family homes is scheduled to be implemented starting in September, 2017. The Division is currently implementing the City’s Zero Waste Strategic Plan (ZWSP). The ZWSP has a goal of diverting from disposal 75% of the solid waste generated in the community by the year 2020. Tools to accomplish this goal include offering new and improved recycling and waste reduction services, along with related information and outreach plus household hazardous waste collection services. The Division also is responsible for environmental quality monitoring, management, and regulatory compliance activities at the closed Sunnyvale Landfill.
SMaRT Station®
The Department operates the Sunnyvale Materials Recovery and Transfer Station (SMaRT Station) under a memorandum of understanding (MOU) among the cities of Mountain View, Palo Alto, and Sunnyvale. The SMaRT Station MOU is coordinated with each city’s landfill disposal agreement with Waste Management, Inc. Key services provided by the SMaRT Station include receipt of garbage from the three cities, diversion of recyclable and compostable materials by the materials recovery facility (MRF), and transfer of the unrecycled portion to Kirby Canyon Landfill in San Jose. The SMaRT Station diverts from landfill disposal more than 30% of the garbage it receives — a unique accomplishment. Taking into account source-separated materials arriving at SMaRT, 44% of all incoming materials are recycled or composted.
The Station processes and markets recyclables from Mountain View and Sunnyvale; Palo Alto has its recyclables processed elsewhere. The Station also receives, processes, and markets compostable yard trimmings. In addition, it operates a drop-off / buyback recycling center for the public and accepts “universal waste” including household batteries, used automotive fluids and batteries, paint, electronic waste, fluorescent bulbs and tubes, and medical “sharps”. It also provides confidential document shredding events for the residents of the three cities.
The following graph illustrates the proportions of the various recyclables recovered from municipal solid waste (MSW) during FY 2015/16:
Materials Diverted from MSW
Scrap Metal6%Concrete, Dirt,
Carpet, Matresses17%
Wood / Yard Trimmings13%
Aluminum, Glass, Plastic
2%
Mixed Paper& Cardboard
7%
Compostable Organics55%
Sustainability
The City’s Climate Action Plan (CAP) serves as the roadmap for initiatives to reduce community greenhouse gas emissions and foster resiliency in response to climate change. The Department’s Regulatory Programs Division facilitates and coordinates implementation of CAP across various City departments, most notably Public Works and Community Development. The Division also implements various CAP initiatives for energy conservation, alternative energy, and community engagement.
City of Sunnyvale FY 2017/18 Adopted Budget and Resource Allocation Plan
415
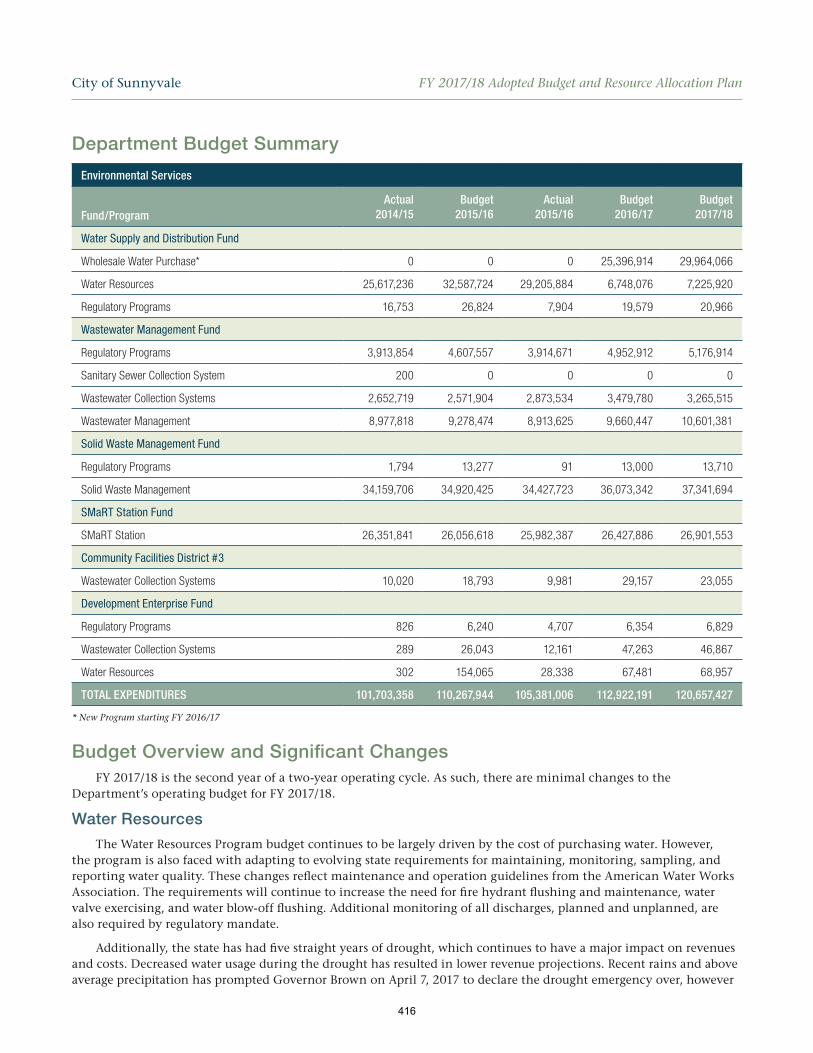
Department Budget Summary
Environmental Services
Fund/Program Actual
2014/15Budget
2015/16Actual
2015/16Budget
2016/17Budget
2017/18
Water Supply and Distribution Fund
Wholesale Water Purchase* 0 0 0 25,396,914 29,964,066
Water Resources 25,617,236 32,587,724 29,205,884 6,748,076 7,225,920
Regulatory Programs 16,753 26,824 7,904 19,579 20,966
Wastewater Management Fund
Regulatory Programs 3,913,854 4,607,557 3,914,671 4,952,912 5,176,914
Sanitary Sewer Collection System 200 0 0 0 0
Wastewater Collection Systems 2,652,719 2,571,904 2,873,534 3,479,780 3,265,515
Wastewater Management 8,977,818 9,278,474 8,913,625 9,660,447 10,601,381
Solid Waste Management Fund
Regulatory Programs 1,794 13,277 91 13,000 13,710
Solid Waste Management 34,159,706 34,920,425 34,427,723 36,073,342 37,341,694
SMaRT Station Fund
SMaRT Station 26,351,841 26,056,618 25,982,387 26,427,886 26,901,553
Community Facilities District #3
Wastewater Collection Systems 10,020 18,793 9,981 29,157 23,055
Development Enterprise Fund
Regulatory Programs 826 6,240 4,707 6,354 6,829
Wastewater Collection Systems 289 26,043 12,161 47,263 46,867
Water Resources 302 154,065 28,338 67,481 68,957
TOTAL EXPENDITURES 101,703,358 110,267,944 105,381,006 112,922,191 120,657,427
* New Program starting FY 2016/17
Budget Overview and Significant ChangesFY 2017/18 is the second year of a two-year operating cycle. As such, there are minimal changes to the
Department’s operating budget for FY 2017/18.
Water Resources
The Water Resources Program budget continues to be largely driven by the cost of purchasing water. However, the program is also faced with adapting to evolving state requirements for maintaining, monitoring, sampling, and reporting water quality. These changes reflect maintenance and operation guidelines from the American Water Works Association. The requirements will continue to increase the need for fire hydrant flushing and maintenance, water valve exercising, and water blow-off flushing. Additional monitoring of all discharges, planned and unplanned, are also required by regulatory mandate.
Additionally, the state has had five straight years of drought, which continues to have a major impact on revenues and costs. Decreased water usage during the drought has resulted in lower revenue projections. Recent rains and above average precipitation has prompted Governor Brown on April 7, 2017 to declare the drought emergency over, however
City of Sunnyvale FY 2017/18 Adopted Budget and Resource Allocation Plan
416

continued conservation momentum within the community will continue to suppress water sales over the next three years. With recent rains, operating costs such as the price of water, energy, and the implementation of water quality regulations, will continue to rise in the near term, and are incorporated into this two-year budget, as well as the Water Supply and Distribution Fund Twenty Year Financial Plan.
Wastewater Collections
Wastewater Collections Program budget includes the Sewer and Storm Collections programs. The combination of the programs has streamlined the budget for the Water and Sewer Division and more clearly reflects the entire cost of operating the City’s sewer and storm collections systems.
Solid Waste Management
Solid Waste Program costs vary year to year mainly by inflationary changes in the costs of the City’s contracts for collection, recycling, transfer and disposal of solid waste. The amount of material collected is also a factor driving program costs — tonnage collected rises and falls in tandem with economic activity. The recent economic expansion in the local area has seen tons collected increase moderately. The budget assumes that FY 2017/18 tons collected will be similar to last year and anticipates corresponding revenue levels.
Landfill post-closure maintenance and regulatory compliance costs continue to be one of the most complex and unpredictable areas of work for the Solid Waste Program. Currently, compliance areas of special interest are landfill gas and stormwater. Landfill gas, which is about 40% methane, continues to be the object of intense regulatory scrutiny due to the role of methane in climate change. This scrutiny comes from multiple levels of government and manifests itself in the form of requirements for calculating and reporting landfill gas generation rates, emissions of greenhouse gases, and leak testing of the landfill gas system and the landfill surface itself. Gas at the Sunnyvale Landfill site is well-controlled, but that does not relieve the City of costs associated with meeting the testing and reporting requirements of various regulators. At this time, no significant increases in landfill monitoring and maintenance costs are anticipated in the short term, however, further regulations are likely.
The majority of costs related to industrial stormwater discharges at the landfill and SMaRT Station have already been incurred. There is one remaining stormwater project required to be completed by 2018. As discussed in more detail in the next section in the context of the SMaRT Station, the City is currently working to design and install structural changes in that facility’s stormwater infrastructure. New collection and piping systems will separate industrial from non- industrial runoff and provide for industrial stormwater to flow to the adjacent Water Pollution Control Plant (WPCP) for treatment. The City will share the cost of these improvements with its SMaRT Station partners, Mountain View and Palo Alto.
The City’s implementation of the Zero Waste Strategic Plan continues, including a food scraps collection services for single-family homes planned to begin in September, 2017.
SMaRT Station®
SMaRT Station expenses and revenues have been updated to reflect current tonnage and anticipated recycled material values.
The budget assumes that material recovery facility (MRF) operations by the contract operator will achieve a municipal solid waste (MSW) diversion percentage of 31%, down from a prior year projection of 35%, based on actual facility achievements. This diversion reflects both the sorting equipment improvements installed by Bay Counties Waste Services (BCWS), as part of its new 2015-2021 operations contract and increased composting of 2-inch and smaller “MRF fines” mechanically sorted from the incoming garbage. The changes arising from increased diversion are reflected in the operating budget on both the expenditure side (increased composting charges, largely balanced by decreased landfill disposal charges) and revenue side (capture of a larger proportion of the beverage containers in the garbage). The budget reflects a consumer price index (CPI)- based increase of 3.53% in the annual payment to BCWS, as provided in the current operations contract.
The SMaRT Station budget includes landfill disposal charges paid to Waste Management, Inc. on behalf of all three partner cities. The per-ton landfill disposal fee will see a CPI-based increase of 3.53% effective July 1, 2017. No increases are assumed for government taxes and fees charged at Kirby Canyon Landfill.
City of Sunnyvale FY 2017/18 Adopted Budget and Resource Allocation Plan
417

Water Pollution Control Plant (WPCP)
The purpose of the WPCP is to treat wastewater suitable for discharge to the southernmost end of the Bay. The WPCP is a vital element of the utility infrastructure of the City. Large sections of the WPCP are older than 40 years. Each year additional challenges such as equipment breaks present themselves as the WPCP continues to age; and the facility degrades. The aging plant needs to be rebuilt over the next 10 to 15 years at a cost exceeding $400 million as currently estimated. In addition, “gap” projects need to be completed to keep the Plant operating until it is rebuilt. The City is now well on its way to rebuilding the Plant with a Consultant who has been working over the last two years developing the master plan for rebuilding the Plant, as well as to design the new headworks and primary facilities, which are beyond their useful life and highly vulnerable to failure. At key milestones, staff will be bringing this item to Council as the decisions related to the WPCP renovation and rebuild are addressed.
The southernmost end of the Bay where the treated wastewater is discharged is shallow and considered a fragile habitat. Treatment plants in this area are subject to strict regulatory requirements. Staff are actively monitoring and participating in regulatory developments that may impact the WPCP’s operations. In addition to these stringent regulatory compliance challenges, Sunnyvale uses an unusual method for biological treatment of wastewater employing algae growth in ponds to supply oxygen to the secondary treatment microorganisms. Over the years, solids accumulate in the ponds and ultimately need to be removed. The City has secured the services of Synagro to dredge and dewater the pond solids and remove them for reuse. This project began operations in FY 2011/12 and continues to make progress in reclaiming treatment capacity in the ponds.
The FY 2017/18 Budget includes two plans to stabilize vacancies and enhance succession planning efforts in the Water Pollution Control Operations and Maintenance group. The addition of 2.0 Principal Operator, 1.0 Mechanic in Training, offset by the deletion of 2.0 Senior Operator and 2.0 Operator positions is included in this budget to provide for an entry level position and two higher level supervisor positions in the work group. This action was included in the FY 2016/17 Adopted Budget. In March 2017, new classifications were formally approved by the City Council. These positions provide additional support and promotional opportunities for Senior Operator level positions. This budget also includes the addition of 1.0 Senior Operator and 2.0 Operator positions for a five-year period to provide additional operational capacity and oversight. Due to the 24-hour nature of the WPCP operations, staffing challenges have occurred when other positions become vacant or employees are absent. These positions will help to mitigate these challenges.
Regulatory Programs
Regulatory Programs Division services include laboratory support for water and wastewater operations, outreach and inspection services for wastewater and stormwater quality protection, oversight and reporting for wastewater and citywide stormwater compliance, and coordination of the City’s sustainability initiatives. Compliance oversight includes regulatory activities for air quality, safety, and the National Pollutant Discharge Elimination System (NPDES) permits for the Water Pollution Control Plant and for Stormwater.
NPDES permits require public outreach and education to achieve pollution prevention and reduction goals. Requirements include reaching specific audiences (e.g. adults, school children, general businesses, and specific businesses such as dentists, mobile cleaners, etc.) as well as providing messages regarding specific pollutants (e.g. mercury, trash, copper). The Regulatory Programs Division oversees these efforts.
Water quality regulations are evolving and are expected to require enhanced program activities over time. Both NPDES permits were set to expire in 2014 and completed renegotiation and renewal in 2014/15 and 2015/16. The Plant’s NPDES permit was reissued in 2014. The permit included some modest modifications and improvements. In the regional context, nutrients have emerged as a priority issue for San Francisco Bay due to concerns that the Bay may be losing its resiliency to high nutrient loads and may begin to experience significant adverse impacts. Wastewater treatment plants are the primary source of elevated nutrient loads to the Bay and a special watershed permit was adopted in 2014 which requires Plants to conduct facility evaluations in anticipation of potential infrastructure changes and to contribute to scientific studies related to nutrients.
The Stormwater Permit is a regional permit, held by each of the Bay Area cities and special districts that discharge stormwater to San Francisco Bay, which was reissued in November 2015. The new permit requires expanded implementation of elements that were in planning or pilot stages in the previous permit. These include stringent
City of Sunnyvale FY 2017/18 Adopted Budget and Resource Allocation Plan
418

requirements for the reduction of litter to creeks, measures to reduce sediment mobility to prevent the discharge of mercury and polychlorinated biphenyls (PCBs) in order to meet required numeric reductions, and a Green Infrastructure master plan development.
The Division is responsible for coordinating citywide implementation of the Climate Action Plan (adopted in May 2014), including tracking and monitoring progress and leading several CAP initiatives. The CAP identifies Community Choice Energy as one of the most effective strategies for community scale transition to renewable energy sources and reducing community greenhouse gases. The Division has also led the regional partnership which established the Silicon Valley Clean Energy Authority in spring 2016. Staff will continue to provide critical support to SVCEA as it becomes operational. Resources and funding for specific CAP initiatives will be brought forward for City Council consideration during appropriate budget cycles as part of program development or as study items are completed. A budget supplement has been included to augment resources needed to advance a new Council strategic priority to Accelerate Climate Action. This initiative will evaluate new greenhouse reduction targets and create a framework to the achieve these goals.
Department Position Allocation
ClassificationFY 2016/17
Budgeted PositionsFY 2017/18
Budgeted Positions Change
Director of Environmental Services 1 1 —
Water and Sewer Systems Division Manager 1 1 —
Regulatory Programs Division Manager 1 1 —
Solid Waste Programs Division Manager 1 1 —
WPCP Division Manager 1 1 —
Environmental Programs Manager 2 2 —
Water Operations Manager 1 1 —
Wastewater Operations Manager 1 1 —
Sr Environmental Engineer 2 2 —
Laboratory/Pretreatment Manager 1 1 —
WPCP Maintenance and Facility Manager 1 1 —
WPCP Operations Manager 1 1 —
Administrative Aide 4 4 —
Administrative Aide-Confidential 1 1 —
Administrative Analyst 1 1 —
Senior Environmental Chemist 2 2 —
Solid Waste Contract Administrator 1 1 —
Senior Environmental Compliance Inspector 1 1 —
Environmental Compliance Inspector 4 4 —
Environmental Chemist II 3 3 —
Environmental Engineering Coordinator 3 3 —
Environmental Engineering Coordinator - Term Limited 1 1 —
City of Sunnyvale FY 2017/18 Adopted Budget and Resource Allocation Plan
419

ClassificationFY 2016/17
Budgeted PositionsFY 2017/18
Budgeted Positions Change
Water System Operator 0 0 —
WPCP Mechanic in Training 1 1 —
Water Pollution Control System Integrator 1 1 —
Principal Design & Construction Operator 1 1 —
Solid Waste Specialist 1 1 —
Laboratory/Field Technician 5 5 —
Landfill Technician 1 1 —
WPC Plant Mechanic 6 6 —
Senior WPC Plant Mechanic 2 2 —
Senior WPCP Operator – (C) Certified 3 4 1
Principal Water Pollution Control Operator 2 2 —
Cross Connection Control Specialist 1 1 —
Water Distribution Supervisor 2 2 —
Water Distribution Crew Leader 5 5 —
Senior Water Distribution Worker 5 5 —
Water Distribution Worker 6 6 —
Maintenance Worker II 13 13 —
WPCP Operator II 16 17 1
WPCP Operator I 1 2 1
Wastewater Collections Supervisor 1 1 —
Wastewater Collections Crew Leader 2 2 —
Senior Wastewater Collections Worker 2 2 —
Senior Office Assistant 4 4 —
Storekeeper II 1 1 —
Staff Office Assistant 2 2 —
Utility Worker 1 1 —
Environmental Services Department Total 120 123 3
City of Sunnyvale FY 2017/18 Adopted Budget and Resource Allocation Plan
420

Environmental Services Department Performance Indicators2011 Consolidated General Plan Goals: Chapter 7, Environmental Management (EM)
Goal EM-1: Adequate Water Supplies Goal EM-2: Water ConservationGoal EM-3: Reliable and Safe Water Distribution Goal EM-4: Adequate Water QualityGoal EM-5: Minimal Pollution and Quantity of Wastewater Goal EM-6: Effective Wastewater Collection SystemGoal EM-7: Effective Wastewater Treatment Goal EM-8: Protection of Creeks and Bays Goal EM-9: Adequate Storm Drain SystemGoal EM-10: Reduced Runoff and Pollutant Discharge Goal EM-12: Safe and Healthy Solid Waste Collection Goal EM-13: Clean NeighborhoodsGoal EM-14: Recycling and Source Reduction Programs Goal EM-15: Environmentally-Sound Disposal
Please refer to the General Plan Executive Summary for further details on goals
General Plan Goal
FY 2013/14 Results
FY 2014/15 Results
FY 2015/16 Results
WATER SUPPLY AND DISTRIBUTION
WORKLOAD INDICATORS
Number of water service connections. EM-1 30,739 28,916 28,791
Number of water service work orders. EM-3, EM-4 1,618 1,908 1,802
Per capita water usage (gallons per person per day). EM-1, EM-2 125 106 94
PERFORMANCE INDICATORS
Number of emergency repairs and percent that restore service within 24 hours of notification.
EM-3, EM-4 140 100%
120 100% MET
90 100% MET
Number of water samples collected and percent in compliance with Health Department regulations.
EM-3, EM-4 2,274 100%
2,204 100% MET
2,098 100% MET
STORM WATER COLLECTION
WORKLOAD INDICATORS
Number of storm drain inlets. EM-8, EM-9, EM-10
4,200 4,200 4,200
PERFORMANCE INDICATORS
Number of preventive maintenance activities and percent completed as scheduled.
EM-8, EM-9, EM-10
3,161 100%
3,596 100% MET
3,897 100% MET
City of Sunnyvale FY 2017/18 Adopted Budget and Resource Allocation Plan
421

General Plan Goal
FY 2013/14 Results
FY 2014/15 Results
FY 2015/16 Results
SANITARY SEWER MAINTENANCE
WORKLOAD INDICATORS
Miles of sanitary sewer lines. EM-5, EM-6 283 310 310
Number of sanitary sewer service calls. EM-6 2,469 2,458 2,504
PERFORMANCE INDICATORS
Number of lateral blockages and percent responded to within 2 hours of notification.
EM-5, EM-6 2,364 96%
2,306 95% MET
2,504 95% MET
Number of sanitary sewer overflow (SSO) emergencies and percent responded to within 30 minutes of notification.
EM-5, EM-6 4 100%
6 83%
NOT MET
1 100% MET
SOLID WASTE MANAGEMENT
WORKLOAD INDICATORS
Tons of solid waste collected. EM-12, EM-13 110,749 115,142 119,931
Number of reports to Air Quality Board due to landfill gas system non-compliance.
EM-15 0 0 0
PERFORMANCE INDICATORS
Pounds of solid waste disposed per resident per day with a goal of 3 pounds per resident per day.
EM-12, EM-13 3.5 3.5 MET
3.6 MET
Energy provided by the landfill gas collection system as measured by BTU’s (in millions) and percent of prior year.
EM-15 47,306 95.1%
45,287 95.7% MET
48,490 107.1%
EXCEEDS
SMART STATION OPERATIONS
WORKLOAD INDICATORS
Tons of solid waste and recyclable materials received. EM-14 242,646 258,011 252,782
PERFORMANCE INDICATORS
Percent of all material received at the SMaRT Station that is diverted from disposal.
EM-14 36.8% 38.0% MET
43.1% MET
Quality of service provided to SMaRT Station partner cities (Mountain View and Palo Alto) as measured by percent of billings, payments, reconciliations, audits and other reports provided within two weeks of the agreed to scheduled date.
EM-14 92% 83% MET
100% EXCEEDS
WASTEWATER MANAGEMENT
WORKLOAD INDICATORS
Average wastewater flow in million gallons per day (mgd) processed by the Water Pollution Control Plant (WPCP).
EM-5, EM-6 12.78 12.89 11.79
City of Sunnyvale FY 2017/18 Adopted Budget and Resource Allocation Plan
422

General Plan Goal
FY 2013/14 Results
FY 2014/15 Results
FY 2015/16 Results
Value of capital projects performed during the year. EM-6, EM-7 2,962,985 11,861,751 12,979,552
Average age of major WPCP assets. EM-7 33 34 36
PERFORMANCE INDICATORS
Number of water quality tests and percent in compliance with water quality standards.
EM-5, EM-6 22,950 100%
22,290 100% MET
19,368 99.9% MET
Percent of time that peak flow capacity is maintained at the WPCP. EM-6, EM-7 100% 100% MET
100% MET
Percent of preventive operations procedures completed on schedule. EM-5, EM-6, EM-7
90% 92% MET
78% NOT MET
REGULATORY PROGRAMS
WORKLOAD INDICATORS
Number of tests conducted by laboratory. EM-4, EM-5, EM-7, EM-8,
EM-9
40,385 42,009 37,066
PERFORMANCE INDICATORS
Number of regulated businesses and percent in compliance with water quality standards.
EM-4 754 85.9%
898 93.1% MET
768 92.6% MET
Number of stormwater permit requirements and percent implemented on time.
EM-8 135 99%
131 100% MET
125 99%
NOT MET
Percent of total Department operating budget expended. 97.1% 94.5% MET
98.0% MET
City of Sunnyvale FY 2017/18 Adopted Budget and Resource Allocation Plan
423

This Page Intentionally Blank
424

Program 360 - Water Resources
Program Performance BudgetCity of Sunnyvale
Service Delivery Plan 36001 - Water Purchased for Resale
Budget2015/2016
Actual2014/2015
Actual2015/2016
Current2016/2017 2017/2018
Plan
Activity 360100 - San Francisco Public Utility Commission [Deleted]Product: An Acre Foot
16,721,140.5410,302.00
0.00
16,345,110.410.000.00
0.000.000.00
0.000.000.00
12,162,874.900.00
17.10
Costs:Products: Hours:
Activity 360110 - Santa Clara Valley Water District [Deleted]Product: An Acre Foot
9,775,870.0011,944.00
0.00
6,522,344.510.000.00
0.000.000.00
0.000.000.00
6,372,668.220.007.00
Costs:Products: Hours:
Activity 360120 - Wells [Deleted]Product: An Acre Foot
108,020.00120.00
0.00
135,355.480.007.00
0.000.000.00
0.000.000.00
871,009.490.00
19.40
Costs:Products: Hours:
Activity 360130 - Power Usage [Deleted]Product: A Kilowatt Hour
138,994.380.000.00
179,620.220.000.00
0.000.000.00
0.000.000.00
271,833.010.001.00
Costs:Products: Hours:
0.00
26,744,024.92 23,182,430.62
7.00
0.00 0.00
Totals for Service Delivery Plan 36001 - Water Purchased for Resale
19,678,385.62
44.50Hours:
Costs:
0.00 0.00
425

Program 360 - Water Resources
Program Performance BudgetCity of Sunnyvale
Service Delivery Plan 36002 - Water Distribution
Budget2015/2016
Actual2014/2015
Actual2015/2016
Current2016/2017 2017/2018
Plan
Activity 360200, 360201, 360202, 360203, 360204 - Water Control System (SCADA)Product: An Activity Completed
301,217.822,549.002,931.00
162,760.841,812.001,596.69
214,976.851,350.002,025.00
230,229.171,350.002,025.00
195,291.671,382.001,959.91
Costs:Products: Hours:
Activity 360210, 360211, 360212, 360213, 360214, 360215, 360216, 360217, 360218, 360219 - Preventative MaintenanceProduct: An Activity Completed
1,007,404.949,894.00
12,451.00
1,023,069.656,279.00
11,404.01
1,087,972.237,700.00
12,613.00
1,161,819.287,700.00
12,613.00
870,267.586,495.009,582.89
Costs:Products: Hours:
Activity 360220, 360221, 360222, 360223, 360224, 360225, 360226, 360227, 360228, 360229, 360261 - Corrective RepairsProduct: An Activity Completed
1,795,205.264,363.00
16,851.00
1,913,612.182,849.00
15,961.86
2,158,970.284,500.00
20,995.00
2,330,522.614,500.00
20,995.00
1,949,480.934,263.00
18,321.93
Costs:Products: Hours:
Activity 360230, 360231, 360232, 360233, 360234, 360235, 360236, 360237, 360238 - Emergency ResponseProduct: An Activity Completed
349,001.43657.00
3,950.00
89,588.45450.00
1,074.33
197,859.62650.00
2,300.00
214,074.62650.00
2,300.00
119,093.82763.00
1,521.65
Costs:Products: Hours:
Activity 360240, 360241, 360242, 360243, 360244, 360245, 360246, 360247, 360248, 360249, 360251 - Service RequestProduct: A Service Request Completed
729,937.582,428.006,940.00
781,128.075,836.007,194.62
676,591.772,400.006,520.00
722,639.282,400.006,520.00
720,293.411,396.006,873.53
Costs:Products: Hours:
426

Program 360 - Water Resources
Program Performance BudgetCity of Sunnyvale
Service Delivery Plan 36002 - Water Distribution
Budget2015/2016
Actual2014/2015
Actual2015/2016
Current2016/2017 2017/2018
Plan
Activity 360250 - Development Plan Review and Water Line Inspection
154,064.660.00
1,750.00
28,337.500.00
223.07
67,480.910.00
500.00
68,956.580.00
500.00
302.220.003.00
Costs:Products: Hours:
Activity 360260 - Power Usage
0.000.000.00
0.000.000.00
220,000.000.000.00
218,932.040.000.00
0.000.000.00
Costs:Products: Hours:
44,873.00
4,336,831.69 3,998,496.69
37,454.58
4,623,851.66 4,947,173.58
Totals for Service Delivery Plan 36002 - Water Distribution
3,854,729.63
38,262.91Hours:
Costs:
44,953.00 44,953.00
427
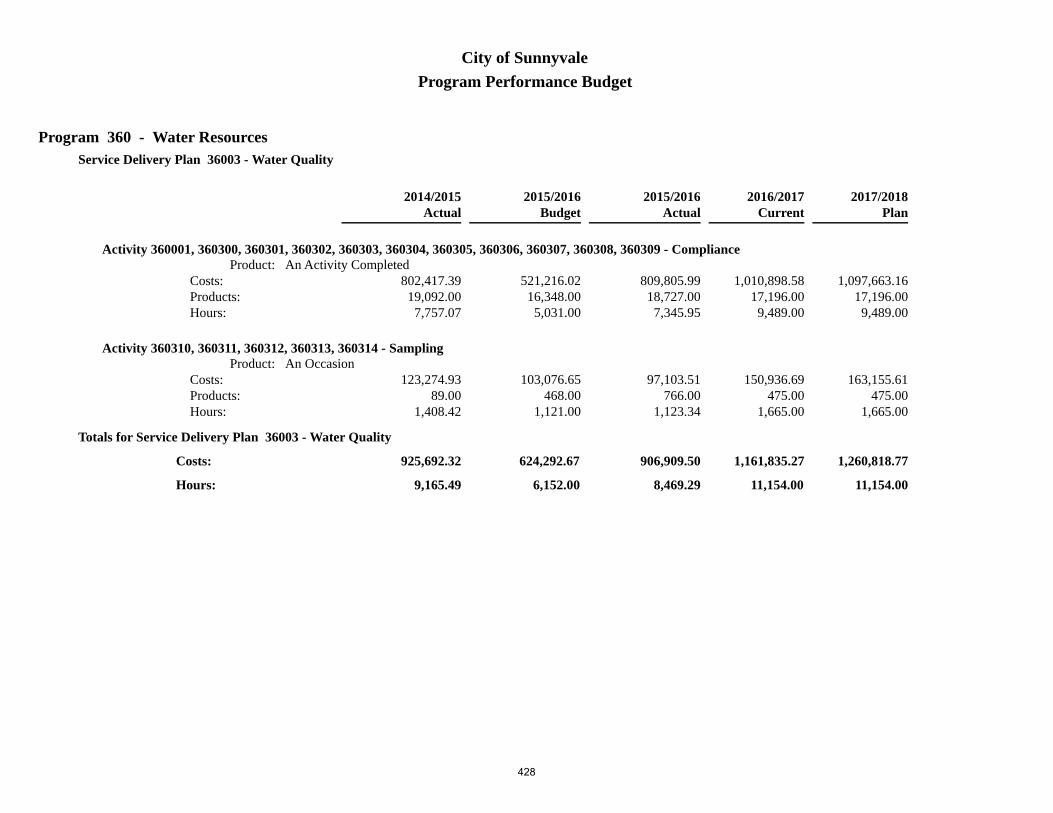
Program 360 - Water Resources
Program Performance BudgetCity of Sunnyvale
Service Delivery Plan 36003 - Water Quality
Budget2015/2016
Actual2014/2015
Actual2015/2016
Current2016/2017 2017/2018
Plan
Activity 360001, 360300, 360301, 360302, 360303, 360304, 360305, 360306, 360307, 360308, 360309 - ComplianceProduct: An Activity Completed
521,216.0216,348.00
5,031.00
809,805.9918,727.00
7,345.95
1,010,898.5817,196.00
9,489.00
1,097,663.1617,196.00
9,489.00
802,417.3919,092.00
7,757.07
Costs:Products: Hours:
Activity 360310, 360311, 360312, 360313, 360314 - SamplingProduct: An Occasion
103,076.65468.00
1,121.00
97,103.51766.00
1,123.34
150,936.69475.00
1,665.00
163,155.61475.00
1,665.00
123,274.9389.00
1,408.42
Costs:Products: Hours:
6,152.00
624,292.67 906,909.50
8,469.29
1,161,835.27 1,260,818.77
Totals for Service Delivery Plan 36003 - Water Quality
925,692.32
9,165.49Hours:
Costs:
11,154.00 11,154.00
428

Program 360 - Water Resources
Program Performance BudgetCity of Sunnyvale
Service Delivery Plan 36004 - Recycled Water Delivered
Budget2015/2016
Actual2014/2015
Actual2015/2016
Current2016/2017 2017/2018
Plan
Activity 360410 - Power Usage
77,219.100.000.00
72,445.650.000.00
80,000.000.000.00
79,611.650.000.00
83,301.260.000.00
Costs:Products: Hours:
0.00
77,219.10 72,445.65
0.00
80,000.00 79,611.65
Totals for Service Delivery Plan 36004 - Recycled Water Delivered
83,301.26
0.00Hours:
Costs:
0.00 0.00
429

Program 360 - Water Resources
Program Performance BudgetCity of Sunnyvale
Service Delivery Plan 36005 - Administration
Budget2015/2016
Actual2014/2015
Actual2015/2016
Current2016/2017 2017/2018
Plan
Activity 360500 - Management and Supervisory Services
578,292.300.00
4,360.00
401,826.410.00
2,708.53
435,166.530.00
2,816.00
456,675.920.00
2,816.00
398,363.230.00
2,814.97
Costs:Products: Hours:
Activity 360510, 360511, 360512, 360513, 360514, 360515, 360516 - Administrative Support
213,281.970.00
2,427.00
470,962.780.00
6,076.66
311,450.050.00
3,405.00
334,490.380.00
3,405.00
426,175.050.00
5,366.80
Costs:Products: Hours:
Activity 360520, 360521, 360522 - Staff Training and Development
167,845.760.00
1,898.00
201,149.740.00
1,726.74
203,253.150.00
1,810.00
216,106.410.00
1,810.00
250,890.650.00
2,261.13
Costs:Products: Hours:
8,685.00
959,420.03 1,073,938.93
10,511.93
949,869.73 1,007,272.71
Totals for Service Delivery Plan 36005 - Administration
1,075,428.93
10,442.90Hours:
Costs:
8,031.00 8,031.00
32,741,788.41
59,710.00
29,234,221.39
56,442.80
25,617,537.76
57,915.80
Costs:
Hours: 64,138.00 64,138.00
6,815,556.66 7,294,876.71
Totals for Program 360
430

Program 363 - Solid Waste Management
Program Performance BudgetCity of Sunnyvale
Service Delivery Plan 36301 - Waste Reduction and Recycling
Budget2015/2016
Actual2014/2015
Actual2015/2016
Current2016/2017 2017/2018
Plan
Activity 363100 - Waste Reduction and RecyclingProduct: Tons Recycled
404,641.6024,905.00
3,755.00
447,784.3830,425.48
4,207.85
436,744.0925,500.00
4,476.00
461,891.0625,500.00
4,476.00
468,226.5425,500.21
4,939.40
Costs:Products: Hours:
3,755.00
404,641.60 447,784.38
4,207.85
436,744.09 461,891.06
Totals for Service Delivery Plan 36301 - Waste Reduction and Recycling
468,226.54
4,939.40Hours:
Costs:
4,476.00 4,476.00
431

Program 363 - Solid Waste Management
Program Performance BudgetCity of Sunnyvale
Service Delivery Plan 36302 - Solid Waste Collection and Disposal
Budget2015/2016
Actual2014/2015
Actual2015/2016
Current2016/2017 2017/2018
Plan
Activity 363200 - Pay Collection Franchise CostsProduct: Tons Collected
20,043,706.04112,000.00
1.00
19,600,207.05119,931.48
1.00
20,437,266.20117,500.00
1.00
21,197,527.61117,500.00
1.00
19,514,997.55115,141.78
1.00
Costs:Products: Hours:
Activity 363210 - Manage Franchise and Enforce Service StandardsProduct: Tons Collected
619,400.02112,000.00
5,415.00
535,107.26119,931.48
4,351.30
595,565.41117,500.00
4,897.00
625,899.83117,500.00
4,897.00
516,740.42115,141.78
4,777.80
Costs:Products: Hours:
Activity 363220 - Refuse Transfer and Disposal (Sunnyvale)Product: Tons Collected
12,766,166.04112,000.00
1.00
12,949,362.50119,931.48
1.00
13,456,515.22117,500.00
1.00
13,884,019.11117,500.00
1.00
12,556,118.35115,141.78
1.00
Costs:Products: Hours:
Activity 363230 - Household Hazardous Waste DisposalProduct: Vehicles Served
261,009.383,750.00
25.00
104,907.731,865.00
52.70
230,456.903,000.00
45.00
231,685.433,000.00
45.00
176,867.144,469.00
66.00
Costs:Products: Hours:
Activity 363240 - Regulatory Monitoring and Regional Coordination
91,259.590.00
725.00
106,095.130.00
812.20
97,131.130.00
717.00
100,016.200.00
717.00
92,708.870.00
714.50
Costs:Products: Hours:
432

Program 363 - Solid Waste Management
Program Performance BudgetCity of Sunnyvale
6,167.00
33,781,541.07 33,295,679.67
5,218.20
34,816,934.86 36,039,148.18
Totals for Service Delivery Plan 36302 - Solid Waste Collection and Disposal
32,857,432.33
5,560.30Hours:
Costs:
5,661.00 5,661.00
433

Program 363 - Solid Waste Management
Program Performance BudgetCity of Sunnyvale
Service Delivery Plan 36303 - Landfill Post-closure Maintenance
Budget2015/2016
Actual2014/2015
Actual2015/2016
Current2016/2017 2017/2018
Plan
Activity 363300 - Monitor and Maintain Closed LandfillProduct: Acres Maintained
692,966.0893.00
4,374.00
636,433.8193.00
4,467.20
776,572.6193.00
4,685.00
796,440.5993.00
4,685.00
792,872.6893.00
4,802.80
Costs:Products: Hours:
Activity 363330 - Department-Wide Management and Administration
41,276.230.00
220.00
47,824.980.00
234.00
43,090.790.00
224.00
44,214.110.00
224.00
41,174.060.00
217.90
Costs:Products: Hours:
4,594.00
734,242.31 684,258.79
4,701.20
819,663.40 840,654.70
Totals for Service Delivery Plan 36303 - Landfill Post-closure Maintenance
834,046.74
5,020.70Hours:
Costs:
4,909.00 4,909.00
34,920,424.98
14,516.00
34,427,722.84
14,127.25
34,159,705.61
15,520.40
Costs:
Hours: 15,046.00 15,046.00
36,073,342.35 37,341,693.94
Totals for Program 363
434

Program 364 - SMaRT Station
Program Performance BudgetCity of Sunnyvale
Service Delivery Plan 36401 - SMaRT Station
Budget2015/2016
Actual2014/2015
Actual2015/2016
Current2016/2017 2017/2018
Plan
Activity 364100 - Operate SMaRT StationProduct: Tons Received
14,464,562.22245,370.00
2,972.00
14,688,031.92252,782.04
2,927.80
15,571,582.02241,293.00
3,053.00
15,947,270.79241,293.00
3,053.00
13,740,321.47258,010.86
2,908.00
Costs:Products: Hours:
Activity 364110 - Dispose of SMaRT Station ResidueProduct: Tons Disposed
10,160,075.87142,702.00
1.00
9,830,331.74143,950.40
1.00
9,416,926.82149,128.00
1.00
9,584,481.96149,128.00
1.00
10,719,238.03159,653.09
1.00
Costs:Products: Hours:
Activity 364120 - Distribute SMaRT Station RevenuesProduct: Tons Received
1,390,500.87245,370.00
1.00
1,418,914.36252,782.04
1.00
1,396,747.82241,293.00
1.00
1,338,797.96241,293.00
1.00
1,849,039.59258,010.86
1.00
Costs:Products: Hours:
Activity 364130 - Department-Wide Management and Administration
41,478.610.00
230.00
45,109.420.00
230.50
42,629.340.00
224.00
43,502.690.00
224.00
43,242.240.00
231.90
Costs:Products: Hours:
3,204.00
26,056,617.57 25,982,387.44
3,160.30
26,427,886.00 26,914,053.40
Totals for Service Delivery Plan 36401 - SMaRT Station
26,351,841.33
3,141.90Hours:
Costs:
3,279.00 3,279.00
435

Program 364 - SMaRT Station
Program Performance BudgetCity of Sunnyvale
26,056,617.57
3,204.00
25,982,387.44
3,160.30
26,351,841.33
3,141.90
Costs:
Hours: 3,279.00 3,279.00
26,427,886.00 26,914,053.40
Totals for Program 364
436

Program 365 - Wastewater Management
Program Performance BudgetCity of Sunnyvale
Service Delivery Plan 36501 - Operations
Budget2015/2016
Actual2014/2015
Actual2015/2016
Current2016/2017 2017/2018
Plan
Activity 365100, 365101, 365105, 365107, 365109 - Process WastewaterProduct: Million Gallons Processed
1,999,634.965,000.00
15,558.00
1,918,927.030.00
14,056.80
2,012,029.304,562.00
15,490.00
2,329,802.824,562.00
17,350.00
1,922,994.294,648.60
14,529.80
Costs:Products: Hours:
Activity 365110 - Operations Preventive MaintenanceProduct: A Preventive Operational Procedure Completed
632,981.0112,200.00
6,962.00
554,814.330.00
5,881.50
538,897.8212,600.00
6,050.00
600,053.1112,600.00
6,175.00
657,559.9212,614.00
7,539.90
Costs:Products: Hours:
Activity 365120, 365121 - Solids HandlingProduct: Tons of Biosolids Processed
758,330.423,850.008,944.00
704,263.440.00
8,161.00
906,532.202,700.008,900.00
909,724.932,700.008,900.00
675,335.031,411.648,064.90
Costs:Products: Hours:
Activity 365130 - Staff Training and Development
347,742.550.00
3,867.00
535,124.620.00
7,028.65
393,500.690.00
4,300.00
446,381.640.00
4,450.00
378,048.960.00
4,354.60
Costs:Products: Hours:
Activity 365140 - Deliver Recycled Water to the Recycled Water SystemProduct: Million Gallons of Recycled Water Managed
253,454.04150.00
2,249.00
245,155.110.00
2,552.00
313,974.87270.00
2,460.00
338,377.78270.00
2,485.00
160,386.75267.54
1,706.30
Costs:Products: Hours:
437

Program 365 - Wastewater Management
Program Performance BudgetCity of Sunnyvale
Service Delivery Plan 36501 - Operations
Budget2015/2016
Actual2014/2015
Actual2015/2016
Current2016/2017 2017/2018
Plan
Activity 365150 - Tertiary Operations
1,602,053.960.00
8,022.00
1,358,576.430.00
8,727.80
1,542,662.720.00
8,870.00
1,708,878.670.00
8,920.00
1,498,620.860.00
9,135.60
Costs:Products: Hours:
Activity 365160 - Solids Dewatering [Deleted]
331,039.990.00
2,578.00
119,211.930.00
993.50
0.000.000.00
0.000.000.00
232,196.760.00
2,099.50
Costs:Products: Hours:
48,180.00
5,925,236.93 5,436,072.89
47,401.25
5,707,597.60 6,333,218.95
Totals for Service Delivery Plan 36501 - Operations
5,525,142.57
47,430.60Hours:
Costs:
46,070.00 48,280.00
438

Program 365 - Wastewater Management
Program Performance BudgetCity of Sunnyvale
Service Delivery Plan 36502 - Maintenance
Budget2015/2016
Actual2014/2015
Actual2015/2016
Current2016/2017 2017/2018
Plan
Activity 365200 - Tailgates, Program Coordination, and Meetings
131,850.840.00
1,350.00
70,059.280.00
775.60
121,012.550.00
1,214.00
132,144.310.00
1,254.00
90,355.690.00
986.80
Costs:Products: Hours:
Activity 365210, 365211, 365212, 365213, 365214, 365215 - Prescribed Preventive Maintenance - CMMSProduct: A Work Order
565,926.90890.00
2,350.00
735,313.25852.00
2,777.00
822,072.42890.00
4,099.00
902,314.07890.00
4,703.00
635,002.161,615.001,891.50
Costs:Products: Hours:
Activity 365220, 365221, 365222, 365223, 365224 - Corrective Maintenance - CMMS PlannedProduct: A Work Order
906,929.58850.00
6,521.00
741,086.64420.00
4,747.50
869,919.37850.00
5,931.00
952,682.63850.00
6,375.00
1,079,408.551,820.006,836.40
Costs:Products: Hours:
Activity 365230, 365231, 365232, 365233, 365234 - Unscheduled Repairs - Equipment and FacilityProduct: A Work Order
124,889.4480.00
661.00
305,890.43162.00
2,391.20
142,377.4580.00
611.00
169,217.6180.00
891.00
138,537.79111.00928.60
Costs:Products: Hours:
Activity 365240, 365241, 365242, 365243, 365244 - Modifications/Improvements to Equipment and FactilitiesProduct: A Work Order
141,111.5975.00
946.00
220,396.3260.00
662.10
267,956.4575.00
946.00
285,885.6375.00
1,070.00
170,030.4571.00
659.80
Costs:Products: Hours:
439

Program 365 - Wastewater Management
Program Performance BudgetCity of Sunnyvale
Service Delivery Plan 36502 - Maintenance
Budget2015/2016
Actual2014/2015
Actual2015/2016
Current2016/2017 2017/2018
Plan
Activity 365250, 365251 - Management and Supervisory Services
363,168.720.00
1,185.00
427,593.840.00
1,900.00
282,663.640.00
1,271.00
289,584.660.00
1,271.00
203,255.570.00
387.00
Costs:Products: Hours:
Activity 365260 - Inventory Control and Supply ManagementProduct: A Work Order Issued [Deleted]
138,429.560.00
1,843.00
124,369.500.00
1,641.40
140,527.610.00
1,853.00
155,080.910.00
1,893.00
125,942.240.00
1,673.30
Costs:Products: Hours:
Activity 365270 - Staff Review of Plans and Specifications - Capital Projects
53,872.210.00
479.00
510.660.006.00
90,584.710.00
829.00
95,573.610.00
833.00
37,755.050.00
416.50
Costs:Products: Hours:
Activity 365280 - Staff Training and DevelopmentProduct: An Employee Trained [Deleted]
29,585.089.00
278.00
36,789.250.00
318.50
48,024.820.00
332.00
61,396.030.00
476.00
82,063.470.00
713.20
Costs:Products: Hours:
Activity 365290 - Power Generation Operations and Emissions Management
36,167.020.00
302.00
6,862.7312.0041.00
37,429.500.00
325.00
46,065.160.00
405.00
13,733.310.00
118.00
Costs:Products: Hours:
440

Program 365 - Wastewater Management
Program Performance BudgetCity of Sunnyvale
15,915.00
2,491,930.94 2,668,871.90
15,260.30
2,822,568.52 3,089,944.62
Totals for Service Delivery Plan 36502 - Maintenance
2,576,084.28
14,611.10Hours:
Costs:
17,411.00 19,171.00
441
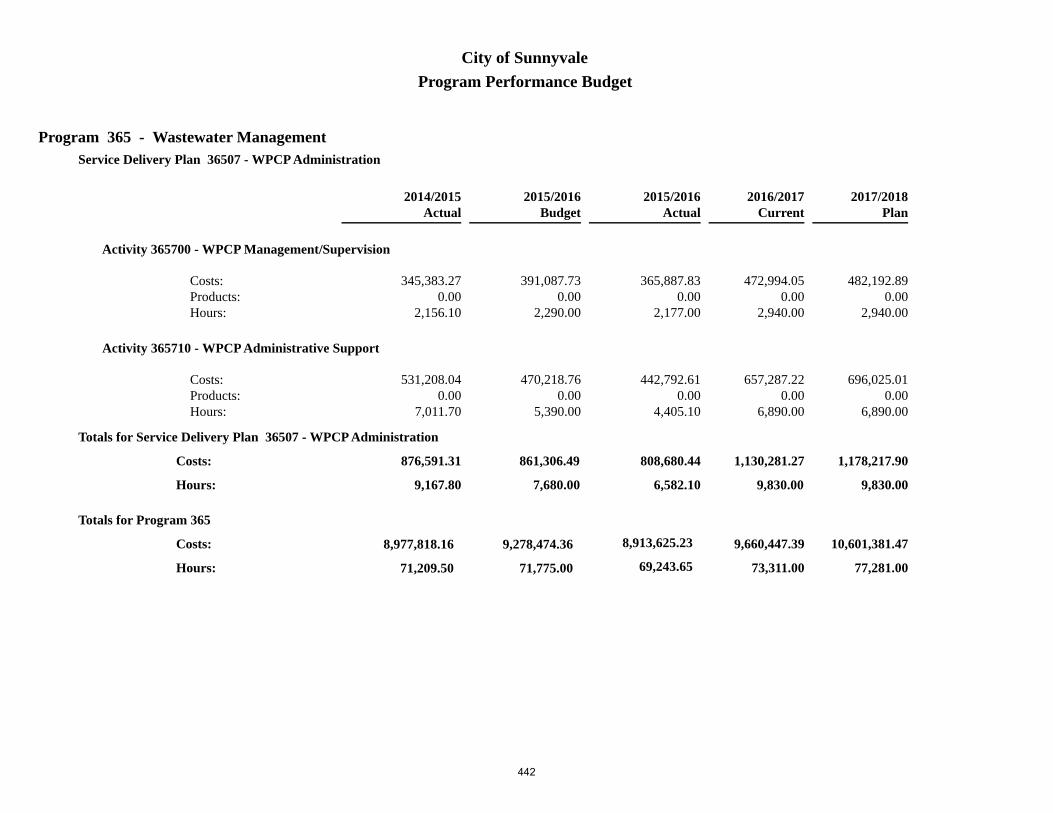
Program 365 - Wastewater Management
Program Performance BudgetCity of Sunnyvale
Service Delivery Plan 36507 - WPCP Administration
Budget2015/2016
Actual2014/2015
Actual2015/2016
Current2016/2017 2017/2018
Plan
Activity 365700 - WPCP Management/Supervision
391,087.730.00
2,290.00
365,887.830.00
2,177.00
472,994.050.00
2,940.00
482,192.890.00
2,940.00
345,383.270.00
2,156.10
Costs:Products: Hours:
Activity 365710 - WPCP Administrative Support
470,218.760.00
5,390.00
442,792.610.00
4,405.10
657,287.220.00
6,890.00
696,025.010.00
6,890.00
531,208.040.00
7,011.70
Costs:Products: Hours:
7,680.00
861,306.49 808,680.44
6,582.10
1,130,281.27 1,178,217.90
Totals for Service Delivery Plan 36507 - WPCP Administration
876,591.31
9,167.80Hours:
Costs:
9,830.00 9,830.00
9,278,474.36
71,775.00
8,913,625.23
69,243.65
8,977,818.16
71,209.50
Costs:
Hours: 73,311.00 77,281.00
9,660,447.39 10,601,381.47
Totals for Program 365
442

Program 366 - Regulatory Programs
Program Performance BudgetCity of Sunnyvale
Service Delivery Plan 36601 - Stormwater Permit Compliance Program
Budget2015/2016
Actual2014/2015
Actual2015/2016
Current2016/2017 2017/2018
Plan
Activity 366110 - City Internal Permit Implementation
262,752.290.00
1,700.00
196,177.210.00
1,378.60
401,508.100.00
2,880.00
417,271.020.00
2,880.00
160,044.820.00
994.10
Costs:Products: Hours:
Activity 366120 - Participation in Regional Permit Program
485,942.400.00
1,161.00
427,768.130.00
703.50
566,897.120.00
1,640.00
587,368.740.00
1,640.00
416,556.370.00
764.70
Costs:Products: Hours:
2,861.00
748,694.69 623,945.34
2,082.10
968,405.22 1,004,639.76
Totals for Service Delivery Plan 36601 - Stormwater Permit Compliance Program
576,601.19
1,758.80Hours:
Costs:
4,520.00 4,520.00
443

Program 366 - Regulatory Programs
Program Performance BudgetCity of Sunnyvale
Service Delivery Plan 36602 - NPDES Compliance Inspection
Budget2015/2016
Actual2014/2015
Actual2015/2016
Current2016/2017 2017/2018
Plan
Activity 366210 - Compliance Inspection PermittingProduct: A Permitting Activity
148,002.05100.00
1,890.00
18,494.1427.00
226.00
144,050.5330.00
1,882.00
154,815.8230.00
1,882.00
108,261.5677.00
1,434.00
Costs:Products: Hours:
Activity 366220, 366221 - Compliance Field InspectionProduct: An Inspection or Sampling Activity
534,983.211,050.005,884.00
301,222.111,578.003,135.00
475,037.403,000.005,110.00
503,374.363,000.005,110.00
406,270.623,018.004,148.00
Costs:Products: Hours:
Activity 366230 - Compliance Inspection EnforcementProduct: An Enforcement Activity
82,577.60230.00
1,020.00
34,486.53246.00451.00
76,111.33240.00920.00
81,806.69240.00920.00
61,773.06240.00802.00
Costs:Products: Hours:
Activity 366240 - Compliance Inspection Administration
210,703.710.00
2,426.00
514,271.020.00
7,270.50
307,864.890.00
3,712.00
329,796.250.00
3,712.00
296,278.860.00
3,892.20
Costs:Products: Hours:
Activity 366250 - Compliance Inspection Management/Supervision
74,744.130.00
620.00
44,898.590.00
378.00
77,603.540.00
620.00
79,909.120.00
620.00
58,470.680.00
518.50
Costs:Products: Hours:
444

Program 366 - Regulatory Programs
Program Performance BudgetCity of Sunnyvale
Service Delivery Plan 36602 - NPDES Compliance Inspection
Budget2015/2016
Actual2014/2015
Actual2015/2016
Current2016/2017 2017/2018
Plan
Activity 366260 - Development Plan Review and Inspection
6,240.490.00
66.00
4,707.480.00
49.70
6,353.880.00
66.00
6,829.310.00
66.00
825.870.008.00
Costs:Products: Hours:
11,906.00
1,057,251.19 918,079.87
11,510.20
1,087,021.57 1,156,531.55
Totals for Service Delivery Plan 36602 - NPDES Compliance Inspection
931,880.65
10,802.70Hours:
Costs:
12,310.00 12,310.00
445

Program 366 - Regulatory Programs
Program Performance BudgetCity of Sunnyvale
Service Delivery Plan 36603 - Sustainability
Budget2015/2016
Actual2014/2015
Actual2015/2016
Current2016/2017 2017/2018
Plan
Activity 366320 - Sustainability - Outreach and Education
28,703.220.00
348.00
26,619.740.00
264.50
42,274.070.00
400.00
45,283.680.00
400.00
502.720.008.50
Costs:Products: Hours:
Activity 366330 - Sustainability - Environmental and Energy Auditing
29,179.200.00
380.00
12,187.550.00
116.90
10,882.030.00
100.00
11,696.340.00
100.00
1,880.480.00
24.50
Costs:Products: Hours:
Activity 366340, 366341 - Sustainability - Policy Review and Program Development
120,732.970.00
1,200.00
300,183.400.00
3,140.80
234,024.570.00
1,950.00
245,182.710.00
1,950.00
246,485.530.00
1,641.00
Costs:Products: Hours:
1,928.00
178,615.39 338,990.69
3,522.20
287,180.67 302,162.73
Totals for Service Delivery Plan 36603 - Sustainability
248,868.73
1,674.00Hours:
Costs:
2,450.00 2,450.00
446

Program 366 - Regulatory Programs
Program Performance BudgetCity of Sunnyvale
Service Delivery Plan 36604 - Air Regulations, Greenhouse Gases and Safety
Budget2015/2016
Actual2014/2015
Actual2015/2016
Current2016/2017 2017/2018
Plan
Activity 366410 - Air Regulations, Title V, GHG - WPCP
99,675.340.00
230.00
69,117.710.00
210.00
124,750.770.00
490.00
166,444.190.00
490.00
89,739.420.00
665.00
Costs:Products: Hours:
Activity 366420 - Air Regulations, Title V, GHG - Landfill
7,651.460.00
65.00
90.870.001.00
7,215.620.00
60.00
7,580.510.00
60.00
1,727.850.00
13.50
Costs:Products: Hours:
Activity 366430 - Haz/Safety Regulations - WPCP
47,055.580.00
291.00
52,882.580.00
478.00
106,149.480.00
396.00
68,225.330.00
396.00
64,130.780.00
590.30
Costs:Products: Hours:
Activity 366440 - Haz/Safety Regulations - City
5,625.690.00
50.00
0.000.000.00
5,784.200.00
50.00
6,129.520.00
50.00
66.200.000.50
Costs:Products: Hours:
Activity 366450 - Air, GHG - City
2,137.560.00
20.00
0.000.000.00
2,176.410.00
20.00
2,339.260.00
20.00
0.000.000.00
Costs:Products: Hours:
447
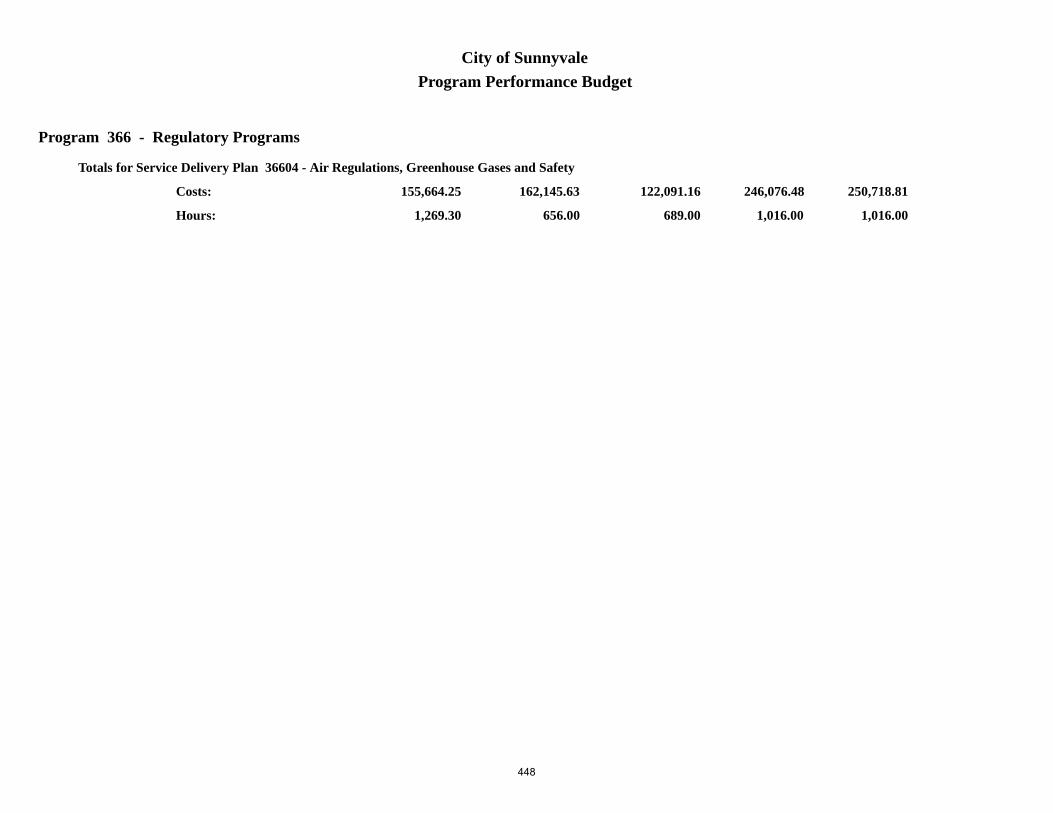
Program 366 - Regulatory Programs
Program Performance BudgetCity of Sunnyvale
656.00
162,145.63 122,091.16
689.00
246,076.48 250,718.81
Totals for Service Delivery Plan 36604 - Air Regulations, Greenhouse Gases and Safety
155,664.25
1,269.30Hours:
Costs:
1,016.00 1,016.00
448
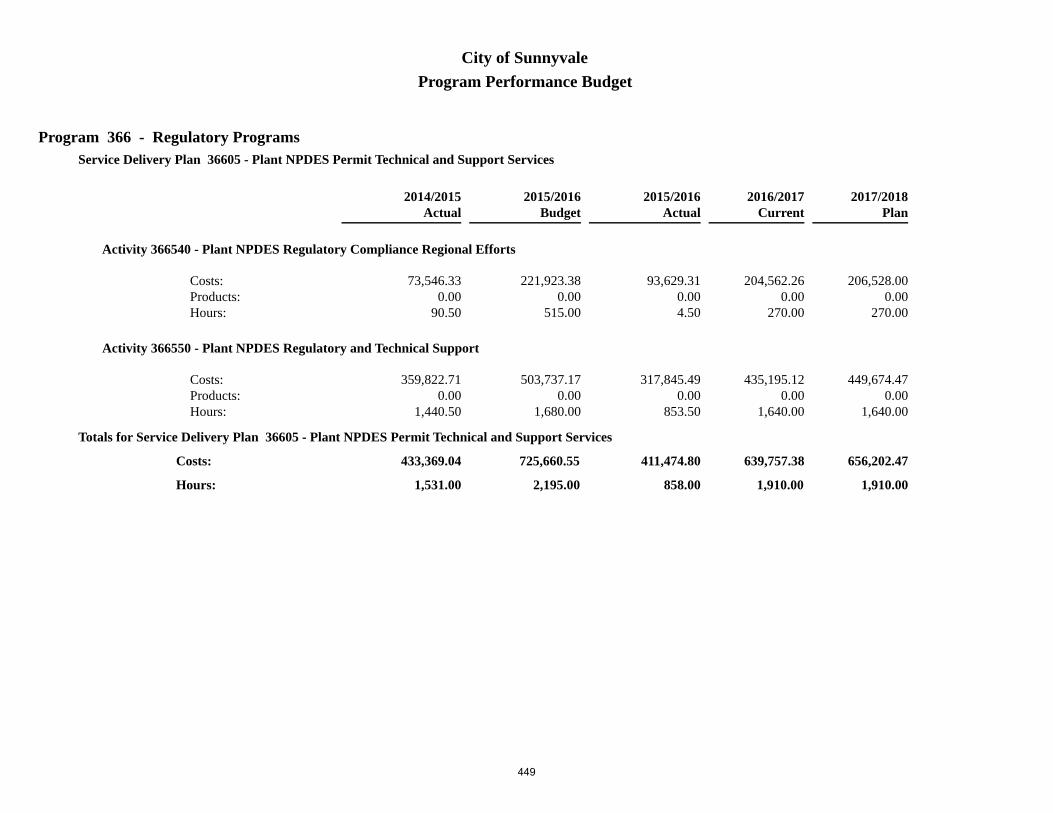
Program 366 - Regulatory Programs
Program Performance BudgetCity of Sunnyvale
Service Delivery Plan 36605 - Plant NPDES Permit Technical and Support Services
Budget2015/2016
Actual2014/2015
Actual2015/2016
Current2016/2017 2017/2018
Plan
Activity 366540 - Plant NPDES Regulatory Compliance Regional Efforts
221,923.380.00
515.00
93,629.310.004.50
204,562.260.00
270.00
206,528.000.00
270.00
73,546.330.00
90.50
Costs:Products: Hours:
Activity 366550 - Plant NPDES Regulatory and Technical Support
503,737.170.00
1,680.00
317,845.490.00
853.50
435,195.120.00
1,640.00
449,674.470.00
1,640.00
359,822.710.00
1,440.50
Costs:Products: Hours:
2,195.00
725,660.55 411,474.80
858.00
639,757.38 656,202.47
Totals for Service Delivery Plan 36605 - Plant NPDES Permit Technical and Support Services
433,369.04
1,531.00Hours:
Costs:
1,910.00 1,910.00
449

Program 366 - Regulatory Programs
Program Performance BudgetCity of Sunnyvale
Service Delivery Plan 36606 - Outreach
Budget2015/2016
Actual2014/2015
Actual2015/2016
Current2016/2017 2017/2018
Plan
Activity 366610 - Outreach - Wastewater
47,009.280.00
570.00
31,101.740.00
333.50
66,523.620.00
890.00
70,893.080.00
890.00
44,376.900.00
514.50
Costs:Products: Hours:
Activity 366620, 366621 - Outreach - Stormwater
114,351.740.00
874.00
110,326.410.00
787.00
139,175.040.00
1,370.00
146,469.490.00
1,370.00
123,035.420.00
1,003.60
Costs:Products: Hours:
Activity 366630 - Outreach - Water
26,824.020.00
346.00
7,903.630.00
97.80
19,578.700.00
210.00
20,966.300.00
210.00
16,752.580.00
199.00
Costs:Products: Hours:
1,790.00
188,185.04 149,331.78
1,218.30
225,277.36 238,328.87
Totals for Service Delivery Plan 36606 - Outreach
184,164.90
1,717.10Hours:
Costs:
2,470.00 2,470.00
450

Program 366 - Regulatory Programs
Program Performance BudgetCity of Sunnyvale
Service Delivery Plan 36607 - Laboratory
Budget2015/2016
Actual2014/2015
Actual2015/2016
Current2016/2017 2017/2018
Plan
Activity 366700 - WPCP Lab Operations/Administration
253,660.420.00
2,790.00
226,913.350.00
2,165.00
269,552.360.00
2,760.00
282,389.810.00
2,760.00
268,716.190.00
2,231.30
Costs:Products: Hours:
Activity 366710 - WPCP Lab Certification/QAQCProduct: An Analysis
322,923.449,665.002,780.00
317,995.888,146.003,453.50
291,386.019,874.002,830.00
307,412.699,874.002,830.00
260,089.3110,083.00
2,847.70
Costs:Products: Hours:
Activity 366720 - Water Quality AnalysisProduct: An Analysis
858,603.6422,011.006,406.00
690,882.8717,979.00
6,233.50
831,132.4622,150.00
6,480.00
868,849.4922,150.00
6,480.00
747,635.5322,290.00
6,645.70
Costs:Products: Hours:
Activity 366730 - WPCP Lab Management/Supervision
158,158.890.00
1,350.00
127,666.820.00
1,067.00
146,054.720.00
1,190.00
151,183.750.00
1,190.00
126,236.970.00
1,186.50
Costs:Products: Hours:
13,326.00
1,593,346.39 1,363,458.92
12,919.00
1,538,125.55 1,609,835.74
Totals for Service Delivery Plan 36607 - Laboratory
1,402,678.00
12,911.20Hours:
Costs:
13,260.00 13,260.00
451

Program 366 - Regulatory Programs
Program Performance BudgetCity of Sunnyvale
4,653,898.88
34,662.00
3,927,372.56
32,798.80
3,933,226.76
31,664.10
Costs:
Hours: 37,936.00 37,936.00
4,991,844.23 5,218,419.93
Totals for Program 366
452

Program 367 - Wastewater Collection Systems
Program Performance BudgetCity of Sunnyvale
Service Delivery Plan 36701 - Service Calls
Budget2015/2016
Actual2014/2015
Actual2015/2016
Current2016/2017 2017/2018
Plan
Activity 367100 - On-Call Regular Hours Service RequestProduct: An Occasion
122,155.41795.00
1,406.00
121,085.65323.00
1,441.90
170,045.82110.00
2,552.00
182,422.61110.00
2,552.00
73,798.42103.00
1,008.35
Costs:Products: Hours:
Activity 367110 - Standby Duty Service RequestProduct: An Occasion
175,264.95795.00
2,600.00
203,166.221,136.002,622.60
151,132.001,520.001,798.00
160,605.101,520.001,798.00
196,509.841,521.002,544.91
Costs:Products: Hours:
Activity 367120 - Service Requests Determined to be Property Owner ResponsibilityProduct: An Occasion
0.000.000.00
39,582.12524.00620.30
34,268.42795.00423.00
36,386.85795.00423.00
60,753.75795.00815.98
Costs:Products: Hours:
Activity 367130 - Respond to Flooding Calls and Clean/Clear DIsProduct: An Occasion
22,817.71100.00282.00
12,243.6792.00
166.10
27,611.66440.00282.00
29,188.81440.00282.00
42,721.48439.00526.54
Costs:Products: Hours:
4,288.00
320,238.07 376,077.66
4,850.90
383,057.90 408,603.37
Totals for Service Delivery Plan 36701 - Service Calls
373,783.49
4,895.78Hours:
Costs:
5,055.00 5,055.00
453
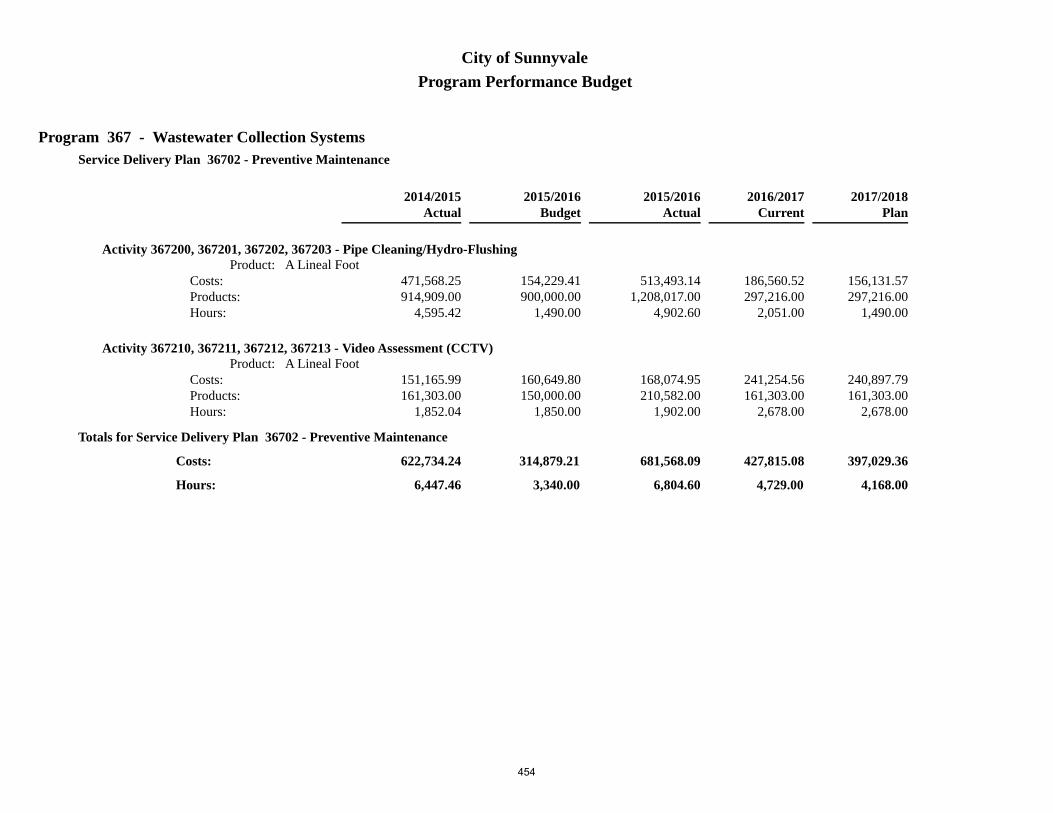
Program 367 - Wastewater Collection Systems
Program Performance BudgetCity of Sunnyvale
Service Delivery Plan 36702 - Preventive Maintenance
Budget2015/2016
Actual2014/2015
Actual2015/2016
Current2016/2017 2017/2018
Plan
Activity 367200, 367201, 367202, 367203 - Pipe Cleaning/Hydro-FlushingProduct: A Lineal Foot
154,229.41900,000.00
1,490.00
513,493.141,208,017.00
4,902.60
186,560.52297,216.00
2,051.00
156,131.57297,216.00
1,490.00
471,568.25914,909.00
4,595.42
Costs:Products: Hours:
Activity 367210, 367211, 367212, 367213 - Video Assessment (CCTV)Product: A Lineal Foot
160,649.80150,000.00
1,850.00
168,074.95210,582.00
1,902.00
241,254.56161,303.00
2,678.00
240,897.79161,303.00
2,678.00
151,165.99161,303.00
1,852.04
Costs:Products: Hours:
3,340.00
314,879.21 681,568.09
6,804.60
427,815.08 397,029.36
Totals for Service Delivery Plan 36702 - Preventive Maintenance
622,734.24
6,447.46Hours:
Costs:
4,729.00 4,168.00
454

Program 367 - Wastewater Collection Systems
Program Performance BudgetCity of Sunnyvale
Service Delivery Plan 36703 - Scheduled Maintenance
Budget2015/2016
Actual2014/2015
Actual2015/2016
Current2016/2017 2017/2018
Plan
Activity 367300, 367301, 367302, 367303 - Storm Drain Inlets/OutfallsProduct: An Occasion
238,268.453,750.003,627.00
125,110.093,238.00
666.40
272,441.953,750.004,292.00
269,721.163,750.004,292.00
104,229.263,597.001,385.85
Costs:Products: Hours:
Activity 367310, 367311, 367312 - Pump/Lift Station MaintenanceProduct: An Activity Completed
36,555.80300.00442.00
111,949.17441.00779.60
93,496.3028.00
664.00
97,374.4428.00
664.00
41,053.3628.00
129.51
Costs:Products: Hours:
Activity 367320, 367321, 367322, 367323 - Underground Utility LocatingProduct: An Activity Completed
87,468.105,000.001,138.00
102,631.3210,147.00
1,236.40
93,519.619,800.001,064.00
99,007.899,800.001,064.00
100,162.589,823.001,195.69
Costs:Products: Hours:
Activity 367330 - Televise Sewer Lateral Components for Condition AssessmentProduct: An Activity Completed
17,723.78150.00226.00
21,782.9173.00
132.20
16,812.9555.00
198.00
17,846.7255.00
198.00
7,072.0454.00
106.59
Costs:Products: Hours:
Activity 367340 - CY Wash Rack - Removal of Solids from Oil/Water SeparatorProduct: An Activity Completed
17,723.78150.00226.00
23,105.4648.00
289.00
15,791.9837.00
202.00
16,843.5037.00
202.00
17,364.3137.00
216.68
Costs:Products: Hours:
455

Program 367 - Wastewater Collection Systems
Program Performance BudgetCity of Sunnyvale
Service Delivery Plan 36703 - Scheduled Maintenance
Budget2015/2016
Actual2014/2015
Actual2015/2016
Current2016/2017 2017/2018
Plan
Activity 367350 - Field Inspections of Proposed Work Sites/Locations and Plan ChecksProduct: An Activity Completed
17,723.78100.00226.00
45,534.3371.00
569.20
94,759.9431.00
852.50
104,719.7931.00
852.50
16,513.9631.00
211.18
Costs:Products: Hours:
Activity 367360, 367361, 367362 - Manhole InspectionProduct: An Activity Completed
34,720.725,000.00
442.00
126,710.977,703.001,395.90
93,027.258,000.001,165.00
99,198.198,000.001,165.00
98,433.708,072.001,272.16
Costs:Products: Hours:
6,327.00
450,184.41 556,824.25
5,068.70
679,849.98 704,711.69
Totals for Service Delivery Plan 36703 - Scheduled Maintenance
384,829.21
4,517.66Hours:
Costs:
8,437.50 8,437.50
456

Program 367 - Wastewater Collection Systems
Program Performance BudgetCity of Sunnyvale
Service Delivery Plan 36704 - Repair and Construction
Budget2015/2016
Actual2014/2015
Actual2015/2016
Current2016/2017 2017/2018
Plan
Activity 367400, 367401, 367402, 367403 - Main Repair and ConstructionProduct: An Activity Completed
322,705.2235.00
2,440.00
184,543.79114.00
1,534.50
535,808.1060.00
2,440.00
349,633.2060.00
2,440.00
209,476.9957.00
1,543.78
Costs:Products: Hours:
Activity 367410, 367411, 367412 - Lateral Repair and ConstructionProduct: An Activity Completed
115,470.6445.00
1,340.00
73,157.9463.00
831.90
118,413.7345.00
1,160.00
124,624.7645.00
1,160.00
97,378.7943.00
863.72
Costs:Products: Hours:
Activity 367420, 367421, 367422 - Cleanout Repair and ConstructionProduct: An Activity Completed
44,915.56100.00442.00
21,480.5315.00
269.50
5,320.4810.0060.00
5,637.2810.0060.00
12,278.917.00
156.63
Costs:Products: Hours:
Activity 367430, 367431, 367432, 367433, 367434, 367435 - Manhole Repair and ConstructionProduct: An Activity Completed
44,915.56100.00442.00
105,871.8775.00
535.10
91,437.98100.00442.00
94,062.95100.00442.00
96,911.5067.00
581.88
Costs:Products: Hours:
Activity 367440, 367441, 367442 - Pump/Lift Stations Repair and ConstructionProduct: An Activity Completed
99,808.735.00
1,102.00
31,902.693.00
121.00
78,332.925.00
716.00
83,438.695.00
716.00
6,110.010.002.00
Costs:Products: Hours:
457

Program 367 - Wastewater Collection Systems
Program Performance BudgetCity of Sunnyvale
Service Delivery Plan 36704 - Repair and Construction
Budget2015/2016
Actual2014/2015
Actual2015/2016
Current2016/2017 2017/2018
Plan
Activity 367450 - Repair/Construction of Storm Drain Inlet or OutfallProduct: An Activity Completed
81,718.923.00
442.00
27,933.5425.00
214.50
86,021.788.00
442.00
88,620.208.00
442.00
2,626.810.008.01
Costs:Products: Hours:
Activity 367460 - Collection System Work Requiring Street/Asphalt/Concrete WorkProduct: An Activity Completed
34,720.725.00
442.00
147,327.89575.00
1,517.10
49,575.78880.00442.00
51,999.68880.00442.00
101,904.13881.00
1,195.89
Costs:Products: Hours:
6,650.00
744,255.35 592,218.25
5,023.60
964,910.77 798,016.76
Totals for Service Delivery Plan 36704 - Repair and Construction
526,687.14
4,351.91Hours:
Costs:
5,702.00 5,702.00
458
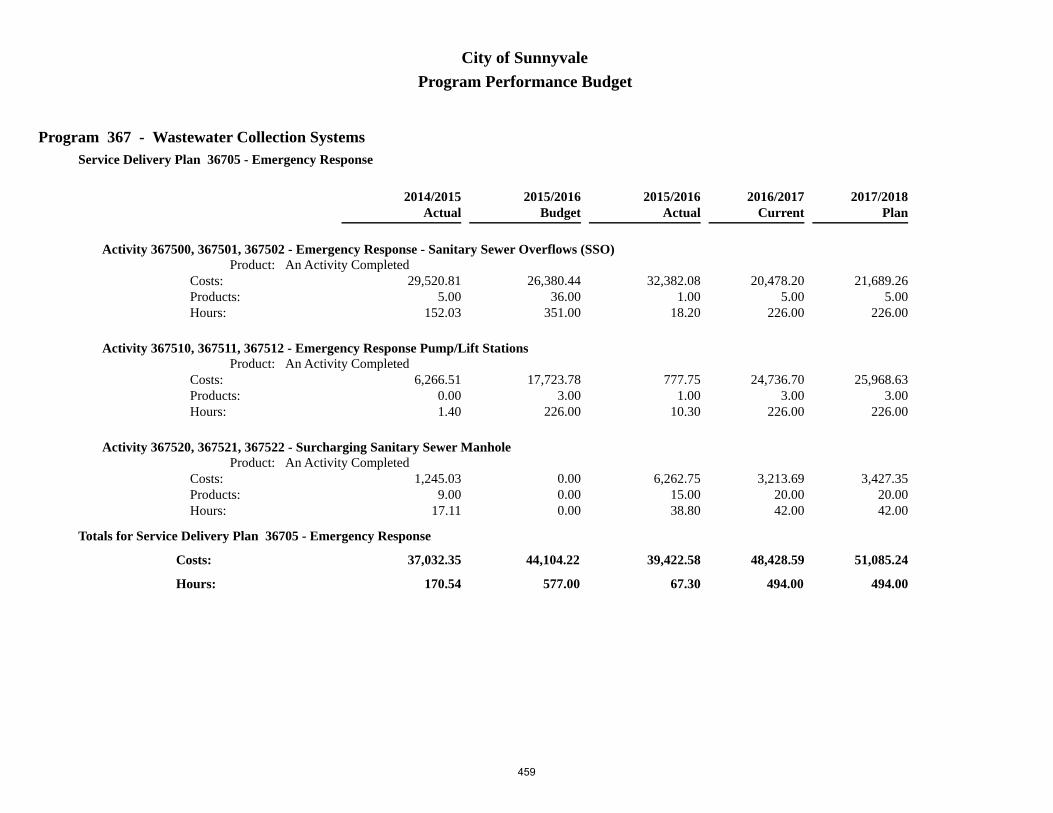
Program 367 - Wastewater Collection Systems
Program Performance BudgetCity of Sunnyvale
Service Delivery Plan 36705 - Emergency Response
Budget2015/2016
Actual2014/2015
Actual2015/2016
Current2016/2017 2017/2018
Plan
Activity 367500, 367501, 367502 - Emergency Response - Sanitary Sewer Overflows (SSO)Product: An Activity Completed
26,380.4436.00
351.00
32,382.081.00
18.20
20,478.205.00
226.00
21,689.265.00
226.00
29,520.815.00
152.03
Costs:Products: Hours:
Activity 367510, 367511, 367512 - Emergency Response Pump/Lift StationsProduct: An Activity Completed
17,723.783.00
226.00
777.751.00
10.30
24,736.703.00
226.00
25,968.633.00
226.00
6,266.510.001.40
Costs:Products: Hours:
Activity 367520, 367521, 367522 - Surcharging Sanitary Sewer ManholeProduct: An Activity Completed
0.000.000.00
6,262.7515.0038.80
3,213.6920.0042.00
3,427.3520.0042.00
1,245.039.00
17.11
Costs:Products: Hours:
577.00
44,104.22 39,422.58
67.30
48,428.59 51,085.24
Totals for Service Delivery Plan 36705 - Emergency Response
37,032.35
170.54Hours:
Costs:
494.00 494.00
459

Program 367 - Wastewater Collection Systems
Program Performance BudgetCity of Sunnyvale
Service Delivery Plan 36706 - Management and Administration
Budget2015/2016
Actual2014/2015
Actual2015/2016
Current2016/2017 2017/2018
Plan
Activity 367600, 367601, 367602 - Admininstration
634,556.900.00
5,660.00
567,647.070.00
5,407.30
912,288.490.00
7,682.50
839,270.810.00
7,682.50
611,870.490.00
5,890.40
Costs:Products: Hours:
Activity 367610, 367611, 367612 - Staff Training and Development
49,248.360.00
442.00
49,262.620.00
609.00
38,693.780.00
442.00
41,060.200.00
442.00
79,481.370.00
987.62
Costs:Products: Hours:
Activity 367620 - Testing/Certification
14,437.360.00
176.00
10,513.600.00
93.50
24,735.140.00
176.00
25,737.410.00
176.00
16,300.440.00
74.56
Costs:Products: Hours:
Activity 367630 - CFD Estates at Sunnyvale
18,793.110.00
93.00
9,980.760.00
64.50
24,110.640.00
169.00
23,055.270.00
169.00
10,020.050.00
88.37
Costs:Products: Hours:
Activity 367640 - Development Plan Review and Inspection
26,042.880.00
250.00
12,160.710.00
148.50
47,262.660.00
400.00
46,867.240.00
400.00
288.870.004.50
Costs:Products: Hours:
460

Program 367 - Wastewater Collection Systems
Program Performance BudgetCity of Sunnyvale
6,621.00
743,078.61 649,564.76
6,322.80
1,047,090.71 975,990.93
Totals for Service Delivery Plan 36706 - Management and Administration
717,961.22
7,045.45Hours:
Costs:
8,869.50 8,869.50
2,616,739.87
27,803.00
2,895,675.59
28,137.90
2,663,027.65
27,428.80
Costs:
Hours: 33,287.00 32,726.00
3,551,153.03 3,335,437.35
Totals for Program 367
461

This Page Intentionally Blank
462

Program 369 - Wholesale Water Purchases
Program Performance BudgetCity of Sunnyvale
Service Delivery Plan 36901 - Water Purchased for Resale
Budget2015/2016
Actual2014/2015
Actual2015/2016
Current2016/2017 2017/2018
Plan
Activity 369100 - San Francisco Public Utility CommissionProduct: An Acre Foot
0.000.000.00
0.000.000.00
16,480,847.0010,003.00
0.00
19,665,486.0010,000.00
0.00
0.000.000.00
Costs:Products: Hours:
Activity 369110 - Santa Clara Valley Water DistrictProduct: An Acre Foot
0.000.000.00
0.000.000.00
8,790,000.008,213.00
0.00
10,121,760.007,920.00
0.00
0.000.000.00
Costs:Products: Hours:
Activity 369120 - WellsProduct: An Acre Foot
0.000.000.00
0.000.000.00
126,067.00110.00
0.00
176,820.00110.00
0.00
0.000.000.00
Costs:Products: Hours:
0.00
0.00 0.00
0.00
25,396,914.00 29,964,066.00
Totals for Service Delivery Plan 36901 - Water Purchased for Resale
0.00
0.00Hours:
Costs:
0.00 0.00
0.00
0.00
0.00
0.00
0.00
0.00
Costs:
Hours: 0.00 0.00
25,396,914.00 29,964,066.00
Totals for Program 369
463

This Page Intentionally Blank
464

Finance
Finance DepartmentDepartment Description
The Department of Finance is responsible for the overall financial management of the City. The Department’s core function is to maintain a strong, secure financial position for the City by providing a wide variety of financial and analytical services to Council, staff, and the public.
Programs and ServicesThe Department of Finance is organized into six programs: Accounting and Financial Services; Financial
Management and Analysis; Budget Management; Purchasing; Revenue Collection and Audit Services; and Utility Billing.
Accounting and Financial Services
The Accounting and Financial Services Program provides accounting and financial reporting services to City management and staff, City Council, Sunnyvale residents and businesses, and regulatory agencies to enable them to make informed decisions about the financial affairs of the City. The Program also provides payroll and accounts payable services to support City operations and ensures the City’s money is well-managed through the provision of cash management, investment, and treasury services.
In order to accurately record the City’s financial transactions, Program staff maintains the City’s financial software, including daily account balancing and structural and security set-up. Other activities include providing financial system reports on a regular basis to City staff, along with query tools for use on an ad-hoc basis. Accounting for the City’s fiscal transactions is done in accordance with generally accepted accounting principles for governmental entities. Staff manages the independent financial audit of the City as required by City Charter, and produces the Comprehensive Annual Financial Report (CAFR) and other required annual financial statements. In addition, staff in the Program prepares twelve other annual regulatory reports. Routine monthly activities include reconciling all bank and general ledger accounts, as well as monitoring and requesting reimbursement for approximately 300 grants and capital projects on a timely basis to ensure that the City maintains optimum cash flow.
The Accounting and Financial Services Program also includes activities associated with managing and preparing the payroll and payment for all goods and services required to support the City’s operations. Staff processes payments to about 1,100 employees on a bi-weekly basis. This function includes issuing approximately 28,000 checks or direct deposits annually, completing all regulatory reports to state and federal agencies and the California Public Employees Retirement System, and managing and maintaining the City’s computerized payroll system. The Accounts Payable function includes paying supplier invoices on time, accurately, and in compliance with contract terms and conditions and City policies. Staff also is responsible for all regulatory reports related to vendor payments.
Program staff also provides cash management, investment, and treasury services so that the City’s money is managed safely and prudently. Program staff invests the City’s pooled cash portfolio of approximately $375 million in accordance with the City’s Investment Policy, which is reviewed and approved by Council annually. Activities include ensuring that debt service payments are made for all outstanding bond issues and continuing disclosure reports are filed as required by bond covenants. Program functions also include maintaining the City’s banking relationships. The Program is also responsible for properly accounting for approximately 12,400 revenue transactions handled by City staff.
City of Sunnyvale FY 2017/18 Adopted Budget and Resource Allocation Plan
465

Financial Management and Analysis
The Financial Management and Analysis Program provides financial expertise to City departments, helping them maintain a strong, secure financial position for the City through the fiscal stewardship of City resources. Activities include maintaining and enhancing Citywide internal control, and providing fiscal impact analysis of internal and external actions affecting the City. The Director of Finance serves as Chief Financial Officer of the City and Treasurer of the Sunnyvale Redevelopment Successor Agency. The Program also provides overall supervision to department staff and ensures administrative support needs are met.
Also, included in the Program is administration and monitoring of the financial aspects of the Sunnyvale Redevelopment Successor Agency. Program staff oversees administration of the former Redevelopment Agency’s dissolution in compliance with state legislation. Finance functions for the Successor Agency include preparing all required reports, monitoring and enforcing existing development agreements, paying off existing debt obligations, and disposing of the former Agency’s properties and assets.
Budget Management
Budget Management Program staff develops, delivers, and continually monitors the operating and capital budgets, and 20-year long-term financial plans, for nearly 50 City funds and sub-funds. Budgetary analysis is also provided through the Program. Activities include development of revenue projections, preparation of the annual fee schedule, review and analysis of operating programs and projects, identifying the budgetary impacts of various City issues, and monitoring revenues and expenditures on a continual basis.
Purchasing
The Purchasing Program provides centralized purchasing for all goods and services to support City operations, including public works construction contracting, in accordance with the City Charter and the Sunnyvale Municipal Code. Centralized procurement assures fair and open acquisition processes that seek to obtain maximum value for each dollar spent. Major activities include soliciting formal competitive bids and proposals, obtaining informal quotes, and participating in cooperative procurements with other governmental agencies where appropriate. In addition,
staff provides assistance and training to City employees to ensure that they understand and comply with all legal and ethical requirements.
Purchasing Program staff also maintains a centralized warehouse and a print shop. Through the centralized warehouse, employees may obtain commonly used supplies conveniently and at a reduced cost due to volume discounts. Central Stores staff disposes of surplus and obsolete equipment, and provides centralized receiving for the City’s Corporation Yard. Print Services are available to department users through the print shop.
Revenue Collection and Audit Services
The Revenue Collection and Audit Services staff facilitates the accurate and timely collection of funds due to the City through direct billing and audit services. Program staff also performs fiduciary/operational audits of city services to ensure good fiscal controls are in place.
Fiduciary audits are performed, based on a risk matrix, on City financial transactions to ensure security, cost effectiveness, and compliance with policies, regulations, and laws. The Program also is responsible for completing specific operational audits as directed by the City Manager and the Director of Finance.
Program staff also reviews and processes revenues for all departments and administers the local Business License Tax, Utility Users Tax and Transient Occupancy Tax ordinances. Staff bills and receives payments centrally for all accounts receivable owed to the City. In addition, staff manages collections of delinquent accounts receivable.
Program staff reviews and audits all disbursements made through accounts payable, payroll, and purchasing cards to ensure compliance with City policies.
City of Sunnyvale FY 2017/18 Adopted Budget and Resource Allocation Plan
466

Utility Billing
The Utility Billing Program provides utility billing and customer services to customers of the City’s water, wastewater, and solid waste utilities. Program staff also provides financial management support to enable the provision of high-quality utility services at the lowest possible rates. All costs of the Program are reimbursed by the three utilities through a payment to the General Fund. Program staff also provides central cashiering services.
Activities in the Program include reading of water meters, operating the utility customer service center, issuing utility bills and collecting revenues, and maintaining the automated utility billing system. Residential meters are read every other month, and commercial meters are read once a month, with customers billed accordingly. The utility customer service center works with customers to start and stop utility services as needed, processes one-time orders for service, helps with emergencies such as sewer backups and water pipe breaks, and handles service complaints. Payments from customers are processed daily and delinquent bills are ultimately collected through the interruption of service. Central cashiering provides direct services to the public and processes payments received at the counter primarily for payment of utility bills and business license tax.
Staff in the Program also provides financial management services to the utility operating programs. Activities in this area include developing and setting annual utility rates and taking them to Council for approval. Staff prepares and reviews operating and capital budgets and long-term financial plans for each utility, and provides financial and operational consulting services to utility program managers.
Department Budget Summary
Finance
Fund/Program Actual
2014/15Budget
2015/16Actual
2015/16Budget
2016/17Budget
2017/18
General Fund
Accounting and Financial Services 1,828,133 1,623,076 1,788,065 2,015,360 2,132,144
Budget Management 786,561 976,936 726,897 962,286 1,053,951
Financial Management and Analysis 769,799 1,000,081 809,744 910,380 939,262
Purchasing 1,334,720 1,328,828 1,389,462 1,511,931 1,789,496
Treasury Services 1,134,821 1,119,436 1,100,475 960,512 1,006,792
Utility Billing 2,234,966 2,344,450 2,346,213 2,575,560 2,735,748
RDA Successor Agency
Accounting and Financial Services 0 15,218 12,269 8,954 9,584
Financial Management and Analysis 92,660 32,489 129,835 19,763 19,955
General Services
Accounting and Financial Services 19,024 50,232 14,692 31,343 33,546
Purchasing 0 0 0 0 636,129
TOTAL EXPENDITURES 8,200,684 8,490,746 8,317,652 8,996,089 10,356,607
City of Sunnyvale FY 2017/18 Adopted Budget and Resource Allocation Plan
467

Budget Overview and Significant ChangesFY 2017/18 is the second year of a two-year operating cycle. As such, there are minimal changes to the
Department’s operating budget for FY 2017/18.
During FY 2016/17, the Department restructured some of the programs to re-align services and provide better utilization of staff. The Treasury Program was split moving the cash management, banking and investment functions into Accounting and Financial Services. The Revenue Collection and Audit Services Program was formed to centralize accounts receivable, revenue and tax collection, and fiduciary audits. The central cashiering function was combined into the Utility Billing program as utility payments make up the majority of the cashier’s workload. These moves allowed the Department to provide greater management oversight of key functions and, through closer grouping of staff with similar job duties, allowed the opportunity for employee cross-training and the creation of redundancies within the Department.
In virtually every program, demand for the Department of Finance’s core services is increasing. In response, the Department is focusing on leveraging resources and using streamlined work processes to handle the increase in workload. This leveraging involves cross training as needed for maximum flexibility, identifying ways that technology can be used to make processes more efficient, and focusing on best practices.
Staff is in the scoping process for replacing the citywide financial system, which is the underlying system for all of the City’s financial transactions. A project is underway to identify potential system solutions and eventually procure a new financial system. This project will impact every division within the Department and take three to five years to implement.
The Department also maximizes all revenue resources to which the City is entitled. The maximization is accomplished through audits, improving processes, educating staff citywide, and focusing on full cost recovery for user fees. Below are the highlights of the Department budget by program.
Accounting and Financial Services
The Accounting and Financial Services Program consists of four primary functions — payroll, accounts payable, cash management, and accounting and financial reporting. In the payroll and accounts payable areas the major emphasis is to improve processes through the thoughtful application of technology, enhanced analysis, and value- added services. A specific effort is being made to deploy additional modules of our automated payroll system, which most recently involved the implementation of electronic time cards and streamlined workflow. The results have been greater efficiency, less double entry, and fewer errors. Staff also is working on process improvements in the accounts payable unit to drive greater efficiencies and improve current processes. Additionally, the program maintains banking relationships, provides management of the City’s investment portfolio and oversight of cash management city-wide.
Financial Management and Analysis
In addition to providing Chief Financial Officer services and department management, the Financial Management and Analysis Program provides financial analysis to the City Council, other departments and the public. The Program also includes the financial and administrative functions associated with the dissolution of the Redevelopment Agency of the City of Sunnyvale.
Budget Management
The primary focus of the Budget Management Program is the development, delivery, and continual monitoring of the adopted budget and twenty-year long-term financial plan. The Program also includes the performance auditing function. The emphasis of the program will be to continue to provide core services, most notably the development and delivery of the recommended and adopted budgets, while integrating the performance audit function with the budget development process to ensure audit priorities are aligned with the budget. This budget recommends the addition of 1.0 Senior Internal Auditor and the deletion of 1.0 Finance Analyst II as the higher level position is more appropriate for the type of work related to the performance audit function across the City.
City of Sunnyvale FY 2017/18 Adopted Budget and Resource Allocation Plan
468
Purchasing
Over the past several years, the Purchasing Program has stepped up its emphasis on competitive bidding and will continue this trend in the foreseeable future, especially as the City addresses its aging infrastructure. Several complex, large procurements have begun, including those associated with reconstruction of the Water Pollution Control Plant (WPCP). These projects will require significant resources inside and outside of the Program.
In order to meet the City’s purchasing demands, the Purchasing Program will necessarily focus on implementing value-added activities such as electronic purchasing/payment automation and obtaining value pricing for commodities through increased use of consolidated master purchase agreements, as well as improving Central Stores inventory management. An additional area of focus is staff training due to the many new employees at all levels of the organization that are being hired to replace retiring City workers. Sunnyvale’s centralized purchasing system is complex, requiring regular training to help ensure all procurement policies and processes are being followed. Additionally, recent turnover within the Purchasing Division, in addition to a significant increase in workload, have presented challenges. The addition of 1.0 Senior Buyer limited-term (two years) is included in this document to help to mitigate the increase in workload primarily related to increased construction project activity and provide additional program support.
Revenue Collection and Audit Services
The focus of the Revenue Collection and Audit Services Program will be ensuring that all revenues owed to the City are collected, particularly in the accounts receivable and business licensing functions. Accounts receivable issues approximately 6,400 bills and generates approximately $3 million in revenue annually. Revenue Collection and Audit Services has improved its receivables collection efforts in several ways, including placing unpaid administrative citations on the County of Santa Clara property tax roll. Administrative citations are issued by the City’s Neighborhood Preservation Division and billed by Finance. The collection rate on this type of receivable has historically been low. Collecting this fine together with property taxes has caused many owners to pay, increasing the City’s collection rate.
Revenue Collection and Audit Services also administers the City’s business license tax ordinance, which licenses approximately 11,400 businesses. Staff continued a series of audits to ensure businesses operating in Sunnyvale have a current business license. Since the inception of the audit program in August 2009, almost $1.74 million has been collected through the end of Fiscal 2015/16.
The program will assume functions previously conducted under the Financial Services Management Program and will focus on a number of revenue producing functions, including tracking development mitigation fees and sales tax audits. In the same vein, the fiduciary audits performed or managed by the Program have identified operational savings or eliminated future liabilities.
City of Sunnyvale FY 2017/18 Adopted Budget and Resource Allocation Plan
469

Utility Billing Program
Over the past several years, the Utility Billing Program has experienced an increase in call volume, primarily related to the implementation of the ChoiceCollect garbage and recyclables collection system. Following the implementation of ChoiceCollect, the Program again expanded its scope and now takes almost all utility-related customer service calls, including garbage complaints, water and sewer emergency calls, water quality calls, and other service-related calls. Most recently, the Program took over the administration of water backflow prevention device certifications from the Environmental Services Department. This, combined with a general increase in activity, has resulted in a permanent adjustment to the base call volume work load handled by the Program.
In order to address these and other pressures on the Program’s work load, staff has been focused on implementing technology and streamlining work processes. Customer use of web based bill presentment and payment continues to grow. Currently, approximately 63% of the City’s customers have enrolled in on-line billing or set up automatic ACH payments. Many of those customers opted not to receive paper statements, reducing our printing and postage costs. Paper checks are processed electronically using specialized remittance processing equipment. Additionally, the Program continues to work with the Department of Environmental Services to deploy automated meter reading technology. To date, approximately 52% of all water meters are now retrofitted with radio read technology, including most of the City’s commercial meters. The Program has also initiated a pilot for cellular based smart meters, which will allow residents to monitor their water use in real time, as well as enable the City to read the meters for billing remotely.
Within the past year, the program has also assumed responsibility for the cashiering function. This has allowed for some cross-training of Utility Billing staff in the cashiering function creating much needed staffing support of this function. Customers making utility bill payments are the primary customers for the cashiering function and the creation of closer ties between the Utility Billing Customer Service and cashiering functions will continue to be a focus in future years.
City of Sunnyvale FY 2017/18 Adopted Budget and Resource Allocation Plan
470

Department Position Allocation
ClassificationFY 2016/17
Budgeted PositionsFY 2017/18
Budgeted Positions Change
Director of Finance 1 1 —
Assistant Director of Finance 1 1 —
Administrative Services Manager 1 1 —
Utility Billing Manager 1 1 —
Senior Management Analyst 1 1 —
Purchasing Officer 1 1 —
Finance Manager 2 2 —
Senior Internal Auditor 0 1 1
Budget Analyst I 3 3 —
Accountant 4 4 —
Senior Accountant 1 1 —
Principal Accountant 1 1 —
Payroll Supervisor 1 1 —
Administrative Aide-Confidential 1 1 —
Senior Buyer 1 1 —
Senior Buyer – Term Limited 0 1 1
Principal Buyer 1 1 —
Technical Support Specialist 1 1 —
Information Technology Coordinator 1 1 —
IT Coordinator: Confidential 1 1 —
Meter Reader 2 2 —
Principal Office Assistant 1 1 —
Senior Office Assistant 1 1 —
Storekeeper II 1 1 —
Staff Office Assistant 2 2 —
Customer Service Representative 4 4 —
Storekeeper I 1 1 —
Storekeeper/Buyer 1 1 —
Buyer II 1 1 —
Accounting Technician 5 5 —
Finance Analyst II 1 0 (1)
Senior Accounting Technician 6 6 —
Payroll Technician III 1 1 —
Press Operator 1 1 —
Part-Time Meter Reader 1 1 —
Part-Time Mail Clerk 1 1 —
Finance Department Total 54 55 1
City of Sunnyvale FY 2017/18 Adopted Budget and Resource Allocation Plan
471

This Page Intentionally Blank
472

Finance Department Performance Indicators2011 Consolidated General Plan Goals:
This department provides administrative and/or internal services within the City. As such, its indicators are not tied to General Plan goals and instead are developed to optimize the level of internal/administrative support service provided.
FY 2013/14 Results
FY 2014/15 Results
FY 2015/16 Results
FINANCIAL MANAGEMENT AND ANALYSIS
WORKLOAD INDICATORS
Number of legislative bills tracked. 23 19 17
PERFORMANCE INDICATORS
Percent of total Department operating budget expended. 97.0% 98.0% 98.0%
ACCOUNTING AND FINANCIAL SERVICES
WORKLOAD INDICATORS
Number of regulatory reports submitted to appropriate agencies. 10 10 10
Number of bank and general ledger account reconciliations. 853 868 886
Number of grant reimbursement requests. 90 80 97
Number of adjustments made to previous payrolls. [New in FY 2016/17] N/A N/A N/A
Average portfolio balance. $275,758,130 $300,301,602 $327,228,891
PERFORMANCE INDICATORS
Number of paychecks issued and percent prepared accurately. [Deleted in FY 2016/17] 27,744 99.95%
27,616 99.44%
28,520 99.9%
Number of paychecks issued, number of adjustments made to previous payrolls affecting pay and percent of paychecks prepared accurately. [New in FY 2016/17]
N/A N/A N/A
Number of accounting period reports and percent issued within 10 business days of period close or pre-established deadlines.
14 100%
14 100%
14 100%
The City’s annual financial report is certified by independent auditors and receives an unqualified opinion.
Achieved Achieved Achieved
Number of supplier payments and percent made within 30 days of invoice date. 26,362 79.19%
27,716 84.62%
30,076 83.68%
REVENUE COLLECTION AND AUDIT SERVICES
WORKLOAD INDICATORS
Number of purchasing card statements audited. 1,341 1,439 1,333
Number of business licenses issued. 7,256 7,177 7,453
Revenue generated from Business License Tax audits. $259,000 $291,295 $127,143
City of Sunnyvale FY 2017/18 Adopted Budget and Resource Allocation Plan
473

FY 2013/14 Results
FY 2014/15 Results
FY 2015/16 Results
Number of fiduciary/compliance audits completed. 4 4 6
Revenue generated from audits of major revenue sources. $2,939,898 $1,905,365 $1,320,326
PERFORMANCE INDICATORS
Number of billing requests received and percent billed within 14 days. [Deleted in FY 2016/17]
6,348 99%
6,196 98%
6,327 99%
Number of biling requests received and percent billed within 10 business days. [New in FY 2016/17]
N/A N/A N/A
Number of accounts payable checks processed and percent disbursed within two days. 10,512 100%
11,283 100%
11,732 100%
BUDGET MANAGEMENT
WORKLOAD INDICATORS
Dollar amount of revenues budgeted and monitored. $272,587,482 $321,076,516 $355,826,448
Dollar amount of citywide budget. $285,141,599 $314,799,151 $349,420,766
Number of funds budgeted and monitored. 48 49 48
PERFORMANCE INDICATORS
Percentage variance between actuals and revised projections for the top six General Fund revenue sources.
103% 103% 102%
PURCHASING SERVICES
WORKLOAD INDICATORS
Number of Warehouse items issued. 101,852 101,281 105,090
Number of surplus items sold. 1,801 2,071 1,829
Dollar amount generated from sales of surplus property. $104,451 $201,140 $43,339
PERFORMANCE INDICATORS
Number of formal contracts and median number of days to issue, with a goal of 55 days. 120 56
145 49
159 34
Number of informal contracts and median number of days to issue, with a goal of 5 days. 1,373 2
1,438 3
1,522 4
Number of public works construction contracts and median number of days to issue, with a goal of 70 days.
14 95
23 90
18 95
Annual physical inventory accuracy rate is at least 99.5% [New in FY 2016/17] N/A N/A 99.20%
UTILITY BILLING, COLLECTION AND REVENUE MANAGEMENT
WORKLOAD INDICATORS
Number of utility accounts. 30,153 30,078 29,999
City of Sunnyvale FY 2017/18 Adopted Budget and Resource Allocation Plan
474

FY 2013/14 Results
FY 2014/15 Results
FY 2015/16 Results
Number of requests for extra trash and bulky item pickups. 5,492 5,970 5,953
Number of water service interruption notices issued. 3,649 3,359 3,930
PERFORMANCE INDICATORS
Number of water meters read and percent read correctly the first time. 199,637 99.99%
207,173 99.98%
189,045 99.98%
Total dollar amount invoiced and percent collected. $101,915,448 99.39%
$130,167,509 99.51%
$107,309,210 99.48%
Number of customer calls and average customer wait time, with a goal of one minute. 40,076 72.99 Seconds
41,404 68.17 seconds
37,99785.92 seconds
Number of utility bills issued and percent billed within five business days of the established billing schedule.
189,151 98.42%
191,729 95.96%
190,287 89%
Number of residents responding to the survey and percent rating utility billing services as satisfactory or better.
82 96.6%
106 95.8%
61 95.25%
Percent of time that central cashier balances within $5.00 during daily reconciliations. 95% 97% 97%
City of Sunnyvale FY 2017/18 Adopted Budget and Resource Allocation Plan
475

This Page Intentionally Blank
476

Program 703 - Budget Management
Program Performance BudgetCity of Sunnyvale
Service Delivery Plan 70301 - Budget Management Services
Budget2015/2016
Actual2014/2015
Actual2015/2016
Current2016/2017 2017/2018
Plan
Activity 703100, 703101 - City Budget Development and Publication
381,217.890.00
3,820.00
458,660.400.00
4,318.86
356,660.360.00
3,130.00
364,099.670.00
3,130.00
457,059.770.00
4,303.50
Costs:Products: Hours:
Activity 703110 - Budget Analysis, Modification, and Communication
373,378.460.00
3,520.00
247,283.600.00
2,229.94
341,736.910.00
3,000.00
348,343.080.00
3,000.00
293,347.520.00
2,886.00
Costs:Products: Hours:
7,340.00
754,596.35 705,944.00
6,548.80
698,397.27 712,442.75
Totals for Service Delivery Plan 70301 - Budget Management Services
750,407.29
7,189.50Hours:
Costs:
6,130.00 6,130.00
477

Program 703 - Budget Management
Program Performance BudgetCity of Sunnyvale
Service Delivery Plan 70302 - Performance Auditing
Budget2015/2016
Actual2014/2015
Actual2015/2016
Current2016/2017 2017/2018
Plan
Activity 703200 - Performance AuditingProduct: An Audit Conducted
172,451.5110.00
1,685.00
0.000.000.00
169,651.100.00
1,860.00
244,491.680.00
1,860.00
0.000.000.00
Costs:Products: Hours:
1,685.00
172,451.51 0.00
0.00
169,651.10 244,491.68
Totals for Service Delivery Plan 70302 - Performance Auditing
0.00
0.00Hours:
Costs:
1,860.00 1,860.00
478

Program 703 - Budget Management
Program Performance BudgetCity of Sunnyvale
Service Delivery Plan 70303 - Management and Administrative Support Services
Budget2015/2016
Actual2014/2015
Actual2015/2016
Current2016/2017 2017/2018
Plan
Activity 703300 - Management and Administrative Support Services
49,887.640.00
430.00
20,952.590.00
143.02
94,238.000.00
590.00
97,016.850.00
590.00
36,153.980.00
263.50
Costs:Products: Hours:
430.00
49,887.64 20,952.59
143.02
94,238.00 97,016.85
Totals for Service Delivery Plan 70303 - Management and Administrative Support Services
36,153.98
263.50Hours:
Costs:
590.00 590.00
976,935.50
9,455.00
726,896.59
6,691.82
786,561.27
7,453.00
Costs:
Hours: 8,580.00 8,580.00
962,286.37 1,053,951.28
Totals for Program 703
479

This Page Intentionally Blank
480

Program 704 - Purchasing
Program Performance BudgetCity of Sunnyvale
Service Delivery Plan 70401 - Centralized Purchasing
Budget2015/2016
Actual2014/2015
Actual2015/2016
Current2016/2017 2017/2018
Plan
Activity 704100 - Purchase Goods or Services Valued at More than $50,000Product: A Contract Issued
362,665.81115.00
3,530.00
434,242.10159.00
4,299.85
421,200.15145.00
4,160.00
521,490.37145.00
4,876.00
385,655.77145.00
3,660.92
Costs:Products: Hours:
Activity 704110, 704111, 706222 - Purchase Goods or Services Valued at $50,000 or LessProduct: A Contract Issued
333,503.991,400.003,340.00
326,509.641,522.003,483.57
404,051.061,450.004,130.00
472,237.091,450.004,488.00
301,520.721,438.003,016.13
Costs:Products: Hours:
Activity 704120 - Bid and Issue Contracts for Public Works ProjectsProduct: A Contract Issued
150,985.5220.00
1,550.00
138,702.1718.00
1,291.25
195,105.4420.00
1,925.00
274,831.7720.00
2,641.00
136,574.5223.00
1,415.30
Costs:Products: Hours:
Activity 704130 - Administer Purchasing Card ProgramProduct: A Purchasing Card Transaction
9,767.805,900.00
95.00
12,571.396,883.00
115.04
9,991.897,100.00
95.00
10,650.227,100.00
95.00
9,218.606,415.00
87.01
Costs:Products: Hours:
Activity 704140 - Conduct Purchasing Training for City Employees [Deleted]Product: A Participant
9,084.03150.00
75.00
2,882.3335.0023.53
0.000.000.00
0.000.000.00
4,713.6769.0040.01
Costs:Products: Hours:
481

Program 704 - Purchasing
Program Performance BudgetCity of Sunnyvale
8,590.00
866,007.15 914,907.63
9,213.24
1,030,348.54 1,279,209.45
Totals for Service Delivery Plan 70401 - Centralized Purchasing
837,683.28
8,219.37Hours:
Costs:
10,310.00 12,100.00
482
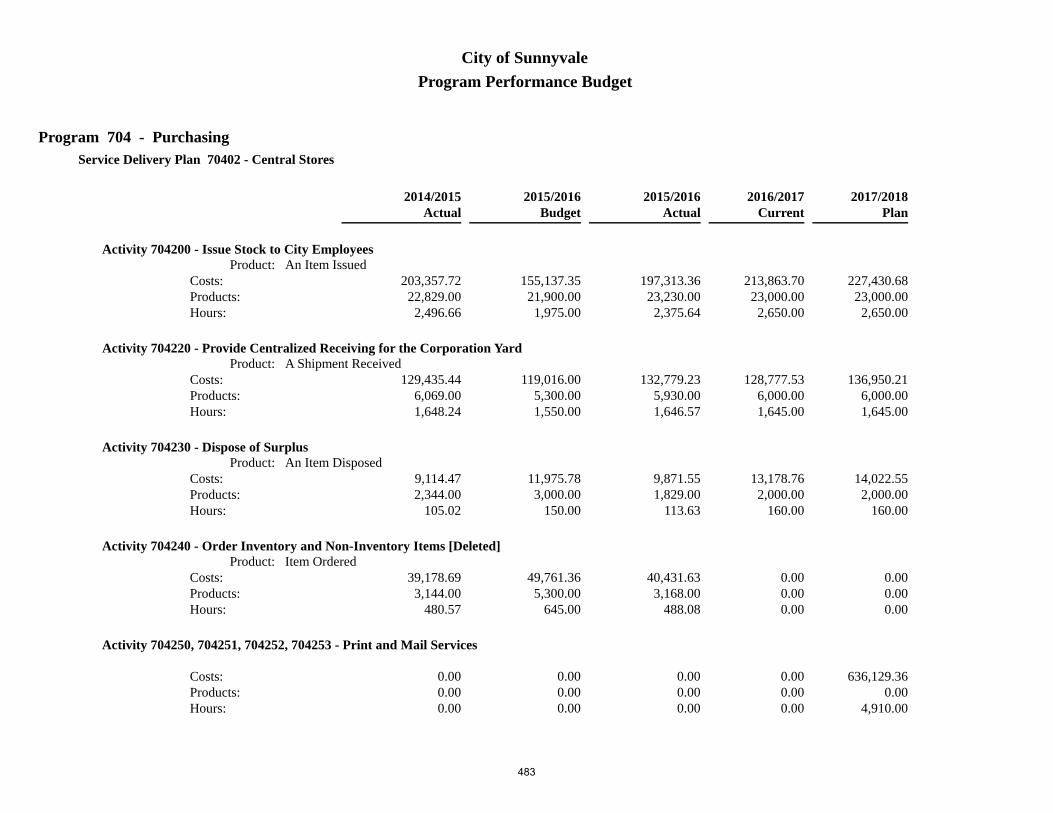
Program 704 - Purchasing
Program Performance BudgetCity of Sunnyvale
Service Delivery Plan 70402 - Central Stores
Budget2015/2016
Actual2014/2015
Actual2015/2016
Current2016/2017 2017/2018
Plan
Activity 704200 - Issue Stock to City EmployeesProduct: An Item Issued
155,137.3521,900.00
1,975.00
197,313.3623,230.00
2,375.64
213,863.7023,000.00
2,650.00
227,430.6823,000.00
2,650.00
203,357.7222,829.00
2,496.66
Costs:Products: Hours:
Activity 704220 - Provide Centralized Receiving for the Corporation YardProduct: A Shipment Received
119,016.005,300.001,550.00
132,779.235,930.001,646.57
128,777.536,000.001,645.00
136,950.216,000.001,645.00
129,435.446,069.001,648.24
Costs:Products: Hours:
Activity 704230 - Dispose of SurplusProduct: An Item Disposed
11,975.783,000.00
150.00
9,871.551,829.00
113.63
13,178.762,000.00
160.00
14,022.552,000.00
160.00
9,114.472,344.00
105.02
Costs:Products: Hours:
Activity 704240 - Order Inventory and Non-Inventory Items [Deleted]Product: Item Ordered
49,761.365,300.00
645.00
40,431.633,168.00
488.08
0.000.000.00
0.000.000.00
39,178.693,144.00
480.57
Costs:Products: Hours:
Activity 704250, 704251, 704252, 704253 - Print and Mail Services
0.000.000.00
0.000.000.00
0.000.000.00
636,129.360.00
4,910.00
0.000.000.00
Costs:Products: Hours:
483

Program 704 - Purchasing
Program Performance BudgetCity of Sunnyvale
4,320.00
335,890.49 380,395.77
4,623.92
355,819.99 1,014,532.80
Totals for Service Delivery Plan 70402 - Central Stores
381,086.32
4,730.49Hours:
Costs:
4,455.00 9,365.00
484

Program 704 - Purchasing
Program Performance BudgetCity of Sunnyvale
Service Delivery Plan 70403 - Management and Supervisory Services
Budget2015/2016
Actual2014/2015
Actual2015/2016
Current2016/2017 2017/2018
Plan
Activity 704300 - Management and Supervisory Services
38,136.820.00
305.00
29,902.980.00
214.25
40,042.560.00
290.00
40,515.090.00
290.00
30,814.570.00
234.53
Costs:Products: Hours:
Activity 704310 - Support Automated Purchasing Systems
88,793.830.00
875.00
64,256.050.00
631.75
85,719.840.00
815.00
91,367.710.00
815.00
85,135.430.00
804.21
Costs:Products: Hours:
1,180.00
126,930.65 94,159.03
846.00
125,762.40 131,882.80
Totals for Service Delivery Plan 70403 - Management and Supervisory Services
115,950.00
1,038.74Hours:
Costs:
1,105.00 1,105.00
1,328,828.29
14,090.00
1,389,462.43
14,683.16
1,334,719.60
13,988.60
Costs:
Hours: 15,870.00 22,570.00
1,511,930.93 2,425,625.05
Totals for Program 704
485

This Page Intentionally Blank
486

Program 705 - Financial Management and Analysis
Program Performance BudgetCity of Sunnyvale
Service Delivery Plan 70501 - Financial Management and Analysis
Budget2015/2016
Actual2014/2015
Actual2015/2016
Current2016/2017 2017/2018
Plan
Activity 705100 - Perform Fiduciary Services and Compliance Audits [Deleted]Product: An Audit Performed
287,891.458.00
1,700.00
161,353.286.00
399.54
0.000.000.00
0.000.000.00
55,534.134.00
247.00
Costs:Products: Hours:
Activity 705110 - Conduct Financial Analysis
89,871.440.00
930.00
54,878.390.00
481.35
199,633.270.00
1,765.00
204,339.490.00
1,765.00
137,873.920.00
1,348.60
Costs:Products: Hours:
2,630.00
377,762.89 216,231.67
880.89
199,633.27 204,339.49
Totals for Service Delivery Plan 70501 - Financial Management and Analysis
193,408.05
1,595.60Hours:
Costs:
1,765.00 1,765.00
487

Program 705 - Financial Management and Analysis
Program Performance BudgetCity of Sunnyvale
Service Delivery Plan 70502 - Management and Administrative Support Services
Budget2015/2016
Actual2014/2015
Actual2015/2016
Current2016/2017 2017/2018
Plan
Activity 705200 - Finance Department Management
433,154.150.00
2,315.00
389,993.200.00
2,039.22
489,059.340.00
2,450.00
500,112.940.00
2,450.00
394,892.870.00
1,993.00
Costs:Products: Hours:
Activity 705210 - Provide Central Administration Services
189,164.080.00
2,360.00
203,518.770.00
2,534.67
221,687.710.00
2,800.00
234,809.160.00
2,800.00
181,498.390.00
2,374.50
Costs:Products: Hours:
4,675.00
622,318.23 593,511.97
4,573.89
710,747.05 734,922.10
Totals for Service Delivery Plan 70502 - Management and Administrative Support Services
576,391.26
4,367.50Hours:
Costs:
5,250.00 5,250.00
488

Program 705 - Financial Management and Analysis
Program Performance BudgetCity of Sunnyvale
Service Delivery Plan 70503 - Redevelopment Agency Management Services
Budget2015/2016
Actual2014/2015
Actual2015/2016
Current2016/2017 2017/2018
Plan
Activity 705320 - Central Core Project ROPS Aministration
32,489.480.00
150.00
129,834.640.00
950.60
19,762.940.00
75.00
19,955.080.00
75.00
92,659.700.00
704.50
Costs:Products: Hours:
150.00
32,489.48 129,834.64
950.60
19,762.94 19,955.08
Totals for Service Delivery Plan 70503 - Redevelopment Agency Management Services
92,659.70
704.50Hours:
Costs:
75.00 75.00
1,032,570.60
7,455.00
939,578.28
6,405.38
862,459.01
6,667.60
Costs:
Hours: 7,090.00 7,090.00
930,143.26 959,216.67
Totals for Program 705
489

This Page Intentionally Blank
490

Program 706 - Accounting and Financial Services
Program Performance BudgetCity of Sunnyvale
Service Delivery Plan 70601 - Payroll
Budget2015/2016
Actual2014/2015
Actual2015/2016
Current2016/2017 2017/2018
Plan
Activity 706100 - Process Regular PayrollProduct: A Check Issued
289,025.7227,800.00
3,360.00
202,020.2428,520.00
2,264.54
312,175.7327,800.00
3,345.00
329,644.6727,800.00
3,345.00
347,308.3127,616.00
4,254.80
Costs:Products: Hours:
Activity 706110 - Payroll Adjustments, Regulatory Reports and Requests [Deleted]Product: An Adjustment/Report/Request
126,702.903,500.001,340.00
148,375.501,384.001,607.27
0.000.000.00
0.000.000.00
123,062.061,695.001,237.30
Costs:Products: Hours:
Activity 706120 - Maintain City's Payroll System
117,472.800.00
1,100.00
79,935.260.00
741.58
103,560.150.00
940.00
109,299.490.00
940.00
146,035.540.00
1,372.50
Costs:Products: Hours:
Activity 706130 - Management and Administrative Support Services - Payroll
0.000.000.00
0.000.000.00
38,270.330.00
365.00
40,344.220.00
365.00
0.000.000.00
Costs:Products: Hours:
5,800.00
533,201.42 430,331.00
4,613.39
454,006.21 479,288.38
Totals for Service Delivery Plan 70601 - Payroll
616,405.91
6,864.60Hours:
Costs:
4,650.00 4,650.00
491

Program 706 - Accounting and Financial Services
Program Performance BudgetCity of Sunnyvale
Service Delivery Plan 70602 - Accounting and Financial Reporting
Budget2015/2016
Actual2014/2015
Actual2015/2016
Current2016/2017 2017/2018
Plan
Activity 706200 - Accounting Periodic Processing and Reporting
98,536.940.00
1,140.00
143,563.840.00
1,723.38
148,052.290.00
1,780.00
158,331.760.00
1,780.00
161,081.050.00
1,977.10
Costs:Products: Hours:
Activity 706210 - Annual External Audit and Regulatory ReportingProduct: A Report Issued
220,452.6113.00
1,390.00
227,668.5810.00
1,440.55
264,547.1013.00
1,610.00
280,758.0413.00
1,610.00
253,656.4510.00
1,482.30
Costs:Products: Hours:
Activity 706220, 706221 - Provide Financial Information to City Departments
116,491.250.00
1,220.00
159,820.820.00
1,555.26
126,228.770.00
1,300.00
135,096.630.00
1,300.00
135,477.720.00
1,377.40
Costs:Products: Hours:
Activity 706230 - Account ReconciliationsProduct: An Account Reconciled
83,981.52875.00
1,025.00
122,716.73886.00
1,355.44
137,076.88875.00
1,520.00
146,664.17875.00
1,520.00
123,641.69868.00
1,379.70
Costs:Products: Hours:
Activity 706240 - Grants and Project AccountingProduct: A Grant/Project Monitored
95,004.16350.00
1,010.00
93,195.00394.00949.10
47,761.03350.00500.00
51,113.16350.00500.00
80,352.14349.00863.50
Costs:Products: Hours:
492
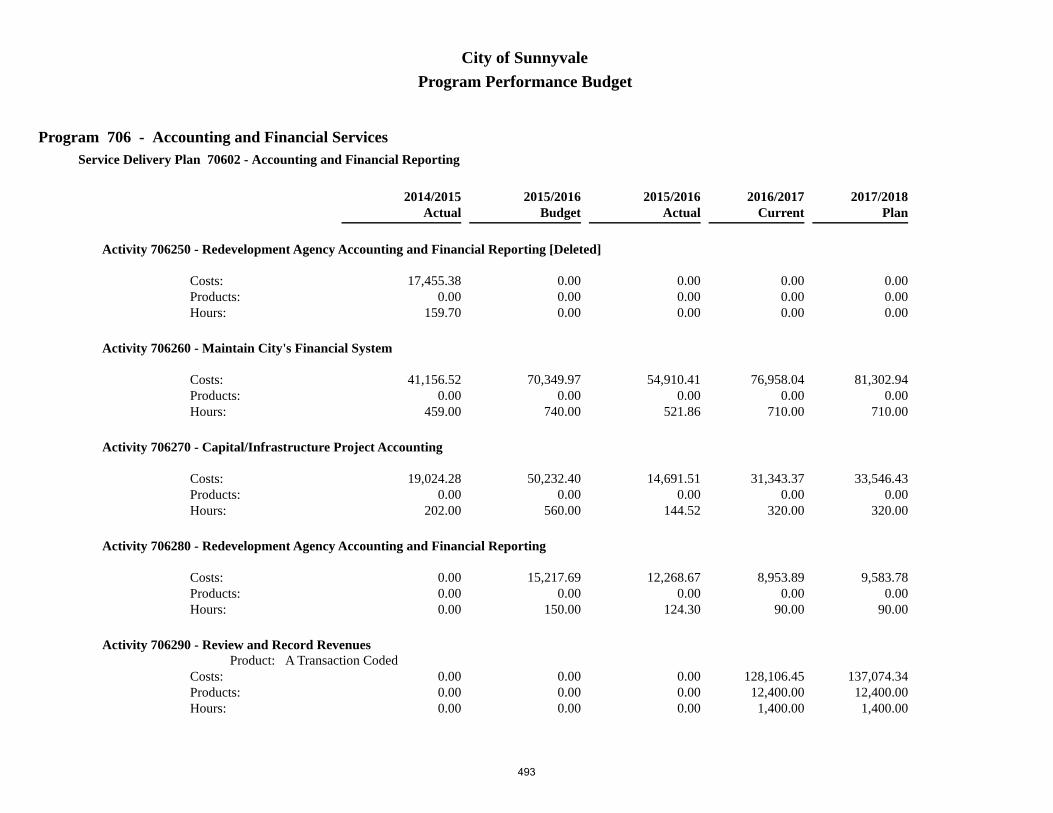
Program 706 - Accounting and Financial Services
Program Performance BudgetCity of Sunnyvale
Service Delivery Plan 70602 - Accounting and Financial Reporting
Budget2015/2016
Actual2014/2015
Actual2015/2016
Current2016/2017 2017/2018
Plan
Activity 706250 - Redevelopment Agency Accounting and Financial Reporting [Deleted]
0.000.000.00
0.000.000.00
0.000.000.00
0.000.000.00
17,455.380.00
159.70
Costs:Products: Hours:
Activity 706260 - Maintain City's Financial System
70,349.970.00
740.00
54,910.410.00
521.86
76,958.040.00
710.00
81,302.940.00
710.00
41,156.520.00
459.00
Costs:Products: Hours:
Activity 706270 - Capital/Infrastructure Project Accounting
50,232.400.00
560.00
14,691.510.00
144.52
31,343.370.00
320.00
33,546.430.00
320.00
19,024.280.00
202.00
Costs:Products: Hours:
Activity 706280 - Redevelopment Agency Accounting and Financial Reporting
15,217.690.00
150.00
12,268.670.00
124.30
8,953.890.00
90.00
9,583.780.00
90.00
0.000.000.00
Costs:Products: Hours:
Activity 706290 - Review and Record RevenuesProduct: A Transaction Coded
0.000.000.00
0.000.000.00
128,106.4512,400.00
1,400.00
137,074.3412,400.00
1,400.00
0.000.000.00
Costs:Products: Hours:
493

Program 706 - Accounting and Financial Services
Program Performance BudgetCity of Sunnyvale
7,235.00
750,266.54 828,835.56
7,814.41
969,027.82 1,033,471.25
Totals for Service Delivery Plan 70602 - Accounting and Financial Reporting
831,845.23
7,900.70Hours:
Costs:
9,230.00 9,230.00
494

Program 706 - Accounting and Financial Services
Program Performance BudgetCity of Sunnyvale
Service Delivery Plan 70603 - Accounts Payable
Budget2015/2016
Actual2014/2015
Actual2015/2016
Current2016/2017 2017/2018
Plan
Activity 706300 - Process Invoices and Other Nonpayroll ObligationsProduct: A Payment Vouched
307,608.1625,100.00
4,190.00
337,390.4530,076.00
4,406.97
320,906.1626,000.00
4,270.00
343,012.9826,000.00
4,270.00
339,251.9127,716.00
4,469.10
Costs:Products: Hours:
Activity 706310 - Prepare Legally Required and Ad Hoc ReportsProduct: A Report Prepared
17,940.14250.00200.00
22,408.92279.00240.03
18,504.92310.00200.00
19,787.05310.00200.00
20,845.20289.00224.00
Costs:Products: Hours:
4,390.00
325,548.30 359,799.37
4,647.00
339,411.08 362,800.03
Totals for Service Delivery Plan 70603 - Accounts Payable
360,097.11
4,693.10Hours:
Costs:
4,470.00 4,470.00
495

Program 706 - Accounting and Financial Services
Program Performance BudgetCity of Sunnyvale
Service Delivery Plan 70604 - Management and Administrative Support Services
Budget2015/2016
Actual2014/2015
Actual2015/2016
Current2016/2017 2017/2018
Plan
Activity 706400 - Management and Administrative Support Services
79,509.870.00
525.00
196,059.130.00
1,422.15
250,828.300.00
1,800.00
254,502.160.00
1,800.00
38,809.230.00
288.20
Costs:Products: Hours:
525.00
79,509.87 196,059.13
1,422.15
250,828.30 254,502.16
Totals for Service Delivery Plan 70604 - Management and Administrative Support Services
38,809.23
288.20Hours:
Costs:
1,800.00 1,800.00
496

Program 706 - Accounting and Financial Services
Program Performance BudgetCity of Sunnyvale
Service Delivery Plan 70605 - Cash Management
Budget2015/2016
Actual2014/2015
Actual2015/2016
Current2016/2017 2017/2018
Plan
Activity 706500 - Investments
0.000.000.00
0.000.000.00
22,252.620.00
220.00
23,672.250.00
220.00
0.000.000.00
Costs:Products: Hours:
Activity 706520 - City-Wide Cashiering Management
0.000.000.00
0.000.000.00
20,131.020.00
220.00
21,540.250.00
220.00
0.000.000.00
Costs:Products: Hours:
0.00
0.00 0.00
0.00
42,383.64 45,212.50
Totals for Service Delivery Plan 70605 - Cash Management
0.00
0.00Hours:
Costs:
440.00 440.00
1,688,526.13
17,950.00
1,815,025.06
18,496.95
1,847,157.48
19,746.60
Costs:
Hours: 20,590.00 20,590.00
2,055,657.05 2,175,274.32
Totals for Program 706
497

This Page Intentionally Blank
498

Program 707 - Revenue Collection and Audit
Program Performance BudgetCity of Sunnyvale
Service Delivery Plan 70701 - Revenue Collection
Budget2015/2016
Actual2014/2015
Actual2015/2016
Current2016/2017 2017/2018
Plan
Activity 707100 - Accounts ReceivableProduct: An Account Processed
193,731.677,000.002,110.00
193,359.806,327.002,199.84
223,818.597,000.002,580.00
238,368.687,000.002,580.00
184,077.546,196.001,997.40
Costs:Products: Hours:
Activity 707110 - RestitutionProduct: An Account Processed
28,068.93340.00290.00
14,107.54718.00190.02
21,689.25600.00300.00
23,184.07600.00300.00
21,131.18640.00260.40
Costs:Products: Hours:
2,400.00
221,800.60 207,467.34
2,389.86
245,507.84 261,552.75
Totals for Service Delivery Plan 70701 - Revenue Collection
205,208.72
2,257.80Hours:
Costs:
2,880.00 2,880.00
499

Program 707 - Revenue Collection and Audit
Program Performance BudgetCity of Sunnyvale
Service Delivery Plan 70702 - Cash Management [Deleted]
Budget2015/2016
Actual2014/2015
Actual2015/2016
Current2016/2017 2017/2018
Plan
Activity 707200 - Investments [Deleted]
30,885.800.00
300.00
18,282.280.00
174.02
0.000.000.00
0.000.000.00
29,418.890.00
258.50
Costs:Products: Hours:
Activity 707210 - Debt Management [Deleted]Product: A Bond Issue Maintained
25,598.838.00
198.00
4,046.268.00
32.00
0.000.000.00
0.000.000.00
7,899.218.00
61.20
Costs:Products: Hours:
Activity 707220 - City's Banking Contracts [Deleted]Product: A Bank Account Maintained
31,907.885.00
290.00
19,199.035.00
189.02
0.000.000.00
0.000.000.00
16,164.135.00
153.00
Costs:Products: Hours:
Activity 707230 - Cashiering [Deleted]Product: A Transaction at the Counter
182,757.8425,000.00
2,270.00
226,345.6127,050.00
2,759.89
0.000.000.00
0.000.000.00
208,764.4521,796.00
2,562.40
Costs:Products: Hours:
3,058.00
271,150.35 267,873.18
3,154.93
0.00 0.00
Totals for Service Delivery Plan 70702 - Cash Management [Deleted]
262,246.68
3,035.10Hours:
Costs:
0.00 0.00
500

Program 707 - Revenue Collection and Audit
Program Performance BudgetCity of Sunnyvale
Service Delivery Plan 70703 - Revenue and Disbursement Audit
Budget2015/2016
Actual2014/2015
Actual2015/2016
Current2016/2017 2017/2018
Plan
Activity 707300 - Audit and Disburse Accounts Payable PaymentsProduct: A Payment Audited
107,013.3610,700.00
1,220.00
65,367.2411,732.00
852.99
77,259.6011,200.00
960.00
82,081.5311,200.00
960.00
69,468.1611,285.00
846.70
Costs:Products: Hours:
Activity 707310 - Audit Purchasing CardsProduct: A Statement Audited
34,182.691,500.00
400.00
33,048.011,333.00
442.15
36,148.741,500.00
500.00
38,640.131,500.00
500.00
34,176.461,439.00
443.50
Costs:Products: Hours:
Activity 707320 - Audit Payroll [Deleted]Product: A Payroll Audited
3,361.4726.0026.00
0.000.000.00
0.000.000.00
0.000.000.00
651.536.005.00
Costs:Products: Hours:
Activity 707330 - Review and Process Travel Documentation
11,335.460.00
160.00
10,482.600.00
120.51
14,014.630.00
160.00
14,797.860.00
160.00
14,793.720.00
180.70
Costs:Products: Hours:
Activity 707340 - Perform Fiduciary Services and Compliance Audits
0.000.000.00
0.000.000.00
179,241.496.00
875.00
180,301.966.00
875.00
0.000.000.00
Costs:Products: Hours:
501

Program 707 - Revenue Collection and Audit
Program Performance BudgetCity of Sunnyvale
1,806.00
155,892.98 108,897.85
1,415.65
306,664.46 315,821.48
Totals for Service Delivery Plan 70703 - Revenue and Disbursement Audit
119,089.87
1,475.90Hours:
Costs:
2,495.00 2,495.00
502

Program 707 - Revenue Collection and Audit
Program Performance BudgetCity of Sunnyvale
Service Delivery Plan 70704 - City Tax Collection
Budget2015/2016
Actual2014/2015
Actual2015/2016
Current2016/2017 2017/2018
Plan
Activity 707400 - Process Business TaxesProduct: A Tax Certificate Issued
273,423.486,530.003,080.00
295,940.657,407.003,609.09
306,491.207,500.003,520.00
324,744.117,500.003,520.00
295,442.407,385.003,815.40
Costs:Products: Hours:
Activity 707430 - Review and Record Revenues [Deleted]Product: A Transaction Coded
108,459.7812,400.00
1,210.00
114,039.1313,356.00
1,217.73
0.000.000.00
0.000.000.00
128,792.3412,321.00
1,380.80
Costs:Products: Hours:
Activity 707440 - Process Utility User Tax (UUT) PaymentsProduct: A UUT Payment Coded
8,753.321,500.00
110.00
7,439.652,179.00
101.51
16,148.422,200.00
200.00
17,270.432,200.00
200.00
12,145.232,140.00
188.90
Costs:Products: Hours:
Activity 707450 - Process Transient Occupancy Tax (TOT) Payments and RemittancesProduct: A TOT Payment Coded
9,015.50425.00
82.00
22,343.27452.00278.03
8,074.22440.00100.00
8,635.22440.00100.00
6,483.94428.00
62.50
Costs:Products: Hours:
4,482.00
399,652.08 439,762.70
5,206.36
330,713.84 350,649.76
Totals for Service Delivery Plan 70704 - City Tax Collection
442,863.91
5,447.60Hours:
Costs:
3,820.00 3,820.00
503

Program 707 - Revenue Collection and Audit
Program Performance BudgetCity of Sunnyvale
Service Delivery Plan 70705 - Management and Administrative Support Services
Budget2015/2016
Actual2014/2015
Actual2015/2016
Current2016/2017 2017/2018
Plan
Activity 707500 - Miscellaneous Treasury Support Services [Deleted]
29,050.880.00
250.00
14,116.370.00
150.02
0.000.000.00
0.000.000.00
29,089.890.00
247.40
Costs:Products: Hours:
Activity 707510 - Management and Administrative Support Services
41,889.000.00
324.00
62,357.810.00
518.56
77,625.590.00
600.00
78,768.130.00
600.00
76,321.690.00
618.30
Costs:Products: Hours:
574.00
70,939.88 76,474.18
668.58
77,625.59 78,768.13
Totals for Service Delivery Plan 70705 - Management and Administrative Support Services
105,411.58
865.70Hours:
Costs:
600.00 600.00
1,119,435.89
12,320.00
1,100,475.25
12,835.38
1,134,820.76
13,082.10
Costs:
Hours: 9,795.00 9,795.00
960,511.73 1,006,792.12
Totals for Program 707
504

Program 708 - Utility Billing
Program Performance BudgetCity of Sunnyvale
Service Delivery Plan 70801 - Meter Reading
Budget2015/2016
Actual2014/2015
Actual2015/2016
Current2016/2017 2017/2018
Plan
Activity 708100, 708101 - Read MetersProduct: A Meter Read
199,891.16205,000.00
2,630.00
207,185.77189,045.00
2,968.61
218,685.39207,000.00
2,950.00
242,207.93207,000.00
2,950.00
205,109.78207,173.00
2,996.70
Costs:Products: Hours:
Activity 708110 - Re-read MetersProduct: A Meter Read
20,524.96900.00270.00
25,600.13828.00324.53
25,172.03830.00330.00
27,277.77830.00330.00
24,443.51790.00315.20
Costs:Products: Hours:
Activity 708120 - Start and Stop Water ServiceProduct: A Service Start/Stop
103,628.815,500.001,370.00
106,832.485,538.001,371.45
101,737.656,340.001,350.00
110,799.526,340.001,350.00
110,984.056,339.001,424.90
Costs:Products: Hours:
Activity 708130 - Shut Off Delinquent AccountsProduct: An Account Shut Off
50,145.67450.00670.00
19,796.98410.00253.53
32,048.42425.00430.00
34,792.32425.00430.00
29,368.15425.00378.30
Costs:Products: Hours:
Activity 708140 - Backflow Compliance AdministrationProduct: A Backflow Device Certified
33,138.743,700.00
400.00
52,053.912,575.00
615.67
34,629.075,000.00
420.00
37,111.675,000.00
420.00
39,359.554,723.00
487.00
Costs:Products: Hours:
505

Program 708 - Utility Billing
Program Performance BudgetCity of Sunnyvale
5,340.00
407,329.34 411,469.27
5,533.79
412,272.56 452,189.21
Totals for Service Delivery Plan 70801 - Meter Reading
409,265.04
5,602.10Hours:
Costs:
5,480.00 5,480.00
506

Program 708 - Utility Billing
Program Performance BudgetCity of Sunnyvale
Service Delivery Plan 70802 - Customer Service
Budget2015/2016
Actual2014/2015
Actual2015/2016
Current2016/2017 2017/2018
Plan
Activity 708200, 708201 - Customer ServiceProduct: A Customer Contact
626,352.2540,400.00
7,210.00
600,767.8537,541.00
6,848.93
658,830.5041,400.00
7,480.00
699,570.2841,400.00
7,480.00
600,681.6541,404.00
7,190.70
Costs:Products: Hours:
Activity 708210 - Utility BillingProduct: A Utility Bill Sent
391,546.16195,000.00
3,220.00
335,914.19190,287.00
2,637.28
310,467.06192,000.00
2,435.00
329,069.25192,000.00
2,435.00
310,401.99191,729.00
2,413.50
Costs:Products: Hours:
Activity 708220 - Utility Accounting and Auditing
143,724.300.00
1,510.00
125,649.760.00
1,275.63
120,143.700.00
1,210.00
128,321.070.00
1,210.00
108,537.580.00
1,265.30
Costs:Products: Hours:
Activity 708230, 708231, 708232 - CollectionsProduct: An Account Processed
114,327.7922,000.00
1,390.00
147,439.1518,693.00
1,824.90
114,816.3718,900.00
1,395.00
124,294.9818,900.00
1,395.00
145,033.4118,888.00
1,767.60
Costs:Products: Hours:
Activity 708240 - Water and Wastewater Emergency CallsProduct: A Call
46,698.991,700.00
650.00
21,457.752,255.00
268.13
25,232.601,900.00
325.00
27,125.701,900.00
325.00
24,198.881,880.00
319.80
Costs:Products: Hours:
507

Program 708 - Utility Billing
Program Performance BudgetCity of Sunnyvale
Service Delivery Plan 70802 - Customer Service
Budget2015/2016
Actual2014/2015
Actual2015/2016
Current2016/2017 2017/2018
Plan
Activity 708250 - Solid Waste ConcernsProduct: A Call
37,481.914,200.00
530.00
25,881.862,323.00
307.33
30,959.562,100.00
395.00
33,282.162,100.00
395.00
27,953.712,149.00
384.60
Costs:Products: Hours:
Activity 708260 - On Call CleanupsProduct: A Request
37,687.374,000.00
500.00
43,287.815,953.00
543.66
41,867.885,200.00
540.00
45,009.145,200.00
540.00
46,140.485,281.00
615.30
Costs:Products: Hours:
Activity 708270 - Process Manual PaymentsProduct: A Payment Processed
64,311.3792,000.00
880.00
56,484.6270,736.00
743.38
81,205.8877,000.00
1,080.00
86,990.7377,000.00
1,080.00
83,947.1177,292.00
1,089.70
Costs:Products: Hours:
Activity 708280 - Process Web PaymentsProduct: A Payment Processed
74,939.6735,000.00
80.00
149,528.3062,201.00
42.00
149,026.8956,000.00
55.00
156,253.9856,000.00
55.00
105,603.6155,620.00
52.30
Costs:Products: Hours:
Activity 708290 - Process ACH/Bill Concentration PaymentsProduct: A Payment Processed
7,144.0168,000.00
80.00
3,179.2460,425.00
36.10
6,057.9462,500.00
65.00
6,478.1162,500.00
65.00
5,556.6462,506.00
56.40
Costs:Products: Hours:
508

Program 708 - Utility Billing
Program Performance BudgetCity of Sunnyvale
Service Delivery Plan 70802 - Customer Service
Budget2015/2016
Actual2014/2015
Actual2015/2016
Current2016/2017 2017/2018
Plan
Activity 708000 - CashieringProduct: A Transaction at the Counter
0.000.000.00
0.000.000.00
193,012.9825,000.00
2,215.00
205,963.9425,000.00
2,215.00
0.000.000.00
Costs:Products: Hours:
16,050.00
1,544,213.82 1,509,590.53
14,527.34
1,731,621.36 1,842,359.34
Totals for Service Delivery Plan 70802 - Customer Service
1,458,055.06
15,155.20Hours:
Costs:
17,195.00 17,195.00
509

Program 708 - Utility Billing
Program Performance BudgetCity of Sunnyvale
Service Delivery Plan 70803 - Cashiering
Budget2015/2016
Actual2014/2015
Actual2015/2016
Current2016/2017 2017/2018
Plan
Activity 708300 - Utility Financial Management Services [Deleted]
138,600.860.00
1,040.00
32,463.320.00
132.71
0.000.000.00
0.000.000.00
127,490.480.00
1,128.30
Costs:Products: Hours:
Activity 708310 - Utility Data Management [Deleted]
16,517.750.00
150.00
21,997.230.00
194.22
0.000.000.00
0.000.000.00
15,718.890.00
139.20
Costs:Products: Hours:
1,190.00
155,118.61 54,460.55
326.93
0.00 0.00
Totals for Service Delivery Plan 70803 - Cashiering
143,209.37
1,267.50Hours:
Costs:
0.00 0.00
510

Program 708 - Utility Billing
Program Performance BudgetCity of Sunnyvale
Service Delivery Plan 70804 - Management and Administrative Support Services
Budget2015/2016
Actual2014/2015
Actual2015/2016
Current2016/2017 2017/2018
Plan
Activity 708400 - Management
96,768.930.00
750.00
139,836.200.00
1,046.21
120,354.720.00
850.00
118,559.390.00
850.00
85,128.740.00
705.00
Costs:Products: Hours:
Activity 708410 - Utility Billing, Systems Support
141,019.130.00
1,250.00
230,856.490.00
1,962.34
270,229.710.00
2,280.00
281,086.740.00
2,280.00
139,307.290.00
1,280.40
Costs:Products: Hours:
Activity 708420 - Administer Utility Rate Adjustments
0.000.000.00
0.000.000.00
41,081.290.00
175.00
41,553.070.00
175.00
0.000.000.00
Costs:Products: Hours:
2,000.00
237,788.06 370,692.69
3,008.55
431,665.72 441,199.20
Totals for Service Delivery Plan 70804 - Management and Administrative Support Services
224,436.03
1,985.40Hours:
Costs:
3,305.00 3,305.00
2,344,449.83
24,580.00
2,346,213.04
23,396.61
2,234,965.50
24,010.20
Costs:
Hours: 25,980.00 25,980.00
2,575,559.64 2,735,747.75
Totals for Program 708
511

This Page Intentionally Blank
512

Human Resources

Human Resources DepartmentDepartment Description
The Human Resources Department coordinates services and programs which assist City departments in developing and maintaining a qualified, effective, and diverse workforce of approximately 824 regular full- and part- time employees, and as many as 300 temporary/casual employees. The Department also provides employment-related services to City employees, job applicants and City volunteers.
Programs and ServicesThe Human Resources Department is organized into five divisions: Risk Management, Recruitment/ Classification,
Employee Relations/Employee Development, Employee Benefits, and Management and Administrative Support Services.
Risk Management
The Risk Management Division administers the City’s liability, safety and workers’ compensation activities. The Liability Program processes claims filed against the City and coordinates the City’s participation in the California Joint Powers Risk Management Authority, which provides excess liability, property and auto insurance coverage to member agencies. This Division is responsible for managing all workers’ compensation claims and compliance with legal mandates. Its Safety/Loss Control activities include safety training, policy development, work site inspection and accident prevention. Risk Management also manages the disability reasonable accommodation process in accordance with City policy, applicable Memoranda of Understanding, the Federal Americans with Disabilities Act (ADA), the California Fair Employment and Housing Act (FEHA) and the Equal Employment Opportunity Commission (EEOC).
Recruitment/Classification
The Recruitment and Classification Division is responsible for managing and administering the City’s recruitment, examination, selection, and pre-employment activities for both regular and temporary/casual positions. This includes managing the City’s temporary employment agency contracts. Staff also manages and administers the City’s classification program, which involves preparing, reviewing, and updating job specifications, as well as conducting classification studies and organizational analyses.
Employee Relations/Employee Development
The Employee Relations Division manages employee relations activities for the six recognized employee bargaining units and the two unrepresented employee groups in accordance with the Meyers-Milias Brown Act. Staff also manages the Memoranda of Understanding (MOU) with each of the recognized units. Staff in this Division administers and assists departments with employee relations issues, grievances and discipline issues. Responsibilities also include the Citywide Employee Performance Evaluation Program; Organizational Advancement; Employee Development Program, which includes the Employee Training Program, Career Development Program and Succession Planning Program; and the City Volunteer Resources Program.
Organizational advancement is a City management strategy to build a strong and successful organization. Several citywide initiatives have been identified and some are led by the Department such as succession planning, citywide training, tuition reimbursement, etc. These initiatives benefit our employees with improvement in the work place and assist in the preparation of employees for advancing their careers with the City.
Employee Benefits
The Employee Benefits Division manages and administers the City’s employee insurance and benefits programs including the CalPERS retirement and supplemental retirement plans, IRS §125 plan, medical, dental, vision, life and long-term disability insurance plans, and employee assistance programs. Staff also manages the Human Resources Information System (HRIS), including the processing and inputting of all employee payroll and benefits information. This Division also manages the employee wellness program.
City of Sunnyvale FY 2017/18 Adopted Budget and Resource Allocation Plan
513

Management and Administrative Support Services
The Management and Administrative Support Services Division provides overall management and administrative support to the Department with oversight of all divisions. In addition, labor relations and bargaining for successor Memorandum of Understandings (MOUs), budget administration, answer point management, and purchasing are key areas of responsibility. This Division also manages the City’s leave programs, including the City’s paid medical leave program in accordance with City policy, applicable Memoranda of Understanding, and all relevant state and federal laws, including the Federal Family and Medical Leave Act (FMLA), the California Family Rights Act (CFRA) and the Pregnancy Disability Leave (PDL).This Division also coordinates several Citywide activities, such as the Annual Giving Campaign, Employee Appreciation Breakfast, Years of Service Recognition Event and the Employee Engagement initiative.
Department Budget Summary
Human Resources
Fund/Program Actual
2014/15Budget
2015/16Actual
2015/16Budget
2016/17Budget
2017/18
General Fund
Human Resources 3,682,260 3,990,480 3,847,479 4,588,585 4,846,658
Property and Liability Insurance
Human Resources 345,405 429,187 361,730 452,628 458,447
TOTAL EXPENDITURES 4,027,665 4,419,667 4,209,209 5,041,213 5,305,105
Budget Overview and Significant ChangesFY 2017/18 is the second year of a two-year operating cycle. As such, there were no significant changes to the
Department’s operating budget for FY 2017/18.
The most significant changes in the Human Resources Department’s FY 2016/17 budget included the restoration of a position that was eliminated during the economic downturn and the addition of one new position.
Despite the high demand of work load, many driven by legislative compliance due to the Affordable Care Act and the Public Employee Pension Reform Act, the Human Resources Department continuously strives to implement new measures to provide high quality of services. The Department reevaluated and realigned some work responsibilities in order to add a new Part-Time Staff Office Assistant position in FY 2016/17. This new position is partly funded through salary savings of downgrading a Senior Human Resources Analyst budgeted position to a lower classification of Human Resources Analyst and under-filling a Human Resources Analyst budgeted position with a lower classification of Human Resources Technician. In addition, a new Human Resources Analyst position was added in FY 2016/17. This position supports different divisions in the Department in areas such as recruitment, leave management, employee engagement initiative, etc.
Risk Management
The following table shows the trends in workers’ compensation claims since FY2004/05. The number of claims has been increasing since FY 2012/13, but at a decreasing pace. Medical management programs such as nurse case management, utilization review and bill review help control workers’ compensation costs. Also, the City’s return- to-work program returns employees to the workplace as soon as possible which results in overall savings. With the majority of claims occurring in the Department of Public Safety (DPS), the Risk Management Division works closely with DPS to minimize both the frequency and the severity of workplace injuries.
City of Sunnyvale FY 2017/18 Adopted Budget and Resource Allocation Plan
514

City of Sunnyvale Workers’ Compensation Claims
Number of Claims Submitted Change in Number of Claims Percent Change
FY 2004/05 186 — —
FY 2005/06 162 -24 -12.9%
FY 2006/07 126 -36 -22.2%
FY 2007/08 116 -10 -7.9%
FY 2008/09 100 -16 -13.8%
FY 2009/10 95 -5 -5.0%
FY 2010/11 114 +19 +20.0%
FY 2011/12 85 -29 -25.4%
FY 2012/13 103 +18 +21.2%
FY 2013/14 119 +16 +15.5%
FY 2014/15 122 +3 +2.5%
FY 2015/16 124 +2 +1.6%
Although the number of Workers’ Compensation claims has increased slightly in recent years, the cost of claims has stayed between $2.3 million and $3.1 million. The cost of workers’ compensation claims includes time off for workers’ compensation injuries, medical care and direct costs charged to the claims. It does not include premiums for excess workers’ compensation insurance or the cost of claims administration. The City has a self-insured workers’ compensation program with a self-insured retention of $500,000. Excess coverage is provided by the California State Association of Counties Excess Insurance Authority.
City of Sunnyvale Cost of Workers’ Compensation Claims
FY 2011/12 $2,615,790.13
FY 2012/13 $2,317,894.05
FY 2013/14 $2,430,504.24
FY 2014/15 $3,097,408.38
FY 2015/16 $2,694,858.76
City of Sunnyvale FY 2017/18 Adopted Budget and Resource Allocation Plan
515

Recruitment/Classification
Recruitment activity has remained consistently heavy since mid-2012 due to employee retirements, employee separations, and the economic recovery, which has allowed the City to add some positions back into the City budget. At the current rate of total recruitment, the Division will be at, or near, 100 hires and promotions for the fourth consecutive fiscal year as shown in the table below.
DPS began ongoing Public Safety Officer-in-Training and Public Safety Officer I Lateral recruitments in mid- 2013. These recruitments are to fill vacancies from retirements, promotions, an increase in budgeted positions and years when there was limited recruiting due to budget reductions. Both the Officer in Training and Lateral Officer recruitments are still ongoing and 76 candidates have been hired or promoted since July 2012.
Fiscal Year New Hires Promotions Total
FY 2009/10 22 20 42
FY 2010/11 28 18 46
FY 2011/12 31 29 60
FY 2012/13 52 30 82
FY 2013/14 78 35 131
FY 2014/15 61 32 93
FY 2015/16 94 35 129
FY 2016/17 YTD (4/10/2017) 67 30 97
Fiscal Year Retirements Non-Retirement Separations Total Separations
FY 2009/10 29 15 44
FY 2010/11 36 19 55
FY 2011/12 41 24 65
FY 2012/13 34 25 59
FY 2013/14 30 32 62
FY 2014/15 40 28 68
FY 2015/16 31 40 71
FY 2016/17 YTD (4/8/2017) 30 29 59
City of Sunnyvale FY 2017/18 Adopted Budget and Resource Allocation Plan
516
Non-retirement separations have been rising since FY 2009/10 with the economic recovery. About half of the non- retirement separations identified finding other job opportunities as the reason for separation.
The Division has established a three-year cycle for ongoing reviews of City job descriptions starting in FY 2015/16. This review cycle will allow for the job descriptions to remain up to date, relevant within the scope of work being performed by employees and provide clear information for applicants seeking employment with the City.
Employee Relations/Employee Development
The Citywide tuition reimbursement program was centralized in the Human Resources Department in FY 2012/13 with $13,000. The budget was increased to $18,000 in FY 2013/14 and has remained the same since. City employees have been making good use of the City’s tuition reimbursement program as they improve their skills and further their education. Participation in the program has been steadily increasing each year. In FY 2015/16, all tuition reimbursement funds were allocated during the first month of the fiscal year. As part of the succession planning efforts, the budget for this program is increasing from $18,000 to $36,000 in FY 2016/17 and FY 2017/18. This increase allows more employees to make use of this benefit, encourage educational development, and maintain and improve employees’ skills in their current positions and/or for potential promotional opportunities.
The budget for the Citywide training program has decreased over the years during the economic recession from over $100,000 in FY 2006/07 to $39,000 in FY 2014/15. As the City continues its efforts in succession planning, training and employee development will continue to gain importance. Additional funding for the Citywide training program will allow the City to offer a greater number and a wider variety of courses to help employees improve their workplace skills and maximize their potential. The budget has increased to $97,000 in FY 2016/17 and $117,000 in FY 2017/18.
In addition to the current tuition reimbursement and citywide training programs, the succession planning program will be expanded to include job shadowing, mentorship/coaching, and job exchange opportunities.
Employee Benefits
The Employee Benefits Division currently deploys a majority of its wellness program budget on the one-day annual benefits fair. Wellness program funds currently provide complimentary flu shots for all employees and biometric screenings for a limited number of employees as part of the one-day benefits fair. The City was awarded the Cities for Workforce Health Grant in 2016 to help the City establish a more robust wellness program beyond our one-day annual benefits fair event. The grant provided for a one-time allotment of $5,000 in calendar year 2016 for specified wellness programming options. The budget has increased to $32,000 in FY 2016/17 (including the $5,000 grant) and FY 2017/18 to cover the projected rise in flu shot costs, provide higher level biometric screenings and increase screenings to twice per year, and provide employees with city sponsored wellness activities and classes.
Management and Administrative Support Services
A full-time Office Assistant was eliminated in FY 2010/11. The position provided first-line, front counter customer service and clerical support to the department. The workload was subsequently distributed to other staff members within the department. With increasing service demand, a part-time Staff Office Assistant was added in FY 2016/17. In addition, a new Human Resources Analyst position was added in FY 2016/17. This position supports all divisions in areas such as recruitment, leave management, and employee engagement, etc.
City of Sunnyvale FY 2017/18 Adopted Budget and Resource Allocation Plan
517

Department Position Allocation
ClassificationFY 2016/17
Budgeted PositionsFY 2017/18
Budgeted Positions Change
Director of Human Resources 1 1 —
Human Resources Manager 3 3 —
Risk Manager 1 1 —
Principal HR Analyst 1 1 —
Administrative Aide-Confidential 1 1 —
Human Resources Analyst 8 8 —
Human Resources Technician 3 3 —
Senior Office Assistant – Confidential 1 1 —
Part-Time Staff Office Assistant 1 1 —
Human Resources Department Total 20 20 —
City of Sunnyvale FY 2017/18 Adopted Budget and Resource Allocation Plan
518

Human Resources Department Performance Indicators2011 Consolidated General Plan Goals:
This department provides administrative and/or internal services within the City. As such, its indicators are not tied to General Plan goals and instead are developed to optimize the level of internal/administrative support service provided.
FY 2013/14 Results
FY 2014/15 Results
FY 2015/16 Results
HUMAN RESOURCES
WORKLOAD INDICATORS
Number of workers’ compensation claims. 119 122 124
Number of liability claims. 122 108 90
Number of regular recruitments. 74 76 98
Number of regular new hires / benefits orientations (not including internal transfers). 78 62 94
Number of temporary new hires. 130 216 208
Number of training classes. 77 64 91
Number of labor associations. 6 6 6
Number of labor agreements (MOU’s) negotiated and approved. 0 2 2
Number of labor grievances. 2 2 2
Number of formal disciplinary actions. 11 12 9
Citywide turnover rate. 7.46% 7.83% 8.77%
Number of personnel record change entries [New in FY 2014/15] N/A 5,338 4,357
Number of unemployment claims processed [New in FY 2014/15] N/A 25 32
PERFORMANCE INDICATORS
Average number of business days for a recruitment process from receiving an approved hiring requisition to the establishment of an eligible list.
66 73 63
Average number of business days for a recruitment process from when the position is posted to the establishment of eligible list. [New in FY 2012/13]
28 29 31
Number of participants in the Citywide Employee Training Program and percent rating their session(s) as good or better.
1,213 97%
947 95%
1,334 97%
Percent of employees attending training sessions. [New in FY 2012/13. Deleted in FY 2014/15.]
61.00% N/A N/A
Expenses of risk management program (safety, workers comp, liability) as a percentage of overall City operating budget.
1.74% 1.35% 1.34%
Number of volunteer applications processed. [Deleted in FY 2014/15] 475 N/A N/A
Percent of volunteer applicants placed into service. [New in FY 2012/13. Deleted in FY 2016/17.]
31.00% 46.80% N/A
City of Sunnyvale FY 2017/18 Adopted Budget and Resource Allocation Plan
519

FY 2013/14 Results
FY 2014/15 Results
FY 2015/16 Results
Number of employees who attended annual health fair [New in FY 2014/15] N/A 308 324
Number of employees who received a flu shot [New in FY 2014/15] N/A 312 312
Percent of total Department operating budget expended. 95.15% 95.59% 95.24%
City of Sunnyvale FY 2017/18 Adopted Budget and Resource Allocation Plan
520

Program 754 - Human Resources
Program Performance BudgetCity of Sunnyvale
Service Delivery Plan 75401 - Risk Management
Budget2015/2016
Actual2014/2015
Actual2015/2016
Current2016/2017 2017/2018
Plan
Activity 754100 - Safety
266,306.240.00
870.00
269,593.490.00
710.80
317,388.680.00
810.00
320,745.210.00
810.00
266,343.250.00
753.90
Costs:Products: Hours:
Activity 754110 - Workers' CompensationProduct: A Claim
154,853.06100.00
1,400.00
128,201.50117.00
1,210.60
157,219.46130.00
1,376.00
163,459.89130.00
1,376.00
142,546.48122.00
1,311.70
Costs:Products: Hours:
Activity 754120 - LiabilityProduct: A Claim
429,187.02110.00
1,000.00
361,729.6690.00
1,115.30
452,628.37110.00
1,173.00
458,447.44110.00
1,173.00
345,404.50108.00
1,128.30
Costs:Products: Hours:
Activity 754130 - Reasonable Accommodation ProcessProduct: A Reasonable Accommodation Process Conducted
33,778.2920.00
270.00
22,110.5415.00
202.20
46,629.8720.00
331.00
47,858.1520.00
331.00
35,394.0612.00
266.40
Costs:Products: Hours:
Activity 754140 - Leave AdministrationProduct: An FMLA Request Received
140,547.99150.00
1,160.00
83,603.6082.00
833.90
123,718.03100.00
1,024.00
128,842.45100.00
1,024.00
104,149.3652.00
922.50
Costs:Products: Hours:
521
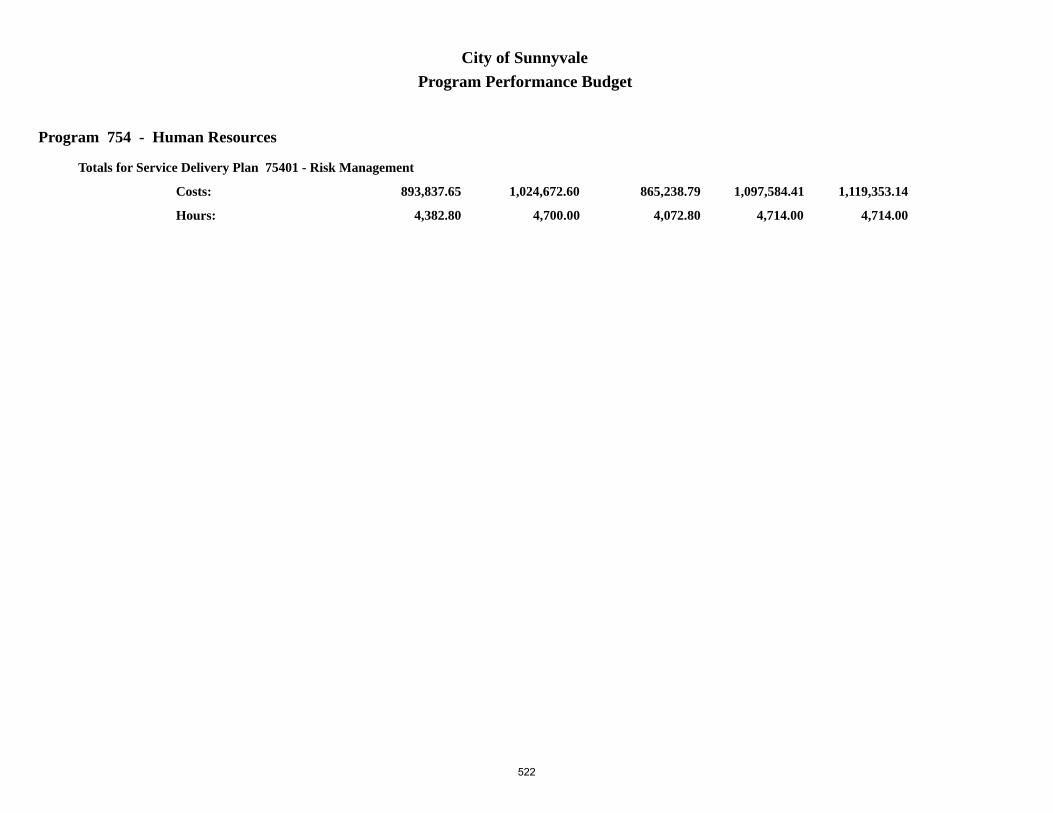
Program 754 - Human Resources
Program Performance BudgetCity of Sunnyvale
4,700.00
1,024,672.60 865,238.79
4,072.80
1,097,584.41 1,119,353.14
Totals for Service Delivery Plan 75401 - Risk Management
893,837.65
4,382.80Hours:
Costs:
4,714.00 4,714.00
522

Program 754 - Human Resources
Program Performance BudgetCity of Sunnyvale
Service Delivery Plan 75402 - Recruitment/Classification
Budget2015/2016
Actual2014/2015
Actual2015/2016
Current2016/2017 2017/2018
Plan
Activity 754230 - RecruitmentProduct: A Recruitment
660,600.8780.00
5,860.00
672,968.9598.00
5,420.30
765,329.4375.00
6,331.00
787,953.2575.00
6,331.00
598,890.2076.00
5,248.70
Costs:Products: Hours:
Activity 754240 - Classification ReviewProduct: Number of Job Descriptions Reviewed
68,359.1110.00
575.00
87,608.9411.00
640.50
136,483.2075.00
1,023.00
140,260.1175.00
1,023.00
120,905.9747.00
858.70
Costs:Products: Hours:
Activity 754250 - New Hire ProcessingProduct: A Regular or Temporary Employees Hired
96,471.56200.00400.00
115,908.53327.00651.00
115,190.61225.00528.00
118,056.88225.00528.00
113,248.27278.00591.50
Costs:Products: Hours:
6,835.00
825,431.54 876,486.42
6,711.80
1,017,003.24 1,046,270.24
Totals for Service Delivery Plan 75402 - Recruitment/Classification
833,044.44
6,698.90Hours:
Costs:
7,882.00 7,882.00
523

Program 754 - Human Resources
Program Performance BudgetCity of Sunnyvale
Service Delivery Plan 75403 - Employee Relations/Development
Budget2015/2016
Actual2014/2015
Actual2015/2016
Current2016/2017 2017/2018
Plan
Activity 754300 - Labor Negotiations
195,775.250.00
679.00
474,789.690.00
2,106.50
233,503.420.00
1,107.00
525,907.430.00
2,289.00
378,055.520.00
1,895.00
Costs:Products: Hours:
Activity 754310 - Employee Relations
467,639.010.00
3,682.00
387,000.500.00
2,666.10
434,870.810.00
3,103.00
448,581.450.00
3,103.00
410,728.780.00
3,205.40
Costs:Products: Hours:
Activity 754330 - Training - CitywideProduct: A Class Session
182,006.01100.00
1,273.20
192,893.6285.00
1,136.20
343,957.26100.00
2,467.00
384,898.61100.00
2,467.00
189,022.7864.00
1,463.60
Costs:Products: Hours:
Activity 754340 - Volunteer Management
52,003.600.00
485.80
43,132.530.00
413.80
45,005.310.00
423.00
47,152.740.00
423.00
30,441.120.00
310.90
Costs:Products: Hours:
6,120.00
897,423.87 1,097,816.34
6,322.60
1,057,336.80 1,406,540.23
Totals for Service Delivery Plan 75403 - Employee Relations/Development
1,008,248.20
6,874.90Hours:
Costs:
7,100.00 8,282.00
524

Program 754 - Human Resources
Program Performance BudgetCity of Sunnyvale
Service Delivery Plan 75404 - Employee Benefits
Budget2015/2016
Actual2014/2015
Actual2015/2016
Current2016/2017 2017/2018
Plan
Activity 754400 - Human Resources Information Systems ManagementProduct: Number of Personnel Records Changed
380,276.441,550.004,132.03
193,513.053,728.002,087.30
426,812.905,000.004,502.00
449,268.915,000.004,502.00
316,031.474,994.003,552.70
Costs:Products: Hours:
Activity 754410 - Benefits AdministrationProduct: A Benefits Change Processed
492,427.66180.00
4,584.01
636,050.79629.00
5,112.50
565,740.71400.00
5,338.00
565,386.32400.00
4,438.00
393,895.06344.00
3,550.40
Costs:Products: Hours:
8,716.04
872,704.10 829,563.84
7,199.80
992,553.61 1,014,655.23
Totals for Service Delivery Plan 75404 - Employee Benefits
709,926.53
7,103.10Hours:
Costs:
9,840.00 8,940.00
525
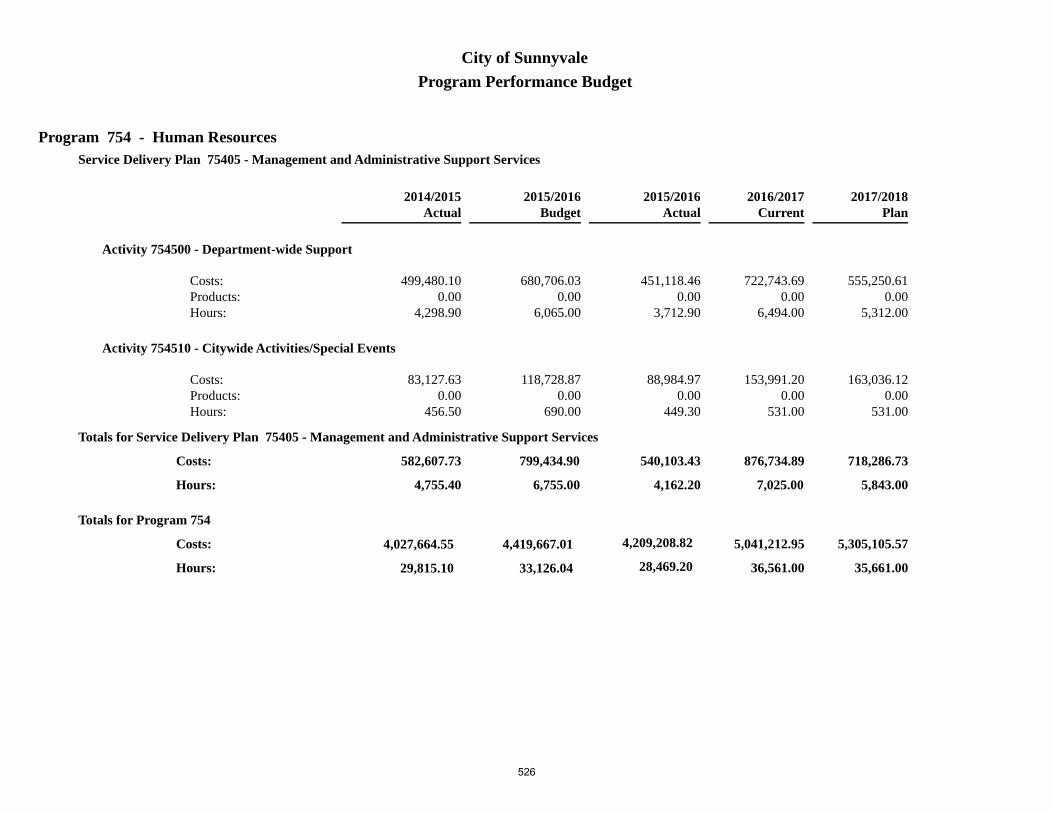
Program 754 - Human Resources
Program Performance BudgetCity of Sunnyvale
Service Delivery Plan 75405 - Management and Administrative Support Services
Budget2015/2016
Actual2014/2015
Actual2015/2016
Current2016/2017 2017/2018
Plan
Activity 754500 - Department-wide Support
680,706.030.00
6,065.00
451,118.460.00
3,712.90
722,743.690.00
6,494.00
555,250.610.00
5,312.00
499,480.100.00
4,298.90
Costs:Products: Hours:
Activity 754510 - Citywide Activities/Special Events
118,728.870.00
690.00
88,984.970.00
449.30
153,991.200.00
531.00
163,036.120.00
531.00
83,127.630.00
456.50
Costs:Products: Hours:
6,755.00
799,434.90 540,103.43
4,162.20
876,734.89 718,286.73
Totals for Service Delivery Plan 75405 - Management and Administrative Support Services
582,607.73
4,755.40Hours:
Costs:
7,025.00 5,843.00
4,419,667.01
33,126.04
4,209,208.82
28,469.20
4,027,664.55
29,815.10
Costs:
Hours: 36,561.00 35,661.00
5,041,212.95 5,305,105.57
Totals for Program 754
526

Information Technology

Information Technology DepartmentDepartment Description
The Information Technology Department (ITD) provides and maintains the City’s array of business systems, office automation, and communications technologies to support the business operations and the delivery of public services. Like any other city, the technology environment in Sunnyvale is challenging due to the complex and varied business needs of the diverse organizational units.
The City relies on well-managed, centralized IT services to control redundancy and balance organizational technology priorities. This key attribute is essential to managing the City’s limited technology budget, while maintaining the City’s standard of delivering excellent public services, and simultaneously controlling costs and improving public access to services and public records.
In support of these goals, ITD employs a continuous improvement strategy and long-term replacement program to ensure funding, in face of an ever-changing technology market. ITD delivers technology services via well-trained and skilled professionals.
Programs and ServicesITD’s various work activities are grouped and delineated by type of service delivered, rather than by the
organizational divisions. This provides a more comprehensive view of the services and support ITD provides.
IT Services and Support
IT Services and Support is defined as the activities required for providing ongoing IT support, also referred to as IT operations. These activities consist of a wide variety of tasks and account for approximately 80% of technical staff time. Work is broken down in two basic activities: Resolving Requests for Service and System Maintenance Tasks. Resolving requests for service includes all service requests from line departments ranging from troubleshooting to setting up new user accounts and replacing or installing minor new equipment (e.g.: new phones or personal computers). System Maintenance Tasks includes installing software patches or minor releases, replacing aging hardware, performing data backups, etc. Requests for new services that are beyond minor or routine requests are considered IT Projects.
Requests for ITD Service
5,963
5,101 5,074
5,7126,278
6,583
5,887 5,939Projected
5,925
0
1,000
2,000
3,000
4,000
5,000
6,000
7,000
2008/09 2009/10 2010/11 2011/12 2012/13 2013/14 2014/15 2015/16 2016/17
Fiscal Year
City of Sunnyvale FY 2017/18 Adopted Budget and Resource Allocation Plan
527

IT Projects
IT Projects primarily comprises the delivery of major IT systems or services such as the implementation of entirely new systems or installation of major upgrades to existing systems. One of the most significant upcoming projects is the replacement of the City’s financial applications with a new, well-integrated Enterprise Resource Planning (ERP) system. The current financial “system” consists of several applications, many requiring specific, stand-alone hardware. These systems are interconnected using complicated data exchange mechanisms. With the acquisition of an ERP, the City’s major financial, payroll, and HR functions will be supported by an integrated system. Some of the other major projects planned are:
• Installation and replacement of a new Operating and Capital Budget System;
• Replacement of the Police Records Management System;
• Replacement of the building and development permit tracking system;
• Installation of a full-featured Constituent Relationship Management application offering online and mobile services for reporting problems and receiving status updates;
• Replacement of the Maintenance Management System used at the WPCP that is no longer supported by its vendor;
• Replacement of aging computer servers.
In addition, ITD will be upgrading several minor business systems and hardware components. Replacing the significant systems listed above will allow ITD to implement much improved Business Intelligence software to provide richer and more timely access to workload and performance data, in support of operational improvements and more effective strategy development.
IT Services and Support Management
IT Services and Support Management captures all management tasks completed in support of IT operations and projects, as well as all technical training and other technology-related staff development activities.
IT Department Administration
The IT Department distinguishes between services and support directly related to IT operations and projects, and general department administration. Budget development and tracking, procurement management, asset management, personnel management, and strategic and tactical planning are all activities that fall under IT Department Administration. Non-technical staff development and training is also included. In addition, the IT Department is the City’s liaison for Telecommunications Franchises, including resolving customer complaints related to cable television franchises.
Department Budget Summary
Information Technology
Fund/Program Actual
2014/15Budget
2015/16Actual
2015/16Budget
2016/17Budget
2017/18
General Services
IT Services and Support 6,715,674 7,100,904 7,033,848 7,877,713 9,099,053
TOTAL EXPENDITURES 6,715,674 7,100,904 7,033,848 7,877,713 9,099,053
City of Sunnyvale FY 2017/18 Adopted Budget and Resource Allocation Plan
528
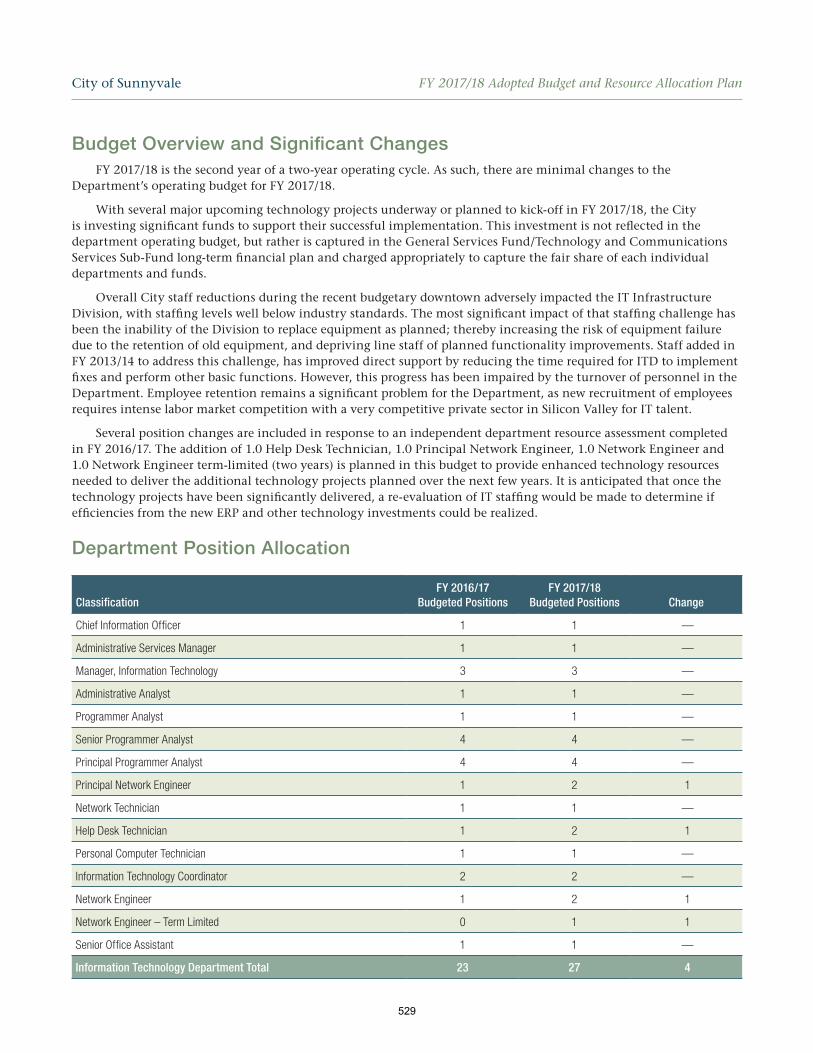
Budget Overview and Significant ChangesFY 2017/18 is the second year of a two-year operating cycle. As such, there are minimal changes to the
Department’s operating budget for FY 2017/18.
With several major upcoming technology projects underway or planned to kick-off in FY 2017/18, the City is investing significant funds to support their successful implementation. This investment is not reflected in the department operating budget, but rather is captured in the General Services Fund/Technology and Communications Services Sub-Fund long-term financial plan and charged appropriately to capture the fair share of each individual departments and funds.
Overall City staff reductions during the recent budgetary downtown adversely impacted the IT Infrastructure Division, with staffing levels well below industry standards. The most significant impact of that staffing challenge has been the inability of the Division to replace equipment as planned; thereby increasing the risk of equipment failure due to the retention of old equipment, and depriving line staff of planned functionality improvements. Staff added in FY 2013/14 to address this challenge, has improved direct support by reducing the time required for ITD to implement fixes and perform other basic functions. However, this progress has been impaired by the turnover of personnel in the Department. Employee retention remains a significant problem for the Department, as new recruitment of employees requires intense labor market competition with a very competitive private sector in Silicon Valley for IT talent.
Several position changes are included in response to an independent department resource assessment completed in FY 2016/17. The addition of 1.0 Help Desk Technician, 1.0 Principal Network Engineer, 1.0 Network Engineer and 1.0 Network Engineer term-limited (two years) is planned in this budget to provide enhanced technology resources needed to deliver the additional technology projects planned over the next few years. It is anticipated that once the technology projects have been significantly delivered, a re-evaluation of IT staffing would be made to determine if efficiencies from the new ERP and other technology investments could be realized.
Department Position Allocation
ClassificationFY 2016/17
Budgeted PositionsFY 2017/18
Budgeted Positions Change
Chief Information Officer 1 1 —
Administrative Services Manager 1 1 —
Manager, Information Technology 3 3 —
Administrative Analyst 1 1 —
Programmer Analyst 1 1 —
Senior Programmer Analyst 4 4 —
Principal Programmer Analyst 4 4 —
Principal Network Engineer 1 2 1
Network Technician 1 1 —
Help Desk Technician 1 2 1
Personal Computer Technician 1 1 —
Information Technology Coordinator 2 2 —
Network Engineer 1 2 1
Network Engineer – Term Limited 0 1 1
Senior Office Assistant 1 1 —
Information Technology Department Total 23 27 4
City of Sunnyvale FY 2017/18 Adopted Budget and Resource Allocation Plan
529

This Page Intentionally Blank
530

Information Technology Department Performance Indicators2011 Consolidated General Plan Goals:
This department provides administrative and/or internal services within the City. As such, its indicators are not tied to General Plan goals and instead are developed to optimize the level of internal/administrative support service provided.
FY 2013/14 Results
FY 2014/15 Results
FY 2015/16 Results
INFORMATION TECHNOLOGY
WORKLOAD INDICATORS
Number of new systems and/or applications implemented. 13 12 10
Number of major business system upgrades. [New in FY 2012/13] 21 13 12
Number of business applications supported. 106 125 130
Number of service requests. 6,557 5,887 5,939
Number of ongoing system maintenance tasks. [New in FY 2012/13] 4,290 4,732 4,950
Number of desktop computers provided and maintained. 1,026 1,196 1,218
Number of servers (stand alone and virtualized enterprise) maintained and administered. 185 203 240
Number of network devices maintained and administered. 135 135 160
Number of requests for technology equipment acquisitions. 153 71 94
Number of IT project requests. [New in FY 2012/13] 18 20 22
Number of IT service contracts managed. [New in FY 2012/13] 208 201 163
Number of Telecommunications Franchise service requests. 49 4 N/A
PERFORMANCE INDICATORS
Business system uptime excluding planned maintenance shutdowns. 99.69% 99.99% 99.87%
Percent of total time that the City’s computing environment (network, servers, desktops) is available, with a goal of 99.999%.
99.999% 99.999% 99.838%
Percent of total time that the City’s voice communications services (telephone, voicemail, radio) are available, with a goal of 100%.
100% 100% 100%
Percent of total time that the City’s e-mail system and Internet services are available. 99.999% 99.999% 99.919%
Percent of critical service requests resolved within 1 day, with a goal of 100%. 95% 97% 100%
Percent of non-critical services requests resolved within 5 business days. 68% 74% 80%
Helpdesk Response
a. Number of service requests. 2,340 2,211 2,307
b. Percent of service requests resolved within 1 hour. 44% 36% 28%
c. Percent of service requests assigned to service technician within one hour. N/A N/A N/A
d. Number of customers served. 527 473 476
City of Sunnyvale FY 2017/18 Adopted Budget and Resource Allocation Plan
531
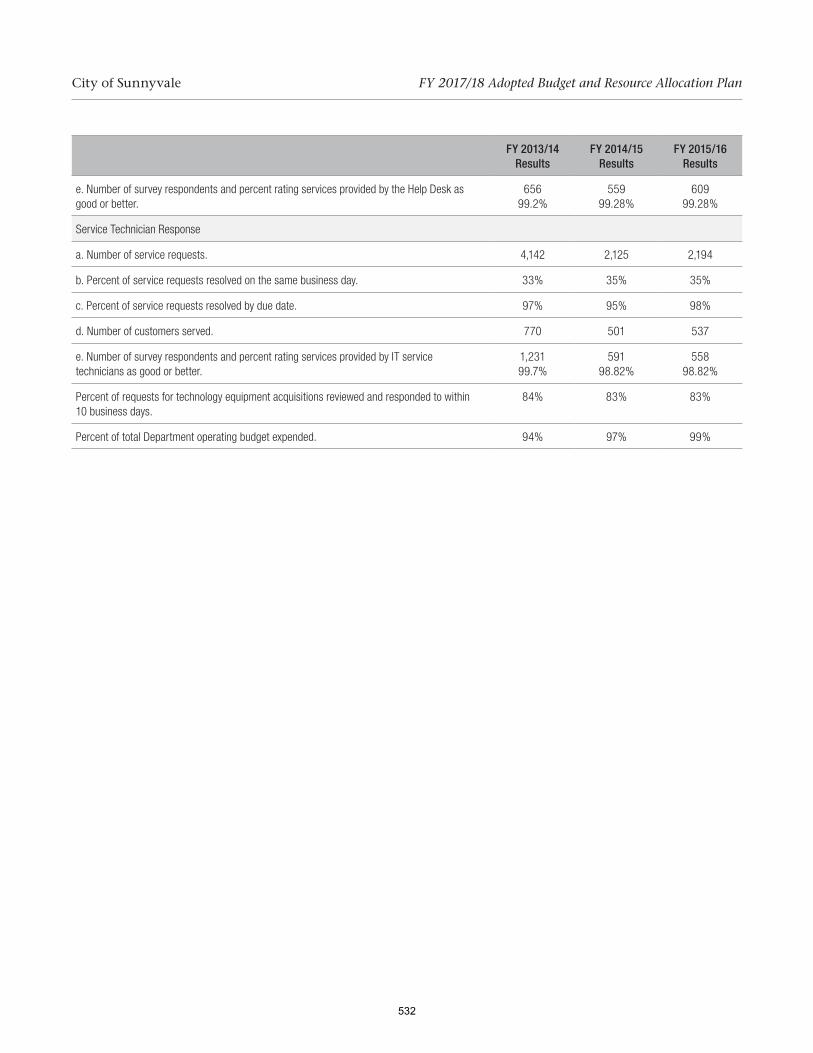
FY 2013/14 Results
FY 2014/15 Results
FY 2015/16 Results
e. Number of survey respondents and percent rating services provided by the Help Desk as good or better.
656 99.2%
559 99.28%
609 99.28%
Service Technician Response
a. Number of service requests. 4,142 2,125 2,194
b. Percent of service requests resolved on the same business day. 33% 35% 35%
c. Percent of service requests resolved by due date. 97% 95% 98%
d. Number of customers served. 770 501 537
e. Number of survey respondents and percent rating services provided by IT service technicians as good or better.
1,231 99.7%
591 98.82%
558 98.82%
Percent of requests for technology equipment acquisitions reviewed and responded to within 10 business days.
84% 83% 83%
Percent of total Department operating budget expended. 94% 97% 99%
City of Sunnyvale FY 2017/18 Adopted Budget and Resource Allocation Plan
532

Program 746 - IT Services and Support
Program Performance BudgetCity of Sunnyvale
Service Delivery Plan 74604 - IT Operations
Budget2015/2016
Actual2014/2015
Actual2015/2016
Current2016/2017 2017/2018
Plan
Activity 746400 - Resolve Requests for ServicesProduct: A Service Request [Deleted]
1,347,030.946,195.00
11,240.00
1,681,335.290.00
14,864.17
1,415,040.920.00
11,880.00
1,818,121.980.00
14,960.00
1,771,682.435,651.00
16,002.83
Costs:Products: Hours:
Activity 746410 - System Maintenance Tasks
3,524,043.670.00
11,670.00
2,578,713.580.00
4,478.84
3,810,286.250.00
12,162.00
4,233,077.860.00
13,658.00
2,358,958.540.00
4,094.24
Costs:Products: Hours:
22,910.00
4,871,074.61 4,260,048.87
19,343.01
5,225,327.17 6,051,199.84
Totals for Service Delivery Plan 74604 - IT Operations
4,130,640.97
20,097.07Hours:
Costs:
24,042.00 28,618.00
533
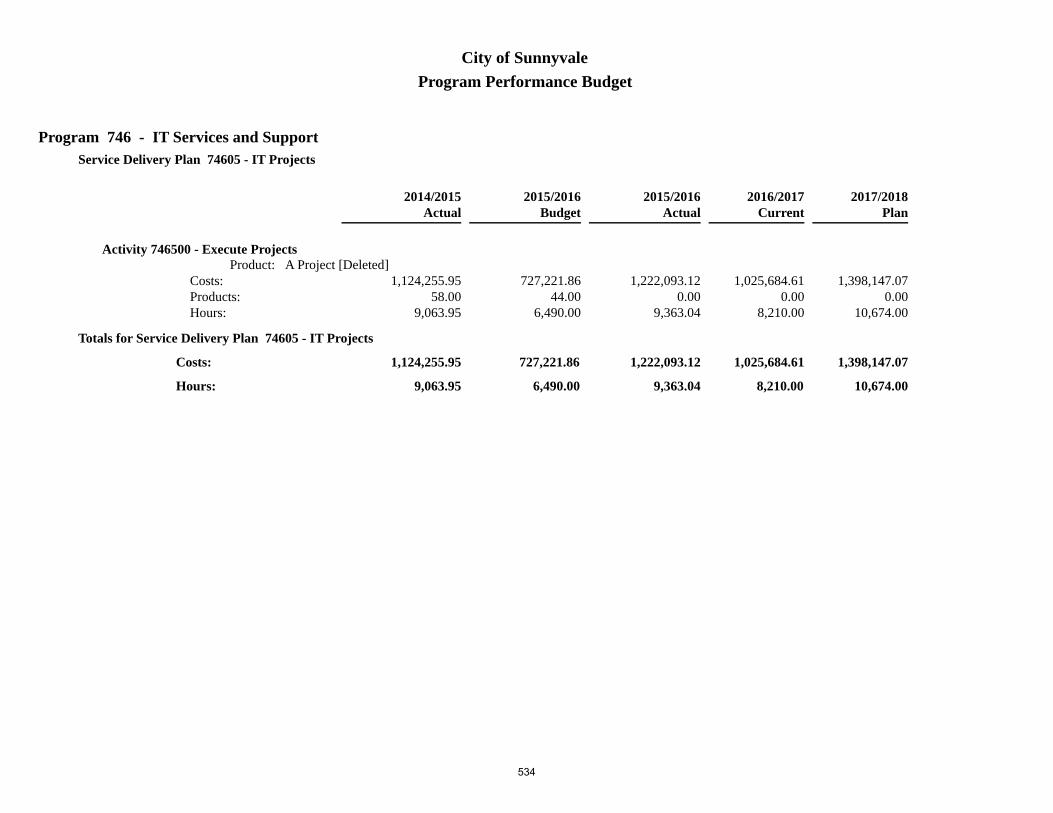
Program 746 - IT Services and Support
Program Performance BudgetCity of Sunnyvale
Service Delivery Plan 74605 - IT Projects
Budget2015/2016
Actual2014/2015
Actual2015/2016
Current2016/2017 2017/2018
Plan
Activity 746500 - Execute ProjectsProduct: A Project [Deleted]
727,221.8644.00
6,490.00
1,222,093.120.00
9,363.04
1,025,684.610.00
8,210.00
1,398,147.070.00
10,674.00
1,124,255.9558.00
9,063.95
Costs:Products: Hours:
6,490.00
727,221.86 1,222,093.12
9,363.04
1,025,684.61 1,398,147.07
Totals for Service Delivery Plan 74605 - IT Projects
1,124,255.95
9,063.95Hours:
Costs:
8,210.00 10,674.00
534
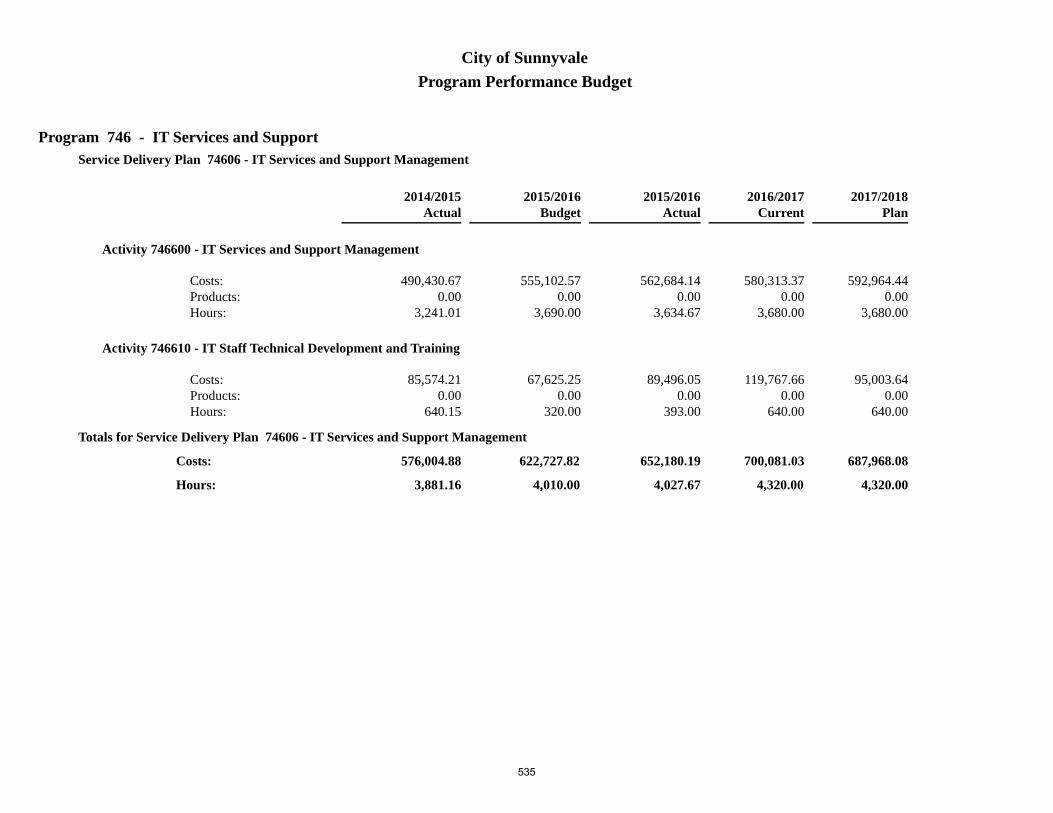
Program 746 - IT Services and Support
Program Performance BudgetCity of Sunnyvale
Service Delivery Plan 74606 - IT Services and Support Management
Budget2015/2016
Actual2014/2015
Actual2015/2016
Current2016/2017 2017/2018
Plan
Activity 746600 - IT Services and Support Management
555,102.570.00
3,690.00
562,684.140.00
3,634.67
580,313.370.00
3,680.00
592,964.440.00
3,680.00
490,430.670.00
3,241.01
Costs:Products: Hours:
Activity 746610 - IT Staff Technical Development and Training
67,625.250.00
320.00
89,496.050.00
393.00
119,767.660.00
640.00
95,003.640.00
640.00
85,574.210.00
640.15
Costs:Products: Hours:
4,010.00
622,727.82 652,180.19
4,027.67
700,081.03 687,968.08
Totals for Service Delivery Plan 74606 - IT Services and Support Management
576,004.88
3,881.16Hours:
Costs:
4,320.00 4,320.00
535

Program 746 - IT Services and Support
Program Performance BudgetCity of Sunnyvale
Service Delivery Plan 74607 - IT Department Administration
Budget2015/2016
Actual2014/2015
Actual2015/2016
Current2016/2017 2017/2018
Plan
Activity 746700 - Management and Administrative Support Services
835,394.770.00
6,770.00
889,546.800.00
7,129.19
901,274.940.00
7,140.00
935,473.600.00
7,140.00
860,174.250.00
7,574.09
Costs:Products: Hours:
Activity 746710 - Staff Development and Training
0.000.000.00
6,060.670.00
49.73
16,248.330.00
340.00
16,886.740.00
340.00
8,636.350.00
95.62
Costs:Products: Hours:
Activity 746720 - Franchise and Carrier Management
44,484.720.00
400.00
3,918.300.00
36.16
9,096.460.00
90.00
9,378.140.00
90.00
15,961.210.00
140.31
Costs:Products: Hours:
7,170.00
879,879.49 899,525.77
7,215.08
926,619.73 961,738.48
Totals for Service Delivery Plan 74607 - IT Department Administration
884,771.81
7,810.02Hours:
Costs:
7,570.00 7,570.00
7,100,903.78
40,580.00
7,033,847.95
39,948.80
6,715,673.61
40,852.20
Costs:
Hours: 44,142.00 51,182.00
7,877,712.54 9,099,053.47
Totals for Program 746
536

Library and Community Services

Library and Community Services
Department DescriptionThe Department of Library and Community Services (LCS) encourages the growth and development of a strong
community by providing life-long learning opportunities, safe and welcoming spaces for community engagement and life skills support for persons of all ages and abilities.
One of the few combined Library and Community Services Departments in the State, the Department provides a continuum of library, recreation and community services to inspire healthy living, a love of learning, and access to community information, programs and resources. The Library Division provides services from a central facility open 7 days a week, and online services are available 24/7. The Community Services Division offers programs in arts, sports, fitness, and aquatics, as well as youth and family services. In addition, the Community Services Division oversees facility rentals, the citywide Special Event Permitting process, produces the annual State of the City event and coordinates the Community Grant Program.
The Community Services Division operates primarily at the Sunnyvale Community Center complex (which includes the Recreation Center, Sunnyvale Senior Center, Indoor Sports Center, Sunnyvale Theatre and Creative Arts Center) and at the Columbia Neighborhood Center. The Division partners with local schools, non-profits and neighborhood associations to maximize its reach and impact in building a stronger Sunnyvale community.
In addition, the Department provides staff support to the Library Board of Trustees, the Parks and Recreation Commission, and the Arts Commission.
LIBRARY DIVISION
General Information
Number of books and other library materials checked out during FY 2015/16: 2,396,689
Number of Library patrons who visited during FY 2015/16: 669,796
Number of logins to the Internet from Library PCs during FY 2015/16: 85,105
Number of people attending Library programs during FY 2015/16: 47,572
Size of Library’s facility: 60,800 sq. ft.
Programs and ServicesThe Library Program is organized into six service delivery plans: Borrower Services/Circulation, Library Services
for Adults, Library Services for Children and Teens, Technology Services, Prepare Library Materials for the Public, and Management, Supervisory and Administrative Support Services.
Borrower Service/Circulation
The Library enables customers to access and borrow library materials by checking items in/out, renewing items, shelving returned items to their proper location, and processing reserved items and materials requested from other libraries for customers. Staff encourages timely return of materials by notifying borrowers of overdue items, sending replacement bills for items long overdue, and collecting fines/fees. Staff also keeps existing library customer accounts updated and issues library cards to new borrowers. In addition, staff delivers materials to a resident’s home if that person is unable to come to the Library due to physical disability.
City of Sunnyvale FY 2017/18 Adopted Budget and Resource Allocation Plan
537

Library Services for Adults
The Library enhances the use of library materials and information resources for adults by providing one-on-one assistance locating and utilizing those resources as well as providing programming in support of community interests and educational pursuits. Staff attends community events and meetings to promote Library services for adults. The Library provides quality adult collections by selecting and acquiring new and relevant materials in a wide variety of formats in response to community interest and demand. Staff evaluates the collection areas in terms of age, relevancy and condition.
Library Services for Children and Teens
The Library provides the same services as discussed in the paragraph above to children and teens. Resources are leveraged with those of the Community Services Division and local non-profit organizations to provide family literacy programs at the Columbia Neighborhood Center.
Technology Services
During the last few years, the Library has increased its online service delivery and maintained patron access to computers. At the Library, computers, photocopiers and other equipment provide access to information and services. Through the Library website, patrons have access to an online catalog and mobile app. The catalog allows customers to search for library materials, magazine and newspaper articles, and e-Books. The website and app allow customers to manage their account, renew materials, place items on hold, request materials from other libraries, pay fines, and register for new library cards. Technology Services maintains all systems and equipment in working order to ensure continuity of services.
Prepare Library Materials for the Public
The Library prepares materials for easy access and use by cataloging new materials accurately using national standards; updating the catalog to keep it current; physically processing new books, media items, periodicals and newspapers; and extending the life of materials through basic repair and rebinding. Staff also orders and receives materials, processes invoices and monitors purchases.
Management, Supervisory, and Administrative Support Services
The Library delivers cohesive and cost-effective operations of the Library facility, maintaining a safe and welcoming environment for customers and staff. High-quality customer service is provided through programs and services designed to meet community needs. Staff provides leadership and manages employees to support the overall effectiveness and efficiency of service delivery. The financial condition and results of Library programs are monitored and analyzed to ensure optimal use of resources. Staff explores options for grants in order to supplement services with non-City funding. The Library partners with civic groups, the local business community, City departments, the Board of Library Trustees, and others to effectively inform the community about the services and resources available to them.
City of Sunnyvale FY 2017/18 Adopted Budget and Resource Allocation Plan
538
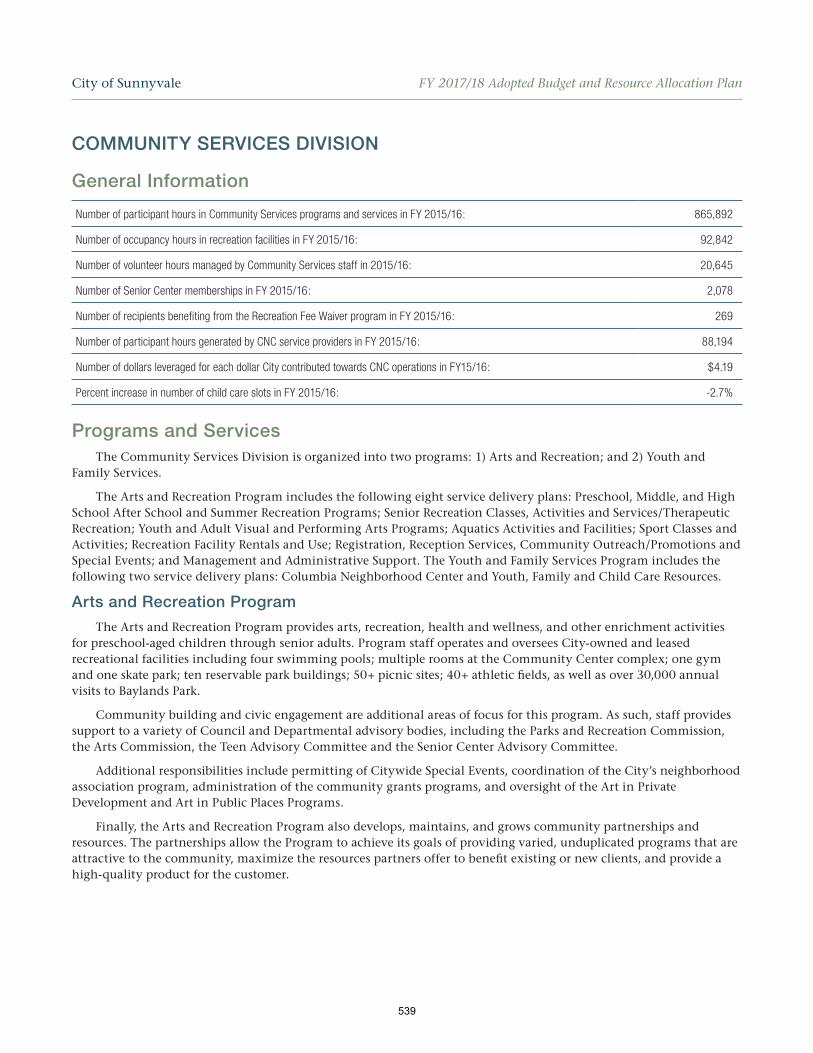
COMMUNITY SERVICES DIVISION
General Information
Number of participant hours in Community Services programs and services in FY 2015/16: 865,892
Number of occupancy hours in recreation facilities in FY 2015/16: 92,842
Number of volunteer hours managed by Community Services staff in 2015/16: 20,645
Number of Senior Center memberships in FY 2015/16: 2,078
Number of recipients benefiting from the Recreation Fee Waiver program in FY 2015/16: 269
Number of participant hours generated by CNC service providers in FY 2015/16: 88,194
Number of dollars leveraged for each dollar City contributed towards CNC operations in FY15/16: $4.19
Percent increase in number of child care slots in FY 2015/16: -2.7%
Programs and ServicesThe Community Services Division is organized into two programs: 1) Arts and Recreation; and 2) Youth and
Family Services.
The Arts and Recreation Program includes the following eight service delivery plans: Preschool, Middle, and High School After School and Summer Recreation Programs; Senior Recreation Classes, Activities and Services/Therapeutic Recreation; Youth and Adult Visual and Performing Arts Programs; Aquatics Activities and Facilities; Sport Classes and Activities; Recreation Facility Rentals and Use; Registration, Reception Services, Community Outreach/Promotions and Special Events; and Management and Administrative Support. The Youth and Family Services Program includes the following two service delivery plans: Columbia Neighborhood Center and Youth, Family and Child Care Resources.
Arts and Recreation Program
The Arts and Recreation Program provides arts, recreation, health and wellness, and other enrichment activities for preschool-aged children through senior adults. Program staff operates and oversees City-owned and leased recreational facilities including four swimming pools; multiple rooms at the Community Center complex; one gym and one skate park; ten reservable park buildings; 50+ picnic sites; 40+ athletic fields, as well as over 30,000 annual visits to Baylands Park.
Community building and civic engagement are additional areas of focus for this program. As such, staff provides support to a variety of Council and Departmental advisory bodies, including the Parks and Recreation Commission, the Arts Commission, the Teen Advisory Committee and the Senior Center Advisory Committee.
Additional responsibilities include permitting of Citywide Special Events, coordination of the City’s neighborhood association program, administration of the community grants programs, and oversight of the Art in Private Development and Art in Public Places Programs.
Finally, the Arts and Recreation Program also develops, maintains, and grows community partnerships and resources. The partnerships allow the Program to achieve its goals of providing varied, unduplicated programs that are attractive to the community, maximize the resources partners offer to benefit existing or new clients, and provide a high-quality product for the customer.
City of Sunnyvale FY 2017/18 Adopted Budget and Resource Allocation Plan
539

Youth and Family Services Program
The Youth and Family Services Program is based out of the Columbia Neighborhood Center (CNC). The City of Sunnyvale operates CNC in collaboration with the Sunnyvale School District, non-profit organizations, and community businesses to provide a connected network of services and programs in the areas of community education, mental health services, health care, recreation, and youth and neighborhood safety. The philosophy behind this web of services is to provide the support that children in the service area need to develop the life skills necessary to be successful in school and beyond.
CNC focuses on serving at-risk youth attending Bishop, Fairwood, Lakewood, San Miguel, and Columbia schools, as well as families with limited access to basic services residing in the Center’s service area. The MayView Community Health Clinic offers a satellite facility at CNC. The Center and its partners also promote a strong community through events and activities for the neighborhood. The Columbia Neighborhood Center Joint Task Force, CNC’s governance and oversight board, includes representation by the Sunnyvale School District Superintendent, the Assistant City Manager, the Director of Library and Community Services, and departmental staff. The CNC Community Advisory Committee, whose members are appointed by the Joint Task Force, advises CNC staff on community needs of the service area.
In addition, the Youth and Family Services offers programs and services that support the City’s child care providers, families with young children, Citywide youth and family issues, and the Child Care Staff Advisory Board, which acts in an advisory capacity to City staff on early care and education topics, are also based at CNC.
Department Budget Summary
Library and Community Services
Fund/Program Actual
2014/15Budget
2015/16Actual
2015/16Budget
2016/17Budget
2017/18
General Fund
Arts and Recreation 7,697,706 8,152,617 8,040,776 8,673,951 9,024,358
Library 7,932,159 8,550,171 8,225,752 8,730,564 9,479,444
Youth and Family Services 353,613 350,919 310,738 360,128 379,013
Youth and Neighborhood Services
Youth and Family Services 719,789 763,619 739,411 839,688 870,152
Development Enterprise Fund
Arts and Recreation Programs 27,957 30,386 15,728 32,716 34,809
TOTAL EXPENDITURES 16,731,224 17,847,712 17,332,405 18,637,047 19,787,776
City of Sunnyvale FY 2017/18 Adopted Budget and Resource Allocation Plan
540

Budget Overview and Significant ChangesFY 2017/18 is the second year of a two-year operating cycle. As such, there were no significant changes to the
Department’s operating budget for FY 2017/18.
FY 2017/18 combined budgeted expenditures for all three programs in the Library and Community Services Department has risen slightly over 5% from the current FY 2016/17 budget; and increased about 13.6%, as compared to FY 2015/16 actual results. Overall, staff hours remain the same from current FY 2016/17; and have increased 7.3% over FY 2015/16 actual results.
Having experienced multiple vacancies over the past year, the Department will continue to analyze its service delivery model and will reallocate resources accordingly, to realize both operational efficiencies and improved responsiveness to changing community needs.
Library Program
Overall, the Library Program budget has been adjusted for inflation and reflects an increase of expenditures by 7.9% in FY 2017/18, as compared to FY 2016/17. Collection expenditures, which had been temporarily augmented by $60,000 per year, have been returned to budgeted amount of $748,181 in FY 2017/18.
The reallocation of savings in goods and services also accounted for a $16,359 reduction that was necessary to offset the increase in the Department of Information Technology’s budget due to the migration to Innovative Sierra ($5,331), as well as the connection of the Library to California’s broadband network ($11,028).
Community Services Programs
Arts and Recreation Program
Overall budget costs have been adjusted for inflation and are up 3.1% for the Program as compared to FY 20/16/17 plan, and 11.96% higher than FY 15/16 actual results. There are no changes in service levels from FY2016/17.
Two large capital projects are planned in the budget that will impact operations. The Washington Pool project may require the pool to be closed for a summer, with the timing of the project yet to be finalized. In this case, significant operational savings are not anticipated but revenues will likely be negatively impacted depending on the time of the actual pool closure. Additionally, the Community Center Infrastructure project will likely impact facility reservations, as buildings are taken offline temporarily, in a phased fashion between July 2017 and January 2018. In this case, significant operational savings are not anticipated, but revenues will likely be negatively impacted.
Revenue is an important component of the Program. Looking at expenses alone does not present a complete picture of its performance. This Program has historically underspent budgeted expenditures and revenue has consistently met or exceeded all targets.
Youth and Family Services
The overall budget costs are up 1.04% for the Youth and Family Services Program, as compared to FY 2016/17 plan, and rose 18.4% as compared to FY 2015/16 actual results, with the increases in costs over 2015/16 actuals attributable to full staffing (2015/16 had significant temporary vacancies).
The Program budget provides for continuing services in line with past years for two components: 1) the neighborhood services; and 2) the Citywide family and child care resources.
City of Sunnyvale FY 2017/18 Adopted Budget and Resource Allocation Plan
541

Department Position Allocation
ClassificationFY 2016/17
Budgeted PositionsFY 2017/18
Budgeted Positions Change
Director of Library and Community Services 1 1 —
Community Services Manager 4 4 —
Superintendent of Community Services 1 1 —
Youth and Family Resources Manager 1 1 —
Library Circulation Manager 1 1 —
Administrative Librarian 2 2 —
Supervising Librarian 3 3 —
Administrative Aide 1 1 —
Administrative Aide-Confidential 1 1 —
Administrative Analyst 1 1 —
Librarian 10 10 —
Library Assistant 6 6 —
Community Services Coordinator II 17 17 —
Community Services Coordinator I 1 1 —
Senior Library Assistant 1 1 —
Facility Attendant I 2 2 —
Facility Attendant II 1 1 —
Office Assistant 1 1 —
Office Clerk 1 1 —
Principal Office Assistant 1 1 —
Senior Office Assistant 5 5 —
Staff Office Assistant 1 1 —
Part-Time Office Assistant 2 2 —
Part-Time Staff Office Assistant 1 1 —
Part-Time Senior Office Assistant 1 1 —
Part-Time Librarian 6 6 —
Part-Time Library Specialist I 6 6 —
Part-Time Library Specialist III 20 20 —
Part-Time Administrative Analyst 1 1 —
Library and Community Services Department Total 100 100 —
City of Sunnyvale FY 2017/18 Adopted Budget and Resource Allocation Plan
542

Library and Community Services Performance Indicators2011 Consolidated General Plan Goals: Chapter 4, Community Character (CC)
Goal CC-7: Appropriate Library FacilitiesGoal CC-8: Broad and Diverse Library Collection Goal CC-9: Appropriate Arts FacilitiesGoal CC-10: High Quality Recreation Programming Goal CC-11: Prioritization for Recreation ProgrammingGoal CC-12: Maximize access to recreation services, facilities, and amenities
Please refer to the General Plan Executive Summary for further details on goals
General Plan Goal
FY 2013/14 Results
FY 2014/15 Results
FY 2015/16 Results
DEPARTMENT OF LIBRARY & COMMUNITY SERVICES
PERFORMANCE INDICATORS
Percent of total department planned operating budget expended. 93.1% 96.4% 97.2%
LIBRARY
WORKLOAD INDICATORS
Number of library programs for adults. CC-7, CC-8 251 285 379
Number of library programs for children, teens and families. CC-7, CC-8 613 563 584
Average circulation of library materials per Sunnyvale resident. [Deleted in FY 2014/15]
CC-8 18 N/A N/A
Average number of library visits annually per Sunnyvale resident. [Deleted in FY 2014/15]
CC-7, CC-8 5 N/A N/A
Number of books circulated. CC-8 2,711,856 2,576,329 2,396,689
Number of library visitors. CC-7, CC-8 707,922 699,128 669,796
PERFORMANCE INDICATORS
Number of customer survey respondents and percent rating Library services as good or better.[1]
CC-7, CC-8 N/A 198 86%
N/A
Number of customer survey respondents and percent rating programs for adults as good or better.
CC-7, CC-8 675 96%
433 98%
495 97%
Percent of library materials re-shelved within 48 hours after check-in. CC-8 99% 98% 97%
Average number of days from receipt of materials to availability. CC-8 11 12 11
Percent of total Library operating budget expended. 93% 96% 96%
ARTS AND RECREATION
WORKLOAD INDICATORS
Number of youth and teen participant hours in arts and recreation programs, including preschool, elementary, middle school and high school.
CC-10, CC-11 379,367 356,897 370,092
City of Sunnyvale FY 2017/18 Adopted Budget and Resource Allocation Plan
543

General Plan Goal
FY 2013/14 Results
FY 2014/15 Results
FY 2015/16 Results
Number of adult participant hours in arts and recreation programs (may include participation by seniors and older teens).
CC-10, CC-11 451,611 410,416** 407,606
Number of duplicated enrollees. [Deleted in FY 2014/15] CC-10, CC-11 237,843 N/A N/A
Number of volunteer hours managed by Community Services staff. CC-10 21,171 21,418 20,645
Number of recipients benefiting from the Recreation Fee Waiver Program. CC-12 224 211 269
Number of occupancy hours from rentals of recreation facilities. CC-9, CC-10, CC-11, CC-12
96,517 103,122 92,842
Number of special event applications received. CC-11, CC-12 43 52 41
Number of neighborhood grant applications received. CC-11, CC-12 10 8 11
PERFORMANCE INDICATORS
Number of customer survey respondents and percent rating arts and recreation programs as good or better.
CC-10 7,345 96%
6,585 92.7%
6,908 90.3%
Number of customer survey respondents and percent rating arts and recreation facilities as good or better.
CC-9, CC-10 263 98%
153 98.7%
73 100%
Percent of cost recovery for the Arts and Recreation Program. CC-12 55% 57% 57%
Percent of total Arts and Recreation operating budget expended. 92% 96% 96%
YOUTH AND FAMILY RESOURCES
WORKLOAD INDICATORS
Number of participant hours generated by Columbia Neighborhood Center service providers in the areas of: Community Education, Mental Health Services, Recreation and Enrichment, Health Services, and Youth & Neighborhood Safety.
CC-10, CC-11, CC-12
102,025 99,712 88,194
PERFORMANCE INDICATORS
Number of adult customer survey respondents and percent rating a Youth & Family Resources sponsored program/activity/service as good or better.
CC-10, CC-11, CC-12
692 96%
327 97.9%
176 94.9%
Number of youth customer survey respondents and percent rating a Youth & Family Resources sponsored program/activity/service as good or better.
CC-10, CC-11, CC-12
807 81%
697 86.7%
1,092 91.5%
Number of customer survey respondents and percent rating medical services provided at Columbia Neighborhood Center (CNC) as good or better.
CC-10 89 96%
192 97.4%
326 96.9%
Amount of Grants and In-Kind Contributions Received. CC-12 $2,359,501 $2,567,225 $2,547,593
Number of customer survey respondents and percent rating the quality of child care information services as good or better.
CC-10, CC-12 37 97%
104 100%
92 100%
Percent of total Youth and Family Resources operating budget expended. 96% 99% 94%
[1] Resident satisfaction survey conducted bi-annually, with next survey scheduled for 2017. **Fremont Pool reporting process internally audited and standardized. Current number reflects comparable participation levels as previous years.
City of Sunnyvale FY 2017/18 Adopted Budget and Resource Allocation Plan
544

Program 527 - Youth and Family Services
Program Performance BudgetCity of Sunnyvale
Service Delivery Plan 52701 - Columbia Neighborhood Center
Budget2015/2016
Actual2014/2015
Actual2015/2016
Current2016/2017 2017/2018
Plan
Activity 527100 - Coordinate Education ProgramsProduct: A Program Coordinated
42,114.0413.00
383.50
69,092.6219.00
653.60
78,895.0615.00
617.00
81,728.4015.00
617.00
43,920.5717.00
278.40
Costs:Products: Hours:
Activity 527110 - Coordinate Health and Mental Health ServicesProduct: A Program Coordinated
85,614.2713.00
1,019.00
72,919.4813.00
1,035.31
109,945.0113.00
1,618.00
113,243.2613.00
1,618.00
51,132.5312.00
639.50
Costs:Products: Hours:
Activity 527130 - Administer Recreation and Enrichment ProgramsProduct: A Program Coordinated
94,489.0116.00
1,063.00
97,891.4916.00
830.40
109,503.6716.00
1,272.00
112,961.8616.00
1,272.00
85,964.6016.00
704.00
Costs:Products: Hours:
Activity 527150 - Provide Community Sports/Aquatics RecreationProduct: A Participant Hour
31,013.937,250.00
992.00
23,761.419,166.00
811.20
28,276.157,750.00
903.00
28,518.027,750.00
903.00
23,314.857,976.00
765.30
Costs:Products: Hours:
Activity 527180 - CNC Oversight and Advisory
21,267.770.00
210.00
23,439.930.00
282.50
20,901.360.00
195.00
21,703.420.00
195.00
24,922.700.00
224.00
Costs:Products: Hours:
545

Program 527 - Youth and Family Services
Program Performance BudgetCity of Sunnyvale
Service Delivery Plan 52701 - Columbia Neighborhood Center
Budget2015/2016
Actual2014/2015
Actual2015/2016
Current2016/2017 2017/2018
Plan
Activity 527200 - Provide Outreach, Information, and Referral to Services
69,872.730.00
714.00
90,300.300.00
1,020.00
81,111.000.00
845.00
85,167.360.00
845.00
101,602.000.00
1,120.00
Costs:Products: Hours:
Activity 527210 - Provide Neighborhood Events
54,251.810.00
529.50
75,090.990.00
942.40
73,418.710.00
760.00
76,615.100.00
760.00
87,113.560.00
948.00
Costs:Products: Hours:
Activity 527230 - Provide Facility Rentals
39,048.630.00
500.00
46,023.440.00
1,111.10
39,199.220.00
815.00
40,622.360.00
815.00
47,081.020.00
1,046.70
Costs:Products: Hours:
Activity 527270 - Management and Supervisory Services
87,699.800.00
697.50
61,577.430.00
469.00
77,507.400.00
600.00
78,509.000.00
600.00
67,221.470.00
523.70
Costs:Products: Hours:
Activity 527280 - Administrative Support
76,675.870.00
892.00
82,942.780.00
1,091.30
66,581.670.00
850.00
70,479.990.00
850.00
82,947.730.00
1,069.90
Costs:Products: Hours:
546

Program 527 - Youth and Family Services
Program Performance BudgetCity of Sunnyvale
Service Delivery Plan 52701 - Columbia Neighborhood Center
Budget2015/2016
Actual2014/2015
Actual2015/2016
Current2016/2017 2017/2018
Plan
Activity 527600 - Coordinate Other Programs/Services (Social, Neighborhood Safety, etc.)Product: A Program Coordinated
16,862.263.00
221.50
11,721.283.00
145.70
5,971.373.00
101.00
6,055.543.00
101.00
10,083.842.00
90.60
Costs:Products: Hours:
Activity 527610, 527611, 527612, 527613, 527614, 527615, 527616, 527617 - Provide Youth Recreation and EnrichmentProduct: A Participant Hour
144,708.671,844.002,578.20
84,650.124,728.001,748.20
148,377.6614,100.00
3,114.00
154,547.6814,100.00
3,114.00
94,483.867,571.001,843.60
Costs:Products: Hours:
9,800.20
763,618.79 739,411.27
10,140.71
839,688.28 870,151.99
Totals for Service Delivery Plan 52701 - Columbia Neighborhood Center
719,788.73
9,253.70Hours:
Costs:
11,690.00 11,690.00
547

Program 527 - Youth and Family Services
Program Performance BudgetCity of Sunnyvale
Service Delivery Plan 52702 - Youth, Family, and Child Care Resources
Budget2015/2016
Actual2014/2015
Actual2015/2016
Current2016/2017 2017/2018
Plan
Activity 527370 - Management and Supervisory Services
99,288.760.00
690.00
102,849.620.00
690.40
97,435.050.00
640.00
99,037.400.00
640.00
115,382.450.00
784.50
Costs:Products: Hours:
Activity 527380 - Administrative Support
41,337.620.00
510.00
43,029.460.00
569.00
49,583.780.00
600.00
52,936.380.00
600.00
41,052.870.00
543.40
Costs:Products: Hours:
Activity 527400 - Support Child Care ProvidersProduct: A Resource or a Program Developed
104,309.738.00
1,183.50
68,469.028.00
911.50
81,061.5410.00
885.00
86,382.6510.00
885.00
81,305.068.00
946.50
Costs:Products: Hours:
Activity 527410 - Support for Youth and FamiliesProduct: A Resource or a Program Developed
105,982.9214.00
1,198.50
96,389.9010.00
1,223.00
132,048.0810.00
1,478.00
140,656.1210.00
1,478.00
115,872.9512.00
1,336.10
Costs:Products: Hours:
3,582.00
350,919.03 310,738.00
3,393.90
360,128.45 379,012.55
Totals for Service Delivery Plan 52702 - Youth, Family, and Child Care Resources
353,613.33
3,610.50Hours:
Costs:
3,603.00 3,603.00
548
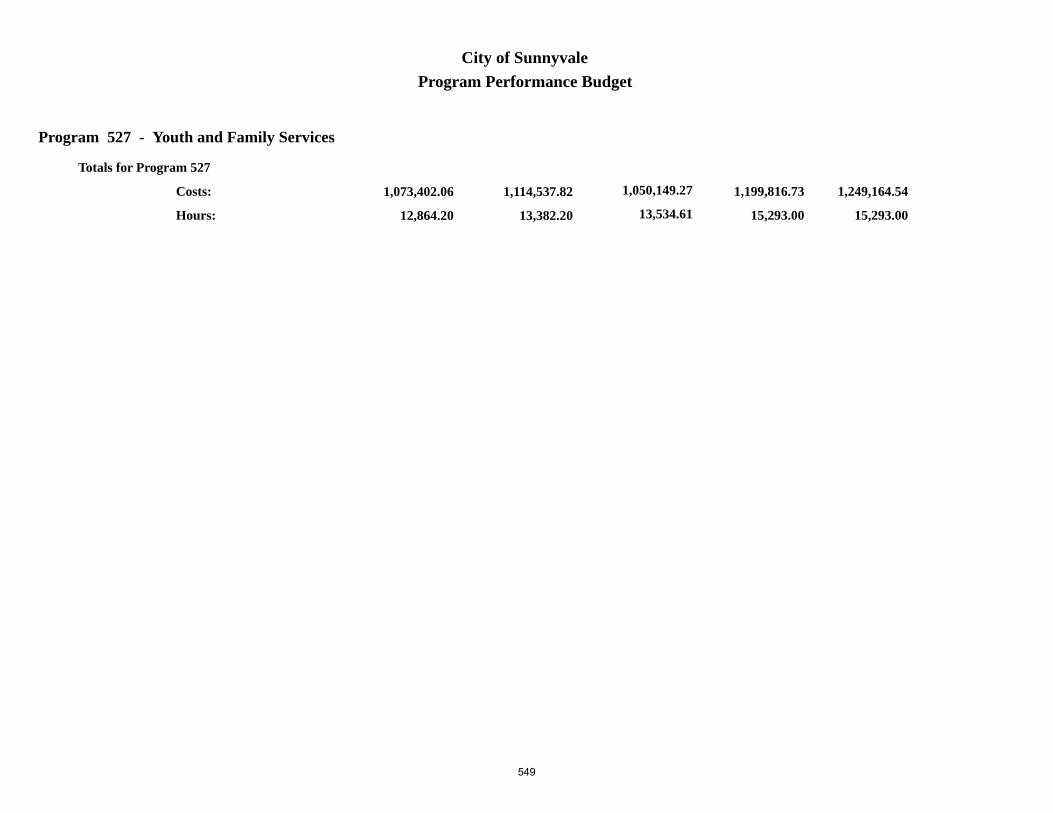
Program 527 - Youth and Family Services
Program Performance BudgetCity of Sunnyvale
1,114,537.82
13,382.20
1,050,149.27
13,534.61
1,073,402.06
12,864.20
Costs:
Hours: 15,293.00 15,293.00
1,199,816.73 1,249,164.54
Totals for Program 527
549

This Page Intentionally Blank
550

Program 620 - Library
Program Performance BudgetCity of Sunnyvale
Service Delivery Plan 62001 - Borrower Services/Circulation
Budget2015/2016
Actual2014/2015
Actual2015/2016
Current2016/2017 2017/2018
Plan
Activity 620100 - Check Out Library MaterialsProduct: An Item Checked Out or Renewed
1,419,730.232,750,000.00
19,772.00
1,396,519.262,396,689.00
19,452.50
1,493,404.812,600,000.00
20,137.00
1,683,079.292,600,000.00
20,137.00
1,380,870.772,576,329.00
19,146.40
Costs:Products: Hours:
Activity 620110 - Shelve Library MaterialsProduct: An Item Shelved
843,467.292,225,000.00
17,139.00
849,822.541,756,866.00
16,708.20
902,341.392,000,000.00
18,020.00
1,028,542.152,000,000.00
18,020.00
856,202.641,997,100.00
16,956.90
Costs:Products: Hours:
Activity 620120 - Circulate Materials through Interlibrary LoanProduct: An Item Borrowed from or Loaned to another Library
149,226.9821,000.00
1,940.00
113,791.9920,126.00
1,422.30
139,828.4621,000.00
1,300.00
149,164.5021,000.00
1,300.00
98,244.4120,056.00
1,225.10
Costs:Products: Hours:
Activity 620130 - Recovery of Overdue or Missing MaterialsProduct: A Notification of an Item to be Recovered
72,315.0251,000.00
720.00
83,726.3844,967.00
883.70
71,459.1947,000.00
690.00
75,799.8847,000.00
690.00
71,254.1847,522.00
681.20
Costs:Products: Hours:
Activity 620140 - Materials Delivery to Homebound ResidentsProduct: An Item Delivered
47,316.454,000.00
640.00
43,393.253,408.00
573.30
46,207.903,700.00
625.00
52,540.753,700.00
625.00
43,774.423,705.00
582.00
Costs:Products: Hours:
551

Program 620 - Library
Program Performance BudgetCity of Sunnyvale
40,211.00
2,532,055.97 2,487,253.42
39,040.00
2,653,241.75 2,989,126.57
Totals for Service Delivery Plan 62001 - Borrower Services/Circulation
2,450,346.42
38,591.60Hours:
Costs:
40,772.00 40,772.00
552

Program 620 - Library
Program Performance BudgetCity of Sunnyvale
Service Delivery Plan 62002 - Library Services for Adults
Budget2015/2016
Actual2014/2015
Actual2015/2016
Current2016/2017 2017/2018
Plan
Activity 620200 - Provide Services to AdultsProduct: A Response Given [Deleted]
925,260.2261,800.00
9,479.00
818,126.3574,075.00
8,413.10
1,013,841.660.00
10,150.00
1,104,699.390.00
10,150.00
804,218.9230,919.00
8,167.10
Costs:Products: Hours:
Activity 620210 - Create and Present Programs for AdultsProduct: A Program Presented to the Public
337,992.70220.00
3,274.00
238,084.62379.00
2,398.90
365,107.38260.00
3,470.00
393,437.75260.00
3,470.00
200,312.94285.00
1,984.10
Costs:Products: Hours:
Activity 620220 - Collection Management for Adults
0.000.000.00
0.000.000.00
751,346.490.00
1,637.00
769,848.710.00
1,637.00
0.000.000.00
Costs:Products: Hours:
12,753.00
1,263,252.92 1,056,210.97
10,812.00
2,130,295.53 2,267,985.85
Totals for Service Delivery Plan 62002 - Library Services for Adults
1,004,531.86
10,151.20Hours:
Costs:
15,257.00 15,257.00
553

Program 620 - Library
Program Performance BudgetCity of Sunnyvale
Service Delivery Plan 62003 - Library Services for Children and Teens
Budget2015/2016
Actual2014/2015
Actual2015/2016
Current2016/2017 2017/2018
Plan
Activity 620300 - Provide Services to Children and TeensProduct: A Response Given [Deleted]
656,924.9447,000.00
6,716.00
737,615.3738,448.00
7,732.50
716,553.800.00
7,192.00
780,727.720.00
7,192.00
668,948.2147,325.00
7,033.50
Costs:Products: Hours:
Activity 620310 - Create and Present Programs for Children and TeensProduct: A Program Presented to the Public
317,375.77650.00
3,010.00
164,653.33594.00
1,646.20
313,453.85600.00
2,850.00
334,841.05600.00
2,850.00
187,945.29563.00
1,949.00
Costs:Products: Hours:
Activity 620320 - Collection Management for Children and Teens
0.000.000.00
0.000.000.00
265,048.710.00
960.00
275,040.380.00
960.00
0.000.000.00
Costs:Products: Hours:
9,726.00
974,300.71 902,268.70
9,378.70
1,295,056.36 1,390,609.15
Totals for Service Delivery Plan 62003 - Library Services for Children and Teens
856,893.50
8,982.50Hours:
Costs:
11,002.00 11,002.00
554

Program 620 - Library
Program Performance BudgetCity of Sunnyvale
Service Delivery Plan 62004 - Acquire Library Materials for the Public
Budget2015/2016
Actual2014/2015
Actual2015/2016
Current2016/2017 2017/2018
Plan
Activity 620420 - Order and Receive Library Materials [Deleted]Product: An Item Received
214,598.6344,000.00
2,466.00
251,011.8645,350.00
3,008.10
0.000.000.00
0.000.000.00
238,405.4643,368.00
2,815.40
Costs:Products: Hours:
Activity 620430 - Select/Merchandise Library Materials - Adults [Deleted]Product: An Item Selected
716,472.7622,000.00
1,598.00
736,132.0620,275.00
1,402.70
0.000.000.00
0.000.000.00
615,297.3419,819.00
1,376.20
Costs:Products: Hours:
Activity 620440 - Select/Merchandise Library Materials - Child/Teens [Deleted]Product: An Item Selected
233,268.4720,000.00
654.00
312,957.3023,591.00
648.30
0.000.000.00
0.000.000.00
254,176.4720,727.00
412.30
Costs:Products: Hours:
Activity 620460 - Evaluate Materials-Repair/Replace/Discard - Adults [Deleted]Product: An Item Evaluated
47,201.0713,000.00
492.00
46,731.1112,597.00
516.90
0.000.000.00
0.000.000.00
30,929.9115,533.00
317.40
Costs:Products: Hours:
Activity 620470 - Evaluate Materials-Repair/Replace/Discard - Child/Teens [Deleted]Product: An Item Evaluated
40,294.0513,500.00
411.00
33,139.7918,704.00
349.10
0.000.000.00
0.000.000.00
20,766.8810,634.00
216.80
Costs:Products: Hours:
555
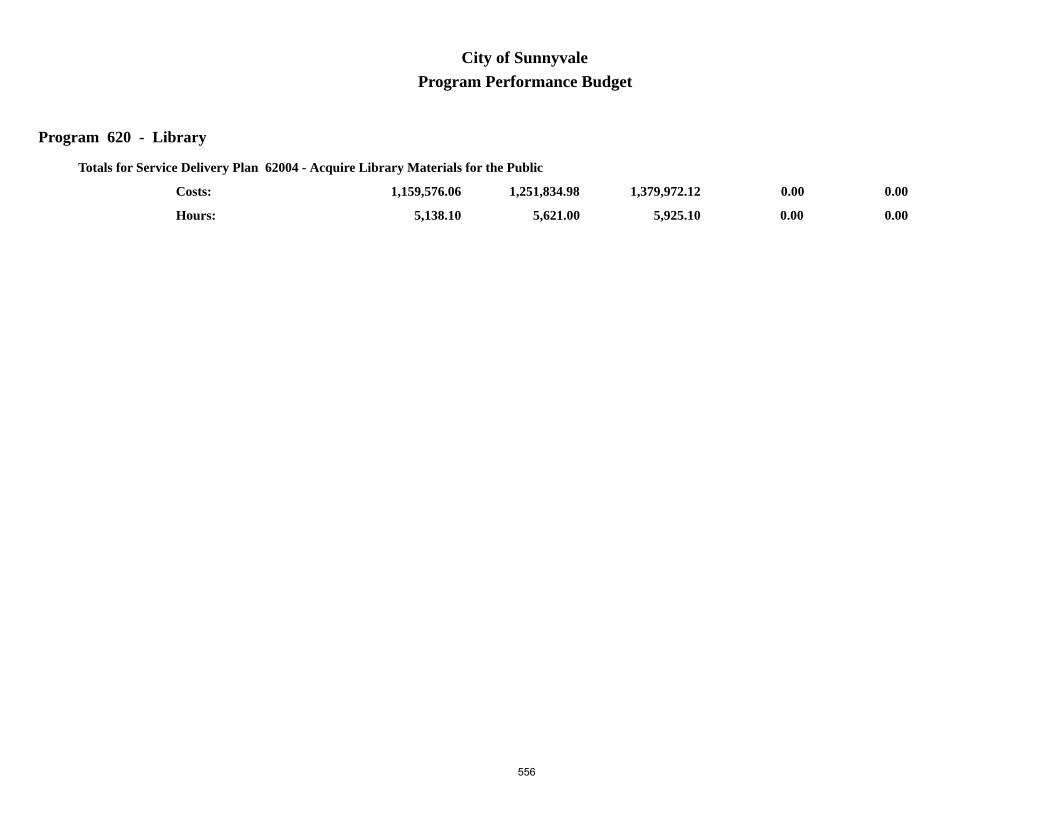
Program 620 - Library
Program Performance BudgetCity of Sunnyvale
5,621.00
1,251,834.98 1,379,972.12
5,925.10
0.00 0.00
Totals for Service Delivery Plan 62004 - Acquire Library Materials for the Public
1,159,576.06
5,138.10Hours:
Costs:
0.00 0.00
556

Program 620 - Library
Program Performance BudgetCity of Sunnyvale
Service Delivery Plan 62005 - Technology Services
Budget2015/2016
Actual2014/2015
Actual2015/2016
Current2016/2017 2017/2018
Plan
Activity 620450 - Provide/Maintain Technology to Access Library Services
428,858.700.00
3,743.00
464,368.310.00
3,445.00
382,028.690.00
3,424.00
404,448.690.00
3,424.00
358,397.640.00
2,547.40
Costs:Products: Hours:
3,743.00
428,858.70 464,368.31
3,445.00
382,028.69 404,448.69
Totals for Service Delivery Plan 62005 - Technology Services
358,397.64
2,547.40Hours:
Costs:
3,424.00 3,424.00
557

Program 620 - Library
Program Performance BudgetCity of Sunnyvale
Service Delivery Plan 62006 - Acquire and Prepare Library Materials for the Public
Budget2015/2016
Actual2014/2015
Actual2015/2016
Current2016/2017 2017/2018
Plan
Activity 620500 - Catalog TitlesProduct: A Title Cataloged
291,402.9017,000.00
2,864.00
242,786.3578,612.00
2,590.30
219,080.0926,500.00
2,240.00
242,152.1226,500.00
2,240.00
278,498.6857,523.00
2,616.70
Costs:Products: Hours:
Activity 620510 - Process Library MaterialsProduct: An Item Processed
265,574.2048,000.00
2,885.00
263,980.4547,595.00
2,982.30
297,682.9748,000.00
3,041.00
322,355.9748,000.00
3,041.00
253,181.0948,471.00
2,779.20
Costs:Products: Hours:
Activity 620520 - Repair Library MaterialsProduct: An Item Repaired or Discarded [Deleted]
60,803.189,000.00
921.00
53,893.958,235.00
788.20
49,643.610.00
750.00
57,783.550.00
750.00
55,911.608,558.00
814.10
Costs:Products: Hours:
Activity 620530 - Edit the Library CatalogProduct: An Item Record Deleted [Deleted]
165,080.6735,000.00
2,066.00
203,056.0844,172.00
2,582.90
166,263.850.00
2,104.00
183,159.820.00
2,104.00
153,917.0733,501.00
2,011.10
Costs:Products: Hours:
Activity 620540 - Order and Receive Library Materials
0.000.000.00
0.000.000.00
203,351.570.00
2,357.00
224,256.820.00
2,357.00
0.000.000.00
Costs:Products: Hours:
558

Program 620 - Library
Program Performance BudgetCity of Sunnyvale
8,736.00
782,860.95 763,716.83
8,943.70
936,022.09 1,029,708.28
Totals for Service Delivery Plan 62006 - Acquire and Prepare Library Materials for the Public
741,508.44
8,221.10Hours:
Costs:
10,492.00 10,492.00
559

Program 620 - Library
Program Performance BudgetCity of Sunnyvale
Service Delivery Plan 62008 - Library Department Management and Support
Budget2015/2016
Actual2014/2015
Actual2015/2016
Current2016/2017 2017/2018
Plan
Activity 620600 - Management and Supervisory Services
733,392.230.00
4,865.00
591,308.990.00
4,002.30
724,732.290.00
4,545.00
745,638.250.00
4,545.00
849,906.470.00
5,815.50
Costs:Products: Hours:
Activity 620610 - Administrative Support Services
499,497.900.00
4,620.00
506,507.320.00
3,784.20
511,540.490.00
4,635.00
545,738.810.00
4,635.00
448,718.370.00
4,077.60
Costs:Products: Hours:
Activity 620620 - Page Support for Library Operations
30,185.140.00
630.00
31,272.860.00
635.00
30,664.500.00
630.00
35,218.300.00
630.00
34,325.100.00
689.90
Costs:Products: Hours:
Activity 620630 - Staff Training and Development
53,931.380.00
481.00
42,872.700.00
271.30
66,982.070.00
479.00
70,969.900.00
479.00
27,955.180.00
205.40
Costs:Products: Hours:
10,596.00
1,317,006.65 1,171,961.87
8,692.80
1,333,919.35 1,397,565.26
Totals for Service Delivery Plan 62008 - Library Department Management and Support
1,360,905.12
10,788.40Hours:
Costs:
10,289.00 10,289.00
560

Program 620 - Library
Program Performance BudgetCity of Sunnyvale
8,550,170.88
91,386.00
8,225,752.22
86,237.30
7,932,159.04
84,420.30
Costs:
Hours: 91,236.00 91,236.00
8,730,563.77 9,479,443.80
Totals for Program 620
561

This Page Intentionally Blank
562
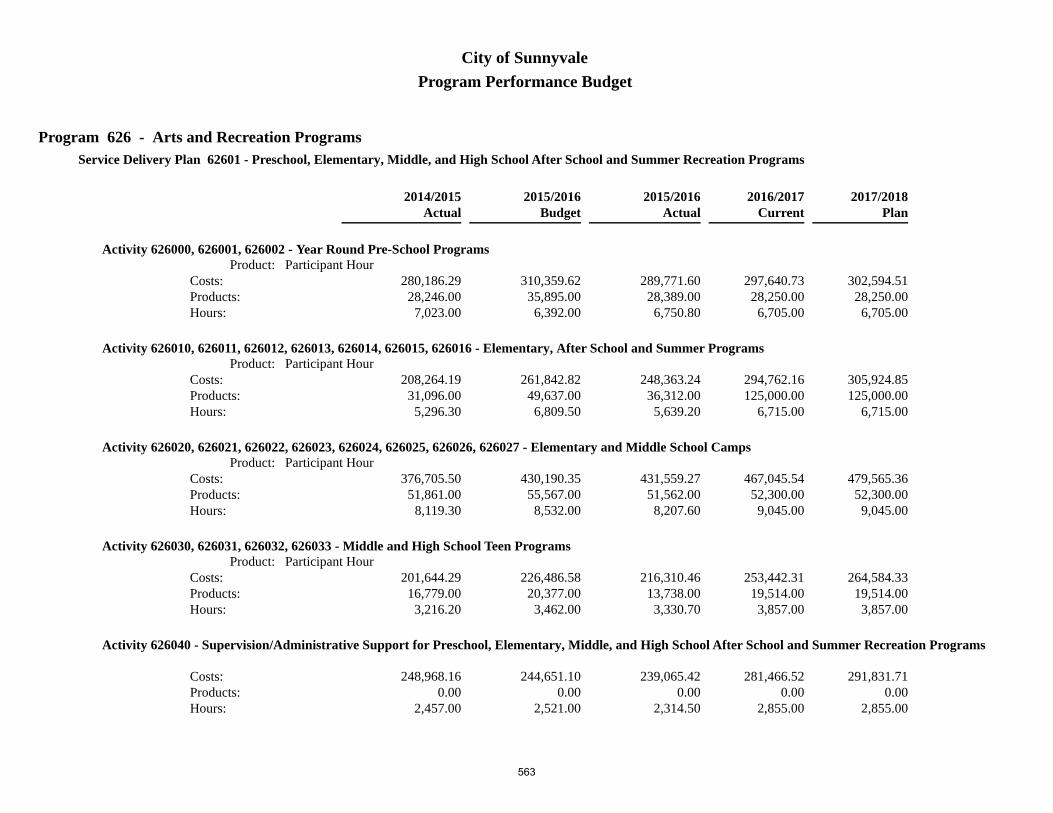
Program 626 - Arts and Recreation Programs
Program Performance BudgetCity of Sunnyvale
Service Delivery Plan 62601 - Preschool, Elementary, Middle, and High School After School and Summer Recreation Programs
Budget2015/2016
Actual2014/2015
Actual2015/2016
Current2016/2017 2017/2018
Plan
Activity 626000, 626001, 626002 - Year Round Pre-School ProgramsProduct: Participant Hour
310,359.6235,895.00
6,392.00
289,771.6028,389.00
6,750.80
297,640.7328,250.00
6,705.00
302,594.5128,250.00
6,705.00
280,186.2928,246.00
7,023.00
Costs:Products: Hours:
Activity 626010, 626011, 626012, 626013, 626014, 626015, 626016 - Elementary, After School and Summer ProgramsProduct: Participant Hour
261,842.8249,637.00
6,809.50
248,363.2436,312.00
5,639.20
294,762.16125,000.00
6,715.00
305,924.85125,000.00
6,715.00
208,264.1931,096.00
5,296.30
Costs:Products: Hours:
Activity 626020, 626021, 626022, 626023, 626024, 626025, 626026, 626027 - Elementary and Middle School CampsProduct: Participant Hour
430,190.3555,567.00
8,532.00
431,559.2751,562.00
8,207.60
467,045.5452,300.00
9,045.00
479,565.3652,300.00
9,045.00
376,705.5051,861.00
8,119.30
Costs:Products: Hours:
Activity 626030, 626031, 626032, 626033 - Middle and High School Teen ProgramsProduct: Participant Hour
226,486.5820,377.00
3,462.00
216,310.4613,738.00
3,330.70
253,442.3119,514.00
3,857.00
264,584.3319,514.00
3,857.00
201,644.2916,779.00
3,216.20
Costs:Products: Hours:
Activity 626040 - Supervision/Administrative Support for Preschool, Elementary, Middle, and High School After School and Summer Recreation Programs
244,651.100.00
2,521.00
239,065.420.00
2,314.50
281,466.520.00
2,855.00
291,831.710.00
2,855.00
248,968.160.00
2,457.00
Costs:Products: Hours:
563

Program 626 - Arts and Recreation Programs
Program Performance BudgetCity of Sunnyvale
27,716.50
1,473,530.47 1,425,069.99
26,242.80
1,594,357.26 1,644,500.76
Totals for Service Delivery Plan 62601 - Preschool, Elementary, Middle, and High School After School and Summer Recreation Programs
1,315,768.43
26,111.80Hours:
Costs:
29,177.00 29,177.00
564

Program 626 - Arts and Recreation Programs
Program Performance BudgetCity of Sunnyvale
Service Delivery Plan 62602 - Senior Recreation Classes, Activities and Services/Therapeutic Recreation
Budget2015/2016
Actual2014/2015
Actual2015/2016
Current2016/2017 2017/2018
Plan
Activity 626100, 626101, 626102, 626103, 626104, 626105, 626106, 626107, 626108 - Membership and Senior ServicesProduct: Participant Hour
394,509.80140,000.00
4,652.00
453,478.38135,192.30
5,718.00
485,840.39140,000.00
6,026.00
524,017.83140,000.00
6,026.00
488,564.73137,470.00
6,280.30
Costs:Products: Hours:
Activity 626110, 626111, 626112, 626113, 626114 - Senior Fee Based ActivitiesProduct: Participant Hour
390,089.9870,000.00
6,195.00
360,701.0947,747.00
5,027.10
417,154.2860,000.00
5,695.00
427,729.2860,000.00
5,695.00
377,455.2747,621.00
5,177.10
Costs:Products: Hours:
Activity 626120 - Care ManagementProduct: A Client Served
48,704.8545.00
900.00
50,270.45108.00883.00
135,976.82100.00
3,019.00
156,697.70100.00
3,019.00
48,243.44109.00900.00
Costs:Products: Hours:
Activity 626130, 626131, 626132 - Therapeutic RecreationProduct: Participant Hour
94,372.743,000.002,017.50
105,542.862,276.002,133.50
117,104.533,000.002,256.00
120,804.973,000.002,256.00
75,609.282,079.001,414.80
Costs:Products: Hours:
Activity 626140 - Supervision/Administrative Support for Senior Recreation Classes, Activities and Services/Therapeutic Recreation
137,273.850.00
1,352.00
145,941.140.00
1,307.50
135,609.500.00
1,282.00
138,344.660.00
1,282.00
148,180.090.00
1,403.60
Costs:Products: Hours:
565

Program 626 - Arts and Recreation Programs
Program Performance BudgetCity of Sunnyvale
15,116.50
1,064,951.22 1,115,933.92
15,069.10
1,291,685.52 1,367,594.44
Totals for Service Delivery Plan 62602 - Senior Recreation Classes, Activities and Services/Therapeutic Recreation
1,138,052.81
15,175.80Hours:
Costs:
18,278.00 18,278.00
566

Program 626 - Arts and Recreation Programs
Program Performance BudgetCity of Sunnyvale
Service Delivery Plan 62603 - Youth and Adult Visual and Performing Arts Program
Budget2015/2016
Actual2014/2015
Actual2015/2016
Current2016/2017 2017/2018
Plan
Activity 626200, 626201 - Adult Art ActivitiesProduct: Participant Hour
154,724.0746,000.00
2,221.00
169,548.8840,679.00
2,232.30
207,064.5844,000.00
2,623.00
224,940.7444,000.00
2,824.00
110,134.3946,217.00
1,342.50
Costs:Products: Hours:
Activity 626210, 626211 - PotteryProduct: Participant Hour
183,567.9215,100.00
2,781.00
180,661.3315,741.00
2,551.00
214,353.4917,351.00
3,330.00
223,430.7817,351.00
3,330.00
183,562.4214,688.00
2,580.50
Costs:Products: Hours:
Activity 626220 - Youth Arts ActivitiesProduct: Participant Hour
381,423.4431,000.00
2,595.20
215,832.2319,637.00
1,503.60
276,891.8820,890.00
2,344.00
293,405.4920,890.00
2,431.00
245,271.8621,913.00
1,563.10
Costs:Products: Hours:
Activity 626230 - Art in Public Construction
36,174.930.00
377.00
25,086.800.00
267.00
40,992.420.00
393.00
42,955.110.00
393.00
33,991.170.00
263.00
Costs:Products: Hours:
Activity 626250 - Supervision/Administrative Support for Youth and Adult Visual and Performing Arts Program
187,089.200.00
1,996.00
121,259.010.00
1,315.50
221,211.940.00
2,337.00
230,874.180.00
2,337.00
157,387.590.00
1,655.70
Costs:Products: Hours:
567

Program 626 - Arts and Recreation Programs
Program Performance BudgetCity of Sunnyvale
Service Delivery Plan 62603 - Youth and Adult Visual and Performing Arts Program
Budget2015/2016
Actual2014/2015
Actual2015/2016
Current2016/2017 2017/2018
Plan
Activity 626260 - Art in Private Development Program
30,386.380.00
345.00
15,727.630.00
164.50
32,715.800.00
368.00
34,809.300.00
368.00
27,957.390.00
304.40
Costs:Products: Hours:
10,315.20
973,365.94 728,115.88
8,033.90
993,230.11 1,050,415.60
Totals for Service Delivery Plan 62603 - Youth and Adult Visual and Performing Arts Program
758,304.82
7,709.20Hours:
Costs:
11,395.00 11,683.00
568

Program 626 - Arts and Recreation Programs
Program Performance BudgetCity of Sunnyvale
Service Delivery Plan 62604 - Aquatics Activities and Facilities
Budget2015/2016
Actual2014/2015
Actual2015/2016
Current2016/2017 2017/2018
Plan
Activity 626300 - Washington PoolProduct: Participant Hour
172,355.6122,000.00
5,104.00
204,578.8121,536.00
5,937.00
209,420.5222,250.00
6,190.80
210,753.9222,250.00
6,190.80
215,013.6122,190.00
6,546.00
Costs:Products: Hours:
Activity 626320 - Sunnyvale PoolProduct: Participant Hour
60,973.224,450.001,623.00
57,199.474,407.501,581.30
55,507.924,162.001,430.00
56,099.594,162.001,430.00
48,626.124,162.501,388.80
Costs:Products: Hours:
Activity 626330 - Columbia PoolProduct: Participant Hour
50,364.284,750.001,551.00
54,812.525,444.501,546.50
53,223.515,800.001,468.00
53,710.355,800.001,468.00
44,854.995,824.501,348.80
Costs:Products: Hours:
Activity 626360 - Fremont High School Pool AgreementProduct: Participant Hour
213,429.7980,100.00
99.00
158,941.44162,225.50
56.30
213,605.50150,000.00
100.00
215,149.53150,000.00
100.00
183,387.35149,993.00
3.90
Costs:Products: Hours:
Activity 626370 - Supervision/Administrative Support for Aquatics Programs
71,353.210.00
713.00
68,917.840.00
597.50
69,234.970.00
639.00
71,721.640.00
639.00
74,476.200.00
688.40
Costs:Products: Hours:
569
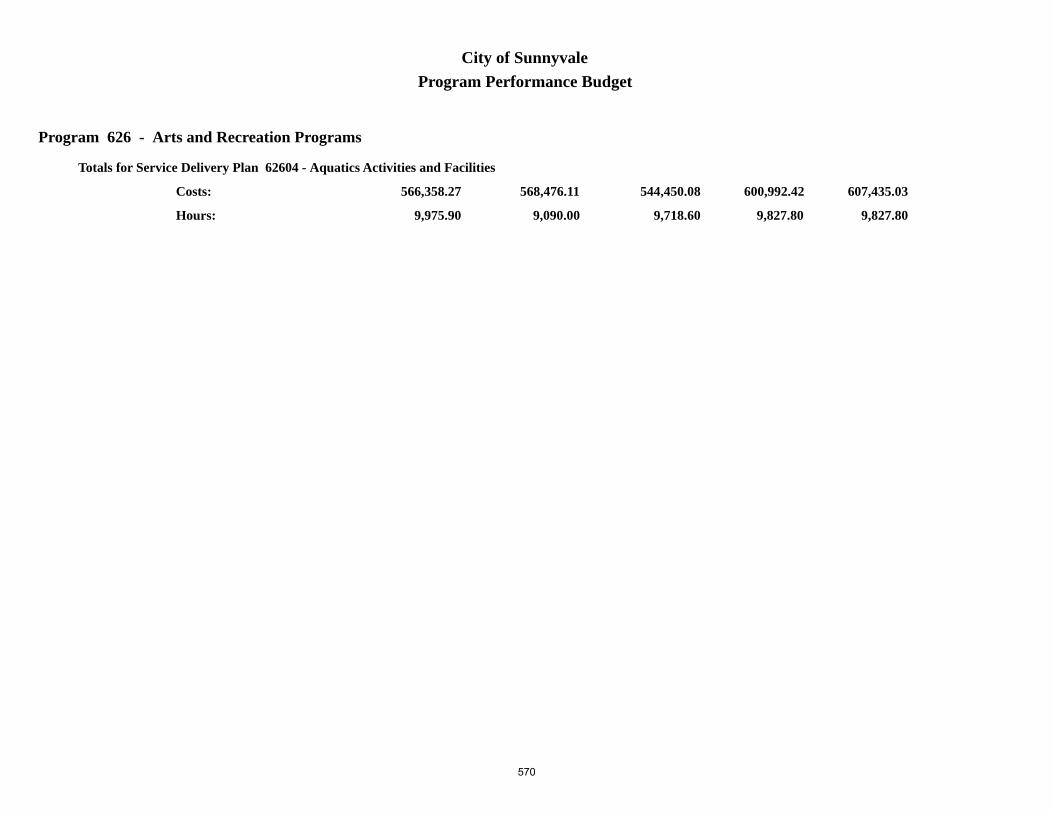
Program 626 - Arts and Recreation Programs
Program Performance BudgetCity of Sunnyvale
9,090.00
568,476.11 544,450.08
9,718.60
600,992.42 607,435.03
Totals for Service Delivery Plan 62604 - Aquatics Activities and Facilities
566,358.27
9,975.90Hours:
Costs:
9,827.80 9,827.80
570

Program 626 - Arts and Recreation Programs
Program Performance BudgetCity of Sunnyvale
Service Delivery Plan 62605 - Sports Classes and Activities
Budget2015/2016
Actual2014/2015
Actual2015/2016
Current2016/2017 2017/2018
Plan
Activity 626400, 626401, 626402, 626403, 626404 - Youth Sports ActivitiesProduct: Participant Hour
733,080.6772,000.00
3,046.00
796,363.5191,388.00
2,987.30
786,303.5975,000.00
2,806.00
799,454.2775,000.00
2,806.00
767,626.6374,922.00
2,891.20
Costs:Products: Hours:
Activity 626410 - Fiscal Agent for Sunnyvale Middle School After School Sports ProgramProduct: Participant Hour
51,550.6927,000.00
119.00
43,798.2328,720.00
76.00
48,912.1428,000.00
80.00
49,595.4928,000.00
80.00
43,232.2028,055.00
42.50
Costs:Products: Hours:
Activity 626420 - Fiscal Agent for Columbia Middle School After School Sports ProgramProduct: Participant Hour
41,370.1213,100.00
119.00
35,138.5514,788.00
75.00
38,441.8416,375.00
80.00
39,073.8616,375.00
80.00
35,767.2616,375.00
44.50
Costs:Products: Hours:
Activity 626430, 626431, 626432, 626433 - Adult Sports ActivitiesProduct: Participant Hour
245,480.8147,424.00
4,044.00
251,451.7146,922.00
3,978.90
253,443.9045,230.00
4,086.00
260,526.1145,230.00
4,086.00
238,599.2045,230.00
3,985.50
Costs:Products: Hours:
Activity 626450 - Supervision/Administrative Support for Sports Classes and Activities
85,899.970.00
911.00
95,110.310.00
1,030.50
107,832.710.00
1,165.00
113,105.740.00
1,165.00
97,392.670.00
1,075.70
Costs:Products: Hours:
571
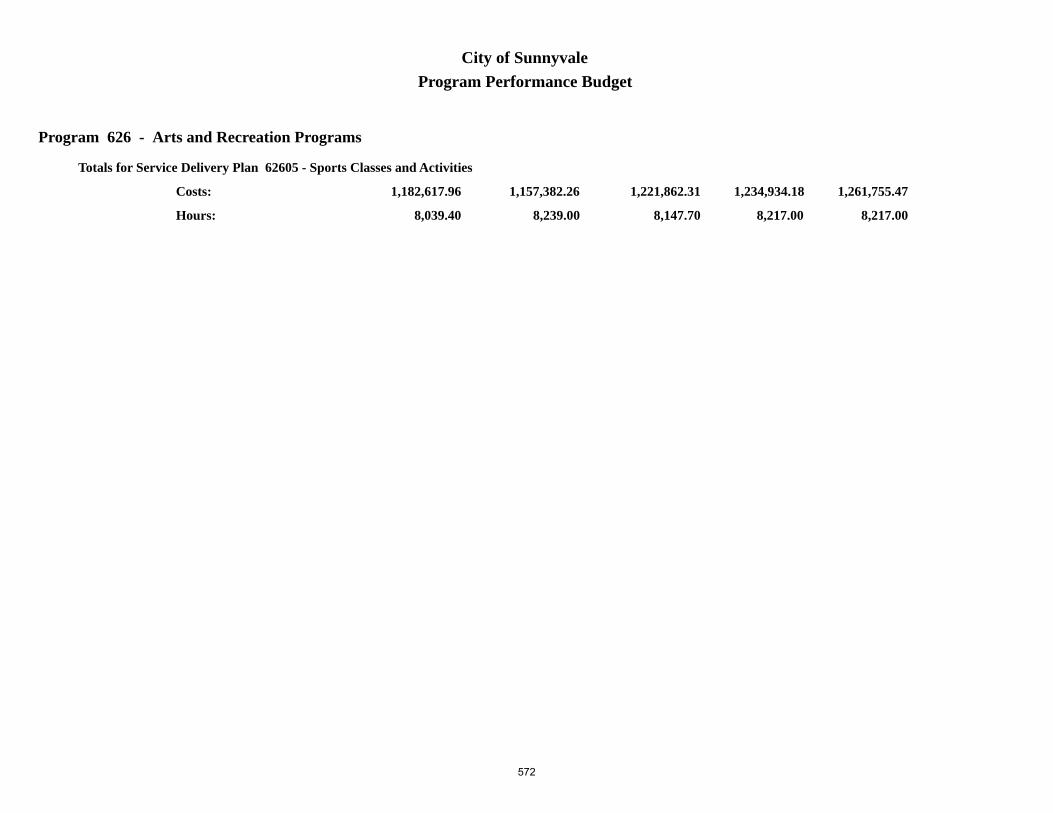
Program 626 - Arts and Recreation Programs
Program Performance BudgetCity of Sunnyvale
8,239.00
1,157,382.26 1,221,862.31
8,147.70
1,234,934.18 1,261,755.47
Totals for Service Delivery Plan 62605 - Sports Classes and Activities
1,182,617.96
8,039.40Hours:
Costs:
8,217.00 8,217.00
572

Program 626 - Arts and Recreation Programs
Program Performance BudgetCity of Sunnyvale
Service Delivery Plan 62606 - Recreation Facility Rentals and Use
Budget2015/2016
Actual2014/2015
Actual2015/2016
Current2016/2017 2017/2018
Plan
Activity 626500 - Community Center General Recreation BuildingsProduct: Occupancy Hour
237,481.7110,000.00
6,175.00
227,601.189,253.005,402.30
230,435.4510,355.00
5,586.00
239,367.6810,355.00
5,586.00
221,137.4910,355.00
5,550.20
Costs:Products: Hours:
Activity 626510 - Indoor Sports CenterProduct: Occupancy Hour
23,063.744,678.00
248.00
25,239.564,973.00
264.40
23,498.524,654.00
250.00
24,999.884,654.00
250.00
23,199.644,654.00
239.70
Costs:Products: Hours:
Activity 626520 - TheatreProduct: Occupancy Hour
232,102.145,000.003,111.00
222,652.522,342.502,815.80
254,119.425,000.003,255.00
266,741.295,000.003,255.00
216,358.864,506.352,808.90
Costs:Products: Hours:
Activity 626530 - Senior CenterProduct: Occupancy Hour
221,786.4110,647.00
5,520.00
203,061.188,269.005,007.00
216,904.138,400.005,400.00
225,369.908,400.005,400.00
212,385.668,363.005,443.60
Costs:Products: Hours:
Activity 626540, 626541, 626542, 626543, 626544 - Park FacilitiesProduct: Occupancy Hour
64,021.8528,318.00
1,887.00
107,308.7939,073.00
3,777.00
95,155.9246,500.00
3,400.00
94,429.6946,500.00
3,400.00
90,070.0646,592.00
3,266.30
Costs:Products: Hours:
573
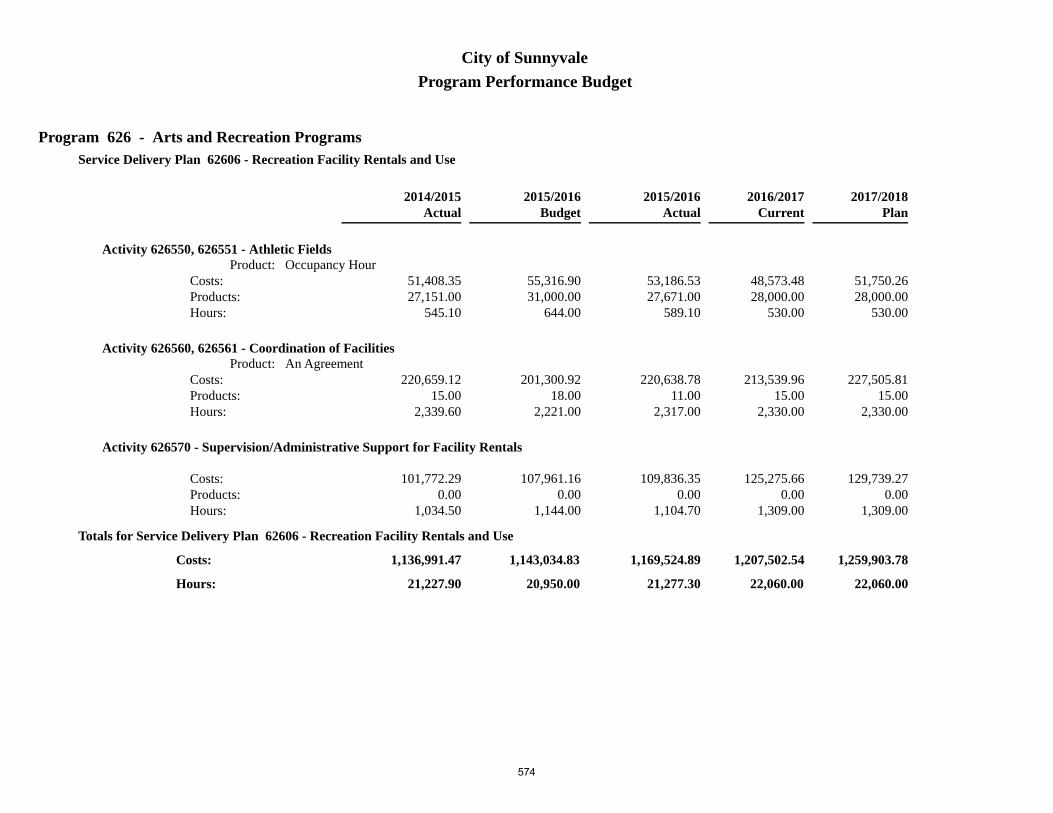
Program 626 - Arts and Recreation Programs
Program Performance BudgetCity of Sunnyvale
Service Delivery Plan 62606 - Recreation Facility Rentals and Use
Budget2015/2016
Actual2014/2015
Actual2015/2016
Current2016/2017 2017/2018
Plan
Activity 626550, 626551 - Athletic FieldsProduct: Occupancy Hour
55,316.9031,000.00
644.00
53,186.5327,671.00
589.10
48,573.4828,000.00
530.00
51,750.2628,000.00
530.00
51,408.3527,151.00
545.10
Costs:Products: Hours:
Activity 626560, 626561 - Coordination of FacilitiesProduct: An Agreement
201,300.9218.00
2,221.00
220,638.7811.00
2,317.00
213,539.9615.00
2,330.00
227,505.8115.00
2,330.00
220,659.1215.00
2,339.60
Costs:Products: Hours:
Activity 626570 - Supervision/Administrative Support for Facility Rentals
107,961.160.00
1,144.00
109,836.350.00
1,104.70
125,275.660.00
1,309.00
129,739.270.00
1,309.00
101,772.290.00
1,034.50
Costs:Products: Hours:
20,950.00
1,143,034.83 1,169,524.89
21,277.30
1,207,502.54 1,259,903.78
Totals for Service Delivery Plan 62606 - Recreation Facility Rentals and Use
1,136,991.47
21,227.90Hours:
Costs:
22,060.00 22,060.00
574

Program 626 - Arts and Recreation Programs
Program Performance BudgetCity of Sunnyvale
Service Delivery Plan 62607 - Registration, Reception Services, Community Outreach/Promotions and Special Events
Budget2015/2016
Actual2014/2015
Actual2015/2016
Current2016/2017 2017/2018
Plan
Activity 626600 - Provision and Administration of Recreation Fee Waiver Program [Deleted]Product: A Recipient
7,606.15188.00
99.00
7,513.92269.00101.00
0.000.000.00
0.000.000.00
45,784.86211.0087.00
Costs:Products: Hours:
Activity 626610, 626611, 626612 - Special EventsProduct: Participant Hour
58,631.516,096.00
525.00
110,053.2311,250.001,031.40
74,419.158,508.00
679.00
77,360.738,508.00
679.00
34,347.780.00
353.30
Costs:Products: Hours:
Activity 626620 - Reception and Registration Services
336,563.700.00
5,355.00
337,907.320.00
4,721.20
368,663.300.00
5,612.00
401,005.650.00
5,612.00
310,320.700.00
4,403.70
Costs:Products: Hours:
Activity 626630 - Community Outreach and Promotions
250,534.230.00
2,081.00
272,478.470.00
2,477.80
275,726.850.00
1,962.00
284,994.040.00
1,962.00
191,204.280.00
1,303.50
Costs:Products: Hours:
Activity 626640 - Supervision/Administrative Support for Registration/Reception/Outreach
249,146.140.00
3,348.00
250,485.140.00
3,345.70
237,613.510.00
2,485.00
244,791.920.00
2,485.00
223,113.160.00
2,581.50
Costs:Products: Hours:
575

Program 626 - Arts and Recreation Programs
Program Performance BudgetCity of Sunnyvale
Service Delivery Plan 62607 - Registration, Reception Services, Community Outreach/Promotions and Special Events
Budget2015/2016
Actual2014/2015
Actual2015/2016
Current2016/2017 2017/2018
Plan
Activity 626650 - Community Resources
0.000.000.00
0.000.000.00
174,077.6325.00
1,717.00
183,506.2525.00
1,717.00
0.000.000.00
Costs:Products: Hours:
11,408.00
902,481.73 978,438.08
11,677.10
1,130,500.44 1,191,658.59
Totals for Service Delivery Plan 62607 - Registration, Reception Services, Community Outreach/Promotions and Special Events
804,770.78
8,729.00Hours:
Costs:
12,455.00 12,455.00
576

Program 626 - Arts and Recreation Programs
Program Performance BudgetCity of Sunnyvale
Service Delivery Plan 62608 - Community Resources
Budget2015/2016
Actual2014/2015
Actual2015/2016
Current2016/2017 2017/2018
Plan
Activity 626700 - Neighborhood Associations [Deleted]Product: A Neighborhood Served
23,518.0325.00
198.00
18,348.110.00
130.00
0.000.000.00
0.000.000.00
18,493.8326.00
147.00
Costs:Products: Hours:
Activity 626710 - Community Information and Outreach [Deleted]Product: A Permit Application Received
123,592.6148.00
1,287.00
162,395.480.00
1,687.50
0.000.000.00
0.000.000.00
143,381.2552.00
1,461.00
Costs:Products: Hours:
Activity 626720 - Annual State of the City [Deleted]
64,436.130.00
277.00
59,234.590.00
361.00
0.000.000.00
0.000.000.00
28,372.330.00
175.00
Costs:Products: Hours:
1,762.00
211,546.77 239,978.18
2,178.50
0.00 0.00
Totals for Service Delivery Plan 62608 - Community Resources
190,247.41
1,783.00Hours:
Costs:
0.00 0.00
577

Program 626 - Arts and Recreation Programs
Program Performance BudgetCity of Sunnyvale
Service Delivery Plan 62609 - Management and Administrative Support
Budget2015/2016
Actual2014/2015
Actual2015/2016
Current2016/2017 2017/2018
Plan
Activity 626800 - Division-Wide Management and Administrative Support
688,234.200.00
6,069.00
633,130.760.00
5,928.40
653,464.430.00
5,297.00
675,903.170.00
5,297.00
632,551.840.00
5,751.90
Costs:Products: Hours:
6,069.00
688,234.20 633,130.76
5,928.40
653,464.43 675,903.17
Totals for Service Delivery Plan 62609 - Management and Administrative Support
632,551.84
5,751.90Hours:
Costs:
5,297.00 5,297.00
8,183,003.53
110,666.20
8,056,504.09
108,273.40
7,725,663.79
104,503.90
Costs:
Hours: 116,706.80 116,994.80
8,706,666.90 9,059,166.84
Totals for Program 626
578
NOVA Workforce Services

NOVA Workforce Services Department
Department DescriptionThe NOVA Workforce Services Department (NOVA) provides workforce development services for the residents and
businesses of northern Santa Clara County and San Mateo County. NOVA is funded entirely through federal, state and local grants, with the primary resources coming from the Workforce Innovation and Opportunity Act (WIOA). The Department is also known as the NOVA (North Valley) Job Training Consortium. The City of Sunnyvale is the host and fiscal agent for this eight-jurisdiction consortium covering the northern end of Santa Clara County plus all of San Mateo County.
Programs and ServicesServices provided by NOVA are divided according to customer groups as follows:
Job Seeker Services
NOVA provides employment and training services to laid-off, unemployed or economically disadvantaged individuals. Services to adults include the NOVA Job Center, job search workshops, career advising, resume assistance, training support, and other employment-related services. NOVA applies for non-WIOA grants in order to provide services to special populations, such as veterans and individuals with disabilities.
Services to job seekers in San Mateo County are currently contracted out to non-profit service providers. These contracts are under the oversight of the NOVA Workforce Board and are monitored for compliance and performance by NOVA staff.
Employer Services
Services provided to employers include pre-layoff services, layoff-aversion and outplacement assistance, staffing and recruitment, employee training and retention, business development, and linkages to resources providing a wide range of business assistance. NOVA Employer Services is an effective collaborator in building relationships that ultimately enhance job seeker success. These innovative solutions are provided at little or no cost through a variety of grants.
Youth Services
The youth program provides individualized assistance in exploring and developing educational and career goals for young people ages 16-24. NOVA provides these services in northern Santa Clara County and they are contracted out to service providers in San Mateo County.
Enterprise Services
NOVA staff develops strategies and grant applications to address gaps in services to targeted populations. NOVA also conducts and contracts for labor market research to provide career guidance for staff and job seekers. Staff also supports the NOVA Workforce Board, which is appointed by the City Council to oversee the delivery of services with federal funds.
City of Sunnyvale FY 2017/18 Adopted Budget and Resource Allocation Plan
579

Department Budget Summary
NOVA Workforce Services
Fund/Program Actual
2014/15Budget
2015/16Actual
2015/16Budget
2016/17Budget
2017/18
Employment Development Fund
Employment Development 7,193,894 10,344,250 10,111,368 10,055,000 10,249,975
TOTAL EXPENDITURES 7,193,894 10,344,250 10,111,368 10,055,000 10,249,975
Budget Overview and Significant ChangesFY 2017/18 is the second year of a two-year operating cycle. As such, there were no significant changes to the
Department’s operating budget for FY 2017/18.
NOVA’s core funding is from the federal Workforce Innovation and Opportunity Act with annual appropriations by Congress. As such, it is dependent on the non-defense discretionary spending portion of the federal budget subject to sequestration and targeted cuts. NOVA’s budget is dependent on its grant funding – both allocated funding and funds awarded through a competitive process. For this reason, the budget will fluctuate over time. A base budget is approved each year and then modified as necessary to reflect additional funding received during the year. NOVA’s budget is primarily for staffing, with other major items including contractual services and training. The NOVA budget is organized into three funding sources: WIOA Programs, Categorical Programs, and Non-Categorical Programs. The FY 2017/18 budget includes WIOA formula funding for San Mateo County, which is now allocated to NOVA.
WIOA Programs
Since July 1, 2000, the primary funding source for the NOVA Workforce Services Department has been federal Workforce Investment Act (WIA) appropriations and competitive grants. In 2014, Congress passed the federal Workforce Innovation and Opportunity Act (WIOA) as the new governing legislation for the local workforce investment system. This new legislation took effect July 1, 2015. Other than incorporating the new WIOA terminology, the Joint Exercise of Power Agreement (JPA) for Council serving as the Chief Local Elected Official (CLEO) for the NOVA consortium maintains many of the same agreements. NOVA’s WIOA funding is allocated based on a federal funding formula administered by the State of California, and consists of funds for adult, youth, dislocated workers, and rapid response (funding to assist companies and individuals affected by layoffs).
Categorical Programs
NOVA seeks grant funding from a variety of federal, state and local sources to serve special populations, such as individuals with disabilities and veterans, and to implement strategies developed by the NOVA Workforce Board that fill specific service gaps and align with the NOVA Strategic Plan.
Non-Categorical Programs
NOVA pursues foundation funding for capacity building, strategic planning, and other purposes that do not address services to individual customers.
A portion of the WIOA funding received by the state is categorized as “Governor’s discretionary funds” or 25% Additional Assistance Funds, which are available to fund specific projects called Additional Assistance Grants (AAGs). NOVA has received funding through this pool of funds since 1989 to provide services to dislocated workers. It is typical for NOVA’s Budgeted Position Allocation (BPA) to reflect more positions than they currently have funding to support. This allows NOVA to be flexible with its staffing, to address special needs for job seekers or noncustomer pilot programs, and move quickly when additional grant funding is secured. Since NOVA is entirely grant funded, reflecting additional headcount has no fiscal impact on the City, as NOVA only spends its allocated grant funding.
City of Sunnyvale FY 2017/18 Adopted Budget and Resource Allocation Plan
580

WIOA funding is allocated to the state from the federal government. This funding is subject to the same uncertainty as other federal programs due to the current federal budget challenges including ever changing priorities and the overall deficit position.
Department Position Allocation
ClassificationFY 2016/17
Budgeted PositionsFY 2017/18
Budgeted Positions Change
Director of NOVA Workforce Services 1 1 —
Manager of Business Operations 0 0 —
Job Seeker Manager 1 1 —
Management Analyst 1 1 —
Employment Training Manager 3 3 —
Accountant 1 1 —
Administrative Aide-Employment Development 3 3 —
Employment Training Program Coordinator 5 5 —
Administrative Analyst 1 1 —
Career Advisor 13 13 —
Business Liaison 3 3 —
Senior Workforce Services Representative 5 5 —
Workforce Development Analyst 1 1 —
ED Information Systems Analyst 2 2 —
Administrative Secretary 1 1 —
Senior Office Assistant 2 2 —
Part-Time Administrative Analyst 0 0 —
Part-Time Career Advisor 1 1 —
NOVA Workforce Services Department Total 44 44 —
City of Sunnyvale FY 2017/18 Adopted Budget and Resource Allocation Plan
581

This Page Intentionally Blank
582

North Valley (NOVA) Workforce Services Performance Indicators2011 Consolidated General Plan Goals: Chapter 3, Land Use and Transportation (LT)
Goal LT-6: Supportive Economic Development Environment Goal LT-7: Balanced Economic Base
Please refer to the General Plan Executive Summary for further details on goals.
General Plan Goal
FY 2013/14 Results
FY 2014/15 Results
FY 2015/16 Results
EMPLOYMENT DEVELOPMENT
WORKLOAD INDICATORS
Number of clients attending job seeker workshops. LT-6, LT-7 11,845 12,410 9,216
Number of clients enrolled in job seeker programs. LT-6, LT-7 4,430 3,879 3,841
Number of employers served. LT-6, LT-7 289 327 558
Number of board members surveyed. LT-6, LT-7 21 20 17
Number of staffed board and committee meetings. LT-6, LT-7 21 18 20
PERFORMANCE INDICATORS
Number of job seeker survey respondents and percent rating the services provided by NOVA Workforce Services as good or better.
LT-6, LT-7 95% 96% 95%
Number of business survey respondents and percent rating the services provided by NOVA Workforce Services as good or better.
LT-6, LT-7 100% 94% 100%
Percentage of board evaluation measures that rate the organization’s performance as satisfactory or better, including board attendance at functions.
LT-6, LT-7 100% 100% 97%
Percent of total Department operating budget expended. 94% 88% 98%
City of Sunnyvale FY 2017/18 Adopted Budget and Resource Allocation Plan
583

This Page Intentionally Blank
584

Program 510 - Employment Development
Program Performance BudgetCity of Sunnyvale
Service Delivery Plan 51001 - Workforce Investment Act Programs
Budget2015/2016
Actual2014/2015
Actual2015/2016
Current2016/2017 2017/2018
Plan
Activity 510010 - Universal
289,250.000.000.00
0.000.000.00
10,449,747.000.00
73,030.00
10,140,295.490.00
73,030.00
0.000.000.00
Costs:Products: Hours:
Activity 510020, 510021, 510022 - Enrolled Core
24.370.000.00
761,307.120.00
12,519.80
0.000.000.00
0.000.000.00
828,909.850.00
13,448.30
Costs:Products: Hours:
Activity 510030 - Enrolled Intensive
3,210,638.020.00
48,432.00
0.000.000.00
0.000.000.00
0.000.000.00
0.000.000.00
Costs:Products: Hours:
Activity 510040, 510041, 510042, 510043, 510044, 510045, 510046, 510047, 510048, 510049 - Training
466.710.000.00
2,714,827.170.00
12,845.50
0.000.000.00
0.000.000.00
805,872.840.00
9,121.00
Costs:Products: Hours:
Activity 510060, 510061, 510062, 510063, 510064 - Rapid Response
542,772.840.00
7,401.00
1,156,467.320.00
12,544.70
0.000.000.00
0.000.000.00
422,416.200.00
4,982.40
Costs:Products: Hours:
585

Program 510 - Employment Development
Program Performance BudgetCity of Sunnyvale
Service Delivery Plan 51001 - Workforce Investment Act Programs
Budget2015/2016
Actual2014/2015
Actual2015/2016
Current2016/2017 2017/2018
Plan
Activity 510070, 510071, 510072, 510073, 510074, 510075 - In-School Youth
442,218.470.00
6,840.00
1,222,085.960.00
7,606.20
0.000.000.00
0.000.000.00
668,131.980.00
2,528.50
Costs:Products: Hours:
Activity 510100 - Document Control/MIS
337,604.650.00
5,400.00
265,366.400.00
4,445.30
0.000.000.00
0.000.000.00
202,348.460.00
3,628.30
Costs:Products: Hours:
Activity 510110 - Administration
183,116.400.00
2,560.00
299,396.870.00
3,404.50
0.000.000.00
0.000.000.00
241,433.530.00
2,625.60
Costs:Products: Hours:
Activity 510120 - IT/Facilities
796,190.430.00
3,440.00
469,968.970.00
3,458.90
95,713.000.000.00
109,679.300.000.00
380,917.380.00
3,187.50
Costs:Products: Hours:
Activity 510130 - Workforce Publications
264,526.600.00
3,160.00
207.220.000.00
0.000.000.00
0.000.000.00
5,387.210.000.00
Costs:Products: Hours:
586

Program 510 - Employment Development
Program Performance BudgetCity of Sunnyvale
Service Delivery Plan 51001 - Workforce Investment Act Programs
Budget2015/2016
Actual2014/2015
Actual2015/2016
Current2016/2017 2017/2018
Plan
Activity 510140, 510141, 510142 - Operational Management and Workforce Board Support
604,229.840.00
5,520.00
422,304.050.00
4,223.50
0.000.000.00
0.000.000.00
355,009.320.00
4,039.80
Costs:Products: Hours:
Activity 510160, 510161, 510162, 510163, 510164, 510165, 510166, 510167, 510168 - WIA 15% Capacity Building
0.000.000.00
86,052.250.00
1,106.70
0.000.000.00
0.000.000.00
240,634.580.00
1,300.90
Costs:Products: Hours:
Activity 510170, 510171, 510172, 510173, 510174, 510175 - Disability Navigator
0.000.000.00
648.100.000.00
0.000.000.00
0.000.000.00
0.000.000.00
Costs:Products: Hours:
Activity 510230, 510231 - Leases
0.000.000.00
357,485.000.000.00
0.000.000.00
0.000.000.00
395,704.000.000.00
Costs:Products: Hours:
Activity 510280, 510281 - 2010 WIA Veterans' Employment-Related Assistance Program 15% (ARRA)
148.950.000.00
0.000.000.00
0.000.000.00
0.000.000.00
0.000.000.00
Costs:Products: Hours:
587

Program 510 - Employment Development
Program Performance BudgetCity of Sunnyvale
Service Delivery Plan 51001 - Workforce Investment Act Programs
Budget2015/2016
Actual2014/2015
Actual2015/2016
Current2016/2017 2017/2018
Plan
Activity 510310, 510311 - Cisco - Additional Asst Grant
0.000.000.00
0.000.000.00
0.000.000.00
0.000.000.00
46,328.340.00
266.00
Costs:Products: Hours:
Activity 510169, 510320, 510321, 510322, 510323, 510324, 510325, 510326 - WIA Supplemental Grants
0.000.000.00
856,695.430.00
6,010.80
0.000.000.00
0.000.000.00
1,424,454.440.00
13,555.40
Costs:Products: Hours:
Activity 510610, 510611, 510612, 510613, 510614, 510615, 510616, 510617, 510618 - San Mateo County WIA Grants
0.000.000.00
2.780.000.00
0.000.000.00
0.000.000.00
616,461.850.00
7,306.70
Costs:Products: Hours:
Activity 510620, 510621, 510622, 510623 - San Mateo County WIOA
0.000.000.00
0.000.000.00
0.000.000.00
0.000.000.00
42,047.440.00
439.00
Costs:Products: Hours:
82,753.00
6,671,187.28 8,612,814.64
68,165.90
10,545,460.00 10,249,974.79
Totals for Service Delivery Plan 51001 - Workforce Investment Act Programs
6,676,057.42
66,429.40Hours:
Costs:
73,030.00 73,030.00
588
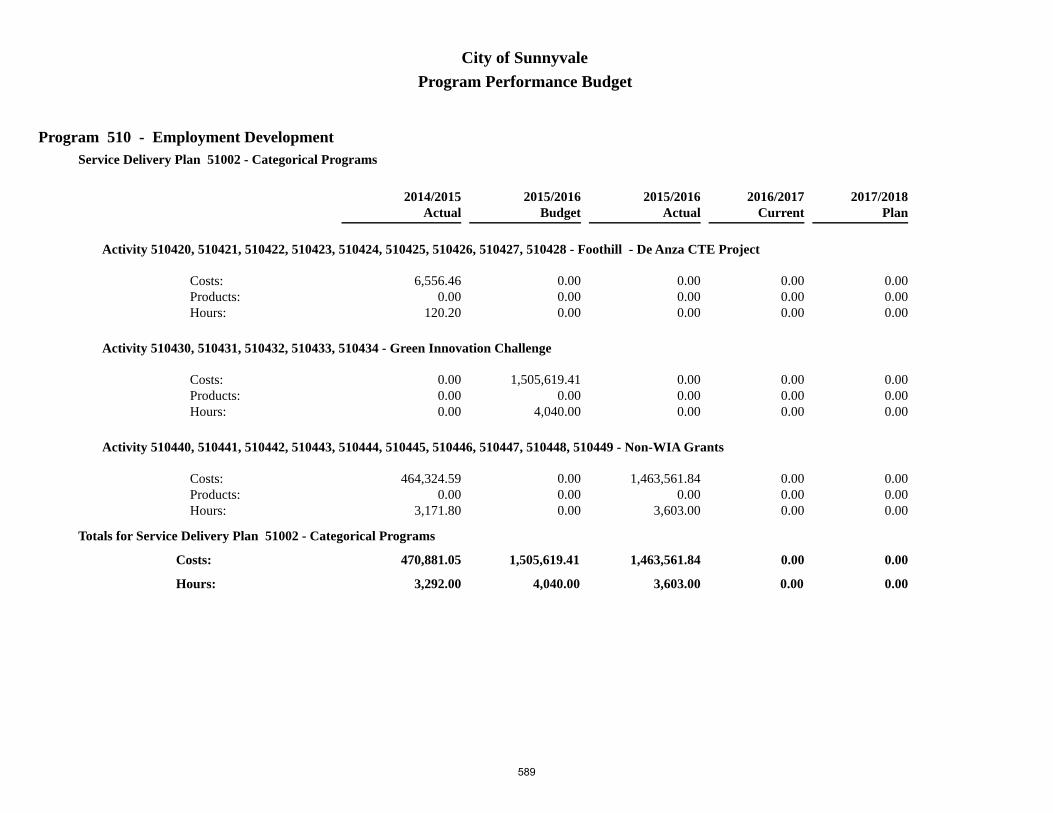
Program 510 - Employment Development
Program Performance BudgetCity of Sunnyvale
Service Delivery Plan 51002 - Categorical Programs
Budget2015/2016
Actual2014/2015
Actual2015/2016
Current2016/2017 2017/2018
Plan
Activity 510420, 510421, 510422, 510423, 510424, 510425, 510426, 510427, 510428 - Foothill - De Anza CTE Project
0.000.000.00
0.000.000.00
0.000.000.00
0.000.000.00
6,556.460.00
120.20
Costs:Products: Hours:
Activity 510430, 510431, 510432, 510433, 510434 - Green Innovation Challenge
1,505,619.410.00
4,040.00
0.000.000.00
0.000.000.00
0.000.000.00
0.000.000.00
Costs:Products: Hours:
Activity 510440, 510441, 510442, 510443, 510444, 510445, 510446, 510447, 510448, 510449 - Non-WIA Grants
0.000.000.00
1,463,561.840.00
3,603.00
0.000.000.00
0.000.000.00
464,324.590.00
3,171.80
Costs:Products: Hours:
4,040.00
1,505,619.41 1,463,561.84
3,603.00
0.00 0.00
Totals for Service Delivery Plan 51002 - Categorical Programs
470,881.05
3,292.00Hours:
Costs:
0.00 0.00
589

Program 510 - Employment Development
Program Performance BudgetCity of Sunnyvale
Service Delivery Plan 51003 - Noncategorical Programs
Budget2015/2016
Actual2014/2015
Actual2015/2016
Current2016/2017 2017/2018
Plan
Activity 510500 - Noncategorical Programs
2,167,443.000.000.00
76.340.000.00
0.000.000.00
0.000.000.00
264.410.000.00
Costs:Products: Hours:
Activity 510510, 510511, 510512, 510513, 510514, 510516 - Youth Foundation - Donations
0.000.000.00
27,957.770.00
1,680.00
0.000.000.00
0.000.000.00
44,248.190.00
2,318.10
Costs:Products: Hours:
Activity 510520 - Values Driven Work
0.000.000.00
6,957.630.00
15.50
0.000.000.00
0.000.000.00
2,442.550.008.00
Costs:Products: Hours:
0.00
2,167,443.00 34,991.74
1,695.50
0.00 0.00
Totals for Service Delivery Plan 51003 - Noncategorical Programs
46,955.15
2,326.10Hours:
Costs:
0.00 0.00
10,344,249.69
86,793.00
10,111,368.22
73,464.40
7,193,893.62
72,047.50
Costs:
Hours: 73,030.00 73,030.00
10,545,460.00 10,249,974.79
Totals for Program 510
590

Public Safety

Public Safety
Mission StatementProviding our community with fully integrated public safety services: Police, Fire and EMS.
Vision StatementTo continually improve our standing as a leader of the fully integrated public safety model.
Values StatementAs members of the Sunnyvale Department of Public Safety, we value our role in contributing to a safe
environment and enhancing the quality of life within our community. We embrace our commitment and responsibility to the public, and each other, by adhering to the following shared values:
• Excellence: We strive to exceed expectations by providing effective, innovative, and valuable services.
• Professionalism: We take pride in providing our community with outstanding service and in conducting ourselves responsibly by maintaining the highest ethical and moral standards. We embrace an environment that encourages teamwork, innovation, constant evaluation of ourselves, and treating those we serve and each other with dignity and respect.
• Accountability: We hold ourselves, and each other, accountable for our actions and decisions for the benefit of our community and profession.
• Community Engagement: We proactively engage our diverse and dynamic community through collaborative, supportive, and productive partnerships..
Department Overview
In an average24-hour period,
Sunnyvale Public Safety Officers…
Conduct225 patrol
calls forservice
Write 28reports
Conduct 4field interviews
Respond to20 emergency
medicalevents
Write 24parkingcitations
Issue 13traffic citations
Arrest 10persons
The Department of Public Safety (DPS), consisting of 201 sworn Public Safety Officers, 87 full-time professional staff, and several part-time and casual employees, is one of the few fully integrated police and fire departments in America. Public Safety Officers are cross-trained as both police officers and firefighters/emergency medical technicians (EMTs), allowing the department to provide police, fire, and emergency medical services seamlessly to the community. Department members take pride in maintaining a city that is safe by focusing on crime and fire prevention, by addressing quality of life issues with all available City resources, and by adhering to enforcement principles to maintain order.
City of Sunnyvale FY 2017/18 Adopted Budget and Resource Allocation Plan
591

Sunnyvale enjoys a reputation for being one of the safest cities in America and consistently has one of the lowest crime rates of any city in the region and state. Much of the success can be attributed to the community policing and problem-solving approach that is employed by the department. Equally as important, staff assigned to fire services and fire prevention and hazardous materials services are tasked with preventing fires through a strong fire inspection program and by providing fire prevention education in schools, neighborhoods, and in the business community.
Emergency medical response is a top priority for the department. To increase the potential for patient survival, both police officers and firefighters are trained as EMTs and are dispatched to every life-threatening emergency medical call. Every emergency responder is equipped with an automated external defibrillator (AED) and the devices are located in every City building.
The department has strong partnerships with the City’s schools, neighborhoods, and business community. These partnerships provide a framework to address localized problems and issues, and allow Public Safety to leverage close relationships to address areas of mutual concern. The department recognizes the power of an engaged community in providing public safety services and keeping the community safe.
Programs and ServicesDPS is organized into nine programs: Police Services, Fire Services, Community Safety Services, Personnel and
Training Services, Investigation Services, Communication Services, Public Safety Administration Services, Records Management and Property Services, and Fire Prevention and Hazardous Materials Services.
Police Services
Police Services focuses on protecting the lives, property, and rights of all people by providing a uniformed police response to both emergency and non-emergency calls for service. Officers are assigned by team over a 24-hour time period and are responsible for a specified geographical area of the City, their respective “beat.” Officers are charged with enforcing federal, state, and local laws including traffic laws, investigating possible criminal activity, and providing crime prevention education. Community Service Officers (CSOs) supplement the program by responding to non-emergency calls for service to aid and assist sworn officers. Special teams are assigned within Police Services, including Traffic Safety Education and Enforcement (officers typically ride motorcycles), and a highly trained Special Weapons and Tactics Team (SWAT). The chart below shows the total number of Part 1 crimes (which include violent and property crimes reported) to the California Department of Justice and Federal Bureau of Investigation as per Uniform Crime Reporting (UCR) standards.
Sunnyvale Total Part 1 Crimes (Per UCR)
0
500
1,000
1,500
2,000
2,500
3,000
2,193 2,127 2,074 2,050 2,131
2,3962,150
2,7472,552
2,885
2005 2006 2007 2008 2009 2010 2011 2012 2013 2014
2,315
2016
2,530
2015
Public Safety Officers assigned to Police Services also augment Fire Services as needed, by assisting with firefighting activities during emergencies.
City of Sunnyvale FY 2017/18 Adopted Budget and Resource Allocation Plan
592

Fire Services
Fire Services focuses on protecting the lives and property of all people by providing primary response to both emergency and non-emergency fire events, as well as emergency medical calls for service. Officers are assigned to one of six fire stations that provide coverage for a specific geographical area. Nine fire engines, three trucks, and one hazardous materials/urban search and rescue apparatus are staffed 24 hours daily at six Fire Stations. Officers and professional staff assigned to Fire Services are also responsible for more than 4,000 fire prevention inspections annually, as well as fire prevention education for schools and businesses.
Community Safety Services
Community Safety Services collaborates with residents, businesses, government and civic organizations, schools and community-based organizations to reduce crime pro-actively, enhance the quality of life for residents, and make the community a safe place to live.
Neighborhood Resource Officers (NROs) provide prevention education to the community. Supervised by one Lieutenant, NROs are assigned to specific geographical areas of the City, tasked with maintaining close partnerships with schools, neighborhood associations, and businesses. NROs often take the lead on problem-solving initiatives by coordinating with other City resources. Crime Prevention Assistants and Public Safety Specialists work closely with NROs to provide support for prevention programs.
Neighborhood Preservation (NP), commonly referred to as code enforcement, resolves Sunnyvale Municipal Code violations at residential, commercial, and industrial properties. NP leverages a wide variety of DPS resources (Police, Fire Prevention, NROs, etc.) and partners with other City departments to address concerns throughout the City.
The Office of Emergency Services (OES) is responsible for disaster preparedness activities and ensures readiness and coordination of City staff through education and planning. OES also provides neighborhoods and businesses with training that will help them to be self-sufficient following a disaster.
Animal Control is also located within Community Safety Services. Animal Control Officers are responsible for services including licensing, responding to calls for service, and transportation to Sunnyvale’s sheltering services partner, the Humane Society Silicon Valley in Milpitas, a state-of-the-art facility.
Personnel and Training Services
Personnel and Training Services, in collaboration with the City’s Department of Human Resources, has primary responsibility for recruiting, testing, hiring, and training all Public Safety employees. Sworn candidates must meet a rigorous set of standards including written testing, oral interviews, psychological screenings, polygraph examinations, and an in-depth background check. Successful candidates attend a 28-week Police Academy, a 16-week Fire Academy, an 8-week Emergency Medical Technician - Basic Academy, and must successfully pass field-training programs in both operational bureaus - Police and Fire.
DPS training is coordinated within Personnel and Training Services to ensure all state-mandated training requirements are met for police, fire, and emergency medical services, as well as specialized skills training for specific assignments.
Investigation Services
Investigation Services focuses primarily on investigative follow-up of criminal cases originating in Police Services and preparing those cases for prosecution. Investigation Services caseloads are managed by two Lieutenants supervising twelve detectives. There is close coordination between this work unit and other local law enforcement agencies because many cases cross jurisdictional boundaries. The Unit also closely coordinates with the Office of the District Attorney and the Santa Clara County Crime Lab. In recent years, technology has played an ever-increasing role in case investigation and, consequently, detectives continue to develop expertise in computer forensics, cell phone technology, and analysis of criminal activity within social networking websites and financial networks.
City of Sunnyvale FY 2017/18 Adopted Budget and Resource Allocation Plan
593

The unit also employs a Senior Crime Analyst who works closely with Detectives and Patrol Officers to analyze the latest crime trends, and provides department-wide awareness to many agency activities. The chart below provides an over 10-year history of Sunnyvale’s clearance rate for violent crimes.
Sunnyvale Violent Crime Clearance Rate
63% 60%55% 54%
67%62%
57%51%
62%
77%
0%
100%
2005 2006 2007 2008 2009 2010 2011 2012 2013 2014
55%
2015
63%
2016
Communication Services
Communication Services functions as the initial point of contact for most police and fire/medical events, both emergency and non-emergency. Dispatchers triage approximately 115,000 incoming calls each year, originating from hard-wired phones, cell phones, and Voice over Internet Protocol (VoIP) contacts. Each year, dispatchers coordinate the assignment of more than 50,000 police events and 7,000 fire and emergency medical events, provide emergency medical directions to callers reporting medical emergencies, process all requests for information by officers, and question callers to provide the best information to emergency responders.
Public Safety Administration Services
Public Safety Administration Services provides management, coordination and support to all department services and functions.
The Professional Standards Unit, also known as Internal Affairs, conducts investigations of misconduct when warranted. Staffed by a Lieutenant and a professional staff, the Professional Standards Unit also conducts quality assurance audits to ensure compliance with laws, and with City and department policies.
The Licenses and Permits Unit processes license and permit applications for residential and business alarm systems, taxicab franchises, massage establishments, adult entertainment, peddlers, and pawnshops. The administration of abandoned vehicle abatement and parking enforcement is also coordinated within this Unit.
Administration Services is also responsible for the fiscal health of the department, ensuring fiscal accountability is maintained across the department and that revenue sources are explored and leveraged. Professional staff is involved in all aspects of the City budget process, including but not limited to, grant applications and fiscal reporting, project submittals, and the coordination of department activities. Additionally, the Department is responsible for revenue-based fines, forfeitures, and licensing, as well as significant annual grant revenue.
City of Sunnyvale FY 2017/18 Adopted Budget and Resource Allocation Plan
594

Records Management and Property Services
Records Management and Property Services is the primary point of contact for non-emergency police and fire events, by both phone and in-person contacts. This Unit provides the repository for all police and fire event records and ensures all case files are prepared for prosecution. Records Management is staffed 24 hours daily to ensure timely processing of information and reports, and as a primary point of contact for all City services after regular business hours. Property Services is a critical function within the Unit. It ensures evidence collected by officers within Police and Investigation Services is properly secured, cataloged, and processed for case prosecution. A secure evidence storage facility is located in the department headquarters on All America Way, and a second long-term facility is located at the City’s Corporation Yard.
Fire Prevention and Hazardous Materials Services
Fire Prevention and Hazardous Materials Services operates under the oversight of the Fire Marshal and is an integral part of ensuring a safe community. This Unit’s primary purpose is to prevent fires and hazardous materials- related emergencies and to minimize injuries and property loss when a fire or hazardous materials emergency occurs. Its core objective is to integrate public education and outreach with fire and life safety inspections in new and existing occupancies.
Fire Prevention Specialists conduct compliance inspections in all occupancies except single-family residences and consult with residents and local business owners on how to maintain fire-safe environments and building systems. Inspections of schools, residential care facilities, daycares, nightclubs, and other occupancies with potentially vulnerable occupants are prioritized.
Fire Protection Engineers participate in pre-design meetings with developers and architects, review architectural plans and shop drawings, and conduct field inspections of passive and active fire protection systems including fire- resistive walls, exit components, automatic sprinkler systems, and fire alarms. These reviews and inspections ensure that engineered systems are designed and installed in accordance with applicable codes and standards.
Technically trained Hazardous Materials Inspectors are responsible for implementing and enforcing a broad set of hazardous materials regulations, contained in six statewide hazardous materials programs and the Fire Code. These regulations cover topics like underground storage tank systems, accidental release prevention, hazardous waste treatment systems, toxic gas, and general storage and use of hazardous materials. The Hazardous Materials Inspectors frequently join the Fire Protection Engineers in pre-design meetings and consultations with business owners and developers.
City of Sunnyvale FY 2017/18 Adopted Budget and Resource Allocation Plan
595

Department Budget Summary
Public Safety
Fund/Program Actual
2014/15Budget
2015/16Actual
2015/16Budget
2016/17Budget
2017/18
General Fund
Communication Services 4,005,419 3,606,079 3,760,436 4,192,385 4,301,891
Community Safety Services 3,729,691 4,220,951 3,997,403 4,299,095 4,369,109
Fire Prevention and Hazardous Material Services 1,091,283 1,231,411 1,224,742 1,440,226 1,946,581
Fire Services 26,969,640 27,614,958 29,254,195 31,211,740 32,782,531
Investigation Services 4,782,298 4,863,457 4,993,552 4,861,829 5,123,761
Personnel and Training 2,130,716 1,993,777 2,423,407 2,133,109 2,210,305
Police Services 25,421,735 29,968,183 27,432,583 30,506,968 32,068,922
Public Safety Administrative Services 5,529,261 5,254,404 5,702,609 5,770,381 6,503,263
Records Management and Property Services 2,102,273 2,124,032 2,087,153 2,103,318 2,246,524
Public Safety Recruitment Projects 5,755,430 8,362,780 6,868,393 9,294,417 6,203,731
DPS Equipment 225,783 461,167 358,071 433,779 715,009
Asset Forfeiture Fund
Police Services 1,977 2,176 1,956 1,999 2,009
Police Services Augmentation Fund
Police Services 273,644 268,718 268,632 262,619 243,316
Development Enterprise Fund
Fire Prevention and Hazardous Material Services 735,317 810,964 711,967 1,145,079 1,230,237
TOTAL EXPENDITURES 82,754,467 90,783,057 89,085,099 97,656,944 99,947,189
Budget Overview and Significant ChangesFY 2017/18 is the second year of a two-year operating cycle. As such, there are no significant changes made to the
Department’s operating budget for FY 2017/18.
Funding for DPS represents approximately 60% of the City’s General Fund operating expenditures. Of that amount, nearly 90% can be attributed to salaries and benefits. Public Safety managers approach the task of developing the budget by critically examining each program and position to ensure that services provided to the community are aligned with the department’s mission and are responsive to the needs of the community.
City of Sunnyvale FY 2017/18 Adopted Budget and Resource Allocation Plan
596

Overall Program Changes
The FY 2016/17 Adopted Budget for the Department of Public Safety included four previously authorized Public Safety Officers that were not funded in prior years’ budgets to be utilized to staff the additional fire teams added to operate the new ladder truck at the new Fire Station 5. This fire station completed construction in early 2016, funded through the Moffett Place Office Campus development agreement.
To address historical program needs, the FY 2016/17 budget also included the addition of one Public Safety Dispatcher-In-Training position and the addition of 4,200 hours of overtime for the Communication Services Dispatchers and Sr. Dispatchers.
For FY 2017/18, additional funding is added to fund the annual inspection of Fire Services turnouts ($25,000), to fund a second set for each Public Safety Officer over the next few years based on NFPA recommendations, and to fund a Neighborhood Preservation Specialist (term-limited position) that was created to support the operational needs in this program area. 1.0 Public Safety Specialist, 2.0 Fire Prevention Specialist I, and 1.0 Senior Hazardous Materials Inspector replacing an existing Hazardous Materials Inspector (1.0) position, were funded by new revenues generated by Fire Prevention and Hazardous Materials fees.
Department Position Allocation
ClassificationFY 2016/17
Budgeted PositionsFY 2017/18
Budgeted Positions Change
Director of Public Safety 1 1 —
Public Safety Captain 7 7 —
Deputy Chief 3 3 —
Public Safety Officer II 148 148 —
Public Safety Lieutenant 42 42 —
DPS (Sworn) Total 201 201 —
City of Sunnyvale FY 2017/18 Adopted Budget and Resource Allocation Plan
597

ClassificationFY 2016/17
Budgeted PositionsFY 2017/18
Budgeted Positions Change
Neighborhood Preservation Manager 1 1 —
Public Safety Communication Manager 1 1 —
Public Safety Records Manager 1 1 —
Management Analyst 1 1 —
Senior Management Analyst 1 1 —
Civilian Fire Marshall 1 1 —
Administrative Aide-Confidential 1 1 —
Senior Community Services Officer 1 1 —
Community Services Officer 6 6 —
Community Services Officer - Term Limited 1 1 —
Animal Control Officer 1 1 —
Public Safety Specialist 3 4 1
Senior Neighborhood Preservation Specialist 1 1 —
Neighborhood Preservation Specialist 3 3 —
Neighborhood Preservation Specialist - Term Limited 1 1 —
EMS Coordinator 1 1 —
Senior Crime Analyst 1 1 —
Senior Hazardous Materials Inspector 0 1 1
Hazardous Materials Inspector 3 2 (1)
Fire Prevention Specialist I 0 2 2
Fire Prevention Specialist II 2 2 —
Public Safety Dispatcher 14 14 —
Public Safety Dispatcher-In-Training 1 1 —
Senior Public Safety Dispatcher 5 5 —
Public Safety Records Specialist II 8 8 —
Public Safety Records Senior Specialist 3 3 —
Principal Office Assistant-Confidential 1 1 —
Public Safety Property Clerk 2 2 —
Senior Office Assistant 9 9 —
Staff Office Assistant 3 3 —
Public Safety Maintenance Worker 1 1 —
Vehicle Abatement Officer 4 4 —
DPS (Non-Sworn) Total 87 90 3
City of Sunnyvale FY 2017/18 Adopted Budget and Resource Allocation Plan
598

Department of Public Safety Performance Indicators2011 Consolidated General Plan Goals: Chapter 6, Safety and Noise (SN)
Goal SN-1: Acceptable Levels of Risk for Natural and Human-Caused Hazards Goal SN-2: Effective Disaster PreparednessGoal SN-3: Safe and Secure CityGoal SN-4: Public Confidence in Police Services Goal SN-5: Effective Fire Service Response System Goal SN-6: Effective Emergency Response CapabilityGoal SN-7: Effective Emergency Communication Services
Please refer to the General Plan Executive Summary for further details on goals
General Plan Goal
FY 2013/14 Results
FY 2014/15 Results
FY 2015/16 Results
POLICE SERVICES
WORKLOAD INDICATORS
Number of traffic enforcement stops. SN-3 10,876 9,393 9,460
Number of traffic citations issued. SN-3 16,017 13,229 17,325
Number of traffic Hot Spots enforced. [Deleted in FY 16/17] SN-3 20 8 0
Number of traffic complaints addressed by enforcement efforts [New in FY 16/17]
SN-3 N/A N/A N/A
PERFORMANCE INDICATORS
Number of police responses to emergency events and average response time.
SN-3, SN-4, SN-6
2,692 4 min, 39 sec
2,438 4 min, 39 sec
2,327 4 min, 42 sec
Number of police responses to urgent events and average response time.
SN-3, SN-4, SN-6
1,711 6 min, 21 sec
1,675 6 min, 42 sec
1,568 6 min, 29 sec
FIRE SERVICES
WORKLOAD INDICATORS
Number of inspections completed by fire station personnel. SN-5 3,081 2,536 2,855
PERFORMANCE INDICATORS
Number of fire responses to all emergency events and average response time.
SN-5, SN-6 7,754 4 min, 11 sec
7,437 4 min, 18 sec
7,774 4 min, 23 sec
Number of fire responses to emergency fire events and average response time.
SN-5, SN-6 1,934 4 min, 33 sec
1,790 4 min, 52 sec
1,907 5 min, 0 sec
Number of fire responses to emergency medical events and average response time.
SN-5, SN-6 5,671 4 min, 4 sec
5,647 4 min, 9 sec
5,867 4 min, 14 sec
COMMUNITY SAFETY SERVICES
WORKLOAD INDICATORS
Number of SNAP volunteers trained. [Deleted in FY 16/17] SN-2 254 392 411
City of Sunnyvale FY 2017/18 Adopted Budget and Resource Allocation Plan
599

General Plan Goal
FY 2013/14 Results
FY 2014/15 Results
FY 2015/16 Results
Number of active volunteers available (i.e. SARES, SNAP and CERT) for the Office of Emergency Services. [New in FY 16/17]
SN-2 N/A N/A N/A
PERFORMANCE INDICATORS
Number of animal service calls and percent responded to within 24 hours.
SN-3, SN-4 1,278 89%
1,531 84%
1,194 80%
Number of complaints reported from businesses, neighborhoods, and schools and percent responded to within 3 days. [Redefined definition of complaint in FY 2013/14]
SN-3, SN-4 90 99%
40 100%
34 100%
Percent of code enforcement cases investigated within 3 business days of receipt.
SN-3, SN-4 100% 98.3% 98.0%
Percent of code enforcement cases resolved within 30 days. SN-3, SN-4 92% 91.8% 91.0%
PERSONNEL AND TRAINING SERVICES
PERFORMANCE INDICATORS
Number of recruits who have completed training and recruit success rate.
SN-3, SN-4, SN-5
9 100%
5 83%
9 69%
INVESTIGATION SERVICES
PERFORMANCE INDICATORS
Sunnyvale’s Violent Crime Rate defined by the FBI, murder, forcible rape, robbery and aggravated assault will be consistent with or below the average of the cities of Mountain View and Santa Clara. [Redefined indicator and measure in FY 16/17]
SN-3 142 167 149
Compared to: City of Santa Clara 157 164 unknown
City of Mountain View 133 168 153
Sunnyvale’s Property Crime Rate defined by the FBI, for burglary, motor vehicle theft, and larceny theft will be consistent with or below the average of the cities of Mountain View and Santa Clara. [Redefined indicator and measure in FY 16/17]
SN-3 2,409 2,456 2,179
Compared to: City of Santa Clara 3,279 3,638 unknown
City of Mountain View 1,681 1,919 1,975
Violent Crime clearance rate as defined by the FBI for the crimes of murder, forcible rape, robbery, and aggravated assault. [Delete in FY 16/17]
SN-3 53% 64% 63%
Compared to: City of Santa Clara 42% N/A unknown
City of Mountain View 68% N/A 100%
Sunnyvale’s Crime Rate as defined by the FBI, for the crimes of murder, forcible rape, and aggravated assault, burglary, motor vehicle theft, and grand theft will be consistent with or below the average of the cities of Mountain View and Santa Clara. [New in FY 16/17]
SN-3 N/A N/A N/A
City of Sunnyvale FY 2017/18 Adopted Budget and Resource Allocation Plan
600

General Plan Goal
FY 2013/14 Results
FY 2014/15 Results
FY 2015/16 Results
COMMUNICATION SERVICES
PERFORMANCE INDICATORS
Number of emergency police events (Priority E) Public Safety Dispatchers processed (question callers, prioritize, etc.), created, and dispatched and percent completed within 2 minutes and 19 seconds of answering the phone.
SN-3, SN-4, SN-7
589 89%
331 87%
423 95%
Number of emergency fire events (Priority 1) Public Safety Dispatchers processed (question callers, prioritize, etc.), created, and dispatched and percent completed within 1 minute and 58 seconds of answering the phone.
SN-3, SN-5, SN-7
1,611 85%
1,683 83%
1,607 84%
Number of emergency medical events Public Safety Dispatchers processed (question callers, prioritize, etc.), created, and dispatched utilizing the Medical Priority Dispatch System and percent completed within 2 minutes and 3 seconds of answering the phone.
SN-6, SN-7 5,708 91%
5,618 90%
5,395 90%
Number of calls received on designated emergency lines answered within 10 seconds, 90% of the time. [New in FY 16/17]
SN-3, SN-7 N/A N/A N/A
DPS MANAGEMENT AND SUPPORT
PERFORMANCE INDICATORS
Percent of total Department operating budget expended. 97.9% 98.3% 100.0%
RECORDS MANAGEMENT AND PROPERTY SERVICES
PERFORMANCE INDICATORS
Number of in custody court cases submitted to the District Attorney and percent submitted within two business days.
SN-3, SN-4 604 100%
507 100%
500 100%
FIRE PREVENTION AND HAZARDOUS MATERIAL SERVICES
WORKLOAD INDICATORS
Number of hazmat inspections completed at permitted sites [Edited FY 2016/17]
SN-5 1,012 1,133 1,100
Number of fire safety inspections completed by Fire Prevention Specialists. [Edited FY 2014/15]
SN-5 909 887 845
PERFORMANCE INDICATORS
Number of regular fire prevention plan checks requested and percent completed within 21 days. [Edited FY 2016/17]
SN-5 1,347 82.7%
2,322 91%
2,037 68.5%
Number of fire safety construction inspections requested and percent completed within 2 days.
SN-5 2,493 18.9%
3,690 16.34%
4,077 11.06%
Number of hazmat plan checks requested and percent completed within 7 days.
SN-1 180 95.0%
123 91.8%
133 92.5%
City of Sunnyvale FY 2017/18 Adopted Budget and Resource Allocation Plan
601

This Page Intentionally Blank
602

Program 471 - Police Services
Program Performance BudgetCity of Sunnyvale
Service Delivery Plan 47101 - Police Field Services
Budget2015/2016
Actual2014/2015
Actual2015/2016
Current2016/2017 2017/2018
Plan
Activity 471010, 471011, 471012, 471013, 471014, 471015, 471016, 471017 - Patrol Response to Police EventsProduct: An Incident
8,382,696.2640,000.0055,256.00
7,598,382.6829,971.0050,990.67
9,345,828.0037,000.0060,287.00
9,830,191.2137,000.0060,287.00
7,579,890.1335,549.0052,488.86
Costs:Products: Hours:
Activity 471020 - Patrol Response to Fire EventsProduct: An Incident
140,636.79325.00900.00
141,094.12367.00939.56
146,357.76400.00900.00
153,798.94400.00900.00
133,685.97411.00917.81
Costs:Products: Hours:
Activity 471030 - Patrol Response to Medical EmergenciesProduct: An Incident
140,636.791,500.00
900.00
126,748.361,384.00
848.93
146,357.761,700.00
900.00
153,798.941,700.00
900.00
128,598.421,702.00
888.19
Costs:Products: Hours:
Activity 471040 - Traffic Enforcement and EducationProduct: An Enforcement Stop
507,855.0811,500.003,250.00
304,596.855,533.002,041.76
455,335.268,400.002,800.00
478,485.608,400.002,800.00
375,861.738,387.002,589.62
Costs:Products: Hours:
Activity 471050 - Ancillary Activities - Includes All Time Spent In and Out of Service Status to Attend On Duty Committee or Task Force Meetings
236,218.070.00
1,530.00
58,140.1211.00
595.44
52,546.580.00
360.00
55,511.840.00
360.00
50,591.80205.00367.13
Costs:Products: Hours:
603

Program 471 - Police Services
Program Performance BudgetCity of Sunnyvale
Service Delivery Plan 47101 - Police Field Services
Budget2015/2016
Actual2014/2015
Actual2015/2016
Current2016/2017 2017/2018
Plan
Activity 471060 - Provide Nondirected Patrol - All Time that is NOT Captured in Other Activities to Show the "Available" Time Officers have for Proactive, Preventive Patrol
7,395,416.460.00
47,789.00
7,503,683.890.00
50,194.68
7,468,148.820.00
45,924.00
7,847,847.410.00
45,924.00
6,576,894.590.00
45,365.83
Costs:Products: Hours:
Activity 471070 - PTO Coordination
210,955.180.00
1,350.00
79,436.920.00
556.99
75,560.520.00
475.00
79,712.760.00
475.00
78,063.830.00
530.01
Costs:Products: Hours:
Activity 471080 - Preshift Preparation Time - Includes Patrol Briefing, Patrol Car Check, and Loading Time
1,640,762.550.00
10,500.00
1,306,066.530.00
8,663.88
1,666,852.300.00
10,250.00
1,751,599.070.00
10,250.00
1,168,715.110.00
8,045.21
Costs:Products: Hours:
Activity 471120 - CSO Field ServicesProduct: A Call for Service
915,079.090.00
11,612.90
787,794.300.00
10,544.81
932,035.733,800.00
11,613.00
1,005,963.333,800.00
11,613.00
699,077.950.00
9,675.00
Costs:Products: Hours:
133,087.90
19,570,256.27 17,905,943.77
125,376.72
20,289,022.73 21,356,909.10
Totals for Service Delivery Plan 47101 - Police Field Services
16,791,379.53
120,867.66Hours:
Costs:
133,509.00 133,509.00
604

Program 471 - Police Services
Program Performance BudgetCity of Sunnyvale
Service Delivery Plan 47102 - Management, Supervision, and Administration
Budget2015/2016
Actual2014/2015
Actual2015/2016
Current2016/2017 2017/2018
Plan
Activity 471210, 471211, 471212, 471213, 471214, 471215 - Employee Training for Patrol Line - Includes Staff Time Spent Providing or Receiving Training
1,243,452.790.00
8,720.00
1,505,227.090.00
9,695.71
1,166,945.950.00
7,500.00
1,228,289.080.00
7,500.00
1,164,505.960.00
7,627.30
Costs:Products: Hours:
Activity 471220 - Court Activity - Includes Staff Time at Traffic, Municipal, and Superior Court Prosecuting ComplaintsProduct: A Court Appearance
226,308.40450.00
1,746.00
99,576.63224.00810.84
121,563.26300.00946.00
128,490.68300.00946.00
116,916.02258.00945.71
Costs:Products: Hours:
Activity 471230 - Annual Audit of Asset Forfeiture Funds
2,175.560.000.00
1,955.850.000.00
1,999.200.000.00
2,009.000.000.00
1,976.970.000.00
Costs:Products: Hours:
Activity 471240 - Rental Rates - Police Services
902,901.860.000.00
902,901.870.000.00
878,836.920.000.00
922,899.630.000.00
839,898.410.000.00
Costs:Products: Hours:
Activity 471250 - Management, Supervision, and Administrative Services for Patrol
5,109,470.310.00
28,494.00
5,308,779.810.00
29,547.33
5,302,694.710.00
27,916.00
5,536,940.400.00
27,916.00
5,050,514.310.00
29,357.20
Costs:Products: Hours:
605

Program 471 - Police Services
Program Performance BudgetCity of Sunnyvale
Service Delivery Plan 47102 - Management, Supervision, and Administration
Budget2015/2016
Actual2014/2015
Actual2015/2016
Current2016/2017 2017/2018
Plan
Activity 471260, 471261 - SWAT Training
254,079.770.00
1,800.00
307,577.200.00
2,430.80
262,524.490.00
1,800.00
276,887.840.00
1,800.00
287,926.210.00
2,313.50
Costs:Products: Hours:
40,760.00
7,738,388.69 8,126,018.45
42,484.68
7,734,564.53 8,095,516.63
Totals for Service Delivery Plan 47102 - Management, Supervision, and Administration
7,461,737.88
40,243.71Hours:
Costs:
38,162.00 38,162.00
606

Program 471 - Police Services
Program Performance BudgetCity of Sunnyvale
Service Delivery Plan 47103 - Desk Officer Services
Budget2015/2016
Actual2014/2015
Actual2015/2016
Current2016/2017 2017/2018
Plan
Activity 471310 - Prepare Crime ReportsProduct: A Report Taken
125,635.542,500.00
804.00
179,022.911,810.001,187.37
162,619.751,966.001,000.00
170,887.711,966.001,000.00
133,411.311,824.00
922.78
Costs:Products: Hours:
Activity 471320 - Provide Jail Processing ServicesProduct: A Jail Processing Service Rendered
135,323.85900.00866.00
36,341.85302.00241.61
81,309.87619.00500.00
85,443.86619.00500.00
62,201.28499.00425.86
Costs:Products: Hours:
Activity 471330 - Provide Customer Service [Deleted]
521,449.960.00
3,337.00
92,948.730.00
622.56
0.000.000.00
0.000.000.00
63,196.570.00
439.29
Costs:Products: Hours:
Activity 471340 - Preshift Desk Officer [Deleted]
53,910.760.00
345.00
49,181.910.00
316.50
0.000.000.00
0.000.000.00
51,170.870.00
338.50
Costs:Products: Hours:
Activity 471350 - Desk Officer Activities (ticket sign-offs, citizen contact, customer service, building security, other calls for service, etc.)
0.000.000.00
0.000.000.00
130,095.790.00
800.00
136,710.160.00
800.00
0.000.000.00
Costs:Products: Hours:
607

Program 471 - Police Services
Program Performance BudgetCity of Sunnyvale
Service Delivery Plan 47103 - Desk Officer Services
Budget2015/2016
Actual2014/2015
Actual2015/2016
Current2016/2017 2017/2018
Plan
Activity 471360 - Desk Officer Non-Directed (All time that is NOT captured in Other Activities to show the "Available" time.)
0.000.000.00
0.000.000.00
690,808.660.00
4,248.00
725,931.020.00
4,248.00
0.000.000.00
Costs:Products: Hours:
5,352.00
836,320.11 357,495.40
2,368.04
1,064,834.07 1,118,972.75
Totals for Service Delivery Plan 47103 - Desk Officer Services
309,980.03
2,126.43Hours:
Costs:
6,548.00 6,548.00
608

Program 471 - Police Services
Program Performance BudgetCity of Sunnyvale
Service Delivery Plan 47104 - Traffic Enforcement
Budget2015/2016
Actual2014/2015
Actual2015/2016
Current2016/2017 2017/2018
Plan
Activity 471400 - Provide Traffic Safety EnforcementProduct: An Enforcement Stop
505,548.783,500.003,322.00
304,341.413,295.001,847.60
677,706.171,800.004,240.00
712,399.361,800.004,240.00
182,856.051,385.001,049.50
Costs:Products: Hours:
Activity 471410 - Investigate Major AccidentsProduct: A Major Accident Investigated
44,534.9820.00
285.00
30,451.724.00
198.20
65,894.8115.00
425.00
69,309.6715.00
425.00
83,550.589.00
551.00
Costs:Products: Hours:
Activity 471420 - Provide Court ActivitiesProduct: A Court Appearance
62,912.44250.00415.00
24,835.81100.00160.10
24,392.9675.00
150.00
25,633.1675.00
150.00
32,296.9532.00
170.20
Costs:Products: Hours:
Activity 471430 - Training for Traffic Unit
98,659.080.00
600.00
187,484.900.00
1,107.60
90,016.060.00
550.00
94,705.970.00
550.00
155,873.660.00
940.80
Costs:Products: Hours:
Activity 471450 - Provide Taxi InspectionsProduct: An Inspection Completed
5,469.21100.00
35.00
1,788.3868.0011.00
5,691.69100.00
35.00
5,981.08100.00
35.00
2,656.6993.0016.50
Costs:Products: Hours:
609

Program 471 - Police Services
Program Performance BudgetCity of Sunnyvale
Service Delivery Plan 47104 - Traffic Enforcement
Budget2015/2016
Actual2014/2015
Actual2015/2016
Current2016/2017 2017/2018
Plan
Activity 471460, 471461, 471462, 471463, 471464, 471465 - Special Enforcement Campaign [Deleted]Product: An Enforcement Campaign Conducted
6,781.0210.0050.00
0.000.000.00
0.000.000.00
0.000.000.00
7,681.470.00
11.00
Costs:Products: Hours:
Activity 471470, 471471, 471472, 471473, 471474, 471475, 471476, 471477, 471478 - Traffic Enforcement - SLES [Deleted]
0.000.000.00
0.000.000.00
0.000.000.00
0.000.000.00
5,269.090.000.00
Costs:Products: Hours:
Activity 471480 - Rental Rates - Traffic Enforcement
59,383.790.000.00
59,383.740.000.00
60,454.670.000.00
63,485.720.000.00
60,136.310.000.00
Costs:Products: Hours:
Activity 471490 - Supervision - Traffic Enforcement
278,384.510.00
1,540.00
303,764.030.00
1,571.80
316,893.400.00
1,680.00
334,215.450.00
1,680.00
227,347.810.00
1,244.10
Costs:Products: Hours:
Activity 471500 - Operation Hot Spot Enforcement, Data Driven Approach to Crime and Traffic Safety [Deleted]Product: An Operation Conducted
66,623.6620.00
468.00
121.650.001.00
0.000.000.00
0.000.000.00
3,959.818.00
26.00
Costs:Products: Hours:
610

Program 471 - Police Services
Program Performance BudgetCity of Sunnyvale
Service Delivery Plan 47104 - Traffic Enforcement
Budget2015/2016
Actual2014/2015
Actual2015/2016
Current2016/2017 2017/2018
Plan
Activity 471510, 471511 - Ancillary Duties
31,252.620.00
200.00
53,816.790.00
338.00
32,523.950.00
200.00
34,177.540.00
200.00
94,469.830.00
604.60
Costs:Products: Hours:
Activity 471520 - Response to Community ComplaintsProduct: A Complaint Received and Responded To
0.000.000.00
0.000.000.00
48,785.92175.00300.00
51,266.31175.00300.00
0.000.000.00
Costs:Products: Hours:
6,915.00
1,159,550.09 965,988.43
5,235.30
1,322,359.63 1,391,174.26
Totals for Service Delivery Plan 47104 - Traffic Enforcement
856,098.25
4,613.70Hours:
Costs:
7,580.00 7,580.00
611

Program 471 - Police Services
Program Performance BudgetCity of Sunnyvale
Service Delivery Plan 47105 - Street Crimes Unit
Budget2015/2016
Actual2014/2015
Actual2015/2016
Current2016/2017 2017/2018
Plan
Activity 471600 - Street Crimes Enforcement Team
665,843.210.00
3,988.00
79,092.800.00
472.10
98,186.680.00
541.30
108,358.560.00
541.30
9,785.580.00
79.70
Costs:Products: Hours:
Activity 471610 - Street Crimes Enforcement Team (SLES)
268,717.670.00
1,589.00
268,631.500.00
1,496.00
262,618.890.00
1,275.70
243,315.660.00
1,275.70
268,374.880.00
1,547.50
Costs:Products: Hours:
5,577.00
934,560.88 347,724.30
1,968.10
360,805.57 351,674.22
Totals for Service Delivery Plan 47105 - Street Crimes Unit
278,160.46
1,627.20Hours:
Costs:
1,817.00 1,817.00
30,239,076.04
191,691.90
27,703,170.35
177,432.84
25,697,356.15
169,478.70
Costs:
Hours: 187,616.00 187,616.00
30,771,586.53 32,314,246.96
Totals for Program 471
612

Program 472 - Fire Services
Program Performance BudgetCity of Sunnyvale
Service Delivery Plan 47201 - Fire Field Services
Budget2015/2016
Actual2014/2015
Actual2015/2016
Current2016/2017 2017/2018
Plan
Activity 472110, 472111, 472112, 472113, 472114 - Fire Response to Fire Events - Provide Appropriate Resources to the Scene of Fire Events to Minimize the Emergency's Impact on Life and Property
Product: An Incident1,760,794.79
1,800.0011,584.00
1,522,650.391,908.00
10,559.53
1,892,789.251,800.00
12,000.00
1,993,643.441,800.00
12,000.00
1,122,493.351,791.007,884.09
Costs:Products: Hours:
Activity 472120 - Fire Response to Medical Events - Provide Appropriate Resources to the Scene of an Emergency Medical Call, whether Emergency, Urgent, or Routine
Product: An Incident2,212,473.39
5,700.0014,000.00
1,329,560.995,867.008,420.88
2,282,241.305,700.00
14,000.00
2,400,880.135,700.00
14,000.00
1,308,051.715,647.008,546.89
Costs:Products: Hours:
Activity 472130 - Fire Safety Inspections - Maintain Fire Reduction Efforts through Annual Inspections of Community Businesses with Corrective Citations as Necessary
Product: An Inspection (Visit)164,861.15
2,600.001,000.00
158,618.982,855.00
990.26
174,501.582,600.001,034.00
183,517.722,600.001,034.00
153,553.132,536.001,008.74
Costs:Products: Hours:
Activity 472140 - Fire Safety Community Education - Provide Education in the Field through the Provision of School Tours, Support of Courses on Fire Safety, and Ad Hoc Opportunities for Education
Product: An Event Conducted162,395.31
370.00970.00
155,612.72505.00981.69
137,257.82550.00808.00
144,372.01550.00808.00
138,704.09586.00907.75
Costs:Products: Hours:
27,554.00
4,300,524.64 3,166,443.08
20,952.36
4,486,789.95 4,722,413.30
Totals for Service Delivery Plan 47201 - Fire Field Services
2,722,802.28
18,347.47Hours:
Costs:
27,842.00 27,842.00
613

Program 472 - Fire Services
Program Performance BudgetCity of Sunnyvale
Service Delivery Plan 47203 - Management, Supervision, and Administrative Services
Budget2015/2016
Actual2014/2015
Actual2015/2016
Current2016/2017 2017/2018
Plan
Activity 472310 - Station and Equipment Maintenance - Daily Inspection and Correction of Problems with Apparatus, Equipment, and Station
3,990,131.120.00
25,454.00
3,423,726.240.00
21,687.82
4,412,354.470.00
26,737.00
4,642,774.280.00
26,737.00
3,572,350.000.00
23,283.00
Costs:Products: Hours:
Activity 472320, 472321, 472322 - Employee Training - Fire, Emergency Medical, and Police Training Received to Improve Skills and Maintain Certifications
4,230,781.620.00
26,572.00
3,687,314.070.00
23,858.59
4,065,540.400.00
24,462.00
4,277,479.840.00
24,462.00
3,307,350.150.00
21,858.11
Costs:Products: Hours:
Activity 472330 - Ancillary Activities - Assigned Projects, Policy Revisions, Prefire Surveys, Equipment, Research Projects, and Formal Structured Meetings
10,978,329.250.00
68,321.00
15,259,805.610.00
96,737.03
14,281,138.760.00
82,396.00
14,997,875.080.00
82,396.00
13,918,114.390.00
90,938.43
Costs:Products: Hours:
Activity 472350 - Rental Rates - Management, Supervision, and Administration
831,672.710.000.00
831,456.990.000.00
922,501.200.000.00
968,753.130.000.00
727,247.170.000.00
Costs:Products: Hours:
Activity 472360 - Management and Administrative Services - Fire Services
1,752,674.650.00
9,036.00
1,947,569.480.00
9,300.11
1,931,752.830.00
9,120.00
2,000,926.950.00
9,120.00
1,793,329.250.00
8,998.70
Costs:Products: Hours:
614

Program 472 - Fire Services
Program Performance BudgetCity of Sunnyvale
Service Delivery Plan 47203 - Management, Supervision, and Administrative Services
Budget2015/2016
Actual2014/2015
Actual2015/2016
Current2016/2017 2017/2018
Plan
Activity 472370 - Supervisory Services - Includes Work Hours Expended Supporting, Leading, and Managing Equipment and Personnel in Support of All Program Measures
1,530,844.210.00
8,481.00
937,879.320.00
5,952.65
1,111,662.450.00
5,875.00
1,172,308.800.00
5,875.00
928,447.120.00
6,068.29
Costs:Products: Hours:
137,864.00
23,314,433.56 26,087,751.71
157,536.20
26,724,950.11 28,060,118.08
Totals for Service Delivery Plan 47203 - Management, Supervision, and Administrative Services
24,246,838.08
151,146.53Hours:
Costs:
148,590.00 148,590.00
27,614,958.20
165,418.00
29,254,194.79
178,488.56
26,969,640.36
169,494.00
Costs:
Hours: 176,432.00 176,432.00
31,211,740.06 32,782,531.38
Totals for Program 472
615

This Page Intentionally Blank
616

Program 473 - Community Safety Services
Program Performance BudgetCity of Sunnyvale
Service Delivery Plan 47301 - Animal Control and Shelter Services
Budget2015/2016
Actual2014/2015
Actual2015/2016
Current2016/2017 2017/2018
Plan
Activity 473110 - Provide Animal Services - Respond and Investigate Animal Control Issues, Including Animal TransportProduct: Number of Animal Service Calls (Calls handled by Animal Services assigned personnel)
246,273.400.00
2,895.00
170,445.800.00
1,988.30
309,508.931,400.003,550.00
335,146.101,400.003,550.00
175,747.240.00
2,265.70
Costs:Products: Hours:
Activity 473120 - Provide Shelter Transport- Transportation of Sick, Injured, or Dead Animals to the Shelter [Deleted]Product: An Animal Transported
23,166.461,600.00
275.00
31,702.031,199.00
370.20
0.000.000.00
0.000.000.00
29,704.241,203.00
372.40
Costs:Products: Hours:
Activity 473130 - Employee Training for Animal Control [Deleted]
6,871.980.00
80.00
9,930.730.00
141.00
0.000.000.00
0.000.000.00
1,594.320.00
18.50
Costs:Products: Hours:
Activity 473140 - Rental Rates - Animal Control and Shelter Services
9,829.900.000.00
9,829.950.000.00
9,355.650.000.00
9,824.720.000.00
11,133.580.000.00
Costs:Products: Hours:
Activity 473150 - Management and Administrative Services for Community Safety [Deleted]
584,233.980.00
4,944.00
588,212.260.00
4,884.30
0.000.000.00
0.000.000.00
607,908.632.00
5,067.80
Costs:Products: Hours:
617

Program 473 - Community Safety Services
Program Performance BudgetCity of Sunnyvale
Service Delivery Plan 47301 - Animal Control and Shelter Services
Budget2015/2016
Actual2014/2015
Actual2015/2016
Current2016/2017 2017/2018
Plan
Activity 473160 - Supervisory Services for Community Safety [Deleted]
396,843.780.00
2,630.00
336,573.020.00
2,222.20
0.000.000.00
0.000.000.00
286,341.460.00
1,767.60
Costs:Products: Hours:
10,824.00
1,267,219.50 1,146,693.79
9,606.00
318,864.58 344,970.82
Totals for Service Delivery Plan 47301 - Animal Control and Shelter Services
1,112,429.47
9,492.00Hours:
Costs:
3,550.00 3,550.00
618

Program 473 - Community Safety Services
Program Performance BudgetCity of Sunnyvale
Service Delivery Plan 47302 - Management, Supervision and Administration
Budget2015/2016
Actual2014/2015
Actual2015/2016
Current2016/2017 2017/2018
Plan
Activity 473200 - Neighborhood Preservation and Animal Services Management
0.000.000.00
0.000.000.00
221,346.420.00
1,740.00
225,922.170.00
1,740.00
0.000.000.00
Costs:Products: Hours:
Activity 473210 - Administration and Support
0.000.000.00
0.000.000.00
285,151.040.00
3,500.00
305,160.390.00
3,500.00
0.000.000.00
Costs:Products: Hours:
Activity 473220 - Provide Facilities and Building Maintenance
0.000.000.00
0.000.000.00
124,981.410.00
1,850.00
135,977.530.00
1,850.00
0.000.000.00
Costs:Products: Hours:
0.00
0.00 0.00
0.00
631,478.87 667,060.09
Totals for Service Delivery Plan 47302 - Management, Supervision and Administration
0.00
0.00Hours:
Costs:
7,090.00 7,090.00
619

Program 473 - Community Safety Services
Program Performance BudgetCity of Sunnyvale
Service Delivery Plan 47303 - Office of Emergency Services (OES)
Budget2015/2016
Actual2014/2015
Actual2015/2016
Current2016/2017 2017/2018
Plan
Activity 473310, 473311, 473312, 473313, 473314 - Emergency Disaster Preparedness and Community OutreachProduct: An Event [Deleted]
277,623.63165.00
1,550.00
344,810.73280.00
1,965.80
333,427.950.00
1,785.00
351,688.990.00
1,785.00
288,004.88452.00
1,580.00
Costs:Products: Hours:
Activity 473320 - Employee Training for OES Unit
14,480.420.00
80.00
34,129.740.00
214.80
15,205.370.00
80.00
16,033.620.00
80.00
8,533.980.00
53.90
Costs:Products: Hours:
Activity 473330 - Provide City Preparedness Services [Deleted]
40,281.980.00
235.00
25,267.960.00
339.50
0.000.000.00
0.000.000.00
58,514.600.00
434.60
Costs:Products: Hours:
1,865.00
332,386.03 404,208.43
2,520.10
348,633.32 367,722.61
Totals for Service Delivery Plan 47303 - Office of Emergency Services (OES)
355,053.46
2,068.50Hours:
Costs:
1,865.00 1,865.00
620

Program 473 - Community Safety Services
Program Performance BudgetCity of Sunnyvale
Service Delivery Plan 47304 - Crime Prevention
Budget2015/2016
Actual2014/2015
Actual2015/2016
Current2016/2017 2017/2018
Plan
Activity 473410 - Provide Specialized Services to Neighborhoods, Schools, and BusinessesProduct: An Event
1,207,783.062,400.009,905.00
1,179,899.561,775.008,598.01
1,594,174.762,400.00
11,735.00
1,682,775.162,400.00
11,735.00
1,157,106.251,834.009,148.10
Costs:Products: Hours:
Activity 473430 - Crossing Guard Program
416,961.550.00
16,275.00
316,916.080.00
12,183.71
362,668.620.00
15,400.00
149,213.150.000.00
360,039.950.00
13,469.80
Costs:Products: Hours:
Activity 473440 - Provide Nuisance Vehicle Abatement - Mark, Tag, and Tow Vehicles through the Abandoned Vehicle Abatement Service Authority Program [Deleted]
Product: A Vehicle Processed192,801.64
3,600.002,973.00
185,394.712,210.003,274.10
0.000.000.00
0.000.000.00
151,215.242,766.002,368.50
Costs:Products: Hours:
Activity 473450 - Provide Public Safety for Contractual Events
0.000.000.00
35,965.110.00
282.60
0.000.000.00
0.000.000.00
35,185.840.00
298.40
Costs:Products: Hours:
Activity 473460 - Employee Training for Crime Prevention
57,320.000.00
360.00
96,306.971.00
543.10
59,717.150.00
360.00
62,777.100.00
360.00
79,087.140.00
463.90
Costs:Products: Hours:
621

Program 473 - Community Safety Services
Program Performance BudgetCity of Sunnyvale
Service Delivery Plan 47304 - Crime Prevention
Budget2015/2016
Actual2014/2015
Actual2015/2016
Current2016/2017 2017/2018
Plan
Activity 473480 - Enforce Parking Standards [Deleted]Product: A Citation Issued
151,810.854,750.002,620.00
104,646.826,378.002,075.10
0.000.000.00
0.000.000.00
83,086.334,580.002,175.10
Costs:Products: Hours:
32,133.00
2,026,677.10 1,919,129.25
26,956.62
2,016,560.53 1,894,765.41
Totals for Service Delivery Plan 47304 - Crime Prevention
1,865,720.75
27,923.80Hours:
Costs:
27,495.00 12,095.00
622

Program 473 - Community Safety Services
Program Performance BudgetCity of Sunnyvale
Service Delivery Plan 47305 - Neighborhood Preservation
Budget2015/2016
Actual2014/2015
Actual2015/2016
Current2016/2017 2017/2018
Plan
Activity 473510 - Conduct Code EnforcementProduct: A Case Closed
510,293.664,000.006,565.00
495,351.294,399.005,711.01
624,641.534,000.007,925.00
673,966.644,000.007,925.00
374,288.263,160.004,794.60
Costs:Products: Hours:
Activity 473520 - Employee Training for Neighborhood Preservation [Deleted]
12,980.910.00
160.00
9,721.910.00
125.10
0.000.000.00
0.000.000.00
2,425.470.00
29.50
Costs:Products: Hours:
Activity 473530 - Work with Targeted Neighborhoods to Improve Properties [Deleted]
39,512.610.00
500.00
0.000.000.00
0.000.000.00
0.000.000.00
0.000.000.00
Costs:Products: Hours:
Activity 473540 - Conduct Outreach, Education, and Clean-ups [Deleted]Product: An Event
16,457.8575.00
200.00
6,874.570.00
94.20
0.000.000.00
0.000.000.00
4,867.980.00
70.30
Costs:Products: Hours:
Activity 473550 - Rental Rates - Neighborhood Preservation
15,423.670.000.00
15,423.720.000.00
16,122.410.000.00
16,930.750.000.00
14,905.410.000.00
Costs:Products: Hours:
623

Program 473 - Community Safety Services
Program Performance BudgetCity of Sunnyvale
7,425.00
594,668.70 527,371.49
5,930.31
640,763.94 690,897.39
Totals for Service Delivery Plan 47305 - Neighborhood Preservation
396,487.12
4,894.40Hours:
Costs:
7,925.00 7,925.00
624

Program 473 - Community Safety Services
Program Performance BudgetCity of Sunnyvale
Service Delivery Plan 47306 - Vehicle Abatement/Parking Enforcement
Budget2015/2016
Actual2014/2015
Actual2015/2016
Current2016/2017 2017/2018
Plan
Activity 473600 - Provide Nuisance Vehicle Abatement - Mark, Tag, and Tow Vehicles through the Abandoned Vehicle Abatement Service Authority ProgramProduct: A Vehicle Processed
0.000.000.00
0.000.000.00
189,609.903,200.002,898.00
221,271.433,200.002,898.00
0.000.000.00
Costs:Products: Hours:
Activity 473610 - Enforce Parking StandardsProduct: A Citation Issued
0.000.000.00
0.000.000.00
153,184.335,240.002,620.00
182,421.165,240.002,620.00
0.000.000.00
Costs:Products: Hours:
0.00
0.00 0.00
0.00
342,794.23 403,692.59
Totals for Service Delivery Plan 47306 - Vehicle Abatement/Parking Enforcement
0.00
0.00Hours:
Costs:
5,518.00 5,518.00
4,220,951.33
52,247.00
3,997,402.96
45,013.03
3,729,690.80
44,378.70
Costs:
Hours: 53,443.00 38,043.00
4,299,095.47 4,369,108.91
Totals for Program 473
625

This Page Intentionally Blank
626

Program 474 - Personnel and Training
Program Performance BudgetCity of Sunnyvale
Service Delivery Plan 47401 - Recruitment and Selection
Budget2015/2016
Actual2014/2015
Actual2015/2016
Current2016/2017 2017/2018
Plan
Activity 474110, 474111 - Conduct Recruitment and Testing of PSO IT
382,689.850.00
3,210.00
734,267.330.00
5,740.50
337,303.210.00
2,550.00
358,383.510.00
2,550.00
366,040.120.00
2,594.20
Costs:Products: Hours:
Activity 474120 - Conduct Background Investigations for Non-Sworn OnlyProduct: A Background Completed
132,689.99150.00765.00
120,105.710.00
652.50
141,068.54150.00915.00
148,597.95150.00915.00
127,810.380.00
671.00
Costs:Products: Hours:
Activity 474130 - Employee Training for Recruitment and Selection [Deleted]
9,038.460.00
50.00
8,628.340.00
47.00
0.000.000.00
0.000.000.00
7,641.020.00
43.00
Costs:Products: Hours:
Activity 474140 - Coordinate All Academy Training
39,769.210.00
220.00
119.790.001.00
37,965.830.00
200.00
40,036.410.00
200.00
51,325.930.00
443.00
Costs:Products: Hours:
Activity 474170 - Cadet Program
0.000.000.00
0.000.000.00
79,947.960.00
3,768.00
89,538.550.00
3,768.00
0.000.000.00
Costs:Products: Hours:
627

Program 474 - Personnel and Training
Program Performance BudgetCity of Sunnyvale
4,245.00
564,187.51 863,121.17
6,441.00
596,285.54 636,556.42
Totals for Service Delivery Plan 47401 - Recruitment and Selection
552,817.45
3,751.20Hours:
Costs:
7,433.00 7,433.00
628

Program 474 - Personnel and Training
Program Performance BudgetCity of Sunnyvale
Service Delivery Plan 47402 - Training Services
Budget2015/2016
Actual2014/2015
Actual2015/2016
Current2016/2017 2017/2018
Plan
Activity 474200 - Fire Continuous Professional Training
225,740.920.00
1,280.00
293,711.440.00
1,574.80
403,272.510.00
2,313.00
425,631.700.00
2,313.00
268,780.170.00
1,489.70
Costs:Products: Hours:
Activity 474210, 474211 - Emergency Medical Services Continuous Professional Training
144,793.040.00
1,418.00
271,190.650.00
2,704.30
203,892.950.00
2,650.00
219,043.220.00
2,650.00
209,711.660.00
2,051.90
Costs:Products: Hours:
Activity 474220 - Firearms Training and Maintenance
79,425.300.00
1,070.00
90,588.910.00
1,015.20
70,598.960.00
1,070.00
72,499.840.00
1,070.00
82,871.030.00
962.10
Costs:Products: Hours:
Activity 474230 - Police Continuous Professional Training
265,510.130.00
1,500.00
251,447.110.00
1,393.00
403,133.180.00
2,312.00
425,483.780.00
2,312.00
295,669.860.00
1,687.50
Costs:Products: Hours:
Activity 474240 - Teaching Police Continuous Professional Training [Deleted]
141,254.070.00
1,075.00
86,367.910.00
607.60
0.000.000.00
0.000.000.00
115,230.770.00
855.90
Costs:Products: Hours:
629

Program 474 - Personnel and Training
Program Performance BudgetCity of Sunnyvale
Service Delivery Plan 47402 - Training Services
Budget2015/2016
Actual2014/2015
Actual2015/2016
Current2016/2017 2017/2018
Plan
Activity 474250 - Training for Sworn Police Training Services Personnel [Deleted]
43,505.820.00
272.00
14,389.830.00
87.80
0.000.000.00
0.000.000.00
49,129.980.00
285.00
Costs:Products: Hours:
Activity 474260 - Medical Event Review (Review of Medical Events and Provision of Quality Improvement Direction) [Deleted]Product: An Event Reviewed
26,548.7880.00
260.00
17,316.930.00
165.00
0.000.000.00
0.000.000.00
19,020.780.00
182.50
Costs:Products: Hours:
Activity 474270 - Rental Rates - Training Services
25,832.480.000.00
25,832.430.000.00
27,734.940.000.00
29,125.500.000.00
26,367.250.000.00
Costs:Products: Hours:
Activity 474280, 474281 - Administrative Support for Training Services
337,087.150.00
1,666.00
477,250.570.00
1,832.00
428,191.040.00
1,750.00
401,964.620.00
1,750.00
434,433.560.00
2,142.30
Costs:Products: Hours:
Activity 474290 - Supervisory Services for Police Training Services [Deleted]
63,269.210.00
350.00
2,334.190.00
12.50
0.000.000.00
0.000.000.00
33,381.150.00
190.00
Costs:Products: Hours:
630

Program 474 - Personnel and Training
Program Performance BudgetCity of Sunnyvale
Service Delivery Plan 47402 - Training Services
Budget2015/2016
Actual2014/2015
Actual2015/2016
Current2016/2017 2017/2018
Plan
Activity 474300 - Cadet Program [Deleted]
76,622.960.00
3,768.00
29,856.230.00
1,527.70
0.000.000.00
0.000.000.00
43,302.530.00
2,197.00
Costs:Products: Hours:
12,659.00
1,429,589.86 1,560,286.20
10,919.90
1,536,823.58 1,573,748.66
Totals for Service Delivery Plan 47402 - Training Services
1,577,898.74
12,043.90Hours:
Costs:
10,095.00 10,095.00
1,993,777.37
16,904.00
2,423,407.37
17,360.90
2,130,716.19
15,795.10
Costs:
Hours: 17,528.00 17,528.00
2,133,109.12 2,210,305.08
Totals for Program 474
631
This Page Intentionally Blank
632

Program 475 - Investigation Services
Program Performance BudgetCity of Sunnyvale
Service Delivery Plan 47501 - Police Investigations
Budget2015/2016
Actual2014/2015
Actual2015/2016
Current2016/2017 2017/2018
Plan
Activity 475110 - Provide Persons Crimes InvestigationsProduct: A Case Investigation
1,358,578.301,000.008,890.00
1,581,271.081,858.00
10,205.71
1,441,575.151,100.008,890.00
1,484,246.421,100.008,890.00
1,415,562.021,047.009,194.70
Costs:Products: Hours:
Activity 475120, 475121, 475122, 475123 - Provide Investigative Support and EnforcementProduct: A Case Investigation
1,087,215.22250.00
7,115.00
856,346.32409.00
5,337.40
1,129,788.63350.00
7,115.00
1,187,777.09350.00
7,115.00
944,358.54365.00
6,194.90
Costs:Products: Hours:
Activity 475130, 475131 - Provide Property Crimes InvestigationsProduct: A Case Investigation
815,264.492,200.005,335.00
864,260.302,451.005,392.50
847,191.851,600.005,335.00
890,674.491,600.005,335.00
715,029.621,443.004,620.40
Costs:Products: Hours:
Activity 475140 - Provide Crime Analysis
184,787.770.00
1,760.00
150,398.640.00
1,538.30
188,338.590.00
1,760.00
203,010.090.00
1,760.00
173,737.020.00
1,844.70
Costs:Products: Hours:
Activity 475150 - Employee Training for Investigations
178,935.640.00
1,120.00
171,094.120.00
1,036.80
186,487.610.00
1,120.00
196,081.330.00
1,120.00
362,424.410.00
2,244.70
Costs:Products: Hours:
633

Program 475 - Investigation Services
Program Performance BudgetCity of Sunnyvale
Service Delivery Plan 47501 - Police Investigations
Budget2015/2016
Actual2014/2015
Actual2015/2016
Current2016/2017 2017/2018
Plan
Activity 475160 - Rental Rates - Investigations
147,635.420.000.00
147,635.410.000.00
148,923.790.000.00
156,390.460.000.00
136,878.300.000.00
Costs:Products: Hours:
Activity 475170 - Management and Administration - Investigations
463,762.770.00
4,289.00
474,095.330.00
4,197.40
261,422.430.00
3,530.00
311,392.260.00
3,530.00
482,777.040.00
4,381.20
Costs:Products: Hours:
Activity 475180 - Supervisory Services for Investigations
627,277.660.00
3,520.00
748,451.020.00
4,136.70
658,100.920.00
3,520.00
694,188.650.00
3,520.00
551,530.590.00
3,073.30
Costs:Products: Hours:
32,029.00
4,863,457.27 4,993,552.22
31,844.81
4,861,828.97 5,123,760.79
Totals for Service Delivery Plan 47501 - Police Investigations
4,782,297.54
31,553.90Hours:
Costs:
31,270.00 31,270.00
4,863,457.27
32,029.00
4,993,552.22
31,844.81
4,782,297.54
31,553.90
Costs:
Hours: 31,270.00 31,270.00
4,861,828.97 5,123,760.79
Totals for Program 475
634

Program 476 - Communication Operations
Program Performance BudgetCity of Sunnyvale
Service Delivery Plan 47601 - Communication Services
Budget2015/2016
Actual2014/2015
Actual2015/2016
Current2016/2017 2017/2018
Plan
Activity 476110 - Directed Demands of Field Responders - Dispatch Response on SWAT Callouts, Support of DUI Enforcement Campaign, and Support of Special Enforcement Details
0.000.000.00
28,241.780.00
341.50
0.000.000.00
0.000.000.00
1,632.520.00
18.50
Costs:Products: Hours:
Activity 476120 - Dispatch Support of Police Events - Dispatch Time Spent on All Police Calls for Service from Receipt of Call to Close of Event [Deleted]
2,543,855.050.00
25,883.00
2,182,704.530.00
23,018.28
0.000.000.00
0.000.000.00
2,147,661.810.00
23,206.04
Costs:Products: Hours:
Activity 476130 - Dispatch Support of Fire Events - Dispatch Time Spent on All Fire Calls for Service from Reciept of Call to Close of Event [Deleted]
214,543.900.00
2,183.00
255,136.490.00
2,706.97
0.000.000.00
0.000.000.00
237,904.580.00
2,524.72
Costs:Products: Hours:
Activity 476140 - Dispatch Support of EMS Events - Dispatch Time Spent on All EMS Calls for Service from Receipt of Call to Close of Event [Deleted]
122,653.510.00
1,248.00
56,527.450.00
596.48
0.000.000.00
0.000.000.00
55,269.780.00
598.36
Costs:Products: Hours:
Activity 476150 - Dispatch Support of All Animal Control - Dispatch Time Spent on All Animal Control Calls for Service from Receipt of Call to Close of Event [Deleted]
183,889.390.00
1,871.00
560,579.000.00
5,977.10
0.000.000.00
0.000.000.00
561,559.900.00
6,077.58
Costs:Products: Hours:
635

Program 476 - Communication Operations
Program Performance BudgetCity of Sunnyvale
Service Delivery Plan 47601 - Communication Services
Budget2015/2016
Actual2014/2015
Actual2015/2016
Current2016/2017 2017/2018
Plan
Activity 476160 - New Dispatcher Training
0.000.000.00
35,602.300.00
501.60
144,119.890.00
1,800.00
148,380.090.00
1,800.00
410,006.230.00
5,571.50
Costs:Products: Hours:
Activity 476180 - Dispatch Hours Allocation Activity for Public Safety Dispatcher [Deleted]
0.000.000.00
17,862.100.000.00
0.000.000.00
0.000.000.00
12.860.000.00
Costs:Products: Hours:
Activity 476190 - Dispatch Hours Allocation for Senior Public Safety Dispatcher [Deleted]
0.000.000.00
6,258.560.000.00
0.000.000.00
0.000.000.00
0.000.000.00
Costs:Products: Hours:
Activity 476100 - Dispatchers' Support, Communications, and OperationsProduct: All Calls, Incoming and Outgoing
0.000.000.00
0.000.000.00
3,468,657.03160,000.00
34,749.00
3,565,682.35160,000.00
34,749.00
0.000.000.00
Costs:Products: Hours:
31,185.00
3,064,941.85 3,142,912.21
33,141.93
3,612,776.92 3,714,062.44
Totals for Service Delivery Plan 47601 - Communication Services
3,414,047.68
37,996.70Hours:
Costs:
36,549.00 36,549.00
636

Program 476 - Communication Operations
Program Performance BudgetCity of Sunnyvale
Service Delivery Plan 47602 - Management Supervisory and Administrative Support Services
Budget2015/2016
Actual2014/2015
Actual2015/2016
Current2016/2017 2017/2018
Plan
Activity 476210 - Supervisiory Services, Systems Administration, Electronic and Audio Reports
188,886.060.00
1,740.00
234,214.420.00
2,167.00
199,462.850.00
1,765.00
204,758.150.00
1,765.00
194,101.760.00
1,848.70
Costs:Products: Hours:
Activity 476220 - Mandated Staff Training and Development for Communication Services
76,396.310.00
774.00
101,122.730.00
1,105.60
78,943.030.00
774.00
81,100.590.00
774.00
94,701.960.00
1,055.70
Costs:Products: Hours:
Activity 476230 - Management of Communication Services Staff in Support of All Program Measures
275,854.980.00
1,790.00
277,239.380.00
1,703.00
301,202.360.00
1,790.00
301,969.540.00
1,790.00
287,450.250.00
1,800.00
Costs:Products: Hours:
4,304.00
541,137.35 612,576.53
4,975.60
579,608.24 587,828.28
Totals for Service Delivery Plan 47602 - Management Supervisory and Administrative Support Services
576,253.97
4,704.40Hours:
Costs:
4,329.00 4,329.00
637

Program 476 - Communication Operations
Program Performance BudgetCity of Sunnyvale
Service Delivery Plan 47603 - Work Hours Balancing Account
Budget2015/2016
Actual2014/2015
Actual2015/2016
Current2016/2017 2017/2018
Plan
Activity 476310 - Work Hours Balancing Account (Dispatch) (Variations and Fluctuations in Time and Hours for Dispatch Personnel)
0.000.000.00
4,947.500.00
73.20
0.000.000.00
0.000.000.00
15,117.390.00
172.10
Costs:Products: Hours:
0.00
0.00 4,947.50
73.20
0.00 0.00
Totals for Service Delivery Plan 47603 - Work Hours Balancing Account
15,117.39
172.10Hours:
Costs:
0.00 0.00
3,606,079.20
35,489.00
3,760,436.24
38,190.73
4,005,419.04
42,873.20
Costs:
Hours: 40,878.00 40,878.00
4,192,385.16 4,301,890.72
Totals for Program 476
638

Program 477 - Public Safety Administrative Services
Program Performance BudgetCity of Sunnyvale
Service Delivery Plan 47701 - Professional Standards
Budget2015/2016
Actual2014/2015
Actual2015/2016
Current2016/2017 2017/2018
Plan
Activity 477110 - Conduct Professional Standards Investigations, Including Complaints and Conduct of Public Safety Employees
312,231.360.00
1,720.00
327,428.530.00
1,729.90
325,057.930.00
1,720.00
342,705.260.00
1,720.00
323,336.510.00
1,766.80
Costs:Products: Hours:
Activity 477130 - Staff Training and Development - Professional Standards
0.000.000.00
0.000.000.00
22,779.500.00
120.00
24,021.850.00
120.00
0.000.000.00
Costs:Products: Hours:
1,720.00
312,231.36 327,428.53
1,729.90
347,837.43 366,727.11
Totals for Service Delivery Plan 47701 - Professional Standards
323,336.51
1,766.80Hours:
Costs:
1,840.00 1,840.00
639

Program 477 - Public Safety Administrative Services
Program Performance BudgetCity of Sunnyvale
Service Delivery Plan 47702 - Management, Supervisory and Administrative Support Services
Budget2015/2016
Actual2014/2015
Actual2015/2016
Current2016/2017 2017/2018
Plan
Activity 477210 - Provide Administrative Planning and Analysis [Deleted]
214,979.780.00
1,790.00
220,342.770.00
1,789.00
0.000.000.00
0.000.000.00
204,051.490.00
1,801.00
Costs:Products: Hours:
Activity 477220 - Provide Facilities and Building Maintenance [Deleted]
144,022.870.00
2,030.00
176,920.970.00
2,358.00
0.000.000.00
0.000.000.00
168,554.560.00
2,266.00
Costs:Products: Hours:
Activity 477230 - Management, Supervision, and Administration
1,784,914.640.00
8,465.00
2,136,044.900.00
8,713.31
2,531,569.210.00
12,105.00
2,638,146.170.00
12,105.00
2,216,193.460.00
9,325.30
Costs:Products: Hours:
Activity 477240, 477241, 477242, 477243, 477244, 477245, 477246, 477247, 477248 - Administer Outside Contracts
1,287,262.630.000.00
1,262,929.550.000.00
1,343,613.360.000.00
1,913,909.890.000.00
1,358,425.580.001.50
Costs:Products: Hours:
Activity 477250 - Modified Duty Assignments
414,578.580.000.00
793,424.410.00
4,975.80
414,100.000.000.00
414,100.000.000.00
494,435.480.00
3,212.90
Costs:Products: Hours:
640

Program 477 - Public Safety Administrative Services
Program Performance BudgetCity of Sunnyvale
Service Delivery Plan 47702 - Management, Supervisory and Administrative Support Services
Budget2015/2016
Actual2014/2015
Actual2015/2016
Current2016/2017 2017/2018
Plan
Activity 477280 - Provide Personnel Services Including Payroll and Human Resources
189,059.650.00
2,450.00
198,375.610.00
2,517.30
194,567.690.00
2,450.00
207,878.500.00
2,450.00
206,472.490.00
2,602.70
Costs:Products: Hours:
Activity 477290 - Staff Training and Development for Administrative Services [Deleted]
21,692.310.00
120.00
4,277.970.00
24.00
0.000.000.00
0.000.000.00
0.000.000.00
Costs:Products: Hours:
14,855.00
4,056,510.46 4,792,316.18
20,377.41
4,483,850.26 5,174,034.56
Totals for Service Delivery Plan 47702 - Management, Supervisory and Administrative Support Services
4,648,133.06
19,209.40Hours:
Costs:
14,555.00 14,555.00
641

Program 477 - Public Safety Administrative Services
Program Performance BudgetCity of Sunnyvale
Service Delivery Plan 47703 - Work Hours Balancing Account - Sworn Officers
Budget2015/2016
Actual2014/2015
Actual2015/2016
Current2016/2017 2017/2018
Plan
Activity 477310 - Work Hours Balancing Account - Variations and Fluctuations in Time and Hours for Sworn Officer Assigned to Police and Fire Field Operations
0.000.000.00
172,269.850.00
1,109.40
0.000.000.00
0.000.000.00
184,437.020.00
1,183.40
Costs:Products: Hours:
0.00
0.00 172,269.85
1,109.40
0.00 0.00
Totals for Service Delivery Plan 47703 - Work Hours Balancing Account - Sworn Officers
184,437.02
1,183.40Hours:
Costs:
0.00 0.00
642

Program 477 - Public Safety Administrative Services
Program Performance BudgetCity of Sunnyvale
Service Delivery Plan 47704 - Grants, Licenses, and Permits
Budget2015/2016
Actual2014/2015
Actual2015/2016
Current2016/2017 2017/2018
Plan
Activity 477410 - Alarm Permits and BillingProduct: An Alarm Permit Processed (new, renewed or discontinued)
122,208.696,200.001,500.00
146,415.758,206.001,740.00
123,053.994,500.001,430.00
132,258.314,500.001,430.00
146,078.265,992.001,641.50
Costs:Products: Hours:
Activity 477420 - DPS Licensing /Permitting ServicesProduct: A Permit or a License Processed
98,723.80300.00
1,334.00
114,320.54137.00
1,614.80
104,853.44300.00
1,475.00
113,212.30300.00
1,475.00
111,478.36221.00
1,512.50
Costs:Products: Hours:
Activity 477430 - Grant Management and Oversight [Deleted]
145,680.190.00
1,350.00
40,123.400.00
437.80
0.000.000.00
0.000.000.00
115,798.150.00
1,353.70
Costs:Products: Hours:
Activity 477440 - Management of Grants, Licensing, and Permits
24,385.310.00
200.00
109,734.930.00
1,164.80
190,164.330.00
1,790.00
194,357.470.00
1,790.00
0.000.000.00
Costs:Products: Hours:
Activity 477450 - False Alarm ComplianceProduct: A False Alarm Processed (billed and non-billable)
0.000.000.00
0.000.000.00
25,957.511,500.00
320.00
28,009.481,500.00
320.00
0.000.000.00
Costs:Products: Hours:
643
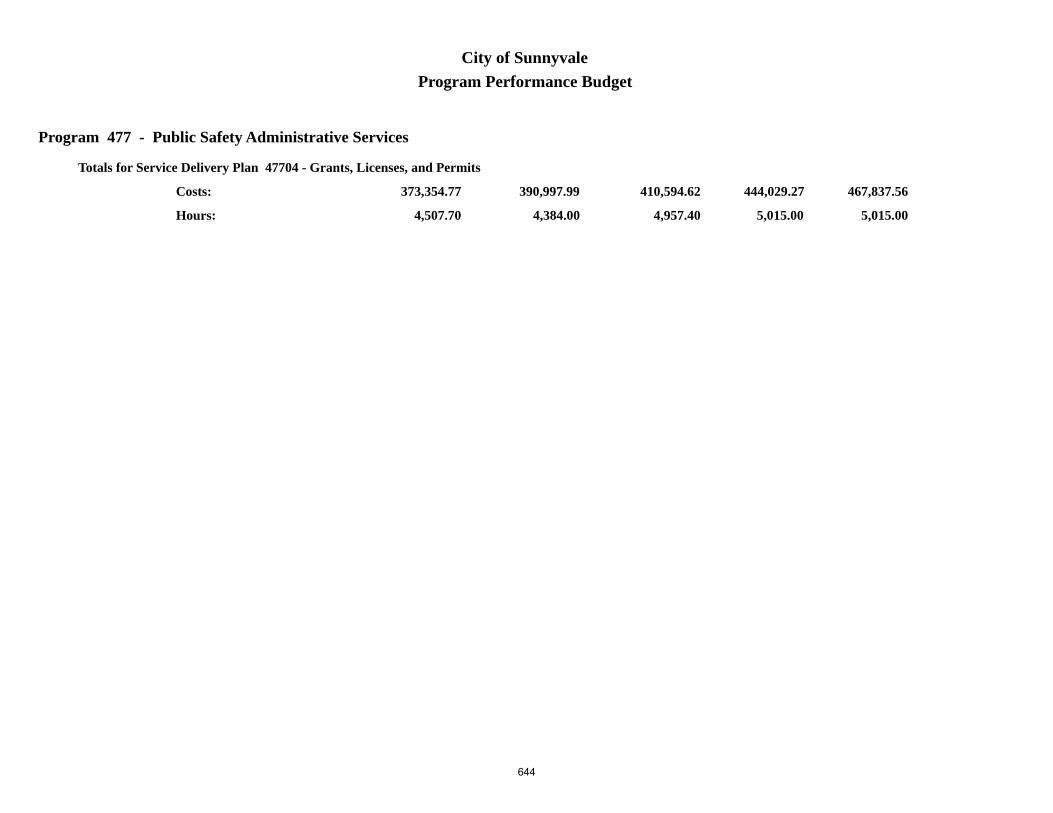
Program 477 - Public Safety Administrative Services
Program Performance BudgetCity of Sunnyvale
4,384.00
390,997.99 410,594.62
4,957.40
444,029.27 467,837.56
Totals for Service Delivery Plan 47704 - Grants, Licenses, and Permits
373,354.77
4,507.70Hours:
Costs:
5,015.00 5,015.00
644

Program 477 - Public Safety Administrative Services
Program Performance BudgetCity of Sunnyvale
Service Delivery Plan 47798 - Allocated Costs
Budget2015/2016
Actual2014/2015
Actual2015/2016
Current2016/2017 2017/2018
Plan
Activity 477950 - Public Safety Sworn Specialty Pay Allocation
494,664.000.000.00
0.000.000.00
494,664.000.000.00
494,664.000.000.00
0.000.000.00
Costs:Products: Hours:
0.00
494,664.00 0.00
0.00
494,664.00 494,664.00
Totals for Service Delivery Plan 47798 - Allocated Costs
0.00
0.00Hours:
Costs:
0.00 0.00
5,254,403.81
20,959.00
5,702,609.18
28,174.11
5,529,261.36
26,667.30
Costs:
Hours: 21,410.00 21,410.00
5,770,380.96 6,503,263.23
Totals for Program 477
645

This Page Intentionally Blank
646

Program 478 - Records Management and Property Services
Program Performance BudgetCity of Sunnyvale
Service Delivery Plan 47801 - Records Management and Information Services
Budget2015/2016
Actual2014/2015
Actual2015/2016
Current2016/2017 2017/2018
Plan
Activity 478110 - Records and Information Services - Research Requests for Information
1,010,035.430.00
14,706.00
961,472.400.00
13,977.11
520,125.260.00
7,431.00
561,690.850.00
7,431.00
1,003,581.990.00
14,105.90
Costs:Products: Hours:
Activity 478120 - Court Services - Prepare and Submit All In Custody and Out of Custody Reports and Related Data to the District Attorney's OfficeProduct: A Court Processed Transaction
276,013.795,300.004,075.00
311,269.386,077.004,499.90
281,250.215,300.004,075.00
303,743.915,300.004,075.00
330,644.775,236.004,710.30
Costs:Products: Hours:
Activity 478140 - Employee Training for Records Management and Information Services [Deleted]
14,341.270.00
190.00
18,575.250.00
236.60
0.000.000.00
0.000.000.00
18,359.710.00
252.60
Costs:Products: Hours:
Activity 478150 - Management and Supervisory Services for Records Management and Information Services
314,800.060.00
3,289.00
271,007.390.00
2,760.30
336,407.450.00
3,329.00
343,505.200.00
3,329.00
258,849.050.00
2,734.40
Costs:Products: Hours:
Activity 478180 - Provide Operational Support
0.000.000.00
0.000.000.00
457,050.670.00
7,425.00
491,065.580.00
7,425.00
0.000.000.00
Costs:Products: Hours:
647

Program 478 - Records Management and Property Services
Program Performance BudgetCity of Sunnyvale
22,260.00
1,615,190.55 1,562,324.42
21,473.91
1,594,833.59 1,700,005.54
Totals for Service Delivery Plan 47801 - Records Management and Information Services
1,611,435.52
21,803.20Hours:
Costs:
22,260.00 22,260.00
648

Program 478 - Records Management and Property Services
Program Performance BudgetCity of Sunnyvale
Service Delivery Plan 47802 - Data and Statistics Services
Budget2015/2016
Actual2014/2015
Actual2015/2016
Current2016/2017 2017/2018
Plan
Activity 478210 - Statistical Report - Provide Statistical Information on All Crimes Reported to and Citations Issued by the Department
6,257.070.00
100.00
20,406.110.00
307.20
6,377.980.00
100.00
6,890.410.00
100.00
17,476.280.00
265.50
Costs:Products: Hours:
Activity 478220 - Entry and Auditing Services - Enter, Audit, and Correct Automated Reporting System Reports, and Enter All Citations, Field Interview Cards and Other Miscellaneous Reports into the Records Management System and Other Related Databases
210,237.770.00
3,360.00
179,929.790.00
2,699.50
216,851.270.00
3,400.00
234,273.790.00
3,400.00
205,392.210.00
3,060.50
Costs:Products: Hours:
Activity 478230 - Employee Training for Data and Statistics Services [Deleted]
0.000.000.00
6,133.370.00
93.50
0.000.000.00
0.000.000.00
3,419.150.00
55.00
Costs:Products: Hours:
3,460.00
216,494.84 206,469.27
3,100.20
223,229.25 241,164.20
Totals for Service Delivery Plan 47802 - Data and Statistics Services
226,287.64
3,381.00Hours:
Costs:
3,500.00 3,500.00
649

Program 478 - Records Management and Property Services
Program Performance BudgetCity of Sunnyvale
Service Delivery Plan 47803 - Property and Evidence Services
Budget2015/2016
Actual2014/2015
Actual2015/2016
Current2016/2017 2017/2018
Plan
Activity 478310 - Property and Evidence Services - Process, Store, and Purge All Property and Evidence as RequiredProduct: A Property or Evidence Transaction
283,883.5413,500.00
4,320.00
317,039.5518,407.00
4,715.70
186,043.0018,000.00
2,450.00
200,810.1018,000.00
2,450.00
264,395.7015,397.00
3,703.70
Costs:Products: Hours:
Activity 478320 - Employee Training for Property and Evidence Services [Deleted]
8,462.800.00
120.00
1,319.330.00
17.00
0.000.000.00
0.000.000.00
154.360.002.00
Costs:Products: Hours:
Activity 478330 - Uniforms and EquipmentProduct: A Uniform and/or Equipment Transaction Processed
0.000.000.00
0.000.000.00
99,212.002,500.002,850.00
104,543.693,000.002,850.00
0.000.000.00
Costs:Products: Hours:
4,440.00
292,346.34 318,358.88
4,732.70
285,255.00 305,353.79
Totals for Service Delivery Plan 47803 - Property and Evidence Services
264,550.06
3,705.70Hours:
Costs:
5,300.00 5,300.00
2,124,031.73
30,160.00
2,087,152.57
29,306.81
2,102,273.22
28,889.90
Costs:
Hours: 31,060.00 31,060.00
2,103,317.84 2,246,523.53
Totals for Program 478
650

Program 479 - Fire Prevention and Hazardous Material Services
Program Performance BudgetCity of Sunnyvale
Service Delivery Plan 47901 - Fire Prevention
Budget2015/2016
Actual2014/2015
Actual2015/2016
Current2016/2017 2017/2018
Plan
Activity 479100 - Provide Fire Safety Permit InspectionsProduct: An Inspection
152,407.31531.00
1,915.00
132,453.42612.00
1,877.30
155,339.49650.00
1,915.00
442,456.01650.00
5,435.00
129,393.74650.00
1,921.80
Costs:Products: Hours:
Activity 479110 - Provide Fire Safety InspectionsProduct: An Inspection
94,309.51314.00
1,185.00
27,296.17214.00421.50
96,123.92200.00
1,185.00
103,722.61200.00
1,185.00
34,488.55237.00518.00
Costs:Products: Hours:
Activity 479120 - Consultation and Coordination
15,917.210.00
200.00
19,264.320.00
309.50
16,223.440.00
200.00
17,505.930.00
200.00
31,342.930.00
470.00
Costs:Products: Hours:
Activity 479130 - Employee Training - Fire Prevention
15,917.210.00
200.00
1,089.720.00
22.30
16,223.440.00
200.00
17,505.930.00
200.00
4,199.500.00
60.50
Costs:Products: Hours:
Activity 479150 - Management and Administration - Fire Prevention
127,484.380.00
1,260.00
166,689.670.00
1,576.90
308,121.870.00
1,260.00
315,259.630.00
1,260.00
160,040.090.00
1,622.90
Costs:Products: Hours:
651

Program 479 - Fire Prevention and Hazardous Material Services
Program Performance BudgetCity of Sunnyvale
4,760.00
406,035.62 346,793.30
4,207.50
592,032.16 896,450.11
Totals for Service Delivery Plan 47901 - Fire Prevention
359,464.81
4,593.20Hours:
Costs:
4,760.00 8,280.00
652

Program 479 - Fire Prevention and Hazardous Material Services
Program Performance BudgetCity of Sunnyvale
Service Delivery Plan 47902 - Hazmat Safety Services
Budget2015/2016
Actual2014/2015
Actual2015/2016
Current2016/2017 2017/2018
Plan
Activity 479200, 479201, 479202, 479203 - Inspect Hazmat FacilitiesProduct: An Inspection
485,383.451,200.004,130.00
427,091.601,154.003,760.20
488,562.781,200.004,090.00
674,435.111,200.005,850.00
358,465.231,038.003,057.60
Costs:Products: Hours:
Activity 479210 - Provide Consultation and Coordination
110,748.820.00
925.00
92,310.360.00
787.50
94,074.980.00
800.00
101,446.110.00
800.00
112,056.600.00
995.10
Costs:Products: Hours:
Activity 479220 - Employee Training for Hazmat Safety Services
48,823.960.00
350.00
85,933.390.00
694.70
48,567.010.00
350.00
51,760.540.00
350.00
27,913.610.00
208.50
Costs:Products: Hours:
Activity 479230 - Rental Rates - Hazmat Safety Services
10,996.920.000.00
9,641.580.000.00
9,658.620.000.00
10,142.880.000.00
9,651.980.000.00
Costs:Products: Hours:
Activity 479240 - Management and Administration - Hazmat Safety Services
169,422.460.00
1,545.00
248,065.920.00
2,582.00
207,330.160.00
1,670.00
212,345.750.00
1,670.00
215,321.560.00
1,964.30
Costs:Products: Hours:
653

Program 479 - Fire Prevention and Hazardous Material Services
Program Performance BudgetCity of Sunnyvale
6,950.00
825,375.61 863,042.85
7,824.40
848,193.55 1,050,130.39
Totals for Service Delivery Plan 47902 - Hazmat Safety Services
723,408.98
6,225.50Hours:
Costs:
6,910.00 8,670.00
654

Program 479 - Fire Prevention and Hazardous Material Services
Program Performance BudgetCity of Sunnyvale
Service Delivery Plan 47903 - Fire Protection Engineering
Budget2015/2016
Actual2014/2015
Actual2015/2016
Current2016/2017 2017/2018
Plan
Activity 479350, 479351 - Provide Construction InspectionProduct: An Inspection
304,667.843,093.002,646.00
200,333.513,001.001,744.20
453,933.393,300.003,874.00
489,240.093,300.003,874.00
204,599.933,016.001,709.70
Costs:Products: Hours:
Activity 479360 - Provide Consultation and Coordination
140,671.050.00
1,228.00
140,747.800.00
1,179.90
159,706.500.00
1,362.00
172,176.270.00
1,362.00
123,203.720.00
1,030.20
Costs:Products: Hours:
Activity 479370 - Provide Plan ReviewProduct: A Plan Processed
262,723.762,079.002,322.00
297,856.131,312.002,531.30
394,198.422,000.003,378.00
425,025.442,000.003,378.00
301,333.753,530.002,523.00
Costs:Products: Hours:
Activity 479380 - Employee Training - Fire Protection Engineering
10,459.940.00
94.00
2,699.000.00
21.60
41,744.140.00
356.00
45,003.490.00
356.00
35,561.630.00
326.70
Costs:Products: Hours:
Activity 479390 - Rental Rates - Fire Protection Engineering
21,458.520.000.00
21,387.340.000.00
20,771.620.000.00
21,813.060.000.00
21,307.130.000.00
Costs:Products: Hours:
655

Program 479 - Fire Prevention and Hazardous Material Services
Program Performance BudgetCity of Sunnyvale
Service Delivery Plan 47903 - Fire Protection Engineering
Budget2015/2016
Actual2014/2015
Actual2015/2016
Current2016/2017 2017/2018
Plan
Activity 479000 - Management and Administration - Fire Protection Engineering
70,982.940.00
440.00
48,943.570.00
292.50
74,724.560.00
440.00
76,978.320.00
440.00
49,310.450.00
304.50
Costs:Products: Hours:
6,730.00
810,964.05 711,967.35
5,769.50
1,145,078.63 1,230,236.67
Totals for Service Delivery Plan 47903 - Fire Protection Engineering
735,316.61
5,894.10Hours:
Costs:
9,410.00 9,410.00
656

Program 479 - Fire Prevention and Hazardous Material Services
Program Performance BudgetCity of Sunnyvale
Service Delivery Plan 47904 - Fire Prevention Services Management and Supervision
Budget2015/2016
Actual2014/2015
Actual2015/2016
Current2016/2017 2017/2018
Plan
Activity 479410 - Employee Training - FP/FPE Management
0.000.000.00
14,905.740.00
102.31
0.000.000.00
0.000.000.00
8,362.310.00
56.00
Costs:Products: Hours:
Activity 479420 - Rental Rate - FP/FPE Management
0.000.000.00
0.000.000.00
0.000.000.00
0.000.000.00
46.740.000.00
Costs:Products: Hours:
0.00
0.00 14,905.74
102.31
0.00 0.00
Totals for Service Delivery Plan 47904 - Fire Prevention Services Management and Supervision
8,409.05
56.00Hours:
Costs:
0.00 0.00
2,042,375.28
18,440.00
1,936,709.24
17,903.71
1,826,599.45
16,768.80
Costs:
Hours: 21,080.00 26,360.00
2,585,304.34 3,176,817.17
Totals for Program 479
657

This Page Intentionally Blank
658

Public Works

Public Works
Department DescriptionThe Department of Public Works constructs, maintains, and improves the City’s General and non-utility
infrastructure; and provides timely cost-effective, and quality services to the residents and businesses of Sunnyvale. Key service initiatives include traffic and transportation planning, pavement and street light operations, street trees, concrete maintenance, administration, engineering and Capital Improvement Program, fleet and facility services, neighborhood park and open space management, and golf course and tennis center operations.
General Information
Miles of City-owned Streets Maintained: 260
City Street Lights Maintained: 9,484
Miles of Sidewalk Maintained: 380
Miles of Curb and Gutter Maintained: 750
Number of City Trees Cared for: (approximately) 37,000
Neighborhood, Community and Mini Parks Maintained (22 sites): 176 acres
School Play Fields Maintained (18 sites): 95 acres
Programs and ServicesTransportation and Traffic Services
The Department’s Transportation and Traffic Services Division plans, operates, and maintains the City’s transportation system. It is responsible for performing traffic studies and roadway design, as well as for short and long-range transportation planning. The Division operates and maintains the City’s traffic signals and administers roadway signs and markings, including public on-street parking. The Division writes, procures and administers grants for transportation capital improvements, and coordinates and manages the delivery of projects. The Division reviews land development proposals to ensure interfaces with the public street system comply with design standards and traffic impacts are mitigated. The Division has responsibility for school, bicycle, and pedestrian safety programs, traffic calming, support to the City’s Bicycle and Pedestrian Advisory Commission, and provides intergovernmental relations support. The Division investigates and responds to customer inquiries regarding transportation and parking systems and conducts City policy studies on a variety of transportation related issues.
Pavement, Traffic Signs and Markings, Sidewalk Curb and Gutter Maintenance, Street Sweeping, and Roadside Easements
The Department’s Operations Division manages pavement and concrete maintenance with the objective of prolonging the street and sidewalk economic life to maximize the City’s investment and reduce liability. The Division also creates, installs, and maintains street striping, markings and signs. In addition, it performs street sweeping to maintain clean and safe roadways and street easements and reduce small particle pollutants from getting to waterways. Overlays and capital reconstruction of streets and sidewalks are managed as separate projects by the Public Works Engineering Division.
City of Sunnyvale FY 2017/18 Adopted Budget and Resource Allocation Plan
659

The following chart provides a historical perspective on both the types and quantities of pavement treatment applied annually within the City:
Total Square Footage Per Year
Reconstruction Mill/Overlay Chip Slurry
0
1,000,000
2,000,000
3,000,000
4,000,000
5,000,000
6,000,000
7,000,000
8,000,000
9,000,000
10,000,000
87 88 89 90 91 92 93 94 95 96 97 98 99 00 01 02 03 04 05 06 07 08 09 10 11 12 13 14 15 16
Squa
re F
oota
ge
Years
77777978
77
76
84
8380
7577
76
77
Street Lights
The Department’s Operations Division also manages the operation and maintenance of over 9,484 existing street lights. In addition, this division responds to resident and business complaints, and to emergency calls related to the City’s street lighting. The Division provides administrative and support services, to make certain the City’s street lights function in a safe, reliable, and cost-effective manner.
Street Tree Services
Street tree services are provided by the Parks, Golf and Street Trees Division. The Division maintains approximately 37,000 City street trees, promoting environmental functionality such as improve air quality, reduce stormwater runoff and provide habitat for wildlife, as well as promote aesthetics through care of the City’s urban forest. The Division prunes to maximize each tree’s structural integrity and to avoid branch/trunk failure. It also ensures removal of hazardous trees, and preserves and enhances the street tree population with replacement and new tree planting.
In FY 2015/16, City staff pruned over 2,382 trees with hazardous conditions, eliminating the current hazardous tree inventory. Additionally, there were 388 replacement plantings and 240 new trees planted to increase the urban forest.
City of Sunnyvale FY 2017/18 Adopted Budget and Resource Allocation Plan
660

Downtown Parking Lot Maintenance
The Department’s Operations Division provides corrective and preventive maintenance for the City’s five Downtown Parking District parking lots. The lots are funded by Parking District property owners for convenience of use, safety, and to attract customers to the Central Business District. The Division maintains the lots at established service levels. The downtown parking lots are located at Frances Street and Evelyn Avenue, Sunnyvale Avenue and Evelyn Avenue, Carroll Street and Evelyn Avenue, and two at Carroll Street and McKinley Avenue.
Work to repair drainage, accessibility, and pavement at Sunnyvale/Evelyn and McKinley/Carroll has been completed, along with slurry seal of the Carroll/Evelyn lots. In FY 2017/18, the parking lots at Sunnyvale/Evelyn and McKinley/Carroll will receive a slurry seal treatment to finalize the construction activities.
Public Works Administration
The Administration Division provides oversight for 12 operating programs and the Department of Public Works operating budget. Primary services include Council and legislative support; monitoring of accounting and budgetary reports and results of operations; property management services; special projects; and general administrative support in the areas of purchasing, main answer point, records management, personnel, and outside reporting.
Continued signs of an improved economy prompts much interest in City-owned properties and their availability for sale. City-owned properties that are no longer needed to provide City services have been approved by Council as surplus properties. 1484 Kifer Road (Unilever building) and 1050/1060 Innovatin Way (Onizuka Air Force Base parcels) are authorized for sale and are currently undergoing environmental assessments and property appraisals The Charles Street/Mathilda Avenue (Block 15) residential properties is currently in the predevelopment phase for proposed affordable housing project with a commercial element on the southeast corner of the development. The Administration Division will continue to manage real estate and leases for the City along with support for certain right-of-way projects.
The addition of 1.0 Senior Management Analyst is included for FY 2017/18 to provide analytical support to all Public Works divisions, including development services support, grant administration, and provide additional management and administrative oversight to all workgroups.
Capital Project Management
The Department’s Engineering Division plans, manages, and implements the City’s Capital Improvement Program. As part of this service, the Division prepares the City’s capital projects budget, including scoping, cost estimating, and scheduling of projects. The Division undertakes all aspects of implementation, including contract administration for design, construction, and project management. It provides planning, design development, and bidding services, as well as construction administration and inspection. In addition, the Division is responsible for claims avoidance, environmental and regulatory compliance, and monitoring.
Land Development – Engineering Services
The Department’s Engineering Division works with private developers and permit applicants to ensure compliance with land use and development standards. The Division provides information related to general engineering, utilities, property line, and design standards. It guides customers through the engineering review process, conducts timely construction inspections of private development affecting the public right-of-way, and establishes and reviews compliance with permit requirements. The Division also maintains and updates engineering records, as well as standard details and specifications. In addition, the Division maintains flood plain records and is responsible for compliance with Federal requirements pertaining to development within flood zone areas.
Neighborhood Parks and Open Space Management
The Department’s Parks and Open Space Management Program maintains over 770 acres of open space including parks, school playfields, regional open space, boulevard landscaping, and special use facilities. The Division ensures these areas are hazard-free, usable, and attractive for residents and the business community. Division staff cares for urban landscaping, which includes park trees, groundcovers, and ornamental water features. In addition, staff maintains recreational facilities including sport courts, athletic fields, playgrounds, picnic sites, multi-purpose
buildings, and support facilities such as auxiliary restrooms, hardscapes, park lighting systems, and furnishings.
City of Sunnyvale FY 2017/18 Adopted Budget and Resource Allocation Plan
661

Golf Course and Tennis Center Operations
The Parks, Golf and Street Trees Division is also responsible for Golf Course and Tennis Center operations. The Golf and Tennis Operations Enterprise Fund operates the City’s two golf courses, Sunnyvale Golf Course and Sunken Gardens Golf Course, as well as the Sunnyvale Tennis Center. Sunnyvale is an 18-hole course and Sunken Gardens is a 9-hole course with a lighted driving range. Together, both courses comprise 175 acres of safe, usable, and attractive golf facilities for Sunnyvale residents, visitors, and the business community. Restaurants and golf pro-shops are located at both courses. Staff offers golf lessons and instruction at all levels of play. Approximately 100,000 rounds of golf are played annually at the two courses.
The Sunnyvale Tennis Center is administered through a license agreement with a private operator. The Tennis Center is a 16-court facility with a pro-shop, locker rooms, and food services. The Center offers various tennis programs at school and park tennis facilities, including instruction and league play.
Fleet Services
The Department’s Operations Division provides fleet services to support City operations by providing a safe, functional, and dependable fleet of vehicles and equipment. The Fleet Services Unit is responsible for the acquisition, ongoing maintenance, and eventual disposition of all City vehicles. This includes many specialized vehicles required by City departments such as Public Safety, Environmental Services, and Public Works. Each year over 40 pieces of equipment and vehicles are replaced as planned, with the old vehicles sold at auction.
Facility Services
The Department’s Operations Division is responsible for maintaining City buildings in a safe, functional, and clean condition for all users. The Facilities Services Unit maintains 87 City buildings (approximately 485,509 square feet of floor space), including the Public Safety headquarters, six fire stations, the library, some park buildings, the Civic Center, the Community Center, and the Senior Center.
Facility Services has been working on replacing some of the older emergency generators that the City has for key buildings. Work is in progress related to the generator for the City Hall annex and for the Public Safety Administration Building. Replacement of the generators and updating of the control panels and wiring is also progressing for Fire Stations 1, 2, 3, 4 and 6.
City of Sunnyvale FY 2017/18 Adopted Budget and Resource Allocation Plan
662

Department Budget Summary
Public Works
Fund/Program Actual
2014/15Budget
2015/16Actual
2015/16Budget
2016/17Budget
2017/18
General Fund
Neighborhood Parks and Open Space Management 9,179,414 9,204,834 8,928,565 9,544,624 10,188,785
Pavement, Traffic Signs and Markings, Street Sweeping, and Roadside Easements
5,453,155 3,696,650 5,699,877 4,042,699 4,433,007
Public Works Administration 585,464 613,921 643,488 892,044 926,238
Street Lights 1,204,044 1,160,574 1,286,845 1,261,318 1,162,723
Transportation and Traffic Services 1,889,710 2,096,942 2,278,495 2,526,491 2,403,826
Urban Forestry 1,785,829 1,908,696 1,321,012 2,025,975 2,132,374
Parking District Fund
Downtown Parking Lot Maintenance 62,855 65,994 53,636 65,067 68,588
Land Development - Engineering Services 1,568 3,538 5,278 3,521 3,591
Neighborhood Parks and Open Space Management 48,890 47,210 62,614 52,940 57,305
Gas Tax Street Improvement Fund
Pavement, Traffic Signs and Markings, Street Sweeping, and Roadside Easements
0 2,025,000 0 2,025,000 2,025,000
Golf and Tennis Fund
Golf Course Operations 3,251,472 3,597,434 3,208,013 3,409,780 3,793,421
General Services
Capital Project Management and Environmental Sustainability 2,585,180 3,097,389 2,934,769 3,343,266 3,501,790
Facilities Services 4,119,047 4,212,031 4,056,014 4,512,843 4,662,753
Provision of Vehicles & Motorized Equipment 3,196,442 3,430,651 3,001,379 3,412,889 3,609,021
Development Enterprise Fund
Land Development - Engineering Services 1,176,655 1,355,242 1,300,194 1,932,790 2,157,500
Transportation and Traffic Services 310,511 226,911 287,029 614,345 654,369
Urban Forestry 35,823 25,279 35,608 42,541 44,103
TOTAL EXPENDITURES 34,886,059 36,768,296 35,192,816 39,708,133 41,824,394
City of Sunnyvale FY 2017/18 Adopted Budget and Resource Allocation Plan
663

Budget Overview and Significant ChangesFY 2017/18 is the second year of a two-year operating cycle. As such, there are modest changes to the Department’s
operating budget for FY 2017/18. The addition of 1.0 Senior Management Analyst is included to provide analytical support to all Public Works divisions, including development services support, grant administration, and provide additional management and administrative oversight to all workgroups.
FY 2017/18 will continue to experience high levels of construction activity (development and capital), neighborhood concerns, such as increased traffic, and request for services impacting all divisions within the Department. To meet established goals and maintain program service levels, positions and responsibilities within the Department were evaluated and restructured for optimum efficiency and service provision. Total budgeted positions in the Department for FY 2017/18 is to change from 186 to 187.
The FY 2016/17 Adopted Budget included 1.0 additional Senior Transportation Engineer, 1.0 term-limited Construction Inspector, and 2.0 term-limited Engineering Assistants, funded through the Development Enterprise Fund, to meet increasing development related and construction demands; and two term-limited positions, 1.0 Transportation & Traffic Manager and 1.0 Transportation Engineer, funded through a three-year agreement with Google, to assist with transportation related work. Finally, 1.0 Administrative Analyst was added to manage the City’s labor compliance program in response to changes to the state’s prevailing wage program.
Transportation and Traffic Operations
The Division of Transportation continues to experience a high level of activity largely due to the strengthened economy and peak development activity. The demand for traffic development studies and development project reviews has more than doubled and has been challenging for staff to meet established timelines for review while maintaining other program service levels. In FY 2016/17, the program added one Senior Transportation Engineer, funded through the Development Enterprise Fund, to help with review of complex and technical documents related to traffic impact analysis (TIAs) and development projects, as well as, assist with other division services such as warrant studies, speed studies and traffic calming studies. There has also been an increase in community interest in bike facilities and staff has implemented a number of projects with new progressive bike standards.
The Division will continue to work on several major projects and plans, many of which are funded through federal, state, and Measure B grants funds. These include the design of a reconstructed Mathilda/237 interchange (in partnership with the VTA), Mary Avenue Overcrossing Environmental Impact Report, Bernardo Avenue Undercrossing, Mary Avenue and Evelyn Avenue Railroad Grade crossings, grade separations at Lawrence Expressway, street light conversion to Light Emitting Diode (LED) and evaluation of the VTA’s El Camino Real Bus Rapid Transit project, implementation of Safe Routes to School projects, and monitoring of regional projects such as Caltrain electrification, and High Occupancy Tool lane projects on Highways 85, 237, and 101.
Street Operations
Increased emphasis on slurry seal and chip seal, as cost effective preventive methods to conserve the good condition of Sunnyvale streets, has included an increase of 12,000,000 sf of slurry seal (50% increase) and 400,000 sf of chip seal (33% increase). Concrete maintenance services continued with grinding of small sidewalk uplifts, and temporary patching or more significant damaged areas in advance of replacement. In FY 2015/16, two projects were put out to bid to make repairs at over 1,000 locations. Newly damaged curb and sidewalk areas are reported every week, and the inventory of backlog requiring a permanent repair has continued to be over 2,000 locations. Staff continues to investigate ways to quickly mitigate sidewalk displacements when they are identified, and to find alternative techniques to make both short term and long term repairs. In locations where the sidewalk has been lifted beyond the ability to ramp it and remain accessible, the concrete has been removed and replaced with asphalt as a smoother, temporary repair. Concrete sawing has also been tested in several locations to provide a longer-term solution without removal of the sidewalk panels. However, this method is not appropriate for severe lifting.
City of Sunnyvale FY 2017/18 Adopted Budget and Resource Allocation Plan
664

Street Lighting
The City owns and maintains approximately 9,484 street lights out of which twenty percent have already been changed to Light Emitting Diodes (LED) fixtures with funding provided by grants and PG&E rebates. The remaining street light inventory are now being changed to LEDs with and the Council approved $2.3 million in funding. This is underway, with the surveying work completed in FY 2016/17 and the lights being replaced in FY 2017/18. Repainting of metal light poles began in FY 2013/14, and has continued with over half of the poles painted to date. Work is anticipated to be completed in the next three years.
Capital Project Management
Upcoming work for the Capital Improvement Program includes the construction of two major bridge projects, Fair Oaks over Caltrain and Old Mountain View-Alviso Road over Calabazas Creek. Staff has also been busy working on the pavement rehabilitation and concrete replacement programs to meet council goals of PCI 80 for pavement, and to decrease the backlog of tripping hazards throughout the City. The master planning and the environmental process for the Sunnyvale Clean Water Program has been completed and staff is moving forward with the implementation phase. The first major project, a new Primary Treatment Facility is under construction and staff is also working on initial design work associated with several projects including: Caribbean Drive Parking and Trail Enhancements, a new Administration and Laboratory Building, a Condition Assessment and Secondary Treatment Improvements. Several “gap” projects are in the final phases of construction to ensure the existing plant continues to meet water quality regulations during the rebuild. Other utilities-related work includes the renovation of Storm Pump Station #1 and #2, as well as ongoing replacement of sewer and water mains.
Parks and Facilities-related projects will focus on renovation of the Community Center buildings and the design for the renovation of Fair Oaks Park, and design of the new Library and Learning Center at Lakewood Park and major renovation for the adjacent Lakewood Park.
Land Development Engineering
Development activity continues at a high level throughout the City and is expected to remain high over the next year. In response to the increased activity and resulting use of consultants to maintain service levels, three limited term positions have been filled which include two limited term Engineering Assistants and one term-limited Construction Inspector. Staff has been reviewing the Town Center project public improvement plans to keep to the developer’s schedule; construction is anticipated to begin FY 2017/18. Additionally, the encroachment permit workload is projected to stay high, as several utilities are working to increase service options they provide to the public.
Neighborhood Parks and Open Space Management
The Parks Program continues to explore options to reduce its carbon footprint and make the City’s open space more eco-friendly by reducing the amount of vehicles it uses, by switching to electric carts and using pesticides with the lowest toxicity. The California drought has continued to challenge Parks to reduce its water consumption by a goal of 30%. Some of these efforts include, optimizing water usage by installing drought tolerant plantings, utilizing efficient water management, and reducing grass areas without greatly impacting use by the surrounding
neighborhoods. The Program’s increasing use of integrated pest management principles has limited the numbers and amounts of pesticides used while maintaining service levels. These efforts will continue to help improve the quality of Sunnyvale parks and open space. Beginning in FY 2017/18, the Parks Division anticipates adding approximately 13 acres of open space in four new Park projects as part of new development.
City of Sunnyvale FY 2017/18 Adopted Budget and Resource Allocation Plan
665

Golf and Tennis Services
The past ten years have shown a decline in golf revenue reflecting a national trend. This has affected the number of rounds played at the golf courses, which have continued to decline, and additional General Fund transfers were made or approved during the last two and current fiscal years in the amount of $1.44 million to account for the loss in revenue (FY 2014/15: $140,000; FY 2015/16: $450,000; FY 2016/17: $850,000). This has kept the operations funding going, to allow for the establishment of new concessions, explore creative marketing strategies to attract new patrons and maximize revenue opportunities. Staff is cautiously optimistic with the restaurants open at both courses, that slow growth over the next several years is achievable, particularly in anticipation of the closure of other neighboring local golf courses.
Golf operations continue to face challenges over the long-term. These challenges include rising costs including water and retirement costs, continued deferred capital maintenance, in addition to the continued decline in the interest in golf nationally. Revenues are projected to grow at a modest rate of 2% per year. Cost reduction efforts will continue through operational efficiencies, including water conservation and a restructure plan that will reduce labor costs through personnel attrition. Although positive strides in reducing operating costs are being made, expenses are projected to grow faster than 2% per year. As reported to Council at the April 18, 2017 Meeting, Staff plans to evaluate options regarding golf course operations during the next fiscal year and will bring forward recommendations for Council consideration.
The Sunnyvale Tennis Center is operated by a contractor pursuant to a license agreement which has shown to have a significant, positive impact for both operating and capital programs in the Enterprise Fund. The agreement will generate license fees totaling more than two million dollars over its 15-year term. In addition, the agreement calls for a total capital investment of $230,000 toward the improvement of various buildings at the Tennis Center, as well as payment of up to $75,000 for electricity costs over the life of the agreement. It is also expected that tennis programs, including instruction, leagues, camps, tournaments, and special events will increase in number and quality.
Fleet Services
FY 2016/17 budget for this program decreased slightly from FY 2015/16, mainly attributable by the low prices of fuel costs, which has countered the continuing rise in expenses associated with outside labor and materials. Materials expenses, especially, have significantly exceeded budget due to the expensive parts for unique pieces of equipment such as fire trucks, hydro-excavators, street sweepers, paving boxes, etc. No large increases in gasoline or diesel prices are expected over the next year.
Facility Services
Facility Services was close to fully staffed entering FY 2016/17. Response times for service requests and overall customer satisfaction has been excellent. The storms of January and February, and the age of City and PG&E equipment, resulted in some significant loss of service capability for various of City buildings. Plans are in place to replace a number of generators, including control panels and wiring, to allow for smoother response to power outages, if and when they occur. Preventive and corrective maintenance continues on the various building systems of the Civic Center to provide for City employees and visitors.
City of Sunnyvale FY 2017/18 Adopted Budget and Resource Allocation Plan
666

Department Position Allocation
ClassificationFY 2016/17
Budgeted PositionsFY 2017/18
Budgeted Positions Change
Director of Public Works 1 1 —
Asst Director of Public Works/City Engineer 1 1 —
Assistant City Engineer 2 2 —
Facilities Services Superintendent 1 1 —
Superintendent of Parks and Golf 1 1 —
Superintendent of Public Works Operations 1 1 —
Transportation and Traffic Manager - Term Limited 1 1 —
Transportation and Traffic Manager 1 1 —
Senior Management Analyst 0 1 1
Golf Operations Manager 1 1 —
Parks Manager 2 2 —
Urban Landscape Manager 1 1 —
Streets Operations Manager 1 1 —
Senior Engineer 4 4 —
Senior Engineer-Debt Funded 1 1 —
Fleet Manager 1 1 —
Property Manager 1 1 —
Administrative Aide 1 1 —
Administrative Aide-Confidential 1 1 —
Auto Shop Attendant 1 1 —
Administrative Analyst 2 2 —
Civil Engineer 5 5 —
Engineering Assistant II 3 3 —
Engineering Assistant II – Term Limited 2 2 —
Engineering Assistant I 1 1 —
Senior Traffic Engineer 1 1 —
Senior Transportation Engineer 1 1 —
Principal Transportation Planner 1 1 —
Traffic Engineer 1 1 —
Traffic Engineer – Term Limited 1 1 —
Transportation Engineer 1 1 —
Traffic Engineering Technician II 1 1 —
Fleet Services Coordinator 1 1 —
City of Sunnyvale FY 2017/18 Adopted Budget and Resource Allocation Plan
667

ClassificationFY 2016/17
Budgeted PositionsFY 2017/18
Budgeted Positions Change
Public Works Construction Inspector - Term Limited 1 1 —
Public Works Construction Inspector 4 4 —
Golf Professional 1 1 —
Assistant Golf Professional 1 1 —
Golf Course Equipment Mechanic 1 1 —
Equipment Mechanic 8 8 —
Heavy Equipment Operator 7 7 —
Street Lighting Technician 1 1 —
Facilities Attendant II 2 2 —
Facilities Technician II 4 4 —
Facilities Technician III 3 3 —
Parks Leader 8 8 —
Public Works Crew Leader 5 5 —
Senior Park Utility Worker 6 6 —
Public Works Supervisor 3 3 —
Senior Building Services Leader 3 3 —
Senior Maintenance Worker 8 8 —
Maintenance Worker II 10 10 —
Principal Office Assistant 4 4 —
Senior Office Assistant 4 4 —
Staff Office Assistant 2 2 —
Greenskeeper 1 1 —
Senior Greenskeeper 1 1 —
Parks Supervisor 2 2 —
Groundsworker 2 2 —
Parks Worker I 5 5 —
Parks Worker II 15 15 —
Parks Worker III 12 12 —
Utility Worker 11 11 —
Part-Time Staff Office Assistant 1 1 —
Part-Time Golf Services Assistant 5 5 —
Department of Public Works Total 186 187 1
City of Sunnyvale FY 2017/18 Adopted Budget and Resource Allocation Plan
668
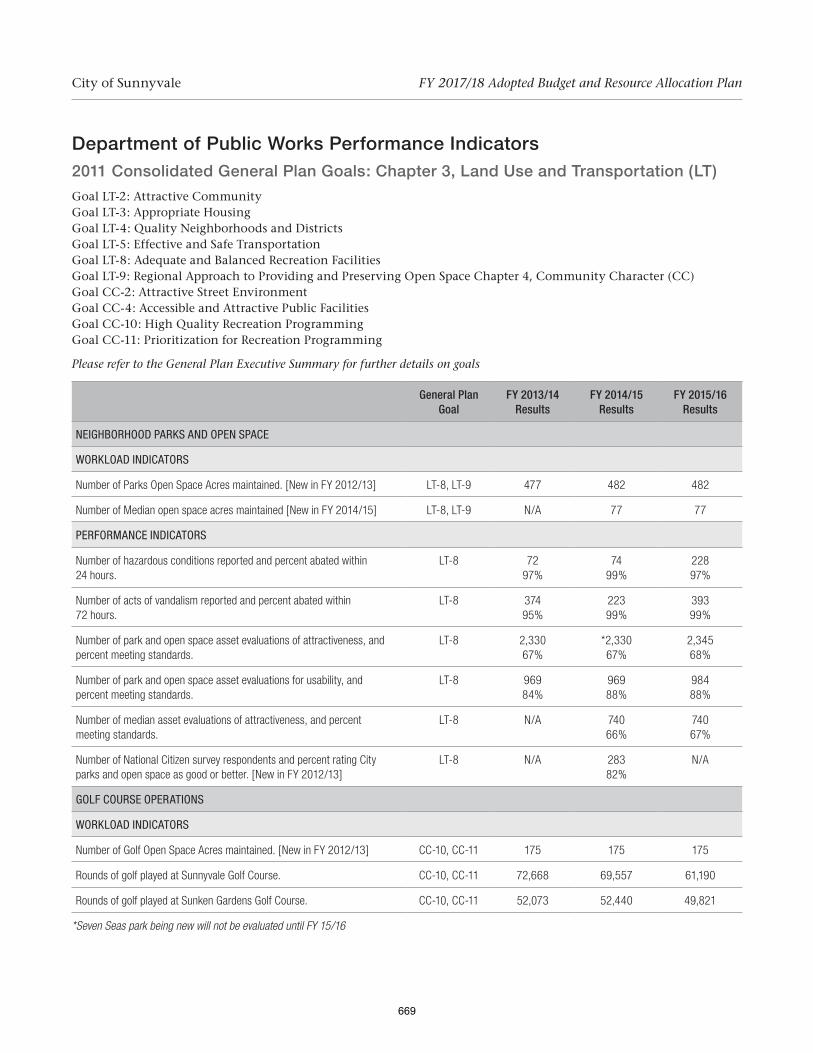
Department of Public Works Performance Indicators2011 Consolidated General Plan Goals: Chapter 3, Land Use and Transportation (LT)
Goal LT-2: Attractive Community Goal LT-3: Appropriate HousingGoal LT-4: Quality Neighborhoods and Districts Goal LT-5: Effective and Safe TransportationGoal LT-8: Adequate and Balanced Recreation FacilitiesGoal LT-9: Regional Approach to Providing and Preserving Open Space Chapter 4, Community Character (CC)Goal CC-2: Attractive Street EnvironmentGoal CC-4: Accessible and Attractive Public Facilities Goal CC-10: High Quality Recreation Programming Goal CC-11: Prioritization for Recreation Programming
Please refer to the General Plan Executive Summary for further details on goals
General Plan Goal
FY 2013/14 Results
FY 2014/15 Results
FY 2015/16 Results
NEIGHBORHOOD PARKS AND OPEN SPACE
WORKLOAD INDICATORS
Number of Parks Open Space Acres maintained. [New in FY 2012/13] LT-8, LT-9 477 482 482
Number of Median open space acres maintained [New in FY 2014/15] LT-8, LT-9 N/A 77 77
PERFORMANCE INDICATORS
Number of hazardous conditions reported and percent abated within 24 hours.
LT-8 72 97%
74 99%
228 97%
Number of acts of vandalism reported and percent abated within 72 hours.
LT-8 374 95%
223 99%
393 99%
Number of park and open space asset evaluations of attractiveness, and percent meeting standards.
LT-8 2,330 67%
*2,330 67%
2,345 68%
Number of park and open space asset evaluations for usability, and percent meeting standards.
LT-8 969 84%
969 88%
984 88%
Number of median asset evaluations of attractiveness, and percent meeting standards.
LT-8 N/A 740 66%
740 67%
Number of National Citizen survey respondents and percent rating City parks and open space as good or better. [New in FY 2012/13]
LT-8 N/A 28382%
N/A
GOLF COURSE OPERATIONS
WORKLOAD INDICATORS
Number of Golf Open Space Acres maintained. [New in FY 2012/13] CC-10, CC-11 175 175 175
Rounds of golf played at Sunnyvale Golf Course. CC-10, CC-11 72,668 69,557 61,190
Rounds of golf played at Sunken Gardens Golf Course. CC-10, CC-11 52,073 52,440 49,821
*Seven Seas park being new will not be evaluated until FY 15/16
City of Sunnyvale FY 2017/18 Adopted Budget and Resource Allocation Plan
669
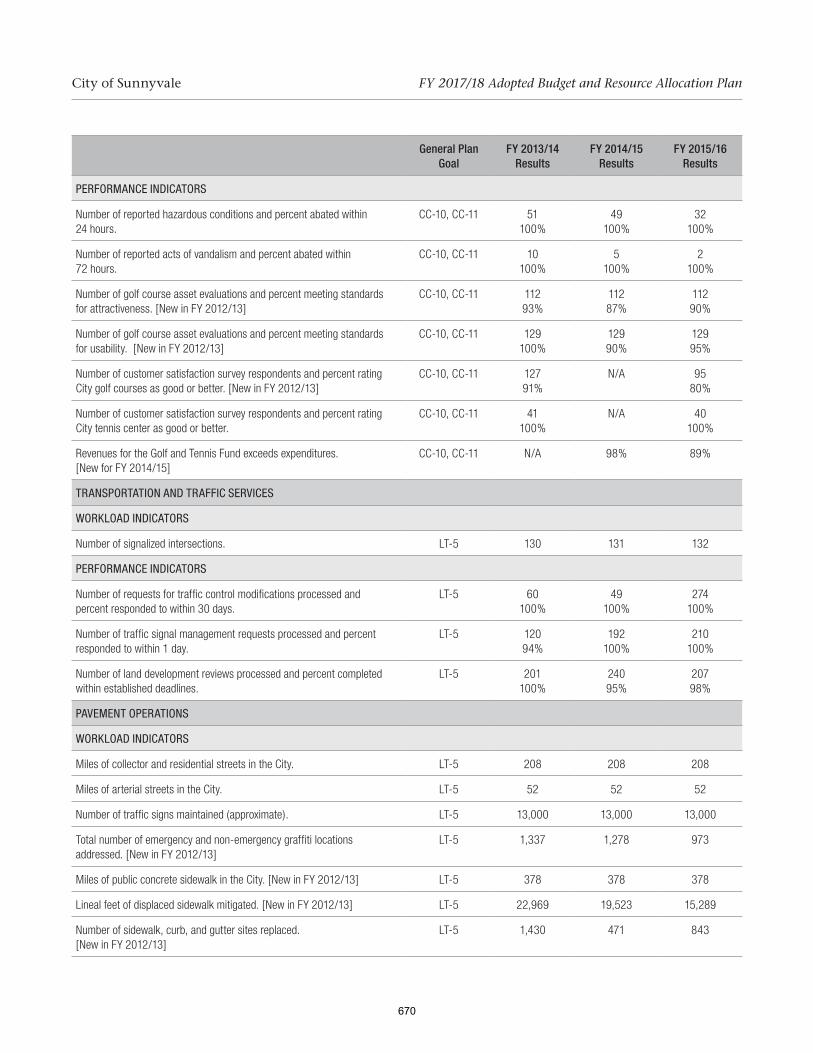
General Plan Goal
FY 2013/14 Results
FY 2014/15 Results
FY 2015/16 Results
PERFORMANCE INDICATORS
Number of reported hazardous conditions and percent abated within 24 hours.
CC-10, CC-11 51 100%
49 100%
32 100%
Number of reported acts of vandalism and percent abated within 72 hours.
CC-10, CC-11 10 100%
5 100%
2 100%
Number of golf course asset evaluations and percent meeting standards for attractiveness. [New in FY 2012/13]
CC-10, CC-11 112 93%
112 87%
112 90%
Number of golf course asset evaluations and percent meeting standards for usability. [New in FY 2012/13]
CC-10, CC-11 129 100%
129 90%
129 95%
Number of customer satisfaction survey respondents and percent rating City golf courses as good or better. [New in FY 2012/13]
CC-10, CC-11 127 91%
N/A 95 80%
Number of customer satisfaction survey respondents and percent rating City tennis center as good or better.
CC-10, CC-11 41 100%
N/A 40 100%
Revenues for the Golf and Tennis Fund exceeds expenditures. [New for FY 2014/15]
CC-10, CC-11 N/A 98% 89%
TRANSPORTATION AND TRAFFIC SERVICES
WORKLOAD INDICATORS
Number of signalized intersections. LT-5 130 131 132
PERFORMANCE INDICATORS
Number of requests for traffic control modifications processed and percent responded to within 30 days.
LT-5 60 100%
49 100%
274 100%
Number of traffic signal management requests processed and percent responded to within 1 day.
LT-5 120 94%
192 100%
210 100%
Number of land development reviews processed and percent completed within established deadlines.
LT-5 201 100%
240 95%
207 98%
PAVEMENT OPERATIONS
WORKLOAD INDICATORS
Miles of collector and residential streets in the City. LT-5 208 208 208
Miles of arterial streets in the City. LT-5 52 52 52
Number of traffic signs maintained (approximate). LT-5 13,000 13,000 13,000
Total number of emergency and non-emergency graffiti locations addressed. [New in FY 2012/13]
LT-5 1,337 1,278 973
Miles of public concrete sidewalk in the City. [New in FY 2012/13] LT-5 378 378 378
Lineal feet of displaced sidewalk mitigated. [New in FY 2012/13] LT-5 22,969 19,523 15,289
Number of sidewalk, curb, and gutter sites replaced. [New in FY 2012/13]
LT-5 1,430 471 843
City of Sunnyvale FY 2017/18 Adopted Budget and Resource Allocation Plan
670

General Plan Goal
FY 2013/14 Results
FY 2014/15 Results
FY 2015/16 Results
PERFORMANCE INDICATORS
Number of resident survey respondents and percent rating the services provided by Pavement Operations as good or better.
LT-5 N/A 283 60%
N/A
Average Citywide pavement condition index (PCI) rating, with a goal of 80% or higher. [New in FY 2012/13]
LT-5 79 77 77
Number of City collector and residential streets surveyed and percent rated good or better (PCI = 70+), based on Metropolitan Traffic Commission regional standards.
LT-5 1,256 82%
1,534 76%
1,538 75%
Number of City arterial streets surveyed and percent rated good or better (PCI = 70+), based on Metropolitan Traffic Commission regional standards.
LT-5 199 81%
245 84%
245 80%
Number of hazardous debris calls received and percent responded to within 3 hours of notification.
LT-5 116 97%
22898%
14196%
Number of graffiti obscenities reported and percent removed within 1 working day of notification.
LT-5 1 100%
7 100%
3 100%
Number of non-emergency graffiti incidents reported and percent responded to within 2 days of notification. [New in FY 2012/13]
LT-5 6 100%
24 100%
41 91%
Number of unscheduled street sweeping requests/complaints received and % resolved within 2 working days of notification.
LT-5 34 100%
26 100%
33 95%
Number of displaced sidewalk sites serviced and percent temporarily ramp patched within five working days of notification.
LT-5 1,180 98%
1,217 98%
707 87%
STREETLIGHT SYSTEM
WORKLOAD INDICATORS
Number of streetlights maintained by the City. [New in FY 2012/13] LT-5 9,357 9,357 9,357
Number of streetlights surveyed in a year. [New in FY 2012/13] LT-5 15,992 15,992 13,222
1,567 Collector and Arterial Lights surveyed bi-monthly 1,385 Industrial Zone Lights surveyed quarterly 175 Overhead Pathway Lights surveyed bi-monthly
PERFORMANCE INDICATORS
Number of City streetlights surveyed and percent functioning. LT-5 15,791 99%
15,642 95%
13,120 90%
Number of resident survey respondents and percent rating the services provided by Streetlight System as good or better.
LT-5 N/A 293 62%
N/A
Number of City owned streetlight outages due to lamp failure and percent repaired within 1 working day of notification.
LT-5 700 99%
1,240 95%
1,656 80%
Percent of scheduled arterial, industrial, and pedestrian pathway light surveys completed as scheduled.
LT-5 15 94%
14 88%
14 88%
City of Sunnyvale FY 2017/18 Adopted Budget and Resource Allocation Plan
671

General Plan Goal
FY 2013/14 Results
FY 2014/15 Results
FY 2015/16 Results
STREET TREE MAINTENANCE
WORKLOAD INDICATORS
Number of City street trees (approximate). CC-2 37,000 37,000 37,000
PERFORMANCE INDICATORS
Number of street trees scheduled for individual pruning due to damage, disease or other hazardous conditions and percent pruned within 90 days. [New in FY 2012/13, Deleted in FY 2014/15]
CC-2 1,950 100%
N/A N/A
Number of street trees scheduled for safety pruning due to damage, disease or other hazardous conditions and percent pruned within 60 days. [New in FY 2014/15]
CC-2 N/A 1,987 100%
2,382 100%
Number of trees scheduled for structural pruning by City Staff or contractor on a 7 year average pruning cycle and percent completed. [New in FY 2012/13, Deleted in FY 2014/15]
CC-2 5,286 337%
N/A N/A
Number of trees scheduled for structural pruning on a 7 year average pruning cycle and percent completed. [New in FY 2014/15]
CC-2 N/A 5,285 176%
3,970 75%
Number of street trees scheduled for removal due to damage, disease, death or other hazardous conditions and percent removed and replaced within 90 days of determination by City Arborist. [New in FY 2012/13, Deleted in FY 2014/15]
CC-2 333 52%
N/A N/A
Number of street trees scheduled for removal due to damage, disease, death or other hazardous conditions and percent removed within 60 days of determination by City Arborist. [New in FY 2014/15]
CC-2 N/A 224 90%
388 90%
Number of Street Trees Planted [New in FY 2014/15] CC-2 N/A 541 628
Number of requests for tree services and percent investigated within ten business days of notification.
CC-2 2,299 99%
1,732 99%
1,838 99%
DOWNTOWN PARKING LOT MAINTENANCE
WORKLOAD INDICATORS
Square footage of downtown parking lots maintained. LT-2 152,149 152,149 152,149
PERFORMANCE INDICATORS
Number of Parking District parking lot light outages reported and percent repaired within 24 hours of notification. (Goal 90%)
LT-2 50 91%
67 95%
78 90%
PUBLIC WORKS ADMINISTRATION
WORKLOAD INDICATORS
Number of real properties leased by DPW Administration Division [New in FY 2014/15]
LT-1 N/A 27 ^50
Total number of Department operating program activities managed. 163 153 146
^Cell tower leases under PW Admin in FY 15/16
City of Sunnyvale FY 2017/18 Adopted Budget and Resource Allocation Plan
672

General Plan Goal
FY 2013/14 Results
FY 2014/15 Results
FY 2015/16 Results
PERFORMANCE INDICATORS
Number of resident survey respondents and percent rating the services provided by Public Works as good or better.
LT-1 N/A N/A 1,609 65%
Percent of total Department operating budget expended. 98% 98% 96%
Number and percent of units leased at or above market rate within 60 days of vacancy [New in FY 2014/15]
LT-1 N/A 5 83%
N/A
CAPITAL PROJECT MANAGEMENT
WORKLOAD INDICATORS
Number of construction capital projects managed. [Edited for FY 2014/15]
CC-4 92 32 32
Number of design capital projects managed. [New in FY 2014/15] CC-4 N/A 87 68
PERFORMANCE INDICATORS
Number of customer survey respondents and percent rating the design services provided by Capital Project Management as good or better.
CC-4 6 83%
9 96%
3 100%
Number of customer survey respondents and percentage of respondents rating the construction services provided by the construction management team as meeting expectations or better. [New in FY 2014/15]
CC-4 N/A 5 80%
4 100%
Number of City capital construction projects completed during the fiscal year and percent that have no deficiencies at final inspection. [Deleted in FY 2014/15]
CC-4, LT-5 19 6%
N/A N/A
Number of City capital project designs completed compared to the number of planned projects per fiscal year. [Edited for FY 2014/15 for clarification]
CC-4, LT-5 22 26 28
Number and percentage of capital construction projects completed within the approved construction budget. [New in FY 2014/15]
CC-4, LT-5 N/A 17 100%
17 100%
LAND DEVELOPMENT ENGINEERING
WORKLOAD INDICATORS
Number of subdivision map reviews. [Deleted in FY 2014/15] LT-2, LT-3, LT-4 19 N/A N/A
Number of major development project reviews. [New in FY 2014/15] LT-2, LT-3, LT-4 N/A 15 17
Number of encroachment permit application reviews and inspections. [New in FY 2012/13]
LT-2, LT-3, LT-4 437 438 581
Number of public contacts (CRM, counter, email, phone, etc.). [New in FY 2012/13]
LT-2, LT-3, LT-4 9,153 10,767 9,724
City of Sunnyvale FY 2017/18 Adopted Budget and Resource Allocation Plan
673

General Plan Goal
FY 2013/14 Results
FY 2014/15 Results
FY 2015/16 Results
PERFORMANCE INDICATORS
Number of permit applicant survey respondents and percent rating the services provided by General Engineering as good or better.
LT-2, LT-3, LT-4 5 100%
1 100%
3 100%
Number of major development projects reviewed and percent completing an initial review within 21 days. [Deleted in FY 2014/15]
LT-2, LT-3, LT-4 19 33%
N/A N/A
Percent of initial project reviews completed within 21 days for major development projects. [New in FY 2014/15]
LT-2, LT-3, LT-4 N/A 44% 71%
Number of resubmitted major development project reviews processed and percent completed within 14 days. [Deleted in FY 2014/15]
LT-2, LT-3, LT-4 19 61%
N/A N/A
Percent of resubmittted project reviews completed within 14 days for major development projects. [New in FY 2014/15]
LT-2, LT-3, LT-4 N/A 38% 62%
Number of encroachment permit applications processed and percent reviewed within 14 days. [Deleted in FY 2014/15]
LT-2, LT-3, LT-4 437 82%
N/A N/A
Percent of encroachment permit reviews completed within 14 days. [New in FY 2014/15]
LT-2, LT-3, LT-4 N/A 84% 90%
FACILITY SERVICES
WORKLOAD INDICATORS
Number of City buildings maintained. CC-4 87 87 87
PERFORMANCE INDICATORS
Number of non-urgent work orders and percent completed within 15 calendar days.
CC-4 4,772 89%
2,757 90%
4,105 87%
Number of urgent/emergency work orders and percent abated within 24 hours.
CC-4 226 80%
60 100%
65 92%
Number of work orders completed and percent requiring a call back. CC-4 4,998 0%
2,817 2%
4,170 0%
Number of customer survey respondents and percent rating services provided by the Facilities Division as good or better.
CC-4 299 97%
N/A 422 100%
PROVISION OF VEHICLES AND MOTORIZED EQUIPMENT
WORKLOAD INDICATORS
Number of autos and light trucks maintained in City fleet. [New in FY 2012/13]
CC-4 207 210 339
Number of special purpose trucks, tractors and trailers maintained in City fleet. [New in FY 2012/13]
CC-4 33 33 25
Number of construction and landscape equipment items maintained in City fleet. [Deleted in FY 2014/15]
CC-4 81 82 N/A
Number of small equipment and auxiliary power generator items maintained in City fleet. [New in FY 2012/13]
CC-4 157 151 154
City of Sunnyvale FY 2017/18 Adopted Budget and Resource Allocation Plan
674

General Plan Goal
FY 2013/14 Results
FY 2014/15 Results
FY 2015/16 Results
PERFORMANCE INDICATORS
Percent of operating time that City vehicles and equipment are available for department usage (also known as uptime).
CC-4 97% 94% 94%
Number of customer survey respondents and percent rating services provided by the Fleet Division as good or better.
CC-4 11 97%
5 94%
N/A
Complete a minimum of 95% of scheduled preventive maintenance services on vehicles in the month scheduled. [New in FY 2014/15]
CC-4 N/A 84% 86%
City of Sunnyvale FY 2017/18 Adopted Budget and Resource Allocation Plan
675

This Page Intentionally Blank
676

Program 119 - Transportation and Traffic Services
Program Performance BudgetCity of Sunnyvale
Service Delivery Plan 11901 - Transportation Engineering and Planning
Budget2015/2016
Actual2014/2015
Actual2015/2016
Current2016/2017 2017/2018
Plan
Activity 119100 - Warrant StudiesProduct: A Study Completed
27,720.3012.00
326.00
11,587.7012.00
123.26
67,102.1723.00
453.71
64,894.7523.00
453.71
12,096.0611.00
178.92
Costs:Products: Hours:
Activity 119110 - Parking and Speed StudiesProduct: A Study Completed
30,561.7610.00
327.00
44,886.54100.00491.84
87,169.6678.00
416.59
89,993.1078.00
416.59
27,980.62110.00314.08
Costs:Products: Hours:
Activity 119120 - Collision AnalysisProduct: A Collision Report Reviewed [Deleted]
5,362.040.00
56.00
11,851.090.00
94.35
34,029.390.00
280.91
35,664.230.00
280.91
10,221.540.00
80.41
Costs:Products: Hours:
Activity 119130 - Respond to Community Transportation Issues
171,346.690.00
1,490.00
142,746.600.00
1,305.25
152,022.240.00
1,290.05
161,275.710.00
1,290.05
128,129.460.00
1,256.63
Costs:Products: Hours:
Activity 119140 - Planning/Policy Studies
114,275.740.00
815.00
105,179.830.00
659.17
46,086.020.00
357.23
48,479.950.00
357.23
116,713.840.00
945.64
Costs:Products: Hours:
677

Program 119 - Transportation and Traffic Services
Program Performance BudgetCity of Sunnyvale
Service Delivery Plan 11901 - Transportation Engineering and Planning
Budget2015/2016
Actual2014/2015
Actual2015/2016
Current2016/2017 2017/2018
Plan
Activity 119150 - Capital Project Support
131,088.300.00
1,105.00
162,063.810.00
1,360.44
221,583.010.00
1,088.64
283,362.590.00
1,536.64
133,572.620.00
1,221.16
Costs:Products: Hours:
Activity 119160 - Geometric, Streetlight, and Other Design
45,313.500.00
358.00
30,870.740.00
302.15
41,708.110.00
369.95
43,961.350.00
369.95
25,965.570.00
302.47
Costs:Products: Hours:
Activity 119170, 119171, 119172 - Parking Permit Program AdministrationProduct: A Permit Issued
9,930.53610.00132.00
22,285.221,543.00
233.10
10,064.201,104.00
132.50
10,712.80900.00132.50
16,299.50449.00192.02
Costs:Products: Hours:
4,609.00
535,598.86 531,471.53
4,569.56
659,764.80 738,344.48
Totals for Service Delivery Plan 11901 - Transportation Engineering and Planning
470,979.21
4,491.33Hours:
Costs:
4,389.58 4,837.58
678

Program 119 - Transportation and Traffic Services
Program Performance BudgetCity of Sunnyvale
Service Delivery Plan 11902 - Intergovernmental Coordination
Budget2015/2016
Actual2014/2015
Actual2015/2016
Current2016/2017 2017/2018
Plan
Activity 119200 - Intergovernmental Support and Participation
73,802.880.00
560.00
55,045.830.00
423.78
55,505.370.00
377.37
57,037.860.00
377.37
48,577.980.00
400.56
Costs:Products: Hours:
Activity 119210 - Grant Writing
41,489.040.00
310.00
62,739.720.00
514.86
56,551.520.00
413.41
59,206.750.00
413.41
36,674.610.00
285.75
Costs:Products: Hours:
Activity 119220 - Review Outside Agency Plans, Designs, and Studies
23,975.750.00
227.00
11,831.440.00
71.99
26,401.700.00
197.16
27,835.920.00
197.16
12,294.070.00
99.05
Costs:Products: Hours:
Activity 119230 - Congestion Management Agency
258,521.860.000.00
257,031.360.00
56.72
264,403.670.00
71.02
265,818.990.00
71.02
248,609.090.000.00
Costs:Products: Hours:
1,097.00
397,789.53 386,648.35
1,067.35
402,862.26 409,899.52
Totals for Service Delivery Plan 11902 - Intergovernmental Coordination
346,155.75
785.36Hours:
Costs:
1,058.96 1,058.96
679

Program 119 - Transportation and Traffic Services
Program Performance BudgetCity of Sunnyvale
Service Delivery Plan 11903 - Traffic Signal Operations and Maintenance
Budget2015/2016
Actual2014/2015
Actual2015/2016
Current2016/2017 2017/2018
Plan
Activity 119300 - Routine Maintenance and Repairs
231,470.750.000.00
239,623.250.000.00
254,980.810.000.00
258,141.030.000.00
253,360.960.00
231.64
Costs:Products: Hours:
Activity 119310 - Nonroutine Maintenance and Repairs
468,962.470.000.00
680,604.180.000.00
691,156.630.000.00
503,293.100.000.00
411,788.670.000.00
Costs:Products: Hours:
Activity 119320 - Signal Maintenance and Repair by Staff
227,241.680.00
2,073.00
194,211.090.00
1,578.82
284,305.030.00
672.05
247,129.980.00
672.05
161,569.550.00
1,331.50
Costs:Products: Hours:
Activity 119330 - Signal Maintenance Contract Administration
20,290.530.00
170.00
41,849.650.00
178.35
9,638.180.00
75.26
10,269.600.00
75.26
17,486.800.00
146.44
Costs:Products: Hours:
2,243.00
947,965.43 1,156,288.17
1,757.17
1,240,080.65 1,018,833.71
Totals for Service Delivery Plan 11903 - Traffic Signal Operations and Maintenance
844,205.98
1,709.58Hours:
Costs:
747.31 747.31
680

Program 119 - Transportation and Traffic Services
Program Performance BudgetCity of Sunnyvale
Service Delivery Plan 11904 - Development Review
Budget2015/2016
Actual2014/2015
Actual2015/2016
Current2016/2017 2017/2018
Plan
Activity 119420 - Perform Development Review
61,716.630.00
519.00
69,764.470.00
653.83
104,671.630.00
881.94
111,836.460.00
881.94
77,320.860.00
709.20
Costs:Products: Hours:
Activity 119430 - Review Traffic Control Plans
27,263.530.00
239.00
51,923.850.00
672.26
174,865.290.00
1,519.01
185,678.230.00
1,519.01
73,838.710.00
817.09
Costs:Products: Hours:
Activity 119440, 119441 - Review Transportation Impact Analyses/Environmental Impact Reports
92,565.910.00
773.00
101,008.440.00
822.46
252,815.620.00
2,021.46
269,619.450.00
2,021.46
87,094.440.00
741.79
Costs:Products: Hours:
Activity 119450 - Review of Improvement Plans
21,410.330.00
185.00
54,383.300.00
576.16
19,288.680.00
150.52
20,225.970.00
150.52
53,052.350.00
452.85
Costs:Products: Hours:
Activity 119460 - Review/Approve Transportation Demand Management Plans
23,955.060.00
209.00
9,948.650.00
78.76
62,703.890.00
511.99
67,008.400.00
511.99
19,205.120.00
164.55
Costs:Products: Hours:
681
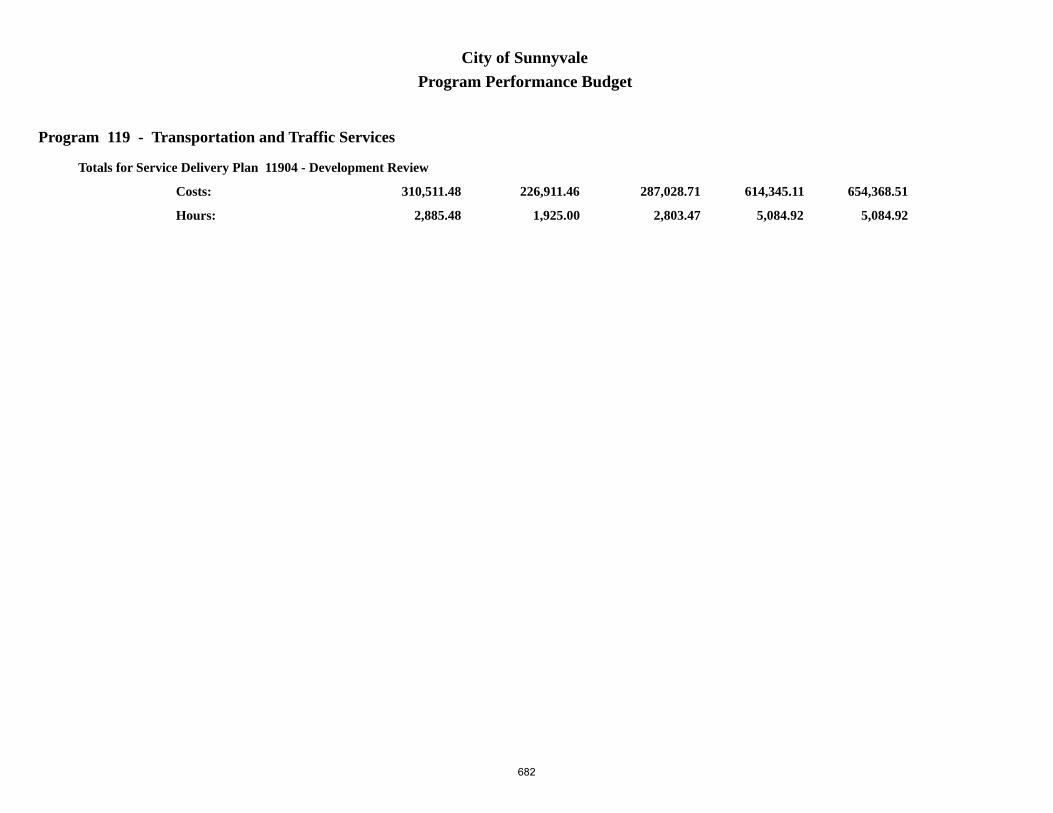
Program 119 - Transportation and Traffic Services
Program Performance BudgetCity of Sunnyvale
1,925.00
226,911.46 287,028.71
2,803.47
614,345.11 654,368.51
Totals for Service Delivery Plan 11904 - Development Review
310,511.48
2,885.48Hours:
Costs:
5,084.92 5,084.92
682
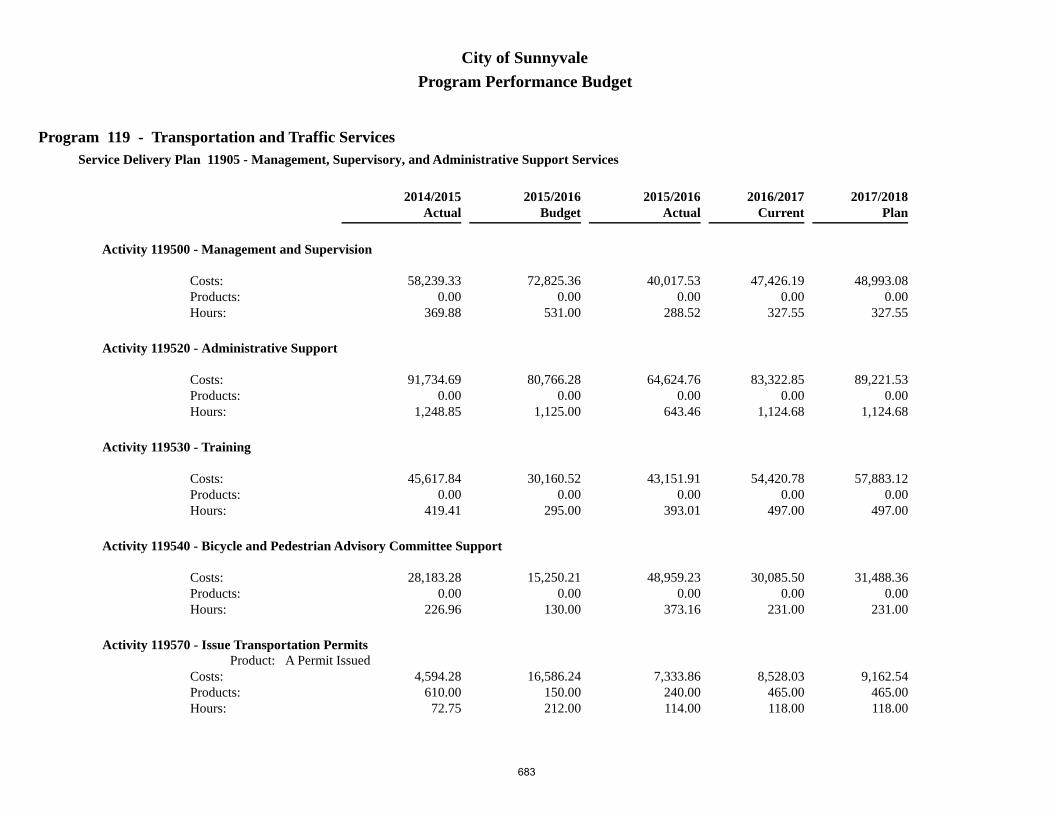
Program 119 - Transportation and Traffic Services
Program Performance BudgetCity of Sunnyvale
Service Delivery Plan 11905 - Management, Supervisory, and Administrative Support Services
Budget2015/2016
Actual2014/2015
Actual2015/2016
Current2016/2017 2017/2018
Plan
Activity 119500 - Management and Supervision
72,825.360.00
531.00
40,017.530.00
288.52
47,426.190.00
327.55
48,993.080.00
327.55
58,239.330.00
369.88
Costs:Products: Hours:
Activity 119520 - Administrative Support
80,766.280.00
1,125.00
64,624.760.00
643.46
83,322.850.00
1,124.68
89,221.530.00
1,124.68
91,734.690.00
1,248.85
Costs:Products: Hours:
Activity 119530 - Training
30,160.520.00
295.00
43,151.910.00
393.01
54,420.780.00
497.00
57,883.120.00
497.00
45,617.840.00
419.41
Costs:Products: Hours:
Activity 119540 - Bicycle and Pedestrian Advisory Committee Support
15,250.210.00
130.00
48,959.230.00
373.16
30,085.500.00
231.00
31,488.360.00
231.00
28,183.280.00
226.96
Costs:Products: Hours:
Activity 119570 - Issue Transportation PermitsProduct: A Permit Issued
16,586.24150.00212.00
7,333.86240.00114.00
8,528.03465.00118.00
9,162.54465.00118.00
4,594.28610.00
72.75
Costs:Products: Hours:
683

Program 119 - Transportation and Traffic Services
Program Performance BudgetCity of Sunnyvale
2,293.00
215,588.61 204,087.29
1,812.15
223,783.35 236,748.63
Totals for Service Delivery Plan 11905 - Management, Supervisory, and Administrative Support Services
228,369.42
2,337.85Hours:
Costs:
2,298.23 2,298.23
2,323,853.89
12,167.00
2,565,524.05
12,009.70
2,200,221.84
12,209.60
Costs:
Hours: 13,579.00 14,027.00
3,140,836.17 3,058,194.85
Totals for Program 119
684
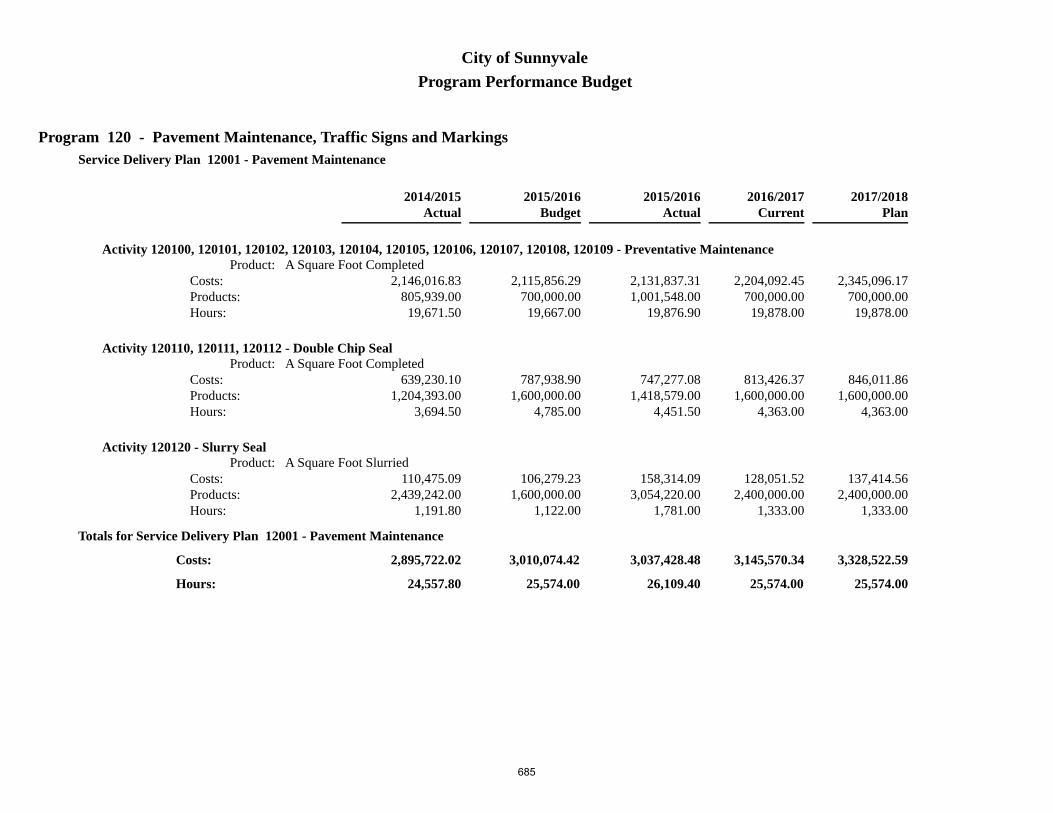
Program 120 - Pavement Maintenance, Traffic Signs and Markings
Program Performance BudgetCity of Sunnyvale
Service Delivery Plan 12001 - Pavement Maintenance
Budget2015/2016
Actual2014/2015
Actual2015/2016
Current2016/2017 2017/2018
Plan
Activity 120100, 120101, 120102, 120103, 120104, 120105, 120106, 120107, 120108, 120109 - Preventative MaintenanceProduct: A Square Foot Completed
2,115,856.29700,000.00
19,667.00
2,131,837.311,001,548.00
19,876.90
2,204,092.45700,000.00
19,878.00
2,345,096.17700,000.00
19,878.00
2,146,016.83805,939.00
19,671.50
Costs:Products: Hours:
Activity 120110, 120111, 120112 - Double Chip SealProduct: A Square Foot Completed
787,938.901,600,000.00
4,785.00
747,277.081,418,579.00
4,451.50
813,426.371,600,000.00
4,363.00
846,011.861,600,000.00
4,363.00
639,230.101,204,393.00
3,694.50
Costs:Products: Hours:
Activity 120120 - Slurry SealProduct: A Square Foot Slurried
106,279.231,600,000.00
1,122.00
158,314.093,054,220.00
1,781.00
128,051.522,400,000.00
1,333.00
137,414.562,400,000.00
1,333.00
110,475.092,439,242.00
1,191.80
Costs:Products: Hours:
25,574.00
3,010,074.42 3,037,428.48
26,109.40
3,145,570.34 3,328,522.59
Totals for Service Delivery Plan 12001 - Pavement Maintenance
2,895,722.02
24,557.80Hours:
Costs:
25,574.00 25,574.00
685

Program 120 - Pavement Maintenance, Traffic Signs and Markings
Program Performance BudgetCity of Sunnyvale
Service Delivery Plan 12002 - Traffic Marking Maintenance
Budget2015/2016
Actual2014/2015
Actual2015/2016
Current2016/2017 2017/2018
Plan
Activity 120200 - Painting Traffic LinesProduct: A Lineal Foot Painted
127,558.29300,000.00
1,192.00
70,154.72118,357.00
612.00
101,161.41425,000.00
855.00
107,196.22425,000.00
855.00
114,439.48492,200.00
1,161.00
Costs:Products: Hours:
Activity 120210, 120211, 120212, 120213, 120214, 120215, 120216, 120217, 120218, 120219 - Install/Remove Traffic Legends, Crosswalks, and Limit BarsProduct: A Legend/Crosswalk/Limit Bar
220,864.494,800.002,252.00
311,428.469,533.003,717.00
200,406.665,700.001,913.00
213,710.695,700.001,913.00
255,032.788,803.002,966.00
Costs:Products: Hours:
Activity 120220 - Premarking of Traffic MarkingsProduct: A Street Marked
41,155.54300.00464.00
37,092.44367.00439.00
41,870.42350.00464.00
45,078.65350.00464.00
44,449.52333.00537.00
Costs:Products: Hours:
Activity 120230 - Remove/Install Ceramic and Reflective MarkersProduct: A Marker Removed/Installed
58,558.7110,100.00
485.00
72,176.9614,863.00
784.50
50,662.517,850.00
377.00
53,327.167,850.00
377.00
58,315.9413,562.00
670.00
Costs:Products: Hours:
4,393.00
448,137.03 490,852.58
5,552.50
394,101.00 419,312.72
Totals for Service Delivery Plan 12002 - Traffic Marking Maintenance
472,237.72
5,334.00Hours:
Costs:
3,609.00 3,609.00
686

Program 120 - Pavement Maintenance, Traffic Signs and Markings
Program Performance BudgetCity of Sunnyvale
Service Delivery Plan 12003 - Traffic Sign Maintenance
Budget2015/2016
Actual2014/2015
Actual2015/2016
Current2016/2017 2017/2018
Plan
Activity 120300, 120301, 120302, 120303 - Traffic Sign FabricationProduct: A Sign Fabricated
75,268.761,420.00
662.00
43,910.76695.00244.00
67,123.611,180.00
553.00
71,303.371,180.00
553.00
45,152.00937.00302.00
Costs:Products: Hours:
Activity 120310, 120311, 120312, 120313, 120314, 120315, 120316 - Install, Repair, Removal, and/or Replace Traffic Signs and PolesProduct: A Sign or Pole
171,429.615,450.001,837.00
141,974.047,984.001,665.80
175,360.535,500.001,837.00
188,265.505,500.001,837.00
180,750.817,275.002,025.90
Costs:Products: Hours:
Activity 120320, 120321, 120322 - City Parking Lot and Curb PaintingProduct: A Lineal Foot Painted
80,113.4915,200.00
1,284.00
37,294.626,478.00
569.00
75,035.1218,500.00
1,238.00
77,893.4018,500.00
1,238.00
52,872.9114,163.00
730.50
Costs:Products: Hours:
3,783.00
326,811.86 223,179.42
2,478.80
317,519.26 337,462.27
Totals for Service Delivery Plan 12003 - Traffic Sign Maintenance
278,775.72
3,058.40Hours:
Costs:
3,628.00 3,628.00
687

Program 120 - Pavement Maintenance, Traffic Signs and Markings
Program Performance BudgetCity of Sunnyvale
Service Delivery Plan 12004 - Street Sweeping
Budget2015/2016
Actual2014/2015
Actual2015/2016
Current2016/2017 2017/2018
Plan
Activity 120400, 120401, 120402, 120403 - Scheduled Street SweepingProduct: A Mile Swept
473,720.6520,683.00
5,461.00
588,035.0133,091.00
6,546.80
574,144.9934,500.00
6,431.00
618,512.0334,500.00
6,431.00
572,320.3934,872.00
6,443.50
Costs:Products: Hours:
Activity 120410 - Heavy Leaf Pick UpProduct: A Yard of Debris Removed
77,940.521,374.00
904.00
63,698.761,066.00
720.00
84,859.031,470.00
904.00
91,197.811,470.00
904.00
53,822.55203.00576.00
Costs:Products: Hours:
Activity 120420 - Posting of Requested StreetsProduct: A Street Posted
2,955.6820.0036.00
1,784.3913.0023.00
3,047.5320.0036.00
3,282.9720.0036.00
2,360.774.00
39.00
Costs:Products: Hours:
6,401.00
554,616.85 653,518.16
7,289.80
662,051.55 712,992.81
Totals for Service Delivery Plan 12004 - Street Sweeping
628,503.71
7,058.50Hours:
Costs:
7,371.00 7,371.00
688

Program 120 - Pavement Maintenance, Traffic Signs and Markings
Program Performance BudgetCity of Sunnyvale
Service Delivery Plan 12005 - Maintenance of Public Right-of-Way
Budget2015/2016
Actual2014/2015
Actual2015/2016
Current2016/2017 2017/2018
Plan
Activity 120500 - Preventative Maintenance - Clean and Inspect WalkwaysProduct: A Walkway Cleaned
41,249.86600.00472.00
50,634.90800.00649.50
85,416.011,650.00
521.00
89,076.161,650.00
521.00
50,604.43810.00586.50
Costs:Products: Hours:
Activity 120510 - Corrective Maintenance - Repair WalkwaysProduct: A Walkway Repaired
8,766.2810.0070.00
3,233.312.00
34.00
9,006.0010.0070.00
9,504.1310.0070.00
701.440.008.00
Costs:Products: Hours:
Activity 120520 - Preventative Maintenance - Clean Roadside EasementsProduct: An Easement Cleaned
71,486.1340.00
637.00
7,730.142.00
15.00
61,641.1940.00
642.00
66,038.0540.00
642.00
10,943.141.00
50.00
Costs:Products: Hours:
1,179.00
121,502.27 61,598.35
698.50
156,063.20 164,618.34
Totals for Service Delivery Plan 12005 - Maintenance of Public Right-of-Way
62,249.01
644.50Hours:
Costs:
1,233.00 1,233.00
689
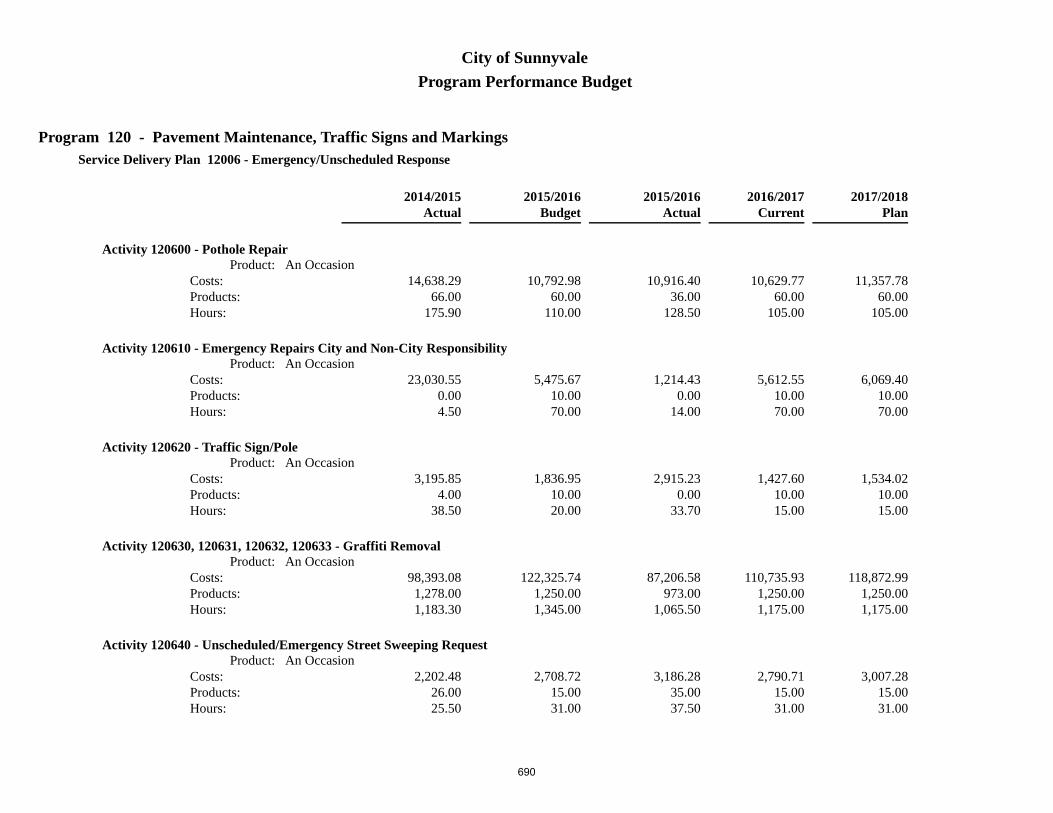
Program 120 - Pavement Maintenance, Traffic Signs and Markings
Program Performance BudgetCity of Sunnyvale
Service Delivery Plan 12006 - Emergency/Unscheduled Response
Budget2015/2016
Actual2014/2015
Actual2015/2016
Current2016/2017 2017/2018
Plan
Activity 120600 - Pothole RepairProduct: An Occasion
10,792.9860.00
110.00
10,916.4036.00
128.50
10,629.7760.00
105.00
11,357.7860.00
105.00
14,638.2966.00
175.90
Costs:Products: Hours:
Activity 120610 - Emergency Repairs City and Non-City ResponsibilityProduct: An Occasion
5,475.6710.0070.00
1,214.430.00
14.00
5,612.5510.0070.00
6,069.4010.0070.00
23,030.550.004.50
Costs:Products: Hours:
Activity 120620 - Traffic Sign/PoleProduct: An Occasion
1,836.9510.0020.00
2,915.230.00
33.70
1,427.6010.0015.00
1,534.0210.0015.00
3,195.854.00
38.50
Costs:Products: Hours:
Activity 120630, 120631, 120632, 120633 - Graffiti RemovalProduct: An Occasion
122,325.741,250.001,345.00
87,206.58973.00
1,065.50
110,735.931,250.001,175.00
118,872.991,250.001,175.00
98,393.081,278.001,183.30
Costs:Products: Hours:
Activity 120640 - Unscheduled/Emergency Street Sweeping RequestProduct: An Occasion
2,708.7215.0031.00
3,186.2835.0037.50
2,790.7115.0031.00
3,007.2815.0031.00
2,202.4826.0025.50
Costs:Products: Hours:
690

Program 120 - Pavement Maintenance, Traffic Signs and Markings
Program Performance BudgetCity of Sunnyvale
Service Delivery Plan 12006 - Emergency/Unscheduled Response
Budget2015/2016
Actual2014/2015
Actual2015/2016
Current2016/2017 2017/2018
Plan
Activity 120650 - Unscheduled/Emergency Cleaning and/or Repairs as RequestedProduct: An Occasion
10,858.3125.00
100.00
8,110.9615.0095.00
11,170.2125.00
100.00
11,833.9625.00
100.00
6,242.303.00
57.00
Costs:Products: Hours:
Activity 120660 - DebrisProduct: An Occasion
35,620.75170.00422.00
37,435.79141.00510.40
53,847.19230.00657.00
58,189.73230.00657.00
36,547.06228.00497.50
Costs:Products: Hours:
Activity 120670 - Traffic ControlProduct: An Occasion
16,528.39220.00168.00
10,355.61167.00117.30
16,865.77220.00168.00
18,062.16220.00168.00
6,887.73149.00
75.30
Costs:Products: Hours:
Activity 120680, 120681, 120682 - Mitigate Concrete Issues in the Public Right-of-WayProduct: An Occasion
5,507.7910.00
100.00
11,520.67205.00158.00
108,102.54280.00103.00
109,047.90280.00103.00
8,919.1550.00
124.00
Costs:Products: Hours:
2,366.00
211,655.30 172,861.95
2,159.90
321,182.27 337,975.22
Totals for Service Delivery Plan 12006 - Emergency/Unscheduled Response
200,056.49
2,181.50Hours:
Costs:
2,424.00 2,424.00
691

Program 120 - Pavement Maintenance, Traffic Signs and Markings
Program Performance BudgetCity of Sunnyvale
Service Delivery Plan 12007 - Service Response
Budget2015/2016
Actual2014/2015
Actual2015/2016
Current2016/2017 2017/2018
Plan
Activity 120700 - Shopping CartsProduct: An Occasion
19,553.451,000.00
225.00
8,738.16869.00115.30
14,042.201,000.00
160.00
15,006.881,000.00
160.00
9,108.8723.00
108.10
Costs:Products: Hours:
Activity 120710 - DebrisProduct: An Occasion
6,000.0980.0068.00
1,931.7436.0022.60
7,433.3060.0084.00
8,017.8860.0084.00
2,374.9213.0030.10
Costs:Products: Hours:
Activity 120720 - Traffic Control - PlannedProduct: An Occasion
13,062.4330.00
144.00
3,821.6125.0046.50
12,722.1425.00
144.00
13,708.0425.00
144.00
4,355.2526.0054.50
Costs:Products: Hours:
Activity 120730 - Concrete Service RequestsProduct: A Service Request Responded/Generated
103,589.461,400.001,280.00
137,522.591,916.001,662.00
124,428.621,825.001,490.00
134,002.371,825.001,490.00
118,888.231,825.001,448.50
Costs:Products: Hours:
Activity 120740, 120741, 120742, 120743 - Concrete Mitigation/Emergency Sidewalk/Parking Strip RemovalProduct: A Lineal Foot
219,084.9525,200.00
3,465.00
200,087.7115,057.00
3,050.50
227,334.0525,000.00
3,465.00
243,567.9225,000.00
3,465.00
171,967.3819,523.00
2,839.50
Costs:Products: Hours:
692
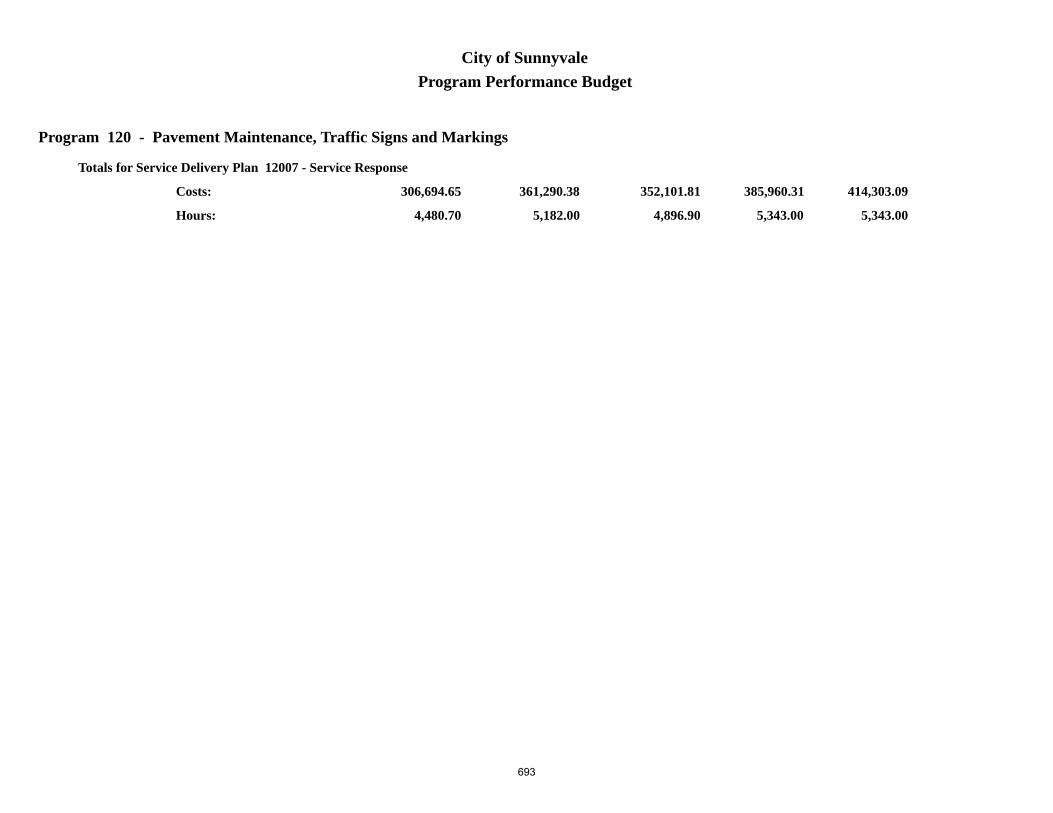
Program 120 - Pavement Maintenance, Traffic Signs and Markings
Program Performance BudgetCity of Sunnyvale
5,182.00
361,290.38 352,101.81
4,896.90
385,960.31 414,303.09
Totals for Service Delivery Plan 12007 - Service Response
306,694.65
4,480.70Hours:
Costs:
5,343.00 5,343.00
693

Program 120 - Pavement Maintenance, Traffic Signs and Markings
Program Performance BudgetCity of Sunnyvale
Service Delivery Plan 12008 - Management, Supervisory, and Administrative Support Services
Budget2015/2016
Actual2014/2015
Actual2015/2016
Current2016/2017 2017/2018
Plan
Activity 120800 - Management and Supervisory Services
290,015.290.00
2,215.00
273,292.510.00
1,985.00
250,401.620.00
1,765.00
276,785.940.00
1,944.00
236,784.330.00
1,767.50
Costs:Products: Hours:
Activity 120810, 120811, 120812, 120813 - Administrative Support Services
264,256.840.00
2,980.00
332,900.000.00
4,065.20
297,294.870.00
3,304.00
318,412.290.00
3,304.00
269,511.280.00
3,113.70
Costs:Products: Hours:
Activity 120820, 120821, 120822 - Meetings, Certification, and TrainingProduct: Staff Training
133,290.06381.00
1,502.00
102,144.12330.00
1,203.00
137,554.26160.00
1,502.00
147,622.18160.00
1,502.00
102,620.51271.00
1,200.50
Costs:Products: Hours:
6,697.00
687,562.19 708,336.63
7,253.20
685,250.75 742,820.41
Totals for Service Delivery Plan 12008 - Management, Supervisory, and Administrative Support Services
608,916.12
6,081.70Hours:
Costs:
6,571.00 6,750.00
5,721,650.30
55,575.00
5,699,877.38
56,439.00
5,453,155.44
53,397.10
Costs:
Hours: 55,753.00 55,932.00
6,067,698.68 6,458,007.45
Totals for Program 120
694

Program 121 - Street Lights
Program Performance BudgetCity of Sunnyvale
Service Delivery Plan 12101 - Street Light Maintenance
Budget2015/2016
Actual2014/2015
Actual2015/2016
Current2016/2017 2017/2018
Plan
Activity 121100 - Power (PG&E Billing)Product: A Light Powered
715,471.159,328.00
1.00
820,362.910.000.00
811,471.609,357.00
1.00
686,745.489,357.00
1.00
797,480.859,357.00
0.00
Costs:Products: Hours:
Activity 121110, 121111, 121112 - Preventative MaintenanceProduct: A Preventative Maintenance Completed
27,045.6845.00
370.00
9,895.8780.00
101.50
15,806.22125.00190.00
17,014.07125.00190.00
9,612.86127.00
99.00
Costs:Products: Hours:
Activity 121120, 121121, 121122, 121123, 121124, 121125 - Corrective MaintenanceProduct: A Repair Completed
219,272.052,830.002,375.00
222,694.065,414.001,810.90
183,546.752,900.001,683.00
194,943.142,900.001,683.00
188,779.823,910.001,558.50
Costs:Products: Hours:
Activity 121130, 121131, 121132, 121133 - Modification and FabricationProduct: An Occasion
45,318.042,149.00
690.00
37,832.154,467.00
534.70
29,978.183,099.00
405.00
33,552.993,099.00
405.00
36,549.933,915.00
512.50
Costs:Products: Hours:
3,436.00
1,007,106.92 1,090,784.99
2,447.10
1,040,802.75 932,255.68
Totals for Service Delivery Plan 12101 - Street Light Maintenance
1,032,423.46
2,170.00Hours:
Costs:
2,279.00 2,279.00
695

Program 121 - Street Lights
Program Performance BudgetCity of Sunnyvale
Service Delivery Plan 12102 - Emergency/Unscheduled Repairs
Budget2015/2016
Actual2014/2015
Actual2015/2016
Current2016/2017 2017/2018
Plan
Activity 121200 - Streetlight Pole KnockdownsProduct: A Pole Replaced
63,499.3911.00
452.00
122,998.2334.00
822.70
143,831.9712.00
874.00
149,670.6812.00
874.00
117,311.6812.00
949.90
Costs:Products: Hours:
Activity 121210, 121211, 121212 - Emergency Repairs City and Non-City Responsibility [Deleted]Product: A Service Request Response
0.000.000.00
4,041.650.00
54.50
0.000.000.00
0.000.000.00
0.000.000.00
Costs:Products: Hours:
Activity 121220 - Graffiti RemovalProduct: An Occasion
13,479.83450.00186.00
7,769.84215.00133.50
13,763.59450.00187.00
14,925.99450.00187.00
7,758.34312.00129.50
Costs:Products: Hours:
638.00
76,979.22 134,809.72
1,010.70
157,595.56 164,596.67
Totals for Service Delivery Plan 12102 - Emergency/Unscheduled Repairs
125,070.02
1,079.40Hours:
Costs:
1,061.00 1,061.00
696
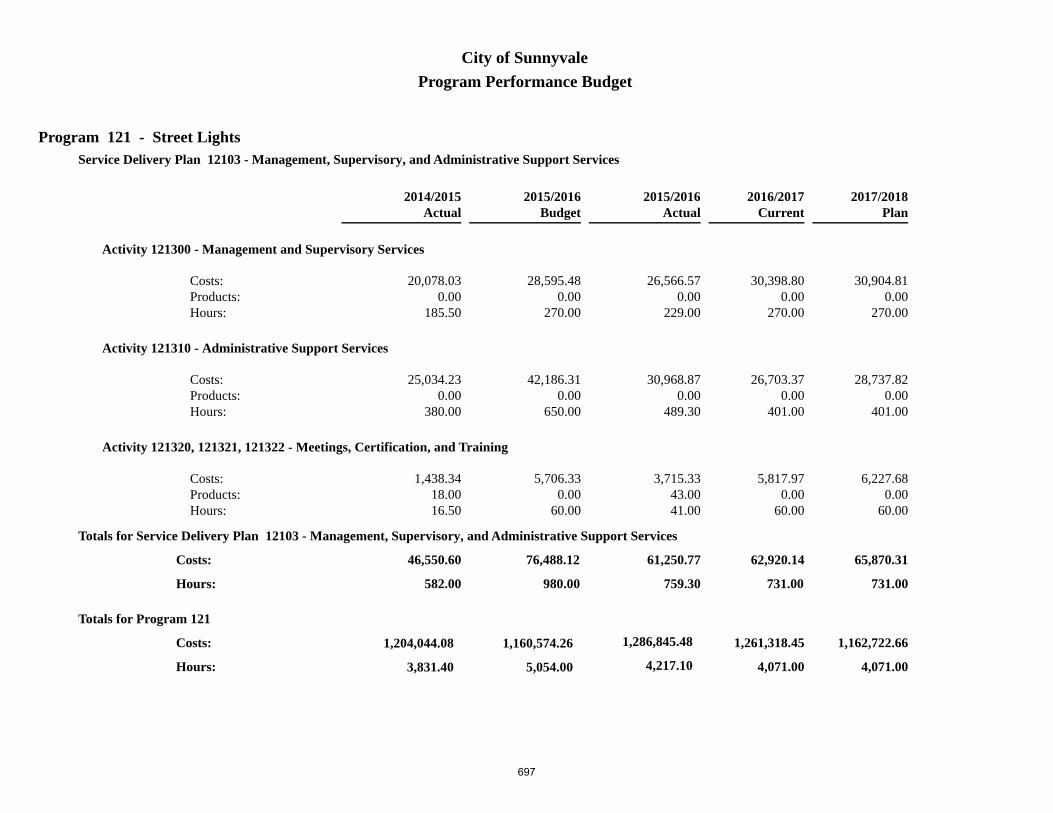
Program 121 - Street Lights
Program Performance BudgetCity of Sunnyvale
Service Delivery Plan 12103 - Management, Supervisory, and Administrative Support Services
Budget2015/2016
Actual2014/2015
Actual2015/2016
Current2016/2017 2017/2018
Plan
Activity 121300 - Management and Supervisory Services
28,595.480.00
270.00
26,566.570.00
229.00
30,398.800.00
270.00
30,904.810.00
270.00
20,078.030.00
185.50
Costs:Products: Hours:
Activity 121310 - Administrative Support Services
42,186.310.00
650.00
30,968.870.00
489.30
26,703.370.00
401.00
28,737.820.00
401.00
25,034.230.00
380.00
Costs:Products: Hours:
Activity 121320, 121321, 121322 - Meetings, Certification, and Training
5,706.330.00
60.00
3,715.3343.0041.00
5,817.970.00
60.00
6,227.680.00
60.00
1,438.3418.0016.50
Costs:Products: Hours:
980.00
76,488.12 61,250.77
759.30
62,920.14 65,870.31
Totals for Service Delivery Plan 12103 - Management, Supervisory, and Administrative Support Services
46,550.60
582.00Hours:
Costs:
731.00 731.00
1,160,574.26
5,054.00
1,286,845.48
4,217.10
1,204,044.08
3,831.40
Costs:
Hours: 4,071.00 4,071.00
1,261,318.45 1,162,722.66
Totals for Program 121
697

This Page Intentionally Blank
698

Program 219 - Street Tree Services
Program Performance BudgetCity of Sunnyvale
Service Delivery Plan 21901 - Tree Services
Budget2015/2016
Actual2014/2015
Actual2015/2016
Current2016/2017 2017/2018
Plan
Activity 219100, 219101, 219102, 219103, 219104, 219105, 219106, 219107 - A Tree Pruned for SafetyProduct: A Tree Pruned for Safety
544,857.142,200.007,765.00
343,622.302,739.004,616.60
611,316.952,450.008,450.00
659,273.142,450.008,450.00
490,720.412,572.006,140.30
Costs:Products: Hours:
Activity 219110, 219111, 219112, 219113, 219114, 219115, 219116 - Contract Block Tree ServicesProduct: A Preventative Tree Pruned
572,978.515,000.00
280.00
2,500.000.000.00
580,939.825,000.00
280.00
585,263.815,000.00
280.00
442,034.876,756.00
177.50
Costs:Products: Hours:
Activity 219120, 219121 - Tree RemovalProduct: A Tree Removed
125,407.68200.00
1,680.00
292,085.22442.00
3,618.02
151,297.82300.00
1,985.00
163,001.36300.00
1,985.00
199,730.66300.00
1,603.00
Costs:Products: Hours:
Activity 219130, 219131 - Tree PlantingProduct: A Tree Planted
123,718.64300.00
1,520.00
177,592.85693.00
1,984.06
192,652.05450.00
2,285.00
205,734.26450.00
2,285.00
151,859.01541.00
1,543.10
Costs:Products: Hours:
Activity 219140 - Tree AssessmentProduct: A Tree Assessed
146,320.261,500.001,635.00
72,194.342,089.00
752.71
91,776.901,500.00
980.00
99,030.031,500.00
980.00
91,910.862,142.00
937.50
Costs:Products: Hours:
699
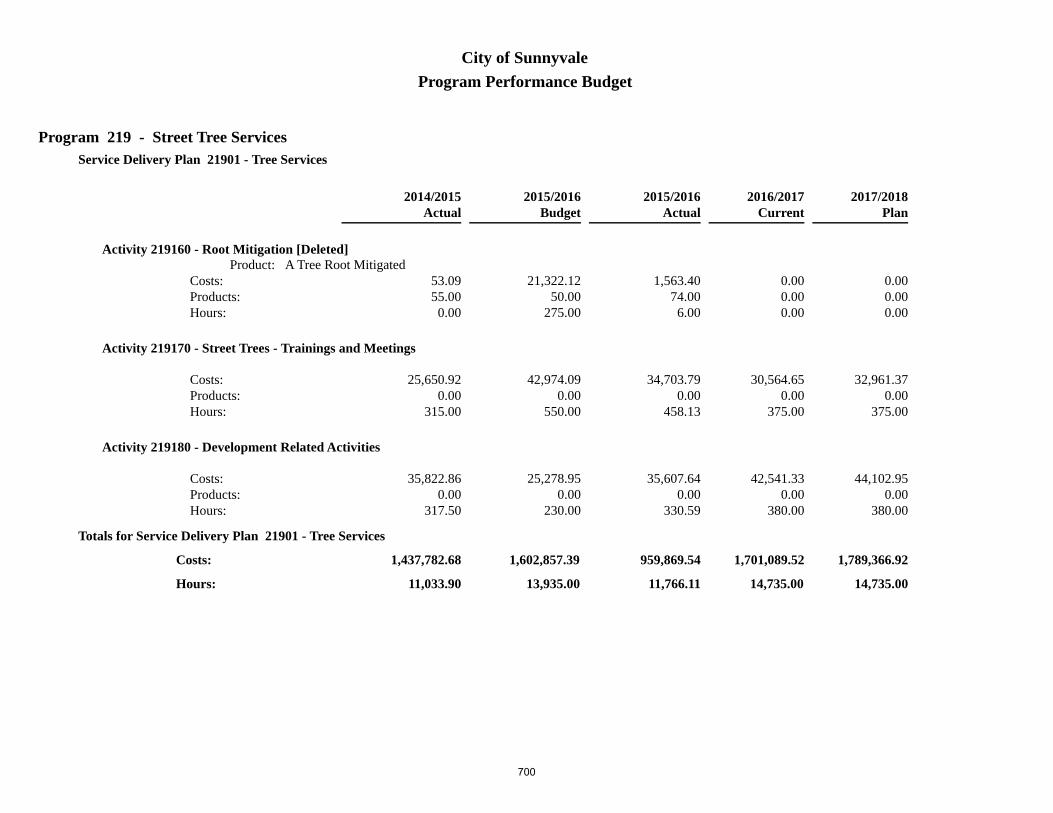
Program 219 - Street Tree Services
Program Performance BudgetCity of Sunnyvale
Service Delivery Plan 21901 - Tree Services
Budget2015/2016
Actual2014/2015
Actual2015/2016
Current2016/2017 2017/2018
Plan
Activity 219160 - Root Mitigation [Deleted]Product: A Tree Root Mitigated
21,322.1250.00
275.00
1,563.4074.00
6.00
0.000.000.00
0.000.000.00
53.0955.00
0.00
Costs:Products: Hours:
Activity 219170 - Street Trees - Trainings and Meetings
42,974.090.00
550.00
34,703.790.00
458.13
30,564.650.00
375.00
32,961.370.00
375.00
25,650.920.00
315.00
Costs:Products: Hours:
Activity 219180 - Development Related Activities
25,278.950.00
230.00
35,607.640.00
330.59
42,541.330.00
380.00
44,102.950.00
380.00
35,822.860.00
317.50
Costs:Products: Hours:
13,935.00
1,602,857.39 959,869.54
11,766.11
1,701,089.52 1,789,366.92
Totals for Service Delivery Plan 21901 - Tree Services
1,437,782.68
11,033.90Hours:
Costs:
14,735.00 14,735.00
700

Program 219 - Street Tree Services
Program Performance BudgetCity of Sunnyvale
Service Delivery Plan 21903 - Emergency Services
Budget2015/2016
Actual2014/2015
Actual2015/2016
Current2016/2017 2017/2018
Plan
Activity 219320 - Emergency ServicesProduct: An Emergency Response During Normal Work Hours
77,732.27180.00
1,180.00
44,027.01339.00626.36
39,012.52200.00520.00
42,087.20200.00520.00
24,519.16189.00306.00
Costs:Products: Hours:
Activity 219330 - Emergency Services - After HoursProduct: An Emergency Response After Normal Work Hours
23,071.75105.00355.00
49,671.2181.00
722.00
30,074.8275.00
453.00
32,721.7675.00
453.00
33,099.7074.00
494.80
Costs:Products: Hours:
1,535.00
100,804.02 93,698.22
1,348.36
69,087.34 74,808.96
Totals for Service Delivery Plan 21903 - Emergency Services
57,618.86
800.80Hours:
Costs:
973.00 973.00
701

Program 219 - Street Tree Services
Program Performance BudgetCity of Sunnyvale
Service Delivery Plan 21904 - Management and Administration
Budget2015/2016
Actual2014/2015
Actual2015/2016
Current2016/2017 2017/2018
Plan
Activity 219430 - Management and Administrative Support
230,313.270.00
2,385.00
303,051.580.00
3,231.03
298,339.230.00
3,055.00
312,301.010.00
3,055.00
326,250.440.00
3,312.30
Costs:Products: Hours:
2,385.00
230,313.27 303,051.58
3,231.03
298,339.23 312,301.01
Totals for Service Delivery Plan 21904 - Management and Administration
326,250.44
3,312.30Hours:
Costs:
3,055.00 3,055.00
1,933,974.68
17,855.00
1,356,619.34
16,345.50
1,821,651.98
15,147.00
Costs:
Hours: 18,763.00 18,763.00
2,068,516.09 2,176,476.89
Totals for Program 219
702
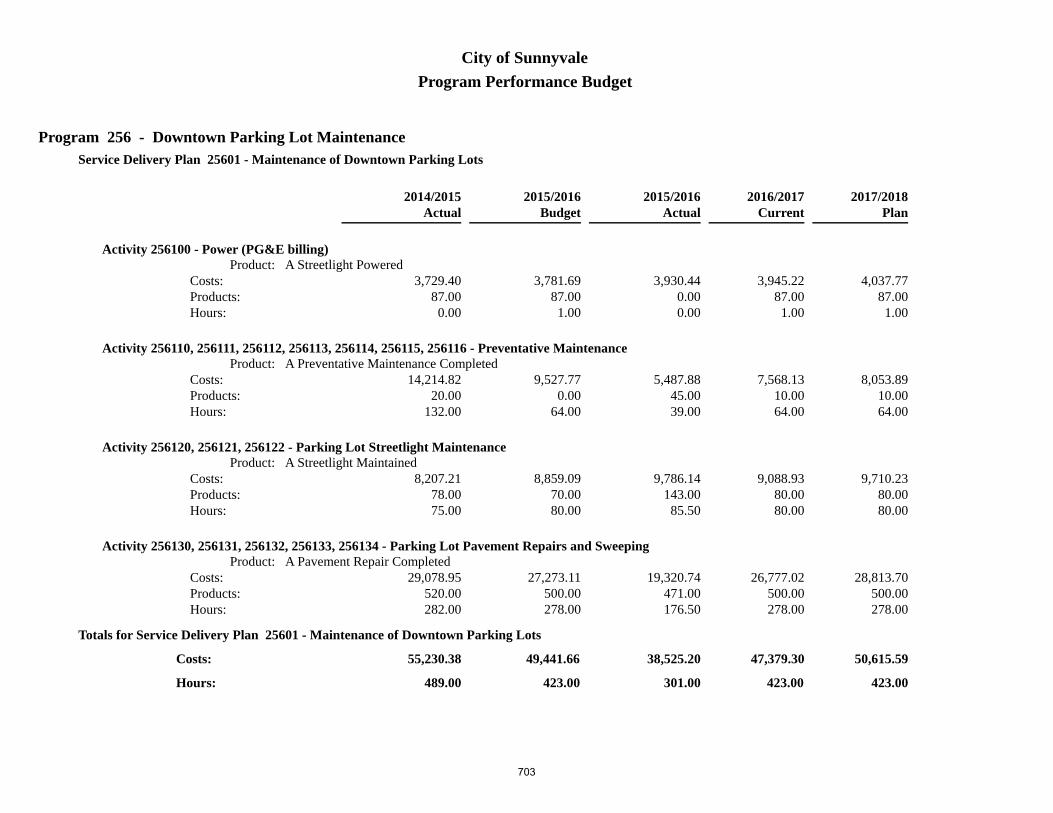
Program 256 - Downtown Parking Lot Maintenance
Program Performance BudgetCity of Sunnyvale
Service Delivery Plan 25601 - Maintenance of Downtown Parking Lots
Budget2015/2016
Actual2014/2015
Actual2015/2016
Current2016/2017 2017/2018
Plan
Activity 256100 - Power (PG&E billing)Product: A Streetlight Powered
3,781.6987.00
1.00
3,930.440.000.00
3,945.2287.00
1.00
4,037.7787.00
1.00
3,729.4087.00
0.00
Costs:Products: Hours:
Activity 256110, 256111, 256112, 256113, 256114, 256115, 256116 - Preventative MaintenanceProduct: A Preventative Maintenance Completed
9,527.770.00
64.00
5,487.8845.0039.00
7,568.1310.0064.00
8,053.8910.0064.00
14,214.8220.00
132.00
Costs:Products: Hours:
Activity 256120, 256121, 256122 - Parking Lot Streetlight MaintenanceProduct: A Streetlight Maintained
8,859.0970.0080.00
9,786.14143.00
85.50
9,088.9380.0080.00
9,710.2380.0080.00
8,207.2178.0075.00
Costs:Products: Hours:
Activity 256130, 256131, 256132, 256133, 256134 - Parking Lot Pavement Repairs and SweepingProduct: A Pavement Repair Completed
27,273.11500.00278.00
19,320.74471.00176.50
26,777.02500.00278.00
28,813.70500.00278.00
29,078.95520.00282.00
Costs:Products: Hours:
423.00
49,441.66 38,525.20
301.00
47,379.30 50,615.59
Totals for Service Delivery Plan 25601 - Maintenance of Downtown Parking Lots
55,230.38
489.00Hours:
Costs:
423.00 423.00
703
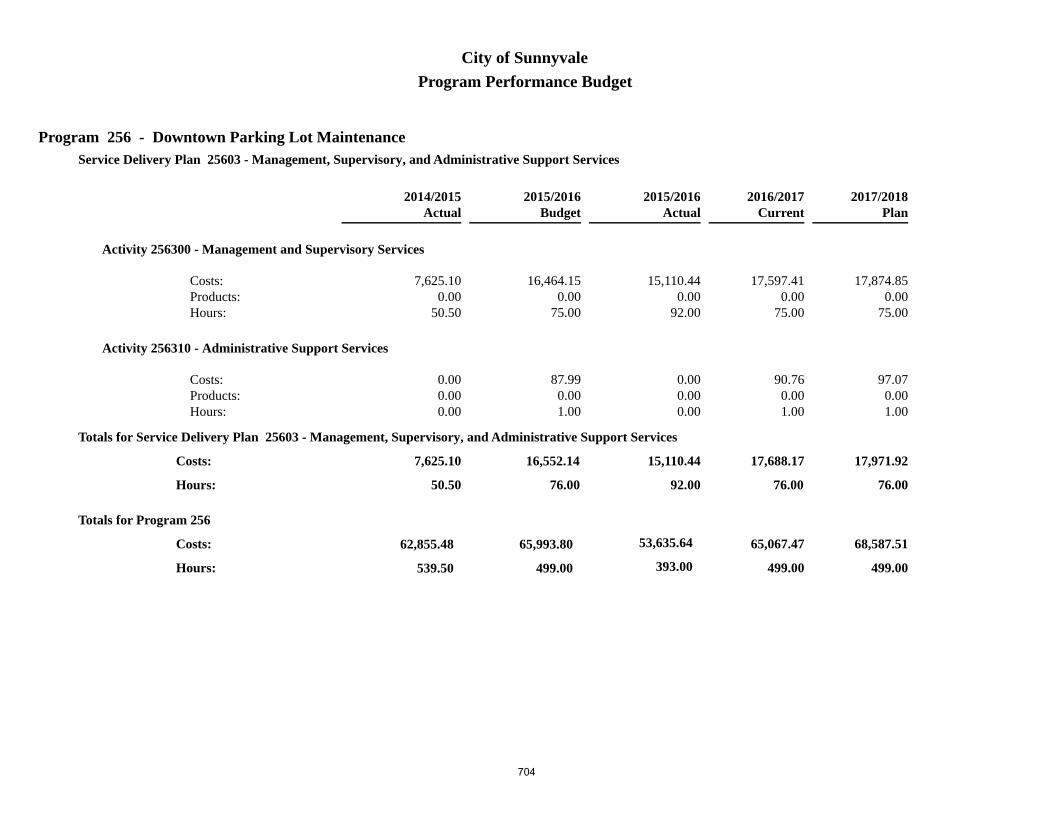
Program 256 - Downtown Parking Lot Maintenance
Program Performance BudgetCity of Sunnyvale
Service Delivery Plan 25603 - Management, Supervisory, and Administrative Support Services
Budget2015/2016
Actual2014/2015
Actual2015/2016
Current2016/2017 2017/2018
Plan
Activity 256300 - Management and Supervisory Services
16,464.150.00
75.00
15,110.440.00
92.00
17,597.410.00
75.00
17,874.850.00
75.00
7,625.100.00
50.50
Costs:Products: Hours:
Activity 256310 - Administrative Support Services
87.990.001.00
0.000.000.00
90.760.001.00
97.070.001.00
0.000.000.00
Costs:Products: Hours:
76.00
16,552.14 15,110.44
92.00
17,688.17 17,971.92
Totals for Service Delivery Plan 25603 - Management, Supervisory, and Administrative Support Services
7,625.10
50.50Hours:
Costs:
76.00 76.00
65,993.80
499.00
53,635.64
393.00
62,855.48
539.50
Costs:
Hours: 499.00 499.00
65,067.47 68,587.51
Totals for Program 256
704

Program 267 - Neighborhood Parks and Open Space Management
Program Performance BudgetCity of Sunnyvale
Service Delivery Plan 26701 - Field Services
Budget2015/2016
Actual2014/2015
Actual2015/2016
Current2016/2017 2017/2018
Plan
Activity 267110, 267111 - Parks MaintenanceProduct: An Acre Maintained
4,255,565.92167.00
47,947.00
4,115,980.12168.00
44,933.27
4,293,795.84176.00
48,135.00
4,597,426.91176.00
48,135.00
4,119,955.93168.00
47,783.44
Costs:Products: Hours:
Activity 267120 - Public Grounds MaintenanceProduct: An Acre Maintained
764,583.5646.00
8,694.00
785,186.8246.00
8,749.34
893,933.3049.00
9,945.00
961,062.0749.00
9,945.00
850,632.8446.00
9,936.15
Costs:Products: Hours:
Activity 267130 - School Site MaintenanceProduct: An Acre Maintained
905,820.42110.00
10,010.00
826,898.86110.00
9,231.65
935,140.5695.00
10,370.00
1,004,848.7395.00
10,370.00
927,781.82110.00
10,406.10
Costs:Products: Hours:
Activity 267140 - Regional Open Space MaintenanceProduct: An Acre Maintained
319,094.72154.00
3,770.00
382,094.27154.00
4,521.10
410,065.99154.00
4,685.00
439,849.99154.00
4,685.00
395,216.20154.00
4,685.63
Costs:Products: Hours:
Activity 267150 - Roadside and Median ServicesProduct: An Acre Maintained
1,034,144.9077.00
10,885.00
971,685.6477.00
10,238.40
1,064,364.8577.00
10,910.00
1,147,269.8477.00
10,910.00
1,000,616.0777.00
10,477.10
Costs:Products: Hours:
705

Program 267 - Neighborhood Parks and Open Space Management
Program Performance BudgetCity of Sunnyvale
Service Delivery Plan 26701 - Field Services
Budget2015/2016
Actual2014/2015
Actual2015/2016
Current2016/2017 2017/2018
Plan
Activity 267160 - Sunnyvale Multimodal Transit MaintenanceProduct: One Site Maintained
192,574.881.00
636.00
141,347.201.00
361.09
180,487.541.00
395.00
183,725.451.00
395.00
147,758.921.00
364.24
Costs:Products: Hours:
Activity 267170 - Parks Maintenance - Training/Meetings
205,068.900.00
2,315.00
220,148.130.00
2,457.40
140,575.560.00
1,580.00
151,657.370.00
1,580.00
184,204.660.00
2,084.01
Costs:Products: Hours:
Activity 267180 - El Camino Real Median Litter and Debris Removal
28,204.460.00
320.00
36,495.560.00
422.60
35,768.680.00
405.00
38,587.220.00
405.00
30,787.620.00
357.43
Costs:Products: Hours:
Activity 267190 - Aquatics FacilitiesProduct: Number of Pools Maintained
235,827.003.00
1,900.00
320,833.773.00
2,692.16
297,490.783.00
2,200.00
314,375.303.00
2,200.00
330,038.633.00
2,871.45
Costs:Products: Hours:
86,477.00
7,940,884.76 7,800,670.37
83,607.01
8,251,623.10 8,838,802.88
Totals for Service Delivery Plan 26701 - Field Services
7,986,992.69
88,965.55Hours:
Costs:
88,625.00 88,625.00
706

Program 267 - Neighborhood Parks and Open Space Management
Program Performance BudgetCity of Sunnyvale
Service Delivery Plan 26702 - Hazards and Vandalism
Budget2015/2016
Actual2014/2015
Actual2015/2016
Current2016/2017 2017/2018
Plan
Activity 267210 - Abate HazardsProduct: A Hazard Abated
114,419.35120.00760.00
62,585.55228.00568.14
136,536.5289.00
760.00
141,845.6789.00
760.00
182,589.3174.00
759.11
Costs:Products: Hours:
Activity 267220 - Abate VandalismProduct: A Vandalism Incident Abated
61,768.56380.00610.00
47,378.28393.00322.58
38,870.43326.00495.00
41,962.74326.00495.00
30,767.78223.00322.39
Costs:Products: Hours:
1,370.00
176,187.91 109,963.83
890.72
175,406.95 183,808.41
Totals for Service Delivery Plan 26702 - Hazards and Vandalism
213,357.09
1,081.50Hours:
Costs:
1,255.00 1,255.00
707

Program 267 - Neighborhood Parks and Open Space Management
Program Performance BudgetCity of Sunnyvale
Service Delivery Plan 26703 - Management and Administration
Budget2015/2016
Actual2014/2015
Actual2015/2016
Current2016/2017 2017/2018
Plan
Activity 267310 - Management and Administrative Support
1,087,761.710.00
10,090.00
1,017,930.920.00
9,152.23
1,117,594.140.00
9,785.00
1,166,174.180.00
9,785.00
979,064.050.00
8,941.05
Costs:Products: Hours:
10,090.00
1,087,761.71 1,017,930.92
9,152.23
1,117,594.14 1,166,174.18
Totals for Service Delivery Plan 26703 - Management and Administration
979,064.05
8,941.05Hours:
Costs:
9,785.00 9,785.00
708

Program 267 - Neighborhood Parks and Open Space Management
Program Performance BudgetCity of Sunnyvale
Service Delivery Plan 26704 - Parking District
Budget2015/2016
Actual2014/2015
Actual2015/2016
Current2016/2017 2017/2018
Plan
Activity 267400 - Parking District Landscaping
47,210.280.00
495.00
62,613.910.00
561.14
52,939.690.00
475.00
57,304.770.00
475.00
48,890.420.00
419.00
Costs:Products: Hours:
495.00
47,210.28 62,613.91
561.14
52,939.69 57,304.77
Totals for Service Delivery Plan 26704 - Parking District
48,890.42
419.00Hours:
Costs:
475.00 475.00
9,252,044.66
98,432.00
8,991,179.03
94,211.10
9,228,304.25
99,407.10
Costs:
Hours: 100,140.00 100,140.00
9,597,563.88 10,246,090.24
Totals for Program 267
709

This Page Intentionally Blank
710

Program 308 - Public Works Administration
Program Performance BudgetCity of Sunnyvale
Service Delivery Plan 30801 - Management Services
Budget2015/2016
Actual2014/2015
Actual2015/2016
Current2016/2017 2017/2018
Plan
Activity 308100 - Department Management
260,279.940.00
1,250.00
245,940.170.00
1,262.50
366,229.780.00
1,948.00
373,282.270.00
1,948.00
281,960.660.00
1,593.94
Costs:Products: Hours:
1,250.00
260,279.94 245,940.17
1,262.50
366,229.78 373,282.27
Totals for Service Delivery Plan 30801 - Management Services
281,960.66
1,593.94Hours:
Costs:
1,948.00 1,948.00
711

Program 308 - Public Works Administration
Program Performance BudgetCity of Sunnyvale
Service Delivery Plan 30802 - Administrative Support Services
Budget2015/2016
Actual2014/2015
Actual2015/2016
Current2016/2017 2017/2018
Plan
Activity 308200 - Administrative Support
273,603.640.00
3,474.00
272,971.970.00
3,568.50
360,070.860.00
4,731.00
384,556.570.00
4,731.00
226,929.560.00
3,217.38
Costs:Products: Hours:
Activity 308210 - Staff Training and Development
5,300.980.00
75.00
2,384.120.00
32.00
0.000.000.00
0.000.000.00
3,270.690.00
46.50
Costs:Products: Hours:
3,549.00
278,904.62 275,356.09
3,600.50
360,070.86 384,556.57
Totals for Service Delivery Plan 30802 - Administrative Support Services
230,200.25
3,263.88Hours:
Costs:
4,731.00 4,731.00
712

Program 308 - Public Works Administration
Program Performance BudgetCity of Sunnyvale
Service Delivery Plan 30803 - Property Management
Budget2015/2016
Actual2014/2015
Actual2015/2016
Current2016/2017 2017/2018
Plan
Activity 308300 - Manage LeasesProduct: A Lease Renegotiated [Deleted]
70,562.220.00
842.00
112,969.240.00
1,048.20
112,364.090.00
842.00
114,164.580.00
842.00
70,091.680.00
769.67
Costs:Products: Hours:
Activity 308310 - Inspect PropertiesProduct: A Property Inspected
4,174.28400.00
48.00
9,222.770.00
80.00
53,379.61420.00400.00
54,234.96420.00400.00
3,211.87237.00
36.51
Costs:Products: Hours:
890.00
74,736.50 122,192.01
1,128.20
165,743.70 168,399.54
Totals for Service Delivery Plan 30803 - Property Management
73,303.55
806.18Hours:
Costs:
1,242.00 1,242.00
613,921.06
5,689.00
643,488.27
5,991.20
585,464.46
5,664.00
Costs:
Hours: 7,921.00 7,921.00
892,044.34 926,238.38
Totals for Program 308
713

This Page Intentionally Blank
714

Program 309 - Capital Project Management
Program Performance BudgetCity of Sunnyvale
Service Delivery Plan 30902 - Capital Project Management
Budget2015/2016
Actual2014/2015
Actual2015/2016
Current2016/2017 2017/2018
Plan
Activity 309200 - Design ManagementProduct: Active Projects Managed
1,389,556.4845.00
12,396.00
1,329,740.1630.00
11,582.60
1,385,540.5126.00
12,195.00
1,437,211.2626.00
12,195.00
1,122,794.1826.00
10,174.40
Costs:Products: Hours:
Activity 309210 - Construction ManagementProduct: Active Projects Managed
799,514.7920.00
7,985.00
658,223.8417.00
5,411.30
774,837.6520.00
6,590.00
796,686.9020.00
6,590.00
645,659.7917.00
6,071.90
Costs:Products: Hours:
Activity 309220 - Inspection Services
501,460.800.00
5,835.00
479,201.880.00
5,224.05
553,333.540.00
6,125.00
585,021.070.00
6,125.00
496,206.960.00
5,614.50
Costs:Products: Hours:
Activity 309230 - Labor Compliance
0.000.000.00
68,290.410.00
717.50
149,002.800.00
1,710.00
157,368.240.00
1,710.00
0.000.000.00
Costs:Products: Hours:
Activity 309240 - Safety Tailgates and Training
81,465.540.00
775.00
91,682.360.00
847.30
107,684.530.00
970.00
111,522.070.00
970.00
72,968.230.00
682.80
Costs:Products: Hours:
715

Program 309 - Capital Project Management
Program Performance BudgetCity of Sunnyvale
26,991.00
2,771,997.61 2,627,138.65
23,782.75
2,970,399.03 3,087,809.54
Totals for Service Delivery Plan 30902 - Capital Project Management
2,337,629.16
22,543.60Hours:
Costs:
27,590.00 27,590.00
716

Program 309 - Capital Project Management
Program Performance BudgetCity of Sunnyvale
Service Delivery Plan 30904 - Management, Supervisory, and Administrative Support Services
Budget2015/2016
Actual2014/2015
Actual2015/2016
Current2016/2017 2017/2018
Plan
Activity 309400 - Management and Supervision
163,420.610.00
1,190.00
173,997.610.00
1,178.50
238,691.140.00
1,575.00
272,636.020.00
1,844.00
145,291.280.00
1,030.50
Costs:Products: Hours:
Activity 309410 - Administrative Support
161,970.860.00
2,200.00
133,632.660.00
1,698.10
134,175.680.00
1,770.00
141,344.530.00
1,770.00
102,259.930.00
1,458.60
Costs:Products: Hours:
3,390.00
325,391.47 307,630.27
2,876.60
372,866.82 413,980.55
Totals for Service Delivery Plan 30904 - Management, Supervisory, and Administrative Support Services
247,551.21
2,489.10Hours:
Costs:
3,345.00 3,614.00
3,097,389.08
30,381.00
2,934,768.92
26,659.35
2,585,180.37
25,032.70
Costs:
Hours: 30,935.00 31,204.00
3,343,265.85 3,501,790.09
Totals for Program 309
717
This Page Intentionally Blank
718

Program 310 - Land Development - Engineering Services
Program Performance BudgetCity of Sunnyvale
Service Delivery Plan 31001 - Land Use Permits and Parcel Maps
Budget2015/2016
Actual2014/2015
Actual2015/2016
Current2016/2017 2017/2018
Plan
Activity 310150 - Parking District AdministrationProduct: An Engineer's Report [Deleted]
3,538.290.00
30.00
5,278.440.00
11.50
3,520.700.00
28.00
3,590.640.00
28.00
1,568.080.00
12.50
Costs:Products: Hours:
Activity 310210 - Review Land Use ApplicationsProduct: A Land Use Application Reviewed
195,706.5885.00
1,900.00
200,015.92148.00
2,024.85
331,761.95102.00
3,490.00
358,643.18102.00
3,490.00
184,387.41138.00
1,811.80
Costs:Products: Hours:
Activity 310220, 310221 - Review Building PermitsProduct: A Building Permit Reviewed
46,881.342,270.00
475.00
48,282.432,515.00
463.19
70,312.562,520.00
735.00
75,991.972,520.00
735.00
39,901.893,695.00
392.80
Costs:Products: Hours:
Activity 310230 - Review and Approve Subdivision Maps and Survey PlatsProduct: A Map or Plat Reviewed
82,405.1113.00
780.00
99,832.1834.00
561.74
84,677.1915.00
840.00
89,421.1115.00
840.00
71,397.1015.00
497.00
Costs:Products: Hours:
Activity 310240 - Provide General Engineering InformationProduct: A Contact
111,115.327,000.001,155.00
100,803.349,724.001,011.93
178,654.608,200.001,912.00
194,173.648,200.001,912.00
69,200.8710,767.00
732.80
Costs:Products: Hours:
719
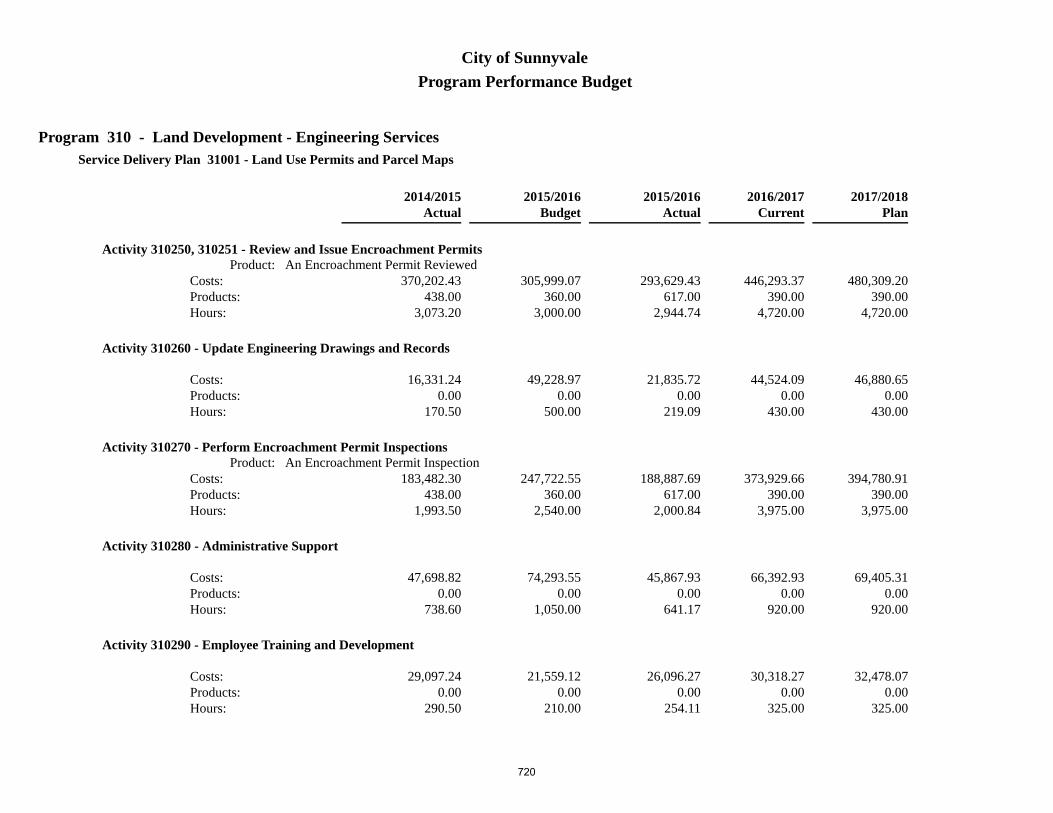
Program 310 - Land Development - Engineering Services
Program Performance BudgetCity of Sunnyvale
Service Delivery Plan 31001 - Land Use Permits and Parcel Maps
Budget2015/2016
Actual2014/2015
Actual2015/2016
Current2016/2017 2017/2018
Plan
Activity 310250, 310251 - Review and Issue Encroachment PermitsProduct: An Encroachment Permit Reviewed
305,999.07360.00
3,000.00
293,629.43617.00
2,944.74
446,293.37390.00
4,720.00
480,309.20390.00
4,720.00
370,202.43438.00
3,073.20
Costs:Products: Hours:
Activity 310260 - Update Engineering Drawings and Records
49,228.970.00
500.00
21,835.720.00
219.09
44,524.090.00
430.00
46,880.650.00
430.00
16,331.240.00
170.50
Costs:Products: Hours:
Activity 310270 - Perform Encroachment Permit InspectionsProduct: An Encroachment Permit Inspection
247,722.55360.00
2,540.00
188,887.69617.00
2,000.84
373,929.66390.00
3,975.00
394,780.91390.00
3,975.00
183,482.30438.00
1,993.50
Costs:Products: Hours:
Activity 310280 - Administrative Support
74,293.550.00
1,050.00
45,867.930.00
641.17
66,392.930.00
920.00
69,405.310.00
920.00
47,698.820.00
738.60
Costs:Products: Hours:
Activity 310290 - Employee Training and Development
21,559.120.00
210.00
26,096.270.00
254.11
30,318.270.00
325.00
32,478.070.00
325.00
29,097.240.00
290.50
Costs:Products: Hours:
720
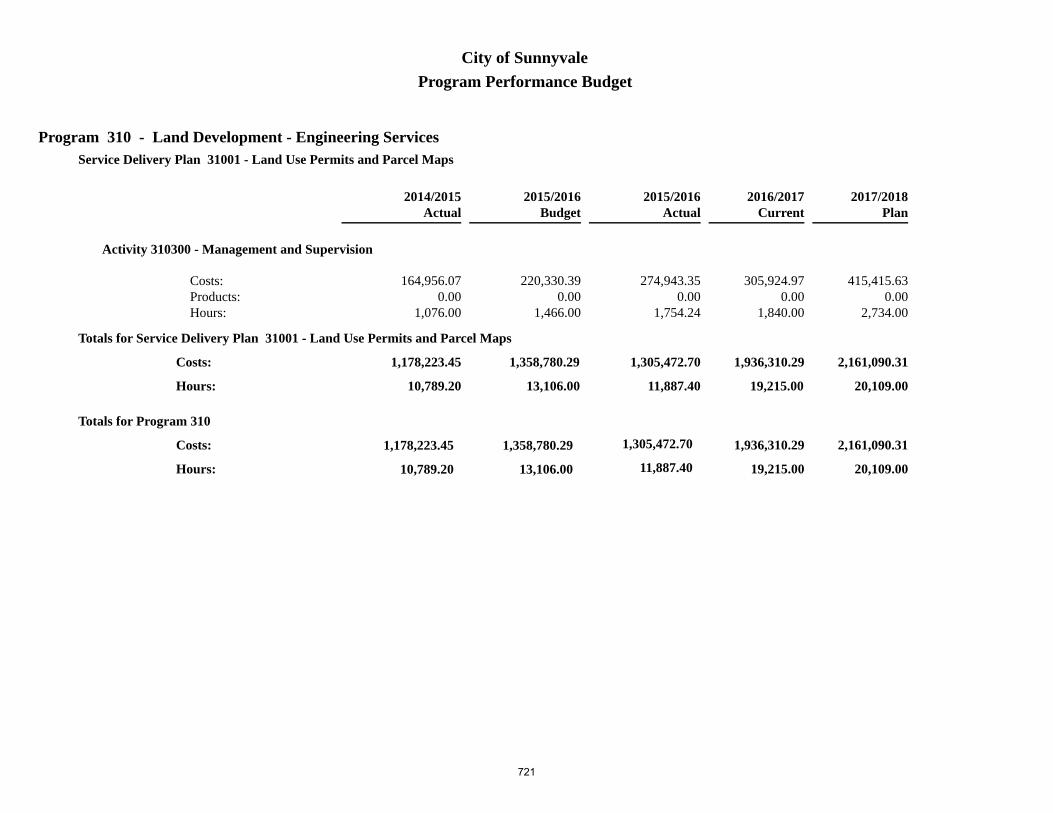
Program 310 - Land Development - Engineering Services
Program Performance BudgetCity of Sunnyvale
Service Delivery Plan 31001 - Land Use Permits and Parcel Maps
Budget2015/2016
Actual2014/2015
Actual2015/2016
Current2016/2017 2017/2018
Plan
Activity 310300 - Management and Supervision
220,330.390.00
1,466.00
274,943.350.00
1,754.24
305,924.970.00
1,840.00
415,415.630.00
2,734.00
164,956.070.00
1,076.00
Costs:Products: Hours:
13,106.00
1,358,780.29 1,305,472.70
11,887.40
1,936,310.29 2,161,090.31
Totals for Service Delivery Plan 31001 - Land Use Permits and Parcel Maps
1,178,223.45
10,789.20Hours:
Costs:
19,215.00 20,109.00
1,358,780.29
13,106.00
1,305,472.70
11,887.40
1,178,223.45
10,789.20
Costs:
Hours: 19,215.00 20,109.00
1,936,310.29 2,161,090.31
Totals for Program 310
721

This Page Intentionally Blank
722
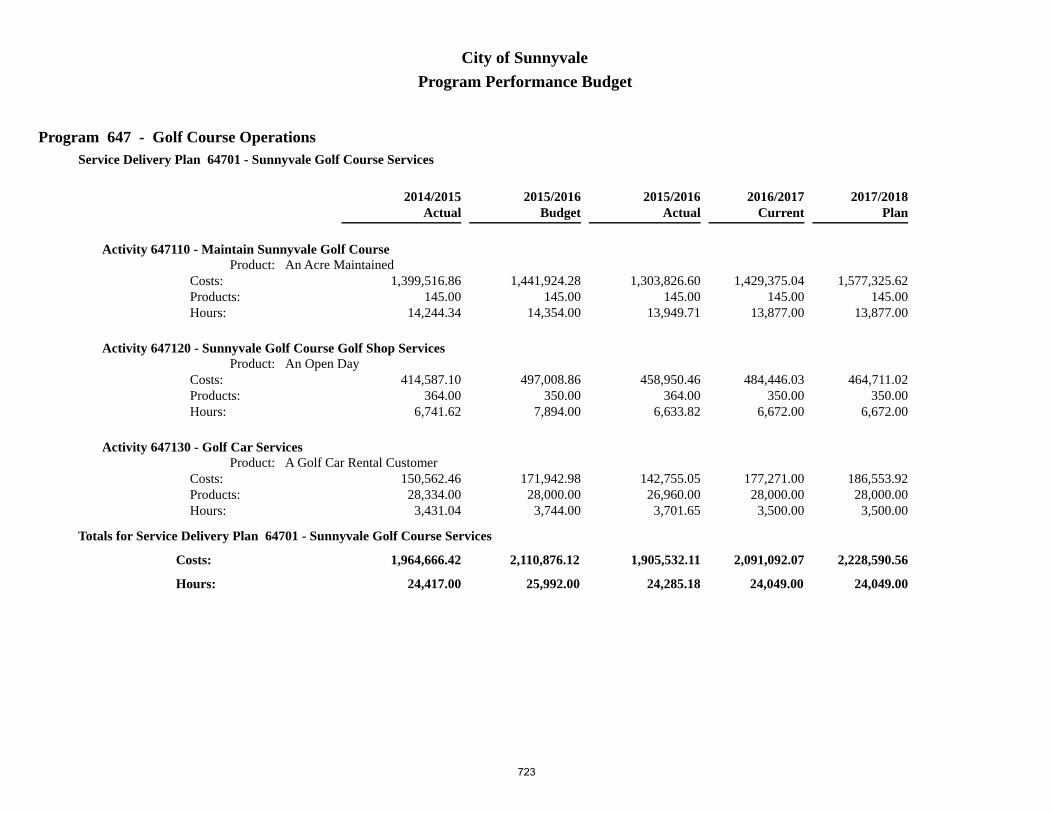
Program 647 - Golf Course Operations
Program Performance BudgetCity of Sunnyvale
Service Delivery Plan 64701 - Sunnyvale Golf Course Services
Budget2015/2016
Actual2014/2015
Actual2015/2016
Current2016/2017 2017/2018
Plan
Activity 647110 - Maintain Sunnyvale Golf CourseProduct: An Acre Maintained
1,441,924.28145.00
14,354.00
1,303,826.60145.00
13,949.71
1,429,375.04145.00
13,877.00
1,577,325.62145.00
13,877.00
1,399,516.86145.00
14,244.34
Costs:Products: Hours:
Activity 647120 - Sunnyvale Golf Course Golf Shop ServicesProduct: An Open Day
497,008.86350.00
7,894.00
458,950.46364.00
6,633.82
484,446.03350.00
6,672.00
464,711.02350.00
6,672.00
414,587.10364.00
6,741.62
Costs:Products: Hours:
Activity 647130 - Golf Car ServicesProduct: A Golf Car Rental Customer
171,942.9828,000.00
3,744.00
142,755.0526,960.00
3,701.65
177,271.0028,000.00
3,500.00
186,553.9228,000.00
3,500.00
150,562.4628,334.00
3,431.04
Costs:Products: Hours:
25,992.00
2,110,876.12 1,905,532.11
24,285.18
2,091,092.07 2,228,590.56
Totals for Service Delivery Plan 64701 - Sunnyvale Golf Course Services
1,964,666.42
24,417.00Hours:
Costs:
24,049.00 24,049.00
723

Program 647 - Golf Course Operations
Program Performance BudgetCity of Sunnyvale
Service Delivery Plan 64702 - Sunken Gardens Golf Course Services
Budget2015/2016
Actual2014/2015
Actual2015/2016
Current2016/2017 2017/2018
Plan
Activity 647210 - Maintain Sunken Gardens Golf CourseProduct: An Acre Maintained
534,711.7630.00
5,083.00
444,468.2630.00
4,695.94
535,666.5430.00
5,096.00
566,725.0230.00
5,096.00
493,906.2630.00
5,340.56
Costs:Products: Hours:
Activity 647220 - Sunken Gardens Golf Course Golf ShopProduct: An Open Day
312,757.58350.00
7,092.00
417,989.03364.00
6,877.35
335,588.01350.00
7,722.00
373,648.48350.00
7,722.00
306,045.87364.00
7,357.65
Costs:Products: Hours:
Activity 647230 - Sunken Gardens Golf Course Driving RangeProduct: An Open Day
176,636.76350.00
5,331.00
127,633.52364.00
4,357.41
180,205.86350.00
5,230.00
191,472.69350.00
5,230.00
152,970.95364.00
5,144.26
Costs:Products: Hours:
17,506.00
1,024,106.10 990,090.81
15,930.70
1,051,460.41 1,131,846.19
Totals for Service Delivery Plan 64702 - Sunken Gardens Golf Course Services
952,923.08
17,842.47Hours:
Costs:
18,048.00 18,048.00
724
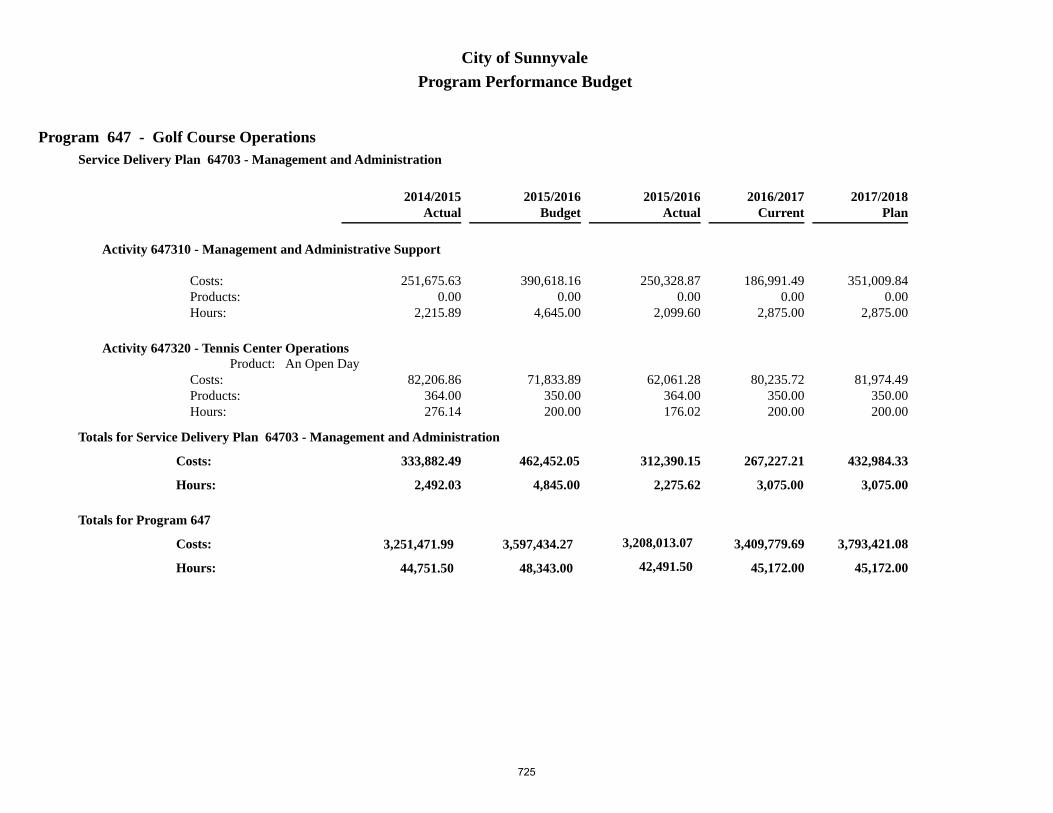
Program 647 - Golf Course Operations
Program Performance BudgetCity of Sunnyvale
Service Delivery Plan 64703 - Management and Administration
Budget2015/2016
Actual2014/2015
Actual2015/2016
Current2016/2017 2017/2018
Plan
Activity 647310 - Management and Administrative Support
390,618.160.00
4,645.00
250,328.870.00
2,099.60
186,991.490.00
2,875.00
351,009.840.00
2,875.00
251,675.630.00
2,215.89
Costs:Products: Hours:
Activity 647320 - Tennis Center OperationsProduct: An Open Day
71,833.89350.00200.00
62,061.28364.00176.02
80,235.72350.00200.00
81,974.49350.00200.00
82,206.86364.00276.14
Costs:Products: Hours:
4,845.00
462,452.05 312,390.15
2,275.62
267,227.21 432,984.33
Totals for Service Delivery Plan 64703 - Management and Administration
333,882.49
2,492.03Hours:
Costs:
3,075.00 3,075.00
3,597,434.27
48,343.00
3,208,013.07
42,491.50
3,251,471.99
44,751.50
Costs:
Hours: 45,172.00 45,172.00
3,409,779.69 3,793,421.08
Totals for Program 647
725

This Page Intentionally Blank
726

Program 709 - Facility Services
Program Performance BudgetCity of Sunnyvale
Service Delivery Plan 70901 - Custodial Services
Budget2015/2016
Actual2014/2015
Actual2015/2016
Current2016/2017 2017/2018
Plan
Activity 709100 - Provide Citywide Janitorial ServicesProduct: Square Foot Cleaned
443,486.40273,161.00
1,737.00
429,425.78244,476.14
1,493.70
479,626.31273,161.00
1,740.00
490,258.77273,161.00
1,740.00
398,322.26269,003.78
1,379.00
Costs:Products: Hours:
Activity 709110 - Provide Janitorial Service to the Columbia Neighborhood CenterProduct: Square Foot Cleaned
29,774.3923,235.00
75.00
31,158.9524,342.96
81.50
34,260.3123,235.00
100.00
34,964.1123,235.00
100.00
21,180.1218,380.21
0.00
Costs:Products: Hours:
Activity 709120 - Provide Janitorial Service to the Sunnyvale Office CenterProduct: Square Foot Cleaned
72,389.1935,500.00
750.00
68,090.7633,410.48
589.00
69,166.0135,500.00
560.00
72,025.6035,500.00
560.00
49,136.3724,107.58
420.50
Costs:Products: Hours:
2,562.00
545,649.98 528,675.49
2,164.20
583,052.63 597,248.48
Totals for Service Delivery Plan 70901 - Custodial Services
468,638.75
1,799.50Hours:
Costs:
2,400.00 2,400.00
727

Program 709 - Facility Services
Program Performance BudgetCity of Sunnyvale
Service Delivery Plan 70902 - Building Maintenance Services
Budget2015/2016
Actual2014/2015
Actual2015/2016
Current2016/2017 2017/2018
Plan
Activity 709200, 709201 - Structural or Preventative Maintenance
1,760,959.310.00
16,918.00
1,778,976.610.00
16,749.50
1,824,113.820.00
17,900.00
1,931,353.470.00
17,900.00
1,744,217.520.00
15,027.10
Costs:Products: Hours:
Activity 709210 - Columbia Neighborhood Center Maintenance
85,246.400.00
370.00
65,754.510.00
118.40
69,281.420.00
200.00
71,013.220.00
200.00
85,489.540.00
374.40
Costs:Products: Hours:
Activity 709220 - Sunnyvale Office Center Maintenance
181,829.130.00
460.00
189,333.690.00
701.50
199,409.510.00
450.00
203,412.860.00
450.00
200,710.690.00
318.90
Costs:Products: Hours:
17,748.00
2,028,034.84 2,034,064.81
17,569.40
2,092,804.75 2,205,779.55
Totals for Service Delivery Plan 70902 - Building Maintenance Services
2,030,417.75
15,720.40Hours:
Costs:
18,550.00 18,550.00
728

Program 709 - Facility Services
Program Performance BudgetCity of Sunnyvale
Service Delivery Plan 70903 - Provide Utilities
Budget2015/2016
Actual2014/2015
Actual2015/2016
Current2016/2017 2017/2018
Plan
Activity 709300 - Provide ElectricityProduct: A Kilowatt Hour Consumed
878,750.276,647,182.00
0.00
865,501.797,399,333.82
0.00
1,079,698.006,395,235.00
0.00
1,074,456.756,416,776.00
0.00
928,472.956,872,950.90
0.00
Costs:Products: Hours:
Activity 709310 - Provide GasProduct: A Therm Consumed
130,166.77147,317.00
0.00
108,240.36132,168.51
0.00
128,167.00147,317.00
0.00
134,447.18147,317.00
0.00
125,217.99137,148.51
0.00
Costs:Products: Hours:
Activity 709320 - Provide WaterProduct: 100 Cubic Feet Consumed
187,184.1133,525.00
0.00
157,496.8155,929.12
304.50
145,000.0031,525.00
0.00
151,238.1031,525.00
0.00
132,999.1329,044.39
0.00
Costs:Products: Hours:
0.00
1,196,101.15 1,131,238.96
304.50
1,352,865.00 1,360,142.03
Totals for Service Delivery Plan 70903 - Provide Utilities
1,186,690.07
0.00Hours:
Costs:
0.00 0.00
729

Program 709 - Facility Services
Program Performance BudgetCity of Sunnyvale
Service Delivery Plan 70904 - Management and Administrative Services
Budget2015/2016
Actual2014/2015
Actual2015/2016
Current2016/2017 2017/2018
Plan
Activity 709400 - Provide Management and Supervisory Services
326,612.400.00
2,330.00
274,151.510.00
1,934.80
337,946.860.00
2,300.00
343,480.180.00
2,300.00
328,697.320.00
2,261.00
Costs:Products: Hours:
Activity 709410 - Provide Administrative Support
115,632.260.00
1,390.00
87,883.330.00
996.90
146,174.150.00
1,706.00
156,102.610.00
1,706.00
104,602.870.00
1,177.10
Costs:Products: Hours:
3,720.00
442,244.66 362,034.84
2,931.70
484,121.01 499,582.79
Totals for Service Delivery Plan 70904 - Management and Administrative Services
433,300.19
3,438.10Hours:
Costs:
4,006.00 4,006.00
4,212,030.63
24,030.00
4,056,014.10
22,969.80
4,119,046.76
20,958.00
Costs:
Hours: 24,956.00 24,956.00
4,512,843.39 4,662,752.85
Totals for Program 709
730
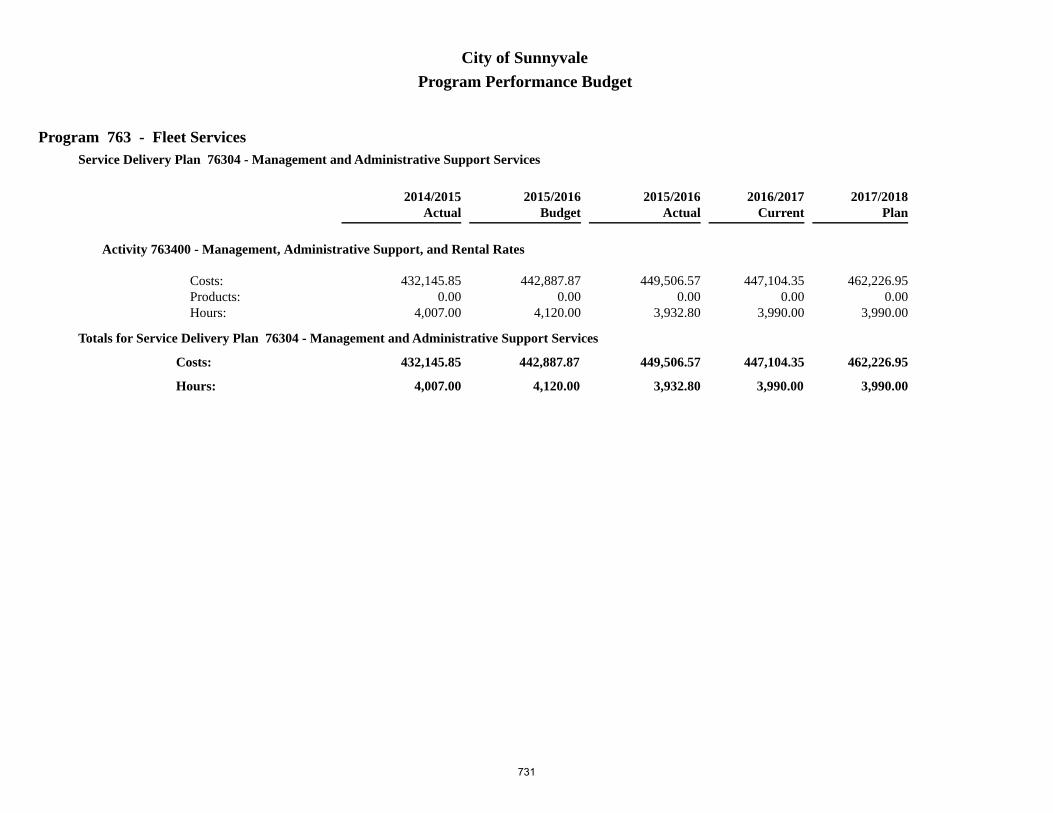
Program 763 - Fleet Services
Program Performance BudgetCity of Sunnyvale
Service Delivery Plan 76304 - Management and Administrative Support Services
Budget2015/2016
Actual2014/2015
Actual2015/2016
Current2016/2017 2017/2018
Plan
Activity 763400 - Management, Administrative Support, and Rental Rates
442,887.870.00
4,120.00
449,506.570.00
3,932.80
447,104.350.00
3,990.00
462,226.950.00
3,990.00
432,145.850.00
4,007.00
Costs:Products: Hours:
4,120.00
442,887.87 449,506.57
3,932.80
447,104.35 462,226.95
Totals for Service Delivery Plan 76304 - Management and Administrative Support Services
432,145.85
4,007.00Hours:
Costs:
3,990.00 3,990.00
731

Program 763 - Fleet Services
Program Performance BudgetCity of Sunnyvale
Service Delivery Plan 76305 - Fleet Maintenance
Budget2015/2016
Actual2014/2015
Actual2015/2016
Current2016/2017 2017/2018
Plan
Activity 763500 - Preventive MaintenanceProduct: Preventive Maintenance Completed
475,097.17940.00
5,177.00
344,146.34704.00
3,460.10
499,083.391,250.005,310.00
535,686.521,250.005,310.00
404,519.231,202.004,097.50
Costs:Products: Hours:
Activity 763510 - Repair ServicesProduct: Number of Repairs
1,022,899.361,430.007,183.00
1,000,970.171,443.006,356.00
1,117,107.241,795.007,970.00
1,173,701.611,795.007,970.00
980,107.641,895.006,150.50
Costs:Products: Hours:
Activity 763520 - Other Fleet Services
525,952.810.00
5,625.00
501,453.120.00
5,447.30
515,888.920.00
5,440.00
549,608.500.00
5,440.00
509,833.240.00
5,253.50
Costs:Products: Hours:
Activity 763530 - Operator Certifications and Training
28,767.140.00
340.00
35,778.760.00
461.50
35,980.470.00
395.00
38,607.300.00
395.00
39,388.740.00
497.00
Costs:Products: Hours:
Activity 763540 - Refueling Services
935,046.970.00
170.00
669,524.000.00
221.30
797,724.630.00
140.00
849,189.910.00
140.00
830,447.530.00
140.00
Costs:Products: Hours:
732
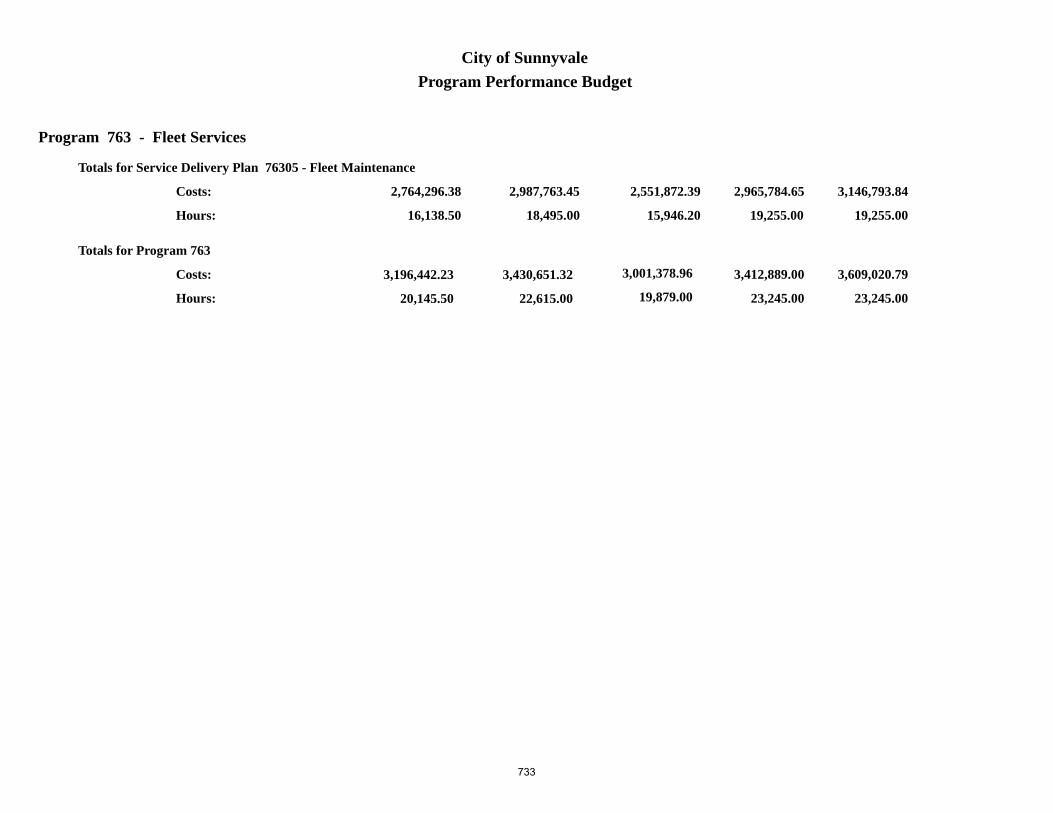
Program 763 - Fleet Services
Program Performance BudgetCity of Sunnyvale
18,495.00
2,987,763.45 2,551,872.39
15,946.20
2,965,784.65 3,146,793.84
Totals for Service Delivery Plan 76305 - Fleet Maintenance
2,764,296.38
16,138.50Hours:
Costs:
19,255.00 19,255.00
3,430,651.32
22,615.00
3,001,378.96
19,879.00
3,196,442.23
20,145.50
Costs:
Hours: 23,245.00 23,245.00
3,412,889.00 3,609,020.79
Totals for Program 763
733

This Page Intentionally Blank
734

Adopted Budget and Resource Allocation PlanCity of Sunnyvale, California – Fiscal Year 2017/18
Volume IIIProjects Budget

City of SunnyvaleADOPTED BUDGET and RESOURCE ALLOCATION PLAN
Fiscal Year 2017/18VOLUME III
Projects BudgetTABLE OF CONTENTS
PageProjects Budget
Introduction:Projects Budget Guide 739Numerical Project Index 741Alphabetical Project Index 755Departmental Project Index 769
Traffic and Transportation Projects:Summary 787Budget Project Costs Summary 797Funded Projects 801Unfunded Projects 873
Downtown Projects:Summary 889Budget Project Costs Summary 891Funded Projects 893Unfunded Projects 903
Housing Projects: Summary 905Budget Project Costs Summary 907
909Funded Projects
Water Projects:Summary 923Budget Project Costs Summary 925Funded Projects 927Unfunded Projects 949
735

City of SunnyvaleADOPTED BUDGET and RESOURCE ALLOCATION PLAN
Fiscal Year 2017/18VOLUME III
Projects BudgetTABLE OF CONTENTS
PageSolid Waste Projects:
Summary 953Budget Project Costs Summary 955
957 Funded Projects
Wastewater Projects:Summary 973Budget Project Costs Summary 975Funded Projects 979Unfunded Projects 1049
Public Safety Projects:Summary 1051Budget Project Costs Summary 1053
1055Funded Projects
Community Development Block Grant (CDBG) Projects:Summary 1087Budget Project Costs Summary 1089
1091 Funded Projects
Outside Group Funding Projects:Summary 1097Budget Project Costs Summary 1099Funded Projects 1101
736

City of SunnyvaleADOPTED BUDGET and RESOURCE ALLOCATION PLAN
Fiscal Year 2017/18VOLUME III
Projects BudgetTABLE OF CONTENTS
PageParks and Recreation Projects:
Summary 1107Budget Project Costs Summary 1109
1113 Funded Projects
Library Projects:Summary 1183Budget Project Costs Summary 1185
1187Funded Projects
Governance and Community Engagement Projects:Summary 1195Budget Project Costs Summary 1197Funded Projects 1201Unfunded Projects 1247
Administrative Facilities Projects:Summary 1249Budget Project Costs Summary 1251Funded Projects 1255Unfunded Projects 1285
737

This Page Intentionally Blank
738

Projects Budget Guide

Projects Budget Guide
Strategic VisionThe City of Sunnyvale has developed a strategic vision to develop its
capital assets so residents will continue to realize optimal service in an aesthetically pleasing environment. Careful management of these assets keeps the City poised for flexible and responsive growth, while methodical planning allows the City to proactively prepare the ground work so it can seize opportunities arising from a dynamic economy. Further, this plan incorporates a broad vision that allows the City to concentrate on the “here and now” delivery of service, while keeping its eye on the horizon. Applying a long-term approach allows the City to seek economically solid and financially feasible opportunities to “grow” toward a vision of tomorrow.
In Sunnyvale’s multi-year framework, capital improvement maintenance and infrastructure replacement are given high priority. New capital improvements must be supportive of the General Plan. The City’s long-term financial plan represents the large demand that fixed asset replacement places on any government body.
Capital improvements substantially affect the economic vitality and quality of life in the community. By definition, a capital improvement requires a major initial investment, a significant and continuing financial commitment, and eventual replacement. Capital improvements require careful long-term planning and budgeting so cyclical downturns or unforeseen financial emergencies do not curtail planned maintenance and necessary replacement.
The City of Sunnyvale has a consolidated General Plan that contains a comprehensive capital assets plan that is specific to its focus on scope of service. This plan is formulated through careful analysis, study, and consideration. The Projects Budget aligns projects with the General Plan.
Using the plan as a foundation, individual projects are proposed based on the needs of the community. These projects may be designated as capital, infrastructure, special, or outside group funding. Capital projects relate to construction, major improvements, or acquisition of a structure. Infrastructure projects generally relate to the long-term renovation and replacement of the City’s existing physical assets like streets, sewers, water lines, roof replacements, and heating, air conditioning, and ventilation systems replacement. Special projects generally include one-time projects that are designed to address a specific community need or problem. For example, this category could include a study on the Fire department standards of response coverage to improve efficiencies and related level of service to the community. The last category is outside group funding. These also are special projects, but are separated to identify City contributions to local community-based organizations.
Project Planning & BudgetingEvery other year the City reviews and updates the twenty-year Projects
Budget. Every project is extensively reviewed. The City examines each project in several different contexts. Consideration is given to how the project will be financed and sometimes whether it will be financed. Cost/benefit analyses are conducted on the merits of the projects and where each fits into the overall capital assets plan for the City. Projections are formulated on expenditures and if the project will generate revenues. All project costs are updated to reflect current requirements.
In order to provide a sound foundation for decision making on capital improvements and other project-related efforts, the City applies extensive criteria to determine the value of each project. Criteria include, but are not limited to protection of public health and safety, adherence to legal requirements, environmental quality, level of public support, return on investment, availability of financing, and relationship to Council-adopted plans.
City of Sunnyvale FY 2017/18 Adopted Budget and Resource Allocation Plan
739

Operating resources required to maintain new capital improvements commencing the year the improvement is completed are included in the City’s long-term financial plans. Each project identifies, if applicable, the amount and the fiscal year in which the additional operating costs become effective. These costs are incorporated in the long-term financial plans for each affected fund.
The City carefully considers each project’s short-term and long-term effects against current policy directives, citywide needs, on-going operational needs, and budgetary constraints. These considerations are applied across the entire twenty-year planning horizon and to all projects, no matter their cost or scope. The effect is a long-term, comprehensive project plan that is synchronized with a balanced operating budget. This approach provides a complete financial analysis of the impact of all projects proposed for funding in the immediate year, as well as in future years. It also provides a “big picture” perspective of how the projects are synchronized with the operating budget.
Fiscal Policies Related to Capital & Infrastructure Expenditures
Council Fiscal Policy identifies a number of capital improvement and related policies designed to maximize value and cost-effectiveness of the City’s infrastructure. Several key policies include those relating to plan, design, and funding.
Capital Improvement Plan. High priority should be given to replacing capital improvements prior to the time they have deteriorated to the point where they are hazardous, incur high maintenance costs, negatively affect property values, or no longer serve their intended purposes. Priority will be given to the repair and replacement of existing infrastructure as compared to the provision of new or expanded facilities.
Capital Improvement Design. The planning and design of all capital improvements should be based on standards that minimize construction costs, while assuring acceptable useful life and reducing maintenance requirements. Value engineering processes will be used when necessary and appropriate.
Capital Improvement Funding. In most cases, governmental capital improvements should be funded on a pay-as-you-go basis. Alternate financing strategies may be considered in light of the specific project and the consequences of each financing strategy.
Land Acquisition. A high priority will be given to acquiring undeveloped land needed to meet City goals. Developed land should be acquired in a reasonable time prior to when the property is required for City purposes.
Reserves. Provide a prudent level of reserves for future unexpected expenses and revenue declines; to accumulate funds to support future planned capital improvements; and to reduce the variability between high and low expenditure years in the Twenty-Year Resource Allocation Plan.
Unfunded ProjectsOver the last several years, staff has made a concerted effort to identify
all of the unfunded capital projects that pose a significant liability in the long-term. Unfunded projects fall into several categories, with many having potential funding sources that can be pursued. Project Information Sheets for these unfunded projects can be found in numerical order in each project category following the Project Information Sheets for funded projects.
In addition, there are many unfunded projects identified in the long range plans for traffic and transportation that guide the development of the capital projects budget in the short- and long-term. These long range plans are discussed in more detail under the Traffic and Transportation projects category. The full listing of projects for this plan is also provided. For those projects on the lists that are not included in the projects budget, at such time as funding becomes available, those projects will be evaluated and moved into the projects budget as appropriate.
City of Sunnyvale FY 2017/18 Adopted Budget and Resource Allocation Plan
740

Numerical Project Index

Project No. Project Name Department Project Category Project Type Page #Funded Projects801351 Sunnyvale Contribution to SMaRT Station Equipment Rep. Fund Environmental Services Special Solid Waste 957802150 Utility Undergrounding Cost Sharing Public Works Capital Traffic & Transportation 801803501 CDBG Housing Rehabilitation Revolving Loan Fund Community Development Special CDBG 1091803700 Leadership Sunnyvale [GF] Office of the City Manager Outside Group Funding Outside Group Funding 1101804201 City-wide Aerial Photos Information Technology Special Gov. & Comm. Engagement 1201804401 Golf Courses Protective Netting Replacement Public Works Infrastructure Parks & Recreation 1113805150 Library Foundation Program Grant Library and Community Services Special Library 1187805253 Sewer Emergency Repair and Replacement Environmental Services Infrastructure Wastewater 979806351 Land Development and Capital Construction Environmental Services Capital Water 927811250 SMaRT Station® Equipment Replacement Environmental Services Infrastructure Solid Waste 958812701 Home Access, Paint, Emergency Repair, and Energy-Efficiency Community Development Special CDBG 1092814952 Redevelopment Dissolution Finance Special Gov. & Comm. Engagement 1202815203 Replacement of Water/Sewer Supervisory Control System Environmental Services Infrastructure Water 928816000 Future Traffic Signal Construction Public Works Capital Traffic & Transportation 802816050 Minor Repair of City Bridges and Culverts Public Works Infrastructure Traffic & Transportation 803818100 Public Safety Buildings - Roofs Public Works Infrastructure Administrative Facilities 1255818550 Park Buildings - Rehabilitation Public Works Infrastructure Parks & Recreation 1114818600 Senior Center Buildings - Rehabilitation Public Works Infrastructure Parks & Recreation 1115818700 Corporation Yard Buildings - Rehabilitation Public Works Infrastructure Administrative Facilities 1256819610 Public Safety Buildings - HVAC Public Works Infrastructure Administrative Facilities 1257819720 Outside Group Funding Support [GF] Community Development Outside Group Funding Outside Group Funding 1102819771 Utility Maintenance Management System Environmental Services Special Water 929819840 Police Services Equipment Acquisition Public Safety Capital Public Safety 1055820000 Corporation Yard Buildings - HVAC Replacement Public Works Infrastructure Administrative Facilities 1258820120 Repaint Street Light Poles Public Works Infrastructure Traffic & Transportation 804820130 Routine Resurfacing of City Owned Parking Lots Public Works Infrastructure Administrative Facilities 1259820140 Computer/Radio Controlled Landscape Median Irrigation Public Works Infrastructure Parks & Recreation 1116820180 Traffic Signal Controller Replacement Public Works Infrastructure Traffic & Transportation 805820190 Traffic Signal Hardware & Wiring Public Works Infrastructure Traffic & Transportation 806820200 Traffic Signal Light Emitting Diode (LED) Array Replacements Public Works Infrastructure Traffic & Transportation 807820240 Park Tennis/Basketball Court Reconstruction Public Works Infrastructure Parks & Recreation 1117
City of SunnyvaleNumerical Project Index
Funded and Unfunded Projects by Project Number
741

Project No. Project Name Department Project Category Project Type Page #
City of SunnyvaleNumerical Project Index
Funded and Unfunded Projects by Project Number
820270 Playground Equipment Replacement Public Works Infrastructure Parks & Recreation 1118820280 Park Furniture and Fixtures Replacement Public Works Infrastructure Parks & Recreation 1119820311 Golf Course Irrigation System Replacement Public Works Infrastructure Parks & Recreation 1120820361 Golf Course Tee Grounds Renewal Public Works Infrastructure Parks & Recreation 1121820570 Minor Building Modifications Public Works Capital Administrative Facilities 1260821010 Maintenance of City Owned Properties - Downtown Public Works Special Administrative Facilities 1261821170 SMaRT Station Operations Contract RFP Environmental Services Special Solid Waste 959821181 Contribution to SMaRT Station Operations Contract RFP Environmental Services Special Solid Waste 960822752 Storm Pump Station Number 1 Rehabilitation Environmental Services Infrastructure Wastewater 980822762 Storm Pump Station Number 2 Rehabilitation Environmental Services Infrastructure Wastewater 981823750 BMR Compliance Enforcement Community Development Special Housing 909824261 Solid Waste Cost of Service Study Finance Special Solid Waste 961824281 Leak Detection and Condition Assessment Program Environmental Services Special Water 930824291 Water Cost of Service Study Finance Special Water 931824301 Rehabilitation of Digesters Environmental Services Infrastructure Wastewater 982824341 Wastewater Cost of Service Study Finance Special Wastewater 983824571 Project Management for Town Center Development Agreement Office of the City Attorney Special Gov. & Comm. Engagement 1203824741 Landfill "Constituents of Concern" Monitoring Environmental Services Special Solid Waste 962824771 SCWP Primary Process Design and Construction Environmental Services Infrastructure Wastewater 984824780 Upgrading of Fuel Stations Public Works Infrastructure Administrative Facilities 1262824980 Sunnyvale Office Center Site Improvements Public Works Infrastructure Administrative Facilities 1263825070 Bicycle Map Revision Public Works Special Traffic & Transportation 808825141 Air Flotation Tanks Rehabilitation Environmental Services Infrastructure Wastewater 985825221 Central Well Reconstruction Environmental Services Infrastructure Water 932825231 Cleaning of Water Tanks Environmental Services Infrastructure Water 933825251 Mary/Carson Water Plant Upgrade Environmental Services Infrastructure Water 934825290 Pavement Rehabilitation Public Works Infrastructure Traffic & Transportation 809825301 Pressure Reducing Valve Replacement Environmental Services Infrastructure Water 935825331 Replacement/Repair/Rehabilitation of Sanitary Sewer System Environmental Services Infrastructure Wastewater 986825340 Street Lights Conduit Replacement Public Works Infrastructure Traffic & Transportation 810825361 Replacement/Repair/Rehabilitation of Storm Drain System Environmental Services Infrastructure Wastewater 987825391 Wolfe/Evelyn Water Plant Upgrade Environmental Services Infrastructure Water 936
742

Project No. Project Name Department Project Category Project Type Page #
City of SunnyvaleNumerical Project Index
Funded and Unfunded Projects by Project Number
825400 Update of Standard Specifications and Details Public Works Special Gov. & Comm. Engagement 1204825451 City-wide Water Line Replacement Environmental Services Infrastructure Water 937825521 WPCP Biosolids Processing Environmental Services Infrastructure Wastewater 988825530 Transportation Model Update Public Works Special Traffic & Transportation 811825570 239 - 241 Commercial Street Property Maintenance Public Works Special Administrative Facilities 1264825610 Fair Oaks Avenue Overhead Bridge Repair Public Works Capital Traffic & Transportation 812825660 Golf Course Greens Renewal Public Works Infrastructure Parks & Recreation 1122825700 General Plan Updates Community Development Special Gov. & Comm. Engagement 1205825730 Pedestrian Lighted Crosswalk Maintenance and Replacement Public Works Infrastructure Traffic & Transportation 813825740 Battery Backup System for Traffic Signals Maintenance Public Works Infrastructure Traffic & Transportation 814825751 Sewer Lift Stations Rebuild Environmental Services Infrastructure Wastewater 989825850 Swim Pools Infrastructure Public Works Infrastructure Parks & Recreation 1123825911 Landfill Gas Flare and Blowers Replacement Environmental Services Infrastructure Solid Waste 963825930 Maintain City-Owned Properties - Downtown/388 Charles Street Public Works Special Administrative Facilities 1265825961 SCVURPPP Contracting and Fiscal Agent Finance Special Wastewater 990826300 FY 14-15 Recruitment and Training for Sworn Officers Public Safety Special Public Safety 1056826320 FY 15-16 Recruitment and Training for Sworn Officers Public Safety Special Public Safety 1057826330 FY 16-17 Recruitment and Training for Sworn Officers Public Safety Special Public Safety 1058826340 FY 17-18 Recruitment and Training for Sworn Officers Public Safety Special Public Safety 1059826350 FY 18-19 Recruitment and Training for Sworn Officers Public Safety Special Public Safety 1060826351 FY 19-37 Recruitment and Training for Sworn Officers Public Safety Special Public Safety 1061826520 Pre-Development Costs on Affordable Housing Sites Community Development Special Housing 910826530 County-Wide Homeless Count Community Development Special Housing 911826620 Town Center Construction - Public Works Services Public Works Special Downtown 893826710 Washington Community Swim Center Public Works Capital Parks & Recreation 1124826730 Underground Overhead Utilities Public Works Capital Traffic & Transportation 815826790 Sunnyvale Avenue Median from Iowa to Washington Public Works Capital Downtown 894826800 Downtown Wayfinding and Gateways Public Works Capital Downtown 895826820 Town Center Traffic Signal Modifications Public Works Capital Downtown 896826850 Calabazas Creek Bridge at Old Mt. View-Alviso Rd Public Works Infrastructure Traffic & Transportation 816826890 Mathilda/237/101 Interchange Improvements Public Works Capital Traffic & Transportation 817826900 Washington Avenue/Mathilda Avenue Intersection Widening Public Works Capital Downtown 897
743

Project No. Project Name Department Project Category Project Type Page #
City of SunnyvaleNumerical Project Index
Funded and Unfunded Projects by Project Number
826960 Water Utility Master Plan Environmental Services Infrastructure Water 938827020 Emergency Flow Management Infrastructure Environmental Services Infrastructure Wastewater 991827040 WPCP Asset Condition Assessment Environmental Services Infrastructure Wastewater 992827160 Sunnyvale Tennis Center Court Rehabilitation Public Works Infrastructure Parks & Recreation 1125827180 Automation of Water Meter Reading Finance Infrastructure Water 939827550 Outside Group Funding Support [CDBG] Community Development Outside Group Funding CDBG 1093827560 Aerial Mapping and Settlement Analysis of the SV Landfill Environmental Services Special Solid Waste 964827570 Downtown Parking District Major Maintenance Public Works Infrastructure Downtown 898827700 Records Imaging and Voting System Upgrade Office of the City Manager Special Gov. & Comm. Engagement 1206828030 Annual Slurry Seal of City Streets Public Works Infrastructure Traffic & Transportation 818828100 First-Time Homebuyer Loans Community Development Special Housing 912828150 Police Services Equipment - Cell Phones Public Safety Capital Public Safety 1062828210 Inspection Data Mgmt and Handheld Data Entry Device Project Environmental Services Capital Wastewater 993828260 Replace SMaRT Station Environmental Services Infrastructure Solid Waste 965828290 Parks Parking Lot Rehabilitation Public Works Infrastructure Parks & Recreation 1126828390 Sunken Gardens Golf Course Clubhouse Paving Public Works Infrastructure Parks & Recreation 1127828400 Golf Buildings Renovations Public Works Infrastructure Parks & Recreation 1128828420 Tennis Center Buildings Infrastructure Public Works Infrastructure Parks & Recreation 1129828750 Tenant Based Rental Assistance (HOME) Community Development Special Housing 913829060 Rehabilitation of Cathodic Protection on RW System Environmental Services Infrastructure Water 940829070 Lawrence Expressway Sanitary Sewer Rehabilitation Environmental Services Infrastructure Wastewater 994829080 Storm System Trash Control Devices Environmental Services Capital Wastewater 995829100 Sanitary Sewer Siphon Cleaning and Assessment Environmental Services Capital Wastewater 996829140 Fire Station Electrical Systems and Roll Up Door Replacement Public Works Capital Administrative Facilities 1266829150 Swimming Pool Buildings Infrastructure Public Works Infrastructure Parks & Recreation 1130829160 Golf Course Tree Trimming and Removal Public Works Special Parks & Recreation 1131829170 Sunken Gardens Driving Range Light Replacement Public Works Infrastructure Parks & Recreation 1132829190 Community Center Comprehensive Infrastructure Public Works Infrastructure Parks & Recreation 1133829310 California Environmental Reporting System (CERS) Grant Public Safety Special Public Safety 1063829370 Safe Routes to School and Neighborhood Guided Bike Routes Public Works Capital Traffic & Transportation 819829400 Sidewalk, Curb and Gutter Replacement Public Works Infrastructure Traffic & Transportation 820829430 WPCP Chlorine Conversion Environmental Services Capital Wastewater 997
744

Project No. Project Name Department Project Category Project Type Page #
City of SunnyvaleNumerical Project Index
Funded and Unfunded Projects by Project Number
829440 Land Acquisition Due Diligence Public Works Infrastructure Parks & Recreation 1134829450 Wolfe Road Recycled Water Project Environmental Services Infrastructure Water 941829510 Emergency Medical Dispatch First Responder Incentive Funding Public Safety Special Public Safety 1064829560 Sunnyvale Workforce Development Program-DST Community Development Special CDBG 1094829620 Downtown Association Office of the City Manager Special Outside Group Funding 1103829630 Council Set Aside Finance Special Gov. & Comm. Engagement 1207829670 Lawrence Station Area Plan - Phase II Community Development Special Gov. & Comm. Engagement 1208829690 Comprehensive School Traffic Study Public Works Special Gov. & Comm. Engagement 1209829751 Fire Prevention Construction-Related Permitting (Fund 510) Public Safety Special Gov. & Comm. Engagement 1210829810 Peery Park Specific Plan and Environmental Impact Report Community Development Special Gov. & Comm. Engagement 1211829910 Mathilda Avenue/Maude Avenue Safety Improvements Public Works Infrastructure Traffic & Transportation 821830040 Onizuka Site Transition Plan Community Development Capital Gov. & Comm. Engagement 1212830110 Sunnyvale-Saratoga Road Pedestrian Safety Signal Public Works Capital Traffic & Transportation 822830120 Pay Parking in Downtown Area Public Works Capital Traffic & Transportation 823830170 Refurbishment of Water Tanks Environmental Services Infrastructure Water 942830180 Landfill Post-Closure Erosion Prevention Environmental Services Infrastructure Solid Waste 966830190 Repairs to the Primary Process Environmental Services Infrastructure Wastewater 998830200 Repairs to the Secondary Process Environmental Services Infrastructure Wastewater 999830210 Repairs to the Power Generation Facility Environmental Services Infrastructure Wastewater 1000830220 Repairs to the Tertiary Process Environmental Services Infrastructure Wastewater 1001830230 Laboratory Information Management System (LIMS) Environmental Services Capital Wastewater 1002830240 SCWP Program Management Environmental Services Infrastructure Wastewater 1003830250 SCWP Master Plan Environmental Services Infrastructure Wastewater 1004830260 Sanitary Sewer Salinity Reduction Study Environmental Services Special Wastewater 1005830280 Sunnyvale Baylands Park Infrastructure Public Works Infrastructure Parks & Recreation 1135830290 Braly Park Renovation and Enhancement Public Works Infrastructure Parks & Recreation 1136830300 Cannery Park Renovation and Enhancement Public Works Infrastructure Parks & Recreation 1137830310 Community Center Grounds Renovation and Enhancement Public Works Infrastructure Parks & Recreation 1138830320 De Anza Park Renovation and Enhancement Public Works Infrastructure Parks & Recreation 1139830330 Encinal Park Renovation and Enhancement Public Works Infrastructure Parks & Recreation 1140830340 Fair Oaks Park Renovation and Enhancement Public Works Infrastructure Parks & Recreation 1141830350 Fairwood Park Renovation and Enhancement Public Works Infrastructure Parks & Recreation 1142
745
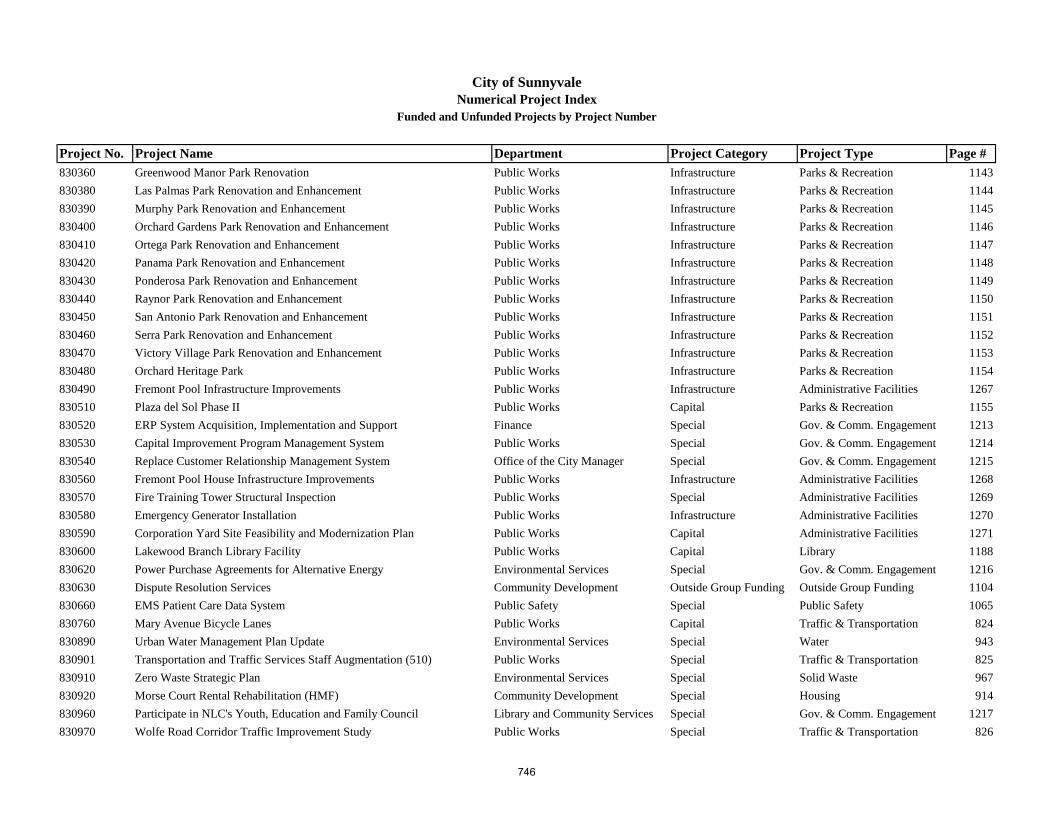
Project No. Project Name Department Project Category Project Type Page #
City of SunnyvaleNumerical Project Index
Funded and Unfunded Projects by Project Number
830360 Greenwood Manor Park Renovation Public Works Infrastructure Parks & Recreation 1143830380 Las Palmas Park Renovation and Enhancement Public Works Infrastructure Parks & Recreation 1144830390 Murphy Park Renovation and Enhancement Public Works Infrastructure Parks & Recreation 1145830400 Orchard Gardens Park Renovation and Enhancement Public Works Infrastructure Parks & Recreation 1146830410 Ortega Park Renovation and Enhancement Public Works Infrastructure Parks & Recreation 1147830420 Panama Park Renovation and Enhancement Public Works Infrastructure Parks & Recreation 1148830430 Ponderosa Park Renovation and Enhancement Public Works Infrastructure Parks & Recreation 1149830440 Raynor Park Renovation and Enhancement Public Works Infrastructure Parks & Recreation 1150830450 San Antonio Park Renovation and Enhancement Public Works Infrastructure Parks & Recreation 1151830460 Serra Park Renovation and Enhancement Public Works Infrastructure Parks & Recreation 1152830470 Victory Village Park Renovation and Enhancement Public Works Infrastructure Parks & Recreation 1153830480 Orchard Heritage Park Public Works Infrastructure Parks & Recreation 1154830490 Fremont Pool Infrastructure Improvements Public Works Infrastructure Administrative Facilities 1267830510 Plaza del Sol Phase II Public Works Capital Parks & Recreation 1155830520 ERP System Acquisition, Implementation and Support Finance Special Gov. & Comm. Engagement 1213830530 Capital Improvement Program Management System Public Works Special Gov. & Comm. Engagement 1214830540 Replace Customer Relationship Management System Office of the City Manager Special Gov. & Comm. Engagement 1215830560 Fremont Pool House Infrastructure Improvements Public Works Infrastructure Administrative Facilities 1268830570 Fire Training Tower Structural Inspection Public Works Special Administrative Facilities 1269830580 Emergency Generator Installation Public Works Infrastructure Administrative Facilities 1270830590 Corporation Yard Site Feasibility and Modernization Plan Public Works Capital Administrative Facilities 1271830600 Lakewood Branch Library Facility Public Works Capital Library 1188830620 Power Purchase Agreements for Alternative Energy Environmental Services Special Gov. & Comm. Engagement 1216830630 Dispute Resolution Services Community Development Outside Group Funding Outside Group Funding 1104830660 EMS Patient Care Data System Public Safety Special Public Safety 1065830760 Mary Avenue Bicycle Lanes Public Works Capital Traffic & Transportation 824830890 Urban Water Management Plan Update Environmental Services Special Water 943830901 Transportation and Traffic Services Staff Augmentation (510) Public Works Special Traffic & Transportation 825830910 Zero Waste Strategic Plan Environmental Services Special Solid Waste 967830920 Morse Court Rental Rehabilitation (HMF) Community Development Special Housing 914830960 Participate in NLC's Youth, Education and Family Council Library and Community Services Special Gov. & Comm. Engagement 1217830970 Wolfe Road Corridor Traffic Improvement Study Public Works Special Traffic & Transportation 826
746

Project No. Project Name Department Project Category Project Type Page #
City of SunnyvaleNumerical Project Index
Funded and Unfunded Projects by Project Number
830980 Comprehensive Update of the Precise Plan for El Camino Real Community Development Special Gov. & Comm. Engagement 1218830990 Community Choice Aggregation Program Environmental Services Special Gov. & Comm. Engagement 1219830991 Community Choice Energy Phase I Environmental Services Special Gov. & Comm. Engagement 1220831110 Fair Oaks Ave Bike Lanes and Streetscape Public Works Capital Traffic & Transportation 827831120 Maude Ave Streetscape Public Works Capital Traffic & Transportation 828831140 Safe Routes to School Pedestrian Safety Improvements Public Works Capital Traffic & Transportation 829831150 Solar Installation Procurement Environmental Services Capital Wastewater 1006831200 CalRecycle HHW Grant for Refillable Gas Cylinders Environmental Services Special Solid Waste 968831290 Climate Action Plan Implementation Environmental Services Special Gov. & Comm. Engagement 1221831300 Tree Planting and Maintenance within the SNAIL Neighborhood Public Works Capital Parks & Recreation 1156831310 Minimum Wage Enforcement Agreement Office of the City Manager Special Gov. & Comm. Engagement 1222831320 RDA Counsel Fees Office of the City Attorney Capital Gov. & Comm. Engagement 1223831340 Civic Center Modernization Office of the City Manager Infrastructure Administrative Facilities 1272831350 Temporary Planning Staffing Community Development Special Gov. & Comm. Engagement 1224831360 Recreation Fee Waiver Library and Community Services Special Parks & Recreation 1157831380 Fire Department Standards of Response Coverage Study Public Safety Special Public Safety 1066831390 CFD No.3 - Ten Year Infrastructure Improvements Plan Environmental Services Infrastructure Wastewater 1007831400 Make-Her Grant Library and Community Services Special Library 1189831420 Santa Clara Valley Water District Coordination Environmental Services Special Water 944831430 Fair Oaks Park Auxiliary Restroom/Parking Lot Grant Project Public Works Infrastructure Parks & Recreation 1158831450 Public Works Development Engineering Staffing Public Works Special Gov. & Comm. Engagement 1225831460 FY2015 Tobacco-Free Environment Study Public Safety Special Public Safety 1067831470 SCWP Construction Management Environmental Services Infrastructure Wastewater 1008831480 Water Conservation and Drought Response Environmental Services Special Water 945831490 Website Redesign Implementation, Upgrades and Maintenance Office of the City Manager Special Gov. & Comm. Engagement 1226831510 Green Streets for Stormwater Environmental Services Capital Wastewater 1009831520 Preliminary Design of Golf Course Renovations Public Works Infrastructure Parks & Recreation 1159831530 One-Stop Permit Center Renovation Community Development Special Administrative Facilities 1273831540 Landscape Improvements on Caribbean Drive Environmental Services Special Solid Waste 969831550 Adjust Water Utilities In Support of Paving Projects Environmental Services Infrastructure Water 946831560 Calabazas Creek Bridge Pipeline Extension Environmental Services Infrastructure Water 947831570 Park Irrigation & Pump Systems Rehabilitation Public Works Infrastructure Parks & Recreation 1160
747

Project No. Project Name Department Project Category Project Type Page #
City of SunnyvaleNumerical Project Index
Funded and Unfunded Projects by Project Number
831580 ADA Projects and Emergency Concrete Replacement Public Works Infrastructure Traffic & Transportation 830831590 Intelligent Transportation Systems Public Works Capital Traffic & Transportation 831831600 Solar Installations on City Facilities Environmental Services Capital Solid Waste 970831620 Repairs to the WPCP Support Facilities Environmental Services Infrastructure Wastewater 1010831630 Repairs to Solids/Dewatering Facilities Environmental Services Infrastructure Wastewater 1011831640 Library LED Pilot Project Public Works Capital Administrative Facilities 1274831650 ADA Transition Plan Public Works Capital Traffic & Transportation 832831660 DPS Body Worn Cameras Public Safety Special Public Safety 1068831670 Asset Management Program Environmental Services Capital Wastewater 1012831680 Adjust Sewer Utilities In Support of Paving Projects Environmental Services Infrastructure Wastewater 1013831690 Storm System Trash Reduction Programs Environmental Services Special Wastewater 1014831700 Channel 26 Public Access Programming Office of the City Manager Special Gov. & Comm. Engagement 1227831710 Electronic Records Management Information Technology Special Gov. & Comm. Engagement 1228831720 Arts Master Plan Library and Community Services Special Parks & Recreation 1161831730 WPCP Oxidation Pond Levee Rehabilitation Environmental Services Capital Wastewater 1015831740 Crescent Terrace Senior Housing Rehabilitation Community Development Special Housing 915831750 460 Persian Dr.: Loan for New Affordable Apts by MidPen Community Development Special Housing 916831761 Homeless Prevention and Rapid Re-Housing (HPRR) Community Development Special Housing 917831770 Illuminated Street Sign Replacement Project Public Works Infrastructure Traffic & Transportation 833831780 Fire Station 5 Improvements Public Safety Capital Public Safety 1069831790 Multi-family Residential Transportation Demand Mgmt Programs Community Development Special Gov. & Comm. Engagement 1229831830 Lakewood Park Renovation and Enhancement Public Works Infrastructure Parks & Recreation 1162831840 Cathodic Protection SFPUC Turnouts and Transmission Pipeline Environmental Services Infrastructure Water 948831850 Washington Park Renovation and Enhancement Public Works Infrastructure Parks & Recreation 1163831860 John W. Christian Greenbelt Pathway Rehabilitation Public Works Infrastructure Parks & Recreation 1164831870 Preventive Maintenance for Various Bridges Public Works Capital Traffic & Transportation 834831880 Preschool Outdoor Play Area Library and Community Services Capital Parks & Recreation 1165831890 Information Technology -- Risk Assessment Information Technology Special Gov. & Comm. Engagement 1230831900 Emergency Vehicle Traffic Signal Preemption Public Safety Capital Public Safety 1070831910 E. Washington Ave and E. Evelyn Ave Park Design Public Works Capital Parks & Recreation 1166831920 Fair Oaks/Highway 237 Preliminary Park Design Public Works Capital Parks & Recreation 1167831950 Pass It On: An Intergenerational Sewing Project Library and Community Services Special Library 1190
748

Project No. Project Name Department Project Category Project Type Page #
City of SunnyvaleNumerical Project Index
Funded and Unfunded Projects by Project Number
831960 FY2015/16 OTS Selective Traffic Enforcement Program (STEP) Public Safety Special Public Safety 1071831970 FY2015 Jag Byrne Memorial Grant Public Safety Special Public Safety 1072831980 Annual State of the City Library and Community Services Special Gov. & Comm. Engagement 1231831990 Fair Oaks Housing Grant No. 2 and Skatepark Lighting Public Works Infrastructure Parks & Recreation 1168832000 East and West Channel Trail Construction Public Works Capital Traffic & Transportation 835832010 Benner Plaza: HOME Loan for New Affordable Apartments Community Development Special Housing 918832020 ADA Curb Retrofits (CDBG) Public Works Capital CDBG 1095832030 Orchard Gardens Apartments Redevelopment Community Development Special Housing 919832040 Persian Drive Sidewalk Extension (CDBG) Community Development Infrastructure CDBG 1096832060 ITS - Advance Traffic Management System Public Works Capital Traffic & Transportation 836832070 LED Streetlights Conversion Project Public Works Infrastructure Traffic & Transportation 837832080 Stevens Creek Fish Passage Improvement Project Office of the City Manager Special Gov. & Comm. Engagement 1232832090 W Remington Dr and Michaelangelo Dr Intersection Improvement Public Works Capital Traffic & Transportation 838832100 Intersection of Mathilda Avenue and Indio Way Public Works Capital Traffic & Transportation 839832110 Electric Vehicle Charging Stations Environmental Services Special Outside Group Funding 1105832130 Traffic Signal Timing Plans - Mathilda & Sunnyvale-Saratoga Public Works Capital Traffic & Transportation 840832140 Traffic Signal Timing Plans - Wolfe Road Public Works Capital Traffic & Transportation 841832150 Traffic Signal Timing Plans - Homestead Road Public Works Capital Traffic & Transportation 842832160 Eng. Services for Transportation Related Projects/Priorities Public Works Special Traffic & Transportation 843832170 RRFB on Henderson and Lily Avenues Public Works Capital Traffic & Transportation 844832180 Green Bike Lanes at Evelyn Avenue Public Works Capital Traffic & Transportation 845832220 Fire Prevention (Non HazMat) Technology Project Public Safety Special Public Safety 1073832230 Fire Prevention (HazMat) Technology Project Public Safety Special Public Safety 1074832260 Office of Emergency Services Public Safety Special Public Safety 1075832270 Permitting System Replacement Information Technology Special Gov. & Comm. Engagement 1233832280 Maintenance for City-owned Property at 1484 Kifer Road Public Works Special Administrative Facilities 1275832290 Safe Routes to School Program Public Safety Special Public Safety 1076832300 State 9-1-1 System Residual Funds Public Safety Special Public Safety 1077832310 Silicon Valley Talent Partnership Office of the City Manager Special Gov. & Comm. Engagement 1234832320 Implementation of Green Bike Lanes Public Works Capital Traffic & Transportation 846832330 Grade Separation Caltrain Crossings at Mary Ave. Study Issue Public Works Capital Traffic & Transportation 847832340 Vision Zero Plan - Study Issue Public Works Capital Traffic & Transportation 848
749

Project No. Project Name Department Project Category Project Type Page #
City of SunnyvaleNumerical Project Index
Funded and Unfunded Projects by Project Number
832350 Murphy Avenue Design Guidelines Comprehensive Update Community Development Special Downtown 899832360 Sustainability Speaker Series Environmental Services Special Gov. & Comm. Engagement 1235832380 Iizuka Sister City Engagement Funding Library and Community Services Outside Group Funding Gov. & Comm. Engagement 1236832390 FY 2016/17 OTS Step Grant PT 17128 Public Safety Special Public Safety 1078832400 Silicon Valley Healthy Aging Partnership Library and Community Services Special Parks & Recreation 1169832410 Stoney Pine Villa Apartments - Rehab Community Development Special Housing 920832430 Recycled and Potable Water Plan Development Environmental Services Infrastructure Wastewater 1016832440 Mary Avenue Overcrossing Environmental Impact Report Public Works Capital Traffic & Transportation 849832450 ATMS Upgrades - Data Collection and Display Enhancements Public Works Capital Traffic & Transportation 850832460 FY 2016/17 Police Services Special Project (SLES) Public Safety Special Public Safety 1079832470 Raynor Park Trash Enclosure and Maintenance Building Public Works Infrastructure Parks & Recreation 1170832480 FY 2016/17 BSCC City Law Enforcement Grant Public Safety Special Public Safety 1080832490 Sunnyvale Library Bike Mobile Project Library and Community Services Special Library 1191832500 Improvements at Mathilda and Maude - City Share Public Works Infrastructure Traffic & Transportation 851832510 Traffic Signals Timing Plan - Fremont Avenue Public Works Capital Traffic & Transportation 852832520 Traffic Signals Timing Plan - Hollenbeck Avenue Public Works Capital Traffic & Transportation 853832530 Traffic Signals Timing Plan - Mary Avenue Public Works Capital Traffic & Transportation 854832540 Traffic Signals Timing Plan - Remington Drive Public Works Capital Traffic & Transportation 855832550 Sale of City Property - 1050 & 1060 Innovation Wy (Onizuka) Public Works Special Administrative Facilities 1276832560 Sale of City Property - 1484 Kifer Road (Unilever) Public Works Special Administrative Facilities 1277832580 City Hall Annex Basement Security/Storage Finance Infrastructure Administrative Facilities 1278832590 Installation of Charging Stations for Electric Vehicles Public Works Capital Administrative Facilities 1279832600 Library LED Lighting Conversion Library and Community Services Capital Administrative Facilities 1280832610 Fire Stations Exterior Window Upgrades Public Works Capital Administrative Facilities 1281832620 Pilot Grant Writer at CNC Library and Community Services Special Gov. & Comm. Engagement 1237832630 Administrative Hearing Officer Finance Special Gov. & Comm. Engagement 1238832640 CAP and Green Building Updates Community Development Special Gov. & Comm. Engagement 1239832650 Peery Park Housing Study Community Development Special Gov. & Comm. Engagement 1240832660 Economic Development Strategy Office of the City Manager Special Gov. & Comm. Engagement 1241832670 Charter Assessment Office of the City Manager Special Gov. & Comm. Engagement 1242832680 Library Plumbing Study Public Works Capital Library 1192832690 Library Restroom Renovation Library and Community Services Capital Library 1193
750

Project No. Project Name Department Project Category Project Type Page #
City of SunnyvaleNumerical Project Index
Funded and Unfunded Projects by Project Number
832700 Library Program Space Public Works Capital Outside Group Funding 1106832710 Synthetic Turf Sports Field Public Works Capital Parks & Recreation 1171832720 Washington Pool Infrastructure Replacement and Renovation Public Works Infrastructure Parks & Recreation 1172832730 Renovate Median Landscaping to Low Maintenance Public Works Infrastructure Parks & Recreation 1173832740 Upgrade Park Pathway Lighting to LED Public Works Infrastructure Parks & Recreation 1174832750 City Maintained Tree Inventory Study Public Works Special Parks & Recreation 1175832760 Serra Park Spray Pool Renovation Public Works Infrastructure Parks & Recreation 1176832770 De Anza Park Pathway Renovation Public Works Infrastructure Parks & Recreation 1177832780 All Inclusive Playground Public Works Infrastructure Parks & Recreation 1178832790 Baylands Park Condition Assessment Study Public Works Special Parks & Recreation 1179832800 Performing Arts Center Infrastructure Public Works Infrastructure Parks & Recreation 1180832810 Park Design Standards for Construction Public Works Special Parks & Recreation 1181832820 West Hill Renovation Park Project Public Works Capital Parks & Recreation 1182832830 Fire Station 2 Training Trailer Maintenance Public Safety Special Public Safety 1081832840 DPS Alarm Permitting, Billing and Tracking Software Public Safety Special Public Safety 1082832850 Public Safety Headquarters - Security Upgrades Public Safety Capital Public Safety 1083832860 FY 2017/18 DPS Internal Affairs Assessment Public Safety Special Public Safety 1084832870 Fire Station Master Plan Public Works Capital Public Safety 1085832880 Bicycle Master Plan Update Public Works Capital Traffic & Transportation 856832890 Traffic Signal Specifications and Standard Details Public Works Capital Traffic & Transportation 857832900 Safe Routes to School and Pedestian Safety Opportunity Plan Public Works Capital Traffic & Transportation 858832910 Bernardo Avenue Bicycle Undercrossing Environmental Analysis Public Works Capital Traffic & Transportation 859832920 East Sunnyvale Area Transportation Improvements Public Works Capital Traffic & Transportation 860832930 Fair Oaks Avenue Bike Lanes and Streetscape - Phase 2 Public Works Capital Traffic & Transportation 861832940 Fremont Avenue Bikeway and Streetscape Improvements Public Works Capital Traffic & Transportation 862832950 Java Drive Road Diet and Bike Lanes Public Works Capital Traffic & Transportation 863832960 Lawrence Station Area Sidewalks and Bicyle Facilities Public Works Capital Traffic & Transportation 864832970 Peery Park Area Transportation Improvements Public Works Capital Traffic & Transportation 865832980 Sunnyvale Roadway Pavement Rehabilitation Public Works Capital Traffic & Transportation 866832990 Sunnyvale Traffic Signal Upgrades Public Works Capital Traffic & Transportation 867833000 Sunnyvale SNAIL Neighborhood Improvements - ATP Public Works Capital Traffic & Transportation 868833010 Bicycle and Pedestian Safety Improvements Public Works Capital Traffic & Transportation 869
751

Project No. Project Name Department Project Category Project Type Page #
City of SunnyvaleNumerical Project Index
Funded and Unfunded Projects by Project Number
833020 Future Traffic Signal Construction (TIF) Public Works Capital Traffic & Transportation 870833030 Pavement Standards Public Works Infrastructure Traffic & Transportation 871833040 Landfill South Hill Drainage Correction Environmental Services Infrastructure Solid Waste 971833050 Wastewater Master Plan Update Environmental Services Infrastructure Wastewater 1017833060 Annual Digester Cleaning Environmental Services Special Wastewater 1018833070 WPCP Electronic Operations & Maintenance Manual Environmental Services Capital Wastewater 1019833080 WPCP Waste Gas Burner Replacement Environmental Services Infrastructure Wastewater 1020833090 Sanitary and Storm System Hydraulic Model Update Environmental Services Capital Wastewater 1021833100 SCWP Capital Replacement Environmental Services Infrastructure Wastewater 1022833110 SCWP Oversight Environmental Services Infrastructure Wastewater 1023833120 SCWP Environmental Mitigation Environmental Services Infrastructure Wastewater 1024833130 SCWP Rehabilitation Primary Effluent Pipeline Environmental Services Infrastructure Wastewater 1025833140 SCWP Rehabilitation Influent Pipelines to WPCP Environmental Services Infrastructure Wastewater 1026833150 SCWP Existing Plant Rehabilitation - Split Flow Environmental Services Infrastructure Wastewater 1027833160 SCWP Caribbean Drive Parking and Trail Access Enhancements Environmental Services Infrastructure Wastewater 1028833210 SCWP Secondary Treatment Improvements-Split Flow CAS Stage 1 Environmental Services Infrastructure Wastewater 1029833220 SCWP Digester Supernatant PS and Drainage Piping Upgrades Environmental Services Infrastructure Wastewater 1030833230 SCWP Thickening and Dewatering Facility - Stage 1 Environmental Services Infrastructure Wastewater 1031833240 SCWP Administration and Lab Building Environmental Services Infrastructure Wastewater 1032833250 SCWP Maintenance Building Environmental Services Infrastructure Wastewater 1033833260 SCWP Recycle Water Improvements (New Recycled Water PS) Environmental Services Infrastructure Wastewater 1034833270 SCWP Community Improvements Environmental Services Infrastructure Wastewater 1035833280 SCWP Miscellaneous Civil Site/Support Utility Improvements Environmental Services Infrastructure Wastewater 1036833330 SCWP Filter Control Building (Includes Demo of Existing) Environmental Services Infrastructure Wastewater 1037833340 SCWP Chloramine Disinfection Environmental Services Infrastructure Wastewater 1038833350 SCWP Digester No. 5 Environmental Services Infrastructure Wastewater 1039833360 SCWP FOG/Food Waste Facility Environmental Services Infrastructure Wastewater 1040833370 SCWP Cogeneration Upgrade Environmental Services Infrastructure Wastewater 1041833420 SCWP Secondary Treatment Improvements - Split Flow CAS Stg 2 Environmental Services Infrastructure Wastewater 1042833430 SCWP Primary Effluent Diurnal EQ and Emergency Storage Environmental Services Infrastructure Wastewater 1043833440 SCWP Filter Backwash Storage Environmental Services Infrastructure Wastewater 1044833450 SCWP Thickening and Dewatering Facility - Stage 2 Environmental Services Infrastructure Wastewater 1045
752

Project No. Project Name Department Project Category Project Type Page #
City of SunnyvaleNumerical Project Index
Funded and Unfunded Projects by Project Number
833460 SCWP Demolition Fixed Growth Reactor (FGR) Pump Station Environmental Services Infrastructure Wastewater 1046833510 SCWP UV Disinfection Environmental Services Infrastructure Wastewater 1047833520 SCWP Demolition Fixed Growth Reactors (FGRs) Environmental Services Infrastructure Wastewater 1048833600 Block 15 - Affordable Housing Site Community Development Special Downtown 900833610 Downtown Pedestrian Traffic Signal Systems Public Works Capital Downtown 901833620 Evaluation of New Revenue Strategies Finance Special Gov. & Comm. Engagement 1243833630 Emergency Operations Center Design Public Works Capital Administrative Facilities 1282833640 2017 Housing Strategy Community Development Special Housing 921833650 Downtown Development Policies for Parking Community Development Special Gov. & Comm. Engagement 1244833660 Develop Wage Theft Enforcement Program Office of the City Manager Special Gov. & Comm. Engagement 1245833680 Climate Action Plan (CAP) 2.0 Initative-Planning Beyond 2020 Environmental Services Special Administrative Facilities 1283833690 Parkland/Open Space Initiative Office of the City Manager Special Gov. & Comm. Engagement 1246833700 Lawrence Station Area Plan - Housing and Sense of Place Community Development Special Housing 922Total Number of Funded Projects: 396
753

Project No. Project Name Department Project Category Project Type Page #
City of SunnyvaleNumerical Project Index
Funded and Unfunded Projects by Project Number
Unfunded Projects802500 City Share of Development Costs - Streets Public Works Capital Traffic & Transportation 873815901 Lawrence Expressway and Wildwood Ave. Realignment Public Works Capital Traffic & Transportation 874818651 Corporation Yard Buildings - Roofs Public Works Infrastructure Administrative Facilities 1285823911 Bernardo Avenue Caltrain Undercrossing Public Works Capital Traffic & Transportation 875825560 Security Access Control System Replacement Public Works Infrastructure Administrative Facilities 1286826570 Tasman/Fair Oaks Area Streetscape and Sense of Place Public Works Capital Traffic & Transportation 876826940 Mary Avenue Transmission Main PRV Environmental Services Infrastructure Water 949829260 Mary Avenue Extension Public Works Capital Traffic & Transportation 877830640 Stevens Creek Trail Public Works Capital Traffic & Transportation 878900141 Future Traffic Calming Projects Public Works Capital Traffic & Transportation 879900290 Streetscape Improvements For Downtown Block 18 Completion Community Development Capital Downtown 903900316 Corporation Yard Facility Replacement Public Works Capital Administrative Facilities 1287900469 El Camino Real Gateway Program Community Development Capital Traffic & Transportation 880900692 Calabazas Creek Trail Low Water Crossings Public Works Capital Traffic & Transportation 881900807 Recycled Water Tank and Pumping Facilities Environmental Services Capital Water 950900894 Recycled Water Inter-Connect Moffett Field/Mountain View Environmental Services Capital Water 951900929 Light Emitting Diode (LED) Streetlight Retrofit Phase II Public Works Infrastructure Traffic & Transportation 882900931 Charles Street Bicycle Boulevard Public Works Capital Traffic & Transportation 883900933 Fair Oaks Junction Sense of Place Improvements Public Works Capital Traffic & Transportation 884900934 Java Drive/Fair Oaks Avenue Bike Lanes Public Works Capital Traffic & Transportation 885901094 Green Infrastructure Planning for Stormwater Environmental Services Infrastructure Wastewater 1049901103 Personal Electronic Tools for Work Order System Public Works Capital Gov. & Comm. Engagement 1247901195 Traffic Signals Replacement Public Works Capital Traffic & Transportation 886901205 Peery Park Specific Plan Wastewater Capacity Improvements Environmental Services Outside Group Funding Wastewater 1050901206 Peery Park Sense of Place Public Works Capital Traffic & Transportation 887901278 Wolfe Road Corridor Traffic Improvement Study Public Works Special Traffic & Transportation 888Total Number of Unfunded Projects: 26
754

Alphabetical Project Index

Project Name Project No. Department Project Category Project Type Page #Funded Projects2017 Housing Strategy 833640 Community Development Special Housing 921239 - 241 Commercial Street Property Maintenance 825570 Public Works Special Administrative Facilities 1264460 Persian Dr.: Loan for New Affordable Apts by MidPen 831750 Community Development Special Housing 916ADA Curb Retrofits (CDBG) 832020 Public Works Capital CDBG 1095ADA Projects and Emergency Concrete Replacement 831580 Public Works Infrastructure Traffic & Transportation 830ADA Transition Plan 831650 Public Works Capital Traffic & Transportation 832Adjust Sewer Utilities In Support of Paving Projects 831680 Environmental Services Infrastructure Wastewater 1013Adjust Water Utilities In Support of Paving Projects 831550 Environmental Services Infrastructure Water 946Administrative Hearing Officer 832630 Finance Special Gov. & Comm. Engagement 1238Aerial Mapping and Settlement Analysis of the SV Landfill 827560 Environmental Services Special Solid Waste 964Air Flotation Tanks Rehabilitation 825141 Environmental Services Infrastructure Wastewater 985All Inclusive Playground 832780 Public Works Infrastructure Parks & Recreation 1178Annual Digester Cleaning 833060 Environmental Services Special Wastewater 1018Annual Slurry Seal of City Streets 828030 Public Works Infrastructure Traffic & Transportation 818Annual State of the City 831980 Library and Community Services Special Gov. & Comm. Engagement 1231Arts Master Plan 831720 Library and Community Services Special Parks & Recreation 1161Asset Management Program 831670 Environmental Services Capital Wastewater 1012ATMS Upgrades - Data Collection and Display Enhancements 832450 Public Works Capital Traffic & Transportation 850Automation of Water Meter Reading 827180 Finance Infrastructure Water 939Battery Backup System for Traffic Signals Maintenance 825740 Public Works Infrastructure Traffic & Transportation 814Baylands Park Condition Assessment Study 832790 Public Works Special Parks & Recreation 1179Benner Plaza: HOME Loan for New Affordable Apartments 832010 Community Development Special Housing 918Bernardo Avenue Bicycle Undercrossing Environmental Analysis 832910 Public Works Capital Traffic & Transportation 859Bicycle and Pedestian Safety Improvements 833010 Public Works Capital Traffic & Transportation 869Bicycle Map Revision 825070 Public Works Special Traffic & Transportation 808Bicycle Master Plan Update 832880 Public Works Capital Traffic & Transportation 856Block 15 - Affordable Housing Site 833600 Community Development Special Downtown 900BMR Compliance Enforcement 823750 Community Development Special Housing 909Braly Park Renovation and Enhancement 830290 Public Works Infrastructure Parks & Recreation 1136Calabazas Creek Bridge at Old Mt. View-Alviso Rd 826850 Public Works Infrastructure Traffic & Transportation 816Calabazas Creek Bridge Pipeline Extension 831560 Environmental Services Infrastructure Water 947
City of SunnyvaleAlphabetical Project Index
Funded and Unfunded Projects by Project Name
755

Project Name Project No. Department Project Category Project Type Page #
City of SunnyvaleAlphabetical Project Index
Funded and Unfunded Projects by Project Name
California Environmental Reporting System (CERS) Grant 829310 Public Safety Special Public Safety 1063CalRecycle HHW Grant for Refillable Gas Cylinders 831200 Environmental Services Special Solid Waste 968Cannery Park Renovation and Enhancement 830300 Public Works Infrastructure Parks & Recreation 1137CAP and Green Building Updates 832640 Community Development Special Gov. & Comm. Engagement 1239Capital Improvement Program Management System 830530 Public Works Special Gov. & Comm. Engagement 1214Cathodic Protection SFPUC Turnouts and Transmission Pipeline 831840 Environmental Services Infrastructure Water 948CDBG Housing Rehabilitation Revolving Loan Fund 803501 Community Development Special CDBG 1091Central Well Reconstruction 825221 Environmental Services Infrastructure Water 932CFD No.3 - Ten Year Infrastructure Improvements Plan 831390 Environmental Services Infrastructure Wastewater 1007Channel 26 Public Access Programming 831700 Office of the City Manager Special Gov. & Comm. Engagement 1227Charter Assessment 832670 Office of the City Manager Special Gov. & Comm. Engagement 1242City Hall Annex Basement Security/Storage 832580 Finance Infrastructure Administrative Facilities 1278City Maintained Tree Inventory Study 832750 Public Works Special Parks & Recreation 1175City-wide Aerial Photos 804201 Information Technology Special Gov. & Comm. Engagement 1201City-wide Water Line Replacement 825451 Environmental Services Infrastructure Water 937Civic Center Modernization 831340 Office of the City Manager Infrastructure Administrative Facilities 1272Cleaning of Water Tanks 825231 Environmental Services Infrastructure Water 933Climate Action Plan (CAP) 2.0 Initative-Planning Beyond 2020 833680 Environmental Services Special Administrative Facilities 1283Climate Action Plan Implementation 831290 Environmental Services Special Gov. & Comm. Engagement 1221Community Center Comprehensive Infrastructure 829190 Public Works Infrastructure Parks & Recreation 1133Community Center Grounds Renovation and Enhancement 830310 Public Works Infrastructure Parks & Recreation 1138Community Choice Aggregation Program 830990 Environmental Services Special Gov. & Comm. Engagement 1219Community Choice Energy Phase I 830991 Environmental Services Special Gov. & Comm. Engagement 1220Comprehensive School Traffic Study 829690 Public Works Special Gov. & Comm. Engagement 1209Comprehensive Update of the Precise Plan for El Camino Real 830980 Community Development Special Gov. & Comm. Engagement 1218Computer/Radio Controlled Landscape Median Irrigation 820140 Public Works Infrastructure Parks & Recreation 1116Contribution to SMaRT Station Operations Contract RFP 821181 Environmental Services Special Solid Waste 960Corporation Yard Buildings - HVAC Replacement 820000 Public Works Infrastructure Administrative Facilities 1258Corporation Yard Buildings - Rehabilitation 818700 Public Works Infrastructure Administrative Facilities 1256Corporation Yard Site Feasibility and Modernization Plan 830590 Public Works Capital Administrative Facilities 1271Council Set Aside 829630 Finance Special Gov. & Comm. Engagement 1207County-Wide Homeless Count 826530 Community Development Special Housing 911
756

Project Name Project No. Department Project Category Project Type Page #
City of SunnyvaleAlphabetical Project Index
Funded and Unfunded Projects by Project Name
Crescent Terrace Senior Housing Rehabilitation 831740 Community Development Special Housing 915De Anza Park Pathway Renovation 832770 Public Works Infrastructure Parks & Recreation 1177De Anza Park Renovation and Enhancement 830320 Public Works Infrastructure Parks & Recreation 1139Develop Wage Theft Enforcement Program 833660 Office of the City Manager Special Gov. & Comm. Engagement 1245Dispute Resolution Services 830630 Community Development Outside Group Funding Outside Group Funding 1104Downtown Association 829620 Office of the City Manager Special Outside Group Funding 1103Downtown Development Policies for Parking 833650 Community Development Special Gov. & Comm. Engagement 1244Downtown Parking District Major Maintenance 827570 Public Works Infrastructure Downtown 898Downtown Pedestrian Traffic Signal Systems 833610 Public Works Capital Downtown 901Downtown Wayfinding and Gateways 826800 Public Works Capital Downtown 895DPS Alarm Permitting, Billing and Tracking Software 832840 Public Safety Special Public Safety 1082DPS Body Worn Cameras 831660 Public Safety Special Public Safety 1068E. Washington Ave and E. Evelyn Ave Park Design 831910 Public Works Capital Parks & Recreation 1166East and West Channel Trail Construction 832000 Public Works Capital Traffic & Transportation 835East Sunnyvale Area Transportation Improvements 832920 Public Works Capital Traffic & Transportation 860Economic Development Strategy 832660 Office of the City Manager Special Gov. & Comm. Engagement 1241Electric Vehicle Charging Stations 832110 Environmental Services Special Outside Group Funding 1105Electronic Records Management 831710 Information Technology Special Gov. & Comm. Engagement 1228Emergency Flow Management Infrastructure 827020 Environmental Services Infrastructure Wastewater 991Emergency Generator Installation 830580 Public Works Infrastructure Administrative Facilities 1270Emergency Medical Dispatch First Responder Incentive Funding 829510 Public Safety Special Public Safety 1064Emergency Operations Center Design 833630 Public Works Capital Administrative Facilities 1282Emergency Vehicle Traffic Signal Preemption 831900 Public Safety Capital Public Safety 1070EMS Patient Care Data System 830660 Public Safety Special Public Safety 1065Encinal Park Renovation and Enhancement 830330 Public Works Infrastructure Parks & Recreation 1140Eng. Services for Transportation Related Projects/Priorities 832160 Public Works Special Traffic & Transportation 843ERP System Acquisition, Implementation and Support 830520 Finance Special Gov. & Comm. Engagement 1213Evaluation of New Revenue Strategies 833620 Finance Special Gov. & Comm. Engagement 1243Fair Oaks Ave Bike Lanes and Streetscape 831110 Public Works Capital Traffic & Transportation 827Fair Oaks Avenue Bike Lanes and Streetscape - Phase 2 832930 Public Works Capital Traffic & Transportation 861Fair Oaks Avenue Overhead Bridge Repair 825610 Public Works Capital Traffic & Transportation 812Fair Oaks Housing Grant No. 2 and Skatepark Lighting 831990 Public Works Infrastructure Parks & Recreation 1168
757

Project Name Project No. Department Project Category Project Type Page #
City of SunnyvaleAlphabetical Project Index
Funded and Unfunded Projects by Project Name
Fair Oaks Park Auxiliary Restroom/Parking Lot Grant Project 831430 Public Works Infrastructure Parks & Recreation 1158Fair Oaks Park Renovation and Enhancement 830340 Public Works Infrastructure Parks & Recreation 1141Fair Oaks/Highway 237 Preliminary Park Design 831920 Public Works Capital Parks & Recreation 1167Fairwood Park Renovation and Enhancement 830350 Public Works Infrastructure Parks & Recreation 1142Fire Department Standards of Response Coverage Study 831380 Public Safety Special Public Safety 1066Fire Prevention (HazMat) Technology Project 832230 Public Safety Special Public Safety 1074Fire Prevention (Non HazMat) Technology Project 832220 Public Safety Special Public Safety 1073Fire Prevention Construction-Related Permitting (Fund 510) 829751 Public Safety Special Gov. & Comm. Engagement 1210Fire Station 2 Training Trailer Maintenance 832830 Public Safety Special Public Safety 1081Fire Station 5 Improvements 831780 Public Safety Capital Public Safety 1069Fire Station Electrical Systems and Roll Up Door Replacement 829140 Public Works Capital Administrative Facilities 1266Fire Station Master Plan 832870 Public Works Capital Public Safety 1085Fire Stations Exterior Window Upgrades 832610 Public Works Capital Administrative Facilities 1281Fire Training Tower Structural Inspection 830570 Public Works Special Administrative Facilities 1269First-Time Homebuyer Loans 828100 Community Development Special Housing 912Fremont Avenue Bikeway and Streetscape Improvements 832940 Public Works Capital Traffic & Transportation 862Fremont Pool House Infrastructure Improvements 830560 Public Works Infrastructure Administrative Facilities 1268Fremont Pool Infrastructure Improvements 830490 Public Works Infrastructure Administrative Facilities 1267Future Traffic Signal Construction 816000 Public Works Capital Traffic & Transportation 802Future Traffic Signal Construction (TIF) 833020 Public Works Capital Traffic & Transportation 870FY 14-15 Recruitment and Training for Sworn Officers 826300 Public Safety Special Public Safety 1056FY 15-16 Recruitment and Training for Sworn Officers 826320 Public Safety Special Public Safety 1057FY 16-17 Recruitment and Training for Sworn Officers 826330 Public Safety Special Public Safety 1058FY 17-18 Recruitment and Training for Sworn Officers 826340 Public Safety Special Public Safety 1059FY 18-19 Recruitment and Training for Sworn Officers 826350 Public Safety Special Public Safety 1060FY 19-37 Recruitment and Training for Sworn Officers 826351 Public Safety Special Public Safety 1061FY 2016/17 BSCC City Law Enforcement Grant 832480 Public Safety Special Public Safety 1080FY 2016/17 OTS Step Grant PT 17128 832390 Public Safety Special Public Safety 1078FY 2016/17 Police Services Special Project (SLES) 832460 Public Safety Special Public Safety 1079FY 2017/18 DPS Internal Affairs Assessment 832860 Public Safety Special Public Safety 1084FY2015 Jag Byrne Memorial Grant 831970 Public Safety Special Public Safety 1072FY2015 Tobacco-Free Environment Study 831460 Public Safety Special Public Safety 1067
758

Project Name Project No. Department Project Category Project Type Page #
City of SunnyvaleAlphabetical Project Index
Funded and Unfunded Projects by Project Name
FY2015/16 OTS Selective Traffic Enforcement Program (STEP) 831960 Public Safety Special Public Safety 1071General Plan Updates 825700 Community Development Special Gov. & Comm. Engagement 1205Golf Buildings Renovations 828400 Public Works Infrastructure Parks & Recreation 1128Golf Course Greens Renewal 825660 Public Works Infrastructure Parks & Recreation 1122Golf Course Irrigation System Replacement 820311 Public Works Infrastructure Parks & Recreation 1120Golf Course Tee Grounds Renewal 820361 Public Works Infrastructure Parks & Recreation 1121Golf Course Tree Trimming and Removal 829160 Public Works Special Parks & Recreation 1131Golf Courses Protective Netting Replacement 804401 Public Works Infrastructure Parks & Recreation 1113Grade Separation Caltrain Crossings at Mary Ave. Study Issue 832330 Public Works Capital Traffic & Transportation 847Green Bike Lanes at Evelyn Avenue 832180 Public Works Capital Traffic & Transportation 845Green Streets for Stormwater 831510 Environmental Services Capital Wastewater 1009Greenwood Manor Park Renovation 830360 Public Works Infrastructure Parks & Recreation 1143Home Access, Paint, Emergency Repair, and Energy-Efficiency 812701 Community Development Special CDBG 1092Homeless Prevention and Rapid Re-Housing (HPRR) 831761 Community Development Special Housing 917Iizuka Sister City Engagement Funding 832380 Library and Community Services Outside Group Funding Gov. & Comm. Engagement 1236Illuminated Street Sign Replacement Project 831770 Public Works Infrastructure Traffic & Transportation 833Implementation of Green Bike Lanes 832320 Public Works Capital Traffic & Transportation 846Improvements at Mathilda and Maude - City Share 832500 Public Works Infrastructure Traffic & Transportation 851Information Technology -- Risk Assessment 831890 Information Technology Special Gov. & Comm. Engagement 1230Inspection Data Mgmt and Handheld Data Entry Device Project 828210 Environmental Services Capital Wastewater 993Installation of Charging Stations for Electric Vehicles 832590 Public Works Capital Administrative Facilities 1279Intelligent Transportation Systems 831590 Public Works Capital Traffic & Transportation 831Intersection of Mathilda Avenue and Indio Way 832100 Public Works Capital Traffic & Transportation 839ITS - Advance Traffic Management System 832060 Public Works Capital Traffic & Transportation 836Java Drive Road Diet and Bike Lanes 832950 Public Works Capital Traffic & Transportation 863John W. Christian Greenbelt Pathway Rehabilitation 831860 Public Works Infrastructure Parks & Recreation 1164Laboratory Information Management System (LIMS) 830230 Environmental Services Capital Wastewater 1002Lakewood Branch Library Facility 830600 Public Works Capital Library 1188Lakewood Park Renovation and Enhancement 831830 Public Works Infrastructure Parks & Recreation 1162Land Acquisition Due Diligence 829440 Public Works Infrastructure Parks & Recreation 1134Land Development and Capital Construction 806351 Environmental Services Capital Water 927Landfill "Constituents of Concern" Monitoring 824741 Environmental Services Special Solid Waste 962
759

Project Name Project No. Department Project Category Project Type Page #
City of SunnyvaleAlphabetical Project Index
Funded and Unfunded Projects by Project Name
Landfill Gas Flare and Blowers Replacement 825911 Environmental Services Infrastructure Solid Waste 963Landfill Post-Closure Erosion Prevention 830180 Environmental Services Infrastructure Solid Waste 966Landfill South Hill Drainage Correction 833040 Environmental Services Infrastructure Solid Waste 971Landscape Improvements on Caribbean Drive 831540 Environmental Services Special Solid Waste 969Las Palmas Park Renovation and Enhancement 830380 Public Works Infrastructure Parks & Recreation 1144Lawrence Expressway Sanitary Sewer Rehabilitation 829070 Environmental Services Infrastructure Wastewater 994Lawrence Station Area Plan - Housing and Sense of Place 833700 Community Development Special Housing 922Lawrence Station Area Plan - Phase II 829670 Community Development Special Gov. & Comm. Engagement 1208Lawrence Station Area Sidewalks and Bicyle Facilities 832960 Public Works Capital Traffic & Transportation 864Leadership Sunnyvale [GF] 803700 Office of the City Manager Outside Group Funding Outside Group Funding 1101Leak Detection and Condition Assessment Program 824281 Environmental Services Special Water 930LED Streetlights Conversion Project 832070 Public Works Infrastructure Traffic & Transportation 837Library Foundation Program Grant 805150 Library and Community Services Special Library 1187Library LED Lighting Conversion 832600 Library and Community Services Capital Administrative Facilities 1280Library LED Pilot Project 831640 Public Works Capital Administrative Facilities 1274Library Plumbing Study 832680 Public Works Capital Library 1192Library Program Space 832700 Public Works Capital Outside Group Funding 1106Library Restroom Renovation 832690 Library and Community Services Capital Library 1193Maintain City-Owned Properties - Downtown/388 Charles Street 825930 Public Works Special Administrative Facilities 1265Maintenance for City-owned Property at 1484 Kifer Road 832280 Public Works Special Administrative Facilities 1275Maintenance of City Owned Properties - Downtown 821010 Public Works Special Administrative Facilities 1261Make-Her Grant 831400 Library and Community Services Special Library 1189Mary Avenue Bicycle Lanes 830760 Public Works Capital Traffic & Transportation 824Mary Avenue Overcrossing Environmental Impact Report 832440 Public Works Capital Traffic & Transportation 849Mary/Carson Water Plant Upgrade 825251 Environmental Services Infrastructure Water 934Mathilda Avenue/Maude Avenue Safety Improvements 829910 Public Works Infrastructure Traffic & Transportation 821Mathilda/237/101 Interchange Improvements 826890 Public Works Capital Traffic & Transportation 817Maude Ave Streetscape 831120 Public Works Capital Traffic & Transportation 828Minimum Wage Enforcement Agreement 831310 Office of the City Manager Special Gov. & Comm. Engagement 1222Minor Building Modifications 820570 Public Works Capital Administrative Facilities 1260Minor Repair of City Bridges and Culverts 816050 Public Works Infrastructure Traffic & Transportation 803Morse Court Rental Rehabilitation (HMF) 830920 Community Development Special Housing 914
760

Project Name Project No. Department Project Category Project Type Page #
City of SunnyvaleAlphabetical Project Index
Funded and Unfunded Projects by Project Name
Multi-family Residential Transportation Demand Mgmt Programs 831790 Community Development Special Gov. & Comm. Engagement 1229Murphy Avenue Design Guidelines Comprehensive Update 832350 Community Development Special Downtown 899Murphy Park Renovation and Enhancement 830390 Public Works Infrastructure Parks & Recreation 1145Office of Emergency Services 832260 Public Safety Special Public Safety 1075One-Stop Permit Center Renovation 831530 Community Development Special Administrative Facilities 1273Onizuka Site Transition Plan 830040 Community Development Capital Gov. & Comm. Engagement 1212Orchard Gardens Apartments Redevelopment 832030 Community Development Special Housing 919Orchard Gardens Park Renovation and Enhancement 830400 Public Works Infrastructure Parks & Recreation 1146Orchard Heritage Park 830480 Public Works Infrastructure Parks & Recreation 1154Ortega Park Renovation and Enhancement 830410 Public Works Infrastructure Parks & Recreation 1147Outside Group Funding Support [CDBG] 827550 Community Development Outside Group Funding CDBG 1093Outside Group Funding Support [GF] 819720 Community Development Outside Group Funding Outside Group Funding 1102Panama Park Renovation and Enhancement 830420 Public Works Infrastructure Parks & Recreation 1148Park Buildings - Rehabilitation 818550 Public Works Infrastructure Parks & Recreation 1114Park Design Standards for Construction 832810 Public Works Special Parks & Recreation 1181Park Furniture and Fixtures Replacement 820280 Public Works Infrastructure Parks & Recreation 1119Park Irrigation & Pump Systems Rehabilitation 831570 Public Works Infrastructure Parks & Recreation 1160Park Tennis/Basketball Court Reconstruction 820240 Public Works Infrastructure Parks & Recreation 1117Parkland/Open Space Initiative 833690 Office of the City Manager Special Gov. & Comm. Engagement 1246Parks Parking Lot Rehabilitation 828290 Public Works Infrastructure Parks & Recreation 1126Participate in NLC's Youth, Education and Family Council 830960 Library and Community Services Special Gov. & Comm. Engagement 1217Pass It On: An Intergenerational Sewing Project 831950 Library and Community Services Special Library 1190Pavement Rehabilitation 825290 Public Works Infrastructure Traffic & Transportation 809Pavement Standards 833030 Public Works Infrastructure Traffic & Transportation 871Pay Parking in Downtown Area 830120 Public Works Capital Traffic & Transportation 823Pedestrian Lighted Crosswalk Maintenance and Replacement 825730 Public Works Infrastructure Traffic & Transportation 813Peery Park Area Transportation Improvements 832970 Public Works Capital Traffic & Transportation 865Peery Park Housing Study 832650 Community Development Special Gov. & Comm. Engagement 1240Peery Park Specific Plan and Environmental Impact Report 829810 Community Development Special Gov. & Comm. Engagement 1211Performing Arts Center Infrastructure 832800 Public Works Infrastructure Parks & Recreation 1180Permitting System Replacement 832270 Information Technology Special Gov. & Comm. Engagement 1233Persian Drive Sidewalk Extension (CDBG) 832040 Community Development Infrastructure CDBG 1096
761

Project Name Project No. Department Project Category Project Type Page #
City of SunnyvaleAlphabetical Project Index
Funded and Unfunded Projects by Project Name
Pilot Grant Writer at CNC 832620 Library and Community Services Special Gov. & Comm. Engagement 1237Playground Equipment Replacement 820270 Public Works Infrastructure Parks & Recreation 1118Plaza del Sol Phase II 830510 Public Works Capital Parks & Recreation 1155Police Services Equipment - Cell Phones 828150 Public Safety Capital Public Safety 1062Police Services Equipment Acquisition 819840 Public Safety Capital Public Safety 1055Ponderosa Park Renovation and Enhancement 830430 Public Works Infrastructure Parks & Recreation 1149Power Purchase Agreements for Alternative Energy 830620 Environmental Services Special Gov. & Comm. Engagement 1216Pre-Development Costs on Affordable Housing Sites 826520 Community Development Special Housing 910Preliminary Design of Golf Course Renovations 831520 Public Works Infrastructure Parks & Recreation 1159Preschool Outdoor Play Area 831880 Library and Community Services Capital Parks & Recreation 1165Pressure Reducing Valve Replacement 825301 Environmental Services Infrastructure Water 935Preventive Maintenance for Various Bridges 831870 Public Works Capital Traffic & Transportation 834Project Management for Town Center Development Agreement 824571 Office of the City Attorney Special Gov. & Comm. Engagement 1203Public Safety Buildings - HVAC 819610 Public Works Infrastructure Administrative Facilities 1257Public Safety Buildings - Roofs 818100 Public Works Infrastructure Administrative Facilities 1255Public Safety Headquarters - Security Upgrades 832850 Public Safety Capital Public Safety 1083Public Works Development Engineering Staffing 831450 Public Works Special Gov. & Comm. Engagement 1225Raynor Park Renovation and Enhancement 830440 Public Works Infrastructure Parks & Recreation 1150Raynor Park Trash Enclosure and Maintenance Building 832470 Public Works Infrastructure Parks & Recreation 1170RDA Counsel Fees 831320 Office of the City Attorney Capital Gov. & Comm. Engagement 1223Records Imaging and Voting System Upgrade 827700 Office of the City Manager Special Gov. & Comm. Engagement 1206Recreation Fee Waiver 831360 Library and Community Services Special Parks & Recreation 1157Recycled and Potable Water Plan Development 832430 Environmental Services Infrastructure Wastewater 1016Redevelopment Dissolution 814952 Finance Special Gov. & Comm. Engagement 1202Refurbishment of Water Tanks 830170 Environmental Services Infrastructure Water 942Rehabilitation of Cathodic Protection on RW System 829060 Environmental Services Infrastructure Water 940Rehabilitation of Digesters 824301 Environmental Services Infrastructure Wastewater 982Renovate Median Landscaping to Low Maintenance 832730 Public Works Infrastructure Parks & Recreation 1173Repaint Street Light Poles 820120 Public Works Infrastructure Traffic & Transportation 804Repairs to Solids/Dewatering Facilities 831630 Environmental Services Infrastructure Wastewater 1011Repairs to the Power Generation Facility 830210 Environmental Services Infrastructure Wastewater 1000Repairs to the Primary Process 830190 Environmental Services Infrastructure Wastewater 998
762

Project Name Project No. Department Project Category Project Type Page #
City of SunnyvaleAlphabetical Project Index
Funded and Unfunded Projects by Project Name
Repairs to the Secondary Process 830200 Environmental Services Infrastructure Wastewater 999Repairs to the Tertiary Process 830220 Environmental Services Infrastructure Wastewater 1001Repairs to the WPCP Support Facilities 831620 Environmental Services Infrastructure Wastewater 1010Replace Customer Relationship Management System 830540 Office of the City Manager Special Gov. & Comm. Engagement 1215Replace SMaRT Station 828260 Environmental Services Infrastructure Solid Waste 965Replacement of Water/Sewer Supervisory Control System 815203 Environmental Services Infrastructure Water 928Replacement/Repair/Rehabilitation of Sanitary Sewer System 825331 Environmental Services Infrastructure Wastewater 986Replacement/Repair/Rehabilitation of Storm Drain System 825361 Environmental Services Infrastructure Wastewater 987Routine Resurfacing of City Owned Parking Lots 820130 Public Works Infrastructure Administrative Facilities 1259RRFB on Henderson and Lily Avenues 832170 Public Works Capital Traffic & Transportation 844Safe Routes to School and Neighborhood Guided Bike Routes 829370 Public Works Capital Traffic & Transportation 819Safe Routes to School and Pedestian Safety Opportunity Plan 832900 Public Works Capital Traffic & Transportation 858Safe Routes to School Pedestrian Safety Improvements 831140 Public Works Capital Traffic & Transportation 829Safe Routes to School Program 832290 Public Safety Special Public Safety 1076Sale of City Property - 1050 & 1060 Innovation Wy (Onizuka) 832550 Public Works Special Administrative Facilities 1276Sale of City Property - 1484 Kifer Road (Unilever) 832560 Public Works Special Administrative Facilities 1277San Antonio Park Renovation and Enhancement 830450 Public Works Infrastructure Parks & Recreation 1151Sanitary and Storm System Hydraulic Model Update 833090 Environmental Services Capital Wastewater 1021Sanitary Sewer Salinity Reduction Study 830260 Environmental Services Special Wastewater 1005Sanitary Sewer Siphon Cleaning and Assessment 829100 Environmental Services Capital Wastewater 996Santa Clara Valley Water District Coordination 831420 Environmental Services Special Water 944SCVURPPP Contracting and Fiscal Agent 825961 Finance Special Wastewater 990SCWP Administration and Lab Building 833240 Environmental Services Infrastructure Wastewater 1032SCWP Capital Replacement 833100 Environmental Services Infrastructure Wastewater 1022SCWP Caribbean Drive Parking and Trail Access Enhancements 833160 Environmental Services Infrastructure Wastewater 1028SCWP Chloramine Disinfection 833340 Environmental Services Infrastructure Wastewater 1038SCWP Cogeneration Upgrade 833370 Environmental Services Infrastructure Wastewater 1041SCWP Community Improvements 833270 Environmental Services Infrastructure Wastewater 1035SCWP Construction Management 831470 Environmental Services Infrastructure Wastewater 1008SCWP Demolition Fixed Growth Reactor (FGR) Pump Station 833460 Environmental Services Infrastructure Wastewater 1046SCWP Demolition Fixed Growth Reactors (FGRs) 833520 Environmental Services Infrastructure Wastewater 1048SCWP Digester No. 5 833350 Environmental Services Infrastructure Wastewater 1039
763

Project Name Project No. Department Project Category Project Type Page #
City of SunnyvaleAlphabetical Project Index
Funded and Unfunded Projects by Project Name
SCWP Digester Supernatant PS and Drainage Piping Upgrades 833220 Environmental Services Infrastructure Wastewater 1030SCWP Environmental Mitigation 833120 Environmental Services Infrastructure Wastewater 1024SCWP Existing Plant Rehabilitation - Split Flow 833150 Environmental Services Infrastructure Wastewater 1027SCWP Filter Backwash Storage 833440 Environmental Services Infrastructure Wastewater 1044SCWP Filter Control Building (Includes Demo of Existing) 833330 Environmental Services Infrastructure Wastewater 1037SCWP FOG/Food Waste Facility 833360 Environmental Services Infrastructure Wastewater 1040SCWP Maintenance Building 833250 Environmental Services Infrastructure Wastewater 1033SCWP Master Plan 830250 Environmental Services Infrastructure Wastewater 1004SCWP Miscellaneous Civil Site/Support Utility Improvements 833280 Environmental Services Infrastructure Wastewater 1036SCWP Oversight 833110 Environmental Services Infrastructure Wastewater 1023SCWP Primary Effluent Diurnal EQ and Emergency Storage 833430 Environmental Services Infrastructure Wastewater 1043SCWP Primary Process Design and Construction 824771 Environmental Services Infrastructure Wastewater 984SCWP Program Management 830240 Environmental Services Infrastructure Wastewater 1003SCWP Recycle Water Improvements (New Recycled Water PS) 833260 Environmental Services Infrastructure Wastewater 1034SCWP Rehabilitation Influent Pipelines to WPCP 833140 Environmental Services Infrastructure Wastewater 1026SCWP Rehabilitation Primary Effluent Pipeline 833130 Environmental Services Infrastructure Wastewater 1025SCWP Secondary Treatment Improvements - Split Flow CAS Stg 2 833420 Environmental Services Infrastructure Wastewater 1042SCWP Secondary Treatment Improvements-Split Flow CAS Stage 1 833210 Environmental Services Infrastructure Wastewater 1029SCWP Thickening and Dewatering Facility - Stage 1 833230 Environmental Services Infrastructure Wastewater 1031SCWP Thickening and Dewatering Facility - Stage 2 833450 Environmental Services Infrastructure Wastewater 1045SCWP UV Disinfection 833510 Environmental Services Infrastructure Wastewater 1047Senior Center Buildings - Rehabilitation 818600 Public Works Infrastructure Parks & Recreation 1115Serra Park Renovation and Enhancement 830460 Public Works Infrastructure Parks & Recreation 1152Serra Park Spray Pool Renovation 832760 Public Works Infrastructure Parks & Recreation 1176Sewer Emergency Repair and Replacement 805253 Environmental Services Infrastructure Wastewater 979Sewer Lift Stations Rebuild 825751 Environmental Services Infrastructure Wastewater 989Sidewalk, Curb and Gutter Replacement 829400 Public Works Infrastructure Traffic & Transportation 820Silicon Valley Healthy Aging Partnership 832400 Library and Community Services Special Parks & Recreation 1169Silicon Valley Talent Partnership 832310 Office of the City Manager Special Gov. & Comm. Engagement 1234SMaRT Station Operations Contract RFP 821170 Environmental Services Special Solid Waste 959SMaRT Station® Equipment Replacement 811250 Environmental Services Infrastructure Solid Waste 958Solar Installation Procurement 831150 Environmental Services Capital Wastewater 1006
764

Project Name Project No. Department Project Category Project Type Page #
City of SunnyvaleAlphabetical Project Index
Funded and Unfunded Projects by Project Name
Solar Installations on City Facilities 831600 Environmental Services Capital Solid Waste 970Solid Waste Cost of Service Study 824261 Finance Special Solid Waste 961State 9-1-1 System Residual Funds 832300 Public Safety Special Public Safety 1077Stevens Creek Fish Passage Improvement Project 832080 Office of the City Manager Special Gov. & Comm. Engagement 1232Stoney Pine Villa Apartments - Rehab 832410 Community Development Special Housing 920Storm Pump Station Number 1 Rehabilitation 822752 Environmental Services Infrastructure Wastewater 980Storm Pump Station Number 2 Rehabilitation 822762 Environmental Services Infrastructure Wastewater 981Storm System Trash Control Devices 829080 Environmental Services Capital Wastewater 995Storm System Trash Reduction Programs 831690 Environmental Services Special Wastewater 1014Street Lights Conduit Replacement 825340 Public Works Infrastructure Traffic & Transportation 810Sunken Gardens Driving Range Light Replacement 829170 Public Works Infrastructure Parks & Recreation 1132Sunken Gardens Golf Course Clubhouse Paving 828390 Public Works Infrastructure Parks & Recreation 1127Sunnyvale Avenue Median from Iowa to Washington 826790 Public Works Capital Downtown 894Sunnyvale Baylands Park Infrastructure 830280 Public Works Infrastructure Parks & Recreation 1135Sunnyvale Contribution to SMaRT Station Equipment Rep. Fund 801351 Environmental Services Special Solid Waste 957Sunnyvale Library Bike Mobile Project 832490 Library and Community Services Special Library 1191Sunnyvale Office Center Site Improvements 824980 Public Works Infrastructure Administrative Facilities 1263Sunnyvale Roadway Pavement Rehabilitation 832980 Public Works Capital Traffic & Transportation 866Sunnyvale SNAIL Neighborhood Improvements - ATP 833000 Public Works Capital Traffic & Transportation 868Sunnyvale Tennis Center Court Rehabilitation 827160 Public Works Infrastructure Parks & Recreation 1125Sunnyvale Traffic Signal Upgrades 832990 Public Works Capital Traffic & Transportation 867Sunnyvale Workforce Development Program-DST 829560 Community Development Special CDBG 1094Sunnyvale-Saratoga Road Pedestrian Safety Signal 830110 Public Works Capital Traffic & Transportation 822Sustainability Speaker Series 832360 Environmental Services Special Gov. & Comm. Engagement 1235Swim Pools Infrastructure 825850 Public Works Infrastructure Parks & Recreation 1123Swimming Pool Buildings Infrastructure 829150 Public Works Infrastructure Parks & Recreation 1130Synthetic Turf Sports Field 832710 Public Works Capital Parks & Recreation 1171Temporary Planning Staffing 831350 Community Development Special Gov. & Comm. Engagement 1224Tenant Based Rental Assistance (HOME) 828750 Community Development Special Housing 913Tennis Center Buildings Infrastructure 828420 Public Works Infrastructure Parks & Recreation 1129Town Center Construction - Public Works Services 826620 Public Works Special Downtown 893Town Center Traffic Signal Modifications 826820 Public Works Capital Downtown 896
765

Project Name Project No. Department Project Category Project Type Page #
City of SunnyvaleAlphabetical Project Index
Funded and Unfunded Projects by Project Name
Traffic Signal Controller Replacement 820180 Public Works Infrastructure Traffic & Transportation 805Traffic Signal Hardware & Wiring 820190 Public Works Infrastructure Traffic & Transportation 806Traffic Signal Light Emitting Diode (LED) Array Replacements 820200 Public Works Infrastructure Traffic & Transportation 807Traffic Signal Specifications and Standard Details 832890 Public Works Capital Traffic & Transportation 857Traffic Signal Timing Plans - Homestead Road 832150 Public Works Capital Traffic & Transportation 842Traffic Signal Timing Plans - Mathilda & Sunnyvale-Saratoga 832130 Public Works Capital Traffic & Transportation 840Traffic Signal Timing Plans - Wolfe Road 832140 Public Works Capital Traffic & Transportation 841Traffic Signals Timing Plan - Fremont Avenue 832510 Public Works Capital Traffic & Transportation 852Traffic Signals Timing Plan - Hollenbeck Avenue 832520 Public Works Capital Traffic & Transportation 853Traffic Signals Timing Plan - Mary Avenue 832530 Public Works Capital Traffic & Transportation 854Traffic Signals Timing Plan - Remington Drive 832540 Public Works Capital Traffic & Transportation 855Transportation and Traffic Services Staff Augmentation (510) 830901 Public Works Special Traffic & Transportation 825Transportation Model Update 825530 Public Works Special Traffic & Transportation 811Tree Planting and Maintenance within the SNAIL Neighborhood 831300 Public Works Capital Parks & Recreation 1156Underground Overhead Utilities 826730 Public Works Capital Traffic & Transportation 815Update of Standard Specifications and Details 825400 Public Works Special Gov. & Comm. Engagement 1204Upgrade Park Pathway Lighting to LED 832740 Public Works Infrastructure Parks & Recreation 1174Upgrading of Fuel Stations 824780 Public Works Infrastructure Administrative Facilities 1262Urban Water Management Plan Update 830890 Environmental Services Special Water 943Utility Maintenance Management System 819771 Environmental Services Special Water 929Utility Undergrounding Cost Sharing 802150 Public Works Capital Traffic & Transportation 801Victory Village Park Renovation and Enhancement 830470 Public Works Infrastructure Parks & Recreation 1153Vision Zero Plan - Study Issue 832340 Public Works Capital Traffic & Transportation 848W Remington Dr and Michaelangelo Dr Intersection Improvement 832090 Public Works Capital Traffic & Transportation 838Washington Avenue/Mathilda Avenue Intersection Widening 826900 Public Works Capital Downtown 897Washington Community Swim Center 826710 Public Works Capital Parks & Recreation 1124Washington Park Renovation and Enhancement 831850 Public Works Infrastructure Parks & Recreation 1163Washington Pool Infrastructure Replacement and Renovation 832720 Public Works Infrastructure Parks & Recreation 1172Wastewater Cost of Service Study 824341 Finance Special Wastewater 983Wastewater Master Plan Update 833050 Environmental Services Infrastructure Wastewater 1017Water Conservation and Drought Response 831480 Environmental Services Special Water 945Water Cost of Service Study 824291 Finance Special Water 931
766

Project Name Project No. Department Project Category Project Type Page #
City of SunnyvaleAlphabetical Project Index
Funded and Unfunded Projects by Project Name
Water Utility Master Plan 826960 Environmental Services Infrastructure Water 938Website Redesign Implementation, Upgrades and Maintenance 831490 Office of the City Manager Special Gov. & Comm. Engagement 1226West Hill Renovation Park Project 832820 Public Works Capital Parks & Recreation 1182Wolfe Road Corridor Traffic Improvement Study 830970 Public Works Special Traffic & Transportation 826Wolfe Road Recycled Water Project 829450 Environmental Services Infrastructure Water 941Wolfe/Evelyn Water Plant Upgrade 825391 Environmental Services Infrastructure Water 936WPCP Asset Condition Assessment 827040 Environmental Services Infrastructure Wastewater 992WPCP Biosolids Processing 825521 Environmental Services Infrastructure Wastewater 988WPCP Chlorine Conversion 829430 Environmental Services Capital Wastewater 997WPCP Electronic Operations & Maintenance Manual 833070 Environmental Services Capital Wastewater 1019WPCP Oxidation Pond Levee Rehabilitation 831730 Environmental Services Capital Wastewater 1015WPCP Waste Gas Burner Replacement 833080 Environmental Services Infrastructure Wastewater 1020Zero Waste Strategic Plan 830910 Environmental Services Special Solid Waste 967Total Number of Funded Projects: 396
767

Project Name Project No. Department Project Category Project Type Page #
City of SunnyvaleAlphabetical Project Index
Funded and Unfunded Projects by Project Name
Unfunded ProjectsBernardo Avenue Caltrain Undercrossing 823911 Public Works Capital Traffic & Transportation 875Calabazas Creek Trail Low Water Crossings 900692 Public Works Capital Traffic & Transportation 881Charles Street Bicycle Boulevard 900931 Public Works Capital Traffic & Transportation 883City Share of Development Costs - Streets 802500 Public Works Capital Traffic & Transportation 873Corporation Yard Buildings - Roofs 818651 Public Works Infrastructure Administrative Facilities 1285Corporation Yard Facility Replacement 900316 Public Works Capital Administrative Facilities 1287El Camino Real Gateway Program 900469 Community Development Capital Traffic & Transportation 880Fair Oaks Junction Sense of Place Improvements 900933 Public Works Capital Traffic & Transportation 884Future Traffic Calming Projects 900141 Public Works Capital Traffic & Transportation 879Green Infrastructure Planning for Stormwater 901094 Environmental Services Infrastructure Wastewater 1049Java Drive/Fair Oaks Avenue Bike Lanes 900934 Public Works Capital Traffic & Transportation 885Lawrence Expressway and Wildwood Ave. Realignment 815901 Public Works Capital Traffic & Transportation 874Light Emitting Diode (LED) Streetlight Retrofit Phase II 900929 Public Works Infrastructure Traffic & Transportation 882Mary Avenue Extension 829260 Public Works Capital Traffic & Transportation 877Mary Avenue Transmission Main PRV 826940 Environmental Services Infrastructure Water 949Peery Park Sense of Place 901206 Public Works Capital Traffic & Transportation 887Peery Park Specific Plan Wastewater Capacity Improvements 901205 Environmental Services Outside Group Funding Wastewater 1050Personal Electronic Tools for Work Order System 901103 Public Works Capital Gov. & Comm. Engagement 1247Recycled Water Inter-Connect Moffett Field/Mountain View 900894 Environmental Services Capital Water 951Recycled Water Tank and Pumping Facilities 900807 Environmental Services Capital Water 950Security Access Control System Replacement 825560 Public Works Infrastructure Administrative Facilities 1286Stevens Creek Trail 830640 Public Works Capital Traffic & Transportation 878Streetscape Improvements For Downtown Block 18 Completion 900290 Community Development Capital Downtown 903Tasman/Fair Oaks Area Streetscape and Sense of Place 826570 Public Works Capital Traffic & Transportation 876Traffic Signals Replacement 901195 Public Works Capital Traffic & Transportation 886Wolfe Road Corridor Traffic Improvement Study 901278 Public Works Special Traffic & Transportation 888Total Number of Unfunded Projects: 26
768

Departmental Project Index

Project No. Project Name Project Category Project Type Project Manager Project Coordinator Page #Department: Community Development
Funded Projects803501 CDBG Housing Rehabilitation Revolving Loan Fund Special CDBG Suzanne Ise Katrina Ardina 1091812701 Home Access, Paint, Emergency Repair, and Energy-Efficiency Special CDBG Suzanne Ise Katrina Ardina 1092819720 Outside Group Funding Support [GF] Outside Group Funding Outside Group Funding Suzanne Ise Katrina Ardina 1102823750 BMR Compliance Enforcement Special Housing Suzanne Ise Ernest De Frenchi 909825700 General Plan Updates Special Gov. & Comm. Engagement Andrew Miner Amber Blizinski 1205826520 Pre-Development Costs on Affordable Housing Sites Special Housing Suzanne Ise Katrina Ardina 910826530 County-Wide Homeless Count Special Housing Suzanne Ise Katrina Ardina 911827550 Outside Group Funding Support [CDBG] Outside Group Funding CDBG Suzanne Ise Katrina Ardina 1093828100 First-Time Homebuyer Loans Special Housing Suzanne Ise Ernest De Frenchi 912828750 Tenant Based Rental Assistance (HOME) Special Housing Suzanne Ise Katrina Ardina 913829560 Sunnyvale Workforce Development Program-DST Special CDBG Suzanne Ise Katrina Ardina 1094829670 Lawrence Station Area Plan - Phase II Special Gov. & Comm. Engagement Andrew Miner Andrew Miner 1208829810 Peery Park Specific Plan and Environmental Impact Report Special Gov. & Comm. Engagement Andrew Miner Amber Blizinski 1211830040 Onizuka Site Transition Plan Capital Gov. & Comm. Engagement Trudi Ryan Ernest De Frenchi 1212830630 Dispute Resolution Services Outside Group Funding Outside Group Funding Suzanne Ise Katrina Ardina 1104830920 Morse Court Rental Rehabilitation (HMF) Special Housing Suzanne Ise Katrina Ardina 914830980 Comprehensive Update of the Precise Plan for El Camino Real Special Gov. & Comm. Engagement Andrew Miner Rosemarie Zulueta 1218831350 Temporary Planning Staffing Special Gov. & Comm. Engagement Andrew Miner Andrew Miner 1224831530 One-Stop Permit Center Renovation Special Administrative Facilities Ali Fatapour Diana Perkins 1273831740 Crescent Terrace Senior Housing Rehabilitation Special Housing Suzanne Ise Katrina Ardina 915831750 460 Persian Dr.: Loan for New Affordable Apts by MidPen Special Housing Suzanne Ise Katrina Ardina 916831761 Homeless Prevention and Rapid Re-Housing (HPRR) Special Housing Suzanne Ise Katrina Ardina 917831790 Multi-family Residential Transportation Demand Mgmt Programs Special Gov. & Comm. Engagement Andrew Miner George Schroeder 1229832010 Benner Plaza: HOME Loan for New Affordable Apartments Special Housing Suzanne Ise Katrina Ardina 918832030 Orchard Gardens Apartments Redevelopment Special Housing Suzanne Ise Katrina Ardina 919832040 Persian Drive Sidewalk Extension (CDBG) Infrastructure CDBG Suzanne Ise Katrina Ardina 1096832350 Murphy Avenue Design Guidelines Comprehensive Update Special Downtown Andrew Miner Amber Blizinski 899832410 Stoney Pine Villa Apartments - Rehab Special Housing Suzanne Ise Katrina Ardina 920832640 CAP and Green Building Updates Special Gov. & Comm. Engagement Andrew Miner George Schroeder 1239832650 Peery Park Housing Study Special Gov. & Comm. Engagement Andrew Miner George Schroeder 1240833600 Block 15 - Affordable Housing Site Special Downtown Suzanne Ise Katrina Ardina 900833640 2017 Housing Strategy Special Housing Suzanne Ise Ernest De Frenchi 921833650 Downtown Development Policies for Parking Special Gov. & Comm. Engagement Andrew Miner George Schroeder 1244833700 Lawrence Station Area Plan - Housing and Sense of Place Special Housing Andrew Miner George Schroeder 922Total Number of Community Development Funded Projects: 34
City of SunnyvaleDepartmental Project Index
Funded and Unfunded Projects by Department
769
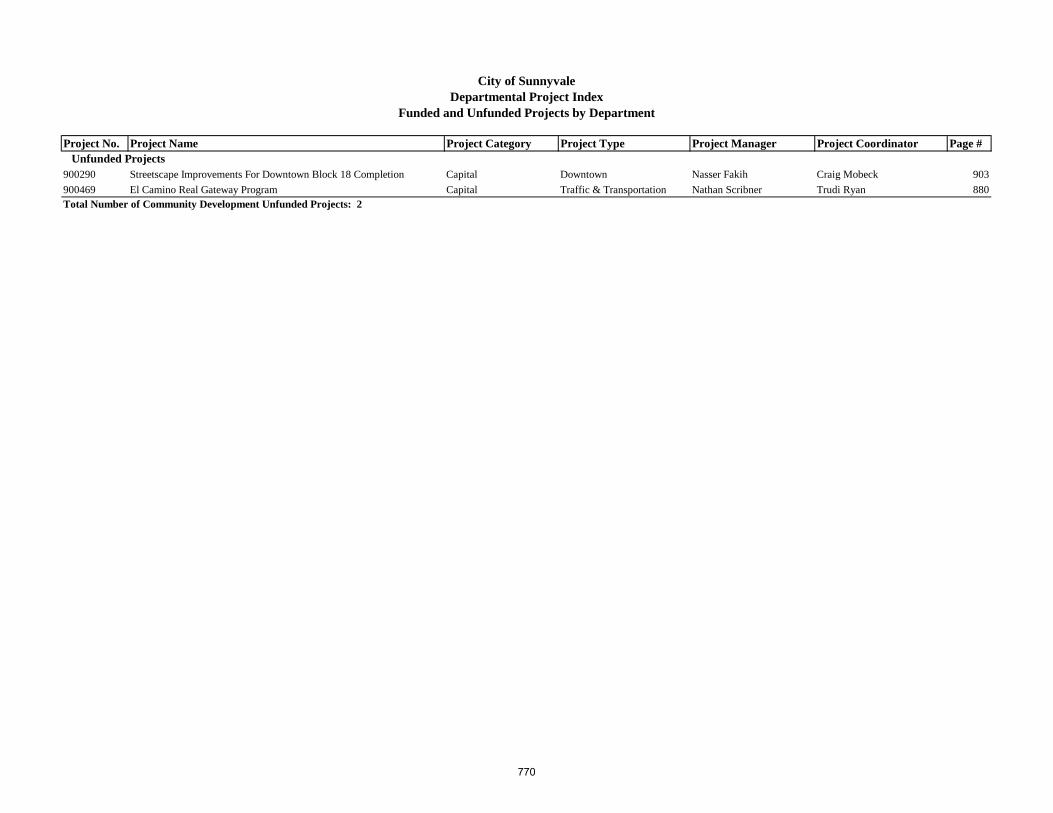
Project No. Project Name Project Category Project Type Project Manager Project Coordinator Page #
City of SunnyvaleDepartmental Project Index
Funded and Unfunded Projects by Department
Unfunded Projects900290 Streetscape Improvements For Downtown Block 18 Completion Capital Downtown Nasser Fakih Craig Mobeck 903900469 El Camino Real Gateway Program Capital Traffic & Transportation Nathan Scribner Trudi Ryan 880Total Number of Community Development Unfunded Projects: 2
770

Project No. Project Name Project Category Project Type Project Manager Project Coordinator Page #
City of SunnyvaleDepartmental Project Index
Funded and Unfunded Projects by Department
Department: Environmental ServicesFunded Projects
801351 Sunnyvale Contribution to SMaRT Station Equipment Rep. Fund Special Solid Waste Mark Bowers Deborah Sargent 957805253 Sewer Emergency Repair and Replacement Infrastructure Wastewater Mansour Nasser Mansour Nasser 979806351 Land Development and Capital Construction Capital Water Mansour Nasser John Ramirez 927811250 SMaRT Station® Equipment Replacement Infrastructure Solid Waste Mark Bowers Deborah Sargent 958815203 Replacement of Water/Sewer Supervisory Control System Infrastructure Water Jennifer Ng John Ramirez 928819771 Utility Maintenance Management System Special Water Mansour Nasser Mansour Nasser 929821170 SMaRT Station Operations Contract RFP Special Solid Waste Mark Bowers Deborah Sargent 959821181 Contribution to SMaRT Station Operations Contract RFP Special Solid Waste Mark Bowers Deborah Sargent 960822752 Storm Pump Station Number 1 Rehabilitation Infrastructure Wastewater Liliana Price Mansour Nasser 980822762 Storm Pump Station Number 2 Rehabilitation Infrastructure Wastewater Nathan Scribner Mansour Nasser 981824281 Leak Detection and Condition Assessment Program Special Water John Ramirez Mansour Nasser 930824301 Rehabilitation of Digesters Infrastructure Wastewater Allie Hood Bhavani Yerrapotu 982824741 Landfill "Constituents of Concern" Monitoring Special Solid Waste Mark Bowers Sandra Jensen 962824771 SCWP Primary Process Design and Construction Infrastructure Wastewater Allie Hood Bhavani Yerrapotu 984825141 Air Flotation Tanks Rehabilitation Infrastructure Wastewater Allie Hood Leonard Espinoza 985825221 Central Well Reconstruction Infrastructure Water Jennifer Ng John Ramirez 932825231 Cleaning of Water Tanks Infrastructure Water Mansour Nasser John Ramirez 933825251 Mary/Carson Water Plant Upgrade Infrastructure Water Thanh Nguyen John Ramirez 934825301 Pressure Reducing Valve Replacement Infrastructure Water Mansour Nasser John Ramirez 935825331 Replacement/Repair/Rehabilitation of Sanitary Sewer System Infrastructure Wastewater Richard Chen Mansour Nasser 986825361 Replacement/Repair/Rehabilitation of Storm Drain System Infrastructure Wastewater Richard Chen Mansour Nasser 987825391 Wolfe/Evelyn Water Plant Upgrade Infrastructure Water Richard Chen John Ramirez 936825451 City-wide Water Line Replacement Infrastructure Water Richard Chen John Ramirez 937825521 WPCP Biosolids Processing Infrastructure Wastewater Bryan Berdeen Bryan Berdeen 988825751 Sewer Lift Stations Rebuild Infrastructure Wastewater Nathan Scribner Mansour Nasser 989825911 Landfill Gas Flare and Blowers Replacement Infrastructure Solid Waste Mark Bowers Sandra Jensen 963826960 Water Utility Master Plan Infrastructure Water Eric Evans John Ramirez 938827020 Emergency Flow Management Infrastructure Infrastructure Wastewater Allie Hood Bhavani Yerrapotu 991827040 WPCP Asset Condition Assessment Infrastructure Wastewater Allie Hood Bhavani Yerrapotu 992827560 Aerial Mapping and Settlement Analysis of the SV Landfill Special Solid Waste Mark Bowers Sandra Jensen 964828210 Inspection Data Mgmt and Handheld Data Entry Device Project Capital Wastewater Melody Tovar none 993828260 Replace SMaRT Station Infrastructure Solid Waste Nathan Scribner Mark Bowers 965829060 Rehabilitation of Cathodic Protection on RW System Infrastructure Water Jennifer Ng Mansour Nasser 940829070 Lawrence Expressway Sanitary Sewer Rehabilitation Infrastructure Wastewater Nathan Scribner Mansour Nasser 994829080 Storm System Trash Control Devices Capital Wastewater Nathan Scribner Elaine Marshall 995829100 Sanitary Sewer Siphon Cleaning and Assessment Capital Wastewater Mansour Nasser Robert Wilson 996
771

Project No. Project Name Project Category Project Type Project Manager Project Coordinator Page #
City of SunnyvaleDepartmental Project Index
Funded and Unfunded Projects by Department
829430 WPCP Chlorine Conversion Capital Wastewater Allie Hood Bhavani Yerrapotu 997829450 Wolfe Road Recycled Water Project Infrastructure Water Richard Chen Mansour Nasser 941830170 Refurbishment of Water Tanks Infrastructure Water Elizabeth Racca-Johnson John Ramirez 942830180 Landfill Post-Closure Erosion Prevention Infrastructure Solid Waste Liliana Price Mark Bowers 966830190 Repairs to the Primary Process Infrastructure Wastewater Leonard Espinoza Leonard Espinoza 998830200 Repairs to the Secondary Process Infrastructure Wastewater Leonard Espinoza Leonard Espinoza 999830210 Repairs to the Power Generation Facility Infrastructure Wastewater Leonard Espinoza Leonard Espinoza 1000830220 Repairs to the Tertiary Process Infrastructure Wastewater Leonard Espinoza Leonard Espinoza 1001830230 Laboratory Information Management System (LIMS) Capital Wastewater Melody Tovar Alo Kauravlla 1002830240 SCWP Program Management Infrastructure Wastewater Allie Hood Bhavani Yerrapotu 1003830250 SCWP Master Plan Infrastructure Wastewater Allie Hood Bhavani Yerrapotu 1004830260 Sanitary Sewer Salinity Reduction Study Special Wastewater Mansour Nasser Melody Tovar 1005830620 Power Purchase Agreements for Alternative Energy Special Gov. & Comm. Engagement Melody Tovar Elaine Marshall 1216830890 Urban Water Management Plan Update Special Water Mansour Nasser Mansour Nasser 943830910 Zero Waste Strategic Plan Special Solid Waste Mark Bowers Karen Gissibl 967830990 Community Choice Aggregation Program Special Gov. & Comm. Engagement Melody Tovar Elaine Marshall 1219830991 Community Choice Energy Phase I Special Gov. & Comm. Engagement Melody Tovar Elaine Marshall 1220831150 Solar Installation Procurement Capital Wastewater Allie Hood Elaine Marshall 1006831200 CalRecycle HHW Grant for Refillable Gas Cylinders Special Solid Waste Karen Gissibl none 968831290 Climate Action Plan Implementation Special Gov. & Comm. Engagement Melody Tovar Elaine Marshall 1221831390 CFD No.3 - Ten Year Infrastructure Improvements Plan Infrastructure Wastewater Mansour Nasser Brice Mc Queen 1007831420 Santa Clara Valley Water District Coordination Special Water Allie Hood Craig Mobeck 944831470 SCWP Construction Management Infrastructure Wastewater Allie Hood Bhavani Yerrapotu 1008831480 Water Conservation and Drought Response Special Water Mansour Nasser Mansour Nasser 945831510 Green Streets for Stormwater Capital Wastewater Nathan Scribner Elaine Marshall 1009831540 Landscape Improvements on Caribbean Drive Special Solid Waste Humza Javed Mark Bowers 969831550 Adjust Water Utilities In Support of Paving Projects Infrastructure Water Elizabeth Racca-Johnson John Ramirez 946831560 Calabazas Creek Bridge Pipeline Extension Infrastructure Water Humza Javed John Ramirez 947831600 Solar Installations on City Facilities Capital Solid Waste Allie Hood Elaine Marshall 970831620 Repairs to the WPCP Support Facilities Infrastructure Wastewater Leonard Espinoza Leonard Espinoza 1010831630 Repairs to Solids/Dewatering Facilities Infrastructure Wastewater Leonard Espinoza Leonard Espinoza 1011831670 Asset Management Program Capital Wastewater Tanner McGinnis Tanner McGinnis 1012831680 Adjust Sewer Utilities In Support of Paving Projects Infrastructure Wastewater Elizabeth Racca-Johnson Mansour Nasser 1013831690 Storm System Trash Reduction Programs Special Wastewater Melody Tovar Elaine Marshall 1014831730 WPCP Oxidation Pond Levee Rehabilitation Capital Wastewater Leonard Espinoza Cameron Kostigen Mumper 1015831840 Cathodic Protection SFPUC Turnouts and Transmission Pipeline Infrastructure Water Elizabeth Racca-Johnson John Ramirez 948832110 Electric Vehicle Charging Stations Special Outside Group Funding Elaine Marshall Elaine Marshall 1105832360 Sustainability Speaker Series Special Gov. & Comm. Engagement Elaine Marshall Nupur Hiremath 1235
772

Project No. Project Name Project Category Project Type Project Manager Project Coordinator Page #
City of SunnyvaleDepartmental Project Index
Funded and Unfunded Projects by Department
832430 Recycled and Potable Water Plan Development Infrastructure Wastewater Bhavani Yerrapotu Bhavani Yerrapotu 1016833040 Landfill South Hill Drainage Correction Infrastructure Solid Waste Nathan Scribner Mark Bowers 971833050 Wastewater Master Plan Update Infrastructure Wastewater Nathan Scribner Mansour Nasser 1017833060 Annual Digester Cleaning Special Wastewater Bryan Berdeen Bryan Berdeen 1018833070 WPCP Electronic Operations & Maintenance Manual Capital Wastewater Bhavani Yerrapotu Tanner McGinnis 1019833080 WPCP Waste Gas Burner Replacement Infrastructure Wastewater Allie Hood Leonard Espinoza 1020833090 Sanitary and Storm System Hydraulic Model Update Capital Wastewater Mansour Nasser Mansour Nasser 1021833100 SCWP Capital Replacement Infrastructure Wastewater Allie Hood Bhavani Yerrapotu 1022833110 SCWP Oversight Infrastructure Wastewater Allie Hood Bhavani Yerrapotu 1023833120 SCWP Environmental Mitigation Infrastructure Wastewater Allie Hood Bhavani Yerrapotu 1024833130 SCWP Rehabilitation Primary Effluent Pipeline Infrastructure Wastewater Allie Hood Bhavani Yerrapotu 1025833140 SCWP Rehabilitation Influent Pipelines to WPCP Infrastructure Wastewater Allie Hood Bhavani Yerrapotu 1026833150 SCWP Existing Plant Rehabilitation - Split Flow Infrastructure Wastewater Allie Hood Bhavani Yerrapotu 1027833160 SCWP Caribbean Drive Parking and Trail Access Enhancements Infrastructure Wastewater Allie Hood Bhavani Yerrapotu 1028833210 SCWP Secondary Treatment Improvements-Split Flow CAS Stage 1 Infrastructure Wastewater Allie Hood Bhavani Yerrapotu 1029833220 SCWP Digester Supernatant PS and Drainage Piping Upgrades Infrastructure Wastewater Allie Hood Bhavani Yerrapotu 1030833230 SCWP Thickening and Dewatering Facility - Stage 1 Infrastructure Wastewater Allie Hood Bhavani Yerrapotu 1031833240 SCWP Administration and Lab Building Infrastructure Wastewater Allie Hood Bhavani Yerrapotu 1032833250 SCWP Maintenance Building Infrastructure Wastewater Allie Hood Bhavani Yerrapotu 1033833260 SCWP Recycle Water Improvements (New Recycled Water PS) Infrastructure Wastewater Allie Hood Bhavani Yerrapotu 1034833270 SCWP Community Improvements Infrastructure Wastewater Allie Hood Bhavani Yerrapotu 1035833280 SCWP Miscellaneous Civil Site/Support Utility Improvements Infrastructure Wastewater Allie Hood Bhavani Yerrapotu 1036833330 SCWP Filter Control Building (Includes Demo of Existing) Infrastructure Wastewater Allie Hood Bhavani Yerrapotu 1037833340 SCWP Chloramine Disinfection Infrastructure Wastewater Allie Hood Bhavani Yerrapotu 1038833350 SCWP Digester No. 5 Infrastructure Wastewater Allie Hood Bhavani Yerrapotu 1039833360 SCWP FOG/Food Waste Facility Infrastructure Wastewater Allie Hood Bhavani Yerrapotu 1040833370 SCWP Cogeneration Upgrade Infrastructure Wastewater Allie Hood Bhavani Yerrapotu 1041833420 SCWP Secondary Treatment Improvements - Split Flow CAS Stg 2 Infrastructure Wastewater Allie Hood Bhavani Yerrapotu 1042833430 SCWP Primary Effluent Diurnal EQ and Emergency Storage Infrastructure Wastewater Allie Hood Bhavani Yerrapotu 1043833440 SCWP Filter Backwash Storage Infrastructure Wastewater Allie Hood Bhavani Yerrapotu 1044833450 SCWP Thickening and Dewatering Facility - Stage 2 Infrastructure Wastewater Allie Hood Bhavani Yerrapotu 1045833460 SCWP Demolition Fixed Growth Reactor (FGR) Pump Station Infrastructure Wastewater Allie Hood Bhavani Yerrapotu 1046833510 SCWP UV Disinfection Infrastructure Wastewater Allie Hood Bhavani Yerrapotu 1047833520 SCWP Demolition Fixed Growth Reactors (FGRs) Infrastructure Wastewater Allie Hood Bhavani Yerrapotu 1048833680 Climate Action Plan (CAP) 2.0 Initative-Planning Beyond 2020 Special Administrative Facilities Melody Tovar Elaine Marshall 1283Total Number of Environmental Services Funded Projects: 109
773

Project No. Project Name Project Category Project Type Project Manager Project Coordinator Page #
City of SunnyvaleDepartmental Project Index
Funded and Unfunded Projects by Department
Unfunded Projects826940 Mary Avenue Transmission Main PRV Infrastructure Water Mansour Nasser John Ramirez 949900807 Recycled Water Tank and Pumping Facilities Capital Water Richard Chen John Ramirez 950900894 Recycled Water Inter-Connect Moffett Field/Mountain View Capital Water Mansour Nasser John Ramirez 951901094 Green Infrastructure Planning for Stormwater Infrastructure Wastewater Melody Tovar Elaine Marshall 1049901205 Peery Park Specific Plan Wastewater Capacity Improvements Outside Group Funding Wastewater Nathan Scribner Jennifer Ng 1050Total Number of Environmental Services Unfunded Projects: 5
774

Project No. Project Name Project Category Project Type Project Manager Project Coordinator Page #
City of SunnyvaleDepartmental Project Index
Funded and Unfunded Projects by Department
Department: FinanceFunded Projects
814952 Redevelopment Dissolution Special Gov. & Comm. Engagement Brice Mc Queen Brice Mc Queen 1202824261 Solid Waste Cost of Service Study Special Solid Waste Janice Broussard Stephen Napier 961824291 Water Cost of Service Study Special Water Janice Broussard Stephen Napier 931824341 Wastewater Cost of Service Study Special Wastewater Janice Broussard Stephen Napier 983825961 SCVURPPP Contracting and Fiscal Agent Special Wastewater Stephen Napier Melody Tovar 990827180 Automation of Water Meter Reading Infrastructure Water Janice Broussard Stephen Napier 939829630 Council Set Aside Special Gov. & Comm. Engagement Tim Kirby Tim Kirby 1207830520 ERP System Acquisition, Implementation and Support Special Gov. & Comm. Engagement Tim Kirby Karen Miller 1213832580 City Hall Annex Basement Security/Storage Infrastructure Administrative Facilities Kenn Lee none 1278832630 Administrative Hearing Officer Special Gov. & Comm. Engagement Tim Kirby none 1238833620 Evaluation of New Revenue Strategies Special Gov. & Comm. Engagement Brice Mc Queen Brice Mc Queen 1243Total Number of Finance Funded Projects: 11
775
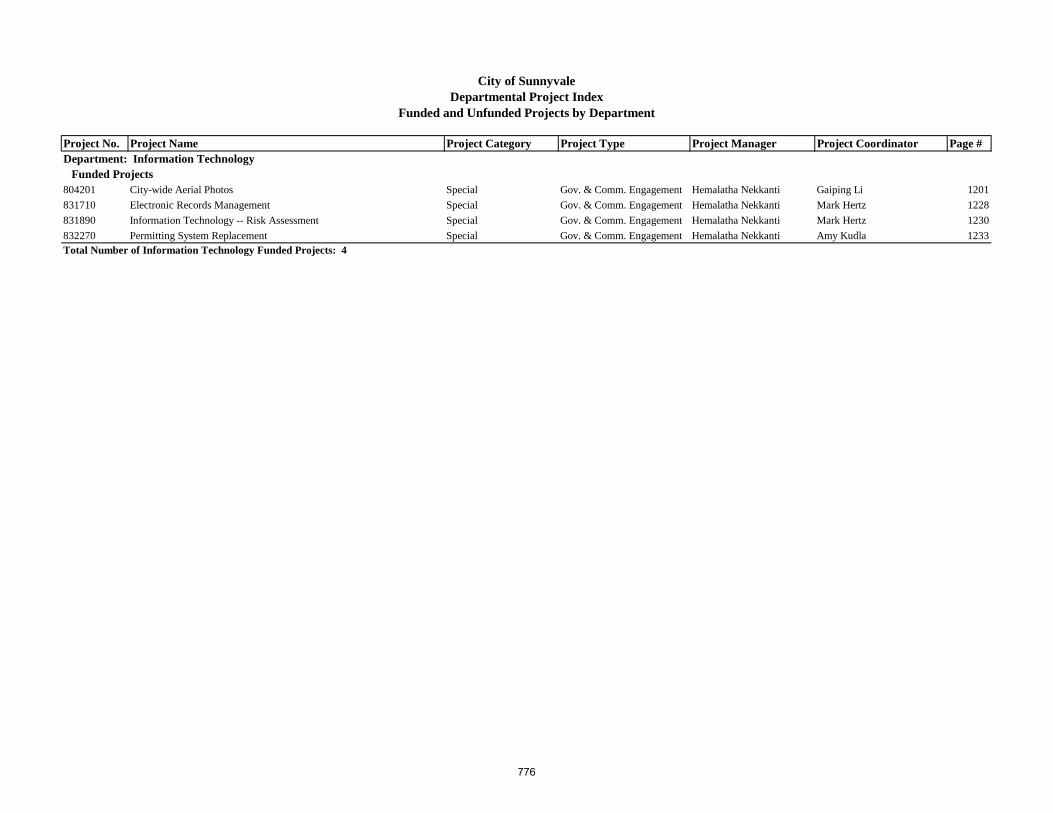
Project No. Project Name Project Category Project Type Project Manager Project Coordinator Page #
City of SunnyvaleDepartmental Project Index
Funded and Unfunded Projects by Department
Department: Information TechnologyFunded Projects
804201 City-wide Aerial Photos Special Gov. & Comm. Engagement Hemalatha Nekkanti Gaiping Li 1201831710 Electronic Records Management Special Gov. & Comm. Engagement Hemalatha Nekkanti Mark Hertz 1228831890 Information Technology -- Risk Assessment Special Gov. & Comm. Engagement Hemalatha Nekkanti Mark Hertz 1230832270 Permitting System Replacement Special Gov. & Comm. Engagement Hemalatha Nekkanti Amy Kudla 1233Total Number of Information Technology Funded Projects: 4
776

Project No. Project Name Project Category Project Type Project Manager Project Coordinator Page #
City of SunnyvaleDepartmental Project Index
Funded and Unfunded Projects by Department
Department: Library and Community ServicesFunded Projects
805150 Library Foundation Program Grant Special Library Steve Sloan Steve Sloan 1187830960 Participate in NLC's Youth, Education and Family Council Special Gov. & Comm. Engagement Daniel Wax none 1217831360 Recreation Fee Waiver Special Parks & Recreation Daniel Wax Angela Chan 1157831400 Make-Her Grant Special Library Susan Kaplan Nancy Andrus 1189831720 Arts Master Plan Special Parks & Recreation Daniel Wax Trenton Hill 1161831880 Preschool Outdoor Play Area Capital Parks & Recreation Elizabeth Racca-Johnson Nancy Grove 1165831950 Pass It On: An Intergenerational Sewing Project Special Library Christine Mendoza Rachel Schmidt 1190831980 Annual State of the City Special Gov. & Comm. Engagement Daniel Wax Jenny Shain 1231832380 Iizuka Sister City Engagement Funding Outside Group Funding Gov. & Comm. Engagement Cynthia Bojorquez Cynthia Bojorquez 1236832400 Silicon Valley Healthy Aging Partnership Special Parks & Recreation Cynthia Bojorquez Gerard Manuel 1169832490 Sunnyvale Library Bike Mobile Project Special Library Christine Mendoza Christine Mendoza 1191832600 Library LED Lighting Conversion Capital Administrative Facilities Javier Lopez Steve Sloan 1280832620 Pilot Grant Writer at CNC Special Gov. & Comm. Engagement Daniel Wax Angela Chan 1237832690 Library Restroom Renovation Capital Library Jennifer Ng Steve Sloan 1193Total Number of Library and Community Services Funded Projects: 14
777

Project No. Project Name Project Category Project Type Project Manager Project Coordinator Page #
City of SunnyvaleDepartmental Project Index
Funded and Unfunded Projects by Department
Department: Office of the City AttorneyFunded Projects
824571 Project Management for Town Center Development Agreement Special Gov. & Comm. Engagement John Nagel Brice Mc Queen 1203831320 RDA Counsel Fees Capital Gov. & Comm. Engagement John Nagel Brice Mc Queen 1223Total Number of Office of the City Attorney Funded Projects: 2
778

Project No. Project Name Project Category Project Type Project Manager Project Coordinator Page #
City of SunnyvaleDepartmental Project Index
Funded and Unfunded Projects by Department
Department: Office of the City ManagerFunded Projects
803700 Leadership Sunnyvale [GF] Outside Group Funding Outside Group Funding Yvette Blackford Claire Garcia 1101827700 Records Imaging and Voting System Upgrade Special Gov. & Comm. Engagement Kathleen Franco Simmons Kathleen Franco Simmons 1206829620 Downtown Association Special Outside Group Funding Connie Verceles Maria Rodriguez 1103830540 Replace Customer Relationship Management System Special Gov. & Comm. Engagement Walter Rossmann Yvette Blackford 1215831310 Minimum Wage Enforcement Agreement Special Gov. & Comm. Engagement Connie Verceles Maria Rodriguez 1222831340 Civic Center Modernization Infrastructure Administrative Facilities Kent Steffens none 1272831490 Website Redesign Implementation, Upgrades and Maintenance Special Gov. & Comm. Engagement Jennifer Garnett Jennifer Garnett 1226831700 Channel 26 Public Access Programming Special Gov. & Comm. Engagement Jennifer Garnett Jennifer Garnett 1227832080 Stevens Creek Fish Passage Improvement Project Special Gov. & Comm. Engagement Kent Steffens Catlin Ivanetich 1232832310 Silicon Valley Talent Partnership Special Gov. & Comm. Engagement Connie Verceles Maria Rodriguez 1234832660 Economic Development Strategy Special Gov. & Comm. Engagement Connie Verceles Maria Rodriguez 1241832670 Charter Assessment Special Gov. & Comm. Engagement Walter Rossmann Kathleen Franco Simmons 1242833660 Develop Wage Theft Enforcement Program Special Gov. & Comm. Engagement Connie Verceles Maria Rodriguez 1245833690 Parkland/Open Space Initiative Special Gov. & Comm. Engagement Catlin Ivanetich Catlin Ivanetich 1246Total Number of Office of the City Manager Funded Projects: 14
779
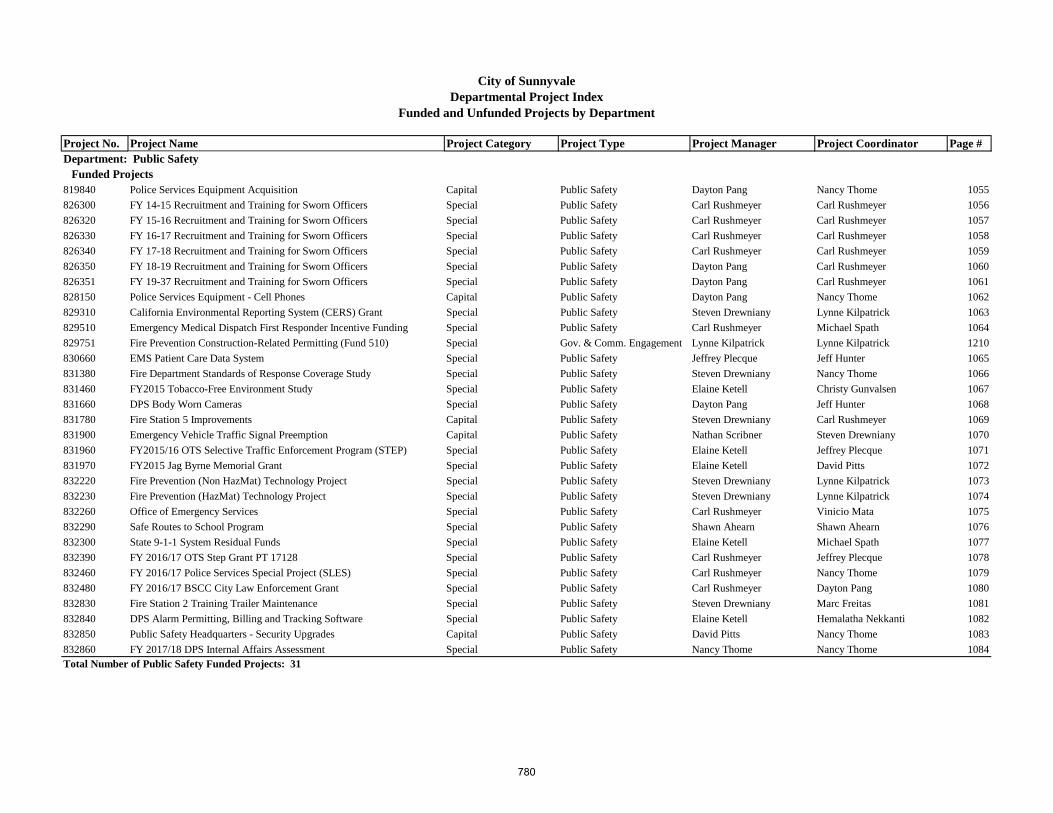
Project No. Project Name Project Category Project Type Project Manager Project Coordinator Page #
City of SunnyvaleDepartmental Project Index
Funded and Unfunded Projects by Department
Department: Public SafetyFunded Projects
819840 Police Services Equipment Acquisition Capital Public Safety Dayton Pang Nancy Thome 1055826300 FY 14-15 Recruitment and Training for Sworn Officers Special Public Safety Carl Rushmeyer Carl Rushmeyer 1056826320 FY 15-16 Recruitment and Training for Sworn Officers Special Public Safety Carl Rushmeyer Carl Rushmeyer 1057826330 FY 16-17 Recruitment and Training for Sworn Officers Special Public Safety Carl Rushmeyer Carl Rushmeyer 1058826340 FY 17-18 Recruitment and Training for Sworn Officers Special Public Safety Carl Rushmeyer Carl Rushmeyer 1059826350 FY 18-19 Recruitment and Training for Sworn Officers Special Public Safety Dayton Pang Carl Rushmeyer 1060826351 FY 19-37 Recruitment and Training for Sworn Officers Special Public Safety Dayton Pang Carl Rushmeyer 1061828150 Police Services Equipment - Cell Phones Capital Public Safety Dayton Pang Nancy Thome 1062829310 California Environmental Reporting System (CERS) Grant Special Public Safety Steven Drewniany Lynne Kilpatrick 1063829510 Emergency Medical Dispatch First Responder Incentive Funding Special Public Safety Carl Rushmeyer Michael Spath 1064829751 Fire Prevention Construction-Related Permitting (Fund 510) Special Gov. & Comm. Engagement Lynne Kilpatrick Lynne Kilpatrick 1210830660 EMS Patient Care Data System Special Public Safety Jeffrey Plecque Jeff Hunter 1065831380 Fire Department Standards of Response Coverage Study Special Public Safety Steven Drewniany Nancy Thome 1066831460 FY2015 Tobacco-Free Environment Study Special Public Safety Elaine Ketell Christy Gunvalsen 1067831660 DPS Body Worn Cameras Special Public Safety Dayton Pang Jeff Hunter 1068831780 Fire Station 5 Improvements Capital Public Safety Steven Drewniany Carl Rushmeyer 1069831900 Emergency Vehicle Traffic Signal Preemption Capital Public Safety Nathan Scribner Steven Drewniany 1070831960 FY2015/16 OTS Selective Traffic Enforcement Program (STEP) Special Public Safety Elaine Ketell Jeffrey Plecque 1071831970 FY2015 Jag Byrne Memorial Grant Special Public Safety Elaine Ketell David Pitts 1072832220 Fire Prevention (Non HazMat) Technology Project Special Public Safety Steven Drewniany Lynne Kilpatrick 1073832230 Fire Prevention (HazMat) Technology Project Special Public Safety Steven Drewniany Lynne Kilpatrick 1074832260 Office of Emergency Services Special Public Safety Carl Rushmeyer Vinicio Mata 1075832290 Safe Routes to School Program Special Public Safety Shawn Ahearn Shawn Ahearn 1076832300 State 9-1-1 System Residual Funds Special Public Safety Elaine Ketell Michael Spath 1077832390 FY 2016/17 OTS Step Grant PT 17128 Special Public Safety Carl Rushmeyer Jeffrey Plecque 1078832460 FY 2016/17 Police Services Special Project (SLES) Special Public Safety Carl Rushmeyer Nancy Thome 1079832480 FY 2016/17 BSCC City Law Enforcement Grant Special Public Safety Carl Rushmeyer Dayton Pang 1080832830 Fire Station 2 Training Trailer Maintenance Special Public Safety Steven Drewniany Marc Freitas 1081832840 DPS Alarm Permitting, Billing and Tracking Software Special Public Safety Elaine Ketell Hemalatha Nekkanti 1082832850 Public Safety Headquarters - Security Upgrades Capital Public Safety David Pitts Nancy Thome 1083832860 FY 2017/18 DPS Internal Affairs Assessment Special Public Safety Nancy Thome Nancy Thome 1084Total Number of Public Safety Funded Projects: 31
780

Project No. Project Name Project Category Project Type Project Manager Project Coordinator Page #
City of SunnyvaleDepartmental Project Index
Funded and Unfunded Projects by Department
Department: Public WorksFunded Projects
802150 Utility Undergrounding Cost Sharing Capital Traffic & Transportation Jennifer Ng Arnold Chu 801804401 Golf Courses Protective Netting Replacement Infrastructure Parks & Recreation Humza Javed Rodney Wilson 1113816000 Future Traffic Signal Construction Capital Traffic & Transportation Jennifer Ng Shahid Abbas 802816050 Minor Repair of City Bridges and Culverts Infrastructure Traffic & Transportation Jim Craig Tony Pineda 803818100 Public Safety Buildings - Roofs Infrastructure Administrative Facilities Richard Chen Marc Freitas 1255818550 Park Buildings - Rehabilitation Infrastructure Parks & Recreation Thanh Nguyen Marc Freitas 1114818600 Senior Center Buildings - Rehabilitation Infrastructure Parks & Recreation Jennifer Ng Marc Freitas 1115818700 Corporation Yard Buildings - Rehabilitation Infrastructure Administrative Facilities Marc Freitas Javier Lopez 1256819610 Public Safety Buildings - HVAC Infrastructure Administrative Facilities Richard Chen Marc Freitas 1257820000 Corporation Yard Buildings - HVAC Replacement Infrastructure Administrative Facilities Marc Freitas Javier Lopez 1258820120 Repaint Street Light Poles Infrastructure Traffic & Transportation Liliana Price Tony Pineda 804820130 Routine Resurfacing of City Owned Parking Lots Infrastructure Administrative Facilities Jim Craig Tony Pineda 1259820140 Computer/Radio Controlled Landscape Median Irrigation Infrastructure Parks & Recreation Humza Javed Juan Barajas 1116820180 Traffic Signal Controller Replacement Infrastructure Traffic & Transportation Manuel Pineda Shahid Abbas 805820190 Traffic Signal Hardware & Wiring Infrastructure Traffic & Transportation Jennifer Ng Shahid Abbas 806820200 Traffic Signal Light Emitting Diode (LED) Array Replacements Infrastructure Traffic & Transportation Manuel Pineda Shahid Abbas 807820240 Park Tennis/Basketball Court Reconstruction Infrastructure Parks & Recreation Liliana Price Juan Barajas 1117820270 Playground Equipment Replacement Infrastructure Parks & Recreation Nathan Scribner Juan Barajas 1118820280 Park Furniture and Fixtures Replacement Infrastructure Parks & Recreation James Stark Juan Barajas 1119820311 Golf Course Irrigation System Replacement Infrastructure Parks & Recreation Thanh Nguyen Rodney Wilson 1120820361 Golf Course Tee Grounds Renewal Infrastructure Parks & Recreation Thanh Nguyen Rodney Wilson 1121820570 Minor Building Modifications Capital Administrative Facilities Marc Freitas Javier Lopez 1260821010 Maintenance of City Owned Properties - Downtown Special Administrative Facilities Manuel Pineda Ryan Sandoval 1261824780 Upgrading of Fuel Stations Infrastructure Administrative Facilities Liliana Price Douglas Belcher 1262824980 Sunnyvale Office Center Site Improvements Infrastructure Administrative Facilities Marc Freitas Javier Lopez 1263825070 Bicycle Map Revision Special Traffic & Transportation Carol Shariat Shahid Abbas 808825290 Pavement Rehabilitation Infrastructure Traffic & Transportation Elizabeth Racca-Johnson Tony Pineda 809825340 Street Lights Conduit Replacement Infrastructure Traffic & Transportation Elizabeth Racca-Johnson Tony Pineda 810825400 Update of Standard Specifications and Details Special Gov. & Comm. Engagement Nathan Scribner Nasser Fakih 1204825530 Transportation Model Update Special Traffic & Transportation Carol Shariat Shahid Abbas 811825570 239 - 241 Commercial Street Property Maintenance Special Administrative Facilities Manuel Pineda Ryan Sandoval 1264825610 Fair Oaks Avenue Overhead Bridge Repair Capital Traffic & Transportation Richard Chen Shahid Abbas 812825660 Golf Course Greens Renewal Infrastructure Parks & Recreation Thanh Nguyen Rodney Wilson 1122825730 Pedestrian Lighted Crosswalk Maintenance and Replacement Infrastructure Traffic & Transportation Manuel Pineda Shahid Abbas 813825740 Battery Backup System for Traffic Signals Maintenance Infrastructure Traffic & Transportation Manuel Pineda Shahid Abbas 814825850 Swim Pools Infrastructure Infrastructure Parks & Recreation Humza Javed Juan Barajas 1123
781
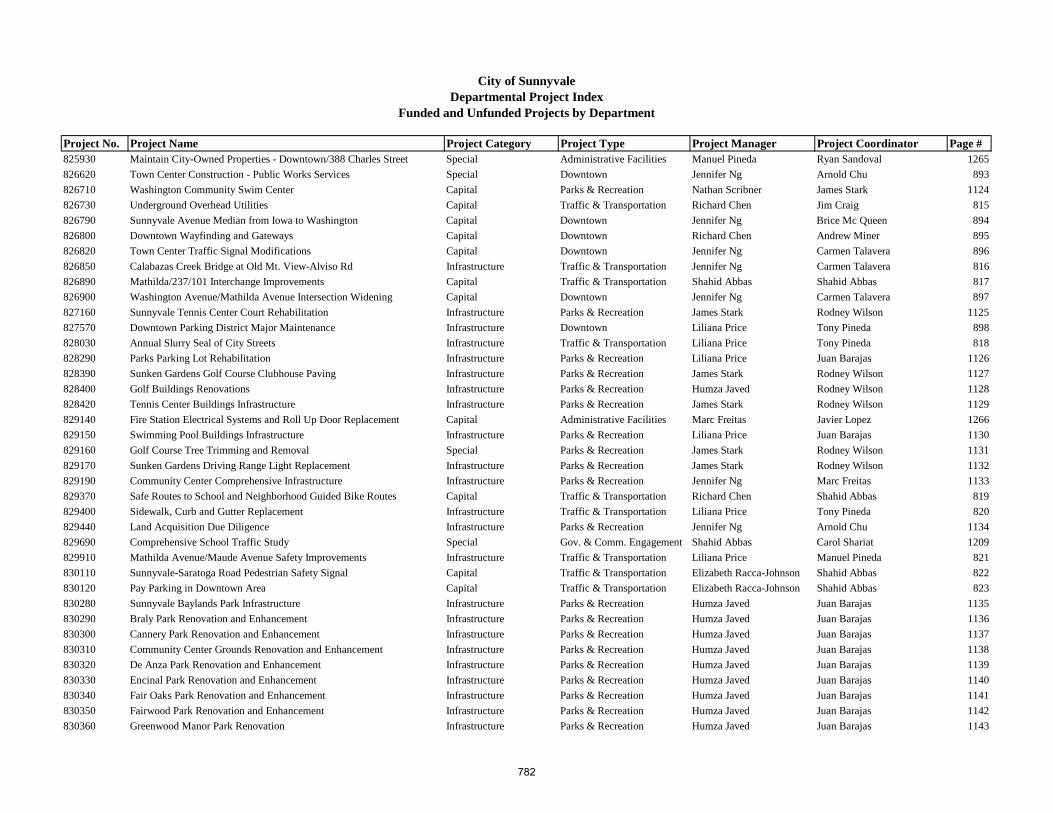
Project No. Project Name Project Category Project Type Project Manager Project Coordinator Page #
City of SunnyvaleDepartmental Project Index
Funded and Unfunded Projects by Department
825930 Maintain City-Owned Properties - Downtown/388 Charles Street Special Administrative Facilities Manuel Pineda Ryan Sandoval 1265826620 Town Center Construction - Public Works Services Special Downtown Jennifer Ng Arnold Chu 893826710 Washington Community Swim Center Capital Parks & Recreation Nathan Scribner James Stark 1124826730 Underground Overhead Utilities Capital Traffic & Transportation Richard Chen Jim Craig 815826790 Sunnyvale Avenue Median from Iowa to Washington Capital Downtown Jennifer Ng Brice Mc Queen 894826800 Downtown Wayfinding and Gateways Capital Downtown Richard Chen Andrew Miner 895826820 Town Center Traffic Signal Modifications Capital Downtown Jennifer Ng Carmen Talavera 896826850 Calabazas Creek Bridge at Old Mt. View-Alviso Rd Infrastructure Traffic & Transportation Jennifer Ng Carmen Talavera 816826890 Mathilda/237/101 Interchange Improvements Capital Traffic & Transportation Shahid Abbas Shahid Abbas 817826900 Washington Avenue/Mathilda Avenue Intersection Widening Capital Downtown Jennifer Ng Carmen Talavera 897827160 Sunnyvale Tennis Center Court Rehabilitation Infrastructure Parks & Recreation James Stark Rodney Wilson 1125827570 Downtown Parking District Major Maintenance Infrastructure Downtown Liliana Price Tony Pineda 898828030 Annual Slurry Seal of City Streets Infrastructure Traffic & Transportation Liliana Price Tony Pineda 818828290 Parks Parking Lot Rehabilitation Infrastructure Parks & Recreation Liliana Price Juan Barajas 1126828390 Sunken Gardens Golf Course Clubhouse Paving Infrastructure Parks & Recreation James Stark Rodney Wilson 1127828400 Golf Buildings Renovations Infrastructure Parks & Recreation Humza Javed Rodney Wilson 1128828420 Tennis Center Buildings Infrastructure Infrastructure Parks & Recreation James Stark Rodney Wilson 1129829140 Fire Station Electrical Systems and Roll Up Door Replacement Capital Administrative Facilities Marc Freitas Javier Lopez 1266829150 Swimming Pool Buildings Infrastructure Infrastructure Parks & Recreation Liliana Price Juan Barajas 1130829160 Golf Course Tree Trimming and Removal Special Parks & Recreation James Stark Rodney Wilson 1131829170 Sunken Gardens Driving Range Light Replacement Infrastructure Parks & Recreation James Stark Rodney Wilson 1132829190 Community Center Comprehensive Infrastructure Infrastructure Parks & Recreation Jennifer Ng Marc Freitas 1133829370 Safe Routes to School and Neighborhood Guided Bike Routes Capital Traffic & Transportation Richard Chen Shahid Abbas 819829400 Sidewalk, Curb and Gutter Replacement Infrastructure Traffic & Transportation Liliana Price Tony Pineda 820829440 Land Acquisition Due Diligence Infrastructure Parks & Recreation Jennifer Ng Arnold Chu 1134829690 Comprehensive School Traffic Study Special Gov. & Comm. Engagement Shahid Abbas Carol Shariat 1209829910 Mathilda Avenue/Maude Avenue Safety Improvements Infrastructure Traffic & Transportation Liliana Price Manuel Pineda 821830110 Sunnyvale-Saratoga Road Pedestrian Safety Signal Capital Traffic & Transportation Elizabeth Racca-Johnson Shahid Abbas 822830120 Pay Parking in Downtown Area Capital Traffic & Transportation Elizabeth Racca-Johnson Shahid Abbas 823830280 Sunnyvale Baylands Park Infrastructure Infrastructure Parks & Recreation Humza Javed Juan Barajas 1135830290 Braly Park Renovation and Enhancement Infrastructure Parks & Recreation Humza Javed Juan Barajas 1136830300 Cannery Park Renovation and Enhancement Infrastructure Parks & Recreation Humza Javed Juan Barajas 1137830310 Community Center Grounds Renovation and Enhancement Infrastructure Parks & Recreation Humza Javed Juan Barajas 1138830320 De Anza Park Renovation and Enhancement Infrastructure Parks & Recreation Humza Javed Juan Barajas 1139830330 Encinal Park Renovation and Enhancement Infrastructure Parks & Recreation Humza Javed Juan Barajas 1140830340 Fair Oaks Park Renovation and Enhancement Infrastructure Parks & Recreation Humza Javed Juan Barajas 1141830350 Fairwood Park Renovation and Enhancement Infrastructure Parks & Recreation Humza Javed Juan Barajas 1142830360 Greenwood Manor Park Renovation Infrastructure Parks & Recreation Humza Javed Juan Barajas 1143
782

Project No. Project Name Project Category Project Type Project Manager Project Coordinator Page #
City of SunnyvaleDepartmental Project Index
Funded and Unfunded Projects by Department
830380 Las Palmas Park Renovation and Enhancement Infrastructure Parks & Recreation Humza Javed Juan Barajas 1144830390 Murphy Park Renovation and Enhancement Infrastructure Parks & Recreation Humza Javed Juan Barajas 1145830400 Orchard Gardens Park Renovation and Enhancement Infrastructure Parks & Recreation Humza Javed Juan Barajas 1146830410 Ortega Park Renovation and Enhancement Infrastructure Parks & Recreation Humza Javed Juan Barajas 1147830420 Panama Park Renovation and Enhancement Infrastructure Parks & Recreation Humza Javed Juan Barajas 1148830430 Ponderosa Park Renovation and Enhancement Infrastructure Parks & Recreation Humza Javed Juan Barajas 1149830440 Raynor Park Renovation and Enhancement Infrastructure Parks & Recreation Humza Javed Juan Barajas 1150830450 San Antonio Park Renovation and Enhancement Infrastructure Parks & Recreation Humza Javed Juan Barajas 1151830460 Serra Park Renovation and Enhancement Infrastructure Parks & Recreation Humza Javed Juan Barajas 1152830470 Victory Village Park Renovation and Enhancement Infrastructure Parks & Recreation Humza Javed Juan Barajas 1153830480 Orchard Heritage Park Infrastructure Parks & Recreation Nathan Scribner Juan Barajas 1154830490 Fremont Pool Infrastructure Improvements Infrastructure Administrative Facilities Humza Javed Nancy Grove 1267830510 Plaza del Sol Phase II Capital Parks & Recreation Humza Javed Juan Barajas 1155830530 Capital Improvement Program Management System Special Gov. & Comm. Engagement Nasser Fakih Manuel Pineda 1214830560 Fremont Pool House Infrastructure Improvements Infrastructure Administrative Facilities Marc Freitas Humza Javed 1268830570 Fire Training Tower Structural Inspection Special Administrative Facilities Jim Craig Marc Freitas 1269830580 Emergency Generator Installation Infrastructure Administrative Facilities Richard Chen Marc Freitas 1270830590 Corporation Yard Site Feasibility and Modernization Plan Capital Administrative Facilities Humza Javed Marc Freitas 1271830600 Lakewood Branch Library Facility Capital Library Humza Javed Cynthia Bojorquez 1188830760 Mary Avenue Bicycle Lanes Capital Traffic & Transportation Thanh Nguyen Shahid Abbas 824830901 Transportation and Traffic Services Staff Augmentation (510) Special Traffic & Transportation Shahid Abbas Carol Shariat 825830970 Wolfe Road Corridor Traffic Improvement Study Special Traffic & Transportation Shahid Abbas Carol Shariat 826831110 Fair Oaks Ave Bike Lanes and Streetscape Capital Traffic & Transportation Thanh Nguyen Shahid Abbas 827831120 Maude Ave Streetscape Capital Traffic & Transportation Elizabeth Racca-Johnson Shahid Abbas 828831140 Safe Routes to School Pedestrian Safety Improvements Capital Traffic & Transportation Liliana Price Shahid Abbas 829831300 Tree Planting and Maintenance within the SNAIL Neighborhood Capital Parks & Recreation James Stark Leonard Dunn 1156831430 Fair Oaks Park Auxiliary Restroom/Parking Lot Grant Project Infrastructure Parks & Recreation Jennifer Ng Juan Barajas 1158831450 Public Works Development Engineering Staffing Special Gov. & Comm. Engagement Jennifer Ng Arnold Chu 1225831520 Preliminary Design of Golf Course Renovations Infrastructure Parks & Recreation Humza Javed Rodney Wilson 1159831570 Park Irrigation & Pump Systems Rehabilitation Infrastructure Parks & Recreation Humza Javed Juan Barajas 1160831580 ADA Projects and Emergency Concrete Replacement Infrastructure Traffic & Transportation Jim Craig Tony Pineda 830831590 Intelligent Transportation Systems Capital Traffic & Transportation Carmen Talavera Shahid Abbas 831831640 Library LED Pilot Project Capital Administrative Facilities Javier Lopez Steve Sloan 1274831650 ADA Transition Plan Capital Traffic & Transportation Carol Shariat Shahid Abbas 832831770 Illuminated Street Sign Replacement Project Infrastructure Traffic & Transportation Shahid Abbas Carmen Talavera 833831830 Lakewood Park Renovation and Enhancement Infrastructure Parks & Recreation Humza Javed James Stark 1162831850 Washington Park Renovation and Enhancement Infrastructure Parks & Recreation Humza Javed Juan Barajas 1163831860 John W. Christian Greenbelt Pathway Rehabilitation Infrastructure Parks & Recreation Thanh Nguyen Juan Barajas 1164
783

Project No. Project Name Project Category Project Type Project Manager Project Coordinator Page #
City of SunnyvaleDepartmental Project Index
Funded and Unfunded Projects by Department
831870 Preventive Maintenance for Various Bridges Capital Traffic & Transportation Humza Javed Jim Craig 834831910 E. Washington Ave and E. Evelyn Ave Park Design Capital Parks & Recreation Jennifer Ng James Stark 1166831920 Fair Oaks/Highway 237 Preliminary Park Design Capital Parks & Recreation Jennifer Ng James Stark 1167831990 Fair Oaks Housing Grant No. 2 and Skatepark Lighting Infrastructure Parks & Recreation Thanh Nguyen Juan Barajas 1168832000 East and West Channel Trail Construction Capital Traffic & Transportation Shahid Abbas Shahid Abbas 835832020 ADA Curb Retrofits (CDBG) Capital CDBG Liliana Price Suzanne Ise 1095832060 ITS - Advance Traffic Management System Capital Traffic & Transportation Shahid Abbas Carmen Talavera 836832070 LED Streetlights Conversion Project Infrastructure Traffic & Transportation Shahid Abbas Carmen Talavera 837832090 W Remington Dr and Michaelangelo Dr Intersection Improvement Capital Traffic & Transportation Thanh Nguyen Shahid Abbas 838832100 Intersection of Mathilda Avenue and Indio Way Capital Traffic & Transportation Liliana Price Shahid Abbas 839832130 Traffic Signal Timing Plans - Mathilda & Sunnyvale-Saratoga Capital Traffic & Transportation Carmen Talavera Shahid Abbas 840832140 Traffic Signal Timing Plans - Wolfe Road Capital Traffic & Transportation Carmen Talavera Shahid Abbas 841832150 Traffic Signal Timing Plans - Homestead Road Capital Traffic & Transportation Carmen Talavera Shahid Abbas 842832160 Eng. Services for Transportation Related Projects/Priorities Special Traffic & Transportation Manuel Pineda Shahid Abbas 843832170 RRFB on Henderson and Lily Avenues Capital Traffic & Transportation Carmen Talavera Shahid Abbas 844832180 Green Bike Lanes at Evelyn Avenue Capital Traffic & Transportation Carmen Talavera Shahid Abbas 845832280 Maintenance for City-owned Property at 1484 Kifer Road Special Administrative Facilities Manuel Pineda Ryan Sandoval 1275832320 Implementation of Green Bike Lanes Capital Traffic & Transportation Carol Shariat Shahid Abbas 846832330 Grade Separation Caltrain Crossings at Mary Ave. Study Issue Capital Traffic & Transportation Shahid Abbas Shahid Abbas 847832340 Vision Zero Plan - Study Issue Capital Traffic & Transportation Carol Shariat Shahid Abbas 848832440 Mary Avenue Overcrossing Environmental Impact Report Capital Traffic & Transportation Ria Lo Ria Lo 849832450 ATMS Upgrades - Data Collection and Display Enhancements Capital Traffic & Transportation Carmen Talavera Shahid Abbas 850832470 Raynor Park Trash Enclosure and Maintenance Building Infrastructure Parks & Recreation Jennifer Ng Arnold Chu 1170832500 Improvements at Mathilda and Maude - City Share Infrastructure Traffic & Transportation Jennifer Ng Arnold Chu 851832510 Traffic Signals Timing Plan - Fremont Avenue Capital Traffic & Transportation Carmen Talavera Shahid Abbas 852832520 Traffic Signals Timing Plan - Hollenbeck Avenue Capital Traffic & Transportation Carmen Talavera Shahid Abbas 853832530 Traffic Signals Timing Plan - Mary Avenue Capital Traffic & Transportation Carmen Talavera Shahid Abbas 854832540 Traffic Signals Timing Plan - Remington Drive Capital Traffic & Transportation Carmen Talavera Shahid Abbas 855832550 Sale of City Property - 1050 & 1060 Innovation Wy (Onizuka) Special Administrative Facilities Manuel Pineda Ryan Sandoval 1276832560 Sale of City Property - 1484 Kifer Road (Unilever) Special Administrative Facilities Manuel Pineda Ryan Sandoval 1277832590 Installation of Charging Stations for Electric Vehicles Capital Administrative Facilities Marc Freitas Jim Craig 1279832610 Fire Stations Exterior Window Upgrades Capital Administrative Facilities Marc Freitas Javier Lopez 1281832680 Library Plumbing Study Capital Library Marc Freitas Steve Sloan 1192832700 Library Program Space Capital Outside Group Funding Marc Freitas Steve Sloan 1106832710 Synthetic Turf Sports Field Capital Parks & Recreation Humza Javed Juan Barajas 1171832720 Washington Pool Infrastructure Replacement and Renovation Infrastructure Parks & Recreation Humza Javed Juan Barajas 1172832730 Renovate Median Landscaping to Low Maintenance Infrastructure Parks & Recreation Humza Javed Juan Barajas 1173832740 Upgrade Park Pathway Lighting to LED Infrastructure Parks & Recreation James Stark Juan Barajas 1174
784

Project No. Project Name Project Category Project Type Project Manager Project Coordinator Page #
City of SunnyvaleDepartmental Project Index
Funded and Unfunded Projects by Department
832750 City Maintained Tree Inventory Study Special Parks & Recreation James Stark Leonard Dunn 1175832760 Serra Park Spray Pool Renovation Infrastructure Parks & Recreation James Stark Juan Barajas 1176832770 De Anza Park Pathway Renovation Infrastructure Parks & Recreation Humza Javed Juan Barajas 1177832780 All Inclusive Playground Infrastructure Parks & Recreation Humza Javed James Stark 1178832790 Baylands Park Condition Assessment Study Special Parks & Recreation Humza Javed James Stark 1179832800 Performing Arts Center Infrastructure Infrastructure Parks & Recreation Jennifer Ng Marc Freitas 1180832810 Park Design Standards for Construction Special Parks & Recreation Jennifer Ng James Stark 1181832820 West Hill Renovation Park Project Capital Parks & Recreation Jennifer Ng James Stark 1182832870 Fire Station Master Plan Capital Public Safety Humza Javed Steven Drewniany 1085832880 Bicycle Master Plan Update Capital Traffic & Transportation Carol Shariat Shahid Abbas 856832890 Traffic Signal Specifications and Standard Details Capital Traffic & Transportation Carmen Talavera Shahid Abbas 857832900 Safe Routes to School and Pedestian Safety Opportunity Plan Capital Traffic & Transportation Carol Shariat Shahid Abbas 858832910 Bernardo Avenue Bicycle Undercrossing Environmental Analysis Capital Traffic & Transportation Shahid Abbas none 859832920 East Sunnyvale Area Transportation Improvements Capital Traffic & Transportation Jennifer Ng Shahid Abbas 860832930 Fair Oaks Avenue Bike Lanes and Streetscape - Phase 2 Capital Traffic & Transportation Jennifer Ng Shahid Abbas 861832940 Fremont Avenue Bikeway and Streetscape Improvements Capital Traffic & Transportation Jennifer Ng Shahid Abbas 862832950 Java Drive Road Diet and Bike Lanes Capital Traffic & Transportation Jennifer Ng Shahid Abbas 863832960 Lawrence Station Area Sidewalks and Bicyle Facilities Capital Traffic & Transportation Jennifer Ng Shahid Abbas 864832970 Peery Park Area Transportation Improvements Capital Traffic & Transportation Jennifer Ng Shahid Abbas 865832980 Sunnyvale Roadway Pavement Rehabilitation Capital Traffic & Transportation Jennifer Ng Jim Craig 866832990 Sunnyvale Traffic Signal Upgrades Capital Traffic & Transportation Jennifer Ng Shahid Abbas 867833000 Sunnyvale SNAIL Neighborhood Improvements - ATP Capital Traffic & Transportation Jennifer Ng Shahid Abbas 868833010 Bicycle and Pedestian Safety Improvements Capital Traffic & Transportation Jennifer Ng Shahid Abbas 869833020 Future Traffic Signal Construction (TIF) Capital Traffic & Transportation Jennifer Ng Shahid Abbas 870833030 Pavement Standards Infrastructure Traffic & Transportation Nathan Scribner Tony Pineda 871833610 Downtown Pedestrian Traffic Signal Systems Capital Downtown Jennifer Ng Carmen Talavera 901833630 Emergency Operations Center Design Capital Administrative Facilities Manuel Pineda none 1282Total Number of Public Works Funded Projects: 177
785

Project No. Project Name Project Category Project Type Project Manager Project Coordinator Page #
City of SunnyvaleDepartmental Project Index
Funded and Unfunded Projects by Department
Unfunded Projects802500 City Share of Development Costs - Streets Capital Traffic & Transportation Jennifer Ng Arnold Chu 873815901 Lawrence Expressway and Wildwood Ave. Realignment Capital Traffic & Transportation Shahid Abbas Manuel Pineda 874818651 Corporation Yard Buildings - Roofs Infrastructure Administrative Facilities Jennifer Ng Marc Freitas 1285823911 Bernardo Avenue Caltrain Undercrossing Capital Traffic & Transportation Jennifer Ng Shahid Abbas 875825560 Security Access Control System Replacement Infrastructure Administrative Facilities Nathan Scribner Marc Freitas 1286826570 Tasman/Fair Oaks Area Streetscape and Sense of Place Capital Traffic & Transportation Richard Chen Manuel Pineda 876829260 Mary Avenue Extension Capital Traffic & Transportation Nasser Fakih Manuel Pineda 877830640 Stevens Creek Trail Capital Traffic & Transportation Carmen Talavera Carla Ochoa 878900141 Future Traffic Calming Projects Capital Traffic & Transportation Shahid Abbas Shahid Abbas 879900316 Corporation Yard Facility Replacement Capital Administrative Facilities Humza Javed Jim Craig 1287900692 Calabazas Creek Trail Low Water Crossings Capital Traffic & Transportation Nasser Fakih Manuel Pineda 881900929 Light Emitting Diode (LED) Streetlight Retrofit Phase II Infrastructure Traffic & Transportation Richard Chen Manuel Pineda 882900931 Charles Street Bicycle Boulevard Capital Traffic & Transportation Nasser Fakih Manuel Pineda 883900933 Fair Oaks Junction Sense of Place Improvements Capital Traffic & Transportation Richard Chen Manuel Pineda 884900934 Java Drive/Fair Oaks Avenue Bike Lanes Capital Traffic & Transportation Manuel Pineda Judy Chu 885901103 Personal Electronic Tools for Work Order System Capital Gov. & Comm. Engagement Douglas Belcher Eddie Soliven 1247901195 Traffic Signals Replacement Capital Traffic & Transportation Carmen Talavera Shahid Abbas 886901206 Peery Park Sense of Place Capital Traffic & Transportation Jennifer Ng Arnold Chu 887901278 Wolfe Road Corridor Traffic Improvement Study Special Traffic & Transportation Shahid Abbas Carol Shariat 888Total Number of Public Works Unfunded Projects: 19
786

Traffic and Transportation

Traffic & TransportationA well planned and maintained transportation infrastructure is a
critical component for ensuring livable local communities, balancing housing and jobs, and supporting economic development. Sunnyvale has developed an excellent transportation infrastructure, but regional and local growth and the passage of time put continual strain on capacity and maintenance needs. The City has proactively conducted long range planning for traffic and transportation needs for a number of years and is actively involved in countywide planning efforts. Several long-range plans guide the development of the projects budget for the short and long term. These are: Valley Transportation Plan (VTP) 2040, Transportation Strategic Program, Downtown Specific Plan (2003), Bicycle Capital Improvement Program, 2007 Pedestrian Safety and Opportunities Study, Tasman/Fair Oaks Bicycle and Pedestrian Circulation Plan, Moffett Park Specific Plan, and Fair Oaks Junction Sense of Place Plan. Each of these plans identifies traffic and transportation projects that are important for a particular area, the City, and/or the region. These plans and a listing of their Sunnyvale transportation projects are detailed later in this section. These plans allow the City to undertake a coordinated traffic and transportation capital projects program and to position itself to compete strongly for outside specialized discretionary funding as it becomes available.
Major Projects
Fair Oaks Avenue Overhead Bridge Repair. The State of California Department of Transportation (CalTrans) rated the existing Fair Oaks Avenue Overhead bridge “structurally deficient” in 2004 during their biannual inspection. The rating is primarily due to severe deck cracking and spalling, inadequate sidewalk width, barrier railings, approach railing and lateral clearance to the columns. Funding for this project includes design and construction. Upon completion, the estimated life of the bridge will be 40 years. The design phase of this project and environmental studies began in FY 2012/13. Design is expected to be complete in 2017 and construction will begin in 2018.
The total project cost is budgeted at $22.8 million. A funding application for this project was submitted to CalTrans for Highway Bridge Program funds, which were received for the Preliminary Engineering phase. Additional applications to fund future phases of the project will be submitted to CalTrans. It is anticipated that 88% of the project cost will be covered by grant funding, with the remainder to be funded by reserves in the Infrastructure Fund.
Mathilda/237/101 Interchange Improvements. Work has begun on design of the reconstruction of the Mathilda Avenue interchanges with SR 237 and US 101. The objective is to provide for safe and efficient movement of traffic at one of the busiest and most complex roadway systems in the region. Necessary documents are being prepared, such as CalTrans submissions, environmental documents, and Plans, Specification, and Estimates. Design of the project has been funded by a $2 million grant from the Valley Transportation Authority, combined with a $2 million City match. The estimated construction cost is $36 million, out of which $8.25 million is planned to be funded by the City.
Pavement Rehabilitation and Annual Slurry Seal of City Streets. Each year the Department of Public Works Pavement Operations staff surveys one half of the City’s streets and inputs the data in the City’s pavement management system. The system produces a list of deteriorated streets and plans are made to repair, slurry seal, double chip seal, overlay, or reconstruct the streets as needed. A constant level of funding for pavement rehabilitation is budgeted in the Department of Public Works. The Annual Slurry Seal of City Streets project covers contract construction costs of slurry sealing a portion of the City’s streets each year. The Pavement Rehabilitation project budgets the additional funds needed in the years where more extensive rehabilitation work is required. Together these projects’ budgets total $94.6 million for the twenty-year plan.
City of Sunnyvale FY 2017/18 Adopted Budget and Resource Allocation Plan
787

Sidewalks, Curbs, and Gutters. The City maintains the vast majority of sidewalks, curbs and gutters throughout the City. This infrastructure is often pushed up or broken by street trees; as they grow over time, slowly damage sidewalks, curbs, and gutters with their roots. The budget includes two projects to address this issue, one to provide ongoing funding to repair damaged sidewalks, and the other to repair sidewalks which become out of compliance with the Americans for Disabilities Act. The two projects provide a combined $42.6 million over twenty years in funding for these repairs.
Grant Funded Transportation Improvement Projects. In FY 2016/17, the City was successful in securing $19.6 million in various grant funds, requiring $3.4 million in local match for transportation and traffic projects which included roadway safety, traffic signals, pedestrians and bicycle projects throughout the City.
Unfunded Projects
Unfunded projects fall into two primary categories. First, several projects are in the unfunded category until a funding source is identified. Many of these projects are strong candidates for outside grants. When a funding source is secured, the project will move into the funded status. Second, projects have been placed in the unfunded category if the timing of the project is dependent on actions from another agency. For example, the Bernardo Avenue Caltrain Undercrossing must be coordinated with the California High Speed Train project, and the funding sources for this project will be impacted by this coordination effort.
In addition to the unfunded projects, the eight long-range traffic and transportation plans each contain a list of specific projects. The project lists are included in the next section within the description of the specific long range plan. If a project has secured funding and is budgeted or completed, it is noted. For the remaining projects, they will move into the City’s projects budget when funding sources are secured. These project lists are updated annually to track the progress the City is making toward the long-range goals outlined in these plans. Some projects, particularly many of those in the VTP 2040, are not the responsibility of the City and therefore will not move into the City’s projects budget. However, staff will continue to monitor and update the project list as these projects are in Sunnyvale and will impact the City’s transportation infrastructure.
City of Sunnyvale FY 2017/18 Adopted Budget and Resource Allocation Plan
788

Traffic and Transportation Long-Range PlansThere are several Traffic & Transportation planning documents that will
inform capital projects over the next twenty years. As funding opportunities present themselves, individual projects will be brought before the Council for consideration and budget appropriation. Additionally, some projects are included in more than one of the planning documents listed below, as these planning documents often overlap in scope and purpose in the processes of long-range planning for the City. The eight planning documents are detailed below.
Valley Transportation Plan
The Valley Transportation Plan, or VTP, is the long-range vision for transportation in Santa Clara County. The Valley Transportation Authority (VTA), in its role as the Congestion Management Agency (CMA) for Santa Clara County, is responsible for preparing and periodically updating the VTP every 4-5 years on a cycle coinciding with the update of the Bay Area’s Regional Transportation Plan (RTP). The current plan is titled VTP 2040. VTP 2040 identifies major regional transportation programs and projects for Santa Clara County and present priorities for Federal and State transportation funding against funding constraints. Under guidelines by the Federal government, long-range transportation plans must be financially constrained. Constrained projected are those funded with projected revenues from sources that currently exist, such as sales tax measures, Federal flexible formula funds, or gas tax subventions, and sources that can be reasonably expected to be available during the life of the plan. Unconstrained projects are those that do not have fund sources identified. The plan also includes projects that do not meet the VTP criteria for constrained funding, but are considered to be improvements of regional significance. These are identified in the plan as unconstrained projects. Staff from cities in the County participate in the process of developing the Valley Transportation Plan and submit candidate projects for consideration for inclusion in the plan. Projects must appear in the VTP and RTP in order to be eligible for most federal, state, and regional funding. The City submits candidate projects which are subsequently ranked and determined to be constrained or unconstrained.
It should be noted that the VTP is intended solely as a planning and policy framework, and the projects identified for the City of Sunnyvale are not to be used as a programming document for which the City is responsible for carrying out.
Transportation Strategic Program
Initiated in 1998, the Transportation Strategic Program (TSP) provides the financial basis for the City’s current land use and transportation plan. It is updated every 5-6 years with the update of the Computerized Transportation Model, which upholds the fair valuation of the Transportation Impact Fee. Without adoption of a program and identification of funding for improvements, traffic congestion could negatively affect the City’s development, economy, neighborhoods, and environmental health, among other things.
The TSP supports land development potential envisioned by the General Plan Land Use and Transportation Element and was approved by Council November 11, 2003 (RTC 03-385). Key components of the Transportation Strategic Program effort were the establishment of a revenue mechanism to recognize the impact of new development on future forecast transportation deficiencies. Council approved the imposition of a two-tiered Transportation Impact Fee to address the transportation capacity needs for areas inside (north of Route 237) and outside the Moffett Industrial Park (south of Route 237), execution of a cost sharing agreement with the County of Santa Clara for County Expressway improvements, and pursuit of outside matching funding for certain transportation improvements. It should be noted that the timing of these projects is uncertain given that they are dependent on traffic congestion from the growth of the City; project timing will be reassessed periodically. The primary sources of funding will be grants and traffic impact fees.
The TSP and Traffic Impact Fees were updated and approved by City Council in December 2013. Funds from Traffic Impact Fees will be augmented in many cases by State or regional grant funds. The funded amount shown below is the amount of City Traffic Impact Fees currently allocated towards listed projects.
City of Sunnyvale FY 2017/18 Adopted Budget and Resource Allocation Plan
789
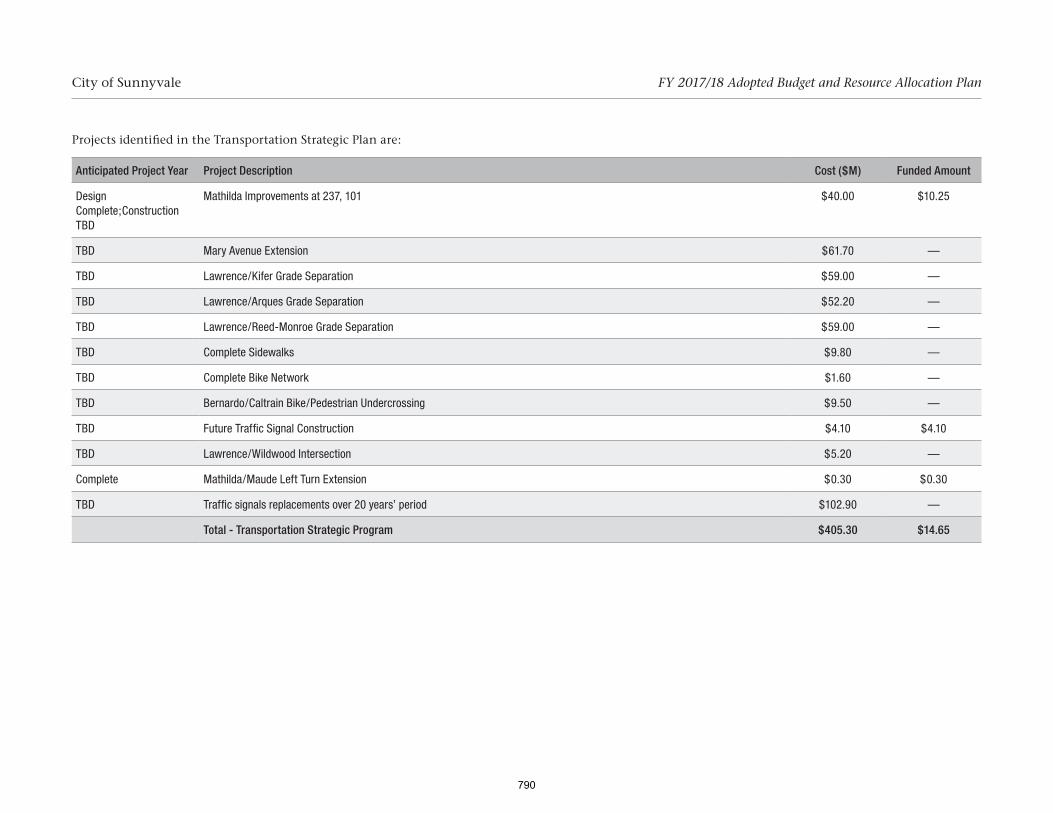
Projects identified in the Transportation Strategic Plan are:
Anticipated Project Year Project Description Cost ($M) Funded Amount
Design Complete;Construction TBD
Mathilda Improvements at 237, 101 $40.00 $10.25
TBD Mary Avenue Extension $61.70 —
TBD Lawrence/Kifer Grade Separation $59.00 —
TBD Lawrence/Arques Grade Separation $52.20 —
TBD Lawrence/Reed-Monroe Grade Separation $59.00 —
TBD Complete Sidewalks $9.80 —
TBD Complete Bike Network $1.60 —
TBD Bernardo/Caltrain Bike/Pedestrian Undercrossing $9.50 —
TBD Future Traffic Signal Construction $4.10 $4.10
TBD Lawrence/Wildwood Intersection $5.20 —
Complete Mathilda/Maude Left Turn Extension $0.30 $0.30
TBD Traffic signals replacements over 20 years’ period $102.90 —
Total - Transportation Strategic Program $405.30 $14.65
City of Sunnyvale FY 2017/18 Adopted Budget and Resource Allocation Plan
790

Downtown Specific Plan (2003)
The 2003 Downtown Specific Plan (DSP) is an update to the 1993 Downtown Specific Plan. A key component of the plan is traffic and transportation improvements. It builds on the General Plan land uses and heights, approved by Council in June 2003, and provides more specific direction about public and private improvements, including goals and policies, building design guidelines, and infrastructure improvements. The 2003 DSP was approved by Council on October 14, 2003 (RTC 03-358), and updated in 2013 along with Zoning Code updates to reflect permitted land uses and applicable development standards.
The DSP area comprises roughly 125 acres, generally bounded by Evelyn Avenue to the north, Bayview Ave to the east, El Camino Real to the south, and Charles St to the west. Its focus is on three goals: (1) Establishing a common vision for the downtown, (2) defining a unique market niche, and (3) creating the framework to link together current and future downtown projects into a vibrant, cohesive place.
It is expected that projects identified as part of the 2003 DSP will be a combination of grant funded and developer funded with the City’s share being 20%, and all projects being revenue dependent.
Transportation related projects identified in Downtown Specific Plan are:
Anticipated Project Year Project Description Cost ($M) Funded Amount
2024/25 Intersection Enhancements $0.5 —
Streetscape complete; 2024/25
Roadway Reconfiguration: Sunnyvale Ave reconfiguration between Evelyn and Iowa $6.1 $1.875
Complete Caltrain North Side Access $4.0 $0.09
Partially complete 2021/22
Traffic Signal Reconstruction and Upgrade to Downtown Streetscape Standards $2.1 —
2017/18 Town Center Traffic Signal Modifications $0.7 $0.7
2017/18 Sunnyvale Avenue Median from Iowa to Washington $0.8 $0.8
2017/18 Washington Avenue/Mathilda Avenue Intersection Widening $0.3 $0.3
TBD Downtown Neighborhood Traffic Mitigation Features $0.2 —
Total – Downtown Specific Plan $14.7 $3.77
City of Sunnyvale FY 2017/18 Adopted Budget and Resource Allocation Plan
791

Bicycle Capital Improvement Program
The Bicycle Capital Improvement Program (Bicycle CIP) was developed in order to meet the City’s goal of encouraging the use of alternative modes of transportation to the automobile in November 2000 and updated in 2006. The physical configuration of all major roadways in the City was assessed and actions needed to develop bike lanes on a street-segment basis were presented. The Bicycle CIP was approved by Council on August 8, 2006 (RTC 06-255), and is intended to be used as a guide, not an action plan.
It is expected that the projects identified as part of the Bicycle CIP will be grant funded with the City’s share being 20%, and all projects being revenue dependent. Furthermore, where the goals of the Bicycle CIP fit in with the VTP 2035 Bicycle Program and comply with its various regional, state, and federal rules for funding, the City will pursue these funds. These projects will improve the service level for bicyclists living and working in Sunnyvale.
The bicycle lane projects, by street, include but are not limited to the following:
Anticipated Project Year Project Description Cost ($M) Funded Amount
Complete Caribbean Drive — —
Complete Crossman Drive — —
Complete Borregas Avenue, Moffett Park Drive to Caribbean — —
Complete Borregas Avenue, Maude Avenue to Ahwanee — —
Complete Moffett Park Drive, Bordeaux to Caribbean — —
Complete Old Mountain View-Alviso Road — —
Complete Lawrence Station Road — —
Complete Persian Drive, Fair Oaks Way to Ross Drive — —
Complete Lakeside Drive — —
Complete Oakmead Parkway — —
Complete Stewart Drive — —
Complete DeGuine Drive — —
Complete Commercial Street, Arques Avenue to Central Expressway — —
Complete Arques Avenue, Fair Oaks to City Limit — —
City of Sunnyvale FY 2017/18 Adopted Budget and Resource Allocation Plan
792

Anticipated Project Year Project Description Cost ($M) Funded Amount
Complete Kifer Road, Fair Oaks to City Limit — —
Complete Wolfe Road, Arques Avenue to Fair Oaks Avenue — —
Complete Fair Oaks Avenue, Evelyn Avenue to Kifer Road — —
Complete Old San Francisco Road — —
Complete Sunnyvale Avenue, Evelyn to El Camino Real — —
Complete Sunnyvale-Saratoga Road, El Camino Real to Mathilda — —
Complete Manet Drive, Remington to Crescent — —
Complete Michaelangelo Drive, Remington to Community Center — —
Complete Remington Drive, Bernardo to Mary — —
Complete Evelyn Avenue — —
Complete Knickerbocker Drive, El Camino Real to Mango — —
Complete Hollenbeck Road, El Camino Real to Danforth — —
Complete Almanor Avenue, Mary to Vaqueros — —
Complete Maude Avenue, Mary to Pastoria — —
Complete Mary Avenue, Maude to Almanor — —
Complete Mary Avenue, Homestead to Cascade — —
Complete Hollenbeck Road, Alberta to Homestead — —
Complete Remington Dr., Mary to Tilton — —
Complete Mary Ave., Evelyn to Fremont $0.71 $0.71
Complete Wildwood Ave., Bridgewood to City limits — —
Complete Mathilda Ave., Washington to Maude — —
Complete Duane Ave., Fair Oaks to Lawrence
City of Sunnyvale FY 2017/18 Adopted Budget and Resource Allocation Plan
793

Anticipated Project Year Project Description Cost ($M) Funded Amount
Complete Fremont Ave., Hollenbeck to Saratoga-Sunnyvale
Complete El Camino Real, Sunnyvale to Fair Oaks
Complete Moffett Park Drive, Enterprise to Innovation
Complete Fair Oaks Ave., Fair Oaks to Tasman
Cancelled Pastoria, El Camino to Evelyn — —
2017/18 Bernardo Ave., El Camino Real to Evelyn $0.16 —
Complete Hendy Ave., Sunnyvale to Fair Oaks Bridge
2019/20 Tasman Dr., Fair Oaks to City Limits $0.30 —
2020/21 Bernardo Ave., Homestead to Fremont $0.13 —
2021/22 Belleville Way, Fremont to Homestead $0.12 —
2023/24 California, Mary to Fair Oaks $0.23 —
2024/25 Olive, Mathilda to Fair Oaks $0.02 —
2025/26 Lakewood/Sandia $0.02 —
2017/18 Fair Oaks, Awhanee to Old San Francisco $1.2 $1.2
2017/18 Maude, Mathilda to Wolfe $0.88 $0.88
2028/29 Del Rey $0.04 —
Total Bicycle Capital Improvement Program $3.81 $2.79
City of Sunnyvale FY 2017/18 Adopted Budget and Resource Allocation Plan
794

2007 Pedestrian Safety and Opportunities Study
The 2007 Pedestrian Safety and Opportunities Study (PedSOS) is a study issue that originated from the Bicycle and Pedestrian Advisory Commission and was supported by Council to study the state of pedestrian facilities on major public streets and identify opportunities for improvement. The PedSOS report characterizes and quantifies existing pedestrian activity and facilities in the City, concluding with the identification and prioritization of pedestrian improvements on major City streets. It also recommends enhancement projects in Pedestrian Opportunity District areas.
Council directed that projects identified in the PedSOS be revenue dependent. Proposed projects in the PedSOS can be funded by a variety of
local, regional, state, and federal sources, including: Congestion Mitigation and Air Quality Improvement Program (CMAQ), Surface Transportation Program (STP), Active Transportation Program (ATP) Community Based Transportation Planning (CBTP), Transportation Fund for Clean Air (TFCA), Transportation Development Act (TDA), Community Development Block Grant (CDBG), and Development Fees (such as the Transportation Impact Fee). The City has secured three Safe Routes to School grants and a Transportation Development Act (TDA) grant, an ATP grant, and CMAQ grants that funds a number of PedSOS improvements in the amount of $7.3 million. CDBG funds have also been allocated to construct accessible curb ramps where none currently exist.
Tasman/Fair Oaks Bicycle and Pedestrian Circulation Plan
The Tasman/Fair Oaks Bicycle and Pedestrian Circulation Plan was developed to complement a re-zoning of the area around the Fair Oaks light rail station to higher density residential from low-rise industrial. The City sought to encourage growth in the area to develop in a way that promotes the use of public transit and encourages bicycle and pedestrian activity. The Plan identifies a set of streetscape enhancements to apply to roads and paths in the area, including new sidewalks, wide sidewalks, specialized lighting,
enhanced intersection features for pedestrians, gateways and other features of interest, and a bike path along the East Channel. While most improvements would be provided by developers as properties redevelop, a Sense of Place fee was enacted to fund improvements in areas not subject to redevelopment like the East Channel Trail and areas where sidewalks are not anticipated to be provided by redevelopment. To date, most improvements are completed or in progress, with the exception of the East Channel Trail.
Anticipated Project Year Project Description Cost ($M) Funded Amount
Mostly complete Enhanced sidewalks and lighting – by developer
Mostly complete Tasman/Fair Oaks Streetscape and Sense of Place - by City $ 2.2 $ 2.2
TBD East Channel Trail $ 0.7 —
Total – Tasman/Fair Oaks Bicycle and Pedestrian Circulation Plan $2.9 $2.2
City of Sunnyvale FY 2017/18 Adopted Budget and Resource Allocation Plan
795
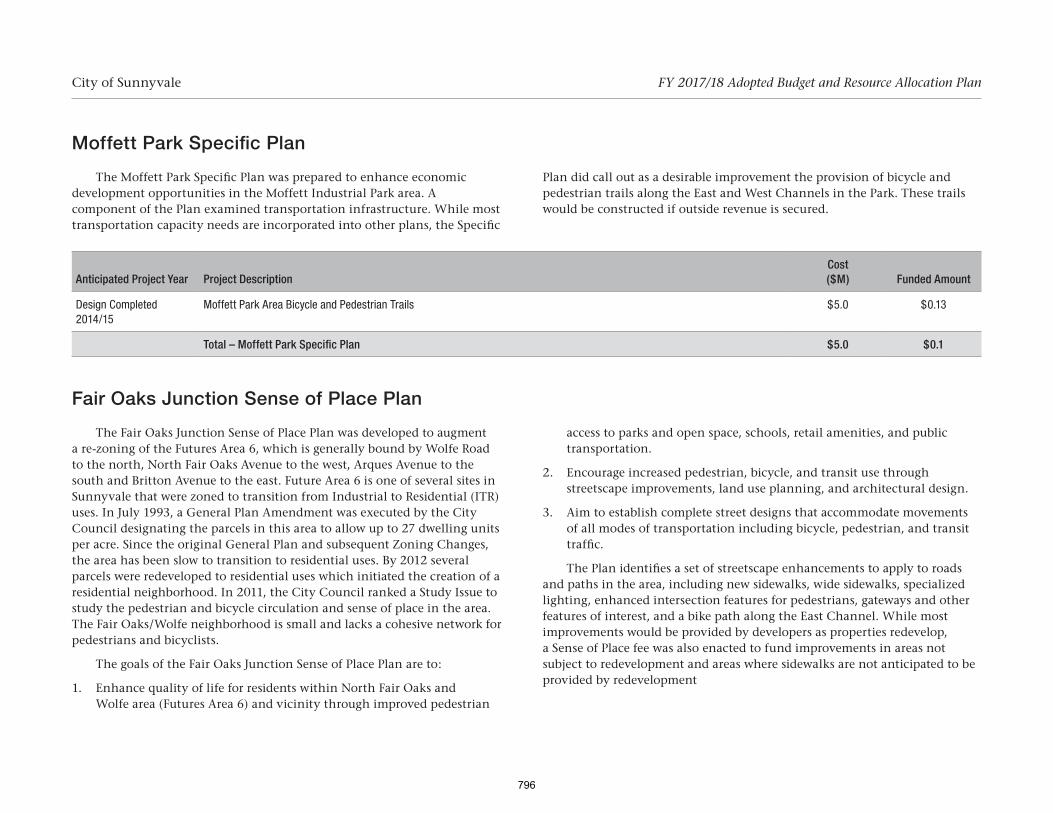
Moffett Park Specific Plan
The Moffett Park Specific Plan was prepared to enhance economic development opportunities in the Moffett Industrial Park area. A component of the Plan examined transportation infrastructure. While most transportation capacity needs are incorporated into other plans, the Specific
Plan did call out as a desirable improvement the provision of bicycle and pedestrian trails along the East and West Channels in the Park. These trails would be constructed if outside revenue is secured.
Anticipated Project Year Project DescriptionCost ($M) Funded Amount
Design Completed 2014/15
Moffett Park Area Bicycle and Pedestrian Trails $5.0 $0.13
Total – Moffett Park Specific Plan $5.0 $0.1
Fair Oaks Junction Sense of Place Plan
The Fair Oaks Junction Sense of Place Plan was developed to augment a re-zoning of the Futures Area 6, which is generally bound by Wolfe Road to the north, North Fair Oaks Avenue to the west, Arques Avenue to the south and Britton Avenue to the east. Future Area 6 is one of several sites in Sunnyvale that were zoned to transition from Industrial to Residential (ITR) uses. In July 1993, a General Plan Amendment was executed by the City Council designating the parcels in this area to allow up to 27 dwelling units per acre. Since the original General Plan and subsequent Zoning Changes, the area has been slow to transition to residential uses. By 2012 several parcels were redeveloped to residential uses which initiated the creation of a residential neighborhood. In 2011, the City Council ranked a Study Issue to study the pedestrian and bicycle circulation and sense of place in the area. The Fair Oaks/Wolfe neighborhood is small and lacks a cohesive network for pedestrians and bicyclists.
The goals of the Fair Oaks Junction Sense of Place Plan are to:
1. Enhance quality of life for residents within North Fair Oaks and Wolfe area (Futures Area 6) and vicinity through improved pedestrian
access to parks and open space, schools, retail amenities, and public transportation.
2. Encourage increased pedestrian, bicycle, and transit use through streetscape improvements, land use planning, and architectural design.
3. Aim to establish complete street designs that accommodate movements of all modes of transportation including bicycle, pedestrian, and transit traffic.
The Plan identifies a set of streetscape enhancements to apply to roads and paths in the area, including new sidewalks, wide sidewalks, specialized lighting, enhanced intersection features for pedestrians, gateways and other features of interest, and a bike path along the East Channel. While most improvements would be provided by developers as properties redevelop, a Sense of Place fee was also enacted to fund improvements in areas not subject to redevelopment and areas where sidewalks are not anticipated to be provided by redevelopment
City of Sunnyvale FY 2017/18 Adopted Budget and Resource Allocation Plan
796
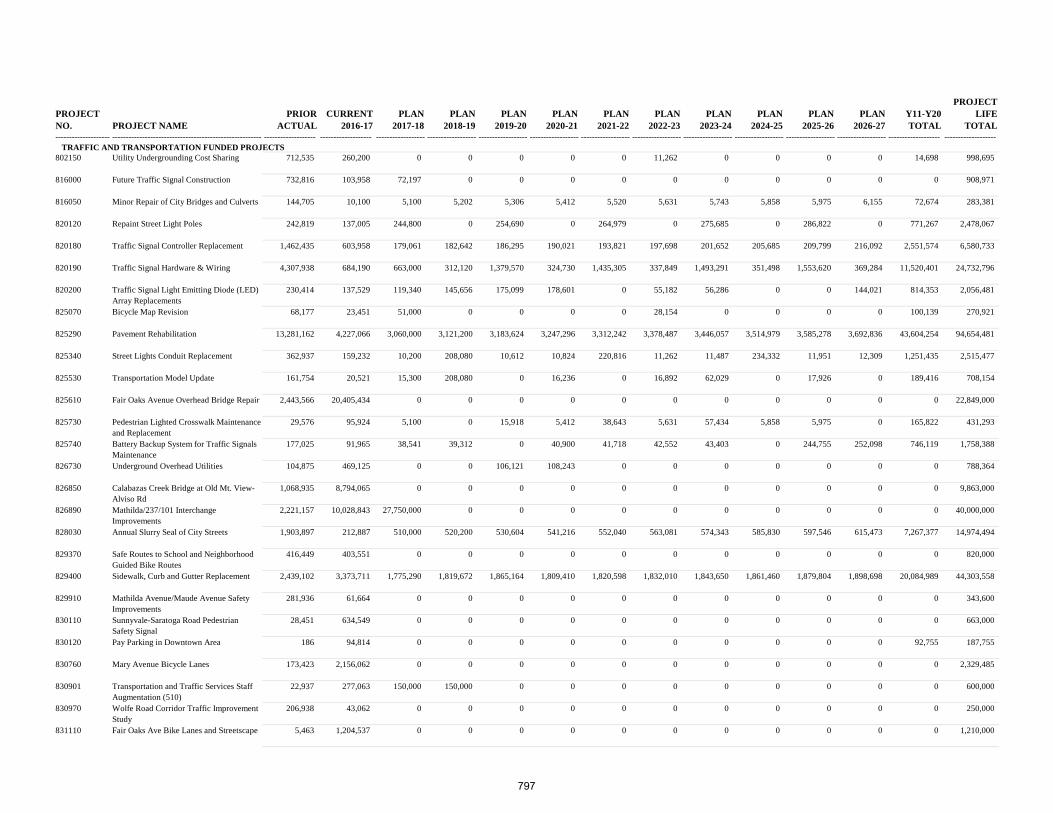
PROJECT NO. PROJECT NAME
PRIOR ACTUAL
CURRENT 2016-17
PLAN 2017-18
PLAN 2018-19
PLAN 2019-20
PLAN 2020-21
PLAN 2021-22
PLAN 2022-23
PLAN 2023-24
PLAN 2024-25
PLAN 2025-26
PLAN 2026-27
Y11-Y20 TOTAL
PROJECT LIFE
TOTAL-------------------- ------------------------------------------------------- ------------------- ------------------- ------------------ ------------------ ------------------ ------------------ ------------------ ------------------ ------------------ ------------------ ------------------ ------------------ ------------------- -------------------
TRAFFIC AND TRANSPORTATION FUNDED PROJECTS802150 Utility Undergrounding Cost Sharing 712,535 260,200 0 0 0 0 0 11,262 0 0 0 0 14,698 998,695
816000 Future Traffic Signal Construction 732,816 103,958 72,197 0 0 0 0 0 0 0 0 0 0 908,971
816050 Minor Repair of City Bridges and Culverts 144,705 10,100 5,100 5,202 5,306 5,412 5,520 5,631 5,743 5,858 5,975 6,155 72,674 283,381
820120 Repaint Street Light Poles 242,819 137,005 244,800 0 254,690 0 264,979 0 275,685 0 286,822 0 771,267 2,478,067
820180 Traffic Signal Controller Replacement 1,462,435 603,958 179,061 182,642 186,295 190,021 193,821 197,698 201,652 205,685 209,799 216,092 2,551,574 6,580,733
820190 Traffic Signal Hardware & Wiring 4,307,938 684,190 663,000 312,120 1,379,570 324,730 1,435,305 337,849 1,493,291 351,498 1,553,620 369,284 11,520,401 24,732,796
820200 Traffic Signal Light Emitting Diode (LED) Array Replacements
230,414 137,529 119,340 145,656 175,099 178,601 0 55,182 56,286 0 0 144,021 814,353 2,056,481
825070 Bicycle Map Revision 68,177 23,451 51,000 0 0 0 0 28,154 0 0 0 0 100,139 270,921
825290 Pavement Rehabilitation 13,281,162 4,227,066 3,060,000 3,121,200 3,183,624 3,247,296 3,312,242 3,378,487 3,446,057 3,514,979 3,585,278 3,692,836 43,604,254 94,654,481
825340 Street Lights Conduit Replacement 362,937 159,232 10,200 208,080 10,612 10,824 220,816 11,262 11,487 234,332 11,951 12,309 1,251,435 2,515,477
825530 Transportation Model Update 161,754 20,521 15,300 208,080 0 16,236 0 16,892 62,029 0 17,926 0 189,416 708,154
825610 Fair Oaks Avenue Overhead Bridge Repair 2,443,566 20,405,434 0 0 0 0 0 0 0 0 0 0 0 22,849,000
825730 Pedestrian Lighted Crosswalk Maintenance and Replacement
29,576 95,924 5,100 0 15,918 5,412 38,643 5,631 57,434 5,858 5,975 0 165,822 431,293
825740 Battery Backup System for Traffic Signals Maintenance
177,025 91,965 38,541 39,312 0 40,900 41,718 42,552 43,403 0 244,755 252,098 746,119 1,758,388
826730 Underground Overhead Utilities 104,875 469,125 0 0 106,121 108,243 0 0 0 0 0 0 0 788,364
826850 Calabazas Creek Bridge at Old Mt. View-Alviso Rd
1,068,935 8,794,065 0 0 0 0 0 0 0 0 0 0 0 9,863,000
826890 Mathilda/237/101 Interchange Improvements
2,221,157 10,028,843 27,750,000 0 0 0 0 0 0 0 0 0 0 40,000,000
828030 Annual Slurry Seal of City Streets 1,903,897 212,887 510,000 520,200 530,604 541,216 552,040 563,081 574,343 585,830 597,546 615,473 7,267,377 14,974,494
829370 Safe Routes to School and Neighborhood Guided Bike Routes
416,449 403,551 0 0 0 0 0 0 0 0 0 0 0 820,000
829400 Sidewalk, Curb and Gutter Replacement 2,439,102 3,373,711 1,775,290 1,819,672 1,865,164 1,809,410 1,820,598 1,832,010 1,843,650 1,861,460 1,879,804 1,898,698 20,084,989 44,303,558
829910 Mathilda Avenue/Maude Avenue Safety Improvements
281,936 61,664 0 0 0 0 0 0 0 0 0 0 0 343,600
830110 Sunnyvale-Saratoga Road Pedestrian Safety Signal
28,451 634,549 0 0 0 0 0 0 0 0 0 0 0 663,000
830120 Pay Parking in Downtown Area 186 94,814 0 0 0 0 0 0 0 0 0 0 92,755 187,755
830760 Mary Avenue Bicycle Lanes 173,423 2,156,062 0 0 0 0 0 0 0 0 0 0 0 2,329,485
830901 Transportation and Traffic Services Staff Augmentation (510)
22,937 277,063 150,000 150,000 0 0 0 0 0 0 0 0 0 600,000
830970 Wolfe Road Corridor Traffic Improvement Study
206,938 43,062 0 0 0 0 0 0 0 0 0 0 0 250,000
831110 Fair Oaks Ave Bike Lanes and Streetscape 5,463 1,204,537 0 0 0 0 0 0 0 0 0 0 0 1,210,000
797

PROJECT NO. PROJECT NAME
PRIOR ACTUAL
CURRENT 2016-17
PLAN 2017-18
PLAN 2018-19
PLAN 2019-20
PLAN 2020-21
PLAN 2021-22
PLAN 2022-23
PLAN 2023-24
PLAN 2024-25
PLAN 2025-26
PLAN 2026-27
Y11-Y20 TOTAL
PROJECT LIFE
TOTAL-------------------- ------------------------------------------------------- ------------------- ------------------- ------------------ ------------------ ------------------ ------------------ ------------------ ------------------ ------------------ ------------------ ------------------ ------------------ ------------------- -------------------831120 Maude Ave Streetscape 49,161 940,839 0 0 0 0 0 0 0 0 0 0 0 990,000
831140 Safe Routes to School Pedestrian Safety Improvements
181,327 1,760,523 0 0 0 0 0 0 0 0 0 0 0 1,941,850
831580 ADA Projects and Emergency Concrete Replacement
0 151,500 76,500 78,030 79,591 81,182 82,806 84,462 86,151 87,874 89,632 92,321 1,090,107 2,080,156
831590 Intelligent Transportation Systems 0 100,000 306,000 0 0 0 0 0 0 0 0 0 0 406,000
831650 ADA Transition Plan 38,036 261,964 0 0 0 0 0 0 0 0 0 0 0 300,000
831770 Illuminated Street Sign Replacement Project
0 129,280 65,280 66,586 67,917 0 0 0 0 0 76,486 78,781 250,808 735,138
831870 Preventive Maintenance for Various Bridges
0 76,500 255,000 0 0 0 0 0 0 0 0 0 0 331,500
832000 East and West Channel Trail Construction 0 500,000 0 0 0 0 0 0 0 0 0 0 0 500,000
832060 ITS - Advance Traffic Management System 0 570,435 0 0 0 0 0 0 0 0 0 0 0 570,435
832070 LED Streetlights Conversion Project 0 2,300,000 0 0 0 0 0 0 0 0 0 0 0 2,300,000
832090 W Remington Dr and Michaelangelo Dr Intersection Improvement
1 214,699 0 0 0 0 0 0 0 0 0 0 0 214,700
832100 Intersection of Mathilda Avenue and Indio Way
4 869,996 300,000 0 0 0 0 0 0 0 0 0 0 1,170,000
832130 Traffic Signal Timing Plans - Mathilda & Sunnyvale-Saratoga
0 163,035 0 0 0 0 0 0 0 0 0 0 0 163,035
832140 Traffic Signal Timing Plans - Wolfe Road 0 100,000 0 0 0 0 0 0 0 0 0 0 0 100,000
832150 Traffic Signal Timing Plans - Homestead Road
0 106,013 0 0 0 0 0 0 0 0 0 0 0 106,013
832160 Eng. Services for Transportation Related Projects/Priorities
0 440,000 440,000 440,000 0 0 0 0 0 0 0 0 0 1,320,000
832170 RRFB on Henderson and Lily Avenues 0 45,243 0 0 0 0 0 0 0 0 0 0 0 45,243
832180 Green Bike Lanes at Evelyn Avenue 0 95,975 0 0 0 0 0 0 0 0 0 0 0 95,975
832320 Implementation of Green Bike Lanes 0 0 250,000 0 0 0 0 0 0 0 0 0 0 250,000
832330 Grade Separation Caltrain Crossings at Mary Ave. Study Issue
0 729,794 0 0 0 0 0 0 0 0 0 0 0 729,794
832340 Vision Zero Plan - Study Issue 0 183,476 0 0 0 0 0 0 0 0 0 0 0 183,476
832440 Mary Avenue Overcrossing Environmental Impact Report
0 686,125 0 0 0 0 0 0 0 0 0 0 0 686,125
832450 ATMS Upgrades - Data Collection and Display Enhancements
0 500,000 0 0 0 0 0 0 0 0 0 0 0 500,000
832500 Improvements at Mathilda and Maude - City Share
0 49,556 0 0 0 0 0 0 0 0 0 0 0 49,556
832510 Traffic Signals Timing Plan - Fremont Avenue
0 0 55,321 0 0 0 0 0 0 0 0 0 0 55,321
832520 Traffic Signals Timing Plan - Hollenbeck Avenue
0 0 59,869 0 0 0 0 0 0 0 0 0 0 59,869
832530 Traffic Signals Timing Plan - Mary Avenue 0 0 98,724 0 0 0 0 0 0 0 0 0 0 98,724
832540 Traffic Signals Timing Plan - Remington Drive
0 0 38,897 0 0 0 0 0 0 0 0 0 0 38,897
798

PROJECT NO. PROJECT NAME
PRIOR ACTUAL
CURRENT 2016-17
PLAN 2017-18
PLAN 2018-19
PLAN 2019-20
PLAN 2020-21
PLAN 2021-22
PLAN 2022-23
PLAN 2023-24
PLAN 2024-25
PLAN 2025-26
PLAN 2026-27
Y11-Y20 TOTAL
PROJECT LIFE
TOTAL-------------------- ------------------------------------------------------- ------------------- ------------------- ------------------ ------------------ ------------------ ------------------ ------------------ ------------------ ------------------ ------------------ ------------------ ------------------ ------------------- -------------------832880 Bicycle Master Plan Update 0 0 350,000 0 0 0 0 0 0 0 0 0 0 350,000
832890 Traffic Signal Specifications and Standard Details
0 0 0 70,000 0 0 0 0 0 0 0 0 0 70,000
832900 Safe Routes to School and Pedestian Safety Opportunity Plan
0 0 0 300,000 0 0 0 0 0 0 0 0 0 300,000
832910 Bernardo Avenue Bicycle Undercrossing Environmental Analysis
0 0 632,911 0 0 0 0 0 0 0 0 0 0 632,911
832920 East Sunnyvale Area Transportation Improvements
0 0 3,857,500 0 0 0 0 0 0 0 0 0 0 3,857,500
832930 Fair Oaks Avenue Bike Lanes and Streetscape - Phase 2
0 0 990,500 0 0 0 0 0 0 0 0 0 0 990,500
832940 Fremont Avenue Bikeway and Streetscape Improvements
0 0 1,575,000 0 0 0 0 0 0 0 0 0 0 1,575,000
832950 Java Drive Road Diet and Bike Lanes 0 0 632,911 0 0 0 0 0 0 0 0 0 0 632,911
832960 Lawrence Station Area Sidewalks and Bicyle Facilities
0 0 632,911 0 0 0 0 0 0 0 0 0 0 632,911
832970 Peery Park Area Transportation Improvements
0 0 3,400,000 0 0 0 0 0 0 0 0 0 0 3,400,000
832980 Sunnyvale Roadway Pavement Rehabilitation
0 0 1,183,600 0 0 0 0 0 0 0 0 0 0 1,183,600
832990 Sunnyvale Traffic Signal Upgrades 0 0 1,714,853 0 0 0 0 0 0 0 0 0 0 1,714,853
833000 Sunnyvale SNAIL Neighborhood Improvements - ATP
0 0 6,059,100 0 0 0 0 0 0 0 0 0 0 6,059,100
833010 Bicycle and Pedestian Safety Improvements
0 0 400,000 0 0 0 0 0 0 0 0 0 0 400,000
833020 Future Traffic Signal Construction (TIF) 0 0 0 156,060 689,785 0 0 0 172,303 761,579 0 0 2,310,840 4,090,567
833030 Pavement Standards 0 0 0 0 50,000 0 0 0 0 0 0 0 0 50,000
------------------- ------------------- ------------------ ------------------ ------------------ ------------------ ------------------ ------------------ ------------------ ------------------ ------------------ ------------------ ------------------- -------------------TRAFFIC AND TRANSPORTATION FUNDED PROJECTS 33,500,137 65,689,419 58,023,806 7,822,840 8,600,296 6,559,483 7,968,488 6,570,153 8,329,514 7,614,953 8,565,569 7,378,068 92,899,028 319,521,754
------------------- ------------------- ------------------ ------------------ ------------------ ------------------ ------------------ ------------------ ------------------ ------------------ ------------------ ------------------ ------------------- -------------------
799
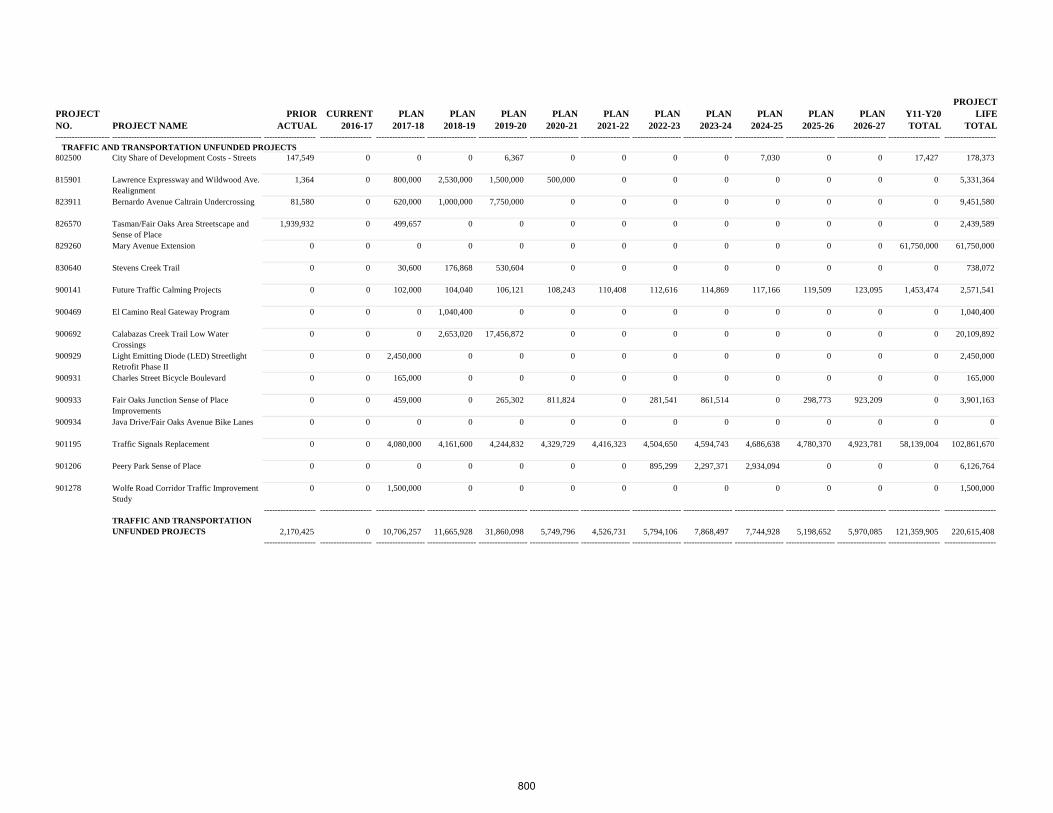
PROJECT NO. PROJECT NAME
PRIOR ACTUAL
CURRENT 2016-17
PLAN 2017-18
PLAN 2018-19
PLAN 2019-20
PLAN 2020-21
PLAN 2021-22
PLAN 2022-23
PLAN 2023-24
PLAN 2024-25
PLAN 2025-26
PLAN 2026-27
Y11-Y20 TOTAL
PROJECT LIFE
TOTAL-------------------- ------------------------------------------------------- ------------------- ------------------- ------------------ ------------------ ------------------ ------------------ ------------------ ------------------ ------------------ ------------------ ------------------ ------------------ ------------------- -------------------
TRAFFIC AND TRANSPORTATION UNFUNDED PROJECTS802500 City Share of Development Costs - Streets 147,549 0 0 0 6,367 0 0 0 0 7,030 0 0 17,427 178,373
815901 Lawrence Expressway and Wildwood Ave. Realignment
1,364 0 800,000 2,530,000 1,500,000 500,000 0 0 0 0 0 0 0 5,331,364
823911 Bernardo Avenue Caltrain Undercrossing 81,580 0 620,000 1,000,000 7,750,000 0 0 0 0 0 0 0 0 9,451,580
826570 Tasman/Fair Oaks Area Streetscape and Sense of Place
1,939,932 0 499,657 0 0 0 0 0 0 0 0 0 0 2,439,589
829260 Mary Avenue Extension 0 0 0 0 0 0 0 0 0 0 0 0 61,750,000 61,750,000
830640 Stevens Creek Trail 0 0 30,600 176,868 530,604 0 0 0 0 0 0 0 0 738,072
900141 Future Traffic Calming Projects 0 0 102,000 104,040 106,121 108,243 110,408 112,616 114,869 117,166 119,509 123,095 1,453,474 2,571,541
900469 El Camino Real Gateway Program 0 0 0 1,040,400 0 0 0 0 0 0 0 0 0 1,040,400
900692 Calabazas Creek Trail Low Water Crossings
0 0 0 2,653,020 17,456,872 0 0 0 0 0 0 0 0 20,109,892
900929 Light Emitting Diode (LED) Streetlight Retrofit Phase II
0 0 2,450,000 0 0 0 0 0 0 0 0 0 0 2,450,000
900931 Charles Street Bicycle Boulevard 0 0 165,000 0 0 0 0 0 0 0 0 0 0 165,000
900933 Fair Oaks Junction Sense of Place Improvements
0 0 459,000 0 265,302 811,824 0 281,541 861,514 0 298,773 923,209 0 3,901,163
900934 Java Drive/Fair Oaks Avenue Bike Lanes 0 0 0 0 0 0 0 0 0 0 0 0 0 0
901195 Traffic Signals Replacement 0 0 4,080,000 4,161,600 4,244,832 4,329,729 4,416,323 4,504,650 4,594,743 4,686,638 4,780,370 4,923,781 58,139,004 102,861,670
901206 Peery Park Sense of Place 0 0 0 0 0 0 0 895,299 2,297,371 2,934,094 0 0 0 6,126,764
901278 Wolfe Road Corridor Traffic Improvement Study
0 0 1,500,000 0 0 0 0 0 0 0 0 0 0 1,500,000
------------------- ------------------- ------------------ ------------------ ------------------ ------------------ ------------------ ------------------ ------------------ ------------------ ------------------ ------------------ ------------------- -------------------TRAFFIC AND TRANSPORTATION UNFUNDED PROJECTS 2,170,425 0 10,706,257 11,665,928 31,860,098 5,749,796 4,526,731 5,794,106 7,868,497 7,744,928 5,198,652 5,970,085 121,359,905 220,615,408
------------------- ------------------- ------------------ ------------------ ------------------ ------------------ ------------------ ------------------ ------------------ ------------------ ------------------ ------------------ ------------------- -------------------
800
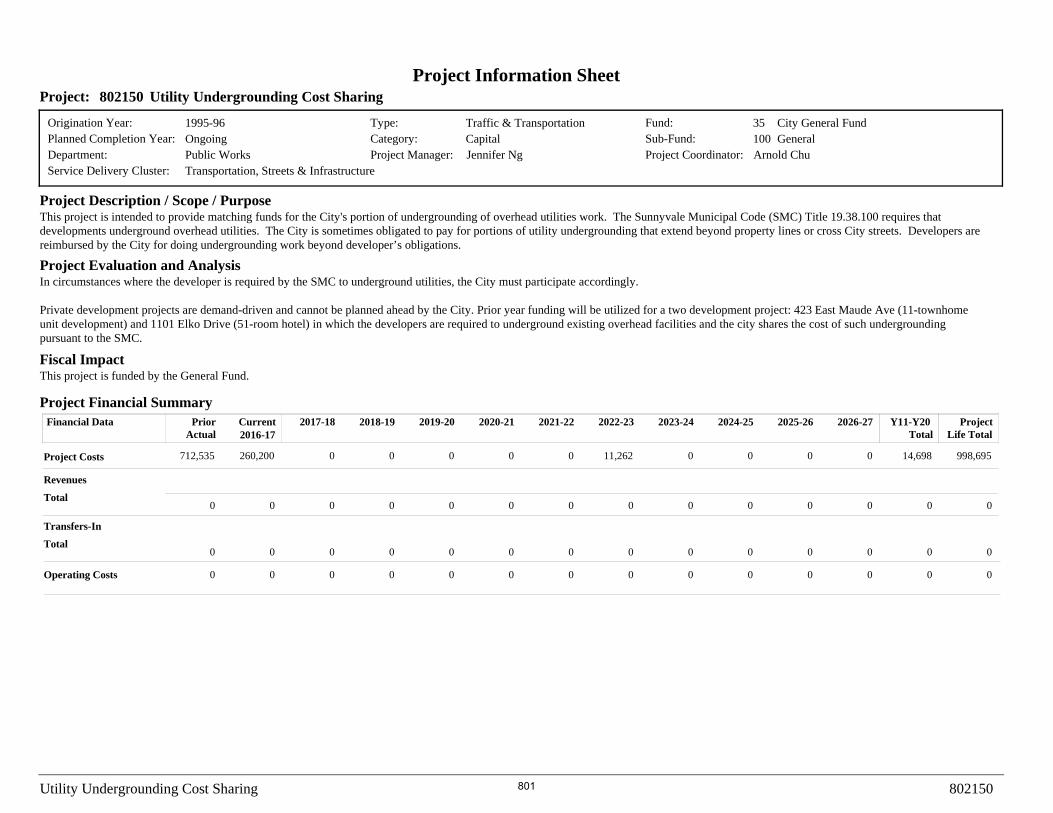
Project Information Sheet802150Project: Utility Undergrounding Cost Sharing
Origination Year: 1995-96Ongoing
Type: Traffic & TransportationCategory: Capital
Project Coordinator: Arnold ChuDepartment: Public WorksPlanned Completion Year:
Fund: City General Fund35Sub-Fund: General100
This project is intended to provide matching funds for the City's portion of undergrounding of overhead utilities work. The Sunnyvale Municipal Code (SMC) Title 19.38.100 requires that developments underground overhead utilities. The City is sometimes obligated to pay for portions of utility undergrounding that extend beyond property lines or cross City streets. Developers are reimbursed by the City for doing undergrounding work beyond developer’s obligations.
In circumstances where the developer is required by the SMC to underground utilities, the City must participate accordingly.
Private development projects are demand-driven and cannot be planned ahead by the City. Prior year funding will be utilized for a two development project: 423 East Maude Ave (11-townhome unit development) and 1101 Elko Drive (51-room hotel) in which the developers are required to underground existing overhead facilities and the city shares the cost of such undergrounding pursuant to the SMC.
This project is funded by the General Fund.
Project Description / Scope / Purpose
Project Financial SummaryFinancial Data Prior
ActualCurrent 2017-18 2018-19 2019-20 2020-21 2021-22 2022-23 2023-24 2024-25 2025-26 2026-27 Y11-Y20
TotalProject
Life Total
Project Costs
Operating Costs
Total
Total
Project Evaluation and Analysis
Fiscal Impact
Revenues
Transfers-In
2016-17
Project Manager: Jennifer NgTransportation, Streets & InfrastructureService Delivery Cluster:
712,535 260,200 0 0 0 0 0 11,262 0 0 0 14,698 998,6950
0 0 0 0 0 0 0 0 0 0 0 0 00
0 0 0 0 0 0 0 0 0 0 0 0 00
0 0 0 0 0 0 0 0 0 0 0 0 00
Utility Undergrounding Cost Sharing 802150
801

Project Information Sheet816000Project: Future Traffic Signal Construction
Origination Year: 1995-962017-18
Type: Traffic & TransportationCategory: Capital
Project Coordinator: Shahid AbbasDepartment: Public WorksPlanned Completion Year:
Fund: Capital Projects385Sub-Fund: Traffic Mitigation Projects950
This project provides funding for traffic signal construction and modification. This project involves installing new traffic signals and traffic signal communications. The locations of these signal improvements are often determined by safety and operational analysis of the intersections, community input or by changes in traffic conditions.
This project allows the City to respond more quickly and efficiently to address the traffic signal needs, and safety concerns. The budget amounts in FY 2018/19 and FY 2019/20 are for the design and construction of a new signal at the Fair Oaks Park entrance. This work may be constructed by developers and reimbursed by the City. Operating costs are for signal electricity and maintenance.
This project is funded by Cumulative Traffic Mitigation Fees.
Project Description / Scope / Purpose
Project Financial SummaryFinancial Data Prior
ActualCurrent 2017-18 2018-19 2019-20 2020-21 2021-22 2022-23 2023-24 2024-25 2025-26 2026-27 Y11-Y20
TotalProject
Life Total
Project Costs
Operating Costs
Total
Total
Project Evaluation and Analysis
Fiscal Impact
Revenues
Transfers-In
2016-17
Project Manager: Jennifer NgTransportation, Streets & InfrastructureService Delivery Cluster:
732,816 103,958 72,197 0 0 0 0 0 0 0 0 0 908,9710
0 0 0 0 0 0 0 0 0 0 0 0 00
11,535 0 0 0 0 0 0 0 0 0 0 0 11,5350
0 0 0 0 0 0 0 0 0 0 0 0 00
Future Traffic Signal Construction 816000
802

Project Information Sheet816050Project: Minor Repair of City Bridges and Culverts
Origination Year: 1995-96Ongoing
Type: Traffic & TransportationCategory: Infrastructure
Project Coordinator: Tony PinedaDepartment: Public WorksPlanned Completion Year:
Fund: Gas Tax Street Improvement280Sub-Fund: n.a.
This project provides funds to complete minor repairs to City-owned bridges and culverts inspected biannually by the California Department of Transportation (Caltrans). There are 99 bridges and box culverts in the City of Sunnyvale. Caltrans inspects some of the bridges every two years and submits a report to the City with recommendations for repairs. Once a bridge is inspected, it will not be inspected again for two years, and not all the bridges are covered at one time. The inspections are conducted by Caltrans from time to time, and reports are submitted accordingly. This project provides funds for minor repairs that will need to be performed by a qualified contractor. Funds are also needed to prepare the backup for funding applications that are submitted when major work is involved.
The minor work performed with this project is necessary to maintain the serviceability of our bridges. The repairs are needed to stop further deterioration and avoid hazardous conditions. These funds are utilized for only minor repairs. In case of major repairs, outside funding is explored.
This project is funded by the Gas Tax Fund.
Project Description / Scope / Purpose
Project Financial SummaryFinancial Data Prior
ActualCurrent 2017-18 2018-19 2019-20 2020-21 2021-22 2022-23 2023-24 2024-25 2025-26 2026-27 Y11-Y20
TotalProject
Life Total
Project Costs
Operating Costs
Total
Total
Project Evaluation and Analysis
Fiscal Impact
Revenues
Transfers-In
2016-17
Project Manager: Jim CraigTransportation, Streets & InfrastructureService Delivery Cluster:
144,705 10,100 5,100 5,202 5,306 5,412 5,520 5,631 5,743 5,858 5,975 72,674 283,3816,155
0 0 0 0 0 0 0 0 0 0 0 0 00
0 0 0 0 0 0 0 0 0 0 0 0 00
0 0 0 0 0 0 0 0 0 0 0 0 00
Minor Repair of City Bridges and Culverts 816050
803

Project Information Sheet820120Project: Repaint Street Light Poles
Origination Year: 1997-98Ongoing
Type: Traffic & TransportationCategory: Infrastructure
Project Coordinator: Tony PinedaDepartment: Public WorksPlanned Completion Year:
Fund: Infrastructure Renov & Replace610Sub-Fund: General Fund Assets100
Many of the City’s 2,300 fluted streetlight poles are showing significant wear and tear. This project will provide funds to repaint the poles to prevent further corrosion and deterioration. Repainting will be done by outside contract. The first 410 poles were painted in FY 2014/15 and FY 2015/16. Current funding will allow approximately one-fifth of the remaining poles to be painted bi-annually. Poles will be monitored and evaluated for repainting as needed, with an expectation that painting should be approximately every 20 years.
This project will preserve the City’s investment in its street lighting infrastructure by protecting light poles against corrosion. This will also present a good public image as an economic center. Failure to protect this infrastructure investment can add to blight and become a public relations issue.
This project is funded by the Gas Tax Fund. Each pole costs approximately $600 to repaint. No additional operating costs are required.
Project Description / Scope / Purpose
Project Financial SummaryFinancial Data Prior
ActualCurrent 2017-18 2018-19 2019-20 2020-21 2021-22 2022-23 2023-24 2024-25 2025-26 2026-27 Y11-Y20
TotalProject
Life Total
Project Costs
Operating Costs
Total
Total
Project Evaluation and Analysis
Fiscal Impact
Revenues
Transfers-In
2016-17
Project Manager: Liliana PriceTransportation, Streets & InfrastructureService Delivery Cluster:
242,819 137,005 244,800 0 254,690 0 264,979 0 275,685 0 286,822 771,267 2,478,0670
0 0 0 0 0 0 0 0 0 0 0 0 00
0 0 0 0 0 0 0 0 0 0 0 0 00
242,819 137,005 244,800 0 254,690 0 264,979 0 275,685 0 286,822 771,267 2,478,0670
244,800 0 254,690 0 264,979 0 275,685 0 286,822 0Gas Tax Fund 771,267
Repaint Street Light Poles 820120
804

Project Information Sheet820180Project: Traffic Signal Controller Replacement
Origination Year: 1998-99Ongoing
Type: Traffic & TransportationCategory: Infrastructure
Project Coordinator: Shahid AbbasDepartment: Public WorksPlanned Completion Year:
Fund: Infrastructure Renov & Replace610Sub-Fund: General Fund Assets100
This project provides for the replacement of traffic signal controllers, traffic signal controller software, cabinets, communication equipment, monitoring devices, and other components at approximately 15-20 year intervals due to obsolescence or changes in functionality. This project improves traffic flow at intersections and increases the reliability of the City's signal control equipment, and also improves the safety at the intersections. The City has a total of 132 traffic signals. The replacement costs of the above equipment varies depending on the location of the traffic signal. The replacement schedule is based on years of service, date of last upgrade, or as needed due to wear and tear. These computer-based controllers, software and other major control components deteriorate and are outdated with time and replacement parts become difficult to find as the equipment is phased out by the manufacturer. Costs are budgeted on a specific replacement schedule. Currently, staff is working on replacing equipment at the following locations: Mathilda/San Aleso, Fair Oaks/Old San Francisco, Fair Oaks/Arques, and Fair Oaks/Duane.
Existing equipment slated for replacement do not meet City standards. This equipment is not capable of coordination and will not communicate on existing City systems. They are obsolete and replacement parts are no longer available. If not replaced, possible future failure will require replacement and will cause long-term shutdown while equipment is ordered and delivered. Project costs are based on bids and prices from manufacturers and contractors.
This project is funded by the Gas Tax Fund.
Project Description / Scope / Purpose
Project Financial SummaryFinancial Data Prior
ActualCurrent 2017-18 2018-19 2019-20 2020-21 2021-22 2022-23 2023-24 2024-25 2025-26 2026-27 Y11-Y20
TotalProject
Life Total
Project Costs
Operating Costs
Total
Total
Project Evaluation and Analysis
Fiscal Impact
Revenues
Transfers-In
2016-17
Project Manager: Manuel PinedaTransportation, Streets & InfrastructureService Delivery Cluster:
1,462,435 603,958 179,061 182,642 186,295 190,021 193,821 197,698 201,652 205,685 209,799 2,551,574 6,580,733216,092
0 0 0 0 0 0 0 0 0 0 0 0 00
0 0 0 0 0 0 0 0 0 0 0 0 00
688,784 603,958 179,061 182,642 186,295 190,021 193,821 197,698 201,652 205,685 209,799 2,551,574 5,807,082216,092
179,061 182,642 186,295 190,021 193,821 197,698 201,652 205,685 209,799 216,092Gas Tax Fund 2,551,574
Traffic Signal Controller Replacement 820180
805

Project Information Sheet820190Project: Traffic Signal Hardware & Wiring
Origination Year: 1998-99Ongoing
Type: Traffic & TransportationCategory: Infrastructure
Project Coordinator: Shahid AbbasDepartment: Public WorksPlanned Completion Year:
Fund: Infrastructure Renov & Replace610Sub-Fund: General Fund Assets100
This project provides funding for design and construction for replacement of traffic signal underground conduits and signal pole structures at the end of their estimated life span. Underground cables and conduits have a life expectancy of approximately 35 years. The City has 131 traffic signals. Out of these, 86 are beyond their design life and are due for replacement.
Signals identified for replacement are evaluated by location specific assessments based upon an inventory of traffic signal life cycles. The traffic signal at Sunnyvale/Hendy was designed in FY 2016/17 and will be constructed in FY 2017/18.
For future projects, design and construction for two traffic signals will be performed in alternating years. In FY 2018/19 Fair Oaks/California, and Bernardo/Heatherstone will be designed and constructed in FY 2019/20.
Underground conduits/substructures, as they age and corrode, become filled with dirt and water and cannot be cleaned. Failure to replace systems may result in wire failure in the future with no means of quick replacement and signal shutdown for multiple days until replaced. Traffic signal poles and associated hardware are evaluated for replacement concurrently in order to consider updated design standards and condition of infrastructure. Project costs are based on bid history and construction prices received. Near term funding levels are calibrated to match conditions in the field.
This project is funded by the Gas Tax Fund.
Project Description / Scope / Purpose
Project Financial SummaryFinancial Data Prior
ActualCurrent 2017-18 2018-19 2019-20 2020-21 2021-22 2022-23 2023-24 2024-25 2025-26 2026-27 Y11-Y20
TotalProject
Life Total
Project Costs
Operating Costs
Total
Total
Project Evaluation and Analysis
Fiscal Impact
Revenues
Transfers-In
2016-17
Project Manager: Jennifer NgTransportation, Streets & InfrastructureService Delivery Cluster:
4,307,938 684,190 663,000 312,120 1,379,570 324,730 1,435,305 337,849 1,493,291 351,498 1,553,620 11,520,401 24,732,796369,284
0 0 0 0 0 0 0 0 0 0 0 0 00
82,000 0 0 0 0 0 0 0 0 0 0 0 82,0000
2,928,865 684,190 663,000 312,120 1,379,570 324,730 1,435,305 337,849 1,493,291 351,498 1,553,620 11,520,401 23,353,723369,284
663,000 312,120 1,379,570 324,730 1,435,305 337,849 1,493,291 351,498 1,553,620 369,284Gas Tax Fund 11,520,4010 0 0 0 0 0 0 0 0 0Cap Proj Fund -Traffic Mitigation 0
Traffic Signal Hardware & Wiring 820190
806

Project Information Sheet820200Project: Traffic Signal Light Emitting Diode (LED) Array Replacements
Origination Year: 1997-98Ongoing
Type: Traffic & TransportationCategory: Infrastructure
Project Coordinator: Shahid AbbasDepartment: Public WorksPlanned Completion Year:
Fund: Infrastructure Renov & Replace610Sub-Fund: General Fund Assets100
This project funds replacement of red, yellow, and green traffic signal light emitting diode arrays (LEDs) as they approach the end of their useful life. The LEDs are warrantied for seven years, but experience has indicated that ten years is the actual life cycle. LEDs result in a significant cost savings to the City in power consumption and annual replacement costs. In the past, incandescent lights were used for traffic signals. The incandescent lights were replaced every 1-2 years and consumed 10-15 times more electricity than LEDs.
The cost estimates are based on current market prices for LED equipment. Starting in FY 2016/17, funds were budgeted for replacement of red (2nd cycle), yellow, and green LEDs and pedestrian crossing indicators. Second cycle replacements will continue through FY 2017/18. Future year funding is for the replacement of the LED installments.
This project will replace existing LED traffic signal indications once they become obsolete, reducing City liability and complying with Federal, State and accepted professional standards. Cost savings from the initial installation of LEDs are already reflected in the operating budget.
This project is funded by the Gas Tax Fund.
Project Description / Scope / Purpose
Project Financial SummaryFinancial Data Prior
ActualCurrent 2017-18 2018-19 2019-20 2020-21 2021-22 2022-23 2023-24 2024-25 2025-26 2026-27 Y11-Y20
TotalProject
Life Total
Project Costs
Operating Costs
Total
Total
Project Evaluation and Analysis
Fiscal Impact
Revenues
Transfers-In
2016-17
Project Manager: Manuel PinedaTransportation, Streets & InfrastructureService Delivery Cluster:
230,414 137,529 119,340 145,656 175,099 178,601 0 55,182 56,286 0 0 814,353 2,056,481144,021
0 0 0 0 0 0 0 0 0 0 0 0 00
0 0 0 0 0 0 0 0 0 0 0 0 00
166,356 137,529 119,340 145,656 175,099 178,601 0 55,182 56,286 0 0 814,353 1,992,423144,021
119,340 145,656 175,099 178,601 0 55,182 56,286 0 0 144,021Gas Tax Fund 814,353
Traffic Signal Light Emitting Diode (LED) Array Replacements 820200
807

Project Information Sheet825070Project: Bicycle Map Revision
Origination Year: 2003-04Ongoing
Type: Traffic & TransportationCategory: Special
Project Coordinator: Shahid AbbasDepartment: Public WorksPlanned Completion Year:
Fund: City General Fund35Sub-Fund: General100
This project funds a comprehensive bicycle map revision every 10 years to account for changes and additions to the City's bicycle network. The next revision is scheduled for FY 2017/18 after the completion of bike plan. Minor updates to bike map will be considered after every five years. The City typically completes 2-3 bicycle projects per year, which result in significant changes and warrant a comprehensive bicycle map revision every 10 years. The project cost includes conducting in-depth research of the bicycle routes, paths, bike lanes, and trail ways within the City and their connectivity with the adjacent jurisdictions, and publishing a map showing these bike facilities for information of general public to encourage use of bikes throughout the City.
Per Section 10.56.286 of the City's Municipal Code, "There shall be maintained on file in the Department of Public Works and available for inspection by the public, a map showing the bicycle lanes, paths, routes, and bikeways, as established from time to time by the City Council." An update of the map will reflect changes. All expenditures for this project will go towards the cost of printing the maps in addition to the labor needed to update the street bicycle network, bicycle facilities, and other elements of the map. The latest revision of the map was completed in FY 2005/06.
This project will improve communication with residents about the City's existing bicycle facilities. The bicycle map is an essential promotional tool to implement bicycle policy.
This project is funded by the General Fund.
Project Description / Scope / Purpose
Project Financial SummaryFinancial Data Prior
ActualCurrent 2017-18 2018-19 2019-20 2020-21 2021-22 2022-23 2023-24 2024-25 2025-26 2026-27 Y11-Y20
TotalProject
Life Total
Project Costs
Operating Costs
Total
Total
Project Evaluation and Analysis
Fiscal Impact
Revenues
Transfers-In
2016-17
Project Manager: Carol ShariatTransportation, Streets & InfrastructureService Delivery Cluster:
68,177 23,451 51,000 0 0 0 0 28,154 0 0 0 100,139 270,9210
0 0 0 0 0 0 0 0 0 0 0 0 00
0 0 0 0 0 0 0 0 0 0 0 0 00
0 0 0 0 0 0 0 0 0 0 0 0 00
Bicycle Map Revision 825070
808

Project Information Sheet825290Project: Pavement Rehabilitation
Origination Year: 2005-06Ongoing
Type: Traffic & TransportationCategory: Infrastructure
Project Coordinator: Tony PinedaDepartment: Public WorksPlanned Completion Year:
Fund: Infrastructure Renov & Replace610Sub-Fund: General Fund Assets100
This project provides for ongoing roadway infrastructure preservation and rehabilitation to maintain Sunnyvale’s network in very good condition. Specific yearly projects will be based upon annual roadway condition surveys and pavement management system (PMS) analysis. Projects in past fiscal years included milling, wedge-grinding and overlay, cold in place roadway recycling, crack sealing, street patching and slurry sealing. This effort was supplemented by the Annual Slurry Seal Project 828030 and the Operations budget for roadway maintenance and increased slurry sealed roadways from 2 million square feet (SF) in FY 2012/13 to 3 million SF in FY 2015/16.
This project will continue the shift from typical roadway replacement strategies to a balanced approach between pavement preservation and roadway replacement. These strategies may include: rejuvenating fog seals, microsurfacing, slurry seals, crack sealing, patch repairs, mill, wedge-grind and overlay, cold in-place or full depth roadway recycling, and other strategies that may be become applicable. This project will also provide for preparatory work needed prior to chip seal and slurry seal roadways. This overall strategy shift will allow the City to improve a larger roadway area and reach a yearly slurry sealing goal of 5 million SF in FY 2019/20.
Maintaining Sunnyvale streets in very good condition is essential to maintain the economic vitality of the City and enhance the quality of life of City’s residents. Historically, an average of approximately $3 million was spent per year in FY 2012/13 through FY 2015/16 in addition to the Annual Slurry Seal project and the Operations maintenance budget. This effort sustained the Pavement Condition Index (PCI) at 77. To maintain the PCI at 77, approximately $3 million is necessary for this project annually. Increasing the PCI above 77 will require additional yearly funding.
The alternative is to not increase funding and delay needed preservation, repairs and replacement. If delayed, lower cost preservation effort and minor street rehabilitation measures will become major street replacement projects at much higher cost. This will result in dropping the PCI by 1 to 2 points per year.
This project is funded by the SB83 VRF Road Improvement Fund, the Gas Tax Fund and the General Fund. The project does not affect the operating budget.
Project Description / Scope / Purpose
Project Financial SummaryFinancial Data Prior
ActualCurrent 2017-18 2018-19 2019-20 2020-21 2021-22 2022-23 2023-24 2024-25 2025-26 2026-27 Y11-Y20
TotalProject
Life Total
Project Costs
Operating Costs
Total
Total
Project Evaluation and Analysis
Fiscal Impact
Revenues
Transfers-In
2016-17
Project Manager: Elizabeth Racca-JohnsonTransportation, Streets & InfrastructureService Delivery Cluster:
13,281,162 4,227,066 3,060,000 3,121,200 3,183,624 3,247,296 3,312,242 3,378,487 3,446,057 3,514,979 3,585,278 43,604,254 94,654,4813,692,836
0 0 0 0 0 0 0 0 0 0 0 0 00
5,500 0 0 0 0 0 0 0 0 0 0 0 5,5000
13,275,662 4,227,066 3,060,000 3,121,200 3,183,624 3,247,296 3,312,242 3,378,487 3,446,057 3,514,979 3,585,278 43,604,254 94,648,9813,692,836
1,079,220 1,423,267 2,285,660 1,745,705 2,414,278 1,204,161 2,548,093 1,589,544 2,687,314 1,604,502General Fund - General 23,770,975980,337 799,969 0 603,627 0 1,276,362 0 1,027,471 0 1,190,370Gas Tax Fund 10,853,639
1,000,443 897,964 897,964 897,964 897,964 897,964 897,964 897,964 897,964 897,964SB83 VRF Local Road Improvement 8,979,640
Pavement Rehabilitation 825290
809

Project Information Sheet825340Project: Street Lights Conduit Replacement
Origination Year: 2005-06Ongoing
Type: Traffic & TransportationCategory: Infrastructure
Project Coordinator: Tony PinedaDepartment: Public WorksPlanned Completion Year:
Fund: Infrastructure Renov & Replace610Sub-Fund: General Fund Assets100
This project provides funding for replacement of damaged conduits, wiring, and other related components throughout the City on an as-needed basis as problems are identified by staff. Many of the City’s streetlights have underground conduits that have been in place for many years and are showing deterioration. Failures are generally the result of heavy vehicles driving over the conduits in shallow driveways, parking strips crushing the conduit, or by water intrusion creating electrical shorts. The budget is based upon replacing approximately four miles every three years, with some funding available on an annual basis to fix unanticipated, immediate repairs, if necessary. Any funds left each year should be carried forward to provide additional funding for subsequent years. At some point additional funding may be required if conduits begin to fail in large numbers, precluding the benefits of spot repairs. The City has an estimated 200 linear miles of conduits, with several known locations of failure.
Future locations will be based upon damaged locations identified over the next three-year period, except for small spot repairs that can be corrected with the small annual budget referenced above.
The alternative to this project would be to not fix broken conduits, which would result in dark streets. Hazardous situations could occur if the conduit breaks in such a way that a street light pole is energized; however, this is not a very common occurrence.
This project is funded by the Gas Tax Fund.
Project Description / Scope / Purpose
Project Financial SummaryFinancial Data Prior
ActualCurrent 2017-18 2018-19 2019-20 2020-21 2021-22 2022-23 2023-24 2024-25 2025-26 2026-27 Y11-Y20
TotalProject
Life Total
Project Costs
Operating Costs
Total
Total
Project Evaluation and Analysis
Fiscal Impact
Revenues
Transfers-In
2016-17
Project Manager: Elizabeth Racca-JohnsonTransportation, Streets & InfrastructureService Delivery Cluster:
362,937 159,232 10,200 208,080 10,612 10,824 220,816 11,262 11,487 234,332 11,951 1,251,435 2,515,47712,309
0 0 0 0 0 0 0 0 0 0 0 0 00
0 0 0 0 0 0 0 0 0 0 0 0 00
331,101 159,231 10,200 208,080 10,612 10,824 220,816 11,262 11,487 234,332 11,951 1,251,435 2,483,64012,309
10,200 208,080 10,612 10,824 220,816 11,262 11,487 234,332 11,951 12,309Gas Tax Fund 1,251,435
Street Lights Conduit Replacement 825340
810
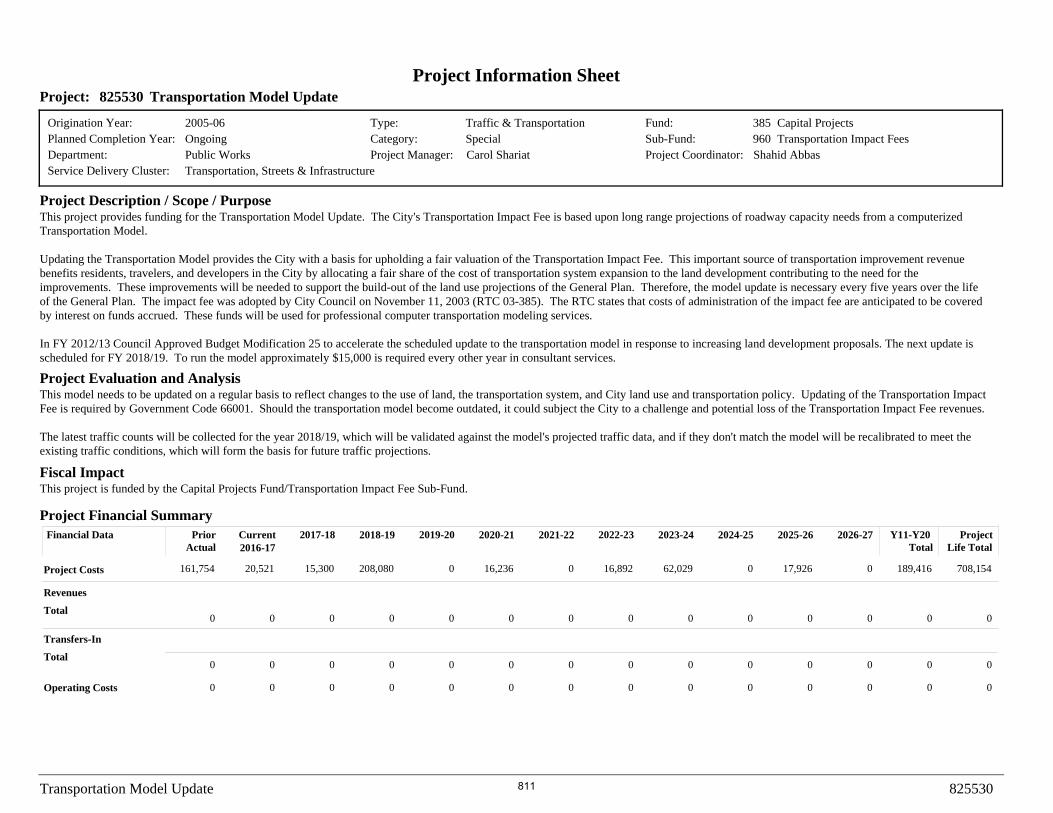
Project Information Sheet825530Project: Transportation Model Update
Origination Year: 2005-06Ongoing
Type: Traffic & TransportationCategory: Special
Project Coordinator: Shahid AbbasDepartment: Public WorksPlanned Completion Year:
Fund: Capital Projects385Sub-Fund: Transportation Impact Fees960
This project provides funding for the Transportation Model Update. The City's Transportation Impact Fee is based upon long range projections of roadway capacity needs from a computerized Transportation Model.
Updating the Transportation Model provides the City with a basis for upholding a fair valuation of the Transportation Impact Fee. This important source of transportation improvement revenue benefits residents, travelers, and developers in the City by allocating a fair share of the cost of transportation system expansion to the land development contributing to the need for the improvements. These improvements will be needed to support the build-out of the land use projections of the General Plan. Therefore, the model update is necessary every five years over the life of the General Plan. The impact fee was adopted by City Council on November 11, 2003 (RTC 03-385). The RTC states that costs of administration of the impact fee are anticipated to be covered by interest on funds accrued. These funds will be used for professional computer transportation modeling services.
In FY 2012/13 Council Approved Budget Modification 25 to accelerate the scheduled update to the transportation model in response to increasing land development proposals. The next update is scheduled for FY 2018/19. To run the model approximately $15,000 is required every other year in consultant services.
This model needs to be updated on a regular basis to reflect changes to the use of land, the transportation system, and City land use and transportation policy. Updating of the Transportation Impact Fee is required by Government Code 66001. Should the transportation model become outdated, it could subject the City to a challenge and potential loss of the Transportation Impact Fee revenues.
The latest traffic counts will be collected for the year 2018/19, which will be validated against the model's projected traffic data, and if they don't match the model will be recalibrated to meet the existing traffic conditions, which will form the basis for future traffic projections.
This project is funded by the Capital Projects Fund/Transportation Impact Fee Sub-Fund.
Project Description / Scope / Purpose
Project Financial SummaryFinancial Data Prior
ActualCurrent 2017-18 2018-19 2019-20 2020-21 2021-22 2022-23 2023-24 2024-25 2025-26 2026-27 Y11-Y20
TotalProject
Life Total
Project Costs
Operating Costs
Total
Total
Project Evaluation and Analysis
Fiscal Impact
Revenues
Transfers-In
2016-17
Project Manager: Carol ShariatTransportation, Streets & InfrastructureService Delivery Cluster:
161,754 20,521 15,300 208,080 0 16,236 0 16,892 62,029 0 17,926 189,416 708,1540
0 0 0 0 0 0 0 0 0 0 0 0 00
0 0 0 0 0 0 0 0 0 0 0 0 00
0 0 0 0 0 0 0 0 0 0 0 0 00
Transportation Model Update 825530
811