adopted 2021 operating budget, two-year financial …
TRANSCRIPT

Northeastern Illinois December 2020
ADOPTED 2021 OPERATING BUDGET, TWO-YEAR FINANCIAL PLAN, AND FIVE-YEAR CAPITAL PROGRAM

Kirk DillardChairman
David R. AndalcioDirector – DuPage County
Mary Beth CantyDirector – Suburban Cook County
Pat CareyDirector – Lake County
William R. CoulsonDirector – Suburban Cook County
John V. FregaDirector – Suburban Cook County
Phil FuentesDirector – City of Chicago
Jamie GathingDirector – Suburban Cook County
Christopher J. GrovenDirector – Kane County
Alexandra HoltDirector – City of Chicago
Thomas J. KotelDirector – City of Chicago
Michael W. LewisDirector – Suburban Cook County
Christopher C. Melvin, Jr.Director – City of Chicago
Sarah PangDirector – City of Chicago
J.D. RossDirector – Will County
Brian SagerDirector – McHenry County
Leanne P. ReddenExecutive Director
Leanne P. ReddenExecutive Director
This document contains the adopted 2021 regional and Service Board operating budgets and capital programs, approved by the RTA Board on December 17, 2020.
Board of Directors

Contents Anything but a “Normal Budget Year” .......................................................................................1
Anticipating the Challenges of 2021 and Beyond .........................................................................1
Economic Recovery Depends on Transit ......................................................................................2
RTA Three-Step Recovery Strategy ..............................................................................................4
Regional Operations ...................................................................................................................5
Regional Operating Budget .........................................................................................................5
CTA Operating Budget ...............................................................................................................14
Metra Operating Budget ...........................................................................................................21
Pace Suburban Bus Service Operating Budget ...........................................................................28
Pace ADA Paratransit Operating Budget ....................................................................................35
RTA Agency Operating Budget...................................................................................................41
Regional Capital Program .........................................................................................................45
Progress Toward Transparency in Capital Investment ...............................................................46
Goals and Requirements for the Five-Year Regional Capital Program ........................................47
2021-2025 Regional Capital Program and 2021 Regional Capital Program .................................49
CTA Capital Program .................................................................................................................57
Metra Capital Program ..............................................................................................................66
Pace Suburban Service Capital Program ....................................................................................78
Pace Regional ADA Paratransit Capital Program ........................................................................85
RTA Capital Program .................................................................................................................85


Page 1 of 85
Adopted 2021 Operating Budget, Two-Year Financial Plan,
and Five-Year Capital Program
Anything but a “Normal Budget Year” The RTA’s mandate is to fund and advocate for CTA, Metra, and Pace — known as the “Service Boards” — and to be candid with them and the public about financial challenges. Annually, all four transit agencies collaborate to develop the Operating Budget, Two-Year Financial Plan, and Five-Year Capital Program. Preparation of these crucial materials has been fraught as never before due to uncertainty caused by the coronavirus pandemic.
Due to unprecedented effects of COVID-19, 2020 has been anything but a normal year for the regional transit system of northeastern Illinois. As with every other transit agency in the U.S., our system has suffered dramatic decreases in ridership and revenues. The RTA and Service Boards are closely evaluating ridership and revenue impacts, which the public can also monitor on the RTA COVID Transit Dashboard, www.rtachicago.org/covid-dash. Since early in the pandemic, the RTA has also sent a bi-weekly COVID-19 email update, to which the public can subscribe through the agency’s recovery web page at www.rtachicago.org/recovery.
“This moment requires nothing less than bold thoughts and action. As a region, we must ensure that our transit system continues to serve its riders reliably, even in the absence of additional federal relief. And while weathering the difficult year ahead — by anticipating, understanding, and confronting challenges of this deadly pandemic — we must also reinvent our transit system to ensure that it can adapt for the region’s long-term future.” Leanne Redden, RTA Executive Director
Anticipating the Challenges of 2021 and Beyond As a transit system with three different but interdependent providers, we have collectively developed this Proposed 2021 Operating Budget, Two-Year Financial Plan, and Five-Year Capital Program to protect transit from the uncertainties of COVID-19 while also speaking frankly about possible ramifications if additional federal relief doesn’t emerge. Among our greatest challenges is to anticipate a variety of potential outcomes and plan carefully so riders — especially the most vulnerable who rely on transit — can continue to count on public transportation. Developed during this very difficult period, the proposed budget seeks to sustain essential public transportation while planning for a future “new normal” that is profoundly uncertain due to the ongoing pandemic.
Together, the transit agencies have created a culture of COVID prevention, and our region’s trains and buses have never been cleaner. CTA, Metra, and Pace have continued providing safe, reliable trips to meet dramatically shifting customer needs. Their employees have performed

Page 2 of 85
Adopted 2021 Operating Budget, Two-Year Financial Plan,
and Five-Year Capital Program
heroically, in particular by transporting workers to hospitals, police and firehouses, groceries, and other essential workplaces and back to their homes and families.
In March 2020, the federal Coronavirus Aid, Relief, and Economic Security (CARES) Act provided $1.4 billion, which has shielded our region’s transit operations from revenues lost due to decreased fare collections and tax receipts. But those dollars will begin to run out in 2021, leaving our transit system with a potential shortfall of more than $500 million. Therefore, the RTA and the Service Boards have joined with the American Public Transportation Association (APTA) to call for a new federal relief package with an additional $32 billion for transit systems nationwide. The Proposed 2021 Operating Budget, Two-Year Financial Plan, and Five-Year Capital Program assumes further financial relief, without which a reckoning will come in early 2021 when this budget would need to be revisited to enact painful service cuts. In addition to looking outside of the agencies for assistance, the RTA Board has also begun recovery efforts that position the agencies to navigate the potential financial challenges of 2021 as discussed later in this document.
Economic Recovery Depends on Transit The pandemic’s effects on public transportation continue to jeopardize the regional economy itself. Before the virus, our metropolitan region’s vibrant economy depended on CTA, Metra, and Pace to provide nearly two million rides on any given weekday. Over the decade prior to the pandemic, approximately 60 percent of all new jobs in the region were created near high-quality transit service1 and over 60 percent of commuters rode public transportation into Chicago’s central business district.2 Now, as greater numbers of residents work from home and others have lost their jobs due to COVID-19, ridership is down dramatically. Based on input from the Greater Chicagoland Chamber of Commerce and its members, business leaders believe a strong transit system is crucial for our region to recover.
As of October 23, 2020, ridership is down 72 percent systemwide compared to 2019, as shown in the following chart from the RTA COVID-19 Transit Dashboard; for comparison, travel by all modes (including cars) was down 23 percent. While ridership has been on a slow upward trajectory from early spring 2020, significantly higher transit use will depend on widespread deployment of a reliable COVID-19 vaccine. And even when commuters begin returning to transit in greater numbers, increased telecommuting is likely here to stay.3 It’s clear that the transit agencies will need to face a near-term reality of lower ridership that is a result of both lower demand and the practical need to maintain social distancing on vehicles. Yet a robust
1 Chicago Metropolitan Agency for Planning (CMAP) Transit Availability Index, cited in “Transit Means Business,” by the Metropolitan Planning Council, p. 12, October 18, 2018.
2 “Regional Transit Strategic Plan 2018-2023: Beginning the Discussion,” the Regional Transportation Authority, p. 13, May 2017.
3 “Telecommuting will likely continue long after the pandemic,” Brookings Institution, by Katherine Guyot and Isabel V. Sawhil, April 6, 2020.

Page 3 of 85
Adopted 2021 Operating Budget, Two-Year Financial Plan,
and Five-Year Capital Program
transit system is necessary to avoid vehicle congestion from overwhelming the region’s highways when people do begin returning to work in larger numbers.
Figure 1. Ridership status, 2020
Source: CTA, Metra, Pace data from RTA COVID-19 Transit Dashboard, as of October 23, 2020
Due to decreased ridership, farebox revenues for all three Service Boards reached their low point in May, followed by slow increases. Without additional federal relief for transit, farebox revenue will not likely rebound quickly enough in 2021 to avoid potentially painful service cuts. In times like these, it is important for the state and region to step up with additional support to sustain transit beyond the pandemic, because massive cuts will have catastrophic effects not only for essential riders in the short term but also for our region’s economy in the longer term.4
4 “Stranded by Transit Cuts,” Center for Neighborhood Technology, September 30, 2020.

Page 4 of 85
Adopted 2021 Operating Budget, Two-Year Financial Plan,
and Five-Year Capital Program
Figure 2. Farebox revenues, 2020
RTA Three-Step Recovery Strategy In order to proactively respond to the financial and social crisis caused by the pandemic and prepare for potential challenges ahead in 2021, the RTA has begun a three-step strategy to address the regional transit system’s near- and longer-term recovery from COVID-19.
Figure 3. RTA Three-Step Recovery Strategy
Each of these steps will be driven by the same clear set of policy priorities that reflect the RTA’s desire to support the Service Boards’ difficult choices in 2021 and beyond. By providing insight into their respective approaches, the Service Boards can help the RTA Board better understand those choices and more effectively advocate for them.
Based on the goals of our region’s Invest in Transit strategic plan, the feedback received during an RTA scenario planning process in mid-2020, and the RTA’s existing statutory responsibilities,

Page 5 of 85
Adopted 2021 Operating Budget, Two-Year Financial Plan,
and Five-Year Capital Program
the RTA is focused on the following policy priorities for near- and longer-term recovery planning:
• Identify immediate funding solutions to support the transit system, includingadvocating for federal aid, exploring new revenue solutions, and considering how toleverage resources to meet short-term needs most effectively.
• Sustain critical transit services to provide mobility for those who most need publictransportation at this time, including bus riders, essential workers, residents witheconomic hardships across the region, and people with disabilities.
• Take an increasingly transparent, collaborative approach to communicating withstakeholders and the public about projected budget shortfalls, impending cuts, andother potential disruptions to service.
In addition to helping the RTA and Service Boards to navigate Steps 1 and 2 in the nearer term, these policy priorities can also guide our activities in Step 3 to build on progress toward recovery and to reinvent transit. Working with our partners throughout the region, we envision a strategic planning process that continues the momentum created by the ON TO 2050 and Invest in Transit plans toward a future transit system that supports a vibrant regional economy and environment that is safe and equitable for all.
Regional Operations This section summarizes the proposed 2021 Regional Operating Budget and Two-Year Financial Plan, with details of each Service Board’s respective budget. These proposals will be presented by staff of the RTA, CTA, Metra, and Pace at the RTA Board meeting on November 19, 2020. Following the public comment period — which includes an RTA virtual public hearing on December 3 — the RTA Board will consider adoption of the regional operating budget and capital program at its December 17 meeting.
Regional Operating Budget The onset of the novel coronavirus pandemic in March 2020 has had a profound impact on the RTA regional operating budget. This impact will stretch through 2021 and could permanently change many aspects of public transportation. Due in part to cautionary measures such as the stay-at-home orders that lasted through May, transit ridership plummeted, resulting in unprecedented fare revenue losses at CTA, Metra, and Pace as many commuters transitioned to remote working. Unemployment rose and RTA sales tax receipts temporarily collapsed, reducing funding to the Service Boards and RTA Agency. Yet, transit operations continued throughout the slowdown, providing critical service to those who needed it the most.
In response to the COVID-19 impacts, an RTA funding amendment was executed in May, leading to the adoption of an amended 2020 regional operating budget in August. This budget was further revised in October to ensure sufficient ADA Paratransit funding. These actions

Page 6 of 85
Adopted 2021 Operating Budget, Two-Year Financial Plan,
and Five-Year Capital Program
acknowledged the availability of more than $1.4 billion of federal CARES Act funding and incorporated the anticipated drawdown of such funding into the Service Board and RTA operating budgets. This first round of relief funding was provided to replace lost fare revenue and RTA funding, allowing critical transit operations to continue in 2020, but is projected to be exhausted as the regional transit system moves through 2021 and into 2022.
The Service Boards have proposed 2021 operating budgets that recognize the reality of lower revenue for operations and call for additional relief funding to sustain essential transit service as the region recovers from the pandemic. Overall service levels have been reduced at Metra and Pace but maintained at CTA, and no immediate fare increases have been included. However, in the absence of additional relief funding, further service reductions and fare increases will be required to balance operating expenses to the reduced revenue base.
When comparing the 2021 budget to the 2020 estimate, note that the 2020 estimate is based on amended budgets that reflect the impact of the COVID-19 pandemic on ridership, fare revenue, public funding, and expenses.
Ridership RTA system ridership plunged to about 20% of normal (as defined by 2019 levels) during the stay-at-home order and has only recovered to about 30% of normal as of October 2020. Ridership losses were heaviest at Metra as many downtown offices closed and have been slow to reopen. Telecommuting quickly became the norm for those with jobs that allow it, but many regional residents still rely exclusively on transit to get them to work, shopping, and medical appointments.
Regional transit ridership is projected to finish 2020 at 231.2 million, a 59% decrease from 2019. Ridership for 2021 is budgeted at 253.8 million, an increase of about 10%. Each Service Board is anticipating a modest ridership rebound in 2021, although ridership levels are assumed to remain far below normal. CTA projects 2021 ridership at 46% of normal, Metra at 33% of normal, and Pace Suburban Service and ADA Paratransit at 60% of normal.
Table 1. Regional Ridership Forecast
Ridership (in millions) 2020 Estimate 2021 Budget Change
CTA 193.7 209.7 +8.3%
Metra 20.0 24.3 +21.5%
Pace 15.3 17.2 +12.0%
ADA Paratransit 2.2 2.6 +19.1%
Region 231.2 253.8 +9.8%

Page 7 of 85
Adopted 2021 Operating Budget, Two-Year Financial Plan,
and Five-Year Capital Program
Operating Revenue The Service Boards’ proposed 2021 budgets assume $1.148 billion of operating revenue, an increase of $30.7 million, or 2.7%, over the 2020 estimate. Operating revenue consists of system-generated revenue from passenger fares as well as ancillary revenue from sources such as the lease of space, advertising, and investment income. It also includes the State reduced fare reimbursement (RFR), which partially compensates the Service Boards for free and reduced fare programs.
Most importantly, 2021 operating revenue includes $467.1 million of CARES Act funding expected to be used by the Service Boards for ongoing fare revenue losses. However, it is estimated that there will not be sufficient CARES Act funding available to replace all lost operating revenue and $138.0 million of additional relief funding for fare revenue losses will be needed to meet required recovery ratios and avoid major service cuts or fare hikes in 2021. In total, operating revenue accounts for 38% of the total revenue needed to balance the regional operating budget, as shown in Figure 4.
Figure 4. 2021 Revenues: $3.025 Billion
Public Funding When public funding is combined with operating revenue, resulting total revenue of $3.025 billion is anticipated to support the proposed level of 2021 service and associated operating expenses.
Overall public funding in 2021 is projected at $1.877 billion, an increase of $46.2 million or 2.5% from the 2020 estimate. About 35% of the region’s revenue for operations is budgeted to come from a regional sales tax imposed at 1.25% in Cook County and 0.5% in the collar counties. RTA sales tax receipts are expected to finish 2020 at $1.053 billion, a decrease of 16.1% from 2019 due to COVID-19 impacts on consumer spending and employment. In 2021, sales tax receipts are expected to decrease by another 0.5% to $1.047 billion, but will be supported by changes in state law taking effect in January resulting in RTA sales tax applying to more online purchases.

Page 8 of 85
Adopted 2021 Operating Budget, Two-Year Financial Plan,
and Five-Year Capital Program
Sales tax is anticipated to rebound by 6% in 2022 and 2023, finishing the period at $1.174 billion. Still, this equates to the level of RTA sales tax received in 2015, an indication of how strong and lasting the impact of the current crisis is expected to be on transit funding. In addition, an existing State surcharge of 1.5% on RTA sales tax collections is assumed to remain in place indefinitely, reducing RTA and Service Board funding by approximately $20 million per year.
The majority of state funding received by the RTA is based on a 30% state match of RTA sales tax and Real Estate Transfer Tax (RETT) receipts. The match funding comes from the State’s Public Transportation Fund (PTF) and is expected to provide $322.7 million for 2021 operations. The PTF funding reflects a 5% reduction due to state legislation that was passed in May 2020, decreasing the state’s match for its 2021 fiscal year. RETT receipts are expected to decrease by 5.4% in 2021 to $46.7 million as the real estate market struggles to rebound. Continued State Financial Assistance (ASA/AFA) of $130.3 million for reimbursement of debt service on RTA Strategic Capital Improvement Program (SCIP) bonds is budgeted for 2021, as is $8.4 million of State funding for Pace ADA Paratransit service. Other revenue sources comprise less than 1% of total revenue.
The Service Boards and RTA have included in their 2021 budgets a total of $69.4 million of CARES Act funding expected to be used to help offset ongoing losses in public funding. However, it is estimated that there will not be sufficient CARES Act funding available to replace all lost public funding and $233.9 million of additional relief funding for sales tax losses will be needed to avoid major service cuts or fare hikes in 2021.
Service Levels and Expenses When RTA and regional expenses are combined with Service Board operating expenses, total 2021 expenses for the RTA system are projected at $3.020 billion, an increase of 2.6% over the 2020 estimate, a decrease of 2.5% from the original 2020 budget and a decrease of 5.0% from the pre-COVID 2021 Plan. Total regional operating expenses are subsequently projected to increase by 0.9% and 2.5% in 2022 and 2023, respectively.
Service Board 2021 operating expenses, which comprise about 91% of RTA system expenses, are projected to grow by 2.7% over the 2020 estimate, to $2.759 billion. CTA’s proposed expense budget incorporates normal, pre-pandemic service levels, while Metra and Pace Suburban Service have budgeted for a continuation of the significant service reductions implemented by both agencies as ridership dropped in the immediate aftermath of the COVID-19 outbreak.

Page 9 of 85
Adopted 2021 Operating Budget, Two-Year Financial Plan,
and Five-Year Capital Program
Figure 5. 2021 Expenses: $3.020 Billion
Relative to their 2020 estimates, CTA projects a 5.3% increase in operating expenses for 2021, driven primarily by labor, material, and insurance and claims expenses. Metra operating costs are expected to decrease by 4.8%, provided that an additional $70 million of savings can be identified. Pace Suburban Service anticipates 8.2% expense growth as some capital-eligible expenses are brought back into the operating budget. ADA Paratransit expenses are projected to increase by 3.6% due to ridership recovery and contractual price increases.
RTA Agency and Regional Programs expenses are budgeted at $38.1 million, an increase of 3.7% from the 2020 estimate. With the August 2020 budget amendment, the Agency’s funding requirement was reduced by 10% to $31.7 million and is planned to remain at that zero-growth level through 2022. The RTA Agency budget represents 1.3% of RTA system expenses. Other regional expenses, which include debt service on bonds issued for Service Board capital funding and Joint Self Insurance Fund (JSIF) premiums, comprise the remaining 7.3% of system expenses. The RTA debt service total of $212.6 million for 2021 includes principal and interest expense on existing long-term bonds and on short-term borrowing to manage expected delays in payments from the State of Illinois.
CARES Act and Additional Funding Need A total of $1.438 billion of federal CARES Act funding was allocated to the RTA region in March 2020. The Service Boards and RTA currently estimate that $819.2 million or 57% of that funding will be requisitioned for 2020 operating revenue and public funding losses. A further $536.6 million of CARES Act funding has been budgeted for 2021, with the remaining $82.4 million carried into the 2022 plan year by Metra, Pace, and the RTA. In the absence of new relief funding, the regional transit system faces a potential shortfall exceeding $500 million in 2021.
CTA’s proposed budget identifies an additional $372 million of relief funding required to replace lost revenue and balance anticipated operating expenses for 2021, with additional shortfalls of

Page 10 of 85
Adopted 2021 Operating Budget, Two-Year Financial Plan,
and Five-Year Capital Program
$390 million and $359 million projected for 2022 and 2023, respectively. Metra has determined a total three-year shortfall of $570 million to restore normal service levels, while Pace’s budget and plan shows that $89 million of additional relief funding is needed just to balance their proposed reduced-schedule level of expenses in 2022 and 2023.
As a result, the total additional funding need for 2021 through 2023, above and beyond the remaining CARES Act funding, is more than $1.8 billion. If this additional relief funding does not materialize, each Service Board would be forced to take unspecified budget balancing actions to resolve projected revenue shortfalls, which could include fare increases, service reductions, job cuts, and other cost saving measures. The impact on our already challenged transit system might be catastrophic.
Net Result and Recovery Ratios As shown in Table 2, the regional operating budget and financial plan is balanced in 2021, 2022, and 2023, with a net result of zero contingent upon additional relief funding or budget balancing actions, shown in red. In addition to ICE funding for approved capital projects, the proposed Metra operating budget resumes the transfer of some fare revenue to their capital program in 2022.
The RTA Act requires the RTA Board to set a system-generated revenue recovery ratio for each Service Board, as well as requiring that the combined revenues from RTA operations cover at least 50% of system operating expenses, with approved adjustments. This requirement excludes ADA Paratransit service, for which the Act mandates a 10% recovery ratio.
By including $467 million of CARES Act funding and $138 million of additional relief funding in operating revenue, the CTA, Metra, and Pace Suburban Service proposed 2021 operating budgets meet or exceed their individual RTA-specified recovery ratios of 54.75%, 52.5%, and 30.3%, respectively. As a result, the RTA regional recovery ratio for 2021 is projected at 50.7%, in compliance with the RTA Act. The ADA Paratransit budget also meets the required recovery ratio of 10%, after authorized expense exclusions.
ICE Funding and Proposed Projects Innovation, Coordination, and Enhancement (ICE) funding of $10.7 million to $11.9 million was allocated to the Service Boards in the adopted 2021-2023 funding amounts, contingent upon RTA Board approval of proposed ICE projects. Table 3 summarizes the proposed uses and amounts of these ICE funds by the Service Boards. Only the 2021 proposed uses are currently subject to approval by the RTA Board. Metra and Pace intend to use ICE funding for capital projects, while CTA has proposed an operating project.

Page 11 of 85
Adopted 2021 Operating Budget, Two-Year Financial Plan,
and Five-Year Capital Program
Table 2. Statement of Regional Revenues and Expenses (dollars in thousands) 2019 2020 2021 2022 2023
Actual Estimate Budget Plan Plan Revenues
Service Board Revenues 1
CTA 697,177 695,657 601,865 567,990 603,137 Metra 411,839 361,270 341,484 325,912 337,981 Pace 55,595 52,782 57,828 61,369 43,751 ADA Paratransit 15,077 8,079 9,298 9,346 9,849 Additional Relief Funding or Budget Balancing Actions - - 137,991 183,290 191,951 Total Operating Revenues 1,179,688 1,117,788 1,148,467 1,147,907 1,186,670
Public FundingRTA Sales Tax 1,254,161 1,052,639 1,047,481 1,110,330 1,173,618 Public Transportation Fund (PTF) 381,989 341,083 322,725 353,035 373,158 Real Estate Transfer Tax (RETT) 62,373 49,426 46,740 49,544 52,368 State Financial Assistance (ASA/AFA) 130,300 130,300 130,300 130,300 115,189 State Funding for ADA Paratransit 8,395 8,395 8,395 8,395 8,395 RTA ADA Paratransit Reserve - 31,428 - - - Federal Funds 8,192 7,893 6,070 4,142 72 RTA Capital Project Reserves 250 - - - - JSIF Reserves 2,500 - 2,500 - - ICE Carryover (2019) - 30 1,211 - -
Other RTA Revenue 2 12,625 6,887 7,873 7,873 8,474 Prior Year PBV (Metra) - 7,000 - - - CARES Act Funding - Public Funding Replacement - 195,430 69,433 11,181 - Additional Relief Funding or Budget Balancing Actions - - 233,940 235,546 227,188 Total Public Funding 1,860,785 $1,830,511 $1,876,667 $1,910,345 $1,958,462
Total Revenues $3,040,473 $2,948,299 $3,025,134 $3,058,252 $3,145,132
ExpensesService Board ExpensesCTA 1,515,388 1,562,710 1,645,065 1,680,059 1,726,425 Metra 802,210 735,000 700,000 678,000 702,000 Pace 225,943 221,144 239,388 249,559 260,531 ADA Paratransit 183,925 168,905 174,978 180,666 191,263 Total Service Board Expenses $2,727,466 $2,687,759 $2,759,431 $2,788,284 $2,880,219
Region/Agency ExpensesDebt Service 228,366 213,700 212,601 211,259 192,883 RTA Agency and Regional Programs 42,068 36,716 38,058 38,058 41,647 RTA Agency Regional Capital Program 250 - - - - Joint Self-Insurance Fund (JSIF) 5,664 5,947 9,500 9,975 10,474 Total Region/Agency Expenses $276,349 $256,363 $260,159 $259,293 $245,004
Total Expenses $3,003,814 $2,944,121 $3,019,590 $3,047,577 $3,125,222
ICE funding not used for operations - transfer to capital 3 (4,978) (4,178) (5,544) (5,876) (6,211)
Other transfers 4 (9,689) - - (4,800) (13,700)
Net Result $21,991 $0 $0 $0 $0
Regional Recovery Ratio 51.7% 50.7% 50.7% 50.2% 50.1%
1 Service Board operating revenues include CARES Act funding in 2020-2022 and additional relief funding in 2021-2023.
2 Includes income from financial transactions and investments, sales tax interest, and revenues from RTA programs and projects.
3 As authorized by RTA Ordinance 2020-47, ICE amounts not required for operating funding may be redesignated for capital projects.
4 Includes Metra farebox capital program and transfers to RTA reserves (2019).

Page 12 of 85
Adopted 2021 Operating Budget, Two-Year Financial Plan,
and Five-Year Capital Program
Table 3. Proposed Uses of ICE Funding (dollars in thousands)
2021 2022 2023CTA
OperatingRapid Response Supplemental Bus Capacity 5,117
Projects To Be Determined 5,424 5,733 CTA Total $5,117 $5,424 $5,733
MetraCapital
Train Tracking and Passenger Counting System 4,158 4,407 4,658 Metra Total $4,158 $4,407 $4,658
PaceCapital
Transit Signal Priority Equipment 1,386 1,469 1,553 Pace Total $1,386 $1,469 $1,553
Total ICE Funding $10,661 $11,300 $11,944

Page 13 of 85
Adopted 2021 Operating Budget, Two-Year Financial Plan,
and Five-Year Capital Program
Primary RTA Public Funding Sources
RTA Sales Tax Part I: The original RTA sales tax, levied at 1.0% in Cook County and 0.25% in the collar counties of DuPage, Kane, Lake, McHenry, and Will. 85% of Sales Tax I receipts are distributed to the Service Boards according to a statutory formula. The remaining 15% of Sales Tax I is initially retained by the RTA to fund regional and agency expenses before being allocated at the direction of the RTA Board.
RTA Sales Tax Part II: Authorized by the 2008 funding reform, an additional sales tax of 0.25% in all six counties of the RTA region. Sales Tax II is distributed to the Service Boards according to a statutory formula after deducting funds for ADA Paratransit, Pace Suburban Community Mobility (SCMF), and RTA Innovation, Coordination, and Enhancement (ICE). After these deductions, CTA receives 48%, Metra 39%, and Pace Suburban Service 13%.
Real Estate Transfer Tax (RETT): The 2008 funding reform also increased the City of Chicago RETT by $1.50 per $500 of property transferred and dedicated this additional tax revenue to directly fund CTA operating expenses.
Public Transportation Fund (PTF) Part I: PTF Part I is State-provided funding comprised of a 25% match of Sales Tax I receipts. 100% of PTF I is retained by the RTA and combined with 15% of Sales Tax I to form the basis for funding to be allocated at the direction of the RTA Board.
Public Transportation Fund (PTF) Part II: PTF Part II, authorized by the 2008 funding reform, is State-provided funding equal to a 5% match of Sales Tax I receipts and a 30% match of Sales Tax II receipts and RETT receipts. After allocating 5/6 of the PTF on RETT receipts to CTA, the remaining PTF II is distributed to the Service Boards by the same statutory formula used to allocate Sales Tax II.
State Financial Assistance: State-provided assistance to reimburse the RTA’s debt service on Strategic Capital Improvement Program (SCIP) bonds. It consists of two components: Additional State Assistance (ASA) and Additional Financial Assistance (AFA).
State Reduced Fare Reimbursement: State-provided reimbursement to the Service Boards, via the RTA, to partially offset the cost of providing reduced fare and free ride programs mandated by law, including those for seniors and disabled persons.

Page 14 of 85
Adopted 2021 Operating Budget, Two-Year Financial Plan,
and Five-Year Capital Program
CTA Operating Budget CTA’s proposed budget reflects the continued operation of full service levels as ridership recovers from the COVID-19 pandemic. Thus, CTA exhausts remaining CARES Act funding sooner than the other Service Boards’ budget proposals. CTA’s budget clearly quantifies the need for additional relief funding, or an equivalent amount of budget balancing actions, beginning in 2021. Over the 2021-2023 period, CTA’s proposed operating budget and financial plan requires more than $1.1 billion of additional relief funding to balance projected expense levels.
“Over the last seven months, the CTA has provided an essential service to those who needed it the most: health care workers, emergency responders, grocery and manufacturing workers, and those needing to make essential trips. But in order to ensure we can continue to provide this critical service, we absolutely must receive additional funding from Congress.” Dorval R. Carter, Jr., CTA President
When comparing the proposed 2021 budget to the 2020 estimate, note that the 2020 estimate is based on an amended budget that reflects the impact of the COVID-19 pandemic on ridership, fare revenue, public funding, and expenses.
Ridership CTA experienced immediate and lasting ridership losses with the onset of COVID-19 mitigation efforts in March. Ridership dropped to about 20% of normal (2019) levels before slowly recovering to around 35% of normal by October. While CTA bus ridership has suffered less losses than rail ridership, CTA’s total 2020 ridership is projected to end the year at about 194 million, down 58% from 2019. The 2021 budget anticipates ridership of 209.7 million, or about 46% of normal levels, an increase of 8% from the 2020 estimate. Further recovery is anticipated for 2022 and 2023, with ridership assumed to reach 90% of normal for both bus and rail by the end of the 2021-2023 planning period.

Page 15 of 85
Adopted 2021 Operating Budget, Two-Year Financial Plan,
and Five-Year Capital Program
Figure 6. CTA Ridership (millions)
Fares No fare increases are included in the proposed CTA 2021 budget. As a result, CTA’s average fare of $1.18 in 2021 is largely unchanged from the 2020 estimate. Some fluctuation in average fare is to be expected across the planning period as ridership and ticket mix (i.e., pass and multi-day products versus single rides) vary during the recovery. CTA’s average fare accounts for ridership of all fare types, including a significant number of free and reduced fare rides.
Figure 7. CTA Average Fare
Service Levels CTA proposes to continue running a full schedule to meet customer demand amid physical distancing requirements. Vehicle revenue miles (VRM), a measure of the total distance vehicles travel while in revenue service, are expected to grow by 3.1% in 2021. Service effectiveness, as measured by passenger trips per vehicle revenue mile, is estimated to drop by more than 50%

Page 16 of 85
Adopted 2021 Operating Budget, Two-Year Financial Plan,
and Five-Year Capital Program
in 2020 and remain low in 2021 before increasing with the assumed ridership recovery through 2023
Figure 8. CTA Passenger Trips per Vehicle Revenue Mile
Operating Revenue Total operating revenue is projected to increase by 6.4% in 2021 to $739.9 million, including CTA’s remaining CARES Act funding and additional relief funding. Fare revenue is budgeted to grow by 12.1% due to increasing ridership. CTA’s share of the State reduced fare reimbursement subsidy is set at $14.6 million in 2021 and the planning years. CTA’s Other Revenue category is expected to grow by 14.3% to $75.4 million as advertising and ancillary revenue sources rebound.
Importantly, CTA’s operating revenue projection includes $263.5 million of CARES Act funding carried over from 2020, and additional relief funding of $138.0 million needed to meet the required recovery ratio. CTA’s operating revenue projection represents 45% of total revenue, as shown below.
Figure 9. CTA 2021 Revenues: $1.645 Billion

Page 17 of 85
Adopted 2021 Operating Budget, Two-Year Financial Plan,
and Five-Year Capital Program
Public Funding Total public funding for CTA operations in 2021 is projected at $905.2 million, 4.4% higher than the 2020 estimate. CTA’s assumptions for 2021 through 2023 match the RTA Board adopted marks for sales tax, Public Transportation Funds, RTA non-statutory funding, and ICE funding. These amounts include Chicago Real Estate Transfer Tax (RETT) receipts projected at $46.7 million to $52.4 million. ICE funding for 2021 totals $5.1 million and will be used for operations, with proposed uses shown above in Table 3 of the Regional Operating Budget section. CTA has also included $233.9 million of additional relief funding for 2021 to provide sufficient total revenue to balance anticipated operating expenses.
Expenses CTA’s proposed 2021 expense level is $1.645 billion, an increase of $82.4 million or 5.3% from the 2020 estimate, and an increase of $34.5 million or 2.1% from CTA’s pre-COVID 2021 Plan. CTA expenses are being driven higher by contractual wage increases, costs related to COVID-19 mitigation, and increased fringe expenses. Labor, CTA’s largest expense category, is budgeted to increase by 2.9% to $1.169 billion, while material expenses are expected to grow by 15.1% due to warranty expirations and purchase of personal protective equipment and cleaning supplies.
Figure 10. CTA 2021 Expenses: $1.645 Billion
Other expense increases are anticipated for CTA’s insurance and claims reserve, and higher debt service related to TIFIA loan repayments. Total expenses are forecast to grow by 2.1% and 2.8% in 2022 and 2023, respectively, reaching $1.726 billion.
CTA has advance purchased about 85% of its 2021 fuel requirements. Fuel expense of $38.1 million represents 2.3% of CTA’s total expense, and is budgeted at $2.29 per gallon, 52 cents lower than the 2020 estimate. CTA’s plan reflects a lower fuel price in 2022, for which it has

Page 18 of 85
Adopted 2021 Operating Budget, Two-Year Financial Plan,
and Five-Year Capital Program
advance purchased about 75% of its needs. As of October, no fuel has been locked in yet for 2023.
Figure 11. CTA Fuel Price Per Gallon
Cost efficiency is shown in the next chart by cost per vehicle revenue mile, which is projected to grow at an average annual rate of 2.2% across the five-year period as expenses increase with inflation while service levels remain essentially flat. Cost effectiveness is also measured, by evaluating the cost per passenger trip, which rises sharply to $8.07 with the ridership losses of 2020 before improving to $4.21 by 2023.
Figure 12. CTA Cost Efficiency and Effectiveness

Page 19 of 85
Adopted 2021 Operating Budget, Two-Year Financial Plan,
and Five-Year Capital Program
CARES Act and Additional Funding Need CTA was allocated $817.5 million of CARES Act relief funding to help offset fare revenue and public funding losses due to the COVID-19 pandemic. To balance expenses and meet its required recovery ratio, CTA’s proposed budget exhausts remaining CARES Act funding and calls for additional relief funding of $372 million in 2021, with a total of $1.121 billion required over the three-year financial planning period. If such funding does not materialize, CTA will likely be forced to implement significant service reductions and other budget balancing actions to reduce overall expenses.
Net Result and Recovery Ratio As shown in Table 4, CTA’s operating budget is balanced in 2021 through 2023 by the additional funding need, shown in red. Revenues equal expenditures, producing a net result of zero. CTA’s 2021 recovery ratio of 55.8%, calculated by dividing total operating revenue by total operating expenditures, with approved adjustments, meets the RTA Board adopted requirement of 54.75%. CTA has properly included CARES Act funding as operating revenue in 2021, and proposes to include a portion of the additional relief funding it has identified in 2021 through 2023 operating revenue.

Page 20 of 85
Adopted 2021 Operating Budget, Two-Year Financial Plan,
and Five-Year Capital Program
Table 4. CTA 2021 Budget and 2022-2023 Financial Plan (dollars in thousands) TABLE 10: CTA 2021 BUDGET AND 2022-2023 FINANCIAL PLAN (DOLLARS IN THOUSANDS)
2019 2020 2021 2022 2023
Actual Estimate Budget Plan Plan
Revenues
Operating Revenues
Passenger Revenue 585,297 221,479 248,275 468,238 497,502
State Reduced Fare Reimbursement 14,606 14,606 14,606 14,606 14,606 Other Revenue 97,274 66,017 75,436 85,146 91,029
CARES Act Funding - Fare Revenue Replacement 1 - 393,555 263,548 - -
Additional Relief Funding or Budget Balancing Actions 2 - - 137,991 183,290 170,997
Total Operating Revenues 697,177 695,657 739,856 751,280 774,135
Public Funding
Sales Tax I 388,833 323,505 324,778 344,265 363,888
Sales Tax II 56,974 56,509 38,088 42,196 44,214 PTF II 67,915 60,793 57,556 62,931 66,518 25% PTF on RETT 15,030 12,027 11,446 12,386 13,092
Non-Statutory Funding - PTF I 220,960 198,357 187,545 205,351 217,056
Non-Statutory Funding - ST I - 910 - - 988
Innovation, Coordination, and Enhancement Funding 3 6,127 5,142 5,117 5,424 5,733
City of Chicago RETT 62,373 49,426 46,740 49,544 52,368
CARES Act Funding - Public Funding Replacement - 160,384 - - -
Additional Relief Funding or Budget Balancing Actions - - 233,940 206,682 188,433
Total Public Funding 818,211 867,053 905,209 928,779 952,291
Total Revenues $1,515,388 $1,562,710 $1,645,065 $1,680,059 $1,726,425
Expenses
Labor 1,093,922 1,136,119 1,169,104 1,198,332 1,228,290
Material 67,652 76,252 87,767 90,400 93,112 Fuel 40,396 39,671 38,138 34,595 43,768 Power 31,560 27,699 31,685 32,385 31,012 Insurance & Claims 7,500 22,000 31,680 31,680 31,680 Purchase of Security Services 14,920 20,163 20,176 20,479 20,786 Other Expenses 259,438 240,806 266,515 272,188 277,778
Total Expenses $1,515,388 $1,562,710 $1,645,065 $1,680,059 $1,726,425
ICE funding not used for operations - transfer to capital 3 - - - - -
Net Result $0 $0 $0 $0 $0
Recovery Ratio 56.3% 54.8% 54.8% 54.8% 54.8%
1 Authorized to be included as operating revenue for recovery ratio purposes by RTA Ordinance 2020-20.2 Assumed to be authorized for inclusion as operating revenue for recovery ratio purposes.3 As authorized by RTA Ordinance 2020-47, ICE amounts not required for operating funding may be redesignated for capital projects.

Page 21 of 85
Adopted 2021 Operating Budget, Two-Year Financial Plan,
and Five-Year Capital Program
Metra Operating Budget Metra’s proposed operating budget reflects the continuation of the temporary service reductions implemented in response to the COVID-19 pandemic, then gradually restores service over the 2021-2023 planning period to match anticipated ridership recovery. Although Metra’s proposed budget does not depend on additional relief funding beyond that provided by the CARES Act, Metra’s budget message clearly states that an additional $570 million of relief funding would be required over the 2021-2023 period for Metra to operate the normal service levels it would prefer to offer its customers.
“Without more financial assistance, we face some awful and extremely difficult choices, including cuts in service. With our sister agencies in Chicago and across the country in the same predicament, we need to get the message out that public transportation will be severely curtailed without additional financial relief.” Jim Derwinski, Metra CEO/Executive Director
When comparing the proposed 2021 budget to the 2020 estimate, note that the 2020 estimate is based on an amended budget that reflects the impact of the COVID-19 pandemic on ridership, fare revenue, public funding, and expenses.
Ridership Following the onset of the COVID-19 pandemic in March, Metra ridership plummeted to about 3% of normal (2019) levels before slowly recovering to around 10% of normal by October. Metra’s 2020 ridership is projected to end the year at about 20 million, down 73% from 2019. The 2021 budget anticipates ridership of 24.3 million, or about 33% of normal levels — an increase of 22% from the 2020 estimate. Further recovery is anticipated for 2022 and 2023, with ridership assumed to reach 80% of normal by the end of the planning period.
Figure 13. Metra Ridership (millions)

Page 22 of 85
Adopted 2021 Operating Budget, Two-Year Financial Plan,
and Five-Year Capital Program
Fares No fare increases are proposed for 2021. A new Saturday or Sunday one-day pass will be introduced, with unlimited rides for $7. Metra will also update the existing weekend pass to be available only on the mobile app. Other pilot projects to be explored in 2021 include a welcome back initiative, multi-day passes, off-peak pricing, and a loyalty program. Metra’s average fare is budgeted at $5.08 in 2021. Fluctuation in average fare is apparent across the five-year period because the mix of ticket types is expected to vary as customers adjust travel patterns during the recovery.
Figure 14. Metra Average Fare
Service Levels COVID-19 related ridership declines prompted Metra to temporarily institute significant service reductions on all lines, with alternate weekday schedules and modification or suspension of weekend service. Metra’s 2021 budget extends those service reductions until additional revenue becomes available.
Service effectiveness, as measured by passenger trips per vehicle revenue mile (VRM), declined sharply with the 2020 ridership losses. As ridership recovers while Metra’s schedule remains reduced, effectiveness is projected to increase steadily in 2021 and the two-year planning period, nearing 2019 levels by 2023.

Page 23 of 85
Adopted 2021 Operating Budget, Two-Year Financial Plan,
and Five-Year Capital Program
Figure 15. Metra Passenger Trips Per Vehicle Revenue Mile
Operating Revenue Metra anticipates that total 2021 operating revenues will decrease by about 6% to $341.5 million, but fare revenue is budgeted to increase by 9% due to higher ridership. As authorized by the RTA Board, federal CARES Act funding requisitioned to replace lost fare revenue may continue to be counted by the Service Boards as operating revenue for the purpose of meeting required recovery ratios. Such CARES Act funding of $184.0 million is included as Metra’s largest operating revenue source for 2021. Metra’s $1.6 million share of the State reduced fare reimbursement and other revenue of $32.5 million round out the operating revenue picture. Other revenue includes lease of space, advertising income, and capital credits.
Operating revenues comprise about 49% of Metra’s total revenue for operations, with the balance provided by public funding sources.
Figure 16. Metra 2021 Revenues: $704.2 Million

Page 24 of 85
Adopted 2021 Operating Budget, Two-Year Financial Plan,
and Five-Year Capital Program
Public Funding Metra’s total 2021 public funding is projected to be $362.7 million, a 4.0% decrease compared to the 2020 estimate. While sales tax and PTF receipts are forecast to decline further in 2021, federal CARES Act funding of $22.2 million is expected to be requisitioned to partially offset those funding losses.
Metra’s public funding assumptions match the RTA Board adopted marks for sales tax, PTF, RTA non-statutory funding, and ICE funding. Metra’s share of the 2021-2023 ICE funding is allocated to the capital program, with proposed uses shown in Table 3 of the Regional Operating Budget section.
Expenses Proposed 2021-2023 expenses reflect the levels that Metra can afford, given the reduced revenue environment. Metra projects that 2021 total expenses must decrease by almost 5% from the 2020 estimate, to $700.0 million, about 18% lower than Metra’s pre-COVID 2021 Plan. To reach this $700 million total expense level, Metra’s Operations expense for full-schedule service of $669.5 million requires targeted cost savings of $124.9 million. While approximately $55 million of that target can be achieved by the continuation of reduced service levels, another $70 million of required cost savings are yet to be identified for 2021. When aggregated, Metra’s remaining expense categories — Insurance, Administration, Fuel, and Power — reflect the reduced operating schedule and as a result are flat relative to the 2020 estimate.
Figure 17. Metra 2021 Expenses: $700.0 Million
Diesel fuel expenditures, comprising about 5% of Metra’s total operating expenses, are expected to decrease by 18% in 2021 to $35.1 million due to a combination of lower consumption related to service reductions and the locking in of 2021 fuel purchases at favorable rates. Fuel price is budgeted at $1.93 per gallon, representing a 32 cent decrease from the 2020 estimate.

Page 25 of 85
Adopted 2021 Operating Budget, Two-Year Financial Plan,
and Five-Year Capital Program
Figure 18. Metra Fuel Price Per Gallon
Electricity expense for the Metra Electric District line is budgeted to increase by 2.9% in 2021, to $3.5 million. For 2022, Metra’s overall expenses are planned to decrease by 3.1% before growing by a similar amount in 2023. This results in generally flat total expenses across the period, necessary for Metra to maintain balance with projected revenues.
Cost efficiency is shown in the next chart by cost per vehicle revenue mile, which is projected to increase in 2020 as fixed costs are spread over fewer revenue miles due to the service reductions. Cost effectiveness is shown as cost per passenger trip, which more than triples in 2020 because of the sharp COVID-related ridership decline. Both measures should improve in 2021-2023 if ridership recovers as expected.
Figure 19. Metra Cost Efficiency and Effectiveness

Page 26 of 85
Adopted 2021 Operating Budget, Two-Year Financial Plan,
and Five-Year Capital Program
CARES Act and Additional Funding Need Metra was allocated $479.2 million of CARES Act relief funding to help offset fare revenue and public funding losses due to the COVID-19 pandemic. To meet its required recovery ratio, Metra’s budget solution constrains overall expense via reduced service, allowing CARES Act funding drawdowns to extend into 2022.
To operate a full-service schedule, Metra has stated the need for a total of $570 million of additional relief funding over the 2021-2023 period. If such funding does not materialize, Metra will be forced to continue to operate reduced service levels and rely on yet to be determined cost reductions. These cost reductions could include further schedule reductions and other actions to balance the operating budget.
Net Result and Recovery Ratio As shown in Table 5, Metra’s operating budget is balanced in 2021 through 2023 by the targeted cost savings related to operations, shown in red. Revenues equal expenditures, producing a net result of zero. By 2022, Metra’s funding level allows for the resumption of fare revenue transfers to the capital program, since not all funding may be expended on operations while still meeting recovery ratio requirements.
Metra’s 2021 through 2023 recovery ratios, calculated by dividing total operating revenue by total operating expenditures, with approved adjustments, meet or exceed the RTA Board adopted requirement of 52.5%. Metra has properly included CARES Act funding as operating revenue in both 2021 and 2022.

Page 27 of 85
Adopted 2021 Operating Budget, Two-Year Financial Plan,
and Five-Year Capital Program
Table 5. Metra 2021 Budget and 2022-2023 Financial Plan (dollars in thousands) TABLE 12: METRA 2021 BUDGET AND 2022-2023 FINANCIAL PLAN (DOLLARS IN THOUSANDS)
2019 2020 2021 2022 2023Actual Estimate Budget Plan Plan
RevenuesOperating RevenuesPassenger Revenue 365,935 113,200 123,400 240,900 301,400 State Reduced Fare Reimbursement 1,618 1,618 1,618 1,618 1,618 Other Revenue 44,285 35,952 32,466 32,494 34,963 CARES Act Funding - Fare Revenue Replacement 1 - 210,500 184,000 50,900 - Total Operating Revenues 411,839 361,270 341,484 325,912 337,981
Public FundingSales Tax I 306,654 258,982 256,105 271,472 286,946 Sales Tax II 46,291 45,913 30,947 34,284 35,924 PTF II 55,181 49,394 46,764 51,132 54,046 Non-Statutory Funding - PTF I - - - - - Non-Statutory Funding - ST I - 740 - - 803 Innovation, Coordination, and Enhancement Funding 2 4,978 4,178 4,158 4,407 4,658 Joint Self Insurance Fund (JSIF) Reserve 2,500 - 2,500 - - Homeland Security Grant 1,500 - - - - CARES Act Funding - Public Funding Replacement - 11,700 22,200 - Prior Year PBV - 7,000 - - - Total Public Funding 417,105 377,908 362,673 361,295 382,376
Total Revenues $828,943 $739,178 $704,158 $687,207 $720,358
ExpensesOperations 625,794 579,800 669,500 693,200 716,000 Targeted Cost Savings - Operations 3 - - (124,900) (177,400) (191,100) Claims & Insurance 20,532 18,500 18,300 18,700 19,000 Administration 91,408 90,500 98,500 98,500 98,500 Diesel Fuel 64,475 42,800 35,100 41,000 55,300 Electricity - 3,400 3,500 4,000 4,300
Total Expenses 802,210 735,000 700,000 678,000 702,000
ICE funding not used for operations - transfer to capital 2 (4,978) (4,178) (4,158) (4,407) (4,658) Farebox capital program (7,000) - - (4,800) (13,700)
Net Result $14,756 $0 $0 $0 $0
Recovery Ratio 54.9% 53.0% 53.0% 52.5% 52.5%
1 Authorized to be included as operating revenue for recovery ratio purposes by RTA Ordinance 2020-20.2 As authorized by RTA Ordinance 2020-47, ICE amounts not required for operating funding may be redesignated for capital projects.3 Expected to be achieved through a combination of reduced service and other as yet undetermined cost reduction actions.

Page 28 of 85
Adopted 2021 Operating Budget, Two-Year Financial Plan,
and Five-Year Capital Program
Pace Suburban Bus Service Operating Budget Pace’s proposed operating budget makes the temporary service reductions implemented following the onset of the COVID-19 pandemic permanent until operating funding recovers to sufficient levels. Even at these reduced service levels, Pace’s three-year operating plan requires an additional $88.6 million of relief funding to balance projected expense levels.
“Our funding streams have been devastated by the COVID-19 pandemic. We will continue to provide the highest level of service possible with the resources we have, but we’re approaching a cliff. We need help. We need federal relief to continue providing the critical transportation service our region needs.” Rocky Donahue, Pace Executive Director
When comparing the proposed 2021 budget to the 2020 estimate, note that the 2020 estimate is based on an amended budget that reflects the impact of the COVID-19 pandemic on ridership, fare revenue, public funding, and expenses.
Ridership Pace ridership is estimated to finish 2020 at 15.3 million, a 46% decrease from the prior year. Following the onset of the COVID-19 pandemic in March, Pace ridership quickly declined to about 25% of normal (2019) levels before slowly recovering to around 45% of normal in October. Combined ridership for Pace’s three Suburban Service modes is budgeted to increase by 12% in 2021 to 17.2 million, or about 60% of normal levels. Further recovery is anticipated for 2022 and 2023, with ridership expected to reach 73% of normal by the end of the 2021-2023 planning period.
Figure 20. Pace Ridership (millions)

Page 29 of 85
Adopted 2021 Operating Budget, Two-Year Financial Plan,
and Five-Year Capital Program
Fares Pace last implemented a general 25 cent fare increase in January 2018, and the 2021 budget does not contain any proposed fare adjustments. Pace’s average fare across all fare and pass types was $1.26 in 2019 and is projected to remain fairly steady through 2023 with some minor fluctuations as ridership recovers. Pace’s two-year financial plan does incorporate budget balancing actions in 2022 and 2023, which could include future fare adjustments.
Figure 21. Pace Average Fare
Service Levels In response to COVID-19-related ridership declines, Pace temporarily suspended or reduced service on almost 100 bus routes in May 2020. Pace’s 2021 budget extends those service reductions and makes them permanent until additional funding becomes available. Specifically, 73 routes are proposed to be discontinued and 25 more will have reduced service, contingent upon customer feedback at Pace’s required public hearings. A complete list of the affected routes is available in Pace’s 2021 Proposed Budget document.
Service effectiveness, as measured by passenger trips per vehicle revenue mile (VRM), declined sharply with the 2020 ridership losses. As ridership recovers while Pace’s schedule remains reduced, effectiveness is projected to increase steadily in 2021 and the two-year planning period, nearing 2019 levels by 2023.

Page 30 of 85
Adopted 2021 Operating Budget, Two-Year Financial Plan,
and Five-Year Capital Program
Figure 22. Pace Passenger Trips Per Vehicle Revenue Mile
Operating Revenue Pace projects that total 2021 operating revenues will increase by 9.6% to $57.8 million, driven by higher fare revenue of $23.0 million as ridership begins to recover. As authorized by the RTA Board, federal CARES Act funding requisitioned to replace lost fare revenue may continue to be included by the Service Boards as operating revenue for the purpose of meeting required recovery ratios. CARES Act funding of $19.6 million is projected as Pace’s second largest operating revenue source for 2021. Pace’s $1.3 million share of the State reduced fare reimbursement and other revenue of $13.8 million round out the operating revenue picture. Other revenue includes investment income, advertising income, and local government contributions for specific Pace services.
Operating revenue comprises less than 25% of Pace’s total revenue for operations, with the balance provided by public funding sources.
Figure 23. Pace 2021 Revenues: $240.8 Million

Page 31 of 85
Adopted 2021 Operating Budget, Two-Year Financial Plan,
and Five-Year Capital Program
Public Funding Pace’s total 2021 public funding is projected to increase by 8.7% from the 2020 estimate to $182.9 million. While sales tax and PTF receipts are expected to decline further in 2021, federal CARES Act funding of $34.6 million is expected to be requisitioned to offset those funding losses.
Pace’s public funding assumptions match the RTA Board adopted marks for sales tax, PTF, Suburban Community Mobility Funds, South Suburban Job Access Funds, RTA non-statutory funding, and ICE funding. Pace’s share of the 2021-2023 ICE funding is allocated to the capital program, with proposed uses shown in Table 3 of the Regional Operating Budget section. In addition to RTA funding, Pace anticipates $6.1 million of federal CMAQ / Enhanced Mobility funding for operations in 2021.
Expenses Pace projects that 2021 total expenditures will increase from the 2020 estimate by 8.2%, to $239.4 million, a decrease of about 3% from Pace’s pre-COVID 2021 Plan. Labor, Pace’s largest expense category, is expected to increase by 5.5% to $140.6 million. Expense growth in the Materials and Purchased Transportation categories is being driven by the relocation of $14.6 million of preventive maintenance and capital cost of contracting expenses from the capital program to the operating budget. As a result, Pace’s proposed 2021 total expenses are essentially unchanged from the original 2020 operating budget.
Figure 24. Pace 2021 Expenses: $239.4 Million
Pace’s fuel expense is projected to grow by 11.9% to $8.6 million. Consumption is expected to decrease by about 7% in 2021 due to the full-year impact of service reductions, but this is more than offset by an assumed price increase to $1.52 per gallon.

Page 32 of 85
Adopted 2021 Operating Budget, Two-Year Financial Plan,
and Five-Year Capital Program
Figure 25. Pace Fuel Price Per Gallon
Cost efficiency is shown in the next chart by cost per vehicle revenue mile, which grows at an average rate of 11.5% per year as fixed costs are spread over fewer revenue miles due to the ongoing schedule reductions. Cost effectiveness is shown as cost per passenger trip, which nearly doubles in 2020 because of the sharp COVID-related ridership decline before improving as ridership slowly recovers.
Figure 26. Pace Cost Efficiency and Effectiveness

Page 33 of 85
Adopted 2021 Operating Budget, Two-Year Financial Plan,
and Five-Year Capital Program
CARES Act and Additional Funding Need Pace Suburban Bus Service was allocated $112.8 million of CARES Act relief funding to offset fare revenue and public funding losses due to the COVID-19 pandemic. Pace projects that its CARES Act funding will last into 2022, due in part to cost savings from ongoing schedule reductions.
To fully balance Pace’s projected 2022 and 2023 expense levels, additional funding of $88.6 million is required. If such funding does not materialize, Pace will be forced to implement budget balancing actions which could include further service reductions and fare adjustments.
Net Result and Recovery Ratio As shown in Table 6, Pace’s operating budget is balanced in 2021 through 2023 by the additional funding need, shown in red. Revenues equal expenditures, producing a net result of zero.
Pace’s 2021 through 2023 recovery ratios — calculated by dividing total operating revenue by total operating expenditures, with approved adjustments — exactly meet the RTA Board adopted requirement of 30.3%, contingent upon the additional funding being approved for inclusion as operating revenue, similar to the CARES Act funding.

Page 34 of 85
Adopted 2021 Operating Budget, Two-Year Financial Plan,
and Five-Year Capital Program
Table 6. Pace Suburban Bus Service 2021 Budget and 2022-2023 Financial Plan (dollars in thousands) TABLE 14: PACE SUBURBAN SERVICE 2021 BUDGET AND 2022-2023 FINANCIAL PLAN (DOLLARS IN THOUSANDS)
2019 2020 2021 2022 2023Actual Estimate Budget Plan Plan
RevenuesOperating RevenuesPassenger Revenue 36,050 17,979 23,014 24,959 27,128 State Reduced Fare Reimbursement 1,346 1,346 1,346 1,346 1,346 Other Revenue 18,199 13,768 13,824 14,636 15,277 CARES Act Funding - Fare Revenue Replacement 1 - 19,689 19,644 20,428 - Additional Relief Funding or Budget Balancing Actions 2 - - - - 20,954 Total Operating Revenues 55,595 52,782 57,828 61,369 64,705
Public FundingSales Tax I 97,174 82,038 81,150 86,020 90,923 Sales Tax II 15,413 15,304 10,316 11,428 11,975 PTF II 18,394 16,465 15,588 17,044 18,015 Suburban Community Mobility Fund 25,528 21,426 21,321 22,601 23,889 South Suburban Job Access Fund 7,500 7,500 7,500 7,500 7,500 Non-Statutory Funding - PTF I 4,509 4,048 3,827 4,191 4,430 Non-Statutory Funding - ST I - 247 - - 268 Innovation, Coordination, and Enhancement Funding 3 440 1,393 1,386 1,469 1,553 ICE Carryover (2019) 4 - 30 1,211 - - CMAQ / Enhanced Mobility 6,692 7,893 6,070 4,142 72 CARES Act Funding - Public Funding Replacement - 12,018 34,577 6,401 - Additional Relief Funding or Budget Balancing Actions - - - 28,864 38,755 Total Public Funding 175,650 168,362 182,947 189,659 197,379
Total Revenues $231,245 $221,144 $240,775 $251,028 $262,084
ExpensesLabor/Fringes 129,874 133,371 140,644 144,558 148,191 Health Insurance 24,686 27,166 26,398 28,351 30,449 Parts/Supplies 6,166 5,816 9,233 9,922 10,635 Purchased Transportation 25,725 16,778 22,194 23,642 26,107 Fuel 12,394 7,693 8,611 9,321 10,042 Utilities 2,506 2,875 3,066 3,254 3,448 Insurance 9,685 10,407 11,089 11,918 12,778 Other Expenses 14,907 17,038 18,153 18,593 18,881
Total Expenses $225,943 $221,144 $239,388 $249,559 $260,531
ICE funding not used for operations - transfer to capital 3 - - (1,386) (1,469) (1,553)
Net Result $5,302 $0 $0 $0 $0
Recovery Ratio 30.8% 30.3% 30.3% 30.3% 30.3%
1 Authorized to be included as operating revenue for recovery ratio purposes by RTA Ordinance 2020-20.2 Assumed to be authorized for inclusion as operating revenue for recovery ratio purposes.3 As authorized by RTA Ordinance 2020-47, ICE amounts not required for operating funding may be utilized for approved capital projects.4 Carried forward due to delayed start-up of Milwaukee Ave Pulse service.

Page 35 of 85
Adopted 2021 Operating Budget, Two-Year Financial Plan,
and Five-Year Capital Program
Pace ADA Paratransit Operating Budget The COVID-19 pandemic had an immediate and out-sized impact on Pace’s ADA Paratransit operation. To protect customers from the risk of infection, Pace suspended shared rides, which effectively undid years of efficiency gains Pace had achieved. In addition, Pace implemented driver retention actions to avoid a driver shortage as demand began to recover. The RTA ADA Paratransit reserve was tapped in 2020 to maintain a sufficient level of overall funding, but for 2021-2023, only Sales Tax II and State funding are utilized to meet Pace’s ADA Paratransit funding requirement.
Ridership ADA Paratransit ridership declined sharply at the onset of the COVID-19 pandemic and stay-at-home order in March. Pace expects ridership to finish 2020 at 2.2 million, down about 50% from 2019. Pace’s proposed budget projects that ADA Paratransit ridership, including companions, will rebound by 19.1% in 2021 to 2.6 million, or about 60% of normal (2019) ridership.
When comparing the proposed 2021 budget to the 2020 estimate, note that the 2020 estimate is based on an amended budget that reflects the impact of the COVID-19 pandemic on ridership, fare revenue, public funding, and expenses.
Figure 27. Pace ADA Paratransit Ridership (millions)
Taxi Access Program (TAP) ridership is forecast at 189,000 or about 77% of 2019 levels, as Pace continues to emphasize that mode as a cost-effective alternative to traditional ADA Paratransit service. Total ridership is projected to remain flat in 2022 before increasing by 5% in 2023, ending the 2021-2023 planning period at 2.7 million.

Page 36 of 85
Adopted 2021 Operating Budget, Two-Year Financial Plan,
and Five-Year Capital Program
Fares No fare increase has been proposed by Pace for 2021, so the base ADA Paratransit fare will remain at $3.25. The TAP fare was reduced from $5.00 to $3.00 in 2017 and will also be unchanged for 2021. Because personal care attendants of ADA Paratransit riders are included in ridership totals but do not pay a separate fare, the average fare across all riders is less than the base fare and is projected to remain constant at $2.77 through 2023.
Figure 28. Pace ADA Paratransit Average Fare
Service Levels ADA Paratransit service levels are driven by customer demand. Pace projects that ADA Paratransit vehicle revenue miles will decrease by 44% in 2020, less than the projected ridership decline, due to the suspension of shared rides. As a result, service effectiveness, as measured by passenger trips per vehicle revenue mile, is expected to decrease from pre-COVID levels before stabilizing over the three-year planning period.
Figure 29. Pace ADA Paratransit Passenger Trips Per Vehicle Revenue Mile

Page 37 of 85
Adopted 2021 Operating Budget, Two-Year Financial Plan,
and Five-Year Capital Program
Operating Revenue Pace projects that 2021 ADA Paratransit operating revenues will increase by 15.1% to $9.3 million as ridership begins to recover. Fare revenue is expected to increase with ridership, but most of the operating revenue gains are in Other revenue, consisting of payments for RTA certification trips and a small amount of investment income. Other revenue is projected to more than double in 2021 to $2.1 million. Operating revenue comprises only about 5% of Pace’s total revenue for operations, with the balance provided by public funding sources.
Figure 30. Pace ADA Paratransit 2021 Revenues: $175.0 Million
Public Funding In 2011, the RTA Act was amended to ensure that ADA Paratransit operations are fully funded each year. In the 2021 budget, Pace projects an ADA Paratransit funding need of $165.7 million, satisfied by Sales Tax II funds of $157.3 million and additional state funding of $8.4 million. Due to the ongoing impacts of COVID-19 on ridership and cost efficiency, there is considerable uncertainty in the 2021 funding requirement. If additional ADA funding is needed, the RTA Board may be asked to approve the use of ADA Paratransit reserve funds or an additional sales tax allocation. Pace’s two-year financial plan indicates that adopted RTA funding levels should be sufficient for 2022 and 2023, if Pace’s ridership assumptions hold true.
Expenses Pace projects that 2021 operating expenditures for ADA Paratransit will increase by 3.6% to $175.0 million, balanced with revenue, followed by increases of 3.3% and 5.9% in 2022 and 2023, respectively. Purchased transportation, which accounts for 85% of total ADA Paratransit expenses, is budgeted to increase by 1.8% in 2021, and the regional ADA support allocation, which accounts for work done by other Pace departments in support of ADA Paratransit, is projected at $9.4 million, an increase of 3.3% from 2020.

Page 38 of 85
Adopted 2021 Operating Budget, Two-Year Financial Plan,
and Five-Year Capital Program
Figure 31. Pace ADA Paratransit 2021 Expenses: $175.0 Million
With the new provider contracts in the City of Chicago service area effective in April 2020, Pace now purchases fuel for ADA Paratransit service in both the City and suburban service areas. As a result, fuel expense now comprises about 4% of Pace’s total ADA Paratransit expenses. Due to this contractual change, fuel expenses are projected to grow by almost 73% in 2021 to $6.6 million, with an assumed fuel price of $2.13 per gallon, flat relative to 2019.
Figure 32. Pace ADA Paratransit Fuel Price Per Gallon
Cost efficiency is shown in the next chart by cost per vehicle revenue mile, which increased to $12.05 with the COVID-19 disruptions of 2020 but is projected to stabilize at around $10 in 2021 and the two-year financial planning period. Cost effectiveness, shown as cost per passenger trip, jumped to almost $78 in 2020 as Pace implemented single rides and driver retention initiatives. Cost per trip is budgeted at $67.64 in 2021, a decrease from 2020, but 57% higher than pre-COVID (2019) levels.

Page 39 of 85
Adopted 2021 Operating Budget, Two-Year Financial Plan,
and Five-Year Capital Program
Figure 33. Pace ADA Paratransit Cost Efficiency and Effectiveness
Net Result and Recovery Ratio As shown in Table 7, the proposed Regional ADA Paratransit operating budget is balanced in 2021 through 2023, with revenues equal to expenditures, producing a net result of zero in each year.
Pace’s 2021 through 2023 recovery ratios, calculated by dividing total operating revenue by total operating expenditures, with approved adjustments, meet the statutory requirement of 10%. Pace’s capital cost of contracting expense exclusion of $72.1 million in 2021 recognizes that a portion of Pace’s purchased transportation expense represents payment to ADA Paratransit contractors for their capital investments, rather than operating expenses. An additional security expense exclusion of $9.9 million was applied to offset efficiency losses due to the provision of single rides.

Page 40 of 85
Adopted 2021 Operating Budget, Two-Year Financial Plan,
and Five-Year Capital Program
Table 7. Pace Regional ADA Paratransit 2021 Budget and 2022-2023 Financial Plan (dollars in thousands) TABLE 17: PACE REGIONAL ADA PARATRANSIT 2021 BUDGET AND 2022-2023 FINANCIAL PLAN (DOLLARS IN THOUSANDS)
2019 2020 2021 2022 2023Actual Estimate Budget Plan Plan
RevenuesOperating RevenuesPassenger Revenue 11,988 7,148 7,157 7,157 7,515 Other Revenue 1 3,089 931 2,141 2,189 2,334 Total Operating Revenues $15,077 $8,079 $9,298 $9,346 $9,849
Public FundingSales Tax II 164,631 121,003 157,285 162,925 173,019 RTA ADA Paratransit Reserve - 31,428 - - - Additional State Funding 8,395 8,395 8,395 8,395 8,395 Total Public Funding $173,025 $160,826 $165,680 $171,320 $181,414
Total Revenues $188,102 $168,905 $174,978 $180,666 $191,263
ExpensesLabor/Fringes 4,040 4,169 4,294 4,423 4,555 Health Insurance 683 863 885 907 930 Admin Expenses 3,282 3,461 2,604 2,671 2,737 Fuel 2,448 3,828 6,611 6,781 7,296 Insurance 991 809 933 957 981 RTA Certification Trips 1,484 738 1,735 1,779 1,912 Purchased Transportation 162,686 145,911 148,483 153,433 162,844 Regional ADA Support Allocation 2 8,311 9,127 9,432 9,715 10,006
Total Expenses $183,925 168,905 174,978 $180,666 191,263
Net Result $4,177 $0 $0 $0 $0
Recovery Ratio 10.4% 10.0% 10.0% 10.0% 10.0%
1 Includes investment income and reimbursements for RTA certification trips, and also residual Medicaid reimbursements in 2019.2 Accounts for work done by other Pace departments in support of ADA Paratransit activities.

Page 41 of 85
Adopted 2021 Operating Budget, Two-Year Financial Plan,
and Five-Year Capital Program
RTA Agency Operating Budget The May 2020 RTA funding amendment reduced the amount of sales tax available for RTA requirements. In response, $3.5 million of Agency budget savings was identified, and a revised Agency budget was adopted in August 2020. The amended 2020 Agency budget was funded at $31.7 million, a reduction of 10% from the original 2020 budget. The proposed 2021 Agency budget has zero growth, and maintains this $31.7 million funding level through 2022.
Background The Regional Transportation Authority (RTA) is the oversight, funding and regional planning agency for the three Service Boards: Chicago Transit Authority (CTA) bus and rail, Metra Commuter Rail, and Pace Suburban Service and Regional ADA Paratransit.
The RTA’s primary source of operating funding is a regional sales tax which is matched by the State of Illinois via the Public Transportation Fund (PTF).
Most of the RTA sales tax collections and PTF pass directly through the RTA to CTA, Metra, and Pace according to pre-determined, statutory formulas. The remainder of the sales tax and PTF is distributed at the direction of the RTA Board. A portion of this funding covers the RTA agency administrative costs, regional services and programs, and regional debt service expense.
The 2021 Agency operating budget was developed in two parts in order to continue the RTA’s support of regional programs and services. First is the RTA Agency Administration Budget, which includes the core agency expenses for staff, facilities, information technology, office services, and professional services to support the funding, planning, and oversight mission of the RTA.
Second is the RTA Regional Programs Budget, which includes Regional Services provided directly to the public by the RTA such as ADA Certification, Mobility Management Services, Travel Information, Customer Service, and the Reduced Fare and Transit Benefit Programs. The Regional Programs Budget also includes all of the RTA’s grant-funded projects, RTA-funded regional studies and initiatives, and regional capital programs.
RTA Agency Administration Budget In 2021, total Agency Administration operating expenses of $16.1 million are $1.3 million or 7.2% lower than the 2020 estimate. The 2021 Administration Budget accounts for 42.3% of RTA Agency expenses and is 44.4% below the 2021 administrative expense cap of $29.0 million set by the RTA Act. Administration expenses are expected to remain flat in 2022 before increasing in line with projected sales tax revenues in 2023.

Page 42 of 85
Adopted 2021 Operating Budget, Two-Year Financial Plan,
and Five-Year Capital Program
RTA Regional Programs Budget In 2021, total Regional Programs revenue of $6.4 million is comprised of Regional Services Operating Revenue of $0.4 million and federal grants for Regional Projects totaling $6.0 million. The grant revenue for Regional Projects is $1.2 million greater than the 2020 estimate.
Total Regional Programs expenses of $22.0 million, the sum of the Regional Services Operating Expense and the Grant and RTA Funded Project Expenses, comprise the remaining 57.7% of total RTA Agency expenses. This amount is 13.4% higher than the 2020 estimate due primarily to increased and contractually obligated Purchased Service expense of the mostly outsourced Mobility Services Programs. For 2021 these additional costs are being funded from RTA reserves. Overall Regional Services expenses are projected to be $1.3 million or 9.4% higher than the 2020 estimate, and Regional Programs are also budgeted $1.3 million higher than the 2020 estimate.
The overall RTA Agency operating expense of $38.1 million is projected to be 3.7% higher than the 2020 estimate, primarily due to an increase in Regional Services operating expense and Grant-Funded Program expense, partially offset by lower Administration expense. The overall Agency expense level is budgeted to remain flat in 2022 before increasing in 2023.
Figure 34. 2021 RTA Agency Expenses: $38.1 Million
Sales Tax and CARES Act Funding The Agency was allocated $28.8 million, or 2.0%, of the total $1.438 billion of federal CARES Act funding awarded to the RTA region. Following expected drawdowns of $11.3 million in 2020, the 2021 budget utilizes $12.7 million of CARES Act funding to offset lower regional sales tax receipts, with the remaining $4.8 million programmed for 2022.

Page 43 of 85
Adopted 2021 Operating Budget, Two-Year Financial Plan,
and Five-Year Capital Program
As shown in Table 8, the combination of operating revenue of $0.4 million, grant revenue of $6.0 million, sales tax of $19.0 million, and CARES Act funding of $12.7 million comprise total Agency revenue for 2021, and together balance the overall RTA Agency operating budget expenses of $38.1 million. Sales tax receipts and CARES Act funds comprise 83.3% of total 2021 Agency revenues.
Figure 35. 2021 RTA Agency Revenues: $38.1 Million

Page 44 of 85
Adopted 2021 Operating Budget, Two-Year Financial Plan,
and Five-Year Capital Program
Table 8. RTA Agency 2021 Budget and 2022-2023 Financial Plan (dollars in thousands) TABLE 18: RTA AGENCY 2021 BUDGET AND 2022-2023 FINANCIAL PLAN (DOLLARS IN THOUSANDS)
2019 2020 2021 2022 2023Actual Estimate Budget Plan Plan
RevenuesOperating RevenueAdministrative Operating Revenue 559 0 0 0 0Regional Services Operating Revenue 674 230 373 373 408Total Operating Revenue $1,233 $230 $373 $373 $408
Public FundingFederal Grants 6,650 4,800 6,000 6,000 6,566Sales Tax I 34,185 20,357 19,029 26,905 34,672CARES Act Funding - Public Funding Replacement 0 11,328 12,656 4,780 0Total Public Funding $40,835 $36,485 $37,685 $37,685 $41,238
Total Revenues $42,068 $36,716 $38,058 $38,058 $41,647
ExpensesAdministrative Operating Expenses 1 17,699 17,347 16,091 16,091 17,609
Regional Services Operating Expenses 2 17,183 13,749 15,037 15,037 16,455Grant and RTA Funded Multi Year Project Expenses 7,187 5,620 6,930 6,930 7,583Total Expenses $42,068 $36,716 $38,058 $38,058 $41,647
Net Result $0 $0 $0 $0 $0
2 2019 includes additional amounts that were set aside for regional services operations.
1 2019 includes additional amounts that were set aside for pension contributions, IT infrastructure and network

Page 45 of 85
Adopted 2021 Operating Budget, Two-Year Financial Plan,
and Five-Year Capital Program
Regional Capital Program Capital programming is a core function of the RTA. Section 2.01b of the RTA Act (70 ILCS 3615/) requires the RTA Board to annually adopt a regional Five-Year Regional Capital Program that is guided by a strategic plan (Invest in Transit) and is fiscally constrained by the annual budget and two-year financial plan. Once the capital program is adopted, the expenditures of CTA, Metra, and Pace are subjected to continual review so that the RTA may budget and ensure that funds available to the region are spent with maximum efficiency. The purpose of this document is to fulfill the RTA’s statutory requirements and, just as important, to provide insights into the strategic benefits of transit capital investment underway in the region.
For the last several years, the RTA and the Service Boards have been working together to articulate and advance a regional transit capital strategy. Invest in Transit emphasizes the importance of transit in Northeastern Illinois and infrastructure investment for the three transit Service Boards. It includes a vision, goals, and priority projects that the RTA and the Service Boards are committed to advancing with additional capital funding. The enactment of Rebuild Illinois in June 2019 provided the RTA system with $2.6 billion over five years in state bond funding and an estimated $227 million annually in gas tax revenue, referred to as “PAYGO” dollars. This funding infusion allowed the agencies to advance several Invest in Transit priority projects within the 2020-2024 Regional Capital Program adopted by the RTA Board in December 2019, as described in the Annual Progress Report published in February 2020.
Throughout 2020, the RTA and the Service Boards have worked toward executing that capital program. The Service Boards continued robust construction programs despite many pandemic impacts to their operations and workforce. The RTA and the Service Boards also worked together with the Illinois Department of Transportation (IDOT) to implement the Rebuild Illinois program, which includes bond funds as well as PAYGO, a sustainable annual source of funding. In 2020, about half of the Rebuild Illinois bond funds were granted to the Service Boards, which will allow major projects to begin, including CTA’s Forest Park Branch Upgrades and 5000 Series Rail Car Upgrades, Metra’s Yard Expansions and Locomotive Purchases, Pace’s I-55 Express Bus Garage in Plainfield, and the replacement Bus Garage in Wheeling that will support compressed natural gas (CNG) buses. Furthermore, the Service Boards, IDOT, and RTA have worked to grant the first $227 million in PAYGO funds, that will include ongoing capital maintenance projects and enhancements that will contribute to maintaining a state of good repair.
To more efficiently move the Rebuild Illinois program forward, RTA worked with IDOT on streamlined guidelines and processes to ensure that projects can be delivered to the region’s transportation users in a timely manner. Finally, the RTA and the Service Boards also worked to take steps toward performance-based capital programming by developing the draft Framework for Capital Investment (the draft Framework) as described in the next section. Looking ahead to the 2021-2025 capital program, the Service Boards are poised to begin expenditures of Rebuild Illinois bond and PAYGO funds and to continue discussions about how to allocate future capital funding in a way that maximizes benefits to riders and the region.

Page 46 of 85
Adopted 2021 Operating Budget, Two-Year Financial Plan,
and Five-Year Capital Program
This section of the 2021 Operating Budget, Two-Year Financial Plan, and Five-Year Capital
Program provides an outlook for the 2021-2025 Capital Program, while adding some new detail
and analysis related to its impact on the regional transit system’s strategic direction.
Progress Toward Transparency in Capital Investment The RTA and the Service Boards have been working to improve the transparency of capital programming and the use of data to understand the impacts of the program on strategic priorities. The RTA Board, in its December 2019 budget ordinance, commissioned a new Performance-Based Capital Allocation Process Committee to develop more rigorous communications and reporting around the regional transit capital program. The ordinance promised that “the RTA will work towards a regional agreement to program PAYGO, other state, federal, and RTA funding in a collaborative and transparent process.” A working committee of staff at the RTA and the Service Boards began working toward a process in January 2020, not knowing what the future would hold. The pandemic presented many challenges to the transit agencies throughout the year, but staff held to the original deadline knowing that a solid investment framework is even more crucial so the RTA and the Service Boards can continue advocating in a unified manner for funds to support the region’s transit system.
Released in July 2020, the draft Framework provided new details on the current transit agency capital programming processes. It also proposed to communicate the goals, processes, and outcomes of the capital program in a more transparent, engaging manner. The draft Framework also proposed to further integrate the goals of regional plans like Invest in Transit into the existing capital program development process, so that the linkages between long-range planning and near-term programming are clearer to those who do not typically follow both. Three specific changes were proposed for the current capital programming process:
• Improved clarity in the requirements and goals for the Five-Year Regional CapitalProgram.
• Enhancements to the data being collected and reported externally by the RTA.
• Additional information products and updates to regularly describe project activities andresults.
During the draft Framework public comment period from July 15 through August 28, four comments were received, three of which included requests for new priorities and more robust performance-based programming. As a result, the RTA Board opted to defer adoption of the draft Framework and to program 2025 capital funding to a regional fund until such time as a different process can be developed, vetted, and approved by the RTA Board. This action effectively pauses work on the draft Framework. That said, many of the recommended transparency improvements presented in the draft Framework are important steps toward

Page 47 of 85
Adopted 2021 Operating Budget, Two-Year Financial Plan,
and Five-Year Capital Program
change and were already incorporated into the 2021-2025 Regional Capital Program development process and many of these changes are incorporated into this document.
Goals and Requirements for the Five-Year Regional Capital Program One of the new activities introduced by the draft Framework is improved clarity in the requirements and goals for the Five-Year Regional Capital Program. Invest in Transit makes mention of several core requirements that are timeless values that the agencies take seriously. In addition, it describes three strategic goals for the five-year timeframe and a set of specific priority projects that will be advanced with additional funding. The core requirements, goals, and priority projects — which provide three lenses for understanding how the capital program is accomplishing strategic objectives of the agencies — are used to analyze the capital program this year.
Strategic Goals Invest in Transit’s strategic goals capture the RTA’s and Service Boards’ current, shared priorities. The strategic goals, and what they mean for capital programming, are as follows:
• Deliver value on our investment. This goal focuses on fiscal responsibility andmaximizing the region’s investments in transit. Investment in this category might includereplacing vehicles and facilities that are beyond their useful life to bring the regionalsystem into a State of Good Repair.
• Build on the strengths of our network. This goal focuses on improvements to the transitsystem in six high-priority markets: The Chicago Central Business District, Chicago NorthSide, Chicago South Side and Southland, Suburban Cook County, Suburban EmploymentCenters, and ADA Paratransit. Investment in this category might include new technologyand infrastructure to increase service capacity where it is needed, improved facilitiesand technologies for more seamless connections between services, or investments toprovide transit workers the tools and training necessary to maintain round-the-clockoperations.
• Stay competitive. This goal focuses on the ability of the transit system to satisfactorilymeet customer needs and attract riders to the services. Investment in this categorymight include facilities and technologies to improve bus speeds and reliability,advancements in Ventra payment and Mobility-as-a-Service initiatives, or technologiesthat enable improved bus and rail reliability.
By using the lens of Invest in Transit strategic goals to describe the regional capital program and the individual Service Board’s capital program sections, the RTA and the Service Boards demonstrate how the current portfolio of capital investments will assist in achieving prescient pre-COVID transit strategic priorities of the region.

Page 48 of 85
Adopted 2021 Operating Budget, Two-Year Financial Plan,
and Five-Year Capital Program
Core Requirements The core requirements are central to the activities of the Service Boards. They are noted in Invest in Transit and are non-negotiable elements of agency operations that transcend immediate areas of focus. The Service Boards expend capital dollars to meeting these requirements, and thus RTA is committed to addressing them through the regional capital programming process. These core requirements and their implications for the capital program include:
• Maintain and improve safety and reliability. This core requirement is focused oninfrastructure improvements that improve the safety of passengers and staff, as well assecurity of the system. Investment in this category might include new and enhancedcamera and communication systems, improved lighting at stations and facilities, ortechnologies for improved incident response. Ensuring that aging assets are maintainedand replaced when needed to maintain the continuity of safe and reliable operationsthroughout the existing regional transit system is of paramount of importance toregional and Service Board capital programming processes.
• Achieve full accessibility. The agencies have been working for years to achieve fullaccessibility of the transit system to all riders, including those with physical disabilities.Investment in this category might include station and facility reconstructions to fullymeet accessibility needs, replacement of aged elevators, new and upgraded signage andwayfinding systems, improvements for accessing bus stops and stations, or technologyinnovations to provide improved access to people with disabilities.
• Improve equity. Some types of investments improve access to transit and access toopportunities across the large and diverse RTA region. This might include providingimprovements to serve residents of low income and disinvested neighborhoods withreconstructed facilities or enabling new services to increase access to jobs andopportunities.
• Meet regulatory requirements. Meeting regulatory requirements that make theNortheastern Illinois transit system safer and more accessible is an ongoingprogramming need. Investment in this category might include new systems such asMetra’s required $400 million investment in Positive Train Control (PTC), new vehiclestandards to meet crash or emission requirements, or technology to support security orreporting requirements.
In describing the capital program through the lens of core requirements presented in the capital program section, as well as the individual Service Board’s capital program sections, the RTA and the Service Boards demonstrate how much funding is required to accomplish their responsibilities, where emphasis is currently placed, and where additional funding will be needed to do more.
Page 49 of 85
Adopted 2021 Operating Budget, Two-Year Financial Plan,
and Five-Year Capital Program
Priority Projects The core requirements, strategic goals, and priority projects defined by Invest in Transit are shared priorities that shaped the current capital program. These priority projects are a set of core capital initiatives largely focused on bringing the regional transit system nearer to a state of good repair as well as advancing limited expansions in growing markets. This list is updated each year during the capital programming process. Progress toward funding this list was presented in the 2020-2024 capital program as well as the Invest in Transit Annual Progress Report completed in February 2020. This list has been refreshed during the 2021-2025 budget development process and will be used to frame not only future needs but also the contribution of specific capital program line items to advancement of those projects.
In describing the capital program through the lens of priority projects presented in the capital program section, as well as the individual Service Board’s capital program sections, RTA and the Service Boards provide transparency around how many projects and how much funding is used to advance each of these specific projects.
Summary The core requirements, strategic goals, and priority projects defined in Invest in Transit are shared priorities for the transit agencies that can be applied to understanding the current capital program. There is value in using these lenses to analyze, present, and monitor the capital investments being made, as part of the journey toward more transparency. As the region works toward a process for reinventing transit starting in mid-2021, these priorities may change. Meanwhile, the analysis illuminates the benefits and challenges of capital programming, as described in the next section.
2021-2025 Regional Capital Program and 2021 Regional Capital Program
2021-2025 Capital Funding by Source The 2021-2025 Regional Capital Program includes $6.351 billion in funding. After accounting for debt-service payments the region has $5.503 billion to program and use for capital projects between 2021 and 2025. Table 9 shows the breakdown of funding sources by Service Board in the five-year Capital Program.

Page 50 of 85
Adopted 2021 Operating Budget, Two-Year Financial Plan,
and Five-Year Capital Program
Table 9. 2021-2025 Regional Capital Program Funding (dollars in thousands)
CTA Metra Pace Pace ADA RTA Total
% of Total
Funding Sources
Federal Funds 1,789,901 804,195 182,374 - 591,450 3,367,920 53.0%
State Bond Funds 413,472 504,799 138,775 15,800 - 1,072,846 16.9%
PAYGO Funds 567,500 295,100 45,400 - 227,000 1,135,000 17.9% RTA Innovation, Coordination, & Enhancement (ICE) - 13,223 4,408 - - 17,631 0.3% Service Board and Other Local Funds 580 - - - - 580 0.0% Total New Capital Funding $2,771,453 $1,617,318 $370,956 $15,800 $818,450 $5,593,977 88.1%
RTA Bond Proceeds - 130,000 - - - 130,000 2.0%
CTA Bond Proceeds 626,590 - - - - 626,590 9.9%
Pace Bond Proceeds - - - - - - 0.0%
Sub-Total Bond Funds $626,590 $130,000 - - - $756,590 11.9%
Total Capital Funding $3,398,043 $1,747,318 $370,956 $15,800 $818,450 $6,350,566 100.0%
Debt Service (847,304) - - - - (847,304) Total Capital Funding Available $2,550,738 $1,747,318 $370,956 $15,800 $818,450 $5,503,262
The $6.351 billion in funding is 23.5% less than the 2020-2024 Capital Program. Unlike 2020, when two major new State funding sources, Rebuild Illinois bond funds and PAYGO, became available, there are no new funding sources available in the 2021-2025 Capital Program. The principal reason for less capital funding between 2020 and 2021 is that 59% ($1.527 billion) of Rebuild Illinois bond funds were programmed in 2020 leaving $1.073 billion in funds in the 2021-2025 budget. The remaining Rebuild Illinois bond funds are spread through years 2021-2024 but not into 2025, as Rebuild Illinois is designated as a five-year bond program. The RTA continues to work with the state to develop additional consistency in state capital funding beyond 2024, to provide reliable funds to maintain the region’s transit system.
The 2021-2025 Capital Program includes a mix of federal, state, RTA, and local sources. Funding is divided as follows: 53.0% federal funds, 17.9% state PAYGO funds, 16.9% State bond funds, 2.3% RTA funds, and 9.9% local funds comprised of CTA Bonds. Figure 36 shows the funding source split of the entire Capital Program.

Page 51 of 85
Adopted 2021 Operating Budget, Two-Year Financial Plan,
and Five-Year Capital Program
Figure 36. 2021-2025 Capital Funding: $6.351 Billion
The PAYGO funding allocations for 2021-2024 are based on the last Capital Asset Condition
report and are allocated 62.5% to CTA, 32.5% to Metra, and 5.0% to Pace. This allocation was
defined in the 2020 budget process through the year 2024 with the understanding that
allocations could be divided differently in future years. The 2025 PAYGO and federal formula
capital funds are programmed into a regional set-aside allocated to RTA until such time as a
new process for allocating these funds is established. The funds will be allocated in the future
when a more holistic plans for recovery has been developed in collaboration with the Service
Boards, discussed with stakeholders, and endorsed by the RTA Board.
2021 Annual Capital Program Funding For 2021 the total regional funds are $1.492 billion. After deducting $276.3 million of CTA debt service on previously issued bonds, an estimated amount of $1.216 billion is available for 2021. These funds come from the following sources: 45.7% federal, 25.9% CTA Bonds, 15.2% PAYGO, 12.8% State Bonds, 0.4% RTA ICE, and .01% other local funds. Again, 2021 regional funds are 29.4% lower compared to 2020, as there are less Rebuild Illinois bond funds available for programming. Table 10 and Figure 37 show the split of funds by Service Board and funding source for 2021.

Page 52 of 85
Adopted 2021 Operating Budget, Two-Year Financial Plan,
and Five-Year Capital Program
Table 10. 2021 Annual Regional Capital Program Funding (dollars in thousands)
Figure 37. 2021 Capital Funding: $1.492 Billion
With a more balanced funding mix between federal, state, and local sources, 2021 will continue 2020’s momentum for the region to fund important projects to maintain and enhance the critical transportation network in the RTA region.
Capital Funding by Priority Project The following section presents the 2021-2025 Capital Program through the lens of priority projects identified by the Service Boards, through Invest in Transit and subsequent annual updates. All current priority projects are included in the analysis, whether or not they will receive funding in the five-year capital program. In addition, there is an administrative category for activities required to execute the proposed capital projects, as well as a category for projects that do not fall into any of the priority projects, called uncategorized projects. These two categories (administrative and uncategorized) are shown in the summary tables but not
TABLE 2: 2021 CAPITAL PROGRAM FUNDING (DOLLARS IN THOUSANDS)
CTA Metra Pace Pace-ADA RTA Total % of Total
Funding Sources
Federal Funds 447,118 189,773 44,580 - - 681,471 45.67%
State Bond Funds 20,000 119,142 48,550 4,000 - 191,692 12.85%
PAYGO Funds 141,875 73,775 11,350 - - 227,000 15.21%
RTA Innovation, Coordination, & Enhancement (ICE) - 4,158 1,386 - - 5,544 0.37%
Service Board and Other Local Funds 160 - - - - 160 0.01%
Total New Capital Funding $609,153 $386,847 $105,866 $4,000 - $1,105,866 74.11%
RTA Bond Proceeds - - - - - - 0.00%
CTA Bond Proceeds 386,290 - - - - 386,290 25.89%
Pace Bond Proceeds - - - - - - 0.00%
Sub-Total Bond Funds $386,290 - - - - $386,290 25.89%
Total Capital Funding $995,442 $386,847 $105,866 $4,000 - $1,492,156 100.00%
Debt Service (276,306) - - - - (276,306)
Total Capital Funding Available $719,137 $386,847 $105,866 $4,000 - $1,215,850

Page 53 of 85
Adopted 2021 Operating Budget, Two-Year Financial Plan,
and Five-Year Capital Program
included in the analysis of priority projects or the 10-year need. The 10-year regional capital funding need is $33.8 billion. Notably, the current 2021-2025 capital program only funds 19% of the total 10-year need.
Overall, 91% of the projects by number identified in the 2021-2025 Capital Program fit in to one of the priority projects identified by the Service Boards. Some of the uncategorized projects include special COVID-19 funding and planning studies. Appendix A includes a table showing all the priority projects, the funding level in the 2021-2025 Capital Program, and the 10-year funding need.
The Services Boards have identified 72 priority projects in total with 53 of the projects receiving funding in the 2021-2025 Capital Program. This leaves several priority projects unfunded in the current program and shows that additional funding is needed to meet the needs of the region’s transit system and users. Furthermore, while 53 of the projects are receiving some funding in the 2021-2025 Capital Program, not a single project can be fully funded based on the amount of funds currently available.
With that in mind, the RTA further analyzed the proposed projects using two different lenses, strategic goals and core requirements, detailed in Goals and Requirements for the Capital Program section above. Appendix B identifies and describes all the projects included in the Capital Program, with details of project funding, strategic goals, and core requirements.
Strategic Goals As described in the introduction to this section, the three strategic goals of Invest in Transit are to deliver value on our investment, build on the strengths of our network, and stay competitive. Each project contained in Invest in Transit has been assigned by the Service Boards to one of the three goals to demonstrate how this capital spending will assist in achieving the intended strategic investments of the region.
Overall, the largest bucket of projects deliver value on our investment, with over 43% of projects by number assigned to that goal; 35% by number have the goal of build on the strengths of the network and about 22% by number help the system stay competitive, as shown in Figure 38. Since many of the projects are focused on maintaining the system, RTA expected to see that many of the projects would deliver value on investment because maintenance, overhauls and rehab allow assets to last longer and keep the system running reliably. Due to the need for more funding, the Service Boards are not able to advance as many projects that help the system stay competitive as many of these are enhancements are above and beyond keeping the system operating.

Page 54 of 85
Adopted 2021 Operating Budget, Two-Year Financial Plan,
and Five-Year Capital Program
Figure 38. Number of Service Board Capital Projects Advancing Each Strategic Goal
Viewing funding by strategic goal reveals starker differences across the three goals: 58% of funding, $3.2 billion, has been assigned to deliver value on investment. While 24% of funding, $1.3 billion, goes to building on the strengths of the network, and 18%, nearly $1.0 billion, goes to staying competitive, shown in Figure 39. Once again, due to funding constraints, the Service Boards primarily choose projects that help to maintain the current system rather than advance expansions and enhancements. With more funding the region would be able to actively improve the system rather than focus on maintaining the current state.
Figure 39. Amount of Service Board Capital Funding Advancing Each Strategic Goal (dollars in millions)

Page 55 of 85
Adopted 2021 Operating Budget, Two-Year Financial Plan,
and Five-Year Capital Program
Overall, the distribution of strategic goals by project shows that the Service Boards are actively choosing projects to help maintain the system, while being more selective in choosing projects that offer enhancements due to the lack of available funding.
Core Requirements The four Core Requirements identified in Invest in Transit are maintain and improve safety and reliability, achieve full accessibility, improve equity, and meet regulatory requirements. Each project has been categorized by the Service Boards as satisfying up to two core requirements. Among the projects, 83% address two requirements, and 17% address one requirement.
By far, the requirement most often identified with a proposed project is maintain and improve safety and reliability, with 168 projects fulfilling that requirement. Over 98 projects are expected to help meet regulatory requirements. Just 55 projects aid in meeting full accessibility and 41 projects improve equity as shown in Figure 40.
Figure 40. Number of Service Board Projects Addressing Each Core Requirement
NOTE: Question is asked as multi-response, Service Boards may select up to two core requirements per project.
Due to the lack of sufficient capital funding, investments within the five-year capital program focus heavily on the core requirement to maintain and improve the safety and reliability of the system. As seen in figure 39, the vast majority of funding available over the next five years is intended to be invested in maintaining and improving the safety and reliability of the current system.
When viewing requirements by dollar amount per requirement, the results are even more stark. $4.1 billion in funds are used on projects with the requirement of maintaining and improving safety and reliability, while between $1.0 and $1.7 billion in funds contribute to each of the other three requirements, as shown in Figure 41. This clearly shows that the Service Boards, above all else, have focused on maintaining a safe and reliable system in the present state, compared to providing additional enhancements.

Page 56 of 85
Adopted 2021 Operating Budget, Two-Year Financial Plan,
and Five-Year Capital Program
Figure 41. Amount of Service Board Funding Addressing Each Core Requirement (dollars in millions)
NOTE: Question is asked as multi-response, Service Boards may select up to two core requirements per project.
While progress is being made toward accessibility and equity, achieving these goals will depend on fully funding them as primary requirements of the regional transit system.
What becomes clear when analyzing available funding by priority projects, strategic goals and core requirements is that the region needs more funds to move from just maintaining the system to improving the offerings and competing better with new travel options.
Summary and Long-Term Funding Need Overall, the 2021-2025 Capital Program is primarily focused on addressing the region’s State of Good Repair needs and advancing projects identified by Invest in Transit.
In addition to the analysis of the capital program provided in previous sections, RTA staff has conducted additional Strategic Asset Management (SAM) analysis of the 2021-2025 funding levels using the same approach outlined in the Potential Impacts of State Funding on Transit State of Good Repair white paper published in July 2020. The key finding of the white paper was that expected increased funding through bonds and PAYGO tax revenues provided in Rebuild Illinois would improve the region’s assets condition, but with the end of the five-year bond term assets would begin to deteriorate once again as a result of insufficient funding.
Figure 42 shows that with the final 2021-2025 budget marks, our region’s asset condition, as measured by Percent of Assets Exceeding Useful Life (PAEUL), will not continue to deteriorate as it had been prior to 2020. Conditions stay about the same from 2020 to 2025, as a result of the Rebuild Illinois PAYGO and bond funds anticipated through 2025, with about 34% of assets exceeding useful life both today in 2020 and projected for 2025. However, when the bond funds are depleted in 2025, the overall regional asset condition will begin to deteriorate once again. By 2035, 38% of assets will exceed their useful lives, which is higher than projected last year and can only be improved by additional funding and sustained investment.

Page 57 of 85
Adopted 2021 Operating Budget, Two-Year Financial Plan,
and Five-Year Capital Program
Figure 42. Percent Regional Assets Exceeding Useful Life
CTA Capital Program CTA’s five-year capital program has $3.398 billion available for capital expenditures in 2021-2025 despite an estimated 10-year need of $21.128 billion for priority projects. CTA’s capital projects are largely focused on moving the system toward a state of good repair with limited expansion activities focused on bringing more equitable transportation options to the region. Major projects include repairs and replacement of rail cars and buses, modernization and upgrades to the rail system, upgrades to stations and other system wide projects that support CTA’s activities. The program uses 54.6% of funds on rail projects, 12.1% of funds on bus projects and the remaining 33.3% of funds on systemwide projects that includes 24.9% of the program dedicated to bond repayment.
Capital Funding by Source In CTA’s $3.398 billion capital program, funding comes from five sources: federal funds 52.7%, CTA Bond Proceeds 18.4%, PAYGO funds 16.7%, Rebuild Illinois bond funds 12.2%, and other funds 0.02%, shown in Figure 43. The Rebuild Illinois program continues to provide the CTA with a more balanced set of revenue sources funding its capital program, but the agency’s reliance on bond financing highlights the need for additional consistent revenue options.

Page 58 of 85
Adopted 2021 Operating Budget, Two-Year Financial Plan,
and Five-Year Capital Program
Figure 43. CTA 2021-2025 Program Funding Sources: $3.398 Billion
Capital Funding by Priority Project CTA has identified 41 priority projects that help to maintain and improve the system. Priority projects such as Red Purple Modernization, bus and rail car overhauls and the Blue Line Forest Park Branch Modernization are focused on maintaining the current system. A limited selection of projects are designed to enhance and expand the system while improving equity in the region including the Red Line Extension to 130th Street and the Bus Slow Zone Removal/Dedicated Lane projects. These projects build on the system and offer transit to underserved communities, fulfilling an important need for the region.
CTA’s 2021-2025 capital program funds activities in 25 of the 41 priority projects as shown in Table 11. This leaves several important regional projects unfunded including Replacement Buses (4000 series), Bus Garage Improvements and a new control center. These projects would improve the safety and reliability of the system, but due to lack of funding have been prioritized lower than the presently funded projects.

Page 59 of 85
Adopted 2021 Operating Budget, Two-Year Financial Plan,
and Five-Year Capital Program
Table 11. CTA Priority Projects, 2021-2025
CTA Priority Projects
Total 10-Year
Funding Need
Total 5-Year
Funding
Programmed
Red Purple Modernization 6,401,000,000.00$ $ 444,847,735.00
Red Line Extension 2,129,412,335.00$ $ 327,771,335.00
Bond Repayment, Interest Cost & Finance Cost 1,517,466,560.00$ $ 758,733,282.00
Railcar Purchase 1,087,276,532.00$ $ 512,146,408.00
Green Line Improvements 683,042,000.00$ $ 9,908,467.00
Blue Line Forest Park Modernization - Phase 2 653,077,000.00$ $ -
Subway Life Safety Improvements 607,309,000.00$ $ -
Blue Line Forest Park Modernization - Phase 3 598,030,000.00$ $ -
Blue Line Forest Park Modernization - Phase 4 597,030,000.00$ $ -
Replacement Bus Purchase (1000 Series) 518,777,964.00$ $ 214,015,178.00
Brown Line Improvements 436,384,000.00$ $ 7,347,373.00
Systemwide Track Renewal 422,575,000.00$ $ 34,141,749.00
Red Line Improvements 396,400,000.00$ $ -
Elevated Track and Structure Systemwide 380,000,000.00$ $ 152,000,000.00
Perform Bus Maintenance Activities 360,000,000.00$ $ 144,000,000.00
Blue Line (O'Hare) Traction Power Capacity & Track Improvements 351,400,000.00$ $ 20,206,695.00
Bus Garage Improvements 343,000,000.00$ $ -
Systemwide Structural Renewal 336,200,000.00$ $ -
Rail Car Maintenance Activities 300,000,000.00$ $ 116,435,082.00
Rail Yard Improvements 267,224,412.00$ $ 11,850,000.00
Rail Shops Improvements 265,700,000.00$ $ 4,400,000.00
Tactical Signal Improvements (Systemwide) 235,900,000.00$ $ -
BRT/Bus Slow Zone Removal/ TSP/Dedicated Lane projects 233,440,000.00$ $ 16,802,085.00
Replacement Buses (4000 Series) 233,018,000.00$ $ -
Maintenance Facilities Rehabilitation 200,000,000.00$ $ 78,000,000.00
Railcar Overhaul (2600s and 5000s) 191,146,078.00$ $ 62,663,100.00
New Control Center 183,900,000.00$ $ -
Systemwide Station Program 172,417,000.00$ $ 42,981,219.90
Tactical Traction Power Improvements (Systemwide) 166,604,000.00$ $ 122,299,115.00
Information Technology 152,405,000.00$ $ 34,722,600.00
CTA OFPS - Equipment (Lease) - VENTRA 150,000,000.00$ $ 60,000,000.00
Blue Line Forest Park Modernization - Phase 1 134,452,000.00$ $ -
Critical Needs at CTA Facilities 94,762,000.00$ $ -
Non-Revenue Vehicle Replacement Program 72,300,000.00$ $ 7,333,095.00
Program Management 66,064,000.00$ $ 26,425,500.00
Mid-Life Bus Overhaul (7900 series) 58,094,000.00$ $ -
Life-Extending Bus Overhaul 430 (1000 series) 53,252,000.00$ $ 53,917,895.00
Radio System Upgrade 35,000,000.00$ $ -
Program Development 26,250,000.00$ $ 2,625,000.00
New Training Center 14,700,000.00$ $ -
Mid-Life Bus Overhaul (4300 series) 3,081,000.00$ $ -
Uncategorized Projects - CTA -$ $ 88,721,181.00
Administration - CTA -$ $ 43,748,459.00
Grand Total 21,128,089,881.00$ 3,398,042,553.90$

Page 60 of 85
Adopted 2021 Operating Budget, Two-Year Financial Plan,
and Five-Year Capital Program
One CTA priority project, bond repayment, interest and finance cost, must be fully funded, as debt service payments are required, and represent the largest of CTA’s funded projects in the 2021-2025 plan.
Data will be further analyzed by looking at core requirements, and strategic goals, Table 12 shows information for each of CTA’s projects and Appendix B contains the detailed data for each project.
Table 12. CTA Priority Projects Details
CTA Priority Projects
Estimated 10-Year need for
Priority Project Individual Capital
Project Title
Total 5-Year Funding
Programmed
Strategic Goals
Core Requirements
De
liver
Val
ue
on
Ou
r In
vest
men
t
Bu
ild o
n S
tren
gth
s o
f O
ur
Ne
two
rk
Stay
Co
mp
etit
ive
Mai
nta
in a
nd
imp
rove
saf
ety
an
d r
elia
bili
ty
Ach
ieve
Fu
ll A
cces
sib
ility
Mee
t R
egu
lato
ry R
equ
ire
me
nt
Imp
rove
Eq
uit
y
Red Purple Modernization
$6,401,000,000 North Main Line - RPM $444,847,735
• • •
Red Line Extension $2,129,412,335 Red Line Extension $327,771,335 • • •
Bond Repayment, Interest Cost & Finance Cost
$1,517,466,560
Bond Repayment, Interest Cost, & Finance Cost
$758,733,282
•
Railcar Purchase $1,087,276,532
Purchase Rail Cars - 7000' Series (BaseOrder 400) $217,715,300
• • •
Rail Cars - 7000 Sers Option One 156 $294,431,108
• • •
Green Line Improvements
$683,042,000
Green Line South - Track Improvements (GTT) $9,908,467
• • •
Blue Line Forest Park Modernization - Phase 2
$653,077,000 (No Projects Programmed) $0

Page 61 of 85
Adopted 2021 Operating Budget, Two-Year Financial Plan,
and Five-Year Capital Program
Subway Life Safety Improvements
$607,309,000 (No Projects Programmed) $0
Blue Line Forest Park Modernization - Phase 3
$598,030,000 (No Projects Programmed) $0
Blue Line Forest Park Modernization - Phase 4
$597,030,000 (No Projects Programmed) $0
Replacement Bus Purchase (1000 Series)
$518,777,964
Purchase up to 70 Electric Buses and up to nine Chargers
$38,603,470
• • •
Replace Buses Options up to 500 of 1,030 -New Flyers
$175,411,708
• • •
Brown Line Improvements
$436,384,000 Brown Line - Track Improvements (GTT) $7,347,373
• • •
Systemwide Track Renewal
$422,575,000
Green & Pink Line West - Track Improvements (GTT) $11,342,834
• • •
Red & Blue Line Subway - Track Improvements (GTT) $17,439,211
• • •
Subway Waterproofing & Track $5,359,704
• •
Red Line Improvements
$396,400,000 (No Projects Programmed) $0
Elevated Track and Structure Systemwide
$380,000,000 Elevated Track and Structure Systemwide $152,000,000
• • •
Perform Bus Maintenance Activities
$360,000,000
Perform Bus Maintenance Activities
$144,000,000
• •
Blue Line (O'Hare) Traction Power Capacity & Track Improvements
$351,400,000
Blue Line O'Hare Branch Traction Power Improvements GTT $20,206,695
• •
Bus Garage Improvements
$343,000,000 (No Projects Programmed) $0
Systemwide Structural Renewal
$336,200,000 (No Projects Programmed) $0

Page 62 of 85
Adopted 2021 Operating Budget, Two-Year Financial Plan,
and Five-Year Capital Program
Rail Car Maintenance Activities
$300,000,000 Rail Car Maintenance Activities $116,435,082
• •
Rail Yard Improvements
$267,224,412 Rail Facilities - Rail Yards
$11,850,000 • •
Rail Shops Improvements
$265,700,000 Skokie Clean Room - Bench Test Equipment $4,400,000
• •
Tactical Signal Improvements (Systemwide)
$235,900,000 (No Projects Programmed) $0
BRT/Bus Slow Zone Removal/ TSP/Dedicated Lane projects
$233,440,000
Bus Priority Zones $125,000
• • •
Bus Slow Zones Elimination Program $16,677,085
• • •
Replacement Buses (4000 Series)
$233,018,000 (No Projects Programmed) $0
Maintenance Facilities Rehabilitation
$200,000,000 Maintenance Facilities Rehabilitation $78,000,000
• •
Railcar Overhaul (2600s and 5000s)
$191,146,078
Perform Rail Car Overhaul - 5000 Series Qtr Overhaul $62,663,100
• • •
New Control Center $183,900,000 (No Projects Programmed) $0
Systemwide Station Program
$172,417,000
Rehabilitate Rail Stations - ASAP (AUSTIN) $8,894,700
• • •
Rehabilitate Rail Stations Systemwide $5,925,000
• • •
Station Security Enhancements Systemwide (Safe and Secure) $13,930,000
• • •
Systemwide Security Cameras Improvements (Safe & Secure) $14,231,520
• •
Tactical Traction Power Improvements (Systemwide)
$166,604,000
Tactical Traction Improvements - Barry, Damen and Canal $113,681,000
• •
Tactical Traction Power (Equipment/Cable/Enclosures)
$8,618,115
• •

Page 63 of 85
Adopted 2021 Operating Budget, Two-Year Financial Plan,
and Five-Year Capital Program
Information Technology
$152,405,000
Implement Security Projects (HLS Program) $29,622,600
• •
Upgrade Office Computer Systems $3,900,000
• •
Upgrade\Support Computer Systems $1,200,000
• •
CTA OFPS - Equipment (Lease) - VENTRA
$150,000,000
CTA Open Fare Payment System - Equipment (Lease) - VENTRA $60,000,000
• • •
Blue Line Forest Park Modernization - Phase 1
$134,452,000 (No Projects Programmed) $0
Critical Needs at CTA Facilities
$94,762,000 (No Projects Programmed) $0
Non-Revenue Vehicle Replacement Program
$72,300,000
Equipment and Non-Revenue Vehicles (Diesel Locomotives) $7,333,095
• • •
Program Management
$66,064,000
Program Management
$26,425,500
• • •
Mid-Life Bus Overhaul (7900 series)
$58,094,000 (No Projects Programmed) $0
Life-Extending Bus Overhaul 430 (1000 series)
$53,252,000
Perform Bus Overhaul - Life Extending Overhaul - Up to 430 Standard (1000 Series)
$53,917,895
• •
Radio System Upgrade
$35,000,000 (No Projects Programmed) $0
Program Development
$26,250,000 Program Development $2,625,000
• • •
New Training Center $14,700,000 (No Projects Programmed) $0
Mid-Life Bus Overhaul (4300 series)
$3,081,000 (No Projects Programmed) $0
Uncategorized Projects - CTA
$0
GTT Repayment $88,571,181 •
Transit System Network Design Study $150,000
• • •
Administration - CTA
$0
Office Building - Principal & Interest $24,751,944
• •
Support Service for 5307, 5337, $18,996,515
• • •

Page 64 of 85
Adopted 2021 Operating Budget, Two-Year Financial Plan,
and Five-Year Capital Program
5339, Fast Tracks Program, CTA Bond, CMAQ and Homeland Security
Grand Total $21,128,089,881 $3,398,042,554
Strategic Goals Each CTA project is categorized according the Invest in Transit strategic goals, with the result that 82.5% of projects deliver value on investment, 17.5% of projects build on the strengths of the network and none of the projects focus on staying competitive, as shown in Figure 44.
Figure 44. Number of CTA Projects Advancing Each Strategic Goal
Based on dollars per goal, 75% ($2.541 billion) of funding goes toward delivering value on investment while 25% ($856.9 million) of funding goes toward building on the strengths of the network, as shown in Figure 45.
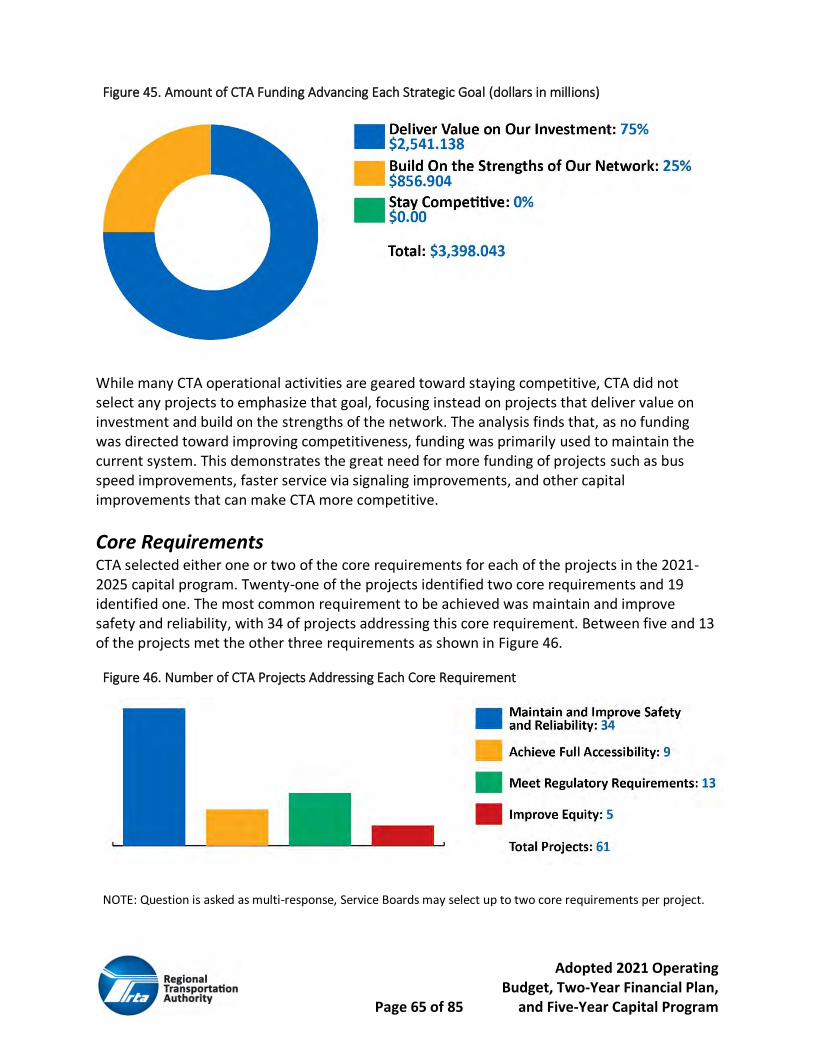
Page 65 of 85
Adopted 2021 Operating Budget, Two-Year Financial Plan,
and Five-Year Capital Program
Figure 45. Amount of CTA Funding Advancing Each Strategic Goal (dollars in millions)
While many CTA operational activities are geared toward staying competitive, CTA did not select any projects to emphasize that goal, focusing instead on projects that deliver value on investment and build on the strengths of the network. The analysis finds that, as no funding was directed toward improving competitiveness, funding was primarily used to maintain the current system. This demonstrates the great need for more funding of projects such as bus speed improvements, faster service via signaling improvements, and other capital improvements that can make CTA more competitive.
Core Requirements CTA selected either one or two of the core requirements for each of the projects in the 2021-2025 capital program. Twenty-one of the projects identified two core requirements and 19 identified one. The most common requirement to be achieved was maintain and improve safety and reliability, with 34 of projects addressing this core requirement. Between five and 13 of the projects met the other three requirements as shown in Figure 46.
Figure 46. Number of CTA Projects Addressing Each Core Requirement
NOTE: Question is asked as multi-response, Service Boards may select up to two core requirements per project.

Page 66 of 85
Adopted 2021 Operating Budget, Two-Year Financial Plan,
and Five-Year Capital Program
When looking at core requirements by amount of funding, maintain and improve safety and reliability was also the clear leader, with $2.206 billion of funds helping to address this requirement. The other requirements had between $440.8 million and $1.034 billion of the funds available to address the core requirement, as shown in Figure 47.
Figure 47. Amount of CTA Funding CTA Addressing Each Core Requirement (millions)
NOTE: Question is asked as multi-response, Service Boards may select up to two core requirements per project.
Based on these measures, CTA is firmly focused on maintaining the current system. There are very limited funds available for other projects that would provide enhancements. CTA and RTA continue to advocate for funds that will help address important goals such as CTA’s All Stations Accessibility Plan and the Red Line Extension to 130th Street. These projects build on the system and offer transit to underserved communities, fulfilling an important need for the region. Furthermore, continuing to advocate for federal and state funding can allow CTA to reduce its reliance on funding projects with CTA issued debt, which requires large repayments funded from other sources.
Metra Capital Program Metra has $1.747 billion of funding available in its 2021-2025 capital program despite an estimated 10-year need of $11.5 billion for priority projects. With many older rail cars and locomotives, Metra continues to concentrate its capital budget on improving rail cars and locomotives. Furthermore, there are significant station projects around the system as well as projects to maintain track, yards, and signals.
Capital Funding by Source Metra’s 2021-2025 capital program is funded with the following sources: federal funds 46.0%, Rebuild Illinois bond funds 28.9%, PAYGO funds 16.9%, RTA Bonds 7.4% and RTA Innovation, Coordination and Enhancement Funds 0.8%, as shown in Figure 48. With an even split between federal and state funds, as well as an injection of local RTA dollars, Metra’s funding split is well balanced for 2021-2025. But as the Rebuild Illinois bond funds are expended by 2024, it will be
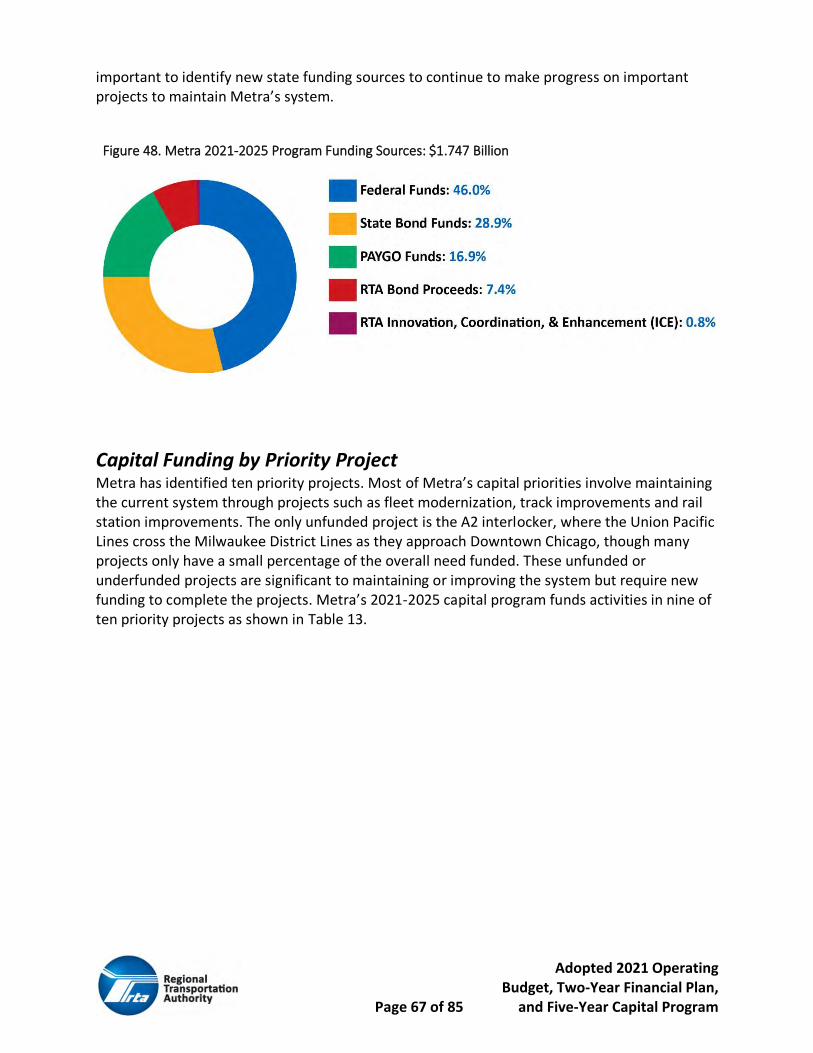
Page 67 of 85
Adopted 2021 Operating Budget, Two-Year Financial Plan,
and Five-Year Capital Program
important to identify new state funding sources to continue to make progress on important projects to maintain Metra’s system.
Figure 48. Metra 2021-2025 Program Funding Sources: $1.747 Billion
Capital Funding by Priority Project Metra has identified ten priority projects. Most of Metra’s capital priorities involve maintaining the current system through projects such as fleet modernization, track improvements and rail station improvements. The only unfunded project is the A2 interlocker, where the Union Pacific Lines cross the Milwaukee District Lines as they approach Downtown Chicago, though many projects only have a small percentage of the overall need funded. These unfunded or underfunded projects are significant to maintaining or improving the system but require new funding to complete the projects. Metra’s 2021-2025 capital program funds activities in nine of ten priority projects as shown in Table 13.

Page 68 of 85
Adopted 2021 Operating Budget, Two-Year Financial Plan,
and Five-Year Capital Program
Table 13. Metra 2021-2025 Priority Projects
Data will be further analyzed by looking at core requirements, and strategic goals, Table 14 shows information for each of Metra’s projects and Appendix B contains the detailed data for each project.
Metra Priority Projects
Total 10-Year
Funding Need
Total 5-Year
Funding
Programmed
Fleet Modernization Plan 2,100,000,000$ $ 805,291,102
Bridge Replacement and Repair 2,000,000,000$ $ 87,150,000
Track Improvements 1,900,000,000$ $ 69,956,000
75th Street Corridor 1,500,000,000$ $ 6,500,000
Signal & Electrical Improvements 1,200,000,000$ $ 268,428,000
Rail Station Improvements 853,000,000$ $ 254,450,500
A-2 Interlocking Replacement 750,000,000$ $ -
Yards, Facilities, and Equipment Improvements 664,000,000$ $ 121,475,000
Chicago Union Station Improvements 500,000,000$ $ 2,000,000
Uncategorized Projects - Metra -$ $ 51,038,189
Administration - Metra -$ $ 65,428,943
PTC - systemwide -$ $ 15,600,000
Grand Total 11,467,000,000$ 1,747,317,734$

Page 69 of 85
Adopted 2021 Operating Budget, Two-Year Financial Plan,
and Five-Year Capital Program
Table 14. Metra Priority Projects Details
Metra Priority Projects
Total 10-Year Funding Need
Individual Project Title
Total 5-Year Funding
Programmed
Strategic Goals
Core Requirements
De
liver
Val
ue
on
Ou
r In
vest
men
t
Bu
ild o
n S
tren
gth
s o
f O
ur
Ne
two
rk
Stay
Co
mp
etit
ive
Mai
nta
in a
nd
imp
rove
saf
ety
an
d r
elia
bili
ty
Ach
ieve
Fu
ll A
cces
sib
ility
Mee
t R
egu
lato
ry R
equ
ire
me
nt
Imp
rove
Eq
uit
y
Fleet Modernization Plan
$2,100,000,000
Automatic Passenger Counters $4,000,000
• • •
Car and Locomotive Cameras $7,500,000
• • •
Car and Locomotive Improvements $7,500,000
• • •
Car Rehab (Nippon Sharyo Highliners) $34,360,822
• • •
Car Rehab (Nippon Sharyo Phases 5-7) $90,695,000
• • •
DC to AC Conversion $62,000,000
• •
F59 Locomotive Engine Upgrade $58,800,000
• • •
GPS/Train Tracking $5,158,000
• • •
Locomotive Rehabilitation 100-149,215,216 $6,585,000
• • •
New Gallery Cars Purchase $509,742,280
• • •
Traction Motors $6,900,000 • • •
Video Equipment $1,250,000
• • •

Page 70 of 85
Adopted 2021 Operating Budget, Two-Year Financial Plan,
and Five-Year Capital Program
Wheel Replacement $10,800,000
• • •
Bridge Replacement and Repair
$2,000,000,000
275-Old 96thAvenue $8,000,000
• •
Bridge A110/56, MWD $23,150,000
• • •
Bridge A318, MWD $2,500,000
• •
Bridge A418 $6,100,000 • •
Bridge and Retaining Walls, BNS $6,000,000
• • •
Bridge and Retaining Walls, UPR $3,500,000
• • •
Bridges, MED $1,700,000 • • •
Bridges, MWD $2,100,000 • • •
Grand Avenue $16,000,000 • • •
Stoney Creek $7,500,000 • • •
Z14C - Keystone Avenue $10,600,000
• • •
Track Improvements
$1,900,000,000
Catenary Structure Rehab $2,250,000
• • •
Rail Replacement, BNS $4,000,000
• • •
Rail Replacement, MED $2,500,000
• • •
Rail Replacement, MWD $5,400,000
• • •
Rail Replacement, RID $6,500,000
• • •
Rail Replacement, UPR $1,500,000
• • •
Rail Welding $1,000,000 • • •
Ties and Ballast $4,970,000 • • •
Ties and Ballast $5,200,000 • • •
Ties and Ballast, BNS $10,700,000
• • •
Ties and Ballast, MED $7,806,000
• • •
Ties and Ballast, RID $6,880,000
• • •
Undercutting and Surfacing, MDW $3,000,000
• • •

Page 71 of 85
Adopted 2021 Operating Budget, Two-Year Financial Plan,
and Five-Year Capital Program
Undercutting and Surfacing, MED $3,250,000
• • •
Undercutting and Surfacing, RID $3,250,000
• • •
Undercutting and Surfacing, UPR $1,750,000
• • •
75th Street Corridor
$1,500,000,000 CREATE – P2, SWS $6,500,000
• • •
Signal & Electrical Improvements
$1,200,000,000
16th Street Interlockers $9,900,000
• • •
A-20Interlocking $12,000,000
• • •
Bi-Directional Signaling - 11th-47th Street $30,000,000
• • •
Bi-Directional Signaling - 47th-65th Street $30,000,000
• • •
CCF Generation $800,000 • • •
Communications Improvements $4,000,000
• • •
Constant Tension Catenary Study $750,000
• •
Crossings (Road and Track), MED $2,250,000
• • •
Crossings (Road and Track), MWD $3,500,000
• • •
Crossings (Road and Track), MWD $6,000,000
• • •
Crossings (Road and Track), RID $4,000,000
• • •
Crossings (Road and Track), UPR $3,000,000
• • •
Fiber Optic $8,000,000 • • •
Fiber Optic $29,500,000 • • •
Impedance Bonds $700,000
• • •
Lake Forest Crossovers $3,000,000
• • •
Lake Street Interlocker $17,000,000
• • •
MED Improvement Project $4,000,000
• • •

Page 72 of 85
Adopted 2021 Operating Budget, Two-Year Financial Plan,
and Five-Year Capital Program
Milwaukee Signals $10,100,000
• • •
Morgan Interlocking $3,000,000
• • •
MWD Line Signals, MWD $15,650,000
• • •
PE 5362 Western Interlocking $6,000,000
• • •
Signal Standards $550,000 • • •
Signal System Improvements, MED $4,500,000
• • •
Signal System Improvements, MWD $4,000,000
• • •
Signal System Improvements, RID $4,500,000
• • •
Smart Gates $27,000,000 • • •
Substation Improvements (Jackson) $19,200,000
• • •
Switch Layout Standards $5,528,000
• • •
Rail Station Improvements
$853,000,000
103rd St. Rosemoor Station $5,500,000
• • •
59th/60th St. (U. of Chicago) Station $18,000,000
• • •
79th St. (Chatham) Station $5,000,000
• • •
Bicycle Parking $306,000 • •
Congress Park Station $6,000,000
• • •
Downtown Public Address System $3,000,000
• • •
Elevator Replacement $7,150,000
• • •
Elmhurst Station $2,000,000 • • •
Evanston Davis Street $20,000,000
• • •
Glen Ellyn Station $4,000,000
• • •
Hickory Creek Station $500,000
• • •

Page 73 of 85
Adopted 2021 Operating Budget, Two-Year Financial Plan,
and Five-Year Capital Program
Highlands Station $500,000
• • •
Hubbard Woods Station $8,000,000
• • •
Kenilworth Station $7,000,000
• • •
Millennium Station Boilers $2,180,000
• •
Ogilvie Tile Replacement $1,000,000
• •
Olympia Fields Station $7,500,000
• • •
Parking Lot Improvements $4,000,000
• • •
Platform Improvements $22,700,000
• • •
River Forest Station $3,000,000
• • •
Rogers Park Station $10,000,000
• • •
Round Lake Station $2,200,000
• • •
Shelters $12,000,000 • • •
South Water St. Station $2,000,000
• • •
Systemwide Station Improvements $19,000,000
• • •
Systemwide Station Signs $6,400,000
• • •
Ticket Vending Machines $12,650,000
• • •
TROI-NET $16,138,200 • • •
University Park Ped Ramp Canopy $300,000
• • •
Van Buren St. Station $38,126,300
• • •
West Chicago Station $4,000,000
• • •
Western Avenue Station $2,300,000
• • •
Westmont $2,000,000 • •
A-2 InterlockingReplacement
$750,000,000 (No Projects Programmed) $ -
Yards, Facilities, and Equipment Improvements
$664,000,000
47th Street Yard Heating $6,000,000
• • •
Building Improvements $20,000,000
• • •

Page 74 of 85
Adopted 2021 Operating Budget, Two-Year Financial Plan,
and Five-Year Capital Program
Central Warehousing $4,000,000
• •
Crew Facilities $2,000,000 • • •
Equipment and Vehic Mech $14,000,000
• •
Facilities – Electrical, BNS $3,600,000
• • •
Facilities – Electrical, MED $1,920,000
• • •
Facilities – Electrical, MWD $3,800,000
• • •
Facilities – Electrical, RID $2,570,000
• • •
Hill/Eola/14th St. Yard Expansion $4,000,000
• •
M19A Wastewater Treatment $2,945,000
• • •
Right of Way Equipment $31,250,000
• •
Western Ave Yard Oil Separation $890,000
• • •
Yard Improvements, BNS $10,500,000
• • •
Yard Improvements, MED $3,600,000
• • •
Yard Improvements, MWD $4,000,000
• • •
Yard Improvements, RID $2,000,000
• • •
Yard Improvements, UPR $4,400,000
• • •
Chicago Union Station Improvements
$500,000,000 CUS Interlockers $2,000,000
• • •
Uncategorized Projects - Metra
$ -
COVID-19 Modifications $26,800,000
• • •
Infrastructure Engineering, BNS $700,000
• • •
Infrastructure Engineering, MED $1,800,000
• • •

Page 75 of 85
Adopted 2021 Operating Budget, Two-Year Financial Plan,
and Five-Year Capital Program
Infrastructure Engineering, MET $1,550,000
• • •
Infrastructure Engineering, MWD $1,800,000
• • •
Infrastructure Engineering, RID $1,800,000
• • •
INFRASTRUCTURE ENGINEERING, UPR $1,600,000
• • •
IT Components and Services $4,523,000
• •
Systemwide Cameras $1,400,000
• •
ICE to be Determined $9,065,189
•
Administration - Metra
$ -
Contingencies $7,278,943 • •
Financial System Replacement $1,000,000
• •
Office Equipment $1,100,000
• •
Program Management $40,000,000
• • •
Project Administration $3,750,000
•
Project Development $2,000,000
• • •
Transit Asset Management $10,300,000
• • •
PTC - systemwide PTC Renewal (Engineering) $10,000,000
• • •
PTC Renewal (Mechanical) $5,600,000
• • •
Grand Total $11,467,000,000 $1,747,317,734
Strategic Goals Metra selected project strategic goals from Invest in Transit for each of the projects presented in the capital program. Metra’s projects were relatively spread out between the goals, with between 29% and 40% of the projects assigned to each of the goals, as shown in Figure 49. Projects such as rehab rail cars and locomotives were marked as deliver value on investment as they will enable older assets to continue serving the region. The purchase of new rail cars and locomotives as well as projects like CREATE P-2, which aims to untangle South Side rail lines, contribute to the strategic goal of stay competitive as these projects offer amenities and service improvements to customers. Projects like yard and station improvements fulfill the goal of build on the strengths of the network.

Page 76 of 85
Adopted 2021 Operating Budget, Two-Year Financial Plan,
and Five-Year Capital Program
Figure 49. Number of Metra Projects Advancing Each Strategic Goal
When looking at funding by goal, the largest portion of funding goes toward projects to stay competitive, with 54% ($934.1 million) of funds addressing this goal. Deliver value on our investment was selected for 24% ($423.6 million) of funds and build on the strengths of the network accounted for 22% ($389.6 million) of funds, as shown in Figure 50. A large portion of Metra’s capital program is focused on replacing the older fleet that is currently operating in the system, and these projects will help Metra stay competitive versus other forms of transportation.
Figure 50. Amount of Metra Funding Advancing Each Strategic Goal (dollars in millions)

Page 77 of 85
Adopted 2021 Operating Budget, Two-Year Financial Plan,
and Five-Year Capital Program
Core Requirements Metra selected either one or two of the core requirements for each of the projects in the 2021-2025 capital program. Metra identified 119 projects as addressing two core requirements, and 22 were identified as addressing one core requirement. The most common core requirement is maintain and improve safety and reliability, which was a requirement of 109 projects. Another important core requirement for Metra was meeting regulatory requirements, which was identified in 83 projects. The requirements of achieve full accessibility were selected for 37 projects and improve equity was a requirement of 31 projects, seen in Figure 51.
Figure 51. Number of Metra Projects Addressing Each Core Requirement
NOTE: Question is asked as multi-response, Service Boards may select up to two core requirements per project.
From a funding perspective by core requirement, $1.557 billion of the funding is going toward projects that meet the requirement of maintaining and improving safety and reliability. The other three requirements have between $410 million and $733 million of the funds toward those requirements as shown in Figure 52.
Figure 52. Amount of Metra Funding Addressing Each Core Requirement (dollars in millions)
NOTE: Question is asked as multi-response, Service Boards may select up to two core requirements per project.

Page 78 of 85
Adopted 2021 Operating Budget, Two-Year Financial Plan,
and Five-Year Capital Program
An interesting finding is that while 59% by number of projects help to meet regulatory requirements, the value of those projects represents just 35% of Metra’s capital program meaning that many smaller projects that Metra is undertaking address regulatory requirements in this five-year program.
Overall, like the other Service Boards, Metra’s goals are primary focused on maintaining the system and meeting regulatory requirements. Lesser funds are available for improving accessibility and equity. With more funds, Metra would better be able to address these issues as well.
Pace Suburban Service Capital Program Pace’s 2021-2025 capital program contains $371.0 million of available funding despite an estimated $1.033 billion 10-year funding need for priority projects. The 2021-2025 capital program continues to focus on maintaining Pace’s fleet of vehicles, improving, and maintaining passenger infrastructure and providing for limited expansion of services.
Capital Funding by Source Pace’s 2021-2025 Capital Plan is supported by four principal funding sources: federal funds 49.2%; Rebuild Illinois Bond funds 37.4%; PAYGO funds 12.2%; and Innovation, Coordination, & Enhancement funds 1.2%, as shown in Figure 53. As with the other Service Boards, Pace funding has a robust mix of federal and state sources, though local contributions are limited. Pace and RTA will continue to advocate for additional state funding after the Rebuild Illinois program is drawn down, as Pace’s funding mix will begin to move back to being primarily federally supported without additional state support.
Figure 53. Pace 2021-2025 Program Funding Sources: $371.0 Million

Page 79 of 85
Adopted 2021 Operating Budget, Two-Year Financial Plan,
and Five-Year Capital Program
Capital Funding by Priority Projects Pace has identified 20 key priority projects as part of their 10-year funding needs, as shown in Table 15. Of those 20 projects, Pace has been able to dedicate some funding to 18 of the 20 projects during the five-year capital plan and some of the projects are at least 50% funded during the five-year capital program. This implies that if funding continued at the same rate the projects could be fully funded over the 10-year time horizon. The majority of projects seeing the largest amount of funding are focused on maintaining and replacing Pace’s fleet of vehicles that services the community. In addition, Pace is funding several projects that benefit user amenities including shelters, signage, and passenger facilities. Finally, Pace has targeted some of their funding to limited expansions in areas where there is projected growth post-COVID.
Table 15. Pace Priority Projects
Pace Priority Projects
Estimated 10-
Year Need
Total 5-Year Funding
Programmed
Fixed Route Buses - Replacement 316,300,000$ $ 112,000,000
Associated Capital Maintenance Items 111,680,000$ $ 55,096,131
Fixed Route Buses - Expansion 94,889,000$ $ 9,900,000
Pulse Infrastructure 84,525,000$ $ 600,000
Improve Support Facilities 58,925,000$ $ 41,500,000
Paratransit Vehicles - Replacement 55,300,000$ $ 20,992,833
Security, Computer, Software, and Office Systems Upgrades 50,500,000$ $ 5,600,000
Bus on Shoulder (BoS) Infrastructure 35,000,000$ $ 35,000,000
Pedestrian Infrastructure/Shelters/Signs 33,980,000$ $ 8,980,000
Vanpool Vehicles - Replacement 33,560,000$ $ 6,560,000
Support Equipment/Non-Revenue Vehicles 22,850,000$ $ 2,350,000
Improve Passenger Facilities - Transportation Centers 20,900,000$ $ 12,594,620
Intelligent Bus System (IBS) Replacement 20,500,000$ $ 6,250,000
Community Vehicles - Replacement 18,750,000$ $ 6,675,000
Construct New Support Facilities 18,300,000$ $ 18,300,000
Improve Passenger Facilities - Park-n-Ride Lots 14,200,000$ $ 6,750,000
Regional Transit Signal Priority (RTSP) 14,000,000$ $ 6,407,729
Farebox System 13,250,000$ $ 10,000,000
Paratransit Vehicles - Expansion 13,000,000$ $ -
Community Vehicles - Expansion 3,000,000$ $ -
Uncategorized Projects - Pace -$ $ 1,400,000
Administration - Pace -$ $ 4,000,000
Grand Total 1,033,409,000$ $ 370,956,313

Page 80 of 85
Adopted 2021 Operating Budget, Two-Year Financial Plan,
and Five-Year Capital Program
Data will be further analyzed by looking at core requirements, and strategic goals. Table 16 shows information for every Pace project, and Appendix B contains the detailed data for each project.
Table 16. Pace Priority Projects Details
Pace Priority Projects
Estimated 10-Year Need for Priority
Project
Individual Capital Project
Title
Total 5-Year Funding
Programmed
Strategic Goals Core
Requirements
De
liver
Val
ue
on
Ou
r In
vest
men
t
Bu
ild o
n S
tren
gth
s o
f O
ur
Ne
two
rk
Stay
Co
mp
etit
ive
Mai
nta
in a
nd
imp
rove
saf
ety
an
d r
elia
bili
ty
Ach
ieve
Fu
ll A
cces
sib
ility
Mee
t R
egu
lato
ry R
equ
ire
me
nt
Fixed Route Buses - Replacement
$316,300,000 Replacement diesel buses (40')
$39,000,000 • • •
Replacement CNG buses
$63,250,000 • • •
Coach Buses $9,750,000 • • •
Associated Capital Maintenance Items
$111,680,000 Engine/Transmission Retrofits & Associated Capital
$55,096,131
• •
Fixed Route Buses - Expansion
$94,889,000 Expansion CNG buses
$9,900,000 • • •
Pulse Infrastructure $84,525,000 Pulse Dempster Line Easements
$600,000 • •
Paratransit Vehicles - Replacement
$55,300,000 Paratransit Vehicles
$20,992,833 • • •
Improve Support Facilities
$58,925,000 Improve Support Facilities
$3,500,000 • •
North Shore Division Expansion
$20,000,000 • •

Page 81 of 85
Adopted 2021 Operating Budget, Two-Year Financial Plan,
and Five-Year Capital Program
Southwest Division Expansion
$18,000,000 • •
Security, Computer, Software, and Office Systems Upgrades
$50,500,000 Computer Systems/Hardware & Software
$5,100,000
• •
Office Equipment/Furniture
$500,000 • •
Bus on Shoulder (BoS) Infrastructure
$35,000,000 I-294 Stationsand Park-n-Rides
$35,000,000 •
Pedestrian Infrastructure/Shelters/Signs
$33,980,000 Bus Stop Shelters
$5,330,000 • •
Bus Tracker Signs
$3,650,000 • •
Vanpool Vehicles - Replacement
$33,560,000 Vanpool Vehicles
$6,560,000 • •
Support Equipment/Non-Revenue Vehicles
$22,850,000 Support Equipment/Non
$2,350,000 • • •
Improve Passenger Facilities - Transportation Centers
$20,900,000 Improve Passenger Facilities
$12,594,620
• •
Intelligent Bus System (IBS) Replacement
$20,500,000 Intelligent Bus System
$6,250,000 • •
Community Vehicles - Replacement
$18,750,000 Community Transit/On Demand Vehicles
$6,675,000
• • •
Construct New Support Facilities
$18,300,000 Northwest Wheeling Garage
$10,000,000 • •
Plainfield Garage
$8,300,000 • •
Improve Passenger Facilities - Park-n-Ride Lots
$14,200,000 I-55 Park-n-Rides
$6,750,000 • •
Regional Transit Signal Priority (RTSP)
$14,000,000 Transit Signal Priority Integration
$2,000,000 • •
Transit Signal Priority
$4,407,729 • •
Farebox System $13,250,000 Farebox System Replacement
$10,000,000 •

Page 82 of 85
Adopted 2021 Operating Budget, Two-Year Financial Plan,
and Five-Year Capital Program
Paratransit Vehicles - Expansion
$13,000,000 No Projects Programmed
$ -
Community Vehicles - Expansion
$3,000,000 No Projects Programmed
$ -
Uncategorized Projects - Pace
$ - Transit Asset Management
$400,000 • •
Vision Plan Implementation Study
$1,000,000 • •
Administration - Pace
$ - Project Management for Priority Capital Projects
$4,000,000
• •
Grand Total $1,033,409,000 $370,956,313
Strategic Goals Pace selected one of the strategic goals from Invest in Transit for each of the projects presented in the capital program. Deliver value on our investment was the requirement identified most often, with 52% of projects assigned to this goal. About 27% of projects were assigned to build on the strengths of the network, and 21% to stay competitive, as shown in Figure 54. Pace’s projects that include replacing existing vehicles and improving existing facilities were most often categorized as delivering value on investment, while projects that expand or improve the system, such as the expansion of the bus fleet, and bus-on-shoulder projects are designed to help Pace stay competitive. Projects such as transit signal priority and Pulse Bus Rapid Transit projects were assigned the goal of build on the strengths of the network.
Figure 54. Number of Pace Projects Advancing Each Strategic Goal

Page 83 of 85
Adopted 2021 Operating Budget, Two-Year Financial Plan,
and Five-Year Capital Program
When looking at funding by goal, deliver value on investment continues to be the most funded goal, with 66% of funds going toward these projects, while 18% to build on the strengths of our network and 16% to staying competitive, as seen in Figure 55. Continuing the trend in the region, funding projects that deal with ongoing maintenance and support the existing system remain the most important components of Pace’s capital program. If more funding were available, Pace could advance projects that would allow for more frequent service and offer better connections around the system.
Figure 55. Amount of Pace Funding Advancing Each Strategic Goal (dollars in millions)
Core Requirements Pace selected one core requirement for each of the projects in the 2021-2025 capital program. The top selected requirement was maintaining and improving safety and reliability, which was assigned to 24 projects. Few projects were assigned to the other core requirements with achieve full accessibility accounting for eight projects, improve equity for five projects, and meet regulatory requirements for two projects, as shown in Figure 56. Similar to the strategic goals above, most of Pace’s projects are focused on maintaining current operations and therefore classified as maintaining and improve safety and reliability.

Page 84 of 85
Adopted 2021 Operating Budget, Two-Year Financial Plan,
and Five-Year Capital Program
Figure 56. Number of Pace Projects Addressing Each Core Requirement
NOTE: Question is asked as multi-response, Service Boards may select up to two core requirements per project.
From a funding by core requirement perspective, $324.0 million of the funding is going toward projects that maintain and improve safety and reliability, while $152.9 million help achieve full accessibility, $57.7 million help to improve equity and less than $1.0 million fund regulatory requirements, seen in Figure 57.
Figure 57. Amount of Pace Funding Addressing Each Core Requirement (dollars in millions)
NOTE: Question is asked as multi-response, Service Boards may select up to two core requirements per project.
Overall, Pace’s data show that the requirement of maintain and improve safety and reliability is the chief focus of the funded projects. Furthermore, with Pace’s focus on providing services to a diverse community funding to help achieve full accessibility is another important aspect of the program.
Overall, similarly to the other Service Boards, Pace’s primary goals of their projects are focused on maintaining the system and meeting accessibility needs. Funding to improve service or

Page 85 of 85
Adopted 2021 Operating Budget, Two-Year Financial Plan,
and Five-Year Capital Program
improve equity within the route network are limited by funding constraints and shows the need to continue to advocate for more funding for the essential services that Pace provides.
Pace Regional ADA Paratransit Capital Program The 2021-2025 Pace ADA capital program includes a capital investment of $15.8 million, funded from the Rebuild Illinois Program’s Bond funds. Overall, Pace estimates the 10-year need for the Pace ADA program to be ($187 million). Plans to improve ADA-related technology include upgrading its Trapeze software, enhancing its TripCheck features, adding notification features, and integrating Ventra. In addition, funding will be used to purchase land, build facilities, and provide amenities for riders at new transfer locations. These projects meet the strategic goal of building on the strengths of the system and meet the core requirements of maintaining and improving safety and reliability as well as achieving full accessibility.
To meet Pace’s 10-year funding needs, new funding source will need to be identified to meet all capital needs of the ADA capital program.
RTA Capital Program The RTA’s portion of the proposed 2021-2025 Regional Capital Program totals $818 million, which is made up of set asides of the 2025 federal formula and State PAYGO funding. This funding will be programmed to the Service Boards using a new performance-based capital allocation process developed and implemented at a later date.

175 W. Jackson Blvd., Ste. 1650 Chicago, Illinois 60604
Phone: (312) 913-3200
www.rtachicago.org
Follow us on
Chicago Transit Authority567 W. Lake St.Chicago, IL 60661(888) 968-7282www.transitchicago.com
Metra547 W. Jackson Blvd.Chicago, IL 60661(312) 322-6777www.metrarail.com
Pace550 W. Algonquin Rd.Arlington Heights, IL 60005(847) 364-7223www.pacebus.com