adolescent and youth outcomes after very preterm...
TRANSCRIPT

Adolescent and Youth Adolescent and Youth Outcomes after Outcomes after
Very Preterm BirthVery Preterm Birth
Brian Darlow University of Otago
Christchurch


Very low birthweight Very low birthweight -- <1500g <1500g
Very preterm Very preterm -- <32 weeks <32 weeks
VLBW/VP are 1%-2% live births
Survival - 90% to discharge
1986 413 VLBW infants. 82% survival – 338 survivors
2008 c.800 VLBW infants. 90% survival – 720 survivors
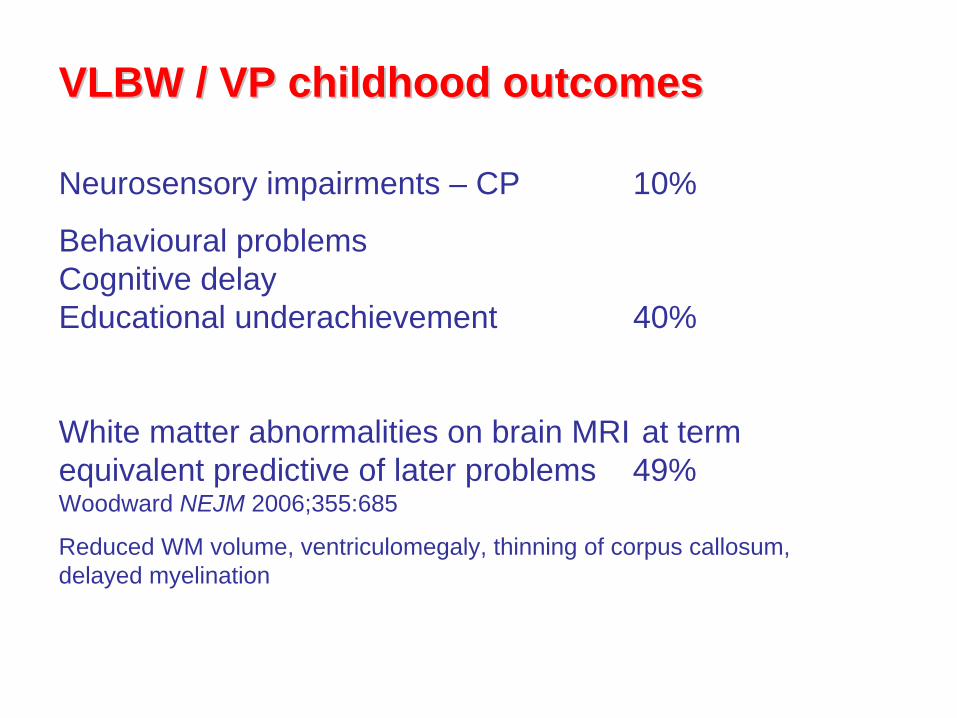
VLBW / VP childhood outcomes VLBW / VP childhood outcomes
Neurosensory impairments – CP 10%
Behavioural problems Cognitive delay Educational underachievement 40%
White matter abnormalities on brain MRI at term equivalent predictive of later problems 49% Woodward NEJM 2006;355:685
Reduced WM volume, ventriculomegaly, thinning of corpus callosum, delayed myelination
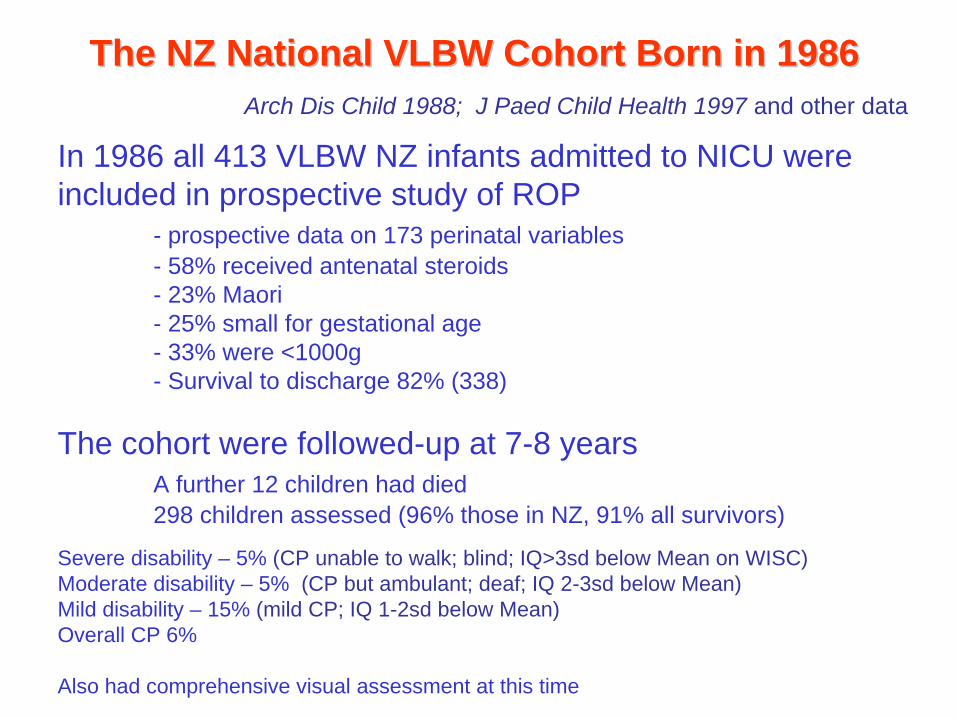
The NZ National VLBW Cohort Born in 1986The NZ National VLBW Cohort Born in 1986Arch Dis Child 1988; J Paed Child Health 1997 and other data
In 1986 all 413 VLBW NZ infants admitted to NICU were included in prospective study of ROP
- prospective data on 173 perinatal variables- 58% received antenatal steroids- 23% Maori- 25% small for gestational age- 33% were <1000g - Survival to discharge 82% (338)
The cohort were followed-up at 7-8 yearsA further 12 children had died298 children assessed (96% those in NZ, 91% all survivors)
Severe disability – 5% (CP unable to walk; blind; IQ>3sd below Mean on WISC)Moderate disability – 5% (CP but ambulant; deaf; IQ 2-3sd below Mean) Mild disability – 15% (mild CP; IQ 1-2sd below Mean) Overall CP 6%
Also had comprehensive visual assessment at this time
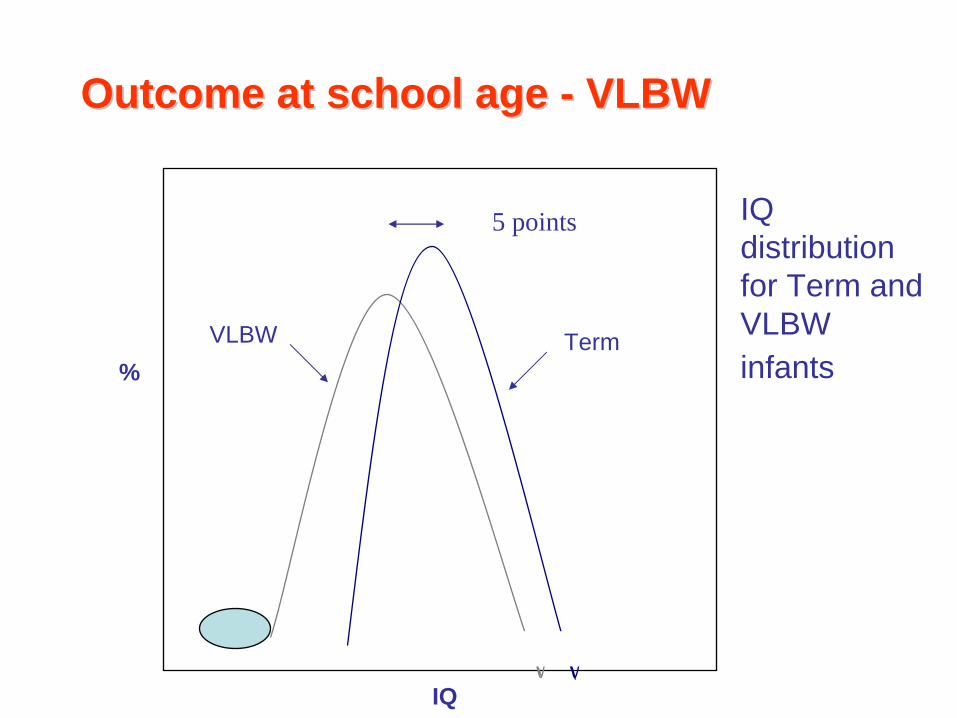
5 points
Outcome at school age Outcome at school age -- VLBWVLBW
IQ distribution for Term and VLBW infants
Term
IQ
VLBW%

Outcome at school age Outcome at school age -- VLBWVLBWArch Dis Child 1998; 79: F12-20 and other data
Behavioural Problems Term 7% VLBW 2-3x
Cognitive Impairment Term 11% VLBW 2.5x
Below ave School Perf. Term 15-20% VLBW 2x
Enrolled special class Term 1% VLBW 6x

Outcome after VLBWOutcome after VLBW
Best evidence from population based studies over time is that:
With increasing survival rates, overall disability is either not increased or less
For the most premature infants, eg 23 weeks or below, overall outcome remains very poor
VLBW/VP “tip of iceberg”. Are many more moderate and late preterm infants. Indications are that they have a similar range of problems but with a lower incidence.


VLBW Adolescents and Young AdultsVLBW Adolescents and Young Adults
Evidence from:
National registry data (eg Scandinavia)
National (Dutch POPS study born 1983), or regional
Hospital based cohorts
Date from 1970’s or early 1980’s
Few received antenatal steroids
Reviews: Hack J Dev Behav Pediatr 2009;30:460
Doyle Pediatrics 2010;126:342

VLBW Adolescents and Young AdultsVLBW Adolescents and Young Adults
Pioneering work of Saroj Saigal – Hamilton, Ontario JAMA 1996; 276: 453
ELBW adolescents born 1977-82, aged 12-16 years
27% had neurosensory impairments
Had more limitations in self-care, pain, sensation and cognitive attributes on direct measures
BUT 71% ELBW vs 73% controls gave utility rating >0.95 for health status
Dinesen Arch Dis Child 2002 exVLBW, LBW, Term at 18-20yrs
Objective QoL , less in VLBW (Societal standards) Subjective QoL, no different (Life experiences and preferences)

VLBW NZ 1986 Young Adult StudyVLBW NZ 1986 Young Adult Study
At 22 years, 230 (71% survivors) 56% had ANS
25% <1000g
25% <28 weeks gestation
26% Maori
47% male
vs. 69 controls, born at term in 1986. Reasonably well matched – NS differences
Traced and assessed by face-to-face interview
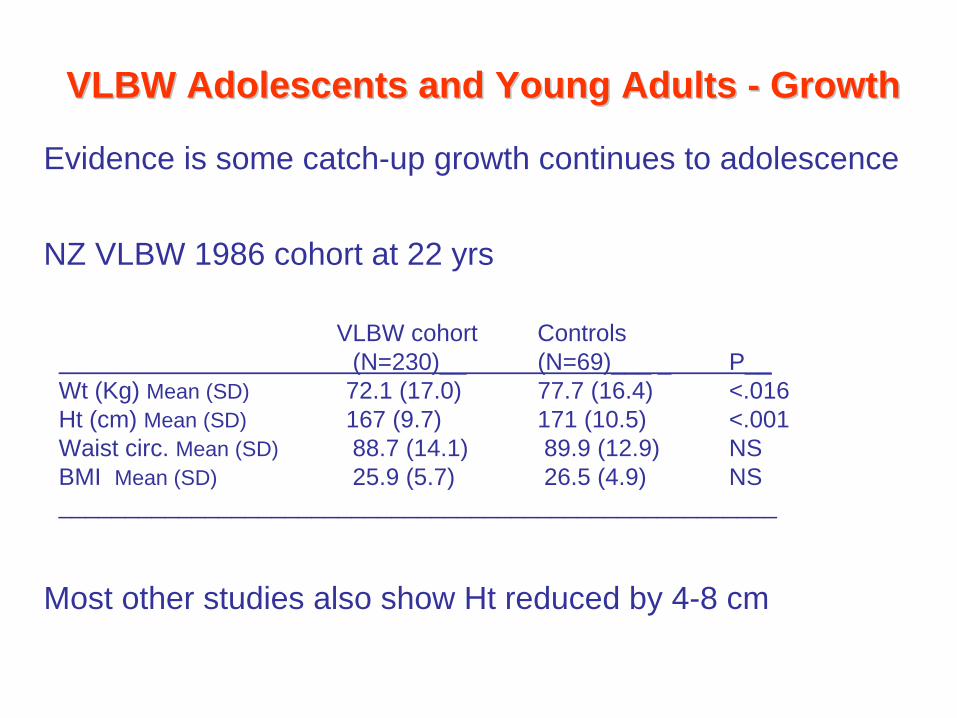
VLBW Adolescents and Young Adults VLBW Adolescents and Young Adults -- GrowthGrowth
Evidence is some catch-up growth continues to adolescence
NZ VLBW 1986 cohort at 22 yrs
Most other studies also show Ht reduced by 4-8 cm
VLBW cohort Controls(N=230)__ (N=69)___ _ P__
Wt (Kg) Mean (SD) 72.1 (17.0) 77.7 (16.4) <.016Ht (cm) Mean (SD) 167 (9.7) 171 (10.5) <.001Waist circ. Mean (SD) 88.7 (14.1) 89.9 (12.9) NSBMI Mean (SD) 25.9 (5.7) 26.5 (4.9) NS______________________________________________________

VLBW Adolescents and Young Adults VLBW Adolescents and Young Adults –– GrowthGrowth
The growth velocity dilemmaSmaller size at birth plus poor growth linked with poorer neurodevelopment and increased risk of health problems
Neonatologists strive to achieve improved growth in VLBW infants
Animal and epidemiological data show upward crossing of percentiles has increased risk of CVS disease, impaired insulin tolerance, etc
Some evidence that for ELBW group BMI Z-scores increase from 3 years to adulthood

VLBW Adolescents/Young Adults VLBW Adolescents/Young Adults –– MetabolicMetabolic
<32 weeks (AGA and SGA) vs controls at age 4 - 10 years had reduced insulin sensitivity (P=0.002)
Hofman NEJM 2004;351:2179
VLBW vs controls at age 18 - 27 years had increased insulin resistance and impaired GTT
Hovi NEJM 2007;356:2053
Decreased bone mineral density in VLBW young adults both M and F in lower lumbar spine, femoral neck
Hovi PLoS Med 2009 Aug

Changes in lung capacity with age, contrasted between those born
very preterm
with those born at term, illustrating the effects of smoking, started at different
ages, on both groups (dashed lines) Courtesy Lex Doyle
VLBW Young Adults VLBW Young Adults –– Respiratory FunctionRespiratory Function

Study (year
published)Age studied
(years)Preterm groups Controls
BPD No BPD
Halvorsen (2004) 19.7 87.8 (13.8)n=12†
97.7 (12.9)n=34
108.1 (13.8)n=46
Doyle (2006) 18.9 81.6 (18.7)n=33*
92.9 (12.8)n=114
99.4 (9.5)n=37
Vrijlandt (2006) 19 90.1 (19.8)n=8‡
99.2 (17.9)n=12‡
109.6 (13.4)n=48
FEV1 ( % predicted for age, height and sex)
FEV1
< 80% is abnormalFEV1
/ FVC
< 75% is abnormal
VLBW / VP young adults may exercise less and have reduced aerobic and exercise
capacity
Courtesy Lex Doyle

VLBW Young Adults VLBW Young Adults –– Respiratory outcomesRespiratory outcomes
NZ 1986 VLBW cohort at 7-8 years
52% had been diagnosed with asthma at some time, compared to
27% of contemporary NZ children in ISAAC study
At 22 years
32% cohort vs 12% controls (P<0.01) had wheeze in past year
But just as likely to be daily smoker: 28% vs 26%

VLBW Young Adults VLBW Young Adults –– cardiovascular diseasecardiovascular disease
CVS disease accounts for 40% all deaths in gen. population
IHD is commonest cause of death – 23%
BP in VLBW/VP young adults
Systolic BP consistently elevated in studies
Diastolic BP elevated in some but not all
Other areas to investigate
Endothelial function
LV function

VLBW Young Adults VLBW Young Adults –– renal diseaserenal disease
Major part of nephrogenesis occurs in third trimester
Acute renal failure in up to 18% VP infants Jetton Curr Opin Pediatr 2012;24: 191
Dutch POPS study suggests: reduced renal growth higher serum creatinine higher microalbumin excretion at 19 years

VLBW Young Adults VLBW Young Adults –– visionvision
VLBW/VP associated with increased risks of impaired acuity, myopia, squint – 2-3x general population
ROP may double the risk; if treated ROP risk still greater
Adverse visual outcomes may affect neurological development
UK Midlands <1701g cohort. Age 10-14 years 50% adverse visual outcomes
Ontario ELBW adolescents 36% prescription glasses vs 10% controls by young adulthood 64% vs 37%

VLBW Young Adults VLBW Young Adults –– cognitive functioncognitive function
VLBW/VP - in childhood impairments in: behaviour, cognitive function, school performance
and problems in: use/understanding of language visuo-spatial abilities executive functioning
Largely unknown whether these persist to adolescence and beyond. Is degree of neural WM plasticity that may modify adverse effects
MRI scans in VLBW young adults from 1966-77 show increased ventricular volume, reductions in corpus callosum and alterations in grey and white matter

Dutch POPS study Born 1983, seen 19yrsADCFNE 2009;94:F196

VLBW Young Adults VLBW Young Adults –– Methods at 22yrsMethods at 22yrs
Participants given comprehensive questionnaire at a face- to-face interview, covering
- socio-demographic factors
- health
- education
- social roles
Supplemented by information from medical records
Parents also administered a postal questionnaire

MethodsMethods
Behaviour, physical and mental health measures
- BRIEF (behavioural rating of executive function)
- ADHD symptoms self-report
- ODD symptoms self-report
- SF-36 (short form health and functioning survey)
- SCL-90 (psychometric check list)
Statistical comparisons – chi square, t-test or Poisson regression as appropriate

MeasureVLBW cohort
(N=230)Controls (N=69)
p
% no formal qualifications 14 6
% high school qualifications only 30 23
% tertiary technical qualifications 41 41
% university degree 15 30 <.05
Educational qualifications
Trend to lower educational attainment most marked in those with prior disability at age 7-8 (30% no quals, 21% high school, 41% tertiary, 3% degree).No effect of B Wt.

MeasureVLBW cohort
(N=230)Controls (N=69)
p
% living with parents 38 25
% cohabiting partner 29 33
% living with flatmates 16 32
% living alone 6 6
% other 11 4 <.05
Current living arrangements
Trend more exaggerated for ELBW and those with mod/severe disability at 7-8 years

Selected other outcomes at 22 years
Measure VLBW (N=230) Controls (N=69) P
% Welfare dependent (ever) 51% 30% <.01
% With romantic partner 58% 75% <.01
% Has few or no friends 53% 32% <.01
% Weekly alcohol use 37% 38% NS
% Cannabis use (past 12m) 30% 36% NS
% Arrested (ever) 17% 25% NS
Trend for less risk taking for those with moderate/severe disability at 7-8 years

SF-36 is Short Form Health Survey that allows quality of life scores to be derived

Norm based SF-36 scale for 18-24 years
VLBW cohort Controls% >1SD below mean (N=230)__ (N=69)_ P_Physical component summary 15.7 13.2 NS
Mental component summary 6.6 4.4 NS
Overall functioningSelf esteem score Mean (SD) 31.7 (5.1) 31.8 (4.6) NS
Life satisfaction Mean (SD) 41.6 (5.2) 42.1 (5.1) NS________________________________________________________________
Consistent message from literature. Although objective measures of health status and QoL are lower than controls – self-rating shows no difference from their peers

VLBW Adolescents/Young Adults VLBW Adolescents/Young Adults –– SummarySummary
Most VLBW/VP adolescents are doing well and rate their health and QoL similar to their peers.
May have declared (eg CP) or undeclared health problems - (eg raised Ct, lower aerobic capacity)
Often more socially isolated than their peers
It is possible VLBW/VP graduates may be at risk of early ageing – current research trying to identify biomarkers for this
Mod/late preterm may have similar issues, lower incidence but higher overall prevalence

VLBW Young Adults VLBW Young Adults –– Current StudyCurrent Study
Current HRC grant
250 (77%) VLBW cohort and 100 controls come to Christchurch for two days of investigations:
Ht, Wt, Waist circumference, BMI, Body fat
Blood tests - fasting insulin, glucose, HbA1 C, cotinine, plasma hormones, biochemistry
BP, Echocardiogram, ECG, perpheral artery tonometry
Respiratory function tests
Visual function, retinal photographs
Dental examination
Cognitive and Neuropsychological Functioning assessments
Questionnaire
Cranial MRI (100 cohort, 50 controls)

Snow and adolescence are the only problems that disappear if you ignore them long enough.
Thank you