administered prices and inflation targeting in thailand · pdf fileadministered prices and...
TRANSCRIPT

Administered Prices and Inflation Targeting in Thailand
Presentation at Bank of ThailandNovember 19, 2015
1
Kanin Peerawattanachart
-6
-4
-2
0
2
4
6
8
10
12
Jan
-96
Oct
-96
Jul-
97
Ap
r-9
8
Jan
-99
Oct
-99
Jul-
00
Ap
r-0
1
Jan
-02
Oct
-02
Jul-
03
Ap
r-0
4
Jan
-05
Oct
-05
Jul-
06
Ap
r-0
7
Jan
-08
Oct
-08
Jul-
09
Ap
r-1
0
Jan
-11
Oct
-11
Jul-
12
Ap
r-1
3
Jan
-14
Oct
-14
Headline Inflation
Core Inflation
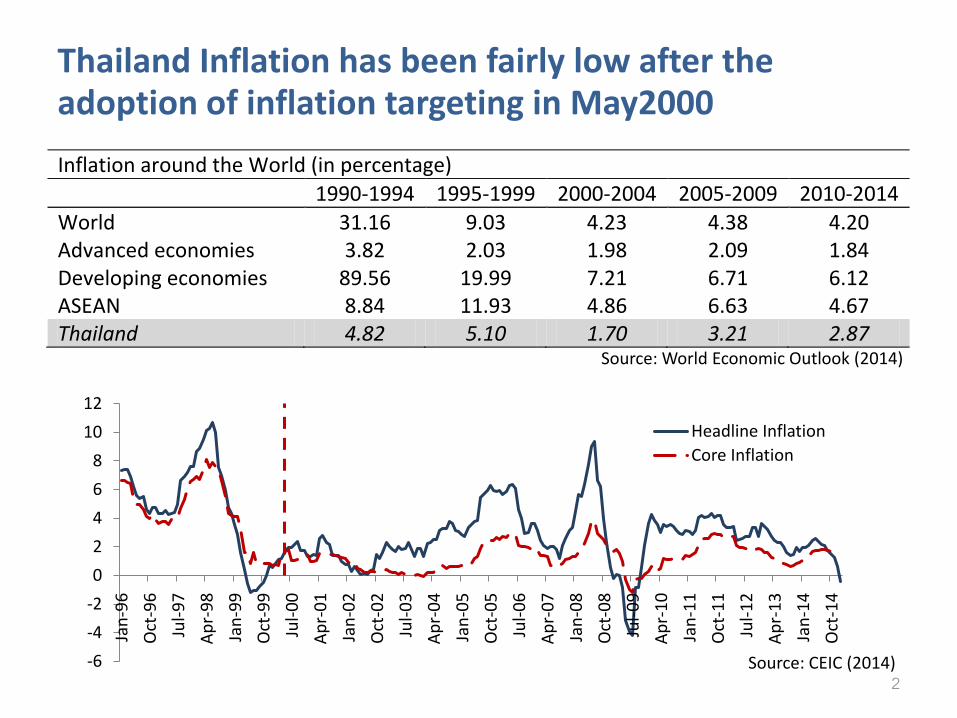
Thailand Inflation has been fairly low after the adoption of inflation targeting in May2000
2
Source: World Economic Outlook (2014)
Inflation around the World (in percentage)
1990-1994 1995-1999 2000-2004 2005-2009 2010-2014
World 31.16 9.03 4.23 4.38 4.20 Advanced economies 3.82 2.03 1.98 2.09 1.84 Developing economies 89.56 19.99 7.21 6.71 6.12 ASEAN 8.84 11.93 4.86 6.63 4.67 Thailand 4.82 5.10 1.70 3.21 2.87
Source: CEIC (2014)

BoT shifted from core inflation targeting at 0.5-3% to headline inflation targeting at 2.5% ± 1.5%
3
Switching of Inflation Targeting Regime
Core Inflation
Headline Inflation
Band Point
Reasons
Easier communication: more attentive to general public
Better anchoring: one target point
Core inflation lost ability to track underlying inflationary pressure. Thailand was the last country that use core inflation as a policy target

Administered Prices
4

Thailand’s share of administered price has always been high above 30% of the CPI Basket
Among inflation targeting countries, Thailand has the largest degree of price subsidies…
…with 135 items, they accounted for around 35% of 2011 CPI Basket
Source: BIS (2009)
5
5%
9% 10% 10%
16% 16% 17% 18% 19%21%
30%
38%
0%
5%
10%
15%
20%
25%
30%
35%
40%
Average : 17%
30.04
38.3437.1
34.6
25.45
31.98
31.627.2
62
77
119
135
0
20
40
60
80
100
120
140
160
0
5
10
15
20
25
30
35
40
45
1998 2002 2007 2011
Weight in Headline Weight in Core Number of Items
Source: Bank of Thailand (2014)
Share of administered prices in CPI Basket Development of Administered Prices in Thailand

How could the sizable share of administered prices impact monetary policy under inflation targeting?
6
High degree of price controls
Maintaining people cost of living
Limiting prices fluctuation and provide short term relief
Coping with temporary shock when monetary policy cannot
accommodate
Distort market mechanism and do not provide long term alleviation
As control is altered, the surprising shock would drive up inflation greatly
Market does not reflect the real pricing, and inflict costs on the
economy

A consistently high proportion of government price control since 2002 could be considered as a special challenge for inflation targeting framework
• “Administered prices also set a special challenge for the inflation targeting framework. The extra measures introduced in 2009 were the main reason for the inflation target being missed in that year. Administered prices also make it harder for the BoT to assess the current state of demand. By keeping prices down, pressures on the index may be suppressed, but at the same time holding prices down gives the public more to spend on other things.”
- Grenville and Ito (2010, p.44)• Controls do not provide long term relief from inflation and do inflict costs on
the economy by distorting the pricing system. - Daniel (1975)
• Large portion of administered items in CPI of emerging economies have substantial impact on inflation volatility in the short term.
- Masson et al. (1998) and Debelle, (2001) • Price controls caused inflation to diverge from normal trend.
- Mallikamas and Ponsaparn (2005)
7
8
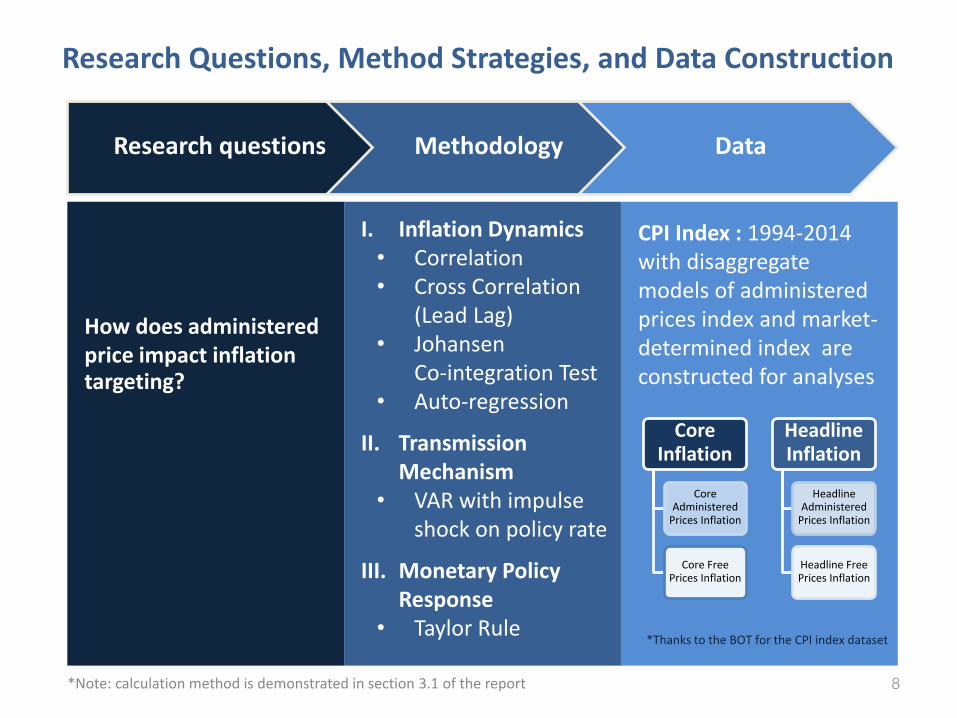
Research questions Methodology Data
How does administered price impact inflation targeting?
I. Inflation Dynamics• Correlation• Cross Correlation
(Lead Lag)• Johansen
Co-integration Test• Auto-regression
II. Transmission Mechanism
• VAR with impulse shock on policy rate
III. Monetary Policy Response
• Taylor Rule
CPI Index : 1994-2014 with disaggregate models of administered prices index and market-determined index are constructed for analyses
*Note: calculation method is demonstrated in section 3.1 of the report
Research Questions, Method Strategies, and Data Construction
Core Inflation
Core Administered
Prices Inflation
Core Free Prices Inflation
Headline Inflation
Headline Administered
Prices Inflation
Headline Free Prices Inflation
*Thanks to the BOT for the CPI index dataset

-15
-10
-5
0
5
10
15
1996 1998 2000 2002 2004 2006 2008 2010 2012 2014
Headline Inflation
Headline admin
Headline free
Asian Financial Crisis
Global Financial Crisis
Euro Crisis
Oil shock
Containing large proportion of administered prices items, headline inflation is more volatile
Source: Bank of Thailand (2014)
9
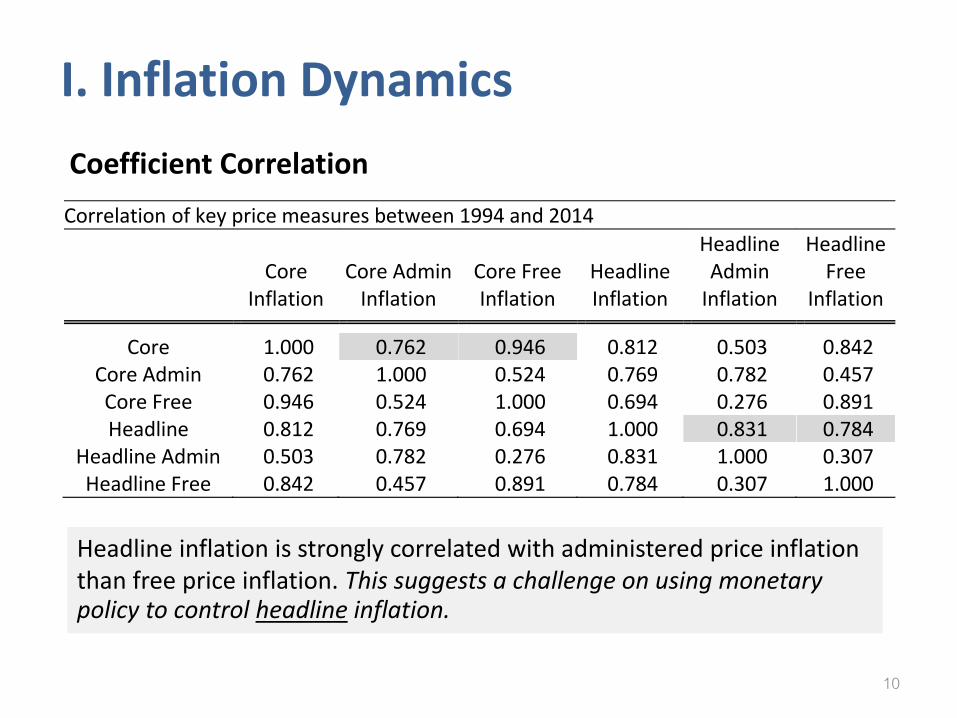
10
Correlation of key price measures between 1994 and 2014
Core
Inflation Core Admin
Inflation Core Free Inflation
Headline Inflation
Headline Admin
Inflation
Headline Free
Inflation Core 1.000 0.762 0.946 0.812 0.503 0.842
Core Admin 0.762 1.000 0.524 0.769 0.782 0.457 Core Free 0.946 0.524 1.000 0.694 0.276 0.891 Headline 0.812 0.769 0.694 1.000 0.831 0.784
Headline Admin 0.503 0.782 0.276 0.831 1.000 0.307 Headline Free 0.842 0.457 0.891 0.784 0.307 1.000
Headline inflation is strongly correlated with administered price inflation than free price inflation. This suggests a challenge on using monetary policy to control headline inflation.
Coefficient Correlation
I. Inflation Dynamics
11
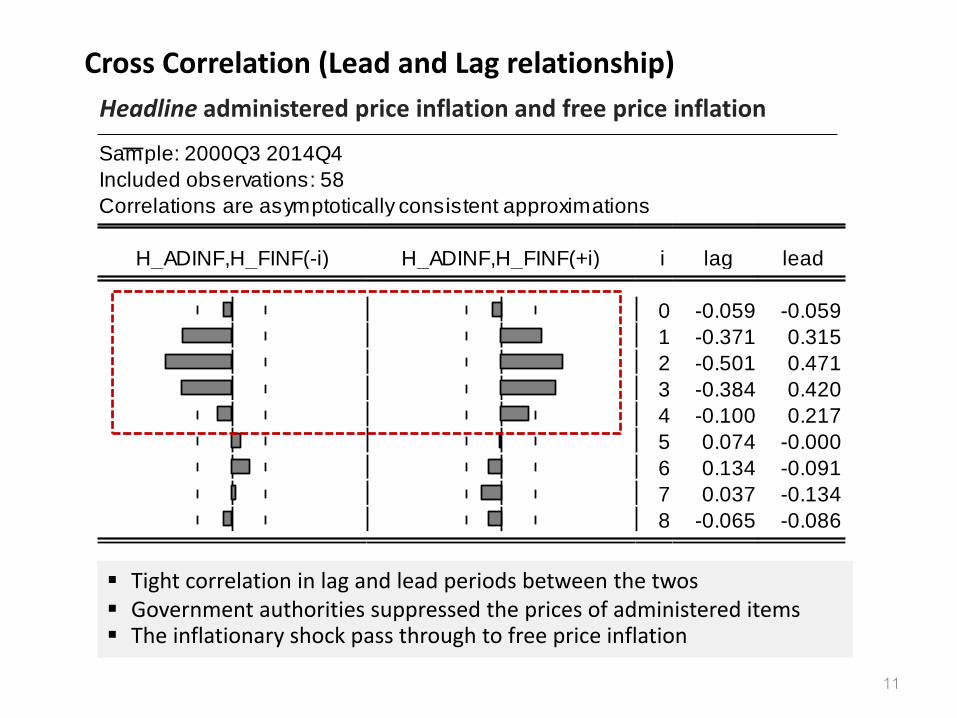
Cross Correlation (Lead and Lag relationship)
Sample: 2000Q3 2014Q4
Included observations: 58
Correlations are asymptotically consistent approximations
H_ADINF,H_FINF(-i) H_ADINF,H_FINF(+i) i lag lead
0 -0.059 -0.059
1 -0.371 0.315
2 -0.501 0.471
3 -0.384 0.420
4 -0.100 0.217
5 0.074 -0.000
6 0.134 -0.091
7 0.037 -0.134
8 -0.065 -0.086
Tight correlation in lag and lead periods between the twos Government authorities suppressed the prices of administered items The inflationary shock pass through to free price inflation
Headline administered price inflation and free price inflation

12
Johansen Co-Integration Test
Inflation Persistency (Auto-regression)
Administered prices do not have significant effect on comprehensiveness and do not reflect the underlying cost of living in the long term
Estimates of persistence in disaggregate inflation
𝜌 coefficient Prob.
Core Inflation 0.490 0.001 Core Admin Inflation 0.523 0.000 Core Free Inflation 0.771 0.000
Headline Inflation 0.297 0.021 Headline Admin Inflation 0.352 0.006 Headline Free Inflation 0.041 0.767
Given lower persistence in headline inflation, BoT has higher ability to anchor inflation expectation
𝜋𝑡 = 𝜇 + 𝜌𝜋𝑡−1 + 𝜀𝑡
*Note: Quarterly Data (%QoQ)
𝜋𝑡 = (1− 𝛾)𝜋𝑡−1 + 𝛾𝐸𝑡 𝜋𝑡+1 + 𝑣𝑡

13
II. Monetary Transmission Mechanism
Vector Auto-Regression Model
-.4
-.3
-.2
-.1
.0
.1
.2
.3
.4
1 2 3 4 5 6 7 8 9 10 11 12 13 14 15 16
Response of headline inflation to policy rate
-.4
-.3
-.2
-.1
.0
.1
.2
.3
.4
1 2 3 4 5 6 7 8 9 10 11 12 13 14 15 16
Response of headline free prices inflation to policy rate
Given impulse shock on policy rate, headline inflation as well as core inflation tend to adjust faster to interest rate shock than the market-determined price inflation does
Bank of Thailand should even be more forward looking as monetary policy likely takes longer horizon than expect
Note: *Model already taken into account of exogenous oil price, price puzzle still exist
10 quarters
8 quarters
Response of headline inflation to policy rate
Response of free price inflation to policy rate

14
Taylor Equation Estimation Results
Sample period (2003Q1-2014Q4)
Normal Equation Estimated by GMM
Smoothing Equation Estimated by GMM
Regression
regression
recovered
constant 𝛼 = 𝑟𝑓 + 𝜋∗ 2.948
(0.214)** 𝛼
0.929 (0.224)**
𝑟𝑓 + 𝜋∗ 2.921
output gap 𝛽2 = 𝛽𝑦 0.124
(0.116) 𝛽2
0.085 (0.049)*
𝛽𝑦 0.267
inflation gap 𝛽1 1.029
(0.187)** 𝛽1
0.327 (0.101)**
𝛽𝜋 1.028
lagged policy
𝜌 0.682
(0.079)** 𝜌 0.682
R-squared
0.555
0.914
Notes: Brackets are standard errors. “**” denotes significance level at 5%
Coefficients of inflation deviation in both equation are consistent with the Taylor principle (i.e. optimal monetary policy).
𝑖𝑡 = 𝛼 + 𝛽1 𝜋𝑡 − 𝜋∗ + 𝛽2 𝑦𝑡 − 𝑦∗ + 𝜌𝑖𝑡−1 + 𝜀𝑡
III. Monetary Policy Response
15
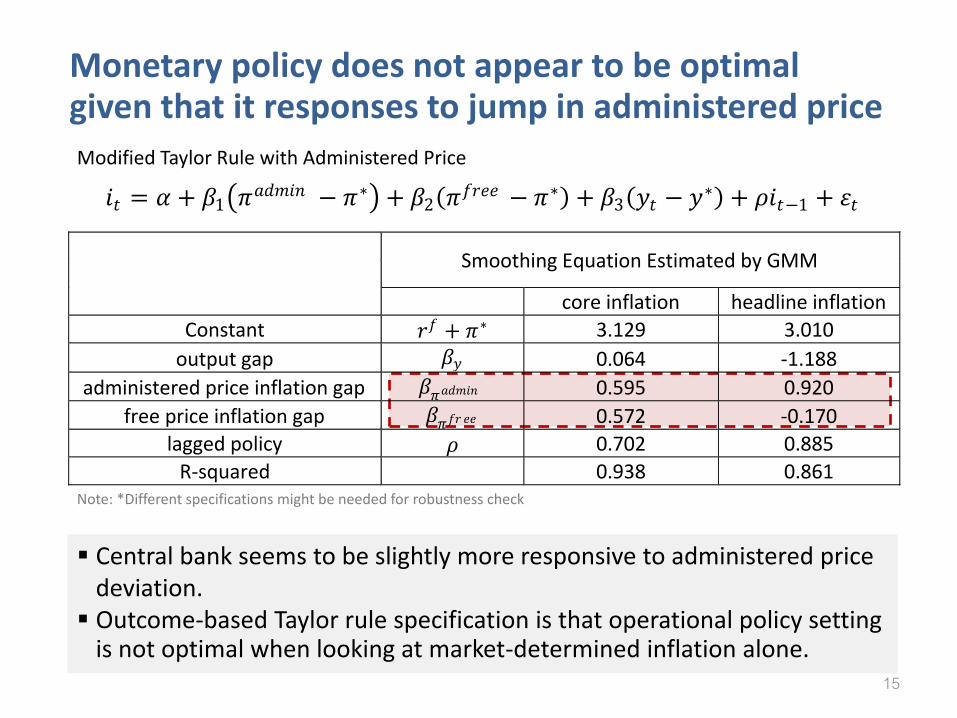
Smoothing Equation Estimated by GMM
core inflation headline inflation
Constant 𝑟𝑓 + 𝜋∗ 3.129 3.010
output gap 𝛽𝑦 0.064 -1.188
administered price inflation gap 𝛽𝜋𝑎𝑑𝑚𝑖𝑛 0.595 0.920
free price inflation gap 𝛽𝜋𝑓𝑟 𝑒𝑒 0.572 -0.170
lagged policy 𝜌 0.702 0.885
R-squared
0.938 0.861
Modified Taylor Rule with Administered Price
Central bank seems to be slightly more responsive to administered price deviation. Outcome-based Taylor rule specification is that operational policy setting
is not optimal when looking at market-determined inflation alone.
Monetary policy does not appear to be optimal given that it responses to jump in administered price
Note: *Different specifications might be needed for robustness check
𝑖𝑡 = 𝛼 + 𝛽1 𝜋𝑎𝑑𝑚𝑖𝑛 − 𝜋∗ + 𝛽2 𝜋
𝑓𝑟𝑒𝑒 − 𝜋∗ + 𝛽3 𝑦𝑡 − 𝑦∗ + 𝜌𝑖𝑡−1 + 𝜀𝑡

Conclusion
16
Price controls raise concern on controllability of Monetary Policy
Inflation process has largely been influenced by price controls Strong correlation with administered prices sector Complicated lead and lag relationship No long-term relationship between price controls and inflation Headline inflation is less persistent; better anchor expectation
Takes longer time for Monetary Policy to become fully effective
Free prices sector has slower transmission process than aggregate headline inflation with over 2 years
Optimality of Monetary Policy depends crucially on the measures of inflation
Taylor Rule holds when aggregate inflation is used to estimate Reaction function seems to exhibit higher degree of response
to deviation in administered price sector
Evolving Process of Inflation
Dynamics
1
Transmission Mechanism
2
Monetary Policy
Response
3

Coordination between Bank of Thailand and Ministry of Commerce is necessary required
17
Key Takeaways
Price controls set special challenges for monetary policy and central bank should incorporate this fact
1
Bank of Thailand should be even more forward looking in setting appropriate monetary policy
2
3
Further study: Welfare analysis on the optimal threshold for the degree of government price control (c.f. Safouane et.al. 2012)
4

THANK YOU.
18