adma digital marketing survey 2007
DESCRIPTION
Research conducted by the Asia Digital Marketing Association (ADMA) in conjunction with Digital Media, the HK4As, the IAA HK, the HKDMA and the HKIM, reveals that the use of digital marketing is on the rise in Asia Pacific.The results of the fourth annual industry survey conducted by the Asia Digital Marketing Association (ADMA), indicate that both large and small companies are increasing their investment in digital marketing. 39% of respondents said they will spend more than 15% of their marketing budget on digital marketing. This represents an increase of 16% over 2006. Over two thirds of those surveyed said that their online budgets have increased over last year.TRANSCRIPT

ADMA’s 4th Annual Digital Marketing
Survey for Asia Pacific
30 November 2007
Supporting Organisations
Powered by

BackgroundThis is the fourth year that ADMA is running this survey. The survey’s purpose is to establish the state of digital marketing in Asia Pacific.
Invitations were sent out via emails to a pre-qualified list of respondents who had opted-in to receive communications.
The sample size of the survey was 108 respondents and the surveywas conducted in September 2007.
Data contained in this presentation should be used as indicative as the sample is not weighted nor projected to a universe.

87%87%indicated that digital digital
marketingmarketing is part of their
marketing strategy (87% in 2006, 82% in 2005 , 77% in 2004)
87%
13%
Yes No
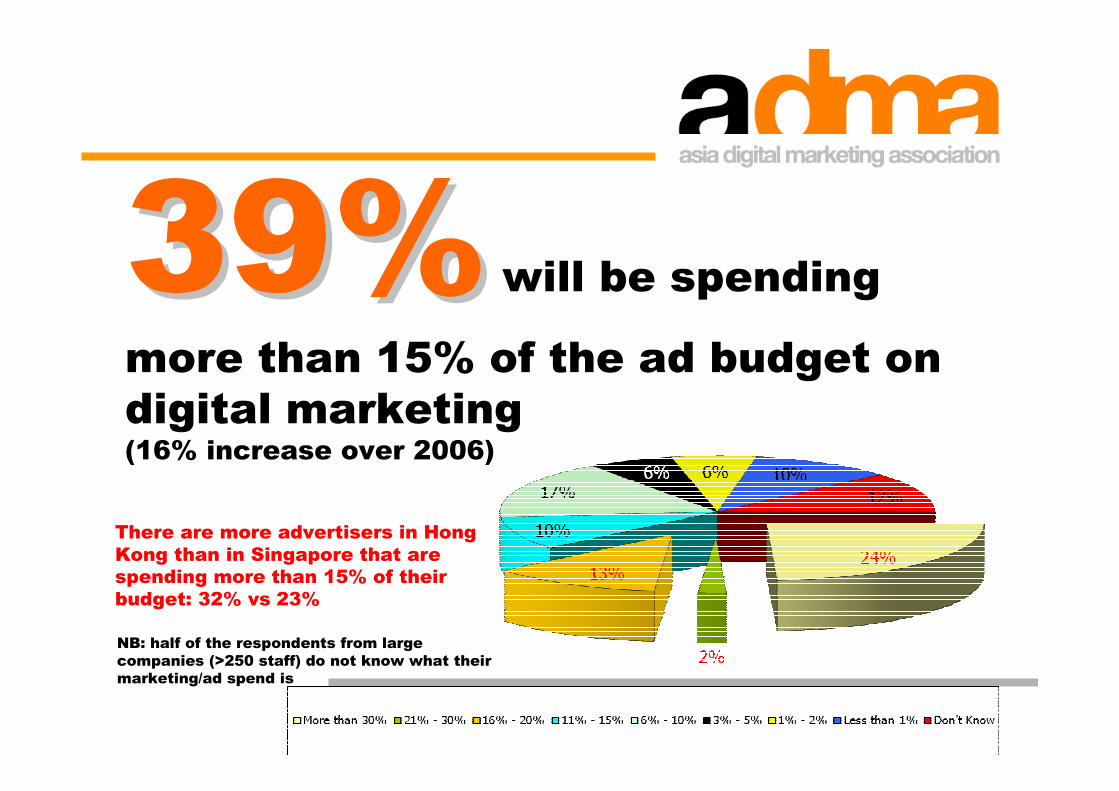
39%39% will be spending
more than 15% of the ad budget on
digital marketing(16% increase over 2006)
There are more advertisers in Hong
Kong than in Singapore that are
spending more than 15% of their
budget: 32% vs 23%
NB: half of the respondents from large
companies (>250 staff) do not know what their
marketing/ad spend is
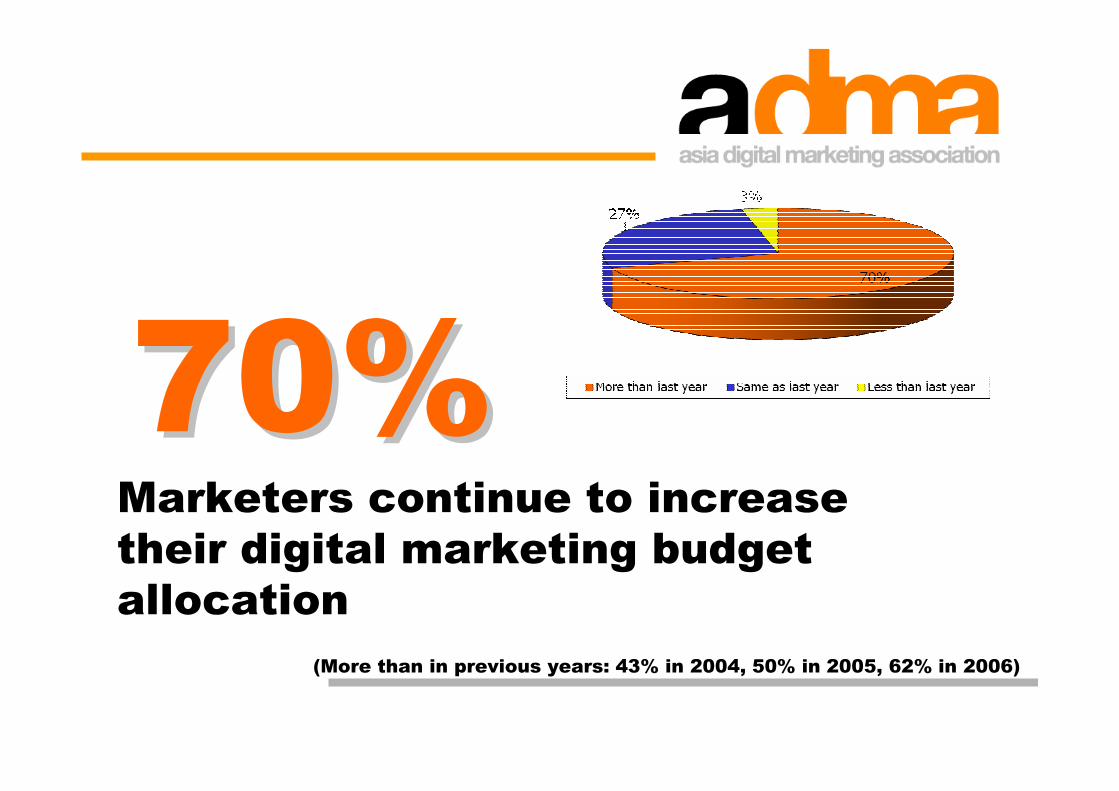
70%70%Marketers continue to increase
their digital marketing budget
allocation
(More than in previous years: 43% in 2004, 50% in 2005, 62% in 2006)
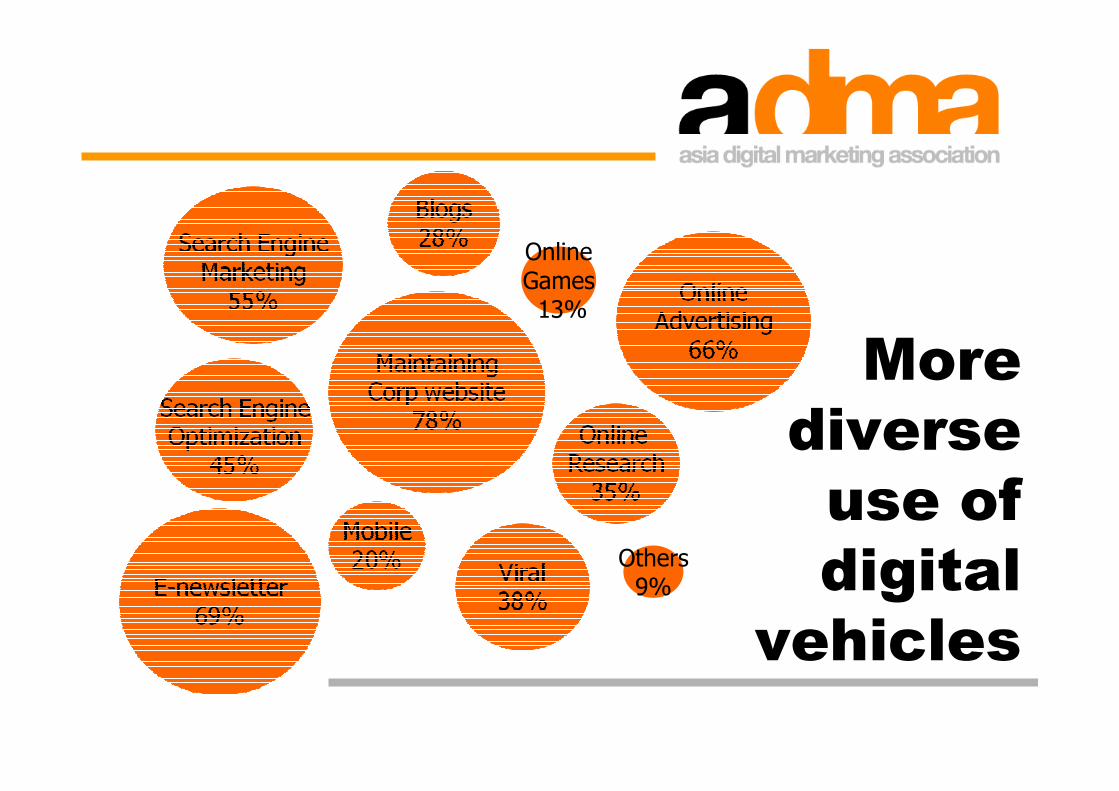
More
diverse
use of
digital
vehicles
Others9%
OnlineGames13%

Text alerts
still
predominant
for mobile
marketing
3G
Services
33%
3G
Services
33% Mobile
In-game
ad
28%
Mobile
In-game
ad
28%
SMS
(profile/
location
based)
78%
SMS
(profile/
location
based)
78%Bar code/
QR code
scanning
33%
Bar code/
QR code
scanning
33%
Request
Information
Via SMS
39%
Request
Information
Via SMS
39%
SMS
(mass)
83%
SMS
(mass)
83%
Base: Those that have deployed mobile marketing

Tailor-made
games preferred
Commissioned game
to be created
58%
Sponsored game
on portals/websites
42%
Licensed game
for website
25%
Licensed game
for mobile phones
17%
Base: Those that have deployed online games

72%72%have used rich media,
multimedia or streaming video
in their promotions and
communications

of Marketers have
NOT used video file
sharing sites to host
Company or Brand
videos
2233
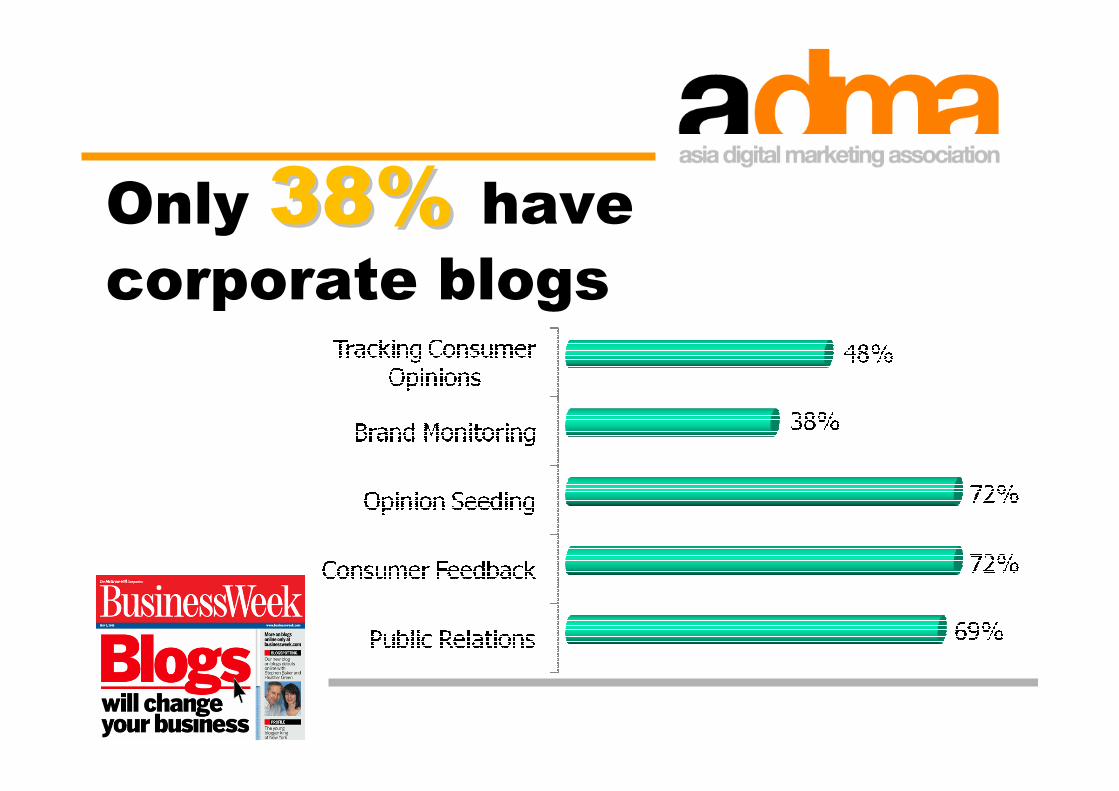
Only 38% 38% have corporate blogs

Respondent Profile - Position

Respondent Profile - Industry

Respondent Profile – Company Size
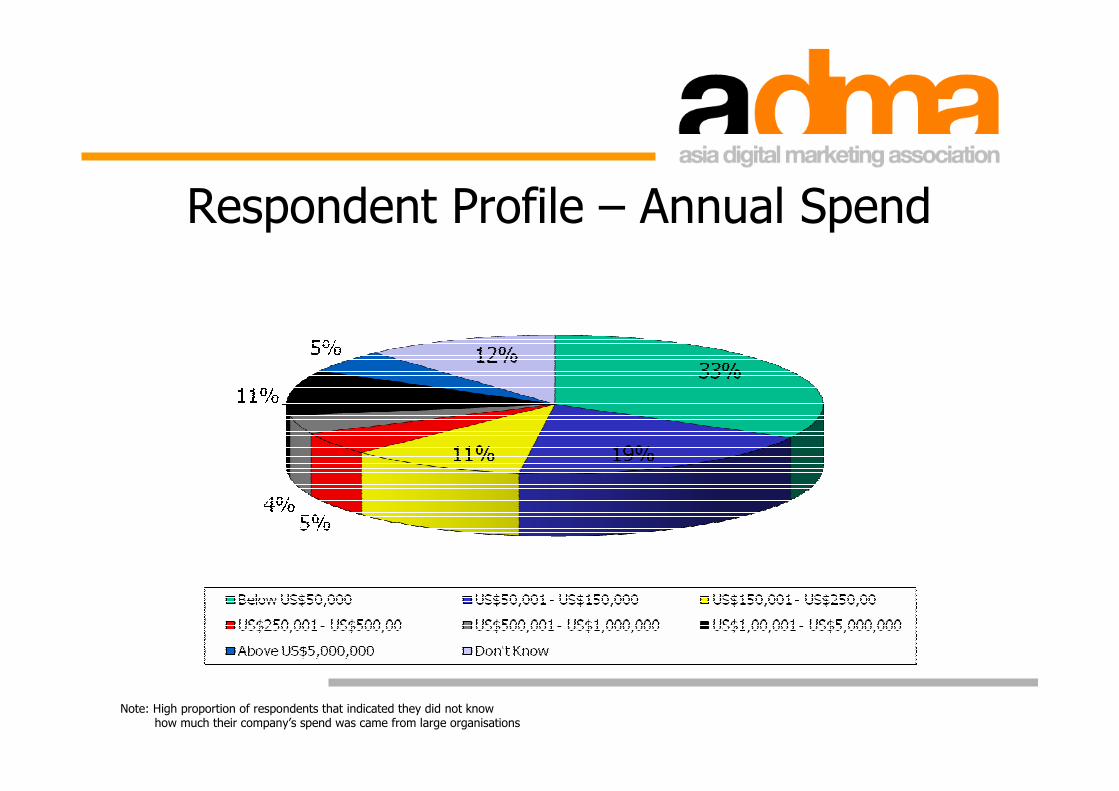
Respondent Profile – Annual Spend
Note: High proportion of respondents that indicated they did not knowhow much their company’s spend was came from large organisations

For more information, please contact:Kay Bayliss
t: +852 8100 9987 e: [email protected]
Douglas Khoot: +852 9096 0065