adhesive performance of acrylic pressure-sensitive
TRANSCRIPT

polymers
Article
Adhesive Performance of Acrylic Pressure-Sensitive Adhesivesfrom Different Preparation Processes
Irene Márquez 1,2 , Núria Paredes 1, Felipe Alarcia 2 and José Ignacio Velasco 2,*
�����������������
Citation: Márquez, I.; Paredes, N.;
Alarcia, F.; Velasco, J.I. Adhesive
Performance of Acrylic Pressure-
Sensitive Adhesives from Different
Preparation Processes. Polymers 2021,
13, 2627. https://doi.org/10.3390/
polym13162627
Academic Editor:
Mariaenrica Frigione
Received: 29 June 2021
Accepted: 4 August 2021
Published: 7 August 2021
Publisher’s Note: MDPI stays neutral
with regard to jurisdictional claims in
published maps and institutional affil-
iations.
Copyright: © 2021 by the authors.
Licensee MDPI, Basel, Switzerland.
This article is an open access article
distributed under the terms and
conditions of the Creative Commons
Attribution (CC BY) license (https://
creativecommons.org/licenses/by/
4.0/).
1 Applications Department, Lubrizol Advanced Materials, Camí de Can Calders, 13,08173 Sant Cugat del Vallès, Spain; [email protected] (I.M.); [email protected] (N.P.)
2 Poly2 Group, Department of Materials Science and Engineering, Universitat Politècnica de Catalunya (UPCBarcelonaTech), ESEIAAT, Carrer de Colom, 11, 08222 Terrassa, Spain; [email protected]
* Correspondence: [email protected]
Abstract: A series of pressure-sensitive adhesives (PSAs) was prepared using a constant monomericcomposition and different preparation processes to investigate the best combination to obtain thebest balance between peel resistance, tack, and shear resistance. The monomeric composition wasa 1:1 combination of two different water-based acrylic polymers—one with a high shear resistance(A) and the other with a high peel resistance and tack (B). Two different strategies were applied toprepare the adhesives: physical blending of polymers A and B and in situ emulsion polymerizationof A + B, either in one or two steps; in this last case, by polymerizing A or B first. To characterize thepolymer, the average particle size and viscosity were analyzed. The glass transition temperature (Tg)was determined by differential scanning calorimetry (DSC). The tetrahydrofuran (THF) insolublepolymer fraction was used to calculate the gel content, and the soluble part was used to determinethe average sol molecular weight by means of gel permeation chromatography (GPC). The adhesiveperformance was assessed by measuring tack as well as peel and shear resistance. The mechanicalproperties were obtained by calculating the shear modulus and determination of maximum stress andthe deformation energy. Moreover, an adhesive performance index (API) was designed to determinewhich samples are closest to the requirements demanded by the self-adhesive label market.
Keywords: acrylic pressure-sensitive adhesives; emulsion polymerization; glass bottle labels; post-polymerization blending
1. Introduction
Pressure-sensitive adhesives (PSAs) have been in wide use since the late 19th century.They have achieved their popularity because they can adhere strongly to a wide varietyof substrates at room temperature with the application of slight pressure for short time.Normally, the adhesives form the adhesion bond in liquid state and, by chemical reaction,a change in the temperature, UV irradiation, or another change, they pass to solid state,which is when they are tested. PSAs differ from others because they stick to a great varietyof surfaces without any chemical reaction, only with light pressure [1]. They are widelyused as, among others, surface protection films, a component of pressure-sensitive tapes,labels, notepads, skin-contact adhesive platform in medical plasters, and so on [2].
All commercial PSAs are based on polymers, mainly stemming from six families:rubbers (synthetics or naturals), polyesters, polyethers, silicones, polyurethanes, andacrylics. The remaining ones are based on esters of acrylic and substituted acrylic acids andpresent a great performance-cost and great relation qualities [3]. They are characterized byhaving high transparency; no color; low toxicity; high resistance to oxidation, UV, organicsolvents, temperature, and plasticizers; and very good peel adhesion on polar surfaces.
Although this type of PSA can be obtained by different polymerization processes,emulsion polymerization shows several advantages compared with bulk and solventpolymerization. In addition to offering environmental safety owing to the use of water
Polymers 2021, 13, 2627. https://doi.org/10.3390/polym13162627 https://www.mdpi.com/journal/polymers

Polymers 2021, 13, 2627 2 of 13
instead of organic solvents, the polymerization process takes places inside of the polymerparticles, allowing producing polymers with a high solid content, high polymerizationrates, and low viscosity [4].
In addition to tack, which represents the ability of the PSA to form bonds with asubstrate with a brief contact under slight pressure, they must have a certain peel andshear resistance. Peel resistance is defined as the force required to remove a tape from atest panel and shear resistance is defined as the capacity of the PSA tape to remain adheredunder constant load. Tack and peel resistance are associated with adhesion forces and shearresistance is associated with cohesion forces. Adhesion and cohesion forces are the forcesthat intervene in the bond. Adhesion is the attraction of two different substances resultingfrom intermolecular forces between the materials. However, cohesion involves only theintermolecular attractive forces within the adhesive.
The intermolecular forces acting in both adhesion and cohesion are primarily van derWaals forces. The balance between these ones determines the properties and quality of theadhesive bond [5,6]. Normally, increasing the properties’ associated with adhesion tendsto decrease cohesion as they are opposing forces. For this reason, it is not possible to obtainthe maximum value of both at the same time, but it is possible to reach a balance [7].
This balance between these properties is greatly affected by the process employed toobtain the polymer, regardless of whether it is the same formulation. Normally, this goalcan be achieved by modification of the chain transfer agent concentrations [8], modificationof reactor conditions [9], or polymerization using different catalysts [10]. An alternativeoption would be to mix two resins of different adhesive properties. Fonseca et al. [11]compared the final adhesive properties of in situ polymerized samples with those ofprepared by physical blend after their polymerization. The results showed that gel contentof in situ polymers was higher than that obtained by the blend of polymers and, in general,the adhesive properties were higher in the first case. Tobing et al. [12] studied the adhesiveperformance of high-gel containing latices and gel-free latex blended at various weightratios. The results showed that the shear resistance was higher in the emulsion blendthan in the individual latexes. Jovanovic et al. [13] compared the results between theconventional emulsion and the miniemulsion polymerization, where the last one showed ahigher control of the molecular weight distribution. In this case, a high tack, moderate peelresistance, and low shear adhesion were obtained. They suppose that the presence of longchains alone was not enough to improve the shear.
In the field of self-adhesive labels, PSAs have acquired great importance. Theirfeatures allow labels to be built and stored in reels, improving their labelling processes [1].As the years go by, label manufacturers claim better properties in the adhesives suppliedto them owing to the great competition in the market. According to the market, currently,PSAs designed for this type of application should present peel, tack, and shear values of10 N/25 mm, 10 N, and 24 h, respectively. However, it is very difficult to meet all threerequirements at the same time because, normally, when the adhesive properties (peel andtack) increase, the cohesive properties (shear) decrease, and vice versa.
The general aim of this work is to develop PSAs for glass bottle labels that meet therequirements currently demanded by the market. As mentioned, this is very complicated.In previous articles [14,15], an attempt has been made to arrive at this balance by modifyingthe composition of the polymer. However, the desired values have not been reached.For this reason, this study has attempted to reach this objective by modifying only theprocess for obtaining the polymer, keeping the monomeric composition constant. To findthis optimal balance in the adhesive properties, between tack, peel resistance, and shearresistance, the monomeric composition was a 1:1 combination of two different water-basedacrylic polymers, A and B. Polymer A was designed with a high content of acrylic acid(AA) in order to obtain high molecular weights that would favor the attainment of highvalues of shear resistance. Instead, polymer B was designed with a low AA content anda chain transfer agent (tert-dodecyl mercaptan) was added to the formulation in order toobtain low molecular weights that gave good peel resistance and tack results. Both A and

Polymers 2021, 13, 2627 3 of 13
B were copolymerized with butyl acrylate and acrylonitrile, as shown in Figure 1. Thistype of polymerization takes place in a random way [15].
Polymers 2021, 13, x FOR PEER REVIEW 3 of 13
resistance, the monomeric composition was a 1:1 combination of two different water-based acrylic polymers, A and B. Polymer A was designed with a high content of acrylic acid (AA) in order to obtain high molecular weights that would favor the attainment of high values of shear resistance. Instead, polymer B was designed with a low AA content and a chain transfer agent (tert-dodecyl mercaptan) was added to the formulation in order to obtain low molecular weights that gave good peel resistance and tack results. Both A and B were copolymerized with butyl acrylate and acrylonitrile, as shown in Figure 1. This type of polymerization takes place in a random way [15].
Four methods were carried out to obtain the polymers: by physical blend of polymers after their polymerization; by polymerization in situ in one; and by polymerization in situ in two steps, where in each step, one of these formulations (A or B) was synthetized and two different polymerization orders were tested, as shown in Figure 2.
(a)
OH
O
O
O N
acrylonitrileacrylic acid n-butyl acrylate2I HS C9H19
tert-dodecyl mercaptan
I
OHO
Hm
O On o
N
S
OHO
Hm
O On o
N
C9H19
2
+++++
(b)
Figure 1. Reaction scheme of (a) sample A and (b) sample B.
Figure 2. Scheme of the strategy used to obtain the samples. A and B are the base polymers designed to obtain high shear values and high peel and tack values, respectively. 1sp and 2sp are the number of steps, one and two, respectively.
To determine the differences between them, the typical physico-chemical and adhe-sive and mechanical properties were investigated. Moreover, an adhesive performance index (API) was designed to determine which samples are closest to the requirements demanded by the self-adhesive label market.
2. Materials and Methods Acrylic acid (AA) and n-butyl acrylate (n-BA) provided by BASF (Ludwigshafen,
Germany), as well as acrylonitrile (ACN) provided by IMCD Benelux B.V. (Amsterdam, The Netherlands), were used as comonomers in the polymerization. Tert-dodecyl-mer-captan (TDM) provided by Chevron Phillips Company LP (Tessenderlo, Belgium) was used as a chain transfer agent. The anionic polymerizable surfactant (S), MaxemulTM 6112,
OH
O
O
ON
acrylonitrileacrylic acid n-butyl acrylate
2 I I
OHO
Hm
O On o
N
2+ + +
A +
B
Post-polymerization blending b-AB
Polymerization in situOne step 1sp-AB
Two step1st A + 2nd B 2sp-AB
1st B + 2nd A 2sp-BA
△
△
Figure 1. Reaction scheme of (a) sample A and (b) sample B.
Four methods were carried out to obtain the polymers: by physical blend of polymersafter their polymerization; by polymerization in situ in one; and by polymerization in situin two steps, where in each step, one of these formulations (A or B) was synthetized andtwo different polymerization orders were tested, as shown in Figure 2.
Polymers 2021, 13, x FOR PEER REVIEW 3 of 13
resistance, the monomeric composition was a 1:1 combination of two different water-based acrylic polymers, A and B. Polymer A was designed with a high content of acrylic acid (AA) in order to obtain high molecular weights that would favor the attainment of high values of shear resistance. Instead, polymer B was designed with a low AA content and a chain transfer agent (tert-dodecyl mercaptan) was added to the formulation in order to obtain low molecular weights that gave good peel resistance and tack results. Both A and B were copolymerized with butyl acrylate and acrylonitrile, as shown in Figure 1. This type of polymerization takes place in a random way [15].
Four methods were carried out to obtain the polymers: by physical blend of polymers after their polymerization; by polymerization in situ in one; and by polymerization in situ in two steps, where in each step, one of these formulations (A or B) was synthetized and two different polymerization orders were tested, as shown in Figure 2.
(a)
OH
O
O
O N
acrylonitrileacrylic acid n-butyl acrylate2I HS C9H19
tert-dodecyl mercaptan
I
OHO
Hm
O On o
N
S
OHO
Hm
O On o
N
C9H19
2
+++++
(b)
Figure 1. Reaction scheme of (a) sample A and (b) sample B.
Figure 2. Scheme of the strategy used to obtain the samples. A and B are the base polymers designed to obtain high shear values and high peel and tack values, respectively. 1sp and 2sp are the number of steps, one and two, respectively.
To determine the differences between them, the typical physico-chemical and adhe-sive and mechanical properties were investigated. Moreover, an adhesive performance index (API) was designed to determine which samples are closest to the requirements demanded by the self-adhesive label market.
2. Materials and Methods Acrylic acid (AA) and n-butyl acrylate (n-BA) provided by BASF (Ludwigshafen,
Germany), as well as acrylonitrile (ACN) provided by IMCD Benelux B.V. (Amsterdam, The Netherlands), were used as comonomers in the polymerization. Tert-dodecyl-mer-captan (TDM) provided by Chevron Phillips Company LP (Tessenderlo, Belgium) was used as a chain transfer agent. The anionic polymerizable surfactant (S), MaxemulTM 6112,
OH
O
O
ON
acrylonitrileacrylic acid n-butyl acrylate
2 I I
OHO
Hm
O On o
N
2+ + +
A +
B
Post-polymerization blending b-AB
Polymerization in situOne step 1sp-AB
Two step1st A + 2nd B 2sp-AB
1st B + 2nd A 2sp-BA
△
△
Figure 2. Scheme of the strategy used to obtain the samples. A and B are the base polymers designedto obtain high shear values and high peel and tack values, respectively. 1sp and 2sp are the numberof steps, one and two, respectively.
To determine the differences between them, the typical physico-chemical and adhesiveand mechanical properties were investigated. Moreover, an adhesive performance index(API) was designed to determine which samples are closest to the requirements demandedby the self-adhesive label market.
2. Materials and Methods
Acrylic acid (AA) and n-butyl acrylate (n-BA) provided by BASF (Ludwigshafen,Germany), as well as acrylonitrile (ACN) provided by IMCD Benelux B.V. (Amsterdam, TheNetherlands), were used as comonomers in the polymerization. Tert-dodecyl-mercaptan(TDM) provided by Chevron Phillips Company LP (Tessenderlo, Belgium) was used as achain transfer agent. The anionic polymerizable surfactant (S), MaxemulTM 6112, basedin a modified alcohol ether phosphate, provided by Croda (Mill Hall, PA USA), wasalso used in the polymerization. Ammonium carbonate ((NH4)2CO3) provided by BASF(Ludwigshafen, Germany) was used as a buffer and ammonium peroxide sulphate (I)supplied by United Initiators (Pullach, Germany) was used as a thermal initiator.

Polymers 2021, 13, 2627 4 of 13
A combination of tert-butyl hydroperoxide (TBHP), provided by Pergan (Bocholt,Germany), and sodium formaldehyde sulfoxylate (Bruggolite® E01), from BrüggemannKG (Heilbronn, Germany), were used as a redox system to reduce free monomer at theend of the polymerization. A 25% ammonia solution, provided by Barcelonesa drugs andchemicals (Cornellà del Llobregat, Spain), was used to neutralize the adhesives. Tetrahydro-furan (THF) at 99%, provided by Merck (Hohenbrunn, Germany), was used as a solvent todetermine the gel content as it is the most suitable solvent to dissolve the acrylic polymersstudied here. Accordingly, it was also used as the mobile phase in the gel permeationchromatography (GPC) measurements.
For adhesion tests, a polyethylene terephthalate (PET) of 12 µm provided by Polinas(Manisa, Turkey) with corona treatment as a surface activation treatment [16] and Tintorettoqesso ultraWSTM paper provided by Arconvert (Sant Gregori, Spain) were used as tapes toperform the tests.
2.1. Sample Preparation
Samples were prepared by two different methods: by emulsion polymerization andby physical blend of polymers after their polymerization.
2.1.1. Emulsion Polymerization
Samples A, B, 1sp-AB, 2sp-AB, and 2sp-BA were prepared by emulsion polymerization.Here, 2 kg of each polymer was prepared at 55% of solid content, adjusting the quantityof water to keep this rate constant. The polymerizations were carried out by a semi-batchemulsion process in a 2.5 L glass reactor at 82 ◦C with mechanical stirring at 100 rpm. Theinitial charge in the reactor consisted of 0.3 parts of (NH4)2CO3 per 100 parts by weight ofmonomer (i.e., 0.3 phm), 0.1 phm of emulsifier, and half of the total water.
After heating and purging the reactor with N2, the thermal initiator was addedfollowed by the pre-emulsions composed by the emulsifier, monomeric system (Table 1),and the remaining water.
Table 1. Initiator (I), surfactant (S), chain transfer agent (TDM), and monomer composition (phm): acrylic acid (AA), n-butylacrylate (n-BA), and acrylonitrile (ACN).
SampleStep 1 Step 2
AA n-BA ACN TDM S I AA n-BA ACN TDM S I
A 3.00 91.0 6.0 0.0 1.2 0.5B 0.50 93.5 6.0 0.2 1.2 0.5
b-AB 1.75 92.3 6.0 0.1 1.2 0.51sp-AB 1.75 92.3 6.0 0.1 1.2 0.52sp-AB 1.50 45.5 3.0 0.0 0.6 0.25 0.25 46.8 3.0 0.1 0.6 0.252sp-BA 0.25 46.8 3.0 0.1 0.6 0.25 1.50 45.5 3.0 0.0 0.6 0.25
In the case of the polymerization in situ in one step (samples A, B, and 1sp-AB), afteradding the thermal initiator, the pre-emulsion was added at a constant rate over 3 h.
However, in the case of the polymerization in situ in two steps (samples 2sp-AB and2sp-BA), the formulation for each step was designed at 27% of solid content to finallyobtain a polymer at 55% solids. After adding the thermal initiator, the first pre-emulsion(Step 1) was added at a constant rate for 1.5 h. Then, the other thermal initiator was addedfollowed by the second pre-emulsion (Step 2).
Once the pre-emulsions feed was completed, to consume the residual monomer, twoshots of 1.0 phm of thermal initiator were added (each one was allowed to react for 1 h).Later, the reactor was cooled down to 57 ◦C and a redox couple of TBHP/Bruggolite® E01(0.2 phm/0.3 phm) was added to consume the residual monomer. Post-polymerizationwas allowed to take place over 4 h. Gas chromatography analysis indicated that the freemonomer concentration was lower than 750 ppm.

Polymers 2021, 13, 2627 5 of 13
2.1.2. Physical Blend of Polymers
Here, 2 kg of sample b-AB was prepared by mechanical mixing of A and B (1:1) at 55%of solid content in water. It was carried out in a 2.5 L glass reactor at 25 ◦C with stirring at100 rpm during 30 min.
2.2. Latex Characterization
After the emulsion polymerization, the latex obtained was cooled at room temperatureand then filtered through a 150 µm filter, and then analyzed to determine their physical-chemical characteristics. Prior to the characterization, all the synthetized adhesives werenormalized by adjusting the pH to 7.5 and the solid content to 50 wt. % by neutralizingwith ammonia solution (12.5%) and adding deionized water, as necessary.
The average particle size was measured by dynamic light scattering (DLS) with aZetasizer Nano Series instrument. Samples were prepared by diluting the polymer indeionized water and analyzed at 25 ◦C, using a detector with a 90◦ angle. The viscosity wasdetermined at 25 ◦C using a programmable Brookfield DV-II+ Pro rotational viscometerfor low viscosities.
The Tg was determined experimentally by differential scanning calorimetry (DSC)using the equipment DSC 1, STARe, calibrated with an indium and zinc standard. Samplesof about 20 mg were initially placed in crucibles and dried in an oven at 80 ◦C for 5 h toobtain dry test samples of about 10 mg. These samples were firstly heated at a rate of20 ◦C/min from 25 ◦C to 200 ◦C and cooled to −65 ◦C at 20 ◦C/min. After stabilization for15 min at −65 ◦C, the second heating was carried out at 20 ◦C/min up to 200 ◦C. The Tgvalue was obtained from the second heating curve.
The gel content was defined as the polymer fraction insoluble in THF at 70 ◦C. Toobtain this polymer fraction, it is necessary to form macromolecules with molecular weighthigher than 7 × 10⁶ g/mol, according to the literature [17]. It was determined after Soxhletextraction for 24 h. The studied samples are thermoplastic polymeric materials withpresence a gel fraction distributed in the form of small gel domains in the bulk. Accordingto the literature, these gel domains consist of cross-linked polymer and entangled highmolecular weight polymer chains [18].
This fraction was dried in an oven at 60 ◦C for 24 h to determine the gel content usingEquation (1), where W1 represents the initial weight of the filter, W2 is the weight of thefilter with the dry polymer, and W3 is the final dry weight of the filter after extraction [19].
Gel content (%) =W3 − W1
W2 − W1100 (1)
The average molecular weight of the soluble polymer fraction (Mw) obtained wasdetermined by GPC. The samples taken out from the Soxhlet were first dried and resolvedin THF to achieve a concentration of about 0.01 g/mL, and 10 µL was injected into the GPCinstrument. The device consisted of a Waters 2414 refractive index detector and a Waterse2695 Separation Module equipped with one lineal column of Agilent PL Gel Mixed-C of5 µm of 7.8 × 300 m, followed by a lineal column of Styragel HR5E of 5 µm of 7.8 × 300 mand one monopore column of Styragel HR 4 7.8 × 300 mm. Chromatograms were obtainedat 40 ◦C using a THF flow rate of 1 mL/min as the continuous step. The equipment wascalibrated using polystyrene standards (PSs) and, therefore, the average molecular weightreferred to PS.
2.3. Adhesion Tests
The adhesive properties were determined through peel as well as tack and shearresistance test. Using a motorized laboratory coater, RK K Control Coater provided byLumaquin S.A. (Montornès del Vallès, Spain), equipped with a bar of 50 µm, 50 g/m2 ofpolymer was applied onto the tapes, which were subsequently dried in the oven for 1 minat 100 ◦C, leaving a layer of polymer of approximately 25 g/m2. Standard sized tapes werecut for each type of test.

Polymers 2021, 13, 2627 6 of 13
The peel resistance, defined as the force required to remove a tape from a test panel,was evaluated by means of the 180◦ peel test after 24 h from the tape application. Paperand PET tapes of 275 × 25 mm2 were applied onto glass panels. A Zwick/Roell Z 2.5tensioner was used at a constant speed of 300 mm/min. The average force to remove thetape and the failure mode were recorded [20].
Tack is the capacity of the adhesive to form bonds with a substrate with a brief contactunder slight pressure. Tack was determined by the loop tack test with an AT1000 tensiletester equipment. A loop was formed with a paper/PET tape of 175 × 25 mm2 and heldwith the upper clamp. A controlled contact was made at a constant speed of 300 mm/minonto glass panels. The maximum force required to peel off the tape from the panel and thefailure mode were recorded [21,22].
The shear resistance is defined as the capacity of the PSA tape to remain adheredunder constant load applied parallel to the surface of the tape and substrate. This testinvolves applying a standard area of paper/PET tape of 25 × 25 mm2 on a panel of stainlesssteel to 2◦ from the vertical and holding 1 kg until failure. The average time the tapes taketo shear from the test panel was recorded [23].
Dynamic shear tests were performed at 5 mm/min with a Zwick/Roell Z 2.5 ma-chine on PET tapes adhered on untreated steel panels at 25 ◦C with a contact area of2.5 × 2.5 mm2. Twenty minutes before the test, the test sample was pressed by means of arubber roller with a mass of 2 kg four times, according the procedure [24]. The shear stressversus strain curves were recorded and the elastic modulus (G), the maximum stress (τm)values, and the deformation energy up to failure (U) were determined.
The shear modulus was determined as the initial slope of the curve with a linearcorrelation coefficient (r2) being higher than 0.999 in all cases. The shear strength wasdetermined as the maximum stress value in the test, and the deformation energy wascalculated as the area under the curve up to the maximum stress value.
3. Results and Discussion
The average particle size and viscosity of the aqueous polymer solution (50% solids)as well as the Tg, gel content, and average sol molecular weight (Mw) of the polymer aresummarized in Table 2.
Table 2. Physico-chemical properties.
Sample Particle Size (nm) Viscosity (cp) Tg (◦C) Gel Content (%) Mw (g/mol)
A 207 165 −30.8 72 476,516B 270 81 −34.1 0 231,126
b-AB 236 124 −31.8 46 446,2761sp-AB 234 75 −33.4 14 276,7672sp-AB 164 23 −32.8 54 993,1262sp-BA 172 49 −34.1 15 505,048
The average particle size of samples b-AB and 1sp-AB, physical blend of polymers,and polymerization in situ in one step, respectively, were very similar, an intermediatevalue between the mean particle size of samples A and B. The viscosity value for sampleb-AB was the mean value between A and B. Instead, sample F showed a viscosity similarto sample B. However, samples 2sp-AB and 2sp-BA obtained by polymerization in twosteps showed lower average particle size and viscosity than the other samples. This wasbecause new particles were formed in each step. The Tg results provided by DSC shown inTable 2 demonstrate that the differences found could not be considered significant becausethe composition was the same. However, if gel content versus Tg is represented (Figure 3),a trend can be seen.

Polymers 2021, 13, 2627 7 of 13
Polymers 2021, 13, x FOR PEER REVIEW 7 of 13
steps showed lower average particle size and viscosity than the other samples. This was because new particles were formed in each step. The Tg results provided by DSC shown in Table 2 demonstrate that the differences found could not be considered significant be-cause the composition was the same. However, if gel content versus Tg is represented (Figure 3), a trend can be seen.
Figure 3. Influence of the gel content on the Tg values.
Samples with a higher gel content displayed higher Tg values. This relationship is generally attributed to the effect of the polymer chain mobility. Those samples with more entanglements and crosslinked display less mobility, which was reflected in their Tg val-ues [25,26].
The average molecular weight determined by GPC only corresponds to the fraction of the polymer solubilized in THF. Therefore, the values obtained should just be consid-ered as the molecular weight of the polymer without the insoluble fraction in THF, that is, without the gel content, that cannot be analyzed by GPC. Samples A and 2sp-AB showed the highest gel content, 72% and 54%, respectively, and thus the highest molecu-lar weight. In these cases, the values obtained by GPC of the Mw were not so representa-tive, as the proportion of sample examined was very low.
The level of entanglement showed by the samples was due to the presence of carbox-ylic acid groups [27] and the reactions of backbiting and intermolecular chain transfer to polymer followed by termination by combination that take place during emulsion polymerization [28]. However, these effects were insignificant in sample B, owing to the presence of the chain transfer agent [29–32]. An amount of 0.2 phm of TDM was enough to avoid the gel content in this case. Samples 1sp-AB and 2sp-BA showed negligible values of gel content in comparation with samples A, b-AB, and 2sp-AB. Sample b-AB showed an intermediate value between samples A and B, as it was a mechanical mix between both. However, sample 2sp-AB showed a greater gel content than sample 2sp-BA. This could be because, in sample 2sp-BA, TDM was added in the first step. This meant that the TDM that did not react in the first step did so in the second, thus decreasing the gel formation in both steps. Instead, in sample 2sp-AB, it only intervened in the last step.
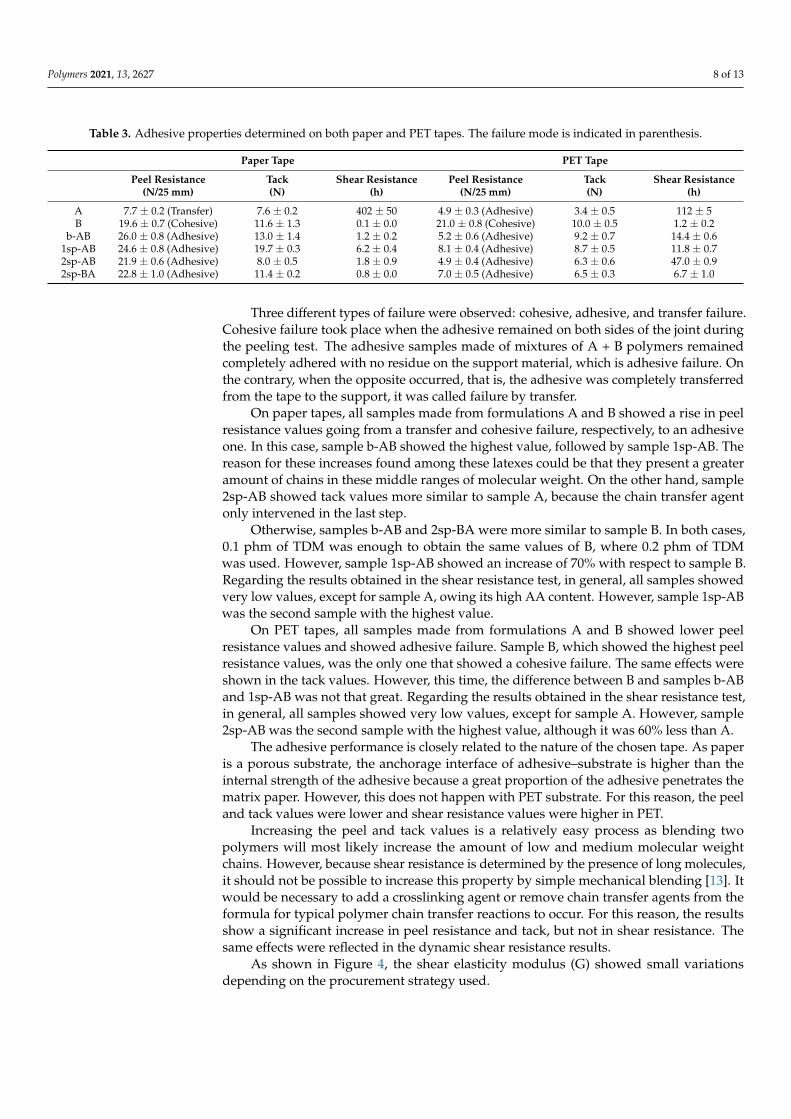
The adhesive properties (tack, peel resistance, and shear resistance) of polymers, tested on paper and PET tapes, were measured and summarized in Table 3.
−20
−25
−30
−35
−400 20 40 60 80
Tg (°
C)
Gel content (%)
Figure 3. Influence of the gel content on the Tg values.
Samples with a higher gel content displayed higher Tg values. This relationshipis generally attributed to the effect of the polymer chain mobility. Those samples withmore entanglements and crosslinked display less mobility, which was reflected in their Tgvalues [25,26].
The average molecular weight determined by GPC only corresponds to the fraction ofthe polymer solubilized in THF. Therefore, the values obtained should just be consideredas the molecular weight of the polymer without the insoluble fraction in THF, that is,without the gel content, that cannot be analyzed by GPC. Samples A and 2sp-AB showedthe highest gel content, 72% and 54%, respectively, and thus the highest molecular weight.In these cases, the values obtained by GPC of the Mw were not so representative, as theproportion of sample examined was very low.
The level of entanglement showed by the samples was due to the presence of car-boxylic acid groups [27] and the reactions of backbiting and intermolecular chain transferto polymer followed by termination by combination that take place during emulsionpolymerization [28]. However, these effects were insignificant in sample B, owing to thepresence of the chain transfer agent [29–32]. An amount of 0.2 phm of TDM was enough toavoid the gel content in this case. Samples 1sp-AB and 2sp-BA showed negligible values ofgel content in comparation with samples A, b-AB, and 2sp-AB. Sample b-AB showed anintermediate value between samples A and B, as it was a mechanical mix between both.However, sample 2sp-AB showed a greater gel content than sample 2sp-BA. This could bebecause, in sample 2sp-BA, TDM was added in the first step. This meant that the TDM thatdid not react in the first step did so in the second, thus decreasing the gel formation in bothsteps. Instead, in sample 2sp-AB, it only intervened in the last step.
The adhesive properties (tack, peel resistance, and shear resistance) of polymers, testedon paper and PET tapes, were measured and summarized in Table 3.
The polymer obtaining process gave rise to samples with differing gel contents, andthus with different molecular weight distributions. These distinctions in molecular weightwere responsible for the differences found in their adhesive properties.
Both tack and peel resistance increase with increasing molecular weight until a maxi-mum is achieved. Tack is influenced by the low-range molecular weight and peel resistanceis known to be influenced by the middle-range molecular weight. The maximum is ata fairly low molecular weight and the transition of the mode of failure from cohesive toadhesive in peel test takes place in this region. Beyond the maximum of the tack and peelresistance, when an increase in the molecular weight causes a decrease of these properties,shear resistance increases. This rise with the growth of molecular weight up to the pointwhere adhesion has decreased to such a low level that the adhesion failure takes placewhen a shear force is applied [7,32].
Polymers 2021, 13, 2627 8 of 13
Table 3. Adhesive properties determined on both paper and PET tapes. The failure mode is indicated in parenthesis.
Paper Tape PET Tape
Peel Resistance(N/25 mm)
Tack(N)
Shear Resistance(h)
Peel Resistance(N/25 mm)
Tack(N)
Shear Resistance(h)
A 7.7 ± 0.2 (Transfer) 7.6 ± 0.2 402 ± 50 4.9 ± 0.3 (Adhesive) 3.4 ± 0.5 112 ± 5B 19.6 ± 0.7 (Cohesive) 11.6 ± 1.3 0.1 ± 0.0 21.0 ± 0.8 (Cohesive) 10.0 ± 0.5 1.2 ± 0.2
b-AB 26.0 ± 0.8 (Adhesive) 13.0 ± 1.4 1.2 ± 0.2 5.2 ± 0.6 (Adhesive) 9.2 ± 0.7 14.4 ± 0.61sp-AB 24.6 ± 0.8 (Adhesive) 19.7 ± 0.3 6.2 ± 0.4 8.1 ± 0.4 (Adhesive) 8.7 ± 0.5 11.8 ± 0.72sp-AB 21.9 ± 0.6 (Adhesive) 8.0 ± 0.5 1.8 ± 0.9 4.9 ± 0.4 (Adhesive) 6.3 ± 0.6 47.0 ± 0.92sp-BA 22.8 ± 1.0 (Adhesive) 11.4 ± 0.2 0.8 ± 0.0 7.0 ± 0.5 (Adhesive) 6.5 ± 0.3 6.7 ± 1.0
Three different types of failure were observed: cohesive, adhesive, and transfer failure.Cohesive failure took place when the adhesive remained on both sides of the joint duringthe peeling test. The adhesive samples made of mixtures of A + B polymers remainedcompletely adhered with no residue on the support material, which is adhesive failure. Onthe contrary, when the opposite occurred, that is, the adhesive was completely transferredfrom the tape to the support, it was called failure by transfer.
On paper tapes, all samples made from formulations A and B showed a rise in peelresistance values going from a transfer and cohesive failure, respectively, to an adhesiveone. In this case, sample b-AB showed the highest value, followed by sample 1sp-AB. Thereason for these increases found among these latexes could be that they present a greateramount of chains in these middle ranges of molecular weight. On the other hand, sample2sp-AB showed tack values more similar to sample A, because the chain transfer agentonly intervened in the last step.
Otherwise, samples b-AB and 2sp-BA were more similar to sample B. In both cases,0.1 phm of TDM was enough to obtain the same values of B, where 0.2 phm of TDMwas used. However, sample 1sp-AB showed an increase of 70% with respect to sample B.Regarding the results obtained in the shear resistance test, in general, all samples showedvery low values, except for sample A, owing its high AA content. However, sample 1sp-ABwas the second sample with the highest value.
On PET tapes, all samples made from formulations A and B showed lower peelresistance values and showed adhesive failure. Sample B, which showed the highest peelresistance values, was the only one that showed a cohesive failure. The same effects wereshown in the tack values. However, this time, the difference between B and samples b-ABand 1sp-AB was not that great. Regarding the results obtained in the shear resistance test,in general, all samples showed very low values, except for sample A. However, sample2sp-AB was the second sample with the highest value, although it was 60% less than A.
The adhesive performance is closely related to the nature of the chosen tape. As paperis a porous substrate, the anchorage interface of adhesive–substrate is higher than theinternal strength of the adhesive because a great proportion of the adhesive penetrates thematrix paper. However, this does not happen with PET substrate. For this reason, the peeland tack values were lower and shear resistance values were higher in PET.
Increasing the peel and tack values is a relatively easy process as blending twopolymers will most likely increase the amount of low and medium molecular weightchains. However, because shear resistance is determined by the presence of long molecules,it should not be possible to increase this property by simple mechanical blending [13]. Itwould be necessary to add a crosslinking agent or remove chain transfer agents from theformula for typical polymer chain transfer reactions to occur. For this reason, the resultsshow a significant increase in peel resistance and tack, but not in shear resistance. Thesame effects were reflected in the dynamic shear resistance results.
As shown in Figure 4, the shear elasticity modulus (G) showed small variationsdepending on the procurement strategy used.

Polymers 2021, 13, 2627 9 of 13
Polymers 2021, 13, x FOR PEER REVIEW 9 of 13
matrix paper. However, this does not happen with PET substrate. For this reason, the peel and tack values were lower and shear resistance values were higher in PET.
Increasing the peel and tack values is a relatively easy process as blending two poly-mers will most likely increase the amount of low and medium molecular weight chains. However, because shear resistance is determined by the presence of long molecules, it should not be possible to increase this property by simple mechanical blending [13]. It would be necessary to add a crosslinking agent or remove chain transfer agents from the formula for typical polymer chain transfer reactions to occur. For this reason, the results show a significant increase in peel resistance and tack, but not in shear resistance. The same effects were reflected in the dynamic shear resistance results.
As shown in Figure 4, the shear elasticity modulus (G) showed small variations de-pending on the procurement strategy used.
Figure 4. Shear modulus values for each adhesive sample.
Samples B and 1sp-AB showed the lowest G owing to their low Mw. On the other hand, sample A and 2sp-AB showed the highest G values. This is because they were the samples with the highest gel content and, therefore, with the highest entanglement. This prevents the chains from having mobility, thus reducing the elasticity of the sample. In contrast, samples b-AB and 2sp-AB showed intermediate values of G.
The maximum shear stress recorded in the dynamic shear test (Figure 5) showed the same tendency as in G.
Figure 5. Maximum shear stress values for each adhesive sample.
Samples A and 2sp-AB showed the highest values. In contrast, sample B showed the lowest values owing to its greater elasticity. Samples b-AB, 1sp-AB, and 2sp-BA showed
0.0
1.0
2.0
3.0
4.0
5.0
6.0
A b-AB 1sp-AB 2sp-AB 2sp-BA B
Elas
tic m
odul
us, G
(kPa
)
0.00
0.05
0.10
0.15
0.20
0.25
0.30
A b-AB 1sp-AB 2sp-AB 2sp-BA B
Shea
r str
engt
h, τ
max
(MPa
)
Figure 4. Shear modulus values for each adhesive sample.
Samples B and 1sp-AB showed the lowest G owing to their low Mw. On the otherhand, sample A and 2sp-AB showed the highest G values. This is because they were thesamples with the highest gel content and, therefore, with the highest entanglement. Thisprevents the chains from having mobility, thus reducing the elasticity of the sample. Incontrast, samples b-AB and 2sp-AB showed intermediate values of G.
The maximum shear stress recorded in the dynamic shear test (Figure 5) showed thesame tendency as in G.
Polymers 2021, 13, x FOR PEER REVIEW 9 of 13
matrix paper. However, this does not happen with PET substrate. For this reason, the peel and tack values were lower and shear resistance values were higher in PET.
Increasing the peel and tack values is a relatively easy process as blending two poly-mers will most likely increase the amount of low and medium molecular weight chains. However, because shear resistance is determined by the presence of long molecules, it should not be possible to increase this property by simple mechanical blending [13]. It would be necessary to add a crosslinking agent or remove chain transfer agents from the formula for typical polymer chain transfer reactions to occur. For this reason, the results show a significant increase in peel resistance and tack, but not in shear resistance. The same effects were reflected in the dynamic shear resistance results.
As shown in Figure 4, the shear elasticity modulus (G) showed small variations de-pending on the procurement strategy used.
Figure 4. Shear modulus values for each adhesive sample.
Samples B and 1sp-AB showed the lowest G owing to their low Mw. On the other hand, sample A and 2sp-AB showed the highest G values. This is because they were the samples with the highest gel content and, therefore, with the highest entanglement. This prevents the chains from having mobility, thus reducing the elasticity of the sample. In contrast, samples b-AB and 2sp-AB showed intermediate values of G.
The maximum shear stress recorded in the dynamic shear test (Figure 5) showed the same tendency as in G.
Figure 5. Maximum shear stress values for each adhesive sample.
Samples A and 2sp-AB showed the highest values. In contrast, sample B showed the lowest values owing to its greater elasticity. Samples b-AB, 1sp-AB, and 2sp-BA showed
0.0
1.0
2.0
3.0
4.0
5.0
6.0
A b-AB 1sp-AB 2sp-AB 2sp-BA B
Elas
tic m
odul
us, G
(kPa
)
0.00
0.05
0.10
0.15
0.20
0.25
0.30
A b-AB 1sp-AB 2sp-AB 2sp-BA B
Shea
r str
engt
h, τ
max
(MPa
)
Figure 5. Maximum shear stress values for each adhesive sample.
Samples A and 2sp-AB showed the highest values. In contrast, sample B showed thelowest values owing to its greater elasticity. Samples b-AB, 1sp-AB, and 2sp-BA showedvalues more similar to A than B. This was because all samples generated gel content, exceptB, thus the molecular weight of the latter was much lower, giving rise to a more flexiblepolymer than the rest.
Finally, the toughness of the adhesives was determined as the deformation energy upto the adhesive failure in the dynamic shear test and was calculated from the area under theforce–displacement curve up to the maximum force value. As shown in Figure 6, sample Arequired more energy than the rest.
This sample was prepared with the highest AA content and the absence of TDM,which generated a high gel content in the final polymer. However, sample 2sp-AB showeda deformation energy three times lower than that in sample A. This was due to the effectof the chain transfer agent and the amount of acrylic acid, as previously commented. Incontrast, samples B and 1sp-AB showed the lowest values.

Polymers 2021, 13, 2627 10 of 13
Polymers 2021, 13, x FOR PEER REVIEW 10 of 13
values more similar to A than B. This was because all samples generated gel content, ex-cept B, thus the molecular weight of the latter was much lower, giving rise to a more flex-ible polymer than the rest.
Finally, the toughness of the adhesives was determined as the deformation energy up to the adhesive failure in the dynamic shear test and was calculated from the area un-der the force‒displacement curve up to the maximum force value. As shown in Figure 6, sample A required more energy than the rest.
Figure 6. Deformation energy until failure for each adhesive sample.
This sample was prepared with the highest AA content and the absence of TDM, which generated a high gel content in the final polymer. However, sample 2sp-AB showed a deformation energy three times lower than that in sample A. This was due to the effect of the chain transfer agent and the amount of acrylic acid, as previously commented. In contrast, samples B and 1sp-AB showed the lowest values.
To determine the samples that satisfy the currently requirement demanded by the market, an adhesive performance index (API) was defined, which takes into account the relative importance of the three adhesive properties in the performance of the adhesive. The polymer that shows a higher API value will be the one that is closest to the require-ments. To develop the API, it was considered that the values required of peel resistance (PRt), tack (Tt), and shear resistance (SRt) by the wine industries were 10 N/25 mm, 10 N, and 24 h, respectively. The API was obtained with the average value obtained of peel resistance (PR), tack (T), and shear resistance (SR) for each sample (s). As the differences in the shear resistance test were very large, the natural logarithm (ln) was applied to the values obtained. As a rule, the industry of labels generally gives much more importance to adhesive shear resistance than the other adhesive properties (i.e., tack and peel). In or-der to combine the relative importance of the three adhesive properties given by this in-dustry to the PSA for labels, the API can be determined by means of the following Equa-tion (2):
API = Cp ·PR𝑠𝑠 - PR𝑡𝑡
PR𝑡𝑡 + Ct ·
T𝑠𝑠 - T𝑡𝑡 T𝑡𝑡
+ Cs · ln(SRs) - ln(SR𝑡𝑡)
ln(SR𝑡𝑡) (2)
where Cp, Ct, and Cs are coefficients that quantify the relative importance of peel, tack, and shear resistance, respectively, in the adhesive performance. For application in labels for wine glass bottles, these coefficients are accepted to have values of 15%, 15%, and 70%, respectively.
As shown in Figure 7, according to the values assigned to determine the API, the samples that most closely approximated the wine cellars’ requirement in the case of paper substrate were samples A and 1sp-AB.
0
50
100
150
200
250
300
A b-AB 1sp-AB 2sp-AB 2sp-BA B
Def
orm
atio
n en
ergy
(Nm
m)
Figure 6. Deformation energy until failure for each adhesive sample.
To determine the samples that satisfy the currently requirement demanded by themarket, an adhesive performance index (API) was defined, which takes into account therelative importance of the three adhesive properties in the performance of the adhesive. Thepolymer that shows a higher API value will be the one that is closest to the requirements.To develop the API, it was considered that the values required of peel resistance (PRt), tack(Tt), and shear resistance (SRt) by the wine industries were 10 N/25 mm, 10 N, and 24 h,respectively. The API was obtained with the average value obtained of peel resistance(PR), tack (T), and shear resistance (SR) for each sample (s). As the differences in the shearresistance test were very large, the natural logarithm (ln) was applied to the values obtained.As a rule, the industry of labels generally gives much more importance to adhesive shearresistance than the other adhesive properties (i.e., tack and peel). In order to combine therelative importance of the three adhesive properties given by this industry to the PSA forlabels, the API can be determined by means of the following Equation (2):
API = Cp ·PRs − PRt
PRt+Ct · Ts − Tt
Tt+Cs · ln(SRs) − ln(SRt)
ln(SR t)(2)
where Cp, Ct, and Cs are coefficients that quantify the relative importance of peel, tack,and shear resistance, respectively, in the adhesive performance. For application in labelsfor wine glass bottles, these coefficients are accepted to have values of 15%, 15%, and 70%,respectively.
As shown in Figure 7, according to the values assigned to determine the API, thesamples that most closely approximated the wine cellars’ requirement in the case of papersubstrate were samples A and 1sp-AB.
Polymers 2021, 13, x FOR PEER REVIEW 11 of 13
Figure 7. Adhesive performance index of samples for paper substrate.
In the case of sample A, the shear values increased almost 17 times, but its peel and tack values were less than 10 N/25 mm and 10 N, respectively. On the other hand, sample 1sp-AB showed the opposite case. It showed an increase of 100% in both peel and tack from what was expected, but the shear values were four times lower. In both cases, the API result is highly influenced by the shear values.
On the other hand, in the case of PET substrate (Figure 8), the samples that most closely approximated the wine cellars’ requirement were samples A and 2sp-AB.
Figure 8. Performance index of samples for PET substrate.
In both cases, the performance index result was highly influenced by the shear val-ues, and their peel resistance and tack values were less than 10 N/25 mm and 10 N, re-spectively.
4. Conclusions To obtain the ideal balance between the three adhesive properties most demanded in
the field of PSA, different methods of obtaining the same formulation were tested. Two different polymers, one with a high shear resistance (A) and the other with a high peel resistance and tack (B), were used to design the base formulation. The designed formula-tion was a 1:1 combination of both polymers. The studied polymers were obtained by physical blend of polymers of both and by polymerization in situ in one and in two steps. Although it was the same formulation, great differences were found in terms of its final properties depending on the obtaining process. Regarding the physico-chemical proper-ties, physical blend of polymers and one step polymerization showed similar results. In contrast, the two-step polymerization resulted in lower particle sizes and viscosities. Sig-nificant differences were found in the results of gel content and Mw, highly influenced by
B2sp-BA
2sp-AB1sp-AB
b-ABA
−1.5 −1.0 −0.5 0.0 0.5 1.0 1.5
API
B2sp-BA
2sp-AB1sp-AB
b-ABA
−1.0 −0.8 −0.6 −0.4 −0.2 0.0 0.2 0.4 0.6 0.8 1.0
API
Figure 7. Adhesive performance index of samples for paper substrate.
In the case of sample A, the shear values increased almost 17 times, but its peel andtack values were less than 10 N/25 mm and 10 N, respectively. On the other hand, sample1sp-AB showed the opposite case. It showed an increase of 100% in both peel and tack

Polymers 2021, 13, 2627 11 of 13
from what was expected, but the shear values were four times lower. In both cases, the APIresult is highly influenced by the shear values.
On the other hand, in the case of PET substrate (Figure 8), the samples that mostclosely approximated the wine cellars’ requirement were samples A and 2sp-AB.
Polymers 2021, 13, x FOR PEER REVIEW 11 of 13
Figure 7. Adhesive performance index of samples for paper substrate.
In the case of sample A, the shear values increased almost 17 times, but its peel and tack values were less than 10 N/25 mm and 10 N, respectively. On the other hand, sample 1sp-AB showed the opposite case. It showed an increase of 100% in both peel and tack from what was expected, but the shear values were four times lower. In both cases, the API result is highly influenced by the shear values.
On the other hand, in the case of PET substrate (Figure 8), the samples that most closely approximated the wine cellars’ requirement were samples A and 2sp-AB.
Figure 8. Performance index of samples for PET substrate.
In both cases, the performance index result was highly influenced by the shear val-ues, and their peel resistance and tack values were less than 10 N/25 mm and 10 N, re-spectively.
4. Conclusions To obtain the ideal balance between the three adhesive properties most demanded in
the field of PSA, different methods of obtaining the same formulation were tested. Two different polymers, one with a high shear resistance (A) and the other with a high peel resistance and tack (B), were used to design the base formulation. The designed formula-tion was a 1:1 combination of both polymers. The studied polymers were obtained by physical blend of polymers of both and by polymerization in situ in one and in two steps. Although it was the same formulation, great differences were found in terms of its final properties depending on the obtaining process. Regarding the physico-chemical proper-ties, physical blend of polymers and one step polymerization showed similar results. In contrast, the two-step polymerization resulted in lower particle sizes and viscosities. Sig-nificant differences were found in the results of gel content and Mw, highly influenced by
B2sp-BA
2sp-AB1sp-AB
b-ABA
−1.5 −1.0 −0.5 0.0 0.5 1.0 1.5
API
B2sp-BA
2sp-AB1sp-AB
b-ABA
−1.0 −0.8 −0.6 −0.4 −0.2 0.0 0.2 0.4 0.6 0.8 1.0
API
Figure 8. Performance index of samples for PET substrate.
In both cases, the performance index result was highly influenced by the shear values,and their peel resistance and tack values were less than 10 N/25 mm and 10 N, respectively.
4. Conclusions
To obtain the ideal balance between the three adhesive properties most demandedin the field of PSA, different methods of obtaining the same formulation were tested.Two different polymers, one with a high shear resistance (A) and the other with a highpeel resistance and tack (B), were used to design the base formulation. The designedformulation was a 1:1 combination of both polymers. The studied polymers were obtainedby physical blend of polymers of both and by polymerization in situ in one and in twosteps. Although it was the same formulation, great differences were found in terms ofits final properties depending on the obtaining process. Regarding the physico-chemicalproperties, physical blend of polymers and one step polymerization showed similar results.In contrast, the two-step polymerization resulted in lower particle sizes and viscosities.Significant differences were found in the results of gel content and Mw, highly influencedby the presence of TDM and the amount of AA. The samples with a lower gel contentdisplayed lower Tg values. In the case of paper substrate, all samples designed from Aand B displayed increased peel values. Sample b-AB was the one with the highest value,followed by sample 1sp-AB, which also showed the highest tack values exceeding 70% ofsample B. Regarding the shear values, none approached the values of sample A; however,sample 1sp-AB was the most effective of the designed samples. On the other hand, in thecase of PET substrate, all samples designed from A and B showed peel and tack valueslower than B and shear values lower than A. The dynamic shear test showed that thehighest values of G, maximum shear stress, and deformation energy until failure wereobtained with samples A and 2sp-AB owing to their high gel content.
From the results obtained, an API was carried out to evaluate if the samples gatheredthrough the different processes were capable of meeting the wine cellar requirements. Inpaper substrate, samples A and 1sp-AB were the closest to the objective. However, forPET substrate, samples A and 2sp-AB were the closest. For both substrates, sample A wasone of those selected owing to its high shear values, but showed slightly lower peel andtack values. In the case of the paper substrate, sample 1sp-AB exceeded more than 100%in terms of peel and tack values. However, its shear values were four times lower thanrequired. On the other hand, in the case of the PET substrate, 2sp-AB showed slightlylower peel and tack values and double the required shear value.
Author Contributions: Conceptualization, N.P., F.A. and J.I.V.; Data curation, I.M.; Funding acqui-sition, F.A. and J.I.V.; Investigation, I.M.; Methodology, J.I.V., N.P. and I.M.; Project administration,

Polymers 2021, 13, 2627 12 of 13
J.I.V.; Resources, N.P.; Supervision, N.P., F.A. and J.I.V.; Writing—original draft, I.M.; Writing—review& editing, N.P., F.A. and J.I.V. All authors have read and agreed to the published version of themanuscript.
Funding: This research was funded by AGAUR Doctorats Industrials, grant number 2017-DI-062.
Institutional Review Board Statement: Not applicable.
Informed Consent Statement: Not applicable.
Data Availability Statement: Not applicable.
Conflicts of Interest: The authors declare no conflict of interest.
References1. Creton, C. Pressure-sensitive adhesives: An introductory course. MRS Bull. 2003, 28, 434–439. [CrossRef]2. Platt, D. The Future of Labels and Release Liners to 2023; Smithers Pira: Leatherhead, UK, 2018.3. Penzel, E.; Ballard, N.; Asua, J.M. Polyacrylates. In Ullmann’s Encyclopedia of Industrial Chemistry; Wiley Online Library: Hoboken,
NJ, USA, 2018; pp. 7–9.4. Lovell, P.A.; Schork, F.J. Fundamentals of Emulsion Polymerization. Biomacromolecules 2020, 21, 4396–4441. [CrossRef] [PubMed]5. Petrie, E. An introduction to adhesive and sealants. In Handbook of Adhesives and Sealants; McGraw-Hill Handbooks: New York,
USA, 2004; pp. 1–48.6. Lay, D.G.; Cranley, P. Polyurethane Adhesives. In Handbook of Adhesion Technology; Pizzi, A., Mittal, K.L., Eds.; Taylor & Francis
Group: New York, NY, USA, 2003; pp. 688–711. ISBN 0824709861.7. Auchter, G.; Aydin, O.; Zettl, A. Acrylic adhesives. In Handbook of Pressure Sensitive Adhesive Technology; Satas, D., Ed.; Van
Nostrand Reinhold: New York, NY, USA, 1989; pp. 445–514. ISBN 978-1-4757-0868-4.8. Sayer, C.; Arzamendi, G.; Asua, J.M.; Lima, E.L.; Pinto, J.C. Dynamic optimization of semicontinuous emulsion copolymerization
reactions: Composition and molecular weight distribution. Comput. Aided Chem. Eng. 2000, 8, 457–462.9. Sayer, C.; Lima, E.L.; Pinto, J.C.; Arzamendi, G.; Asua, J.M. Molecular weight distribution in composition controlled emulsion
copolymerization. J. Polym. Sci. Part A Polym. Chem. 2000, 38, 1100. [CrossRef]10. Soares, J.B.P.; Kim, J.D. Copolymerization of ethylene and α-olefins with combined metallocene catalysts. I. A formal criterion for
molecular weight bimodality. J. Polym. Sci. Part A Polym. Chem. 2000, 38, 1408–1416. [CrossRef]11. Fonseca, G.E.; McKenna, T.F.L.; Dubé, M.A. Effect of bimodality on the adhesive properties of pressure sensitive adhesives: Role
of bimodal particle size and molecular weight distributions. Ind. Eng. Chem. Res. 2010, 49, 7303–7312. [CrossRef]12. Tobing, S.; Klein, A.; Sperling, L.H.; Petrasko, B. Effect of network morphology on adhesive performance in emulsion blends of
acrylic pressure sensitive adhesives. J. Appl. Polym. Sci. 2001, 81, 2109–2117. [CrossRef]13. Jovanovic, R.; Ouzineb, K.; McKenna, T.F.; Dubé, M.A. Butyl acrylate/methyl methacrylate latexes: Adhesive properties.
Macromol. Symp. 2004, 206, 43–56. [CrossRef]14. Márquez, I.; Alarcia, F.; Velasco, J.I. Synthesis and Properties of Water-Based Acrylic Adhesives with a Variable Ratio of
2-Ethylhexyl Acrylate and n-Butyl Acrylate for Application in Glass Bottle Labels. Polymers 2020, 12, 428. [CrossRef] [PubMed]15. Márquez, I.; Paredes, N.; Alarcia, F.; Velasco, J.I. Influence of acrylic acid and tert-dodecyl mercaptan in the adhesive performance
of water-based acrylic pressure-sensitive adhesives. Polymers 2020, 12, 2879. [CrossRef] [PubMed]16. Kulkarni, S. Chapter 3-Plasma Assisted Polymer Synthesis and Processing. In Non-Thermal Plasma Technology for Polymeric
Materials; Thomas, S., Mozetic, M., Cvelbar, U., Špatenka, P., Praveen, K.M., Eds.; Elsevier: Amsterdam, The Netherlands, 2019;pp. 67–93. ISBN 978-0-12-813152-7.
17. Plessis, C.; Arzamendi, G.; Leiza, J.R.; Schoonbrood, H.A.S.; Charmot, D.; Asua, J.M. Decrease in effective acrylate propagationrate constants caused by intramolecular chain transfer. Macromolecules 2000, 33, 4–7. [CrossRef]
18. González, I.; Leiza, R.; Asua, M. Exploring the Limits of Branching and Gel Content in the Emulsion Polymerization of n-BA.Macromolecules 2006, 39, 5015–5020. [CrossRef]
19. Alarcia, F.; de la Cal, J.C.; Asua, J.M. Continuous production of specialty waterborne adhesives: Tuning the adhesive performance.Chem. Eng. J. 2006, 122, 117–126. [CrossRef]
20. ASTM. Standard Test Method for Peel Adhesion of Pressure-Sensitive Tape. In Annual Book of ASTM Standards; ASTM: WestConshohocken, PA, USA, 2003; Volume 4, pp. 1–6.
21. FINAT Technical Committee. FINAT Test Method no. 9 ‘Loop’ tack measurement. In FINAT Technical Handbook; FINAT: TheHague, The Netherlands, 2001; Volume 7, pp. 22–24.
22. PSCT. PSTC-16 Loop Tack Measurements. In Test Methods for Pressure Sensitive Adhesive Tapes; PSTC: Oakbrook Terrace, IL, USA,2007; pp. 1–8.
23. FINAT Technical Committee. FINAT Test method no. 8 Resistance to shear from a standard surface. In FINAT Technical Handbook;FINAT: The Hague, The Netherlands, 2001; Volume 7, pp. 20–21.
24. FINAT Technical Committee. FINAT Test Method no. 18 Dynamic Shear. In FINAT Technical Handbook; FINAT: The Hague, TheNetherlands, 2001; Volume 11, pp. 42–44.

Polymers 2021, 13, 2627 13 of 13
25. Fox, T.G.; Flory, P.J. Second-order transition temperatures and related properties of polystyrene. I. Influence of molecular weight.J. Appl. Phys. 1950, 21, 581–591. [CrossRef]
26. Brady, J.; Drig, T.; Lee, P.I.; Li, J.X. Polymer properties and characterization. In Developing Solid Oral Dosage Forms: PharmaceuticalTheory and Practice, 2nd ed.; Elsevier Inc.: Amsterdam, The Netherlands, 2017; pp. 181–223. ISBN 9780128024478.
27. Cohen-Addad, J.P.; Bogonuk, C. Gel-like Behavior of pH Dependent Latex Films. Macromolecules 1994, 27, 5032–5036. [CrossRef]28. Treviño, M.E.; Dubé, M.A. Synthesis of Self-Crosslinkable Water-Borne Pressure Sensitive Adhesives. Macromol. React. Eng. 2013,
7, 484–492. [CrossRef]29. Fang, C.; Liu, Z.; Zhu, X.; Cao, Y.; Dong, X. Manipulation of chain transfer agent and cross-linker concentration to modify the
performance of fluorinated acrylate latex pressure sensitive adhesive. J. Adhes. Sci. Technol. 2020, 34, 976–994. [CrossRef]30. Çetinkaya, O.; Demirci, G.; Mergo, P. Effect of the different chain transfer agents on molecular weight and optical properties of
poly(methyl methacrylate). Opt. Mater. 2017, 70, 25–30. [CrossRef]31. Ballard, N.; De La Cal, J.C.; Asua, J.M. The role of chain transfer agent in reducing branching content in radical polymerization of
Acrylates. Macromolecules 2015, 48, 987–993. [CrossRef]32. Satas, D. Tailoring pressure-sensitive adhesive polymers. Adhes 1972, 15, 19.