adequacy and sustainability of pensions · page 2 | average incomes of people below pensionable...
TRANSCRIPT

Page 1 |
1. INTRODUCTION
Pensions – mostly from pay-as-you-go public schemes – are the main source of income of older people in Europe. Retired people drawing a pension are a significant and – due to demographic ageing – a growing part of the European Union (EU) population (about 124 million or a quarter of the total1).
European pension systems are facing the dual challenge of remaining financially sustainable and being able to provide Europeans with an adequate income in retirement. The key purpose of pension systems is to protect older people from poverty and to allow them to enjoy decent living standards and economic independence when ageing. Financial sustainability of pension schemes is the indispensable means to this end. Pensions affect public budgets and labour supply in major ways and these impacts must be considered in pension policy.
The main goals of pension and retirement policies are to (i) to provide adequate income in old age while ensuring (ii) financial sustainability and (iii) maximising employment (i.e. through incentives in support of stable formal work careers and longer working lives for women and men).
1 2013, source: European Commission (DG ECFIN) and Economic Policy Committee (AWG). The 2015 Ageing Report: Economic and budgetary projections for the 28 EU Member States (2013-2060). European Economy 3/2015.
2. POLICY CHALLENGES: AN OVERVIEW OF PERFORMANCE IN EU COUNTRIES
The intensification of population ageing over the next 3-5 decades will increase the challenge of meeting these three objectives in major ways. The transition from large to smaller working-age cohorts resulting from low fertility rates and rising longevity will require adjustments to retirement practices and pension arrangements in all Member States. As the first baby-boomer cohorts are now reaching retirement age, the impact on the adequacy and sustainability of pension systems is no longer far-off. The population aged 60+ is currently growing by around two million each year, almost twice the increase observed in the late 1990s and early 2000s2. At the same time, the number of people of prime working age (20-59) will fall every year over the coming decades as the baby-boomers are replaced by much smaller cohorts. In the longer perspective, remaining life expectancy at age 65 in the EU-28 is expected to increase by around four years from 18.2/21.6 (men/women) years in 2014 to 22.4/25.6 years in 2060 (estimates for 2060 derived from the 2015 Ageing Report3, see Figure A1 in Annex).
2.1. The adequacy challenge
The adequacy of pensions is measured by their ability to prevent poverty, the degree to which they replace income before retirement and how they compare to the
2 ibid. 3 ibid.
EUROPEAN SEMESTER THEMATIC FACTSHEET
ADEQUACY AND SUSTAINABILITY OF PENSIONS

Page 2 |
average incomes of people below pensionable age. Pension adequacy has important gender dimensions as in all Member States, on average, women are more exposed to poverty and have lower pensions than men.
Figure 1 illustrates a key part of the pension adequacy challenge for Member States by showing their position compared to the EU-28 average for the rate of people aged 65+ at-risk-of-poverty or social exclusion. Countries above the average are listed (in red) to the right and countries below the average (in blue) to the left of the vertical line indicating the EU-28 average (EU-28=0).
Figure 1 – Percentage of population aged 65 and above at-risk-of-poverty or social exclusion, 2015
Source: Eurostat, EU-SILC. Data extraction date: 3 November 2016, *-2014. Notes: data standardised (EU-28=0), red (on the right) – above the EU-28 average, blue (on the left) – below the EU-28 average.
As for the ability of pensions to replace income from work before retirement the net pension income that is obtainable in different Member States after a 40 year career at average earnings up to the standard pensionable age ranges from 50 to 114 percent of average earnings4 (in 2013). Replacement rates tend to be overall higher for those with a low earnings profile and relatively lower for workers with high earnings, reflecting the redistributive character of most public pension systems.
In 2015, 14.1% of those aged 65 and over were at risk of poverty (i.e. disposing of less than 60% of the median income in a given country), compared to 18.1% for the rest of the population. But differences in poverty rates across countries are large, ranging from 4.56% in Hungary to 35.8% in Estonia (Figure A3). On average in the EU-28, the poverty gap for people aged 65 or more stood at 16.5% in 2015 (see Figure A4), indicating that the median income of the elderly poor was equal to 83.5 percent of the respective national poverty line.
Across the Union most pensioners have been less affected by the crisis than younger age groups largely maintained their relative standard of living over the crisis. While the risk of poverty increased for those below 65 since the onset of the crisis, from around 16% in 2008 to 18.1% in 2015, during the same period the rate went down for those over 65, from 17.8% in 2008 to 14.1% in 2015 – a development that has benefited both men and women and older as well as younger retirees. Still, old-age poverty continues to be a problem in some countries, particularly for women.
In many countries the retirement income that in the future is available to a person with low earnings and a short working career will remain below the poverty threshold despite minimum income
4 European Commission (DG EMPL) and Social Protection Committee (SPC). The 2015 Pension Adequacy Report: current and future income adequacy in old age in the EU. Volume I. European Commission. Luxembourg: Publishing Office of the European Union.
Page 3 |
provisions. In a number of Member States, the minimum income provision amount guaranteed does not even reach half of the at-risk-of-poverty threshold. Only in a few countries will minimum income provisions lift older people without any other resources out of poverty.
While pensions are the main source of income for older Europeans, living standards in old age also depend on other factors, such as home ownership and financial wealth, access to other benefits (such as housing or heating allowances) and services, and employment opportunities. It is also important to assess whether the pension income of retirees allow them as they age to adequately meet their needs in general and increasing needs for health care, social services and long-term care.
2.1.1. Less well-protected groups among present pensioners
Everywhere in the EU, women have lower pensions than men, on average 40% less. Across Member States, this gender pension gap5 for the 65-79 year olds (taking into account only those who do receive pension income) in 2014 ranged from a low 3.7% in Estonia to a high 48.8% in Cyprus (Figure A7). Moreover, more than a third of all older women have no pension in some Member States. Primarily, these gaps are the consequences of gender differences in pension entitlements based on income from formal employment (i.e. women having had lower pay, more part-time and shorter working careers than men)6. But pension system design also matters. A lower gender pension gap may result over the long term from more equal opportunities in employment for women and men, but pension system features such as care crediting and survivors' benefits will continue to play an important role in reducing the gap.
5 The percentage by which women’s average pension is lower than men’s. 6 For more information see European Semester thematic factsheet on labour market participation of women.
Women's longer life expectancy means that their pensions are more affected by the long-term consequences of the incomplete indexing of pension to wages in most Member States. Women are also more exposed to poverty in old age (16% in 2015) than men (11.8%) because they tend to outlive their partners, become widowed and end up living in single person households (Figure A3; also see Figures A5-A6). Survivors' pensions can provide an effective protection against the risk of economic hardship caused by the partner's death.
Older people are in a better position than the working age population in terms of home ownership and financial wealth. Yet, within the older population there are significant gender differences in home ownership and in exposure to severe housing deprivation in many Member States. Women aged 65 and over tend to have considerably less housing and financial wealth than men. Situation also varies considerably across the EU. Over three-quarters of the EU-28 population aged 65 and over live in owner-occupied dwellings, with national rates ranging from a little over a half (the Netherlands, Austria, Cyprus) to nearly 100 percent (Romania, Lithuania, Slovakia, Croatia). However, in some countries (Greece, Bulgaria), a substantial share of older people spent more than 40 percent of their equivalised disposable income on housing, which is recognised as being the threshold at which households are considered to be overburdened with housing costs.
2.1.2. Income replacement: future adequacy
While recent public pension reforms have tended to improve or maintain the poverty protection function, most reforms will result in lower replacement rates (pensions relative to previous earnings) in the future. Theoretical Replacement Rates (TRRs) are expected to range from around 40.1% to around 92.5% in 2053 (Table 2 in Annex).

Page 4 |
Figure 2 – Percentage points difference between 2013 and 2053 in gross TRRs, by type of pension, average wage earner
Source: Commission services, SPC. The 2015 Pension Adequacy Report. Notes: Data source: Member States and the OECD. A positive difference indicates a higher gross TRR in 2053 as compared to 2013. 2013 data for Greece not available. Sorted by total change in gross TRR for an average earner (40 year career up to SPA). If gender differences exist, results for men are reported.
Figure 2 illustrates the projected change in gross replacement rates between 2013 and 2053 for a 40-year career at average earnings until the country-specific pensionable age.7
Figure 2 also reports the expected change in the different pillars of the pension system. Overall, there is no clear EU-wide trend: the expected change in gross theoretical replacement rate between 2013 and 2053 ranges from -30 to +12 percentage points for this basic career scenario (light blue horizontal lines). Importantly, however, the decomposition of the change in gross TRRs into its components reveals a general decline in pension entitlements from public pension schemes (dark-blue bars). For an average wage earner, replacement rates of public pay-as-you-go schemes are projected to decrease by more than five percentage points in 16 Member States and by more than 15 percentage points in six Member
7 This is an agreed measure of pension adequacy indicating pension as percentage of work income in the last year before retirement for a worker with a specific work career. In this specific case, it refers to an uninterrupted career at average earnings from the age of 25 until the country-specific standard pensionable age – SPA.
States. This gap is expected to be, at least partly, compensated by rising entitlements from funded schemes in 16 Member States. Pension entitlements will be increasingly derived from funded schemes, with pension adequacy becoming more dependent on financial markets.
Trends in the future pension adequacy can also be assessed with indicators derived from expenditure projections. Unlike the TRRs, the benefit ratio8 and gross average replacement rate9 reflect the overall pension expenditure (Table 2, column 2 and 3). In general, the projections for the benefit ratio and gross average replacement rate over the 2013-2060 time horizons confirm the trend of declining future replacement rates of public pensions.
8 The benefit ratio is the average benefit of public pension or public and private pensions, respectively, as a share of the economy-wide average wage (gross wages and salaries in relation to employees) (Commission services, EPC). 9 The ‘Gross Average Replacement Rate’ is calculated as the average first pension as a share of the average wage at retirement, as provided by the Member States as part of the 2015 – Ageing Working Group projection exercises (Commission services, EPC).
Page 5 |
2.2. The employment challenge
A standard indicator for the employment challenge linked to pensions is the employment rate of older workers aged 55-64. A growing employment rate for this age range would allow people to better provide for themselves until they reach the pensionable age. It would also contribute to reaching the overall Europe 2020 employment target of 75% for people aged 20-64.
Employment rates for older workers are influenced by a number of factors on the demand and supply side and in tax benefit structures.
But the underpinning of pension systems in terms of a good balance between contributory years and retirement years, or between contributors and beneficiaries, is not just affected by the employment rate at the end of working life. Entry ages and the stability of employment over the working life are also key factors. A new indicator of wider relevance is the average duration of working life.
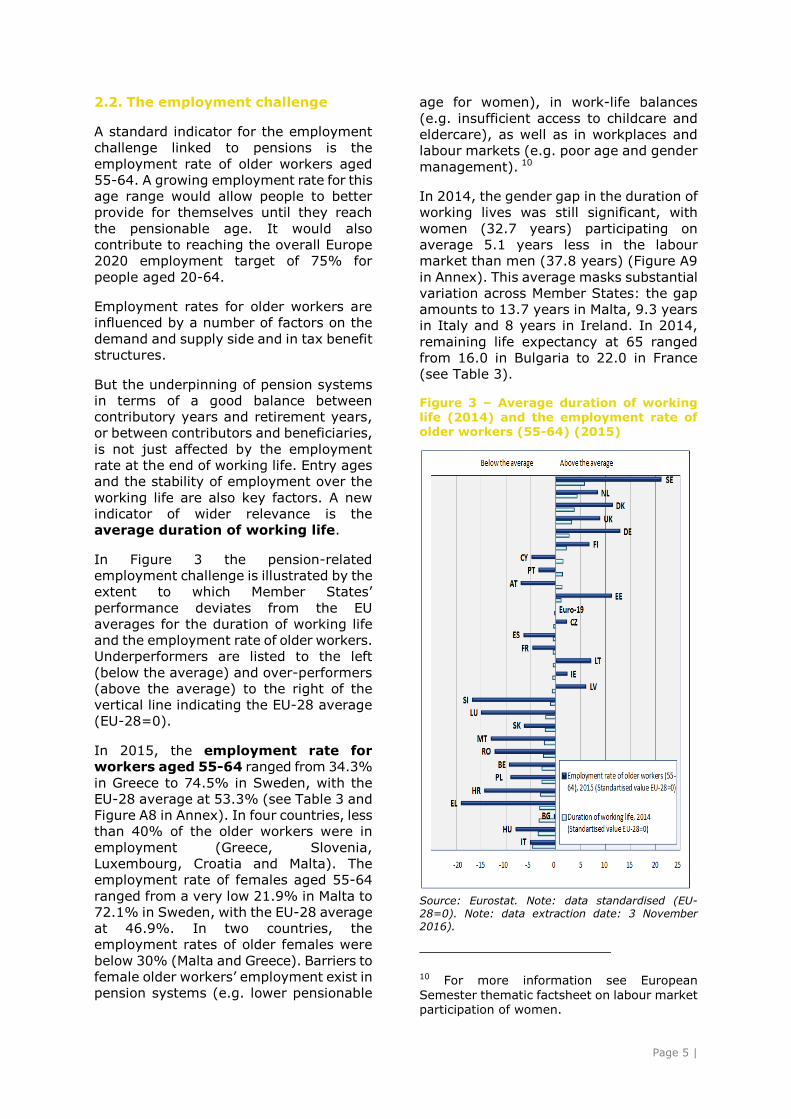
In Figure 3 the pension-related employment challenge is illustrated by the extent to which Member States’ performance deviates from the EU averages for the duration of working life and the employment rate of older workers. Underperformers are listed to the left (below the average) and over-performers (above the average) to the right of the vertical line indicating the EU-28 average (EU-28=0).
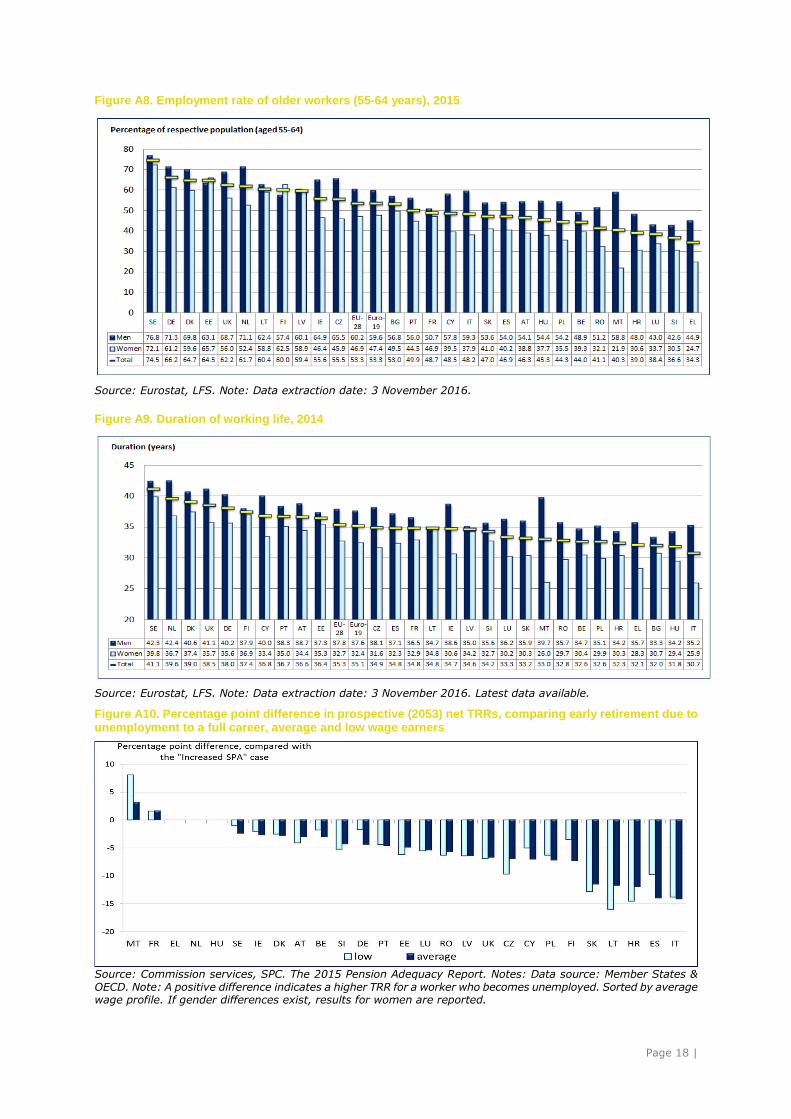
In 2015, the employment rate for workers aged 55-64 ranged from 34.3% in Greece to 74.5% in Sweden, with the EU-28 average at 53.3% (see Table 3 and Figure A8 in Annex). In four countries, less than 40% of the older workers were in employment (Greece, Slovenia, Luxembourg, Croatia and Malta). The employment rate of females aged 55-64 ranged from a very low 21.9% in Malta to 72.1% in Sweden, with the EU-28 average at 46.9%. In two countries, the employment rates of older females were below 30% (Malta and Greece). Barriers to female older workers’ employment exist in pension systems (e.g. lower pensionable
age for women), in work-life balances (e.g. insufficient access to childcare and eldercare), as well as in workplaces and labour markets (e.g. poor age and gender management). 10
In 2014, the gender gap in the duration of working lives was still significant, with women (32.7 years) participating on average 5.1 years less in the labour market than men (37.8 years) (Figure A9 in Annex). This average masks substantial variation across Member States: the gap amounts to 13.7 years in Malta, 9.3 years in Italy and 8 years in Ireland. In 2014, remaining life expectancy at 65 ranged from 16.0 in Bulgaria to 22.0 in France (see Table 3).
Figure 3 – Average duration of working life (2014) and the employment rate of older workers (55-64) (2015)
Source: Eurostat. Note: data standardised (EU-28=0). Note: data extraction date: 3 November 2016).
10 For more information see European Semester thematic factsheet on labour market participation of women.

Page 6 |
As result of recent pension reforms the volume of working hours and the duration of working careers will gain a much larger weight in future pension adequacy. Changes such as the closer links between work income based contributions and the accrual of pension entitlements, the rise in pensionable ages and the restriction of early retirement all strengthen the importance of longer and less interrupted full-time working lives, when seeking to build rights to a decent pension.
Figure A10 reports the impact of forced five years earlier retirement due to unemployment on future net replacement rates (in 2053+), compared to the replacement rate of someone who is able to achieve a full career up to the standard pensionable age.
Even larger falls in future replacement rates are projected for people who fail to complete a full career of 40 years with contributions. After a career of only 30 years11 , net replacement rates for both average earners and low wage earners are expected to decrease by more than 10 percentage points compared with those of a full career person in 23 Member States, by more than 20 percentage points in six Member States.
Though many countries have experienced significant improvements in the duration of working life over the last decade there are presently only a few Member States where this reaches the 40 years mark for men and for women this is nowhere the case. Many people currently manage to achieve only careers being five to ten years shorter than the number of years required for a full pension.
2.3. The sustainability challenge
Sustainability relates to the fiscal and financial balance between revenues and liabilities (and the ratio of workers/contributors to pensioners/
11 European Commission (DG EMPL) and Social Protection Committee (SPC).The 2015 Pension Adequacy Report: current and future income adequacy in old age in the EU. Volume I. European Commission. Luxembourg: Publishing Office of the European Union.
beneficiaries) in pension schemes. To be sustainable in the long run public pension schemes must be able to absorb the impact of population ageing without destabilising public finances.
Pension costs make up a large part of public expenditure (in 2013, 11.3% of GDP in the EU-28, but ranging from 6.9% in the Netherlands to 16.2% in Greece - Table 3) and are a major factor in the present and medium- to longer-term public budget position.
Figure 4 – Projected change in gross public pension expenditure in p.p. of GDP (2013-2060)
Source: European Commission (DG ECFIN) and Economic Policy Committee (AWG). The 2015 Ageing Report: Economic and budgetary projections for the 28 EU Member States (2013-2060). European Economy 3/2015.

Page 7 |
Public pension expenditure in the EU-28 is presently projected to increase over the period 2013-2040 by 0.4 p.p. up to 11.7% of GDP, before levelling down to around 11% of GDP by 2060. A decrease of around 0.2 p.p. is projected over the 2013-2060 horizon.
Yet, the range of projected changes in public pension expenditure is very large across Member States (see Figure 4 and Table 3 in Annex).
Croatia would record the largest decrease of the public pension expenditure ratio (3.9 p.p. of GDP), along with Latvia, Denmark (both 3.1 p.p.) and France (2.8 p.p.). In Italy, Greece, Sweden, Estonia, Spain, Portugal and Poland, decreases would range from 2 p.p. to 0.7 p.p. of GDP. The main drivers of such decrease are coverage ratio, employment rate and benefit ration.
By contrast Luxembourg would experience the strongest increase in public pension spending ratio (4.1 p.p. of GDP), followed by Slovenia (3.5 p.p.), Belgium (3.3 p.p.) and Malta (3.2 p.p.). Germany and Slovakia would see increases between 2 to 3 p.p. of GDP, whilst the increase would be moderate (0.7 to 1.1 p.p.) in Ireland, the Netherlands, Czech Republic and United Kingdom. The public pension spending ratio would instead remain largely stable (+/- 0.5 p.p.) in Austria, Lithuania, Finland, Cyprus, Hungary, Romania and Bulgaria.
In countries with larger projected increases in pension expenditure there will be a need for further pension reforms to contain growing costs.
In countries where public pension expenditure is projected to decrease in spite of considerable population ageing, there will be the risk of major policy reversals as result of a much larger share of women and men ending up with inadequate pensions and becoming exposed to poverty in old age.
Therefore, adequacy adjustments might be needed through other means such as an expanded working life and incentives for complementary pensions schemes.
3. IDENTIFICATION OF POLICY LEVERS TO ADDRESS THE CHALLENGES
Employment patterns and pension systems sustainability and adequacy are strongly interlinked. In ageing societies, maintaining sustainable relation between working life and retirement duration and building entitlements to an adequate pension will generally require people to work longer before retiring. To retain over all pension income at replacement levels similar to those obtainable in the 1990's and 2000's, many people will also have to increase their complementary retirement savings.
With people living longer and working-age population shrinking, the required increase in expenditure might become unsustainable. Pensions' adequacy will not be guaranteed unless people work more and longer before retiring. Pension benefits people are on average entitled to with one working year contributions will therefore need to reduce. Entitlements will have to more closely reflect contributions and be calculated on an actuarial bases. Pension reforms can achieve this by moving to career average as basis for benefit calculations.
Pension systems can help to optimise labour supply over working life, particularly for older workers, by setting strong work incentives in their entitlement rules and restricting access to early retirement.
Postponing retirement and pension take-up by working longer – and thus contributing and building entitlements for longer – can contribute significantly to simultaneous improvements in the sustainability and adequacy of pensions.
By shortening and/or preventing increases in the average time spent in retirement it allows Member States to free up resources that can be used to improve or maintain the present adequacy of pension benefits or at least limit the extent to which they will reduce.
Linking the statutory pension age to life expectancy is a good way to reconcile pension systems sustainability
Page 8 |
and adequacy in the context of ageing populations. Knowing that living longer implies working longer in order to finance the pension system provides strong incentives for postponing the effective retirement age in line with increases in life expectancy.
To promote longer working lives, pension reforms also seek to remove unwarranted early retirements, which at the same burden pension systems with considerable extra costs and deprives it of contributions which otherwise would have occurred.
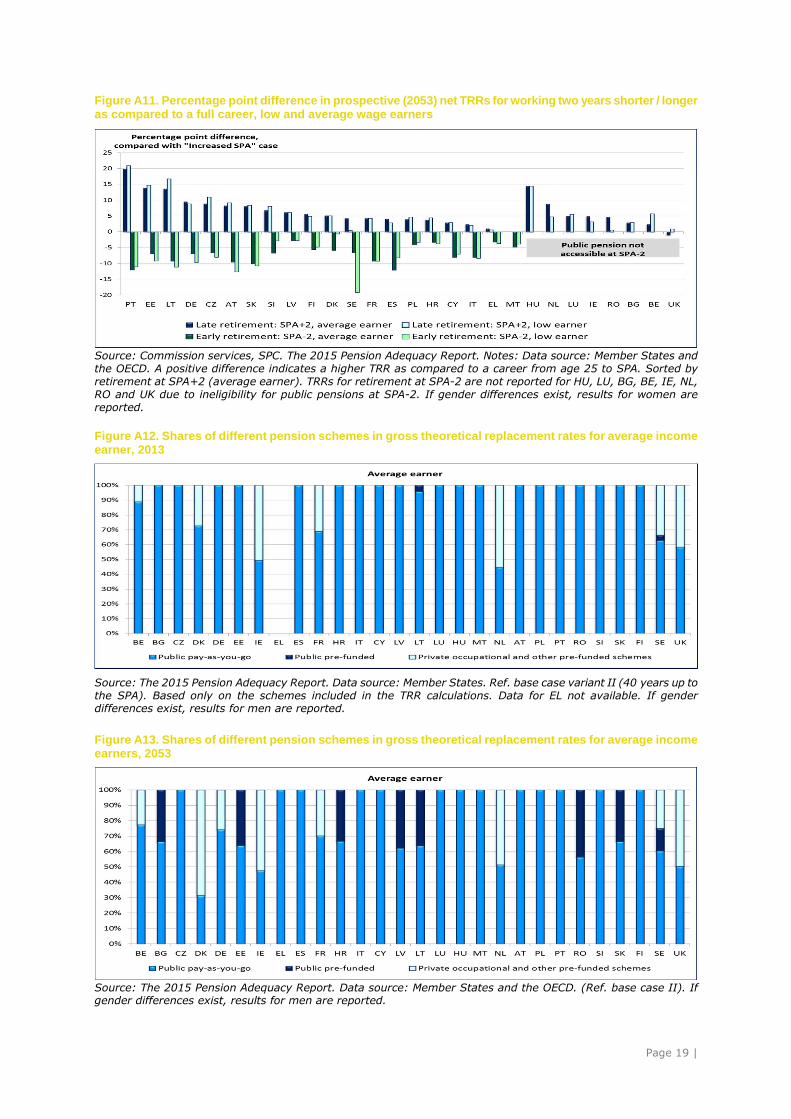
The 2015 Pension Adequacy Report demonstrates how working to a higher age may help maintain or even increase the future level of replacement rates. Figure A11 shows by how much the net replacement rate would increase for someone who works for two more years after having reached the national pensionable age compared to someone who retires at that age. In nine Member States, delaying retirement by two years beyond the standard pensionable age is projected to increase net replacement rates by five or more percentage points for a person with average earnings. The effects on the replacement rate of someone with low earnings (i.e. with two thirds of average earnings) are mostly similar. In these countries, longer working lives hence offer an effective way to improve future pension outcomes. In contrast, the financial incentive structures still appear insufficient in other Member States with a comparably low increase in replacement rates from working longer. Strong mechanisms to discourage early retirement will in the future be well in place in the majority of Member States as retiring two years before the pensionable age will result in substantial drops in replacement rates. Still there are countries where this will have negligible effects on pension benefits and adjustments therefore are needed.
Pension reforms ensuring a better balance between contributions and entitlements, reducing early retirement and raising the pensionable age are necessary to handle the challenges from population ageing. But on their own they are not sufficient.
The success of pension reforms restricting early retirement, raising the pensionable age and possibly linking this or benefits to gains in life expectancy depends on workplace and labour market measures supporting longer and uninterrupted working careers for both women and men. Such incentives can influence age management practices at work only to a certain degree. Specific policies for older workers on both demand and supply side of labour market are also needed, in close cooperation with social partners.
To enable longer working lives, workers' health conditions and professional skills need to be maintained as they age. Even for older workers skills matching and mobility has to be guaranteed. Flexibility in working arrangements has proved particularly useful to enable and encourage workers to extend their working life. The degree of autonomy in work organisation, the access to job-rotation and the ability to adjust working hours are important measures for improving the work-life balance.
However, the focus should not only be on the last phase of peoples' working life. Measures that lower longer term unemployment among youths and ensure early labour market integration on normal contractual conditions including social protection coverage will also contribute to lowering the risks to pension adequacy. The agenda for earlier and better integration of non-EU migrants into labour markets and society is also an essential part of a programme for reducing risks to income maintenance in old age. Policies for reducing gender gaps in pay, working hours and career length are, likewise, active means of narrowing the gender gap in pension entitlements (see European Semester thematic factsheet on female labour market participation).
The purpose of employment and pension policies is to ensure good working careers opportunities to everyone. Unfortunately, these opportunities tend to still be unevenly distributed across the population. With adequate pensions becoming increasingly dependent on contributory periods, social protection

Page 9 |
policy makers must take into account also those who for different reasons cannot have longer or less interrupted careers.
Concerning those unable to meet the longer contribution requirements, it will thus be important to establish some specific measures protecting them against poverty, such as minimum pensions or other minimum income provisions for older people. Some form of crediting of involuntary absence from employment will also be called for in order to reduce the impact on pension rights caused by considerable periods of illness, unemployment, caring duties, etc.
Furthermore, pension policy may need to devote more attention and greater resources to its poverty protection functions in the future.
It is, however, important to ensure that measures designed to provide adequate pensions to people with poor employment opportunities will not encourage an early exit from the labour market for people who could achieve a full career, as in the past has often been the case with certain early retirement, invalidity or unemployment benefit schemes.
Complementary retirement savings will in many countries be necessary to secure adequate replacement rates in the future. Some countries have introduced measures to complement their public pay-as-you-go pension schemes with private funded schemes, but there is considerable scope for further development of complementary pension savings opportunities in many Member States.
This is illustrated in Figure A12 and Figure A13, which focus on the role of income from pre-funded schemes in the total pension package in 2013 and 2053. Access to occupational and personal pension schemes should therefore be enhanced.
This may be achieved through collective agreements and auto-enrolment rules, as well as through tax and other financial incentives, while bearing in mind the need to ensure their cost-effectiveness, safety and transparency.
4. CROSS-EXAMINATION OF POLICY STATE OF PLAY
In the framework of the European Semesters, most Member States (16 in 2011, 17 in 2012, 15 in 2013, 18 in 2014, 14 in 2015 and 12 in 2016) have received Country Specific Recommendations (CSRs) on pensions calling for reforms to modernise pension systems by raising and aligning the pensionable age with the growing life expectancy, reducing early exit pathways, promoting complementary retirement savings and underpinning pension reforms with measures enabling men and women to work longer.
25 Member States have raised or are in the process of raising the pensionable age. Seven countries have linked the pensionable age to life expectancy and one more will follow in 2016. Table 4 in Annex provides the overview of the development of the pensionable ages as effect of reforms.
Whereas the trend towards earlier retirement has been reversed in all Member States over the last decade, premature labour market exit is still a major problem in several countries.
The biggest barrier to longer working lives is in labour markets. No Member State has a well-functioning labour market for people aged 55+. Longer working lives are presently overwhelmingly achieved through retention with the same employer. But if people aged 55+ lose their job, the chances of finding another one are so remote that longer working lives through rehiring is distinctly low.
Except for five countries particularly affected by the economic crisis older workers' employment rate has continued to grow during the last decade due demographic trends and the effect of reforms.
Yet most Member States that have raised and linked the pensionable age to life expectancy and significantly reduced access to early retirement have room for further and more comprehensive measures to underpin these reforms with changes in employment policies
Page 10 |
and work place practices to enable people to continue in employment as pensionable ages go up. Without such measures there is an increasing risk that pressures on unemployment, sickness and social assistance benefits will mount as people are unable to work to higher pensionable ages.
Thanks to reforms already enacted or planned in most Member States, the medium and long-term sustainability of public pension expenditure has markedly been improved, but remains a concern in several EU countries. Some countries may also face sustainability problems in the short to medium perspective, wherefore further reforms may be particularly urgent. Six Member States (Luxembourg, Slovenia, Belgium, Malta, Germany, Slovakia) are still faced
with large increases in public pension expenditure (see Figure 4). There is also a need to check how the drop in public pension expenditures for other Member States (Croatia, Latvia, Denmark, France, Italy) would affect the adequacy of overall income protection for older people. In Member States where public pension costs are reducing the expansion of private pensions would be expected to cover a large part of the possible gaps in adequacy. Yet for this to happen efforts to promote the development of cost-effective vehicles for complementary retirement savings would need to be stepped up in several of these countries.
Date: 14.11.2016

Page 11 |
5. REFERENCES AND USEFUL RESOURCES
• European Commission (DG EMPL) and Social Protection Committee (SPC), 2015. The 2015 Pension Adequacy Report: current and future income adequacy in old age in the EU. Volume I. European Commission. Luxembourg: Publishing Office of the European Union.
• European Commission (DG EMPL) and Social Protection Committee (SPC), 2015. The 2015 Pension Adequacy Report: current and future income adequacy in old age in the EU. Country Profiles. Volume II. European Commission. Luxembourg: Publishing Office of the European Union.
• European Commission (DG EMPL) and Social Protection Committee (SPC), 2012. Pension Adequacy in the European Union 2010-2050. European Commission. Luxembourg: Publishing Office of the European Union.
• European Commission (DG ECFIN) and Economic Policy Committee (AWG). The 2015 Ageing Report: Economic and budgetary projections for the 28 EU Member States (2013-2060). European Economy 3/2015.
• European Commission (DG JUST), FGB and IRS, 2013. The Gender Gap in Pensions in the EU. Luxembourg: Publication Office of the European Union.
• European Semester thematic factsheet on labour market participation of women.
• EUROPE 2020, A strategy for smart, sustainable and inclusive growth COM(2010) 2020 final. The website of Europe 2020: http://ec.europa.eu/europe2020/index_en.htmText of reference
• The White Paper “An Agenda for Adequate, Safe and Sustainable Pensions", COM(2012) 55 final, adopted on 16 February 2012.
• European Commission, COM(2013)83, "Towards Social Investment for Growth and Cohesion - including implementing the European Social Fund 2014-2020", February 2013.
Page 12 |
ANNEX. STATISTICAL INDICATORS AND FIGURES
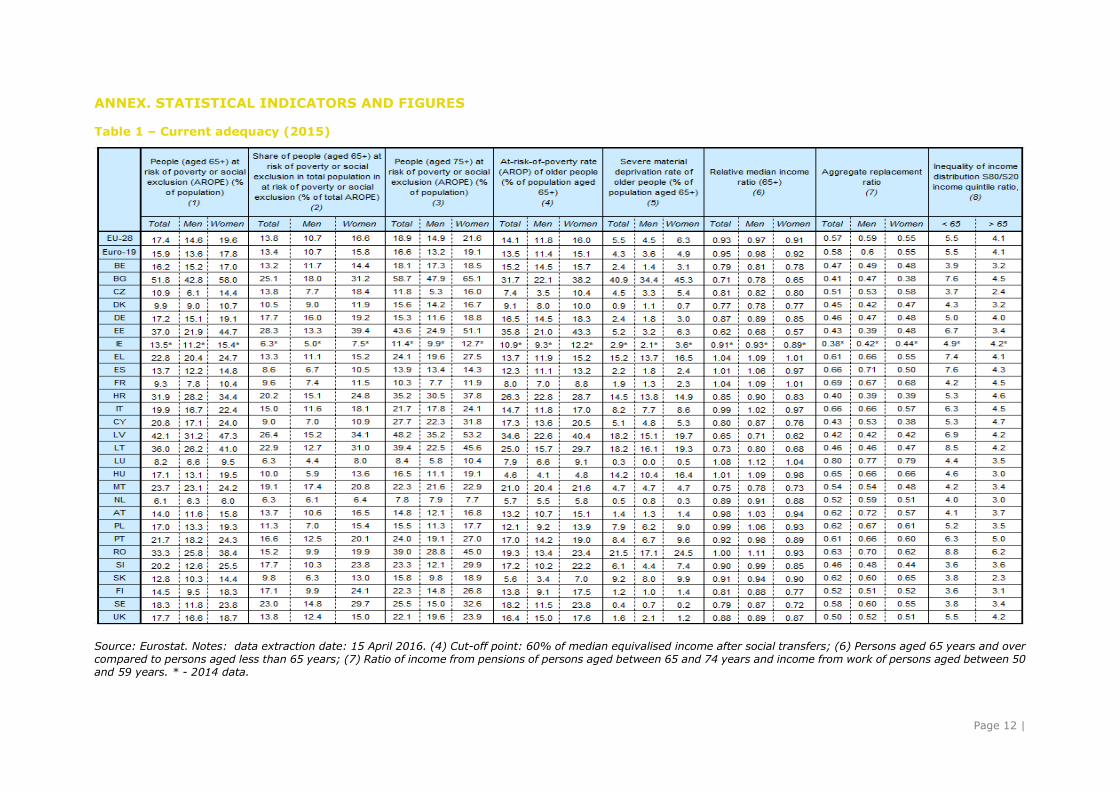
Table 1 – Current adequacy (2015)
Source: Eurostat. Notes: data extraction date: 15 April 2016. (4) Cut-off point: 60% of median equivalised income after social transfers; (6) Persons aged 65 years and over compared to persons aged less than 65 years; (7) Ratio of income from pensions of persons aged between 65 and 74 years and income from work of persons aged between 50 and 59 years. * - 2014 data.
Page 13 |
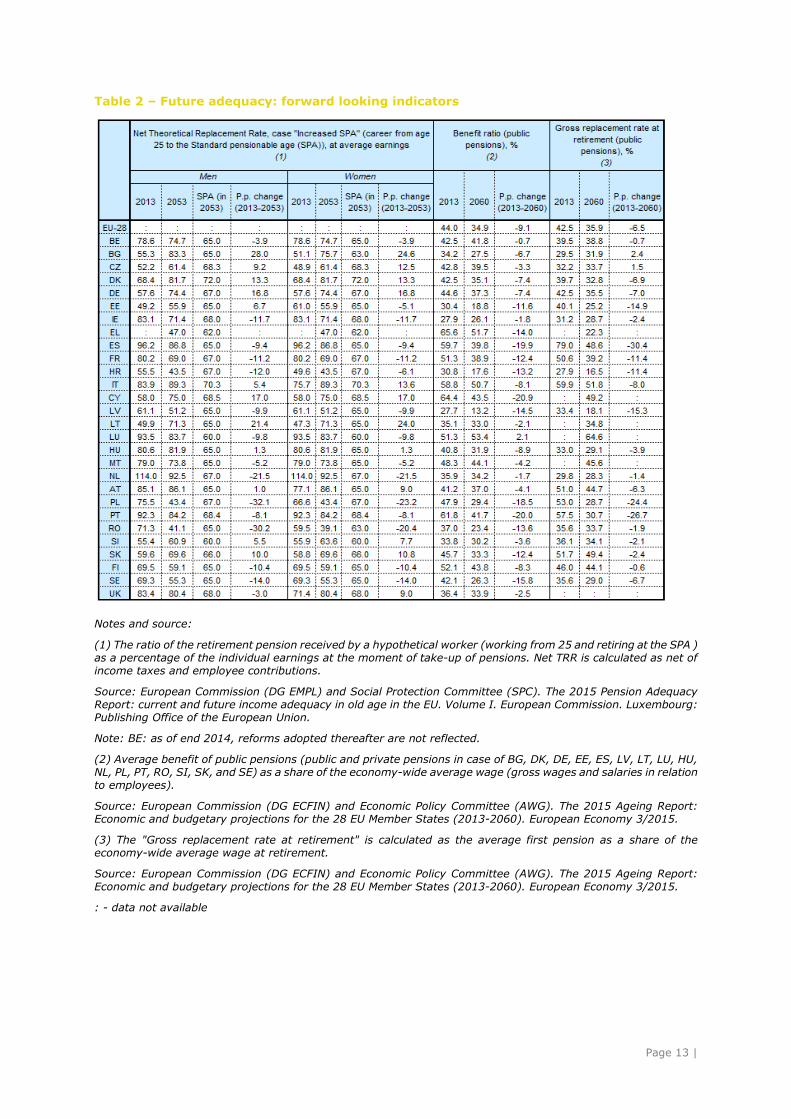
Table 2 – Future adequacy: forward looking indicators
Notes and source:
(1) The ratio of the retirement pension received by a hypothetical worker (working from 25 and retiring at the SPA ) as a percentage of the individual earnings at the moment of take-up of pensions. Net TRR is calculated as net of income taxes and employee contributions.
Source: European Commission (DG EMPL) and Social Protection Committee (SPC). The 2015 Pension Adequacy Report: current and future income adequacy in old age in the EU. Volume I. European Commission. Luxembourg: Publishing Office of the European Union.
Note: BE: as of end 2014, reforms adopted thereafter are not reflected.
(2) Average benefit of public pensions (public and private pensions in case of BG, DK, DE, EE, ES, LV, LT, LU, HU, NL, PL, PT, RO, SI, SK, and SE) as a share of the economy-wide average wage (gross wages and salaries in relation to employees).
Source: European Commission (DG ECFIN) and Economic Policy Committee (AWG). The 2015 Ageing Report: Economic and budgetary projections for the 28 EU Member States (2013-2060). European Economy 3/2015.
(3) The "Gross replacement rate at retirement" is calculated as the average first pension as a share of the economy-wide average wage at retirement.
Source: European Commission (DG ECFIN) and Economic Policy Committee (AWG). The 2015 Ageing Report: Economic and budgetary projections for the 28 EU Member States (2013-2060). European Economy 3/2015.
: - data not available
Page 14 |
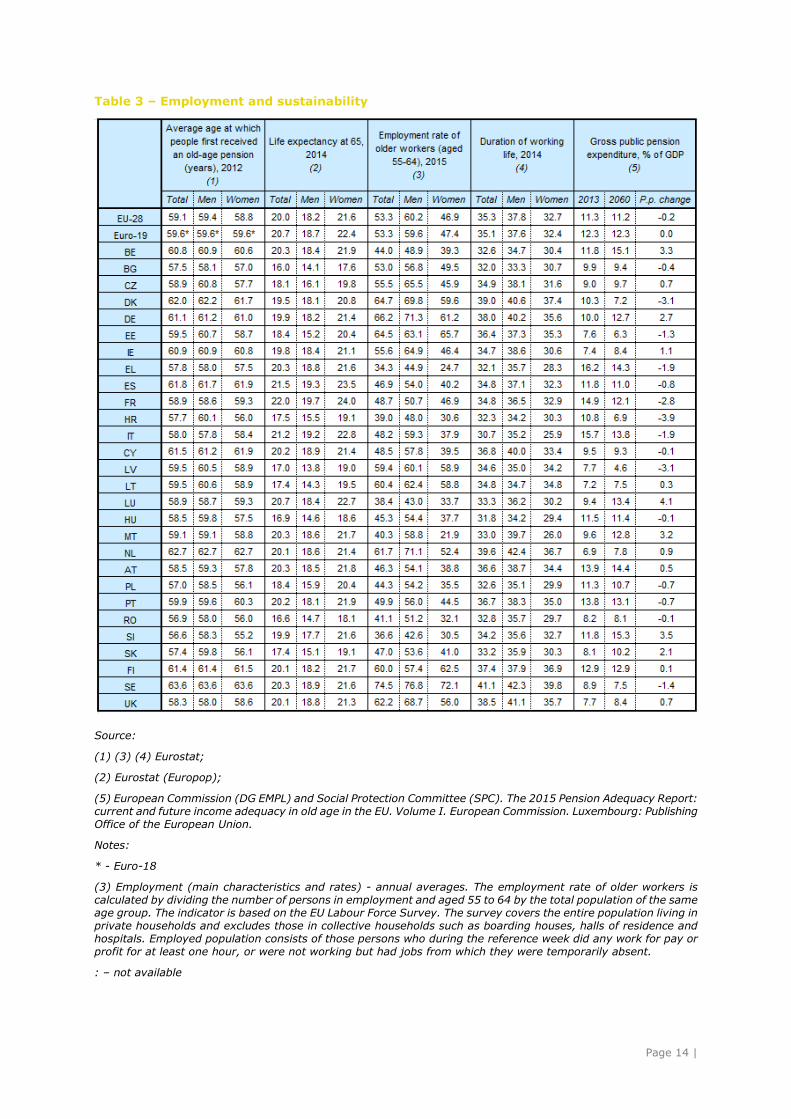
Table 3 – Employment and sustainability
Source:
(1) (3) (4) Eurostat;
(2) Eurostat (Europop);
(5) European Commission (DG EMPL) and Social Protection Committee (SPC). The 2015 Pension Adequacy Report: current and future income adequacy in old age in the EU. Volume I. European Commission. Luxembourg: Publishing Office of the European Union.
Notes:
* - Euro-18
(3) Employment (main characteristics and rates) - annual averages. The employment rate of older workers is calculated by dividing the number of persons in employment and aged 55 to 64 by the total population of the same age group. The indicator is based on the EU Labour Force Survey. The survey covers the entire population living in private households and excludes those in collective households such as boarding houses, halls of residence and hospitals. Employed population consists of those persons who during the reference week did any work for pay or profit for at least one hour, or were not working but had jobs from which they were temporarily absent.
: – not available

Page 15 |
Table 4 – Development in pensionable ages as effect of reforms, different years (on 1 January of the reference year)
MS 2016 2020 After 2020
Men Women Men Women Men Women BE 65 65 67 ( in 2030) BG 63y10m 60y10m 64y3m 61y6m 65+ (in 2037) 1
CZ 63 58y4m-62y4m2 63y8m 60y2m-63y8m 2
67+ (in 2044) 3
DK 65 66 67+ (in 2022) 1 DE 63y2m-65y4m 4 63y10m-65y9m 4 65-67 (in 2029) 4 EE 63 63 65 (in 2026) IE 66 66 68 (in 2028) EL 62-67 4 62-67 4 62-67+ 1,4 ES 65-65y4m4 65-65y10m 4 65-67 (in 2027) 4 FR 61y7m-66y7m 4 62-67 4 62-67 4 HR 65 61y6m 65 62y6m 67 (in 2038) IT 66y7m 65y7m-66y7m 5 67 67+ 1 CY 65 65+ 1 65+ 1 LV 62y9m 63y9m 65 (in 2025) LT 63y4m 61y8m 64 63 65 (in 2026) LU 65 65 65 HU 62y6m 64y6m 65 (in 2022) MT 62 63 65 (in 2027) NL 65y6m 66y8m 67+ (in 2021) 1 AT 65 60 65 60 65 (by 2024-2033) PL 65y10m 60y10m 66y10m 61y10m 67 (in 2020) 67 (in 2040) PT 66 66 67+ (in 2029)1 RO 65 60y3m 65 61 65 63 (in 2030) SI 65 63-65 4 65 65 SK 62 62+ 1 62+ 1 FI 63-68 6 63y9m-68y9m 6 65-70+ (in 2025) 1,6 SE 61-67 6 61-67 6 61-67 6 UK 65 62y8m 66 68 (in 2046) + 1
Source: information provided by Member States.
Notes: Age when a full old-age pension can be claimed without reductions under the general pension regime. (1) Adjusted to life expectancy gains. (2) Depending on the number of children raised. (3) Increased by 2 months annually over an unspecified time horizon. (4) Depending on the contribution period. (5) Depending on the sector of employment. (6) Flexible retirement age linked to benefit level.
Figure A1: Life expectancy at 65 in 2014 and 2060
Source: Eurostat (Europop 2013)

Page 16 |
Figure A2: Relative median income ratio (65+), total and by gender, 2015
Source: Eurostat, EU-SILC. Note: Data extraction date: 3 November 2016. * - 2014 data
Figure A3: At-risk-of-poverty rate (population aged 65+) by gender, 2015
Source: Eurostat, EU-SILC; Income year 2014. Notes: Data extraction date: 3 November 2016. Cut-off point: 60% of median equivalised income after social transfers. * - 2014 data
Figure A4: Relative at risk of poverty gap (by age group) and the AROP for the population aged 65+, 2015
Source: Eurostat. Notes: At-risk-of-poverty gap at 60 percent of the national median equivalised disposable income. Sorted by the poverty gap for the population aged 65+. Data extraction date: 3 November 2016, * - 2014 data

Page 17 |
Figure A5: Severe material deprivation (population aged 65 years or over) by gender, 2015
Source: Eurostat, EU-SILC. Note: Data extraction date: 3 November 2016. *-2014
Figure A6: At-risk-of-poverty or social exclusion rate (AROPE) (65 years or over) by gender, 2015
Source: Eurostat, EU-SILC; Income year 2014. Note: Data extraction date: 3 November 2016. *-2014
Figure A7: Gender gap in pensions (%), pensioners aged 65+ and 65-79, 2014
Source: ENEGE. * - 2013.
Page 18 |
Figure A8. Employment rate of older workers (55-64 years), 2015
Source: Eurostat, LFS. Note: Data extraction date: 3 November 2016.
Figure A9. Duration of working life, 2014
Source: Eurostat, LFS. Note: Data extraction date: 3 November 2016. Latest data available.
Figure A10. Percentage point difference in prospective (2053) net TRRs, comparing early retirement due to unemployment to a full career, average and low wage earners
Source: Commission services, SPC. The 2015 Pension Adequacy Report. Notes: Data source: Member States & OECD. Note: A positive difference indicates a higher TRR for a worker who becomes unemployed. Sorted by average wage profile. If gender differences exist, results for women are reported.
Page 19 |
Figure A11. Percentage point difference in prospective (2053) net TRRs for working two years shorter / longer as compared to a full career, low and average wage earners
Source: Commission services, SPC. The 2015 Pension Adequacy Report. Notes: Data source: Member States and the OECD. A positive difference indicates a higher TRR as compared to a career from age 25 to SPA. Sorted by retirement at SPA+2 (average earner). TRRs for retirement at SPA-2 are not reported for HU, LU, BG, BE, IE, NL, RO and UK due to ineligibility for public pensions at SPA-2. If gender differences exist, results for women are reported.
Figure A12. Shares of different pension schemes in gross theoretical replacement rates for average income earner, 2013
Source: The 2015 Pension Adequacy Report. Data source: Member States. Ref. base case variant II (40 years up to the SPA). Based only on the schemes included in the TRR calculations. Data for EL not available. If gender differences exist, results for men are reported.
Figure A13. Shares of different pension schemes in gross theoretical replacement rates for average income earners, 2053
Source: The 2015 Pension Adequacy Report. Data source: Member States and the OECD. (Ref. base case II). If gender differences exist, results for men are reported.