adding value to veal -...
TRANSCRIPT

Adding Value to Veal
BACKGROUND Lean process improvement was first described in context to the automotive industry in the 1980’s but is successfully being applied to agricultural businesses and the agri-food sector throughout the world. In virtually every sector, experience shows that there are significant opportunities to improve your bottom line by reducing waste, increasing output and focusing on your customers’ priorities. Indeed, identifying and focusing on continually improving only those processes necessary to create value from consumers’ perspectives will lead to more satisfied and loyal customers and consumers, stronger business relationships, reduced costs and enhanced profitability. This case study suggests ways in which a veal value chain could take a lean process improvement approach to capturing increased value from the consumer market. As with most foods, the journey veal takes from a farm to consumers’ dinner plates takes many steps. If even a few of those steps are insufficiently focused on meeting consumer needs, or are improperly managed, the cumulative impact on the value proposition of veal from consumers’ perspectives can be significant. It can also significantly affect the profitability of any or all of the businesses situated along the value chain. With the objective of identifying opportunities to capture greater value from the production, processing and retailing of veal, the Value Chain Management Centre at the George Morris Centre completed a high level study of veal value chains stretching from farms to consumers. The project team used information from the Consumer Data for Farmers1 project as a base to determine which of the current activities create value for consumers, and identify where opportunities for improvement exist. 1 www.vcmtools.ca/consumer_data.php
Funding for this project was provided by Agriculture and Agri-Food Canada through the Agricultural Adaptation Council
January 2011

PURPOSE The purpose of this study is not to apportion blame or criticize any segment of the agri-food sector. It seeks only to present an objective high-level assessment of current operations performed along veal value chains, and to propose how individual participants could more effectively work together to deliver increased value to consumers. In so doing, participants could enhance their own profitability. In 2010, Canada produced approximately 310,000 grain and milk-fed veal calves, and the farm gate value was estimated to have exceeded $225 million. Veal production is centred mainly in Quebec, with approximately 400 producers, and Ontario, with approximately 300 producers. Approximately 70% of Canadian veal is produced in Quebec. The study and review were developed by observing actual chains supplying specific markets, and interviewing key representatives situated at points along these entire value chains. For commercially sensitive reasons, the chains observed for this study are anonymous. To ensure that the incidents and opportunities described in this summary are representative of the wider industry, observations described herein have been validated through discussions with representatives from the Canadian veal and beef industries.
SUMMARY Improving the overall management of a veal value chain may require only small improvements to be made at multiple points, from production through to retailing. The sum of those improvements could enable the participants to capture greater value from their activities and improve their profitability. While opportunities to improve performance can often be easily identified, sustaining any improvements often relies on the existence and application of a more meaningful performance reporting system than previously existed. As well, the chain must implement a governance system that instils the discipline required to reward those participants who are performing beyond minimal requirements, while penalizing those who are not. Opportunities to improve the current performance of the chains studied include the following:
• The overall chains lack insights into the drivers of consumer behaviours which, if shared, could guide improvements at multiple levels of the chains.
• Lack of communication along the chains leads to operations being managed according to transactional measures that can have little correlation to consumers’ demands for veal.
o For instance, premiums are not paid for calves that exceed average quality measures. Below average calves are simply discounted, or not purchased at all.
o Prices paid are based more on supply and demand during a given week than long-term marketing strategies and processes that could foster continual improvement.
• Lack of communication and coordination along the chains appears most prevalent in Quebec.

“This leaves us in a potentially precarious position and discourages us from working to increase the overall value of the veal category
compared to what we otherwise could.” Managing Director, Processor
• One reason for the lack of coordination along chains associated with Quebec: approximately 50% of grain-fed calves are sold through an electronic auction system that purposely seeks to keep calf prices artificially high by masking availability. While this offers short-term benefits to producers, the current system creates at least four unintended consequences that work against the veal industry’s long-term interests:
o A lack of transparency, which discourages processors from working with retailers and foodservice customers to increase the overall size and value of the veal category.
o A lack of strategic alignment, which makes it difficult to challenge retailers’ tendencies to view veal as a category without a future.
o A lack of operational alignment, which creates unnecessarily high costs, many of which are borne by the downstream links in particular.
o The subsequent lack of transparency and strategic alignment hampers industry from developing the capabilities necessary to address consumers’ perceptions of veal as being insufficiently different to beef to warrant paying a price premium.
• Current practices negatively impact all of the researched chains’ efficiencies and effectiveness. This, in turn, prevents all the participants along the chain from fully capturing the financial value their operations could create.
• Strategically aligning operations along each chain would provide entire chains with the ability to deliver added value to consumers while simultaneously increasing revenues and margins.
VALUE CHAIN MAP Figure 1 presents the schematic of one of the anonymous veal value chains used as the basis of this study. It involves multiple veal producers, a livestock auction, a processor with the capacity to slaughter in excess of 150,000 veal calves annually, and a retailer. The individual veal value chain steps are as follows:
• Calf born (usually on dairy farm) • Calf made available for sale • Calf transported to feed lot • Calf fed to market weight • Calf sold/purchased via on-line auction • Calf transported to slaughter house • Calf slaughtered • Carcass graded • Carcass transported to processing plant • Carcass butchered, packed and labelled

• Finished goods transported to meat distributor • Store orders selected • Order transported to individual stores • Veal unloaded and put on display • Consumer purchases • Consumer transports home • Consumer prepares, cooks and serves
Figure 1: Fresh (grain-fed) Veal Value Chain
While this map has 18 major steps, each of which is a summation of a varying number of interrelated steps, Figure 2 shows that the chain essentially operates as five distinctly different units. While overlaps occur among the five units, our observations suggest that many of the management processes occurring at each unit along the chain operate in isolation, relative to each other. Figure 2: Operational Units
Sale Production Processing Retailing Consumers
Interviews with members of this and other veal value chains suggest that the present situation culminates from a number of factors, including the following:

• Primary producers, processors, and retailers each expect the other to exhibit predatory business approaches, should they share all but immediate transactional information.
• Each seeks to maximize short-term gain, sometimes at the expense of long-term opportunity. • Each unit of operation exhibits a tendency to sell rather than market their products. • Beyond transactional measures such as price and weight, the communication system that exists
along the entire chain is ineffective for motivating continual market-focused improvements.
One example of the ways these factors translate into missed opportunities to capture value was stated by the Managing Director of the Processor, “While veal calves are sold and priced weekly, we have to agree on prices with retailers six weeks out. This leaves us in a potentially precarious position and discourages us from working to increase the overall value of the veal category compared to what we otherwise could.” The relationships this creates impact the desire for the chain to work together to strategically grow the veal category, and to develop the capabilities necessary for encouraging retailers to test new merchandizing and buying mechanisms. For example, while many consumers do not perceive veal to be good value for money, researchers identified that the present chain’s governance system results in a higher than necessary cost structure. Being less than optimally efficient and effective limits the chain’s ability to enhance consumers’ perceptions of veal compared to alternative meats, particularly beef. An example of opportunities to improve cost structures can be seen in the relative effectiveness of milk-fed veal produced in Ontario vs. Quebec. Failing to meet minimum specifications leads to higher processing costs. It also leads processors to have to discount veal in order to flow it through the system. Not only does this create additional unnecessary costs, it also limits revenue-generating opportunities. The primary reason for this comparative difference in performance is that Ontario’s industry has consolidated, resulting in fewer, more capable producers. In Quebec, partly due to programs such as ASRA, the veal industry has not consolidated to the same extent as Ontario’s. Using data provided by a number of processors on the average group weights of calves shipped, Figure 3 shows that the existence of many small and often less capable producers results in Quebec producing less from the same resources (including genetics, feed and labour) compared to Ontario.

Figure 3: Milk-fed live weight after 20-week feeding period in Ontario and Quebec in 2009 (n=1,065 shipments)
Figure 3 compares the performance in Quebec and Ontario in relation to the processors’ expectations that they will receive animals weighing 480Ib (live weight) at 20 weeks of age. Figure 3 shows the average animal weight for 1,065 shipments received by processors in Quebec and Ontario. The statistics show that a clear difference exists between animals raised in Quebec and in Ontario, even though they were fed on the same feed for the same period of time. While the animals in 95% of the Quebec shipments failed to meet the processors’ expectations for average weight after 20 weeks, the animals in only 22% of Ontario shipments underperformed. On the other hand, the animals in fewer than 5% of Quebec shipments outperformed expectations. This compares to the 87% of outperformers in Ontario shipments. The cost structure of Quebec’s veal production system also exceeds Ontario’s in two additional areas. At 4.7% vs. 3.5% of all calves respectively, the premature death rate of calves is higher in Quebec than Ontario. The Total Feed Conversion (TFC) is actually higher (less efficient) in Quebec than in Ontario: 1.82kg feed/kg weight gain vs. 1.79kg feed/kg weight gain, respectively. With all these factors resulting in veal production being more costly in Quebec than Ontario, if ASRA did not exist, it could be expected that market forces would drive improvements that would benefit the entire chain – including consumers. While producers’ profitability is ensured to a large degree by risk management programs such as ASRA, processors’ profitability is not. Therefore, they need to address costs created through inconsistency by charging higher prices to retailers and foodservice operators. These higher prices are, in turn, passed onto consumers.

Motivation to Improve In Quebec and Ontario, the motivation for chain members to improve performance is impacted by the fact that, beyond transactional metrics such as price and weight, there is little that currently connects the chain participants in their endeavours to capture value from supplying veal to increasingly discerning consumers. Yet the factors that influence consumers’ purchasing and consumption decisions extend beyond the size of cut, availability and price. To encourage members of the veal industry to explore ways to capture value by innovating in relation to consumer expectations, the remainder of the case study explores opportunities for the value chain to benefit from introducing new processes. This could be expected to lead to consumers’ perceptions that veal offers a higher value proposition than at present. Simultaneously the chain would be able to reduce costs. The remainder of the case study proposes ways this could be achieved.
CONSUMERS’ DEFINITION OF VALUE The process of analyzing opportunities to improve performance of the veal value chain began by evaluating results from the Consumer Data for Farmers project (conducted by Ipsos Forward). This study identified the relative importance consumers place on specific attributes that define the quality and perceived value of veal. The critical to satisfaction (CTS) criteria included the following attributes:
• Taste • Tenderness • Freshness • Consistency in quality • Overall healthiness • The whole family will eat it • Affordable price • Value for money • Quick to prepare • Versatile • Appropriate sizes of the cuts • Availability of recipes • Availability of the desired cuts • Available in a variety of quick to prepare products • Easy to locate in the store • Easy to prepare from scratch
Of the 16 attributes tracked, a number stood out as having particular importance for consumers. The satisfaction consumers feel toward how well veal performs across the 16 attributes also varied considerably. A summary of the relative importance of each of the 16 factors, along with how satisfied consumers are with having their expectations met, is shown in Figure 4.

For each of the CTS criteria, responses from veal consumers in relation to each of the attributes researched have been analyzed to rank the importance for each on a scale of 1 to 10.
• A score of 8, 9 or 10 would indicate a potential “deal breaker” or “must have”. If this requirement cannot be satisfied, consumers will not buy the product.
• 5, 6 or 7 is important and indicates a “should have” requirement. Consumers may buy the product now because they have to, but will likely look at alternatives in the future.
• 2, 3 or 4 is of low importance but would be “nice to have”. These factors will not likely influence consumers’ purchase decisions, but could be opportunities to ‘delight’ consumers and secure a retailer’s position as the one of choice.
• The degree to which consumers are satisfied that their expectations toward each attribute are currently being met is shown immediately below the importance scores. 100% means that veal consumers are highly satisfied that any attribute that meets their expectations.
• As can be seen, some of the attributes consumers deem most important to engendering a purchase decision are those on which veal performs least favourably.
Figure 4: Consumers’ Critical to Satisfaction and Satisfaction scores for Veal
The
who
le fa
mily
will
eat i
t
Tast
e
Ove
rall
Hea
lthin
ess
Val
ue fo
r Mon
ey
Qui
ck to
pre
pare
Vers
atile
(can
be
prep
ared
in a
w
ide
varie
ty o
f way
s)
Affo
rdab
le p
rice
Eas
y to
pre
pare
from
scr
atch
Con
sist
ency
in q
ualit
y
Fres
hnes
s
App
ropr
iate
siz
es o
f cut
s
Tend
erne
ss
Ava
ilabi
lity
of re
cipe
s an
d pr
epar
atio
n su
gges
tions
in th
e st
ore
Eas
y to
loca
te in
my
regu
lar s
tore
Ava
ilabl
e in
a v
arie
ty o
f qui
ck to
pr
epar
e pr
oduc
ts
Des
ired
cuts
ava
ilabl
e in
my
regu
lar s
tore
Importance Score
10 4 6 10 2 3 6 4 4 5 6 3 6 7 2 6
Consumer Satisfaction
78% 80% 78% 65% 74% 73% 58% 77% 76% 79% 75% 79% 58% 69% 60% 67%
As described above, we have separated specific attributes into ‘Must have’, ‘Should have’ and ‘Would be nice to have’ categories. Must haves/deal breaker attributes – with scores of 8, 9 or 10:
• The whole family will eat it Should haves – with scores 5, 6 or7:
• Affordable price Nice to have/delighters – with scores 2, 3 or 4:
• Meat attributes o Taste o Consistency in quality o Freshness o Tenderness o Appropriate sizes of the cuts o Overall healthiness
• Retailer/veal category marketing attributes

o Easy to prepare o Quick to prepare o Versatile – can be prepared in a number of different ways o Easy to prepare from scratch o Availability of recipes, preparation and serving instructions in my store o Easy to locate in my regular store o Availability of desired cuts in my store o Availability of quick to prepare products o Value for money
An important point worth noting is that this information comes from regular consumers of veal. The present gap between the relative importance of the attribute ‘whole family will eat it’ and other attributes would likely be even greater amongst those who rarely consume veal. Figure 5 presents this information schematically, to better illustrate the relationships between the relative importance of attributes researched and consumer satisfaction. Figure 5: Consumers’ Critical to Satisfaction and Satisfaction scores for veal
Results from the CTS research suggest two critical issues exist in relation to consumers’ attitudes toward veal. The first is that many consumers appear to habitually choose veal due to cultural factors, not because of the benefits they perceive veal offers them compared to alternative proteins. The second is that most consumers do not perceive veal as offering good value for money. Both issues appear to arise because opportunities to add value to veal are currently being missed through the chain not working together to enhance its long-term value proposition from consumers’ perspectives. An expert with more than 35 years’ experience retailing meat suggested that opportunities to add value to veal were currently being undermined by the majority of consumers being unfamiliar with veal and

inexperienced with its preparation. According to this expert, the situation is being exacerbated by retail stores across Canada having an inconsistent veal offer from week to week, even though veal offers an enviable retail margin. This is because the portion size of veal is 70% smaller than beef, though around three times the retail price by weight.
ADDRESSING OPPORTUNITIES As reported earlier, the value chain under analysis was deconstructed to encompass 12 separate processes. Many of these processes involve more than one member of the chain (for instance the sale/purchase process will include producers, the livestock auction and the processor). Starting at the part of the chain that most closely interacts with consumers, the processes used to define how the value chain operates are as follows:
• Store display/meat counter • Retailer operations • Retailer procurement • Distribution of logistics • Cool chain and transportation • Cut pack and label • Post kill cooling and logistics • Slaughter • Animal sale/purchase • Housing and handling • Animal genetics • Production system and feed
The matrix shown in Figure 6 illustrates how a value chain might go about increasing sales and capturing added value. It takes the information presented above, then illustrates where research indicates a relationship exists between measured CTS attributes and processes performed along the value chain. This reveals where an investment in improving processes in relation to increasing consumer-defined quality could provide the greatest benefits for the overall value chain. Where a consumer attribute is affected by a step in the value chain, there is an association.
o No score means that no defined association was identified between a process and a CTS attribute.
o The strength of that association is scored on a scale of 1 to 10. A score of 1 signifies a very weak association A score of 10 signifies a very high association Association scores for each cell are multiplied by the consumer CTS score. Row
and column scores are totalled. • Columns with low scores or few association points likely indicate a consumer CTS that is either
not addressed, or is addressed at one or two points. • Rows with low scores or few association points likely indicate a value stream element that is
non-value added or wasteful, or not perceived by consumers as adding value. In either case,

this should be given consideration as an opportunity to reduce cost or increase value to consumers.
• Rows with high scores represent value stream elements that have significant impact on consumer CTS. These elements should be controlled and managed carefully.
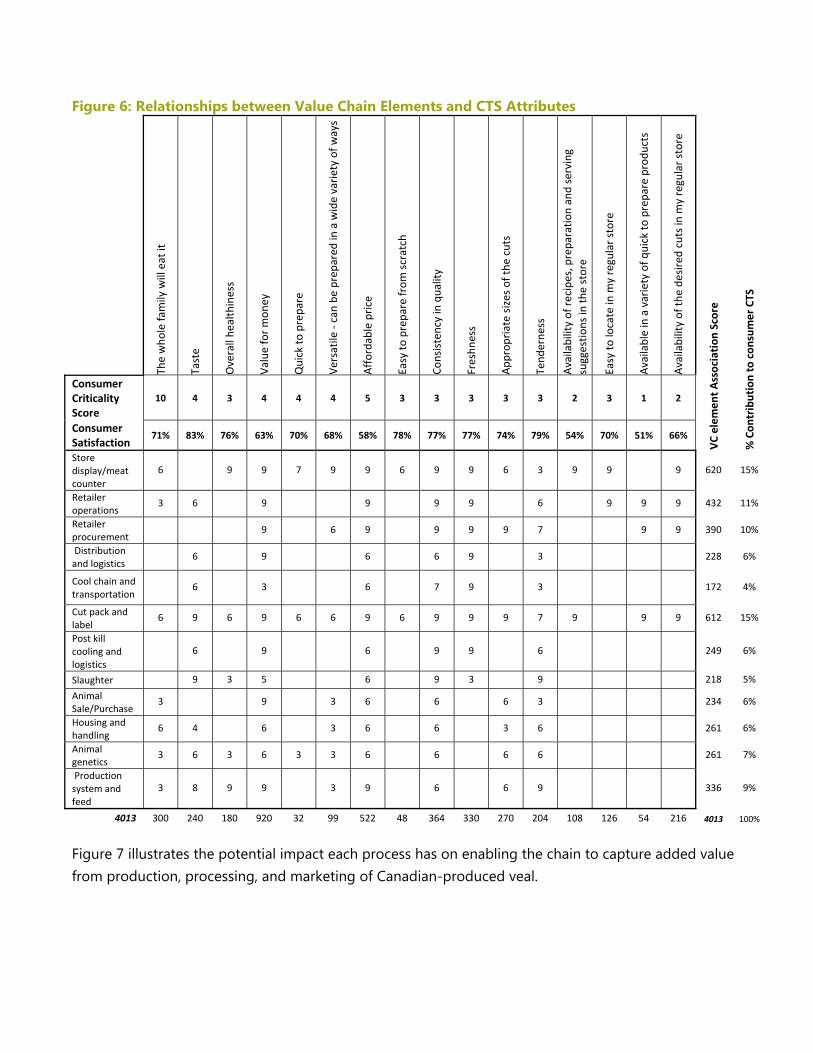
Figure 6: Relationships between Value Chain Elements and CTS Attributes
The who
le family will eat it
Taste
Overall he
althiness
Value for mon
ey
Quick to
prepare
Versatile ‐ can be
prepared in a wide variety of ways
Affordable price
Easy to
prepare from
scratch
Consistency in quality
Freshn
ess
App
ropriate sizes of the
cuts
Tend
erne
ss
Availability of recipes, preparatio
n and serving
suggestio
ns in
the store
Easy to
locate in
my regular store
Available in a variety of q
uick to
prepare produ
cts
Availability of th
e de
sired cuts in m
y regular store
VC elem
ent Association
Score
% Con
tribution to con
sumer CTS
Consumer Criticality Score
10 4 3 4 4 4 5 3 3 3 3 3 2 3 1 2
Consumer Satisfaction
71% 83% 76% 63% 70% 68% 58% 78% 77% 77% 74% 79% 54% 70% 51% 66%
Store display/meat counter
6 9 9 7 9 9 6 9 9 6 3 9 9 9 620 15%
Retailer operations
3 6 9 9 9 9 6 9 9 9 432 11%
Retailer procurement
9 6 9 9 9 9 7 9 9 390 10%
Distribution and logistics
6 9 6 6 9 3 228 6%
Cool chain and transportation
6 3 6 7 9 3 172 4%
Cut pack and label
6 9 6 9 6 6 9 6 9 9 9 7 9 9 9 612 15%
Post kill cooling and logistics
6 9 0% 6 9 9 6 249 6%
Slaughter 9 3 5 6 9 3 9 218 5%
Animal Sale/Purchase
3 9 3 6 6 6 3 234 6%
Housing and handling
6 4 6 3 6 6 3 6 261 6%
Animal genetics
3 6 3 6 3 3 6 6 6 6 261 7%
Production system and feed
3 8 9 9 3 9 6 6 9 336 9%
4013 300 240 180 920 32 99 522 48 364 330 270 204 108 126 54 216 4013 100%
Figure 7 illustrates the potential impact each process has on enabling the chain to capture added value from production, processing, and marketing of Canadian-produced veal.
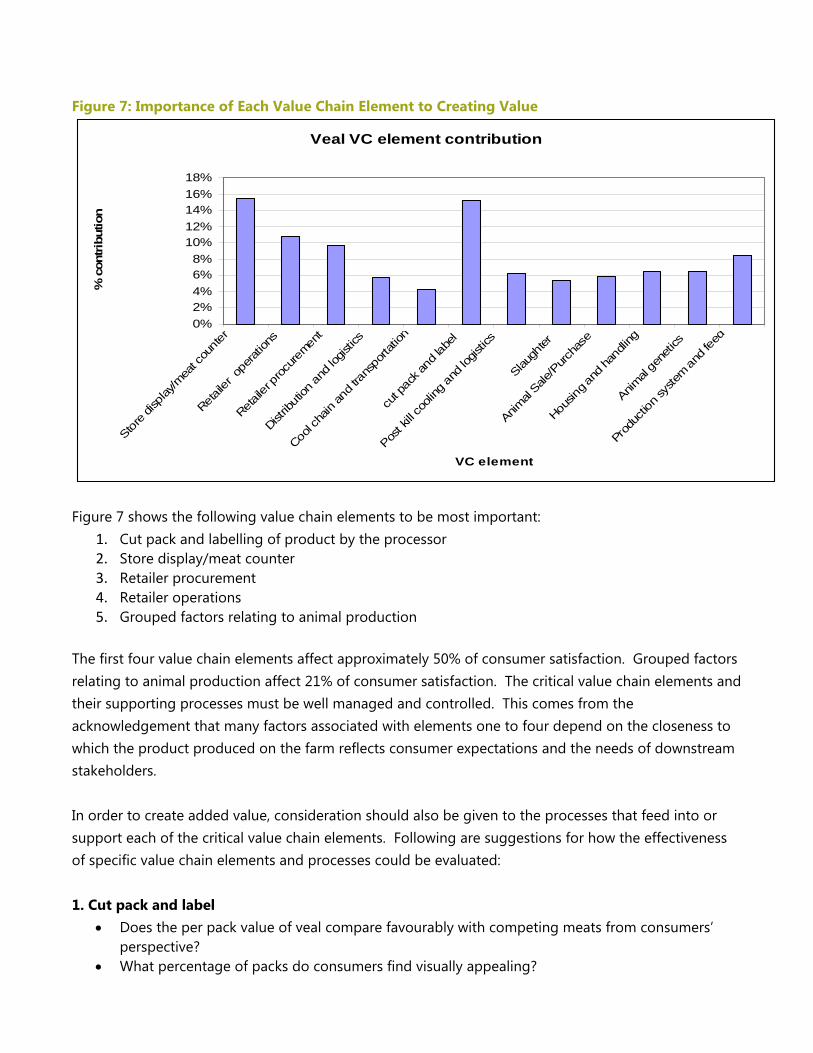
Figure 7: Importance of Each Value Chain Element to Creating Value
Veal VC element contribution
0%2%4%6%8%
10%12%14%16%18%
Store d
isplay
/mea
t cou
nter
Retaile
r ope
ration
s
Retaile
r proc
uremen
t
Dist
ributi
on an
d log
istics
Cool c
hain
and t
rans
porta
tion
cut p
ack a
nd la
bel
Post k
ill co
oling
and l
ogist
ics
Slaugh
ter
Animal
Sale/P
urcha
se
Housin
g and
hand
ling
Animal
gene
tics
Pro
ducti
on sy
stem an
d fee
d
VC element
% c
ontr
ibut
ion
Figure 7 shows the following value chain elements to be most important:
1. Cut pack and labelling of product by the processor 2. Store display/meat counter 3. Retailer procurement 4. Retailer operations 5. Grouped factors relating to animal production
The first four value chain elements affect approximately 50% of consumer satisfaction. Grouped factors relating to animal production affect 21% of consumer satisfaction. The critical value chain elements and their supporting processes must be well managed and controlled. This comes from the acknowledgement that many factors associated with elements one to four depend on the closeness to which the product produced on the farm reflects consumer expectations and the needs of downstream stakeholders. In order to create added value, consideration should also be given to the processes that feed into or support each of the critical value chain elements. Following are suggestions for how the effectiveness of specific value chain elements and processes could be evaluated: 1. Cut pack and label
• Does the per pack value of veal compare favourably with competing meats from consumers’ perspective?
• What percentage of packs do consumers find visually appealing?
• Who determines cut sizes, presentation and packaging format? What is their determination based on?
• Does the processor measure conformance to specifications? • What percentage of labels provide information other than weight and price that consumers
deem valuable? • What percentage of product is written off as shrinkage?
2. Store display/meat counter
• The majority of shoppers are female. Is the meat counter organized to suit female thoughts and selection criteria, or is it organized by men, from a male perspective?
• In as much as veal competes on a certain level with other meat categories, does the veal on display offer a visually appealing (preferably unique) value proposition to consumers?
• Are product information and cooking instructions readily available at the counter? • Are meat section staff on the floor talking to and helping customers or is the meat section that
merchandizes veal wholly reliant on the self-service principle? 3. Retailer procurement
• Do retailers and processors work in a collaborative manner to provide what consumers require? • Do retailers provide processors with meaningful forecasts? • Are forecasts received early enough for processors to balance carcasses demand? • Do forecasts reflect seasonality of supply? • Do retail buyers have meaningful information on the drivers of consumer purchasing behaviours
and attitudes? • How are consumer perceptions on quality factored into evaluating supplier performance?
4. Retailer operations
• Have front line staff members visited a meat processor? • Are all front line staff members fully familiar with the meat they prepare, pack and sell? • Could any front line staff member tell a consumer how to prepare, cook and serve the product? • Does the retailer conduct experiments to determine which predictors increase consumer
satisfaction and sales? • How effectively and efficiently are retailers’ operations performed? • How is the performance of retailers’ internal operations tracked and evaluated? • Is any of this information shared with suppliers for problem-solving purposes?
5. Grouped factors relating to animal production No one factor relating to animal production has the same level of importance as the individual factors described above. Cumulatively, however, they have the potential to significantly impact consumer satisfaction and jointly account for approximately 21% of consumer satisfaction.
• What steps are being taken to brand Canadian veal as a healthy consistent quality meat that the “whole family will eat”, perhaps through strategically-targeted animal welfare programs?
• Are producers provided with retail performance and consumer satisfaction information? • Are experiments undertaken to identify the comparative impact that each stage of the
production process has on meat quality?
• Do downstream stakeholders share information on how issues related to primary production impact their operations?
DISCUSSION ON A SPECIFIC EXAMPLE OF AN OPPORTUNITY TO INCREASE VALUE TO CONSUMERS The opportunity to increase the value proposition of this particular chain is for the producers, processor and retailer to work together, to clearly define factors that are critical to consumer satisfaction, and for the retailer to periodically issue the processor a score card indicating to what extent the processors’ products meet consumer CTS requirements. This need not be an exhaustive process. Based on indicators developed from the CTS research findings and input from the retailer, the next stage would be for the processor to provide producers with a quarterly scorecard indicating how well their veal meets minimum performance requirements, and provide one-on-one coaching as to how to improve the quality of their meat. Improving processes relative to consumer-defined CTS attributes would enable costs to be reduced along the entire chain. This, along with the opportunity to increase revenues through reacting effectively to consumer-defined CTS, would enable producers, processors and retailers to increase their profit margins. Making the change sustainable would depend upon everyone feeling financially incentivized to remain loyal to the process. The CTS criteria for “Affordable Price” scored 5 out of 10. As the relationship between the “whole family will eat it” and the other attributes is so vast compared to products such as pork and chicken, a score of 5 is tantamount to that of a deal breaker. Consumer satisfaction with the current price of veal is only 58%. The matrix shows that every step in the value chain has a reasonably to extremely strong association to this consumer-defined attribute. In interviews and observations from along the chain, researchers saw clear opportunities to reduce costs by more closely aligning operations occurring along the value chain, in order to reduce the often significant variations in product and process that currently exist along the value chain. These variations negatively impact performance. Improvements could be achieved over time by implementing statistical reporting and control measures that are regularly reviewed by management and shared with stakeholders whose operations have a connection with a specific performance being evaluated. It appears that too little information from along the chain is statistically tracked to identify inefficiencies, and test methods to reduce variations in quality. Nor is information shared among members of the value chain in a manner conducive to encouraging the implementation of more effective processes, and driving consumer-focused innovations. In terms of providing regular feedback along the chain, other than grading for payment against statistically based analysis, Figure 8 is offered as a suggestion of what information could be shared to improve the performance of individual members and the value chain overall.
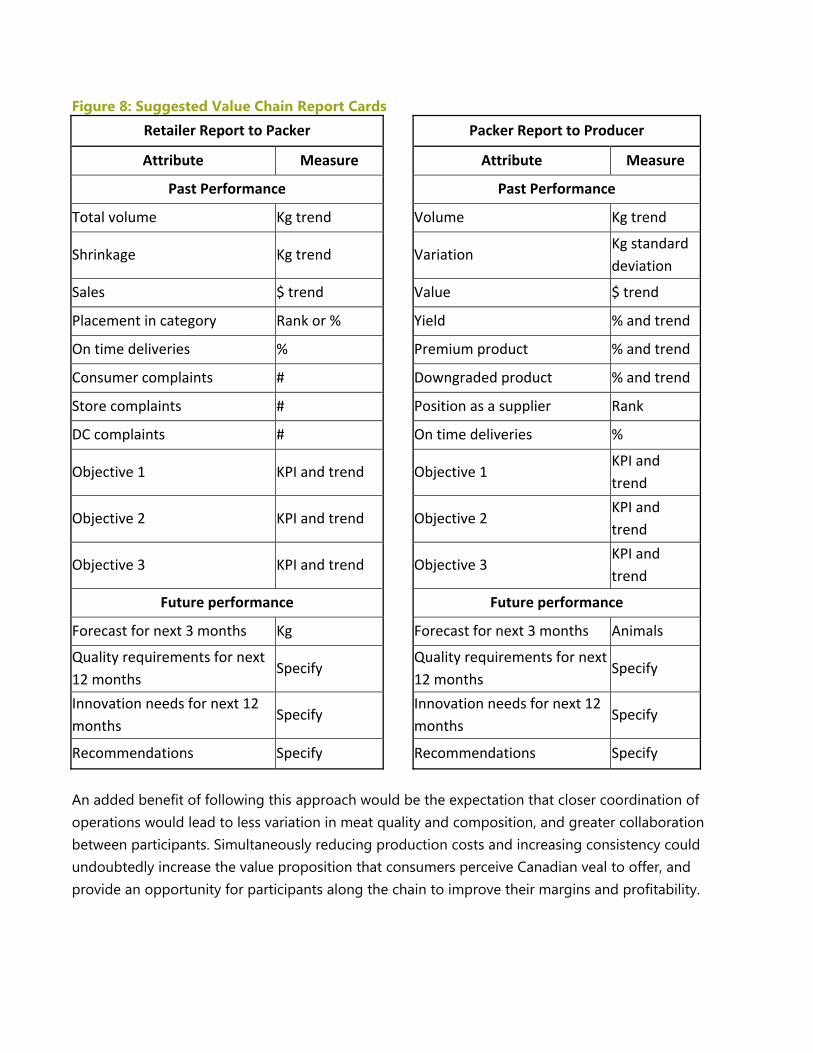
Figure 8: Suggested Value Chain Report Cards
Retailer Report to Packer
Packer Report to Producer
Attribute Measure Attribute Measure
Past Performance Past Performance
Total volume Kg trend Volume Kg trend
Shrinkage Kg trend Variation Kg standard deviation
Sales $ trend Value $ trend
Placement in category Rank or % Yield % and trend
On time deliveries % Premium product % and trend
Consumer complaints # Downgraded product % and trend
Store complaints # Position as a supplier Rank
DC complaints # On time deliveries %
Objective 1 KPI and trend Objective 1 KPI and trend
Objective 2 KPI and trend Objective 2 KPI and trend
Objective 3 KPI and trend Objective 3 KPI and trend
Future performance Future performance
Forecast for next 3 months Kg Forecast for next 3 months Animals
Quality requirements for next 12 months
Specify Quality requirements for next 12 months
Specify
Innovation needs for next 12 months
Specify Innovation needs for next 12 months
Specify
Recommendations Specify Recommendations Specify
An added benefit of following this approach would be the expectation that closer coordination of operations would lead to less variation in meat quality and composition, and greater collaboration between participants. Simultaneously reducing production costs and increasing consistency could undoubtedly increase the value proposition that consumers perceive Canadian veal to offer, and provide an opportunity for participants along the chain to improve their margins and profitability.

The Research Team: Martin Gooch, Abdel Felfel and Dan Laplain of the Value Chain Management Centre, George Morris Centre, Canada. www.vcmtools.com For more information, contact: Martin Gooch [email protected]