addendum to the coordinated operation agreement central
TRANSCRIPT

U.S. Department of the Interior Bureau of Reclamation Mid-Pacific Regional Office Sacramento, CA December 2018
Environmental Assessment
Addendum to the Coordinated Operation Agreement Central Valley Project/State Water Project
18-35-MP

Mission Statements
The mission of the Department of the Interior is to protect and provide access to our Nation’s natural and cultural heritage and honor our trust responsibilities to Indian Tribes and our commitments to island communities.
The mission of the Bureau of Reclamation is to manage, develop, and protect water and related resources in an environmentally and economically sound manner in the interest of the American public.

Table of Contents 1 Introduction ............................................................................................... 1
1.1 Need for the Proposal............................................................................ 1 1.2 Description of the Agreement ............................................................... 2
2 Proposed Action and Alternatives ........................................................... 4 2.1 No Action Alternative ........................................................................... 4 2.2 Proposed Action .................................................................................... 4
3 Affected Environment and Environmental Consequences ................... 6 3.1 Required Resource Discussions ............................................................... 6
3.2 Affected Environment ........................................................................... 7 3.2.1 CVP Facilities ................................................................................. 7 3.2.2 SWP Facilities ................................................................................. 7
3.3 Environmental Consequences ............................................................... 9 3.3.1 Scope of Analysis ........................................................................... 9 3.3.2 Water Supply Effects .................................................................... 10 3.3.3 Socioeconomic Effects.................................................................. 17 3.3.4 Environmental Justice .................................................................. 19
4 Consultation and Coordination ............................................................. 21 4.1 Agencies Consulted ............................................................................ 21
References ............................................................................................................ 22
Appendix A. Temperature Analysis for COA Modeling Appendix B. Operational Analysis for COA Modeling

List of Acronyms and Abbreviations
Agreement Coordinated Operation Agreement CFR Code of Federal Regulations CVP Central Valley Project D-1485 California State Water Resources Control Board Water Right Decision 1485 D-1641 California State Water Resources Control Board Water Right Decision 1641 DCR 2015 DWR Delivery Capability Report Delta Sacramento–San Joaquin Delta Estuary DWR California Department of Water Resources EI Export to Inflow Ratio ESA Federal Endangered Species Act Metropolitan Metropolitan Water District of Southern California OMR Old and Middle River Index Projects Central Valley Project and State Water Project collectively Reclamation Bureau of Reclamation SJR IE San Joaquin River Inflow to Export Ratio SWP State Water Project SWRCB California State Water Resources Control Board TAF thousand acre-feet

1
1 Introduction The United States and the State of California approved and built systems of water conservation and water delivery facilities in the Central Valley, known as the Central Valley Project (CVP) and State Water Project (SWP) (Projects), to serve multiple purposes, including to protect from floods and to deliver water to affected water rights holders and Project contractors. These provide significant public safety and economic benefits to citizens of the State and United States. The Bureau of Reclamation (Reclamation) and California Department of Water Resources (DWR) operate these facilities pursuant to existing water rights. Those water rights include conditions imposed by the State Water Resources Control Board (SWRCB) to protect the beneficial uses of waters in the Sacramento–San Joaquin watershed and Bay-Delta Estuary. The United States and State recognized the need for criteria for the coordinated operation of the CVP and SWP and entered into an initial agreement in 1960 for such coordination. Pursuant to the 1960 agreement, Reclamation and DWR developed and signed a more detailed operations agreement, the “Agreement Between the United States of America and the State of California for Coordinated Operation of the Central Valley Project and the State Water Project” (Agreement) in 1986 (Reclamation and DWR 1986a). The United States Congress enacted Public Law 99-546, which authorized Reclamation to execute the Agreement. Under this Agreement, Reclamation and DWR established the terms by which they would use their respective water rights to ensure certain contractual and regulatory responsibilities were met, while maximizing Reclamation’s and DWR’s ability to operate the CVP and SWP to meet water right and contract obligations upstream of the Delta, Delta water quality and flow objectives, joint Delta water right requirements issued by the SWRCB, and CVP and SWP water right and contract obligations that depend upon diversions from the Delta.
1.1 Need for the Proposal
As part of the ongoing operation of the CVP and SWP facilities, implementation of the Agreement has continuously evolved since 1986 to monitor and adjust operation of the facilities to meet fluctuating conditions, additional regulatory responsibilities, and the overall physical and regulatory environment in which the coordination of CVP and SWP operations takes place. Since 1986, new facilities have been incorporated into the CVP and SWP that did not exist when the Agreement was signed. Since 1986, water quality objectives/standards and flow requirements have been adopted by SWRCB (including but not limited to Decision 1641 [D-1641]); the Central Valley Project Improvement Act has changed how the CVP is operated; and finally, restrictions imposed by biological opinions issued pursuant to Section 7 of the ESA have affected both CVP and SWP operations.
Both D-1641 and the ESA resulted in restrictions on the CVP and SWP which were not explicitly addressed in the 1986 Agreement and have not been addressed in a formal update to the Agreement. Since adopting the various updated regulations, water exports from the Delta during periods when export restrictions are in place have generally been shared equally between the projects.

2
The current Agreement includes an article (Article 14) regarding periodic review every 5 years (unless otherwise requested). Although there have been many informal discussions regarding the Agreement since 1986, formal review pursuant to Article 14 has not been completed since 1986. On June 1, 2016, Reclamation and DWR began review of the Agreement as prescribed in Article 14(a), for the purpose of determining if revisions to the Agreement were warranted. The process was initiated following a series of preliminary meetings that were conducted since August 2015. From June 2016 through July 2018, numerous meetings were held, which also included CVP and SWP contractors. This process did not lead to mutual agreement on revisions, and in August 2018 Reclamation issued a Notice of Negotiation pursuant to Article 14(b)(2) of the Agreement.
Reclamation and DWR subsequently met and reviewed the unresolved issues and potential benefits of alternative approaches. Reclamation and DWR recognize that both agencies have similar interests, including providing for the public’s safety and economic well-being in an environmentally sound manner. As highlighted in the Agreement, both agencies are dedicated to continued utilization of the Project facilities to provide the maximum benefit to the people of the State and nation through the coordinated operation of the Projects. Based on these principles, Reclamation and DWR developed a proposal for amending the Agreement that recognizes the best interests of Reclamation and DWR, as well as all the inherent purposes served by ongoing operation of the CVP and SWP.
1.2 Description of the Agreement
The Agreement outlines operations of the CVP and SWP facilities and water supplies subject to coordinated operation at the time of execution, defines how Reclamation and DWR would coordinate operational procedures, identifies formulas for sharing joint responsibilities for meeting in-basin uses including Delta standards identified in Exhibit A to the Agreement (SWRCB Water Right Decision 1485 [D-1485]) and other legal uses of water, identifies how unstored flow will be shared, establishes a framework for exchange of water and services between the CVP and SWP, and provides for periodic review of the Agreement and processes to consider updating terms as specific conditions affecting ongoing operations change. DWR and Reclamation reached temporary operational arrangements since 1986 to address various conditions, which include buildout of Project facilities, changes in water quality standards/objectives and flow requirements, passage of the Central Valley Project Improvement Act, and requirements under the Federal Endangered Species Act (ESA), but the Agreement has not been amended to address these conditions.
Several of the key provisions of the Agreement are described below:
Sacramento Valley Inbasin Uses: Sacramento Valley Inbasin uses are defined in the Agreement as legal uses of water in the Sacramento Basin, including the water required under the SWRCB D-1485. The Agreement identifies a process to incorporate new Delta standards established by the SWRCB. Each project is obligated to ensure water is available for these uses, but the degree

3
of obligation is dependent on several factors and changes throughout the year, as described below:
Balanced Water Conditions: Balanced water conditions are defined in the Agreement as periods when it is mutually agreed that releases from upstream reservoirs plus unregulated flows approximately equals the water supply needed to meet Sacramento Valley in-basin uses plus exports. Excess water conditions are periods when it is mutually agreed that releases from upstream reservoirs plus unregulated flow exceed Sacramento Valley in-basin uses plus exports. Reclamation’s Central Valley Operations Office and DWR’s SWP Operations Control Office jointly decide when balanced or excess water conditions exist.
Excess Water Conditions: During excess water conditions, sufficient water is available to meet all beneficial needs, the CVP and SWP are not required to supplement the supply with additional releases, and unstored water is available at quantities that exceed the Projects’ physical or permitted export capacities. In excess water conditions, water accounting is not required and some of the excess water is available to CVP and SWP water contractors and users located upstream of the Delta. However, during balanced water conditions, CVP and SWP are sharing the responsibility to meet in-basin uses or are sharing the storage and export of unstored water which exceeds those in-basin uses.
Article 6 Sharing: When water must be withdrawn from reservoir storage to meet in-basin uses, 75 percent of the responsibility is borne by the CVP and 25 percent is borne by the SWP. When unstored water is available for export (i.e., Delta exports exceed storage withdrawals while balanced water conditions exist), the sum of CVP stored water, SWP stored water, and the unstored water for export is allocated 55/45 to the CVP and SWP, respectively. The percentages and ratios included in the Agreement were derived from negotiations between Reclamation and DWR and informed by analyses which assumed Delta standards and operating conditions that existed at the time of the Agreement. Reclamation and DWR have continued to apply these ratios as new SWRCB Delta water quality and flow standards are adopted.
4
2 Proposed Action and Alternatives 2.1 No Action Alternative
Reclamation and DWR would continue to follow the process defined in Article 14 of the Agreement. This would result in amendments to the Agreement other than those identified in the Proposed Action. There is a large degree of uncertainty in what the final amendment would include, given the differences in agency positions that led to the issuance of the Notice of Negotiations. As such, for evaluation purposes, the No Action Alternative was identified as a condition whereby the CVP and SWP would continue to operate per the Agreement without amendment or addendum. Obligations imposed on ongoing operations of the CVP and SWP since 1986 through D-1641 would continue to be met through temporary operations arrangements.
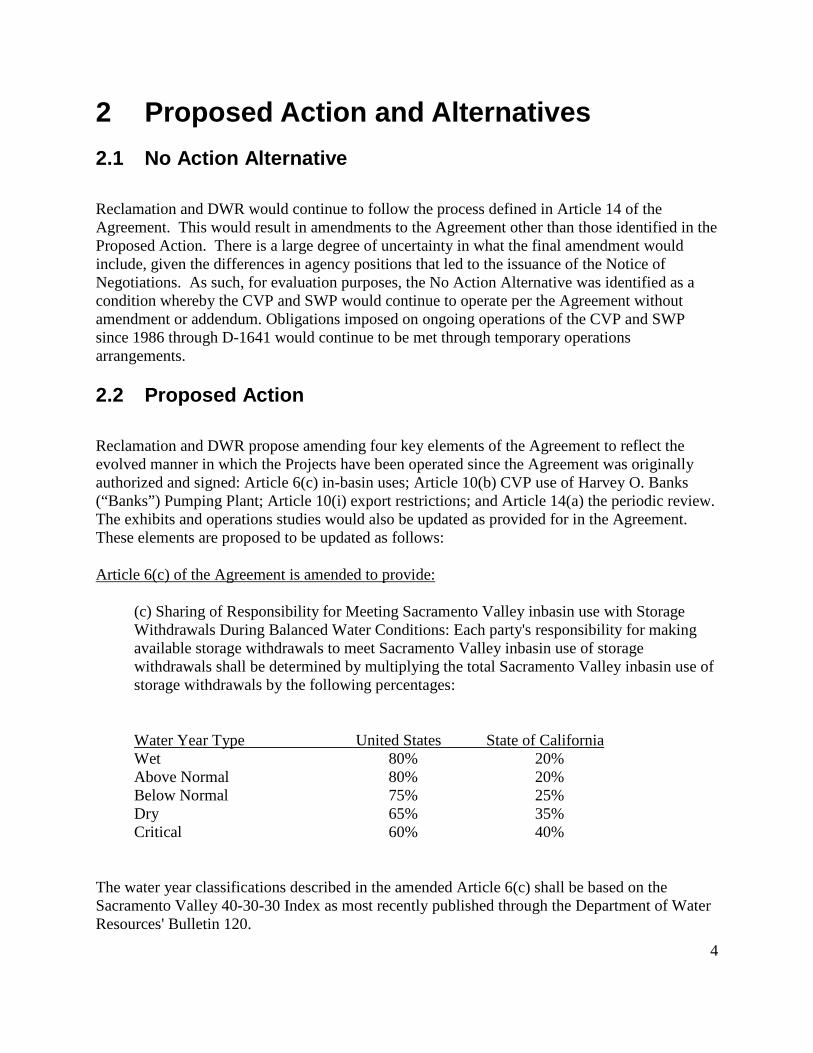
2.2 Proposed Action
Reclamation and DWR propose amending four key elements of the Agreement to reflect the evolved manner in which the Projects have been operated since the Agreement was originally authorized and signed: Article 6(c) in-basin uses; Article 10(b) CVP use of Harvey O. Banks (“Banks”) Pumping Plant; Article 10(i) export restrictions; and Article 14(a) the periodic review. The exhibits and operations studies would also be updated as provided for in the Agreement. These elements are proposed to be updated as follows:
Article 6(c) of the Agreement is amended to provide:
(c) Sharing of Responsibility for Meeting Sacramento Valley inbasin use with Storage Withdrawals During Balanced Water Conditions: Each party's responsibility for making available storage withdrawals to meet Sacramento Valley inbasin use of storage withdrawals shall be determined by multiplying the total Sacramento Valley inbasin use of storage withdrawals by the following percentages:
Water Year Type United States State of California Wet 80% 20% Above Normal 80% 20% Below Normal 75% 25% Dry 65% 35% Critical 60% 40%
The water year classifications described in the amended Article 6(c) shall be based on the Sacramento Valley 40-30-30 Index as most recently published through the Department of Water Resources' Bulletin 120.
5
In a Dry or Critical Year following two Dry or Critical Years, the United States and State will meet to discuss additional changes to the percentage sharing of responsibility to meet inbasin use.
Article 10(b) of the Agreement is amended to provide:
(b) The State will transport up to 195,000 acre-feet of Central Valley Project water through the California Aqueduct Reaches 1, 2A, and 2B no later than November 30 of each year by direct diversion or by rediversion of stored Central Valley Project water at times those diversions do not adversely affect the State Water Project purposes or do not conflict with State Water Project contract provisions. If the diversion capacity at the south Delta intake to Clifton Court Forebay is in excess of 7,180 cubic feet per second during the July 1 through September 30, the State will provide available capacity at the Banks Pumping Plant to the Central Valley Project to divert or redivert 195,000 acre-feet, except when the Delta is in Excess Water Conditions during July 1 through September 30, the diversion capacity at the south Delta intake to Clifton Court Forebay in excess of 7,180 cubic feet per second shall be shared equally by the State and the United States. This Article does not alter the Cross-Valley Canal contractors’ priority to pumping at the Harvey O. Banks Pumping Plant, as now stated in Revised Water Rights Decision 1641 (March 15, 2000).
Article 10(i) is added to the Agreement to provide:
(i) Sharing of Applicable Export Capacity When Exports are Constrained. During periods when exports are constrained by non-discretionary requirements imposed on the Central Valley Project and the State Water Project South Delta exports by any federal or state agency, allowable applicable export capacity shall be shared by the following percentages:
United States State of California
Balanced Water Conditions 65% 35%
Excess Water Conditions 60% 40%
Sharing of applicable export capacity during Balanced Water Conditions shall be considered a first right of refusal for the United States to use up to 65% of allowable export capacity after dividing any unstored water for export in accordance with 6(d).
Article 14(a) of the Agreement is amended to provide:
(a) Prior to December 31 of the fifth full year following execution of this agreement, and before-December 31 of each fifth year thereafter, or within 365 days of the implementation of new or revised requirements imposed jointly on Central Valley Project and State Water Project operations by any federal or state agency, or prior to initiation of operation of a new or significantly modified facility of the United States or the State or more frequently if so requested by either party, the United States and the
6
State jointly shall review the operations of both projects. The parties shall (1) compare the relative success which each party has had in meeting its objectives, (2) review operation studies supporting this agreement, including, but not limited to, the assumptions contained therein, and (3) assess the influence of the factors and procedures of Article 6 in meeting each party's future objectives. The parties shall agree upon revisions, if any, of the factors and procedures in Article 6, Exhibits Band D, and the Operation Study used to develop Exhibit B.
In addition to the amended articles presented above, pursuant to Article 11, Exhibit A will be updated to conform with Delta standards established by the State Water Resources Control Board in the 1995 Water Quality Control Plan for the San Francisco Bay/Sacramento-San Joaquin Delta Estuary as implemented by D-1641. Exhibit B shall also be updated based on a joint operations study of the amendments as agreed to, which identifies nondiscretionary requirements imposed on the Central Valley Project and State Water Project by any federal or state agency.
3 Affected Environment and Environmental Consequences
3.1 Required Resource Discussions
Executive Order, Department of the Interior regulations, and Bureau of Reclamation policy requires a discussion of the following:
• Indian Sacred Sites: The Proposed Action is not on federal lands and will neither affect nor prohibit access to any ceremonial use of Indian sacred sites.
• Indian Trust Assets: While there are myriad Indian Trust Assets within the Central Valley Project boundaries, the contemplated addendum to the coordinated operating agreement would be limited to adjustments regarding ongoing operation of the Projects and how the two projects meet the inbasin needs as defined in the Agreement. As such, the anticipated amendments to the Agreement would be limited to contract supplies South of the Delta for both the CVP and SWP, and there would be no effects to Indian Trust Assets.
• Cultural Resources: The Proposed Action is limited to amending certain elements of the Agreement between Reclamation and DWR related to operational responsibilities within existing CVP and SWP facilities and service areas. Approval of the addendum constitutes an undertaking that has no potential to cause effects on historic properties, pursuant to 36 CFR § 800.3(a)(1), and would result in no effects to cultural resources. Reclamation has no further obligations under 54 U.S.C. § 306108, commonly known as Section 106 of the National Historic Preservation Act, related to the Proposed Action.

7
• Environmental Justice: Discussions of environmental justice are required in all environmental documentation as provided in Executive Order 12898; these considerations are discussed within the Environmental Consequences section.
3.2 Affected Environment
The project area boundaries are defined by CVP facilities and service areas; and the SWP facilities and service areas, as shown in Figure 1.
3.2.1 CVP Facilities
The CVP facilities affected by the proposed amendments to the Agreement are reservoirs on the Trinity, Sacramento, and American Rivers and associated distribution facilities; Mendota Pool on the San Joaquin River; the Jones Pumping Plant; the Delta-Mendota and San Luis Canal; San Luis Reservoir; the San Felipe Division; and the CVP service area that relies upon water from these facilities.
Stored water in CVP Reservoirs North of the Delta is provided to the Delta for delivery through the Contra Costa Canal and Jones Pumping Plant. The Contra Costa Canal originates at Rock Slough near Oakley and extends to the Martinez Reservoir. Water from the Contra Costa Canal is delivered to the Contra Costa Water District. The Jones Pumping Plant at the southern end of the Delta lifts the water into the Delta Mendota Canal delivering water to CVP contractors, who divert water directly from the Delta-Mendota Canal, and to San Joaquin River exchange contractors who also divert directly from the San Joaquin River and the Mendota Pool. In addition, CVP water is conveyed to the San Luis Reservoir for storage and subsequent delivery to CVP contractors through the San Luis Canal and the Delta-Mendota Canal. From San Luis Reservoir, water is conveyed through the Pacheco Tunnel to CVP contractors in Santa Clara and San Benito counties.
3.2.2 SWP Facilities
The SWP facilities that would be affected by amending the Agreement are Lake Oroville on the Feather River; rivers, streams, canals, and aqueducts used to convey SWP water; and the SWP service area that relies upon water from these reservoirs, specifically: Lake Oroville on the Feather River; the Banks Pumping Plant in the southern Delta; the North Bay Aqueduct; the South Bay Aqueduct; California Aqueduct; SWP reservoirs including Lake Del Valle, San Luis Reservoir, and Pyramid, Castaic, Silverwood, and Perris Lake; the SWP service areas in the Sacramento and San Joaquin Valleys, in the San Francisco Bay Area, the Central Coast region, and the Southern California regions.

8
Figure 1 - Central Valley Project and State Water Project Facilities and Service Areas
9
3.3 Environmental Consequences
3.3.1 Scope of Analysis
CalSim II modeling results for amendments to the sharing formula are reflected in water storage and release patterns for the reservoirs associated with the CVP and SWP North of the Delta. The most notable differences are to reservoir elevations and release rates in varying year types. These amendments are also carried into the Delta, and differences in pumping rates at Jones Pumping Plant and Banks Pumping Plant.
“The essence of coordinated operations is the sharing formula, not the water supply figures in Exhibit B-1. The projects are not to be operated to meet predetermined yields, but rather to first meet the needs in the areas of origin, including the Delta water quality standards and flow requirements contained in Exhibit A.” (Reclamation and DWR 1986b, S-2). In order to determine effects to operations from adjusting the sharing formula and water sharing agreement contained in Articles 6 and 10, Reclamation and DWR updated the CalSim II model and simulated 82 years of hydrology to ascertain how the adjustments might affect the Projects’ ability to store and deliver water. Because reservoir storage can affect the release temperature and the volume of water available for instream flows below the dams, additional temperature models were used to determine whether meeting temperature criteria as provided in the current biological opinions would be an issue. No appreciable difference in temperature management is shown in the modeling. Therefore, no effect to downstream populations from reservoir storage changes is anticipated.
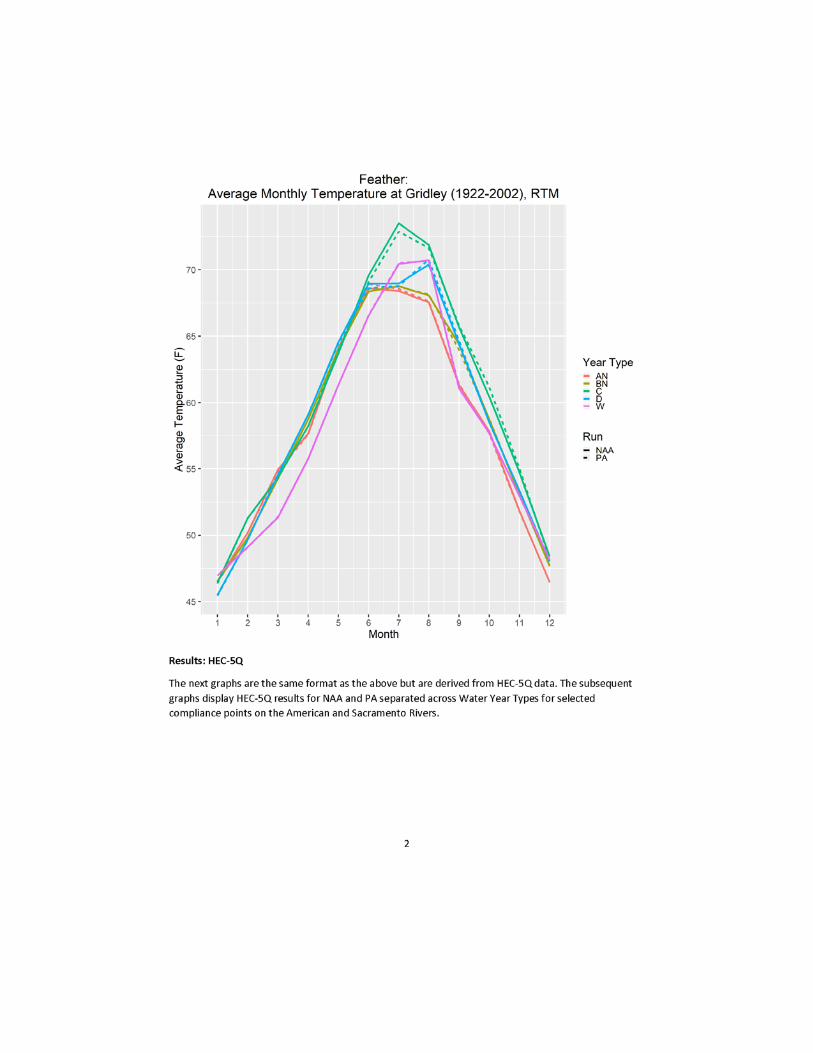
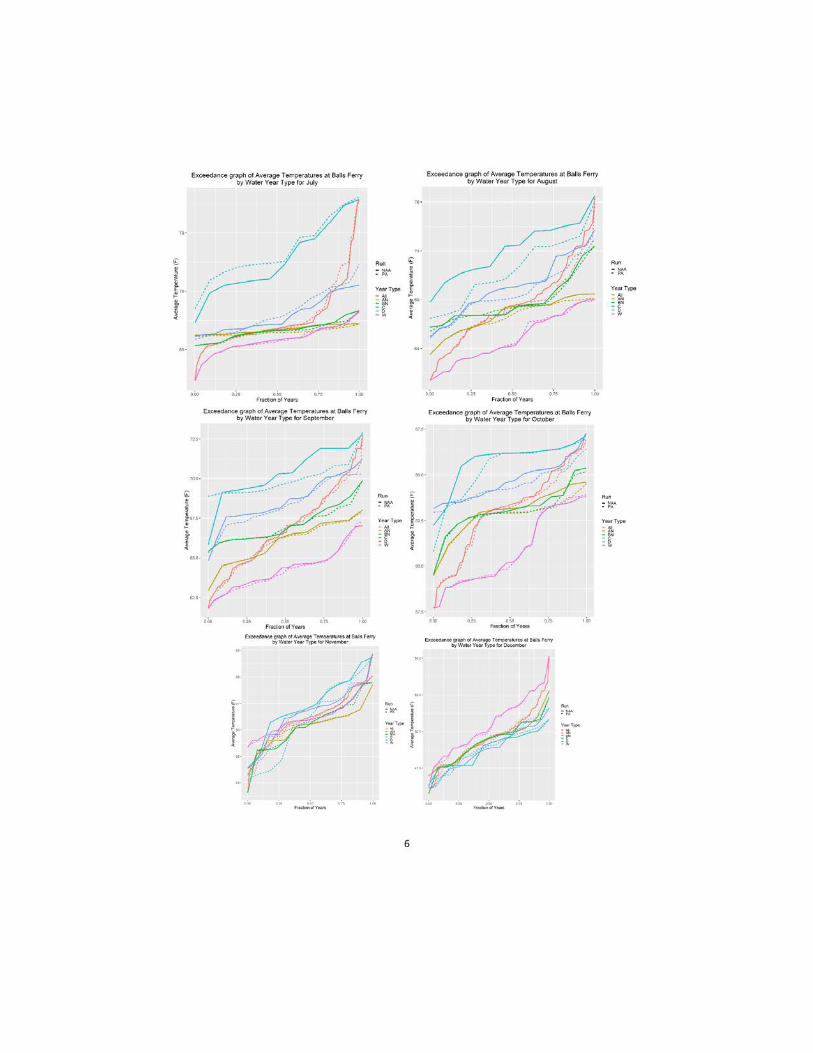
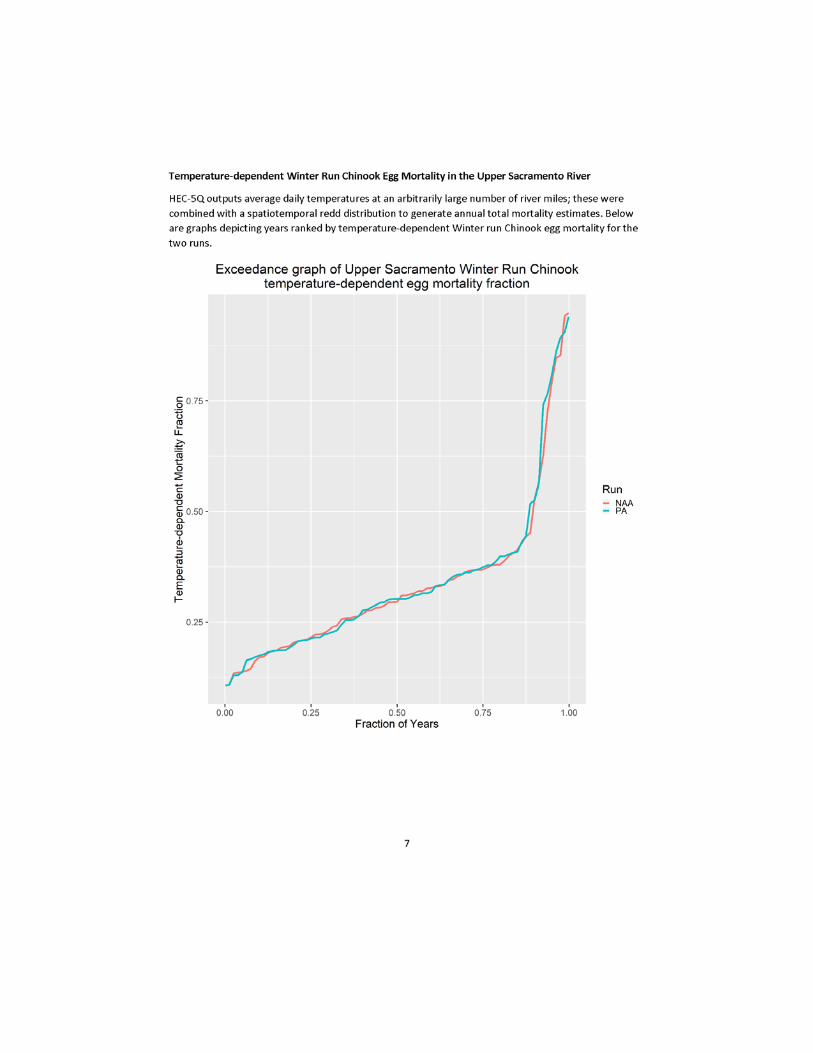
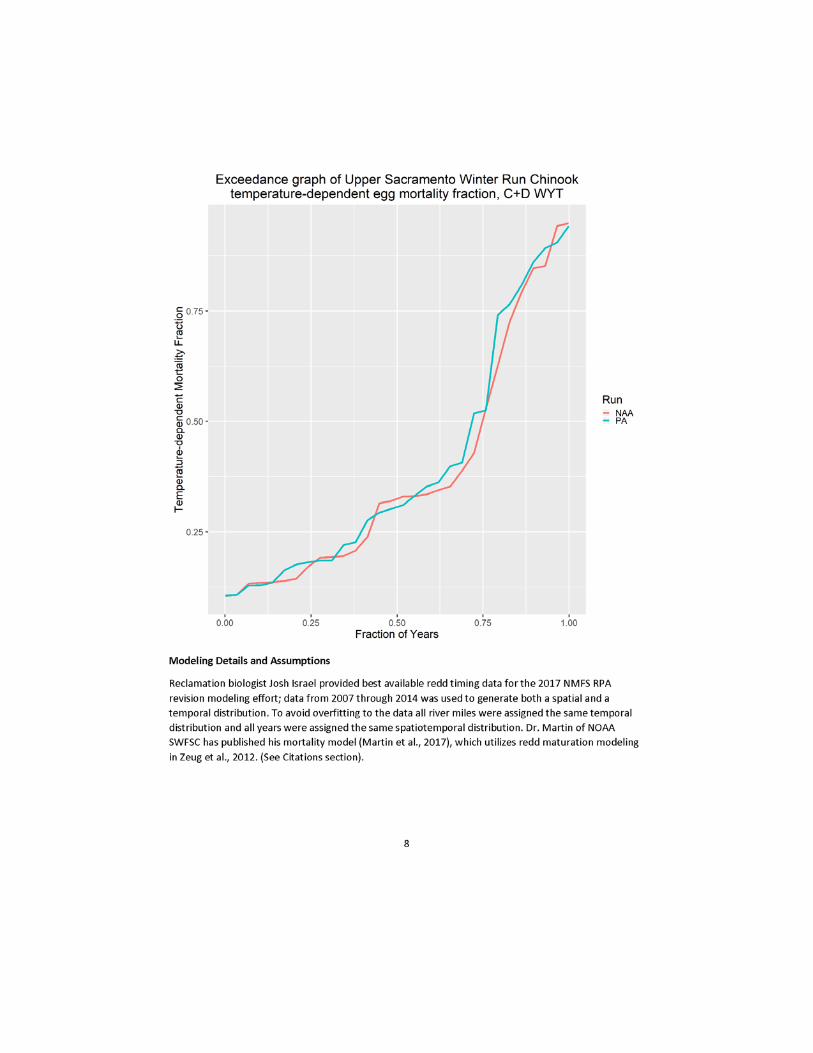
In addition, water temperature modeling on the Sacramento, Feather, and American rivers showed no appreciable difference at most times (Appendix A). The main difference shows up in critical water year types in the Sacramento River. The effects of water temperature in the Sacramento are evaluated on winter-run Chinook egg incubation, the most sensitive lifestage (i.e., lifestage requiring the coolest water). The egg mortality model, the “Martin Model” published by Dr. Martin of the National Oceanic and Atmospheric Administration Southwest Fisheries Science Center, integrates effects of water temperatures through the winter-run Chinook egg incubation period (May to October) and estimates effects to egg to fry survival attributable to water temperature. The egg mortality model results in general show no consistent appreciable difference between the alternatives. The real-time operations of Shasta in concert with the rest of the system place a focus on Shasta temperature control so that operational adjustments can be made daily as needed to best meet the temperature requirements of winter-run Chinook based on the best available science.
ESA listed salmonids, sturgeon, and delta smelt can become entrained and lost at the CVP and SWP delta pumping plants. Entrainment studies used for developing the loss equations at these facilities show that for each salmon salvaged at the CVP facility about 0.6 salmonid is lost and for each salmon salvaged at the SWP facility about four salmonids are lost. Therefore, water pumped at the CVP facility generally results in lower loss numbers (i.e., fewer fish predated upon or entrained past the salvage facility) than water pumped at the SWP, and shifting exports
10
through the Jones Pumping Plant rather than through Clifton Court Forebay may reduce take and benefit listed species.
Because the modeling indicates that effects to listed fish species in the Sacramento and American Rivers, and those that may be entrained at the pumps would be negligible or slightly beneficial, there is no further discussion of these resources.
The results from CalSim II modeling indicate that there would be changes in reservoir elevations, reservoir releases, and water supply delivery both North and South of the Delta that may affect water supply. For this reason, the discussion of effects is limited to water supply and socioeconomic effects associated with adjusting the sharing formula.
3.3.2 Water Supply Effects
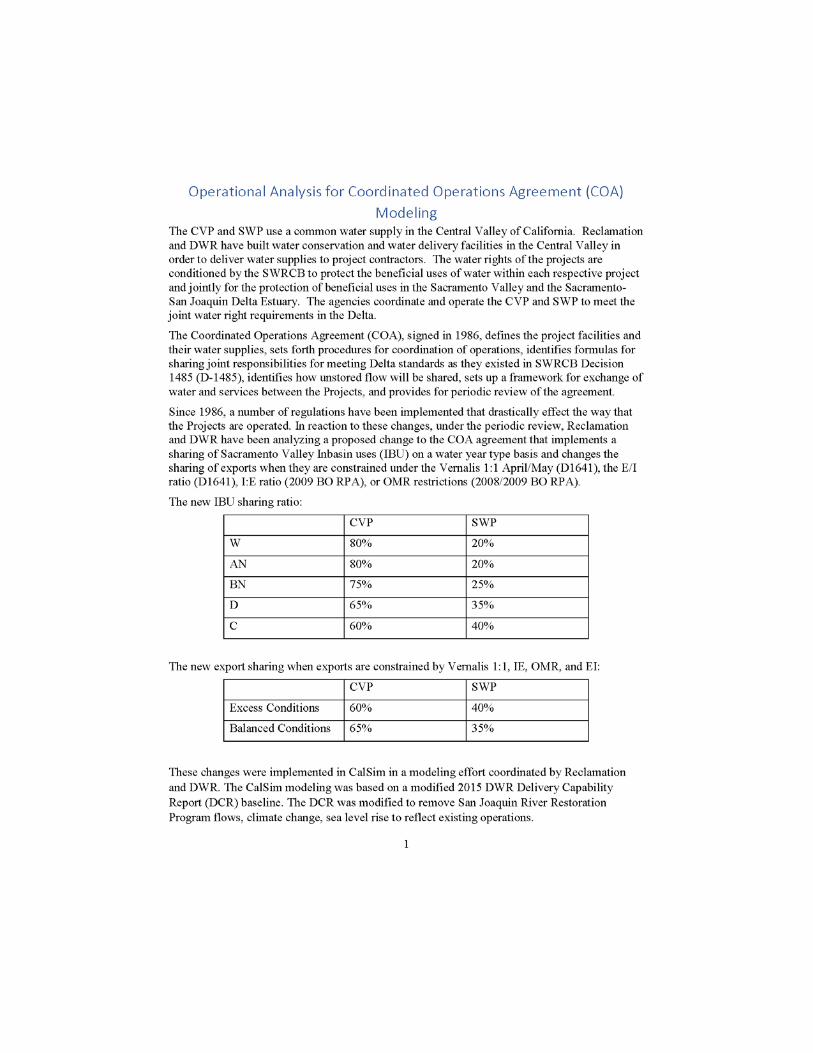
Since 1986, several regulations have been implemented that substantially affect the way the Projects are operated. In reaction to these fluctuating conditions, and as provided for in Article 14(a) regarding periodic review, Reclamation and DWR analyzed how implementing the proposed action would affect water delivery (Appendix A). CalSim II was used to simulate the relative difference in water delivery under the adjusted sharing formula. The analysis used the adjusted sharing formula, and the amended ratios for export sharing when exports are constrained by Vernalis 1:1 April/May (D-1641), SJR I:E ratio (2009 BO RPA), OMR restrictions (2008/2009 BO RPA), and E/I ratio (D-1641). The CalSim II modeling was based on an amended 2015 DWR Delivery Capability Report (DCR) baseline. The DCR was amended to remove San Joaquin River Restoration Program flows, climate change, and sea level rise to reflect existing operations.
The proposed action includes different sharing ratios based on the Sacramento River Index and assumptions in CalSim II were adjusted to reflect the water year types for the particular ratio. The water year types are implemented in February based on final historical water year types, which does not reflect the forecast uncertainties or changes between February and May, though rarely is the sharing formula implemented in the February to May period. The sharing of exports when constrained by E/I, SJR I:E, or OMR was implemented consistent with the proposed action. If either Project could not take their share of exports, the other Project may.
The following sections discuss how adjusting the inbasin and export sharing formulas as described in the proposed action would affect reservoir storage, meeting inbasin demand as indicated by the Projects’ ability to meet North of Delta deliveries, Delta outflow, and exports.
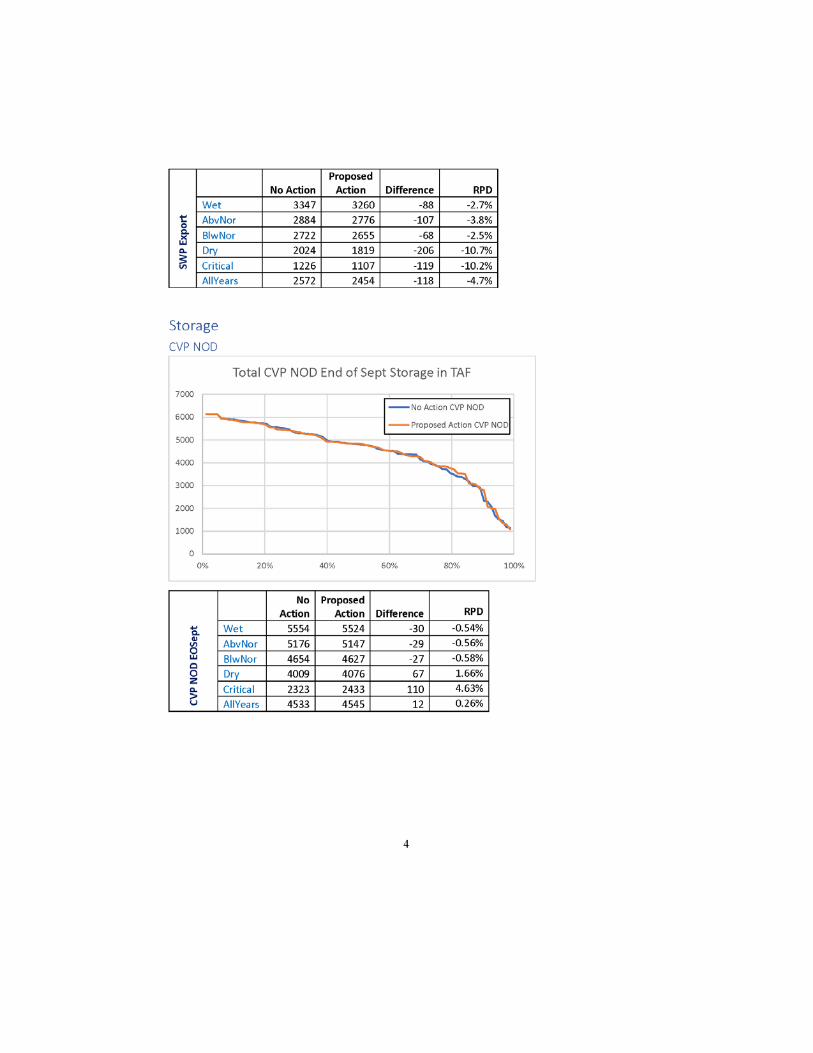
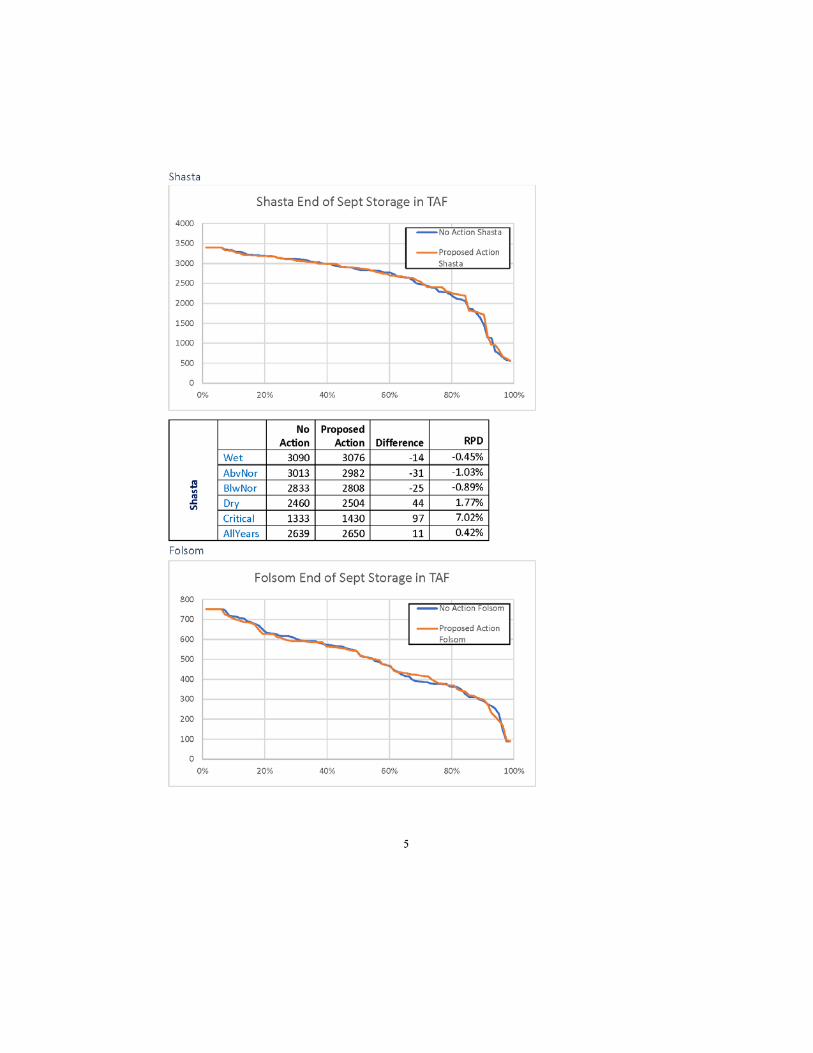
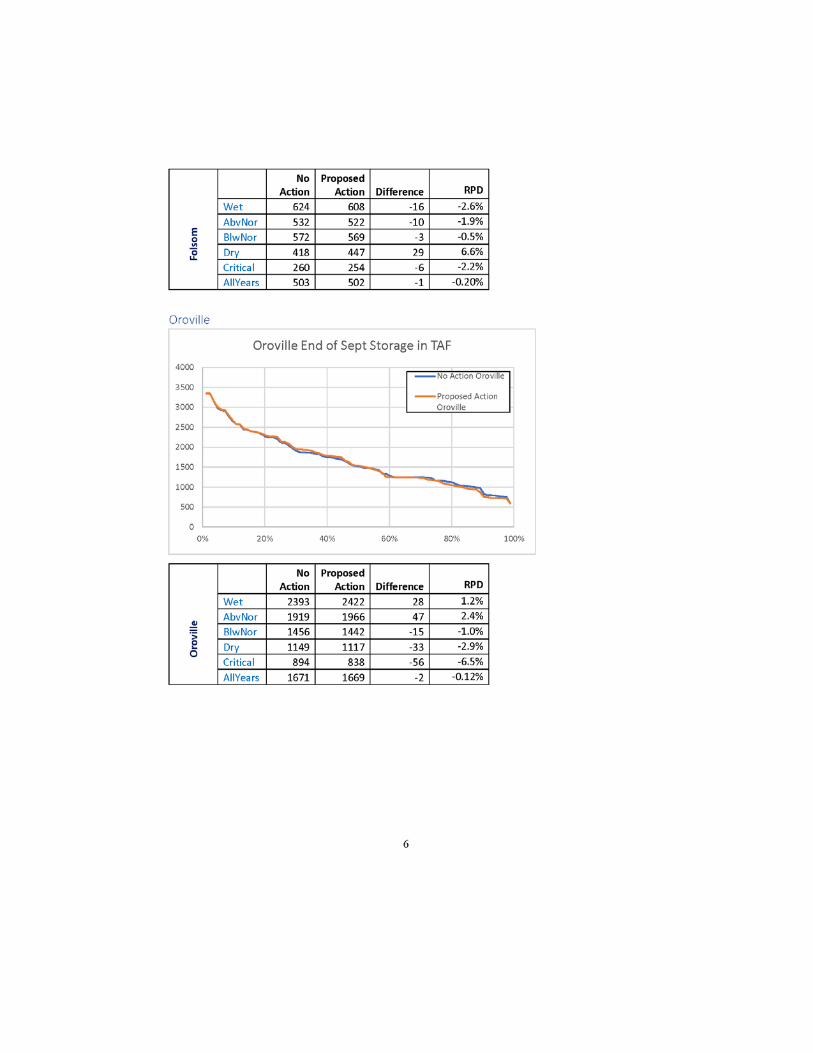
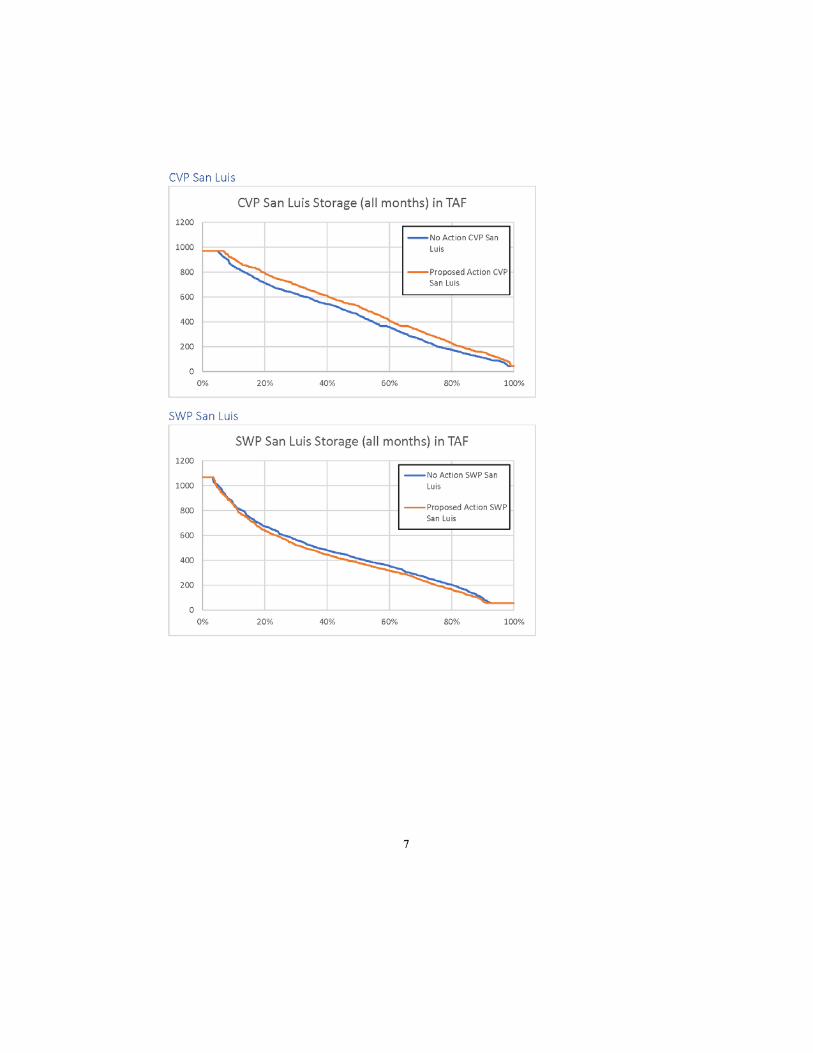
3.3.2.1 Reservoir Storage
Figures 2 and 3 indicate that the CVP and SWP end of September storage would be similar in Shasta, Folsom, Oroville, and Trinity reservoirs as with the current sharing formula. Figures 4 and 5 indicate that water stored in San Luis Reservoir would change in all months. With the proposed action, CVP storage would be higher in nearly all years, while SWP storage would be similarly reduced.

11
Figure 2 – Comparison of Shasta, Folsom, and Trinity Storage with and without the proposed action
Figure 3 – Comparison of Oroville Storage with and without the proposed action

12
Figure 4 – Comparison of CVP Water in Storage at San Luis Reservoir with and without the proposed action
Figure 5 - Comparison of SWP Water in Storage at San Luis Reservoir with and without the proposed action
3.3.2.2 North of Delta Delivery
Figures 6 and 7 indicate the CVP and SWP would be able to maintain deliveries to water contractors and settlement contractors north of the Delta, with slight differences in the various year types. The greatest differences are seen in the drier years for both CVP and SWP deliveries, with the CVP delivering slightly more water and the SWP delivering slightly less, with the proposed action. For the CVP, the magnitude of these differences is about one percent in all year types combined, with the largest relative percent difference of approximately 1.3% in critical years.

13
Figure 6 - Comparison of CVP deliveries North of the Delta with and without the proposed action
For the SWP, the difference for the proposed action in all year types is a reduction of 15 TAF/year, with a relative differnce of 1.2%. The largest difference in deliveries is seen in critical years, where the reduction in deliveries of 40 TAF/year would be a relative difference of about 4%.
Figure 7 - Comparison of SWP deliveries North of the Delta with and without the proposed action
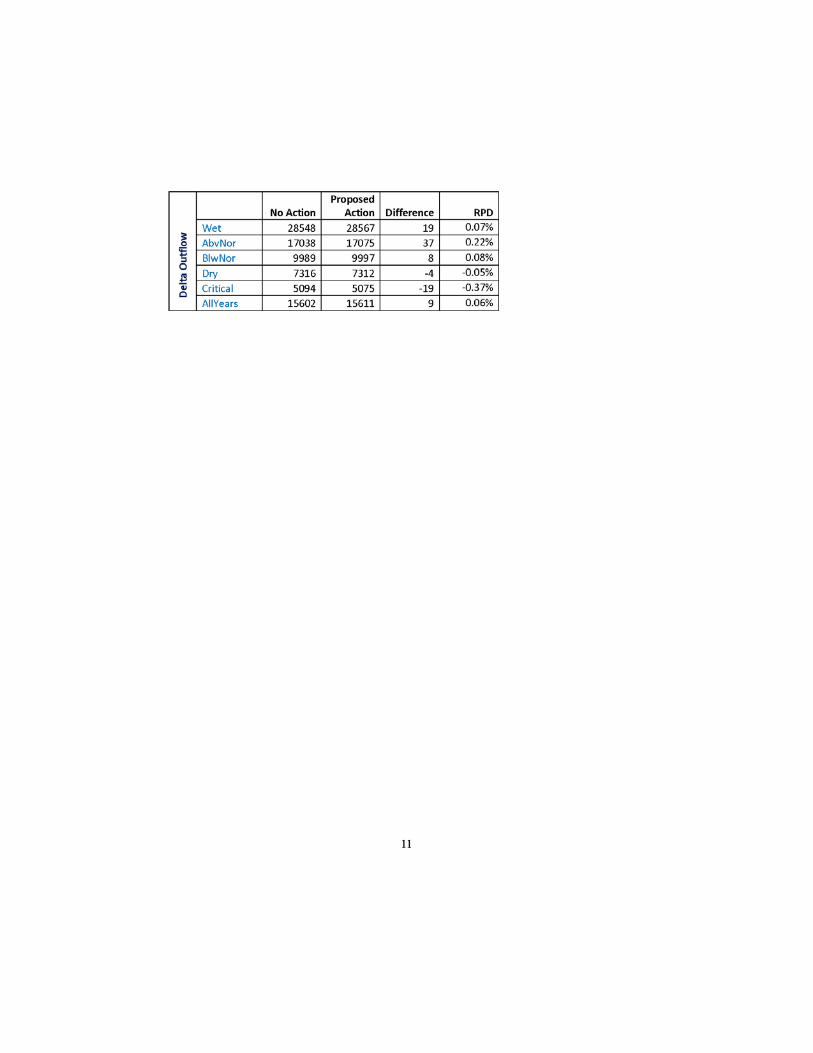
3.3.2.3 Delta Outflow
The following table indicates that the relative percent difference in Delta outflow would be on the order of four tenths of one percent in critical years to less than one tenth of one percent in wet

14
years. This indicates that the Projects would continue to meet outflow criteria designed to maintain acceptable salinity levels in the Delta as prescribed in D-1641, as well as outflow necessary for fisheries.
Table 1 – Difference in Total Delta Outflow in TAF/Year
No
Action Proposed
Action Difference
RPD
Delta
Out
flow
Wet 28548 28567 19 0.07 AbvNor 17038 17075 37 0.22 BlwNor 9989 9997 8 0.08 Dry 7316 7312 -4 -0.05 Critical 5094 5075 -19 -0.37 AllYears 15602 15611 9 0.06
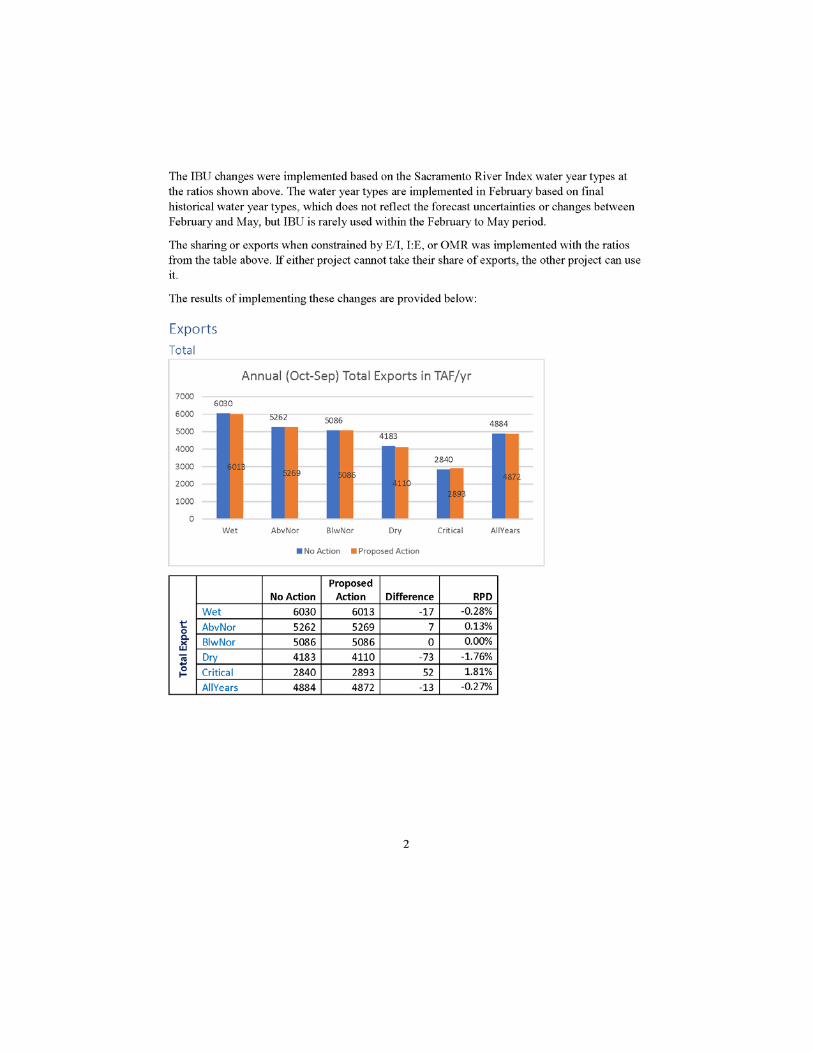
3.3.2.4 Exports
As indicated in Figure 8, the total water exported from the Delta at the Jones and Banks Pumping Plants is relatively unchanged. The greatest change is a decrease in exports South of the Delta in dry year types, though the relative difference is negligible when considering a 73 TAF reduction in total exports of 4,183 TAF. The greatest relative difference is an increase of about 1.8% in critical years.
Figure 8 - Comparison of total combined export for both the CVP and SWP with and without the proposed action
Figure 9 indicates an increase in South of Delta exports through the Jones Pumping Plant, while Figure 10 indicates a correlative decrease in exports through the Banks Pumping Plant.

15
Figure 9 - Comparison of total export for the CVP with and without the proposed action
Figure 10 - Comparison of total export for the SWP with and without the proposed action
Figure 11 displays a positive shift in water delivered to CVP Contractors South of the Delta. The largest change in delivery is an additional 122 TAF during dry year types, representing a relative difference of 5.8% for the proposed action. The largest relative difference is 6.6% in critical years for an additional 106 TAF of deliveries. Overall, the CVP would see an increase of about 95 TAF over all year types, with an associated relative increase of 4%.

16
Figure 11 - Comparison of CVP South of Delta delivery with and without the proposed action
By contrast, Figure 12 displays the associated reduction in South of Delta deliveries to SWP contractors. Averaged over all year types, the reduction in deliveries is approximately 113 TAF, with a relative difference of about 4.6%. The greatest reduction is 207 TAF in dry year types, representing a relative difference of about 10.3%. The greatest relative difference is in critical year types, where a 144 TAF reduction in deliveries to South of Delta contractors equates to a relative difference of 11.3%.
Figure 12 - Comparison of SWP South of Delta delivery with and without the proposed action
The shift in deliveries to the CVP and away from the SWP represents a reduction in water supplies from the Delta to the SWP contractors, and a gain in available water supply from the Delta for CVP contractors. Reductions in South of Delta deliveries to SWP contractors will be borne proportionately among those contractors through reductions in their Table A allocations.
17
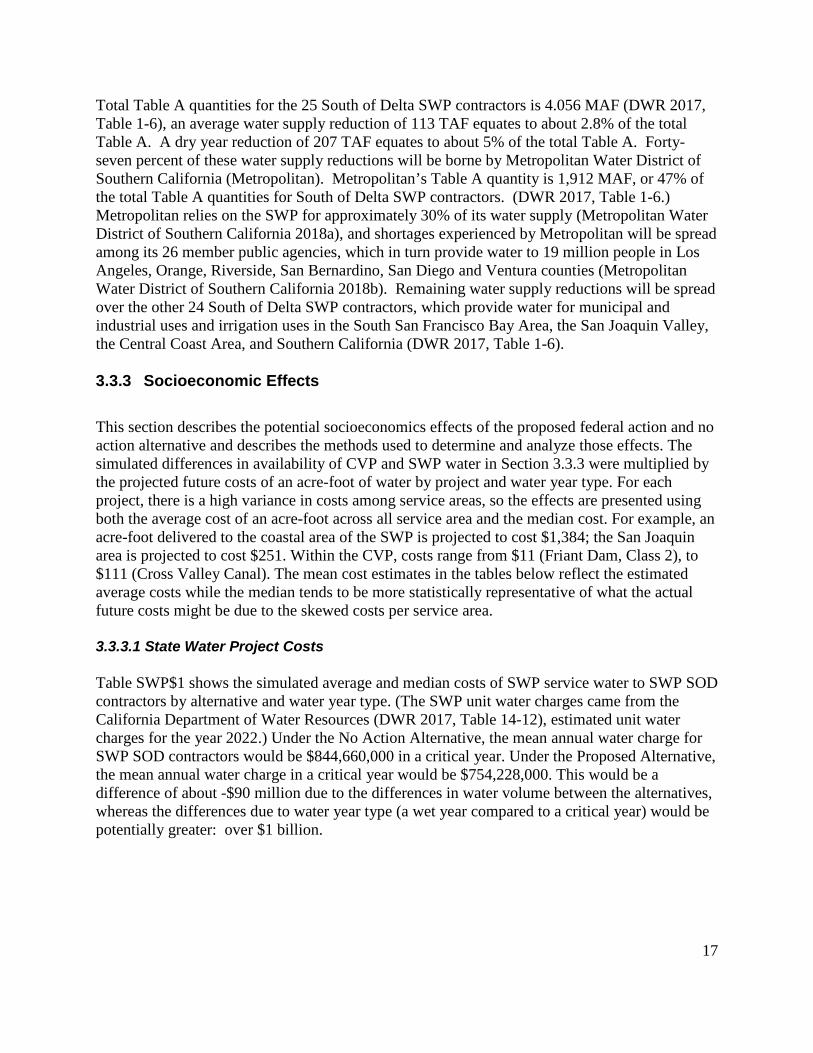
Total Table A quantities for the 25 South of Delta SWP contractors is 4.056 MAF (DWR 2017, Table 1-6), an average water supply reduction of 113 TAF equates to about 2.8% of the total Table A. A dry year reduction of 207 TAF equates to about 5% of the total Table A. Forty-seven percent of these water supply reductions will be borne by Metropolitan Water District of Southern California (Metropolitan). Metropolitan’s Table A quantity is 1,912 MAF, or 47% of the total Table A quantities for South of Delta SWP contractors. (DWR 2017, Table 1-6.) Metropolitan relies on the SWP for approximately 30% of its water supply (Metropolitan Water District of Southern California 2018a), and shortages experienced by Metropolitan will be spread among its 26 member public agencies, which in turn provide water to 19 million people in Los Angeles, Orange, Riverside, San Bernardino, San Diego and Ventura counties (Metropolitan Water District of Southern California 2018b). Remaining water supply reductions will be spread over the other 24 South of Delta SWP contractors, which provide water for municipal and industrial uses and irrigation uses in the South San Francisco Bay Area, the San Joaquin Valley, the Central Coast Area, and Southern California (DWR 2017, Table 1-6).
3.3.3 Socioeconomic Effects
This section describes the potential socioeconomics effects of the proposed federal action and no action alternative and describes the methods used to determine and analyze those effects. The simulated differences in availability of CVP and SWP water in Section 3.3.3 were multiplied by the projected future costs of an acre-foot of water by project and water year type. For each project, there is a high variance in costs among service areas, so the effects are presented using both the average cost of an acre-foot across all service area and the median cost. For example, an acre-foot delivered to the coastal area of the SWP is projected to cost $1,384; the San Joaquin area is projected to cost $251. Within the CVP, costs range from $11 (Friant Dam, Class 2), to $111 (Cross Valley Canal). The mean cost estimates in the tables below reflect the estimated average costs while the median tends to be more statistically representative of what the actual future costs might be due to the skewed costs per service area.
3.3.3.1 State Water Project Costs
Table SWP$1 shows the simulated average and median costs of SWP service water to SWP SOD contractors by alternative and water year type. (The SWP unit water charges came from the California Department of Water Resources (DWR 2017, Table 14-12), estimated unit water charges for the year 2022.) Under the No Action Alternative, the mean annual water charge for SWP SOD contractors would be $844,660,000 in a critical year. Under the Proposed Alternative, the mean annual water charge in a critical year would be $754,228,000. This would be a difference of about -$90 million due to the differences in water volume between the alternatives, whereas the differences due to water year type (a wet year compared to a critical year) would be potentially greater: over $1 billion.

18
Table SWP$1 Average and median estimated water charges for 2022 for SOD contractors (dollars per acre-foot per year)
Water Year Type
No Action $628/TAF/YR1 Average Cost
Proposal $628/TAF/YR Average Cost
No Action $438/TAF/YR2
Median Cost
Proposal $438/TAF-YR Median Cost
Wet $2,007,088 $1,976,944 $1,399,848 $1,378,824
Above normal $1,719,464 $1,661,688 $1,199,244 $1,158,948
Below normal $1,643,476 $1,578,164 $1,146,246 $1,100,694
Dry $1,327,592 $1,197,596 $925,932 $835,266
Critical $844,660 $754,228 $589,110 $526,038
All years $1,583,816 $1,512,852 $1,104,636 $1,055,142
Source: DWR 2017, Table 14-12. 1 $628 is mean water charges for 2022 from Table 14-12 (DWR 2017) for South Bay, Coastal, San Joaquin and Southern California areas. 2 $438 is the median water charges.
3.3.3.2 Central Valley Project Water Costs
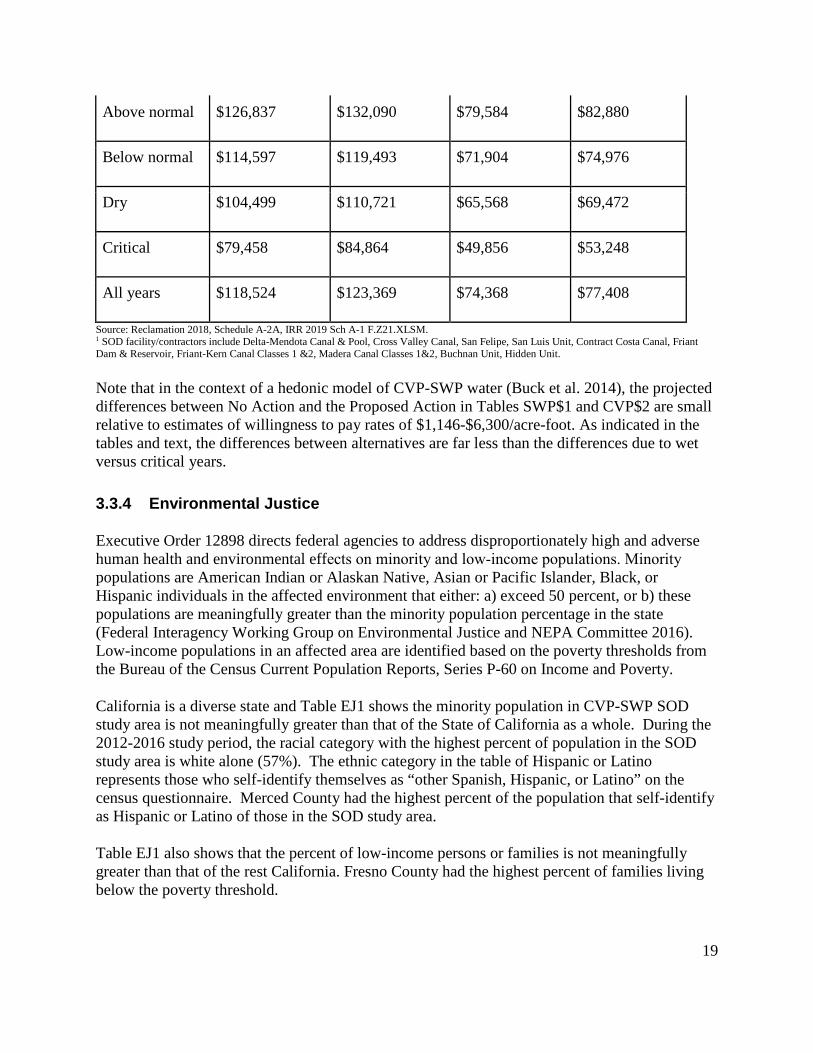
Table CVP$2 shows the simulated average and median costs of CVP service water to CVP SOD contractors by alternative and water year type. The CVP cost of service irrigation water rates came from Reclamation (2018) for the year 2019. Under the No Action Alternative, the mean annual water charge for CVP SOD contractors would be $79,458,000 in a critical year. Under the Proposed Action, the mean annual water charge would be $84,864,000 in a critical year, a difference of about $5 million. As shown in the table, the differences due to future water year types are far greater than the differences between alternatives.
Table CVP$2 Average and median estimated cost of water service rate for 2019 for SOD contractors (dollars per acre-foot per year)
Water Year Type
No Action $51/TAF/YR1
Average Cost
Proposal $51/TAF/YR Average Cost
No Action $32/TAF/YR1
Median Cost
Proposal $32/TAF-YR Median Cost
Wet $144,483 $147,951 $90,656 $92,832
19
Above normal $126,837 $132,090 $79,584 $82,880
Below normal $114,597 $119,493 $71,904 $74,976
Dry $104,499 $110,721 $65,568 $69,472
Critical $79,458 $84,864 $49,856 $53,248
All years $118,524 $123,369 $74,368 $77,408
Source: Reclamation 2018, Schedule A-2A, IRR 2019 Sch A-1 F.Z21.XLSM. 1 SOD facility/contractors include Delta-Mendota Canal & Pool, Cross Valley Canal, San Felipe, San Luis Unit, Contract Costa Canal, Friant Dam & Reservoir, Friant-Kern Canal Classes 1 &2, Madera Canal Classes 1&2, Buchnan Unit, Hidden Unit.
Note that in the context of a hedonic model of CVP-SWP water (Buck et al. 2014), the projected differences between No Action and the Proposed Action in Tables SWP$1 and CVP$2 are small relative to estimates of willingness to pay rates of $1,146-$6,300/acre-foot. As indicated in the tables and text, the differences between alternatives are far less than the differences due to wet versus critical years.
3.3.4 Environmental Justice
Executive Order 12898 directs federal agencies to address disproportionately high and adverse human health and environmental effects on minority and low‐income populations. Minority populations are American Indian or Alaskan Native, Asian or Pacific Islander, Black, or Hispanic individuals in the affected environment that either: a) exceed 50 percent, or b) these populations are meaningfully greater than the minority population percentage in the state (Federal Interagency Working Group on Environmental Justice and NEPA Committee 2016). Low-income populations in an affected area are identified based on the poverty thresholds from the Bureau of the Census Current Population Reports, Series P-60 on Income and Poverty.
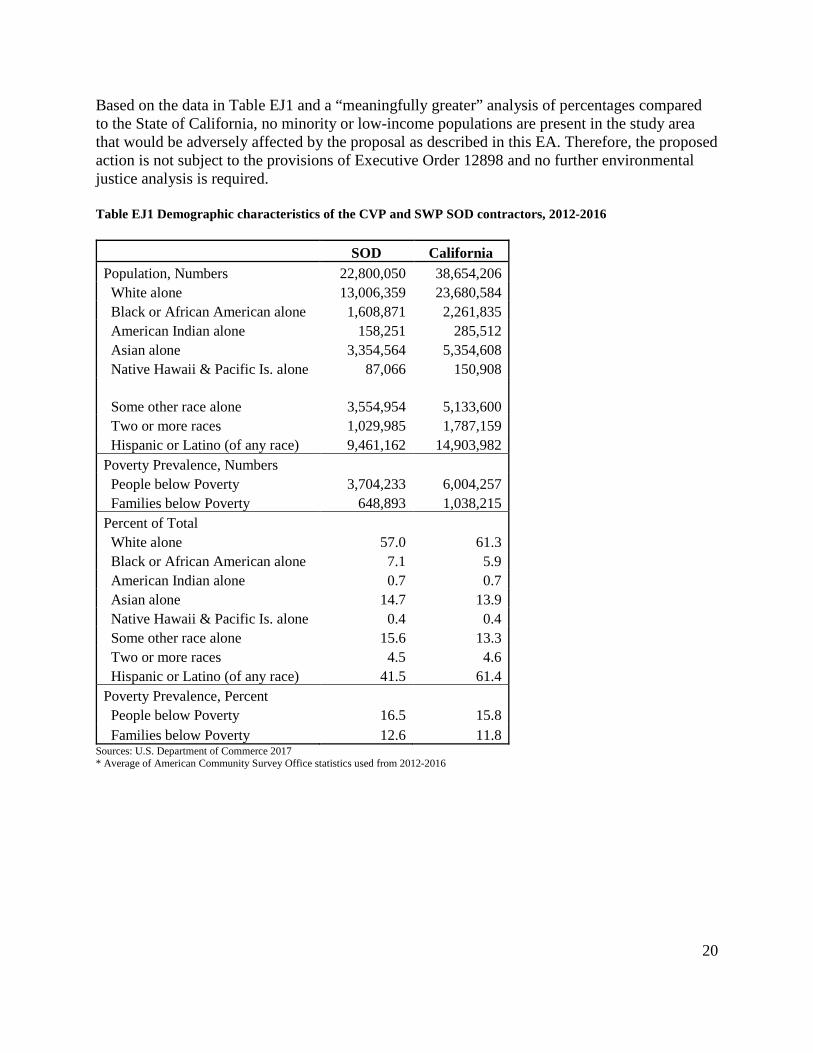
California is a diverse state and Table EJ1 shows the minority population in CVP-SWP SOD study area is not meaningfully greater than that of the State of California as a whole. During the 2012-2016 study period, the racial category with the highest percent of population in the SOD study area is white alone (57%). The ethnic category in the table of Hispanic or Latino represents those who self-identify themselves as “other Spanish, Hispanic, or Latino” on the census questionnaire. Merced County had the highest percent of the population that self-identify as Hispanic or Latino of those in the SOD study area.
Table EJ1 also shows that the percent of low-income persons or families is not meaningfully greater than that of the rest California. Fresno County had the highest percent of families living below the poverty threshold.
20
Based on the data in Table EJ1 and a “meaningfully greater” analysis of percentages compared to the State of California, no minority or low-income populations are present in the study area that would be adversely affected by the proposal as described in this EA. Therefore, the proposed action is not subject to the provisions of Executive Order 12898 and no further environmental justice analysis is required.
Table EJ1 Demographic characteristics of the CVP and SWP SOD contractors, 2012-2016
SOD California Population, Numbers 22,800,050 38,654,206 White alone 13,006,359 23,680,584 Black or African American alone 1,608,871 2,261,835 American Indian alone 158,251 285,512 Asian alone 3,354,564 5,354,608 Native Hawaii & Pacific Is. alone 87,066 150,908
Some other race alone 3,554,954 5,133,600 Two or more races 1,029,985 1,787,159 Hispanic or Latino (of any race) 9,461,162 14,903,982 Poverty Prevalence, Numbers
People below Poverty 3,704,233 6,004,257 Families below Poverty 648,893 1,038,215 Percent of Total White alone 57.0 61.3 Black or African American alone 7.1 5.9 American Indian alone 0.7 0.7 Asian alone 14.7 13.9 Native Hawaii & Pacific Is. alone 0.4 0.4 Some other race alone 15.6 13.3 Two or more races 4.5 4.6 Hispanic or Latino (of any race) 41.5 61.4 Poverty Prevalence, Percent
People below Poverty 16.5 15.8 Families below Poverty 12.6 11.8
Sources: U.S. Department of Commerce 2017 * Average of American Community Survey Office statistics used from 2012-2016

21
4 Consultation and Coordination 4.1 Agencies Consulted
Reclamation consulted with the following agencies in preparing this Environmental Assessment.
• California Department of Water Resources • CVP Contractors • SWP Contractors
22
References Buck, Steven, Maximilian Auffhammer, and David Sunding. 2014. Land Markets and the Value of Water: Hedonic Analysis using Repeat Sales of Farmland. American Journal of Agricultural Economics 96(4):953-969.
California Department of Water Resources. 2017. Management of the California State Water Project. Bulletin 132-2016. Access on line at: https://water.ca.gov/-/media/DWR-Website/Web-Pages/Programs/State-Water-Project/Management/Bulletin-132/Bulletin-132/Files/Bulletin-132-2016.pdf?la=en&hash=643A3CB873EE37480E42C
Federal Interagency Working Group on Environmental Justice and NEPA Committee. 2016. Promising Practices for EJ Methodologies in NEPA Reviews. Headwaters Economics. 2018. Economic Profile System. Accessed online at: https://headwaterseconomics.org/ eps.
Metropolitan Water District of Southern California. 2018a. About Your Water: Sources of Supply. Accessed online at: http://www.mwdh2o.com/AboutYourWater/Sources%20Of%20Supply/Pages/Imported.aspx#tabs-State_Water_Project_SWP
Metropolitan Water District of Southern California. 2018b. Who We Are: Overview & Mission. Accessed online at: http://www.mwdh2o.com/WhoWeAre/Mission/Pages/default.aspx
U.S. Department of Commerce, Census Bureau, American Community Survey Office. 2017. American Community Survey. Washington D.C. Accessed online at: http://factfinder.census.gov/faces/nav/jsf/pages/index.xhtml.
U.S. Bureau of Reclamation, Department of Water Resources. 1986a. Agreement Between the United States of America And The State of California For Coordinated Operation Of The Central Valley Project And The State Water Project. Accessed online at: https://archive.org/details/agreementbetween00wash/page/n5.
U.S. Bureau of Reclamation, Department of Water Resources. 1986b. Final Environmental Impact Statement/Report Coordinated Operation Agreement Central Valley Project/State Water Project.
U.S. Bureau of Reclamation, Mid-Pacific Region, Central Valley Project. 2018. Schedule of Irrigation Project Use Energy, Contract, Cost of Service and Full Cost Water Rates per Acre-foot by Contractor, 2019 Irrigation Water Rates. IRR 2019 Sch A-1 F.Z21.XLSM. Column Sch A-2A.

Appendix A. Temperature Analysis for COA Modeling


Appendix B. Operational Analysis for COA Modeling