addendum: population viability analysis for the … population viability analysis for the jaguar...
TRANSCRIPT

Addendum: Population Viability Analysis for the Jaguar (Panthera onca) in the Northwestern Range
Report prepared by
Philip S. Miller, Ph.D. Senior Program Officer
Conservation Breeding Specialist Group (SSC/IUCN)
Prepared for
U.S. Fish and Wildlife Service Arizona Ecological Services - Tucson
201 N. Bonita Avenue, Suite 141 Tucson, AZ 85745
Under Solicitation
F12PX00876
11 August, 2014

Miller – Addendum: PVA for Jaguar in the Northwestern Range 11 August, 2014

Miller – Addendum: PVA for Jaguar in the Northwestern Range 11 August, 2014
Page 1
Addendum: Population Viability Analysis for the Jaguar (Panthera onca) in the Northwestern Range
Philip S. Miller, Ph.D.
Senior Program Officer Conservation Breeding Specialist Group (SSC/IUCN)
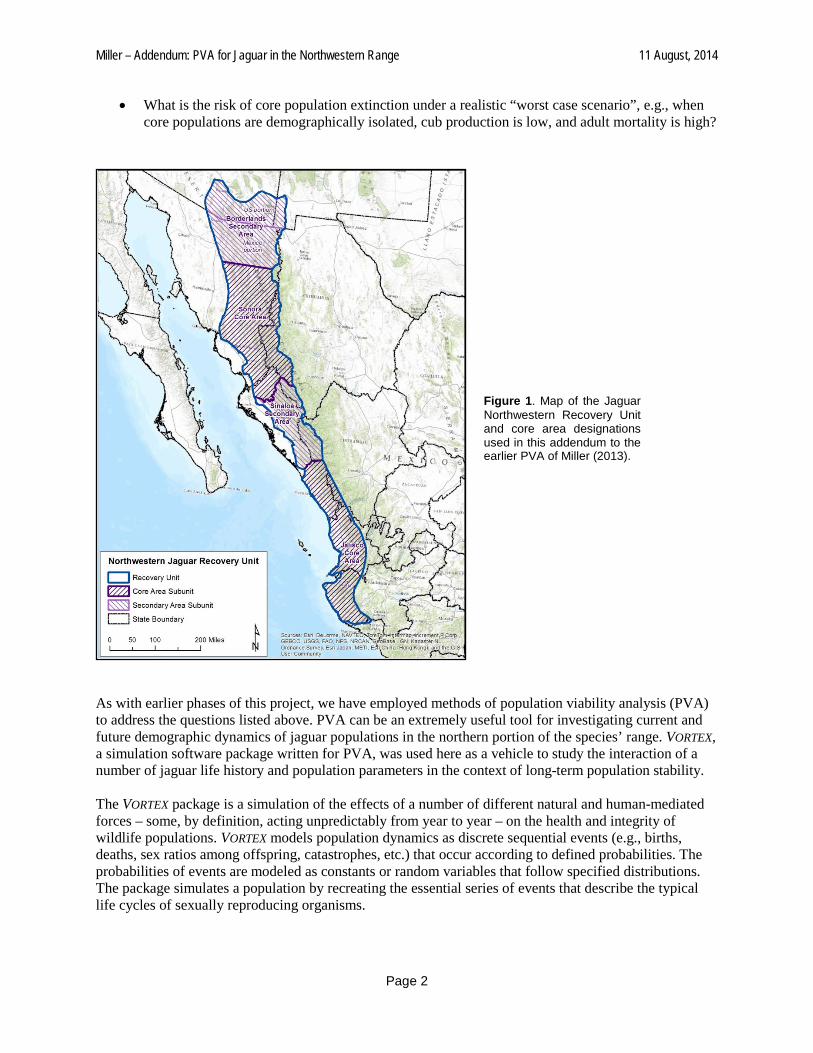
Introduction This document describes the structure, implementation, and interpretation of a new set of demographic simulations of jaguar population viability in the northwestern portion of the species’ range in northern Mexico. The new models were produced at the request of the United States Fish and Wildlife Service Jaguar Recovery Team in an effort to expand the original set of PVA simulations conducted and described by Miller (2013). Attention in these initial models was focused on the demographic viability of the metapopulation defined as the Northwestern Jaguar Recovery Unit, stretching northward from Jalisco at its southern boundary up to southeastern Arizona / southwestern New Mexico in the United States (Figure 1). Two components within this metapopulation contain relatively large jaguar populations, and serve as “core areas” for maintaining overall metapopulation stability. The Jalisco Core Area extends from the southern boundary of Jalisco to northern Nayarit and far western Durango. Farther north, the Sonora Core Area begins in northern Sinaloa and extends to north-central Sonora, including some habitat in far western Chihuahua. These two core areas serve as source populations, from which jaguars can disperse into neighboring “secondary areas” to, at least in theory, stabilize the demographic dynamics of the larger metapopulation and increase long-term viability. Results of analyses described in Miller (2013) suggest that the two core areas within the Northwestern Jaguar Recovery Unit are sufficiently large – both in terms of current abundance and estimated long-term habitat carrying capacity – to serve as effective source populations within the larger metapopulation. However, the analyses also demonstrated that changes in mortality of either cubs or adults could significantly reduce the growth potential of these core areas. This could, in turn, reduce the dispersal rate of individuals from these core areas to the neighboring secondary areas, thereby potentially comprising long-term viability of the metapopulation. The Sinaloa Secondary Area (Figure 1) might serve as a vital connection between the two core areas to maintain long-term demographic stability. In order to better understand this dynamic, a key element of the overall analysis is to explore the conditions under which the two jaguar populations currently occupying the core areas can survive on their own – in other words, assuming demographic isolation from neighboring subpopulations. Specifically, the analyses described in the addendum to Miller (2013) attempt to address the following questions:
• What are the critical levels of age-specific mortality that influence extinction risk in isolated core populations?
• Can we obtain rough estimates of the minimum viable population size of each core area? • What are the potential consequences to population viability if our current estimates of habitat-
specific carrying capacity are in error?
Miller – Addendum: PVA for Jaguar in the Northwestern Range 11 August, 2014
Page 2
• What is the risk of core population extinction under a realistic “worst case scenario”, e.g., when core populations are demographically isolated, cub production is low, and adult mortality is high?
As with earlier phases of this project, we have employed methods of population viability analysis (PVA) to address the questions listed above. PVA can be an extremely useful tool for investigating current and future demographic dynamics of jaguar populations in the northern portion of the species’ range. VORTEX, a simulation software package written for PVA, was used here as a vehicle to study the interaction of a number of jaguar life history and population parameters in the context of long-term population stability. The VORTEX package is a simulation of the effects of a number of different natural and human-mediated forces – some, by definition, acting unpredictably from year to year – on the health and integrity of wildlife populations. VORTEX models population dynamics as discrete sequential events (e.g., births, deaths, sex ratios among offspring, catastrophes, etc.) that occur according to defined probabilities. The probabilities of events are modeled as constants or random variables that follow specified distributions. The package simulates a population by recreating the essential series of events that describe the typical life cycles of sexually reproducing organisms.
Figure 1. Map of the Jaguar Northwestern Recovery Unit and core area designations used in this addendum to the earlier PVA of Miller (2013).

Miller – Addendum: PVA for Jaguar in the Northwestern Range 11 August, 2014
Page 3
PVA methodologies such as the VORTEX system are not intended to give absolute and accurate “answers” for what the future will bring for a given wildlife species or population. This limitation arises simply from two fundamental facts about the natural world: it is inherently unpredictable in its detailed behavior; and we will never fully understand its precise mechanics. Consequently, many researchers have cautioned against the exclusive use of absolute results from a PVA in order to promote specific management actions for threatened populations (e.g., Ludwig 1999; Beissinger and McCullough 2002; Reed et al. 2002; Ellner et al. 2002; Lotts et al. 2004). Instead, the true value of an analysis of this type lies in the assembly and critical analysis of the available information on the species and its ecology, and in the ability to compare the quantitative metrics of population performance that emerge from a suite of simulations, with each simulation representing a specific scenario and its inherent assumptions about the available data and a proposed method of population and/or landscape management. Interpretation of this type of output depends strongly upon our knowledge of jaguar biology, the environmental conditions affecting the species, and possible future changes in these conditions. The VORTEX system for conducting population viability analysis is a flexible and accessible tool that can be adapted to a wide variety of species types and life histories as the situation warrants. The program has been used around the world in both teaching and research applications and is a trusted method for assisting in the definition of practical wildlife management methodologies. For a more detailed explanation of VORTEX and its use in population viability analysis, refer to Lacy (2000) and Miller and Lacy (2005). Revised Input Parameters for Population Viability Simulation Models All of the models presented here use the baseline demographic input parameters described in detail in Miller (2013). Specific revisions to these parameters were made in order to create new models that address the questions outlined above. These revisions are discussed below. Initial population size
As defined in the original PVA effort, the population of jaguar in the Jalisco core area was set at 350 individuals, including approximately 206 adults (134 females, 72 males). This was used as an initial population size in our baseline model. To investigate the impact of reduced abundance on long-term population viability, a set of models was constructed where the initial population size was reduced proportionally at the start of the simulation, from 90% of the baseline value (N0 = 315) to 10% (N0 = 35). The proportional distribution of individuals across all age classes was adjusted accordingly. Because of the close similarity in both initial population size and carrying capacity (K; see below) between the Jalisco and the Sonora core areas, and because of the identical demographic rates used for each core area, the Sonora population is not explicitly modeled in this analysis. All models therefore use the initial population abundance and carrying capacity of the Jalisco core area, with the appropriate adjustments to N0 and K according to the needs of the given scenarios. These similarities allow us to confidently apply the general results of the Jalisco models to the Sonora core area. Carrying capacity
As described in detail by Miller (2013), habitat modeling conducted by staff of the Wildlife Conservation Society (WCS) was used to estimate the extent of available jaguar habitat within a given metapopulation unit and, by extension, the maximum number of individuals that habitat could support in the long-term. The most recent WCS habitat model, labeled Model 13 (2 August 2012), was used as the basis for estimating carrying capacity in the Jalisco core area at 2197 individuals, corresponding to 1318 adults
Miller – Addendum: PVA for Jaguar in the Northwestern Range 11 August, 2014
Page 4
based on the observation that a jaguar population reaching long-term abundance equilibrium (often referred to as a stable age distribution) typically is composed of 60% adults. To investigate the impact of incorrectly estimating carrying capacity – specifically, underestimating the value of the parameter – a set of models was constructed where the carrying capacity was reduced proportionally at the start of the simulation, from 90% of the baseline value (total K = 1977) to 30% (total K = 659). Each of these models featured an initial population size of 350 animals, and all mortality values were at their baseline values (see below). As with scenarios investigating the impact of varying the initial population size, the Sonora core area was not explicitly studied for sensitivity to carrying capacity estimation as the value for K in the Sonora core area (1873 animals) is very close to that estimate for the Jalisco core area (2197 animals). Age-specific mortality
The baseline survival rates used by Miller (2013), transformed from the corresponding mortality rates used by VORTEX, are given in Table 1. Models featured in this Addendum feature systematic changes to both adult and juvenile (cub, Age 0-1) mortality rates that may simulate lower survivorship through poaching, nuisance animal killing, and other activities arising in most instances from increased frequency of contact with local human populations. The modifications to first-year (cub) survival here represent effective changes in adult female reproductive output, or natality.
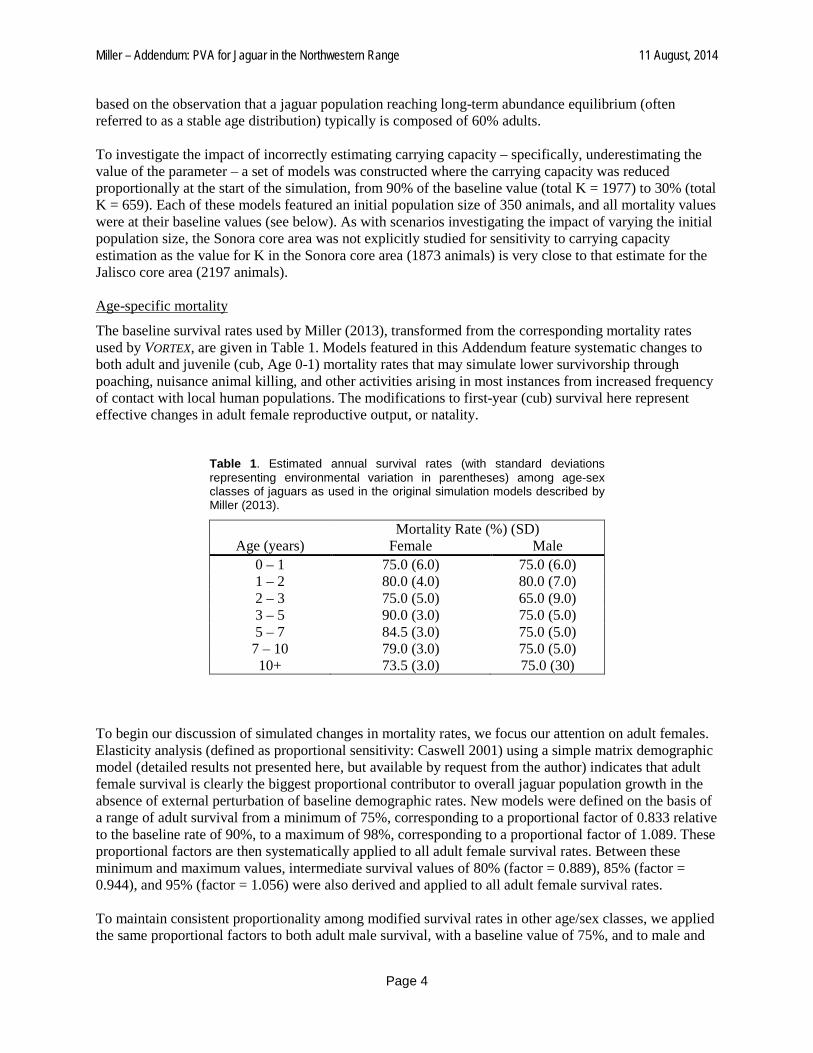
Table 1. Estimated annual survival rates (with standard deviations representing environmental variation in parentheses) among age-sex classes of jaguars as used in the original simulation models described by Miller (2013).
Mortality Rate (%) (SD) Age (years) Female Male
0 – 1 75.0 (6.0) 75.0 (6.0) 1 – 2 80.0 (4.0) 80.0 (7.0) 2 – 3 75.0 (5.0) 65.0 (9.0) 3 – 5 90.0 (3.0) 75.0 (5.0) 5 – 7 84.5 (3.0) 75.0 (5.0) 7 – 10 79.0 (3.0) 75.0 (5.0) 10+ 73.5 (3.0) 75.0 (30)
To begin our discussion of simulated changes in mortality rates, we focus our attention on adult females. Elasticity analysis (defined as proportional sensitivity: Caswell 2001) using a simple matrix demographic model (detailed results not presented here, but available by request from the author) indicates that adult female survival is clearly the biggest proportional contributor to overall jaguar population growth in the absence of external perturbation of baseline demographic rates. New models were defined on the basis of a range of adult survival from a minimum of 75%, corresponding to a proportional factor of 0.833 relative to the baseline rate of 90%, to a maximum of 98%, corresponding to a proportional factor of 1.089. These proportional factors are then systematically applied to all adult female survival rates. Between these minimum and maximum values, intermediate survival values of 80% (factor = 0.889), 85% (factor = 0.944), and 95% (factor = 1.056) were also derived and applied to all adult female survival rates. To maintain consistent proportionality among modified survival rates in other age/sex classes, we applied the same proportional factors to both adult male survival, with a baseline value of 75%, and to male and

Miller – Addendum: PVA for Jaguar in the Northwestern Range 11 August, 2014
Page 5
female cub survival, also with a baseline value of 75%. The resulting array of survival values are summarized in Table 2.
Table 2. Range of survival rates defining scenarios developed for this addendum. Adult female survival rate is given only for the youngest adult class (Age 3-5 years) as defined in the original datasets summarized in Miller (2013). Survival rates for older adults are modified by applying the same multiplicative factor listed in the table. Values in bold represent the baseline values as listed in Table 1.
Adult Scenario Factor ♀ ♂ Cub Scenario Factor ♀, ♂ A1 0.833 75.0 62.5 C1 0.777 58.28 A2 0.889 80.0 66.68 C2 0.833 62.5 A3 0.944 85.0 70.8 C3 0.889 66.68 A4 1.000 90.0 75.0 C4 0.944 70.8 A5 1.056 95.0 79.2 C5 1.000 75.0 A6 1.089 98.0 81.68 C6 1.056 79.2
C7 1.089 81.68 C8 1.112 83.4
This set of adult and cub survival values can then be combined systematically to produce 48 unique model scenarios, e.g., A1C1, A3C6, A6C8, etc. that represent the full range of potential threats to individual jaguar survival. Iterations and years of projection
All population projections (scenarios) were simulated 1000 times, with each projection extending to 100 years. All simulations were conducted using VORTEX version 9.99b (May 2010) (Lacy et al. 2005; Miller and Lacy 2005). Note that while a more recent and substantially updated Version 10 of VORTEX is now available (Lacy and Pollak 2014), an older version of the software was used in the current analysis. This decision was made in order to provide continuity to the original analyses described in Miller (2013). The original version 9.99b remains a robust and reliable platform to evaluate the questions outlined in the Introduction. Results from Simulation Models1 Core population baseline model performance
The Jalisco core area baseline model showed a very slightly positive average rate of population growth, increasing at approximately 0.4% per year (Table 3). The baseline model resulted in a very low probability of population extinction across the 100 years of the simulation, and yielded a final population size of approximately 730 individuals. This model serves as a foundation upon which we can compare alternative models that explore variation in initial population size, carrying capacity, and cub/adult mortality and the impact of this variation on future jaguar core population viability in the Northwestern Recovery Unit. 1 As described on page 3 of this report, because of the close similarity in both initial population size and carrying capacity between the Jalisco and the Sonora core areas, and because of the identical demographic rates used for each core area, the Sonora core area population is not explicitly modeled in this analysis. These similarities allow us to confidently apply the general results of the Jalisco models to the Sonora core area.
Miller – Addendum: PVA for Jaguar in the Northwestern Range 11 August, 2014
Page 6
Impact of initial population size on core population extinction risk
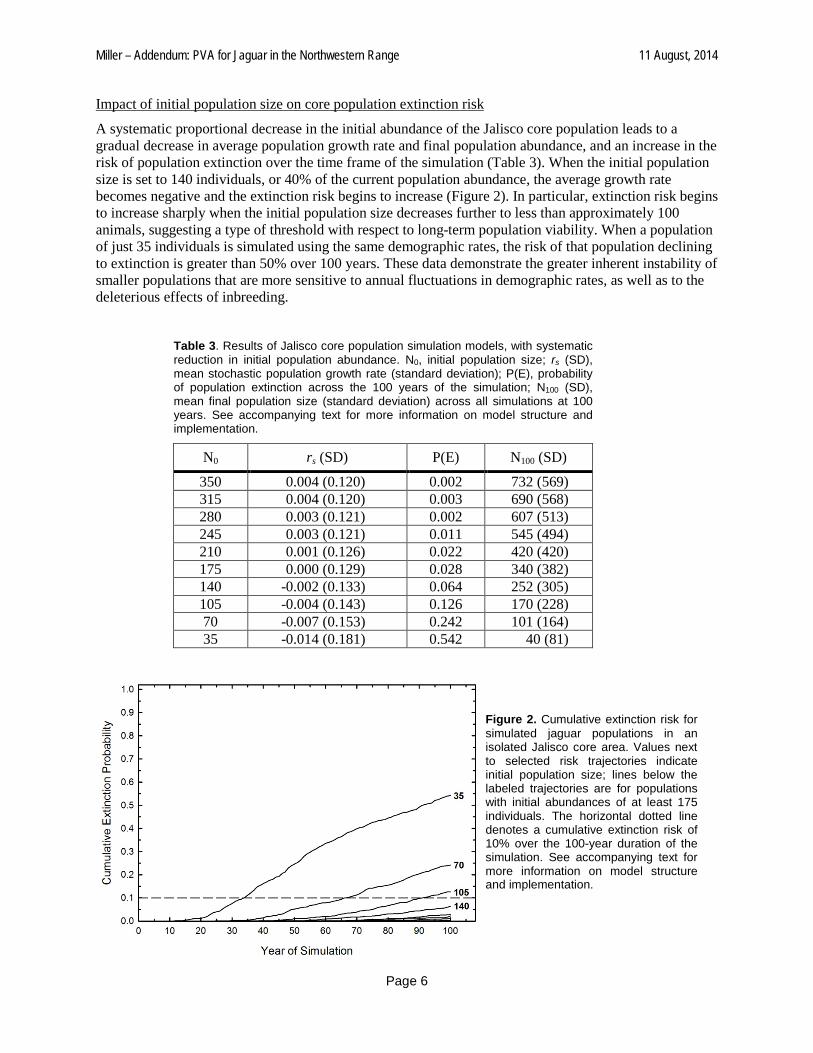
A systematic proportional decrease in the initial abundance of the Jalisco core population leads to a gradual decrease in average population growth rate and final population abundance, and an increase in the risk of population extinction over the time frame of the simulation (Table 3). When the initial population size is set to 140 individuals, or 40% of the current population abundance, the average growth rate becomes negative and the extinction risk begins to increase (Figure 2). In particular, extinction risk begins to increase sharply when the initial population size decreases further to less than approximately 100 animals, suggesting a type of threshold with respect to long-term population viability. When a population of just 35 individuals is simulated using the same demographic rates, the risk of that population declining to extinction is greater than 50% over 100 years. These data demonstrate the greater inherent instability of smaller populations that are more sensitive to annual fluctuations in demographic rates, as well as to the deleterious effects of inbreeding.
Table 3. Results of Jalisco core population simulation models, with systematic reduction in initial population abundance. N0, initial population size; rs (SD), mean stochastic population growth rate (standard deviation); P(E), probability of population extinction across the 100 years of the simulation; N100 (SD), mean final population size (standard deviation) across all simulations at 100 years. See accompanying text for more information on model structure and implementation.
N0 rs (SD) P(E) N100 (SD)
350 0.004 (0.120) 0.002 732 (569) 315 0.004 (0.120) 0.003 690 (568) 280 0.003 (0.121) 0.002 607 (513) 245 0.003 (0.121) 0.011 545 (494) 210 0.001 (0.126) 0.022 420 (420) 175 0.000 (0.129) 0.028 340 (382) 140 -0.002 (0.133) 0.064 252 (305) 105 -0.004 (0.143) 0.126 170 (228) 70 -0.007 (0.153) 0.242 101 (164) 35 -0.014 (0.181) 0.542 40 (81)
Figure 2. Cumulative extinction risk for simulated jaguar populations in an isolated Jalisco core area. Values next to selected risk trajectories indicate initial population size; lines below the labeled trajectories are for populations with initial abundances of at least 175 individuals. The horizontal dotted line denotes a cumulative extinction risk of 10% over the 100-year duration of the simulation. See accompanying text for more information on model structure and implementation.

Miller – Addendum: PVA for Jaguar in the Northwestern Range 11 August, 2014
Page 7
We can identify specific risk thresholds that define population viability in the context of species recovery. As an example of this process, Figure 3 highlights a 10% risk as a type of threshold that is exceeded for jaguar populations initiated with approximately 110-120 individuals or fewer (extrapolated from the existing trajectories). The choice of whether or not to adopt a particular threshold or its value is, of course, at the discretion of the individual species management group. Impact of carrying capacity uncertainty on core population extinction risk
As carrying capacity is systematically decreased in the set of models summarized in Table 4 and Figure 3, mean stochastic growth rate and mean final population size also decreases, but to a much smaller extent than those models just discussed where initial population size is modified. All carrying capacity scenarios – even one that includes a 70% decrease in the estimate of the parameter relative to the baseline value – yield a positive population growth rate and a very small extinction risk. Note that the three scenarios with the smallest carrying capacity values, just 30 – 50% of the baseline value, show a tendency toward population decline in later stages of the simulation. These are valid observations, despite the reported positive population growth rate; the early years of population growth are enough to offset the later years of slow population decline. Despite these (and other) statistical complications, it is clear that only very significant errors in carrying capacity lead to considerable change in long-term population dynamics of an isolated Jalisco core population. If the underlying growth rate of the population were expected to be higher than the current baseline value of 0.004, the differences most apparent in Figure 3 would be markedly smaller.
Table 4. Results of Jalisco core population simulation models, with systematic reduction in habitat carrying capacity. K, carrying capacity; rs (SD), mean stochastic population growth rate (standard deviation); P(E), probability of population extinction across the 100 years of the simulation; N100 (SD), mean final population size (standard deviation) across all simulations at 100 years. See accompanying text for more information on model structure and implementation.
K rs (SD) P(E) N100 (SD)
2197 0.004 (0.120) 0.002 732 (569) 1977 0.004 (0.120) 0.005 710 (525) 1758 0.004 (0.120) 0.001 698 (473) 1538 0.003 (0.120) 0.020 639 (411) 1318 0.004 (0.120) 0.000 626 (357) 1098 0.002 (0.120) 0.004 518 (292) 879 0.002 (0.121) 0.006 464 (238) 659 0.001 (0.121) 0.003 367 (292)

Miller – Addendum: PVA for Jaguar in the Northwestern Range 11 August, 2014
Page 8
Impact of cub and adult survival on core population viability
A total of 48 separate scenarios were constructed and simulated to help identify the survival conditions, applicable to both jaguar cubs and adults, which lead to favorable or unfavorable conditions for future population growth and stability. Our first look at the results of these simulations comes in the form of 3-dimensional surface plots of growth rate (Figure 4A) and extinction risk (Figure 4B) as a function of specific values for cub and adult survival across the range of values considered in this analysis (full tabular results of these analyses are found in Appendix A).
Figure 3. Mean abundance trajectories for simulated jaguar populations in an isolated Jalisco core area. Values next to selected risk trajectories indicate the carrying capacity for that specific scenario as a proportion of the original value (K = 2197individuals); lines above the labeled trajectories are for populations with carrying capacity values at least 60% of the baseline value. See accompanying text for more information on model structure and implementation.
Figure 4. 3D surfaces depicting jaguar population performance in an isolated Jalisco core area, as a function of both cub (juvenile) and adult annual survival rates. (A) Mean stochastic growth rate surface across the range of simulated mean survival rates. Horizontal plane indicates mean population growth of 0.0. Red dot indicates mean stochastic growth rate of baseline Jalisco core population model. (B) Extinction risk surface across the range of simulated mean survival rates. Horizontal plane identifies extinction risk of 0.1. Red dot indicates extinction risk of Jalisco core population model. See accompanying text for more information on model structure and implementation.
A B

Miller – Addendum: PVA for Jaguar in the Northwestern Range 11 August, 2014
Page 9
Inspection of Figure 4A indicates that, under the range of survival values studied here, a relatively narrow range of values leads to positive population growth. Under conditions of low cub production – specifically, when annual cub survival values hover around 60% – only very high adult female survival of about 95% leads to positive growth (the upper left-hand corner of the surface). Alternatively, when cub survival is increased to approximately 83%, adult female survival of approximately 85% is required to generate long-term positive population growth (intersection of right-hand back panel with surface). As a frame of reference, the growth rate emerging from our baseline model is indicated in Figure 4A by the red dot, hovering just above the gray plane indicating r = 0. This baseline condition is in part defined by adult annual female survival of 90% and cub survival of 75%. When either survival rate declines, the surface indicates that stochastic population growth rate is likely to quickly decrease to a negative value. Moreover, the surface indicates that the population growth rate declines more rapidly per unit reduction in adult female survival compared to an equivalent unit reduction in cub survival. Quantitatively, a change of 1% in adult survival results in a change of 0.005 – 0.006 in the population growth rate, while an equivalent change of 1% in cub survival results in a change of just 0.001 – 0.002 in growth rate. This is very consistent with the results of the elasticity analysis reported earlier (detailed data available from the author), where the proportional sensitivity of our model to changes in adult female survival was calculated as approximately five times greater than the same value for female cub survival. A similar picture emerges when examining the extinction risk surface (Figure 4B). As a frame of reference, the extinction risk emerging from our baseline model is indicated in the figure by the red dot, located below the gray plane indicating P(E) = 0.10. This baseline condition is in part defined by adult annual female survival of 90% and cub survival of 75%. The striking feature of this surface, however, is the abrupt transition from low to high extinction risk that results from relatively small changes in survival – particularly survival of adult females. For example, at the highest level of cub survival (corresponding to the front left-hand edge of the surface), the extinction risk is just 0.029 when adult female survival is 85% (growth rate rs = 0.026), but jumps to 0.662 when adult survival declines to 80% (growth rate rs = -0.005). Given an initial population abundance of 350 animals, corresponding to 134 adult females, this 5% increase in mortality equates to the additional loss of just 6-7 animals yearly. As expected, when cub survival is reduced to its minimum value of 58.28% (rear right-hand edge of surface), high extinction risk and low growth rates occur in the presence of much higher adult female survival rates: at 85% adult female survival, risk is 0.014 but increases to 0.583 when adult female survival decreases to 90%. As with examination of population growth rate, our simulated jaguar population is more sensitive with respect to extinction risk to changes in adult female survival, although the relationship is not quite as strong owing to the more stochastic nature of the extinction process. We can perhaps distill the somewhat complicated information presented in the 3D surfaces down to a simpler set of data that identifies those conditions that lead to positive or negative long-term growth, or to a risk of extinction greater or less than some arbitrary threshold value – in this case, 0.10. This 10% risk value is used frequently in deriving case-specific definitions of population viability in conservation planning exercises, usually over a 100-year timeframe, and forms the basis of the IUCN’s definition of a “Vulnerable” species according to the Red List global classification system for threatened species (IUCN 2012). Figure 5 is an attempt at providing the type of simplification mentioned above. Panel A shows the combination of approximate survival values that give rise to a stochastic growth rate of 0.0 – effectively, this line is equivalent to the intersection of the growth rate surface of Figure 4A with the horizontal plane defining rs = 0.0. As predicted, the threshold has a negative slope, meaning that as cub (juvenile) survival increases, the adult female survival rate necessary to confer positive growth decreases. Panel B shows the same general relationship for extinction risk, with the acceptable survival values decreased somewhat in accordance with the acceptable threshold risk being greater than zero.

Miller – Addendum: PVA for Jaguar in the Northwestern Range 11 August, 2014
Page 10
Conclusions We have created a new set of demographic simulation models, focusing on the Jalisco core area of the Northwestern Jaguar Recovery Unit. These models explore the long-term viability of this population under a variety of assumptions related to the size of the population, the habitat carrying capacity, and the demographic characteristics of the population, namely the rate of survival among cubs (juveniles) and adults. All of the model scenarios discussed above, and the underlying questions that formed the basis of this analysis (summarized below), address the fundamental desire among jaguar biologists and managers to explore and understand the sensitivity of extinction risk in Jalisco and Sonora core area populations to the assumption of demographic isolation. We can draw the following conclusions by revisiting the original questions that formed the basis of this latest effort.
• Can we obtain rough estimates of the minimum viable population size of each core area?
As explained above, the present analysis is focused only on the Jalisco core area as defined solely by its current abundance (350 individuals) and its habitat carrying capacity (2179 individuals). However, the close similarity in both current size and habitat carrying capacity to the Sonora core area, itself defined by N0 = 300 and K = 1873 individuals, means that the results obtained by analysis of the Jalisco core will be highly applicable to the Sonora area as well. Under our assumed conditions of the stochastic growth rate rs ≈ 0.0, an isolated core population of approximately 120 individuals – corresponding to an adult abundance of about 70-75 animals given the underlying demographic profile – appears to be the smallest population that persists with a sufficiently high probability, defined in this analysis as a 10% probability of population extinction over a 100-year timeframe. Due to the destabilizing effects of random variability in demographic rates and the deleterious impacts of inbreeding depression, smaller populations tend to decline in abundance over the long term, even if the mean expected demographic rates do not change over time. Since this abundance is defined in the context of the minimal conditions for
Figure 5. Plots identifying acceptable population outcomes for an isolated Jalisco core jaguar population, as a function of both cub (juvenile) and adult annual survival rates. (A) Mean stochastic growth rate plot across the range of simulated mean survival rates. Line indicates mean population growth of approximately 0.0. Black “X” symbol indicates mean stochastic growth rate of baseline Jalisco core population model. (B) Extinction risk plot across the range of simulated mean survival rates. Line identifies extinction risk of approximately 0.1. Black “X” symbol indicates extinction risk of Jalisco core population model. See accompanying text for more information on model structure and implementation.
A B

Miller – Addendum: PVA for Jaguar in the Northwestern Range 11 August, 2014
Page 11
long-term population growth, this could be considered a minimum viable population abundance for these populations, under the conditions simulated in this analysis. If survival within the population is more favorable, an abundance that confers long-term stability could perhaps be smaller. It is critically important to understand that deriving an estimate of a viable population abundance is critically dependent on its underlying demographic stability. If field research indicates that a given population is in long-term decline due to unsustainable demographics, no population will be large enough to overcome these deterministic threats to its survival. Dedicated research is required to better understand mean rates of birth and death, and the forces influencing those rates over the long term, before a true estimate of population viability can be estimated with confidence.
• What are the potential consequences to population viability if our current estimates of habitat-specific carrying capacity are in error?
In contrast to our analysis of initial population abundance, the impact of uncertainty in carrying capacity has a much smaller impact on long-term population viability projections. The true value for carrying capacity would have to considerably smaller – specifically, a reduction of perhaps as much as 60 – 70% of the current estimated value – for a significant effect to be manifest. While a detailed critique of the current estimation method for habitat carrying capacity in the Northwestern Jaguar Recovery Unit is far beyond the scope of this analysis, it may nevertheless be reasonable to argue that the extent of estimation error is not anywhere close to this magnitude. While the absolute value of long-term equilibrium abundance would likely change under a new carrying capacity, the associated estimate of long-term viability would likely not change appreciably.
• What are the critical levels of age-specific survival that influence extinction risk in isolated core populations?
Estimating a critical value of one demographic parameter must always be done in the context of the underlying values of other parameters defining the growth potential of the population under analysis. The case of jaguars in the Jalisco core area, serving also in this analysis as a proxy for jaguars in the Sonora core area, is no exception. Critical values of adult female survival are defined in the context of the underlying cub survival, as demonstrated graphically in Figure 5. When cub survival is low, defined here as just 58%, adult female survival must be on the order of 92% to confer an acceptable (in the author’s estimation) level of extinction risk (10%) over the time-course of the simulation. At the other end of the spectrum, a high rate of cub survival (83%) means that adult female can be as low as approximately 82 – 84% and still have a population that displays a low probability of population extinction. Additional analysis indicates that a population with those survival characteristics may actually have a negative growth rate (see Figure 5A), meaning that simple extinction risk is not always a complete descriptor of the demographic health of a population.
• What is the risk of core population extinction under a realistic “worst case scenario”, e.g., when core populations are demographically isolated, cub production is low, and adult mortality is high?
A precise definition of “low cub production” and “high adult mortality” is, sadly, not universal. In light of this, we must resort to more general insights. The results summarized in Figure 5, however, suggest that relatively small changes in survival among both cubs and adults, especially females, can dramatically increase the risk of extinction of jaguars in the Jalisco core area. This conclusion assumes a relatively low underlying growth rate, as with most of the conclusions
Miller – Addendum: PVA for Jaguar in the Northwestern Range 11 August, 2014
Page 12
drawn in this analysis. However, experts in jaguar population dynamics in Mexico suggest that both Jalisco and Sonora core populations may already be impacted by a combination of threatening factors that limit their growth to a considerable extent. In this case, it may be reasonable to conclude that these populations may be at considerable risk of future population declines if additional mortality occurs through hunting, etc. and dispersal of jaguars into these habitats through demographic connectivity is not possible. As discussed previously, the additional loss of as few as 10 adult females annually from one of these core populations may tip the demographic balance. Maintenance of metapopulation dynamics among these core populations and neighboring corridor habitats may therefore be a vitally important component of a successful management strategy for jaguars in the northern part of the species’ range. The success of such a strategy must also depend, of course, on the responsible management of threats to survival and reproduction of jaguars in the presence of humans.
Miller – Addendum: PVA for Jaguar in the Northwestern Range 11 August, 2014
Page 13
References Beissinger, S. and D. McCullough (Eds.). 2002. Population Viability Analysis. University of Chicago Press,
Chicago.
Brown, D. E., and C. A. López - González. 2001. Borderland Jaguars - Tigres de la Frontera. University of Utah Press, Salt Lake City.
Cavalcanti, S.M., and E.M. Gese. 2009. Spatial ecology and social interactions of jaguars (Panthera onca) in the southern Pantanal, Brazil. Journal of Mammalogy 90:935-945.
Ellner, S.P., J. Fieberg, D. Ludwig, and C. Wilcox. 2002. Precision in population viability analysis. Conservation Biology 16:258-261.
Hatten, J. R., A. Averill Murray, and W. E. Van Pelt. 2005. A spatial model of potential jaguar habitat in Arizona. Journal of Wildlife Management 69:1024–1033.
IUCN. 2012. IUCN Red List Categories and Criteria: Version 3.1. Second edition. Gland, Switzerland and Cambridge, UK: IUCN. iv + 32pp.
Lacy, R.C. 2000. Structure of the VORTEX simulation model for population viability analysis. Ecological Bulletins 48:191-203.
Lacy, R.C., M. Borbat, and J.P. Pollak. 2005. Vortex: A Stochastic Simulation of the Extinction Process. Version 9.5. Brookfield, Illinois: Chicago Zoological Society.
Lacy, R.C., and J.P. Pollak. 2014. Vortex: A Stochastic Simulation of the Extinction Process. Version 10. Brookfield, Illinois: Chicago Zoological Society.
Lotts, K.C., T.A. Waite, and J.A. Vucetich. 2004. Reliability of absolute and relative predictions of population persistence based on time series. Conservation Biology 18:1-9.
Ludwig, D. 1999. Is it meaningful to estimate a probability of extinction? Ecology 80:298-310.
Miller, P.S. 2013. Population Viability Analysis for the Jaguar (Panthera onca) in the Northwestern Range. Report prepared for the U.S. Fish and Wildlife Service, Jaguar Recovery Team.
Miller, P.S., and R.C. Lacy. 2005. VORTEX: A Stochastic Simulation of the Extinction Process. Version 9.50 User’s Manual. IUCN/SSC Conservation Breeding Specialist Group, Apple Valley, MN.
Morton, N.E., J.F. Crow, and H.J. Muller. 1956. An estimate of the mutational damage in man from data on consanguineous marriages. Proceedings of the National Academy of Sciences, USA 42:855-863.
Quigley, H.B., and P.G. Crawshaw. 2002. Reproducción, crecimiento y dispersión del jaguar en la region del Pantanal de Brasil. Pages 289-302 In: Medellin, R.A., C. Equihua, C.L.B. Chetkiewicz, P.G. Crawshaw, A. Rabinowitz, K.H. Redford, J.G. Robinson, E.W. Sanderson, and A.B. Tabor (Eds.). El Jaguar en el Nuevo Milenio. Fondo de Cultura Economica, Universidad Nacional Autónoma de Mexico, Wildlife Conservation Society, Mexico, D.F.
Ralls, K., J.D. Ballou, and A. Templeton. 1988. Estimates of lethal equivalents and the cost of inbreeding in mammals. Conservation Biology 2:185-193.
Reed, J.M., L.S. Mills, J.B. Dunning Jr., E.S. Menges, K.S. McKelvey, R. Frye, S.R. Beissinger, M.-C. Anstett, and P.S. Miller. 2002. Emerging issues in population viability analysis. Conservation Biology 16:7-19.
Sanderson, E.W., and K. Fisher. 2012. Jaguar Habitat Modeling and Database Update. Final report to the USFWS in response to Solicitation F12PS00200.

Miller – Addendum: PVA for Jaguar in the Northwestern Range 11 August, 2014
Page 14
Appendix A: Results of Survival Analysis The following table gives the detailed results of the 48 scenarios comprising the survival analysis that was applied to the Jalisco core population. Column definitions are below: Scenario Name of scenario, defined by the combined levels of cub (juvenile) and adult survival Surv (Cub) Value of cub survival in the given scenario. Surv (Adult) Value of adult female survival in the given scenario. Other age/sex-specific survival
values calculated as described in the report. rs (SD) Mean stochastic population growth rate (standard deviation) P(E) Probability of population extinction across the 100 years of the simulation T(E) Median time (years) to extinction in those scenarios where P(E) ≥ 0.50 N100 (SD) Mean final population size (standard deviation) across all simulations at 100 years.

Miller – Addendum: PVA for Jaguar in the Northwestern Range 11 August, 2014
Page 15
Scenario Surv (Cub) Surv (Adult) rs (SD) P(E) T(E) N100 (SD)
C1A1 58.28 75.00 -0.140 (0.197) 1.000 33 0 C1A2 58.28 80.00 -0.109 (0.198) 1.000 42 0 C1A3 58.28 85.00 -0.078 (0.178) 0.991 57 0.1 (1) C1A4 58.28 90.00 -0.044 (0.156) 0.583 95 10 (21) C1A5 58.28 95.00 -0.006 (0.117) 0.014 312 (317) C1A6 58.28 98.00 0.011 (0.109) 0.000 1219 (598) C2A1 62.50 75.00 -0.127 (0.195) 1.000 36 0 C2A2 62.50 80.00 -0.097 (0.188) 1.000 46 0 C2A3 62.50 85.00 -0.067 (0.176) 0.951 66 1 (3) C2A4 62.50 90.00 -0.032 (0.144) 0.287 35 (47) C2A5 62.50 95.00 0.005 (0.114) 0.000 780 (547) C2A6 62.50 98.00 0.019 (0.110) 0.000 1740 (405) C3A1 66.68 75.00 -0.118 (0.197) 1.000 39 0 C3A2 66.68 80.00 -0.088 (0.186) 1.000 51 0 C3A3 66.68 85.00 -0.055 (0.170) 0.835 78 3 (8) C3A4 66.68 90.00 -0.019 (0.132) 0.093 116 (155) C3A3 66.68 95.00 0.014 (0.114) 0.000 1399 (572) C3A6 66.68 98.00 0.024 (0.112) 0.000 1963 (255) C4A1 70.80 75.00 -0.109 (0.195) 1.000 42 0 C4A2 70.80 80.00 -0.078 (0.184) 0.991 57 0.1 (1) C4A3 70.80 85.00 -0.046 (0.164) 0.626 91 10 (19) C4A4 70.80 90.00 -0.007 (0.124) 0.027 311 (343) C4A5 70.80 95.00 0.020 (0.115) 0.000 1802 (381) C4A6 70.80 98.00 0.029 (0.114) 0.000 2007 (194) C5A1 75.00 75.00 -0.098 (0.195) 1.000 47 0 C5A2 75.00 80.00 -0.068 (0.183) 0.959 66 1 (3) C5A3 75.00 85.00 -0.033 (0.152) 0.330 33 (54) C5A4 75.00 90.00 0.004 (0.120) 0.001 727 (551) C5A5 75.00 95.00 0.025 (0.117) 0.000 1935 (240) C5A6 75.00 98.00 0.035 (0.117) 0.000 51 2042 (176) C6A1 79.20 75.00 -0.090 (0.194) 0.999 74 0 C6A2 79.20 80.00 -0.059(0.180) 0.874 2 (8) C6A3 79.20 85.00 -0.022 (0.140) 0.134 95 (127) C6A4 79.20 90.00 0.013 (0.119) 0.000 1300 (600) C6A5 79.20 95.00 0.030 (0.119) 0.000 2000 (202) C6A6 79.20 98.00 0.040 (0.117) 0.000 54 2056 (164) C7A1 81.68 75.00 -0.085 (0.193) 0.997 82 0.03 (0.5) C7A2 81.68 80.00 -0.052 (0.176) 0.768 6 (16) C7A3 81.68 85.00 -0.014 (0.135) 0.067 190 (249) C7A4 81.68 90.00 0.016 (0.119) 0.000 1568 (508) C7A5 81.68 95.00 0.033 (0.120) 0.000 2023 (190) C7A6 81.68 98.00 0.043 (0.118) 0.000 57 2072 (153) C8A1 83.40 75.00 -0.080 (0.193) 0.994 88 0.1 (1) C8A2 83.40 80.00 -0.047 (0.170) 0.662 9 (21) C8A3 83.40 85.00 -0.008 (0.130) 0.029 278 (305) C8A4 83.40 90.00 0.018 (0.120) 0.000 1707 (430) C8A5 83.40 95.00 0.035 (0.120) 0.000 2034 (182) C8A6 83.40 98.00 0.045 (0.118) 0.000 2086 (142)