addendum on digital mammography - mamo.cz: … · image presentation 28 ... well as manufacturers...
TRANSCRIPT

The European Protocol for the Quality Control of the physical and technical aspects of mammography screening
Addendum on
Digital Mammography
to chapter 3 of the: European Guidelines for Quality Assurance in
Mammography Screening
version 1.0 November 2003

Addendum on digital mammography to chapter 3 of the European Guidelines, version 1.0 2
Authors: R. van Engen, Nijmegen, the Netherlands K. Young, Guildford, United Kingdom H. Bosmans, Leuven, Belgium M. Thijssen, Nijmegen, the Netherlands (project leader) Co-authors: R. Visser, Nijmegen, the Netherlands L. Oostveen, Nijmegen, the Netherlands T. Geertse, Nijmegen, the Netherlands R. Bijkerk, Nijmegen, the Netherlands P. Heid, Marseille, France Contributors: P. Baldelli, Ferrara, Italy B. Beckers, Nijmegen, the Netherlands A. Bloomquist, Toronto, Canada M. Borowski, Bremen, Germany AK. Carton, Leuven, Belgium M. Chevalier, Madrid, Spain M. Gambaccini, Ferrara, Italy S. von Gehlen, Oldenburg, Germany G. Gennaro, Padua, Italy A. de Hauwere, Gent, Belgium B. Johnson, Guildford, United Kingdom B. Lazzari, Florence, Italy A. Lisbona, Nantes, France G. Mawdsley, Toronto, Canada P. Moran, Madrid, Spain A. Noel, Nancy, France
K. Pedersen, Oslo, Norway N. Phelan, Dublin, Ireland F. Rogge, Leuven, Belgium M. Säbel, Erlangen, Germany M. Schutten, Nijmegen, the Netherlands F. Shannoun, Luxembourg, Luxembourg A. Stargardt, Aachen, Germany M. Swinkels, Nijmegen, the Netherlands A. Taibi, Ferrara, Italy J. Teubner, Heidelberg, Germany H. Thierens, Gent, Belgium P. Torbica, Innsbruck, Austria F. van der Meer, Rotterdam, the Netherlands F.R. Verdun, Lausanne, Switzerland A. Workman, Belfast, United Kingdom
Acknowledgements: Comments have been received from the following manufacturers: Agfa, Barco, Fischer, Fuji, GE, Hologic, IMS, Instrumentarium, Kodak, Mevis, Siemens, X-counter Comments have been received from the following groups: DIN working group mammography, IEC MT 31: mammography Corresponding address: Corresponding author: EUREF office R. van Engen [email protected] [email protected] National Expert and Training Centre for Breast Cancer Screening 451 University Medical Centre Nijmegen P.O. Box 9101 6500 HB Nijmegen The Netherlands
Addendum on digital mammography to chapter 3 of the European Guidelines, version 1.0 3
Table of contents: Foreword 5 1. Introduction to the measurements 5
1.1 Staff and equipment 7 1.2 System demands 8 1.3 Definition of terms 12
2. Image acquisition 15 2.1 X-ray generation 15
2.1.1 X-ray source 15 2.1.2 Tube voltage and beam quality 16 2.1.3 AEC-system 17 2.1.3.1 Exposure control steps: central value and difference per step (if applicable) 17 2.1.3.2 Back-up timer and security cut-off 17 2.1.3.3 Short term reproducibility 18 2.1.3.4 Long term reproducibility 18 2.1.3.5 Object thickness and tube voltage compensation 18 2.1.3.5.1 Glandular dose per PMMA thickness 18 2.1.3.5.2 Signal to Noise Ratio (SNR) and Contrast to Noise Ratio (CNR) 19 2.1.4 Compression 20 2.1.5 Anti scatter grid 20
2.2 Image receptor 20 2.2.1 Image receptor response 20 2.2.1.1 Response function 20 2.2.1.2 Noise evaluation 21 2.2.2 Missed tissue at chest wall side 21 2.2.3 Image receptor homogeneity and stability 22 2.2.3.1 Image receptor homogeneity 22 2.2.3.2 Detector element failure (DR systems) 23 2.2.3.3 Uncorrected defective detector elements (DR systems) 23 2.2.4 Inter plate sensitivity variations (CR systems) 23 2.2.5 Influence of other sources of radiation (CR systems) 24 2.2.6 Fading of latent image (CR systems) 24
2.3 Dosimetry 24 2.4 Image Quality 25
2.4.1 Threshold contrast visibility 25 2.4.2 Modulation Transfer Function (MTF) and Noise Power Spectrum (NPS) [optional] 26 2.4.3 Exposure time 26 2.4.4 Geometric distortion and artefact evaluation 26 2.4.5 Ghost image / erasure thoroughness 27
3. Image processing 27 4. Image presentation 28
4.1 Monitors 28 4.1.1 Ambient light 28 4.1.2 Geometrical distortion (CRT displays) 29 4.1.3 Contrast visibility 29 4.1.4 Resolution 31 4.1.5 Display artefacts 31 4.1.6 Luminance range 32 4.1.7 Greyscale Display Function 32 4.1.8 Luminance uniformity 33
4.2 Printers 34 4.2.1 Geometrical distortion 34 4.2.2 Contrast visibility 34 4.2.3 Resolution 34 4.2.4 Printer artefacts 35 4.2.5 Optical Density Range (optional) 35 4.2.6 Greyscale Display Function 35 4.2.7 Density uniformity 36
4.3 Viewing boxes 36 5. CAD software 36 Appendix 1: Procedure for determination of average glandular dose in digital mammography 39

Addendum on digital mammography to chapter 3 of the European Guidelines, version 1.0 4
A1.1 Dose to typical breasts simulated with PMMA 39 A1.2 Clinical breast doses 39
Appendix 2: Calculation of contrast for details in a contrast–detail test object 42 Appendix 3: Justification of limiting values 43
A3.1 Average glandular dose limiting values 43 A3.2 Image quality limiting values 44
Appendix 4: CR screen processing modes 45 Appendix 5: Guidance for QC measurements on systems which only use breast thickness to determine exposure settings 47
A5.1 Threshold contrast visibility 47 A5.2 Thickness and tube voltage compensation 48 A5.3 Thickness indication 48
Appendix 6: Frequencies of Quality Control 49 Appendix 7: Limiting values 51
The authors acknowledge the valuable contributions of numerous scientists as well as manufacturers in the preparation of this document. Furthermore the financial support of the European Commission through the European Breast Cancer Network contracts 2000 (SI2.307923), 2001(SI2.307923) and 2002 (SPC2002482) is acknowledged. This addendum/publication is written as part of two projects:
- the European Guidelines and Certification Project of the European Reference Organisation for Quality Assured Breast Screening and Diagnostic Services (EUREF) and - the Digital Mammography Project of the Leuven Universitary Center of Cancer Prevention (LUCK).
Both projects are partners of the European Breast Cancer Network (EBCN). The publication has been coordinated by the EUREF office in Nijmegen.

Addendum on digital mammography to chapter 3 of the European Guidelines, version 1.0 5
Foreword
The ‘European guidelines for quality assurance in mammography screening’ include as chapter 3 the “European protocol for the quality control of the physical and technical aspects of mammography screening”. In this protocol the requirements for an adequate screen-film imaging system are defined. In recent years, the image detection technology used in mammography has extended to include the use of digital detector systems. This technology is different in so many ways, that it is necessary to set new quality standards and test procedures specifically for digital systems. This document is an addendum to the European protocol (3rd edition, ISBN 92-894-1145-7) and will be integrated in the 4th edition of the European guidelines which are currently under preparation by the European Breast Cancer Network (EBCN). The approach to quality assessment and control in this addendum is comparable in the sense, that the measurement and evaluation of performance are in principle independent of the type and brand of the system used. The measurements are generally based on parameters that are extracted from the images that are produced when a phantom with known physical properties is exposed under defined conditions. The limiting values are based upon the quality that is achieved by screen-film systems which fulfil the demands of the European guidelines. To fulfil the European guidelines in mammography screening, the digital x-ray system must pass all relevant tests at the acceptable level. The achievable level reflects the state of the art for the individual parameter. This addendum to the European protocol is work-in-progress and subject to improvements as more experience in digital mammography is obtained and new types of digital mammography equipment are developed , changes in measuring techniques or limiting values will lead to a new version number, changes in wording or added comments will change the sub-number. Updates on version 1.0 will be made available on the Euref website (www.euref.org). It is recommended that users check the website for updates before testing digital mammography equipment. In the text some lines are printed in parentheses [like these]. This text is a remark.
1. Introduction to the measurements
To produce images with adequate quality, each part of the imaging chain must function within the limits of performance given. Experience with some digital systems shows, that non-compliance results in a seriously diminished information transfer to the observer. This can be expected to result in a lower detection rate for microcalcifications and/or for low contrast lesions. To facilitate the relevant quality control, the user must be able to evaluate the status of the acquisition system including detector, the processing system and the display system (see fig. 1). This protocol follows the DICOM standard (Digital Imaging and Communications in Medicine, http://medical.nema.org). The equipment therefore must be able to transmit and receive digital mammogram images as IOD’s (Information Object Definitions) of modality “MG” (mammography) or “CR” (computed radiography), in compliance with parts 3 (IOD definition), 5 (data structures and encoding), 6 (data dictionary) and 7 (message exchange) of the DICOM standard. The general principles for testing the three main parts of the imaging chain, illustrated in figure 1, are discussed below. Acquisition system including image receptor The acquisition system (fig. 1, A) can be evaluated: o by inspection of a recent “pixel construction map” or table, that reflects the position and amount of
modification of individual pixels (picture elements). This map reflects what percentage of each pixel is based on its own del reading (see 2.2.3.2). A “bad pixel map” or a totally uncorrected image is the preferred information until 2005. It must be accessible to the user at any time and be usable independently of a given equipment and manufacturers permission.
o by the assessment of the relation between X-ray exposure parameters, dose to the image receptor and pixel values. An “unprocessed image” (DICOM defines such an image as ‘for processing’), presenting a linear or other known mathematical relationship between del dose and pixel value, must be accessible. This image type must also be available for CAD (computer aided detection) or other processing software.
Text in a box like this needs further evaluation

Addendum on digital mammography to chapter 3 of the European Guidelines, version 1.0 6
o by an indication of the nominal sensitivity setting of the system in every image. Since image quality increases with dose, the preference for higher system dose can be expected. This leads to a higher dose and consequent higher radiation risk to the women screened. In screen-film systems the dose to the image receptor is linked to the mean optical density of each film, given the speed class of the system (speed class 100 corresponds roughly to an air kerma of 10 µGy at the place of the image receptor). An indication, comparable to speed class, must be provided for digital systems to keep the radiologist informed on the average doses delivered. It is recommended that manufacturers provide sufficient information in the header of the file to allow calculation of the average glandular dose for each individual patient. A working group of DICOM is drafting the definitions.
o For the evaluation of the acquisition system this protocol follows some advises of AAPM task group 10 and of preliminary results of the ACRIN trial.
Processing system o The processing system (fig 1, B) can be evaluated by the inspection and scoring of a test set of images
(either mammograms or phantom images), which have been processed in the available standard processing algorithm.
• These images are to be inserted by the user as ‘unprocessed images’ (DICOM: ‘for processing’) and processed by the software of manufacturer before displaying.
• The manufacturer must provide information in general terms on the processing applied. o The processing algorithms are built to enhance the visibility of specific image details. At this moment little
experience and literature on the effects is available. These algorithms therefore are not addressed in the present protocol. The observer is urged to convince himself of the value of the algorithms provided.
o Evaluation of processing algorithms and CAD (computer aided detection) will be addressed in a later version of this protocol.
Display system o The display system (fig 1, C) can be evaluated by the inspection on the display system (printer or monitor)
of a synthetic phantom image, produced in DICOM format and independent of the phantom images delivered by the manufacturer. The user must be able to insert these images as “processed images” (DICOM: ‘for presentation’). They are not processed further before displaying. Evaluation of such images is necessary to confirm compliance to quality standards other than those of the manufacturer. It must be possible to load and display these phantom images using the imaging system under evaluation.
o For the evaluation of the display system this protocol follows the advice of AAPM task group 18 and of preliminary results of the ACRIN trial.
The measurements in the protocol are in principle chosen and described to be generally applicable. Where the tests are similar to those required for screen-film mammography, a reference to the relevant part of the European guideline is given. When necessary, different test procedures are given for CR (computed radiology, i.e. photo-stimulable phosphor type) systems and DR (direct radiology, i.e. solid state type, including scanning slot) systems separately. Many measurements are performed by an exposure of a test object. All measurements are performed under normal working conditions: no special adjustment of the equipment is necessary. Since the available settings in the different systems vary in spectrum and X-ray quantity for the different breast thicknesses, no common standard exposure can be indicated. Therefore dose calculations for the comparison of systems are based on the AGD (average glandular dose) to the breast rather (oe simulated breast) than on entrance surface air kerma.
Addendum on digital mammography to chapter 3 of the European Guidelines, version 1.0 7
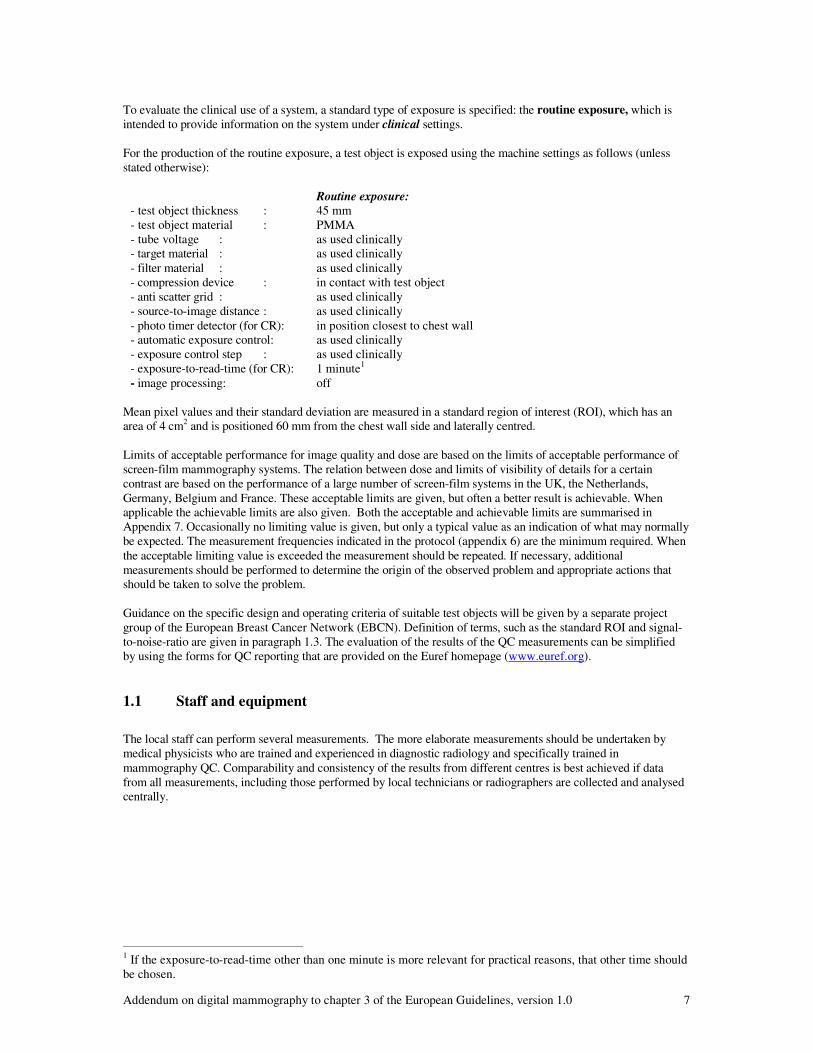
To evaluate the clinical use of a system, a standard type of exposure is specified: the routine exposure, which is intended to provide information on the system under clinical settings. For the production of the routine exposure, a test object is exposed using the machine settings as follows (unless stated otherwise):
- test object thickness : - test object material : - tube voltage : - target material : - filter material : - compression device : - anti scatter grid : - source-to-image distance : - photo timer detector (for CR): - automatic exposure control: - exposure control step : - exposure-to-read-time (for CR): - image processing:
Routine exposure: 45 mm PMMA as used clinically as used clinically as used clinically in contact with test object as used clinically as used clinically in position closest to chest wall as used clinically as used clinically 1 minute1 off
Mean pixel values and their standard deviation are measured in a standard region of interest (ROI), which has an area of 4 cm2 and is positioned 60 mm from the chest wall side and laterally centred. Limits of acceptable performance for image quality and dose are based on the limits of acceptable performance of screen-film mammography systems. The relation between dose and limits of visibility of details for a certain contrast are based on the performance of a large number of screen-film systems in the UK, the Netherlands, Germany, Belgium and France. These acceptable limits are given, but often a better result is achievable. When applicable the achievable limits are also given. Both the acceptable and achievable limits are summarised in Appendix 7. Occasionally no limiting value is given, but only a typical value as an indication of what may normally be expected. The measurement frequencies indicated in the protocol (appendix 6) are the minimum required. When the acceptable limiting value is exceeded the measurement should be repeated. If necessary, additional measurements should be performed to determine the origin of the observed problem and appropriate actions that should be taken to solve the problem. Guidance on the specific design and operating criteria of suitable test objects will be given by a separate project group of the European Breast Cancer Network (EBCN). Definition of terms, such as the standard ROI and signal-to-noise-ratio are given in paragraph 1.3. The evaluation of the results of the QC measurements can be simplified by using the forms for QC reporting that are provided on the Euref homepage (www.euref.org). 1.1 Staff and equipment
The local staff can perform several measurements. The more elaborate measurements should be undertaken by medical physicists who are trained and experienced in diagnostic radiology and specifically trained in mammography QC. Comparability and consistency of the results from different centres is best achieved if data from all measurements, including those performed by local technicians or radiographers are collected and analysed centrally.
1 If the exposure-to-read-time other than one minute is more relevant for practical reasons, that other time should be chosen.

Addendum on digital mammography to chapter 3 of the European Guidelines, version 1.0 8
The staff conducting the daily/weekly QC-tests will need the following equipment2 at the screening site: - Standard test block3 (45 mm PMMA4) - digital QC test images - Reference cassette (CR systems) - PMMA plates5
The medical physics staff conducting the other QC-tests will need the following additional equipment and may need duplicates of many of the above3:
2 The specifications of the listed equipment are given, where appropriate, in chapter 3.5, table 2 of the European Guidelines, third edition. 3 The standard test block, covering the whole imaging area, may be composed of several PMMA plates. 4 PMMA (polymethylmethacrylate) is commercially available under several brand names, e.g. Lucite, Plexiglas
and Perspex. 5 Covering the whole imaging area, and covering a total thickness range from 20 to 70 mm PMMA (Normally
PMMA of 180 X 240mm is available)
- Dose meter - Tube voltage meter - Exposure time meter - Telescopic luminance meter - Illuminance meter - QC test objects - Digital QC test images - Contrast-detail test object - Densitometer
- Aluminium sheets - Focal spot test device + stand - Screen-film contact test device - Tape ruler - Compression force test device - Rubber foam - Lead sheet - Aluminium stepwedge
1.2 System demands
• Accessibility It must be able to access and insert DICOM images as ‘for processing’ and ‘for presentation’ to allow evaluation of the image receptor, image processing and image representation separately.
• AEC: The ALARA principle (As Low As Reasonably Achievable) on dose administered to the patient urges the use of an automated exposure control (AEC) system to ensure the optimal exposure of the image receptor compensating for breast thickness and composition. The use of a look up table, only based on the measured thickness of the compressed breast, increases the mean dose to the patients. This is due to the necessary margin in exposure to avoid increased noise by underexposure in dense breasts and to compensate for the incorrect reading of the thickness.
• Image receptor: The required physical size of the image receptor and the amount of missed tissue at the short sides and especially at the chest wall side are important for an optimal imaging of the breast tissues. An upper limit is given for the amount of missed tissue at chest wall side, but the acceptance of other margins remains the responsibility of the radiologist.
• Display system: Optimal transfer of the information in digital mammograms will be reached, when every pixel in the matrix is projected to at least one pixel on the display system and when the pixel size on the display system is sufficiently small to show details that coincide with the maximum sensitivity of the eye of the observer (1-3 lp/mm at a viewing distance of 30 cm). In screening the monitor should allow for the inspection of the image at full size in full resolution, since the number of images read does not allow time consuming procedures like roaming or zooming. Normally two images are viewed at the same time, and with the current technology it is therefore recommended that diagnostic workstations with two large (45-50 cm diagonal (19-21”)) high quality, 5 megapixel monitors are used.

Addendum on digital mammography to chapter 3 of the European Guidelines, version 1.0
9
On the acquisition unit it may be acceptable to use a monitor with lower specification, depending on the tasks of the radiographer. Further research is needed to demonstrate whether cheaper solutions (e.g. 3 megapixel monitors) may be sufficient in clinical situations.
• Viewing conditions: Since the maximum intensity on the monitor (300-800 cd/m2) is much lower than that of a viewing box with unexposed and developed film (2000-4000 cd/m2) and due to the reflection characteristics of the monitor, the amount of ambient light might seriously diminish the visible dynamic range and the visibility of low contrast lesions. The ambient light level therefore should be low (10 lux) to allow maximal extension to the lower part of the range. Although the level has proven to be acceptable, a short time to adapt to that level might be necessary.
• CR system: All measurements should be performed with the same phosphor screen to rule out differences between screens except when testing individual screens as in section 2.2.4 and when testing contrast threshold visibility as in section 2.4.1. The exposure-to-read-time is standardised to minimize differences caused by varying time delays (i.e. fading of the latent image). The DICOM standard allows both IOD’s of “CR” and “MG” to be used for CR images. This may lead to improper hanging of the images by different display systems.
• DR detector: When measurements are performed for which no image is required (e.g. HVL or tube voltage), cover the detector sufficiently to prevent ghost images. When the absorbers in the QC test object lead to automatic exposure values other than those that would be obtained with homogeneous PMMA, set the system manually to these values.
Martin Thijssen PhD, November 2003

Addendum on digital mammography to chapter 3 of the European Guidelines, version 1.0
10
Fig. 1
processing acquisition
un- processed
image storage
processed image storage
image ‘for processing’
image ‘for presentation’
e.g. unsharp masking
breast peripheral enhancement logarithmic scaling
display
DICOM image archive
A B C
detector correction
unprocessed image
e.g. gain correction
offset correction bad pixel correction
detector
x-ray intensity
image acquisition Fig. 1A

Addendum on digital mammography to chapter 3 of the European Guidelines, version 1.0
11
Fig. 1C: monitor image display
p-value to DDL
conversion
graphics board display
processed image(p-values) luminance
Fig. 1C: printer
image printer
processed image(p-values)
printer
luminance
viewing box

Addendum on digital mammography to chapter 3 of the European Guidelines, version 1.0
12
1.3 Definition of terms
The definitions given here specify the meaning of the terms used in this document. Active display area: The part of the display used for displaying images, applications and the
desktop. Bad pixel map: A map which defines the number and position of defective dels. Bit-depth: Number of values which can be assigned to a pixel in a certain digital system,
expressed in bits. Computer Aided Detection Software to aid the radiologists’ detection of suspect areas in the breast image (CAD): and increase his/her sensitivity. Computed Radiography (CR): Digital radiology technology using photostimulable phosphor plates. Contrast to Noise Ratio (CNR): The CNR is calculated as follows for a specific test object (e.g. 0.1 mm Al
thickness on 45 mm PMMA).
d)(backgroundeviationstandardd)(backgroun valuepixelmean -(signal) valuepixelmean
CNR =
Del: Discrete element in a DR detector. Detective Quantum Efficiency Function which describes the transfer of SNR as function of spatial frequency (DQE) when recording an X-ray image. The DQE gives the efficiency with which
the device uses the available quanta. Detector corrections: Correction in DR systems in which the pixel value of defective detector
elements is reconstructed and in which is corrected for individual detector element sensitivity variations and electronic gain of the read-out and.
Direct Radiography (DR): Digital radiology technology using sealed units mounted on a radiography system, which captures X-rays and produces a digital image by sampling the X-ray image.
Digital Driving Level (DDL): Digital value which is the input for a display system. Exposure indicator: Number ascribed to an image related to the exposure. Exposure time: The time during which primary X-rays reach an imaged object. Modulation Transfer Function Function which describes how the contrast of image components is (MTF) transmitted as a function of their spatial frequency content. Noise: Fluctuations of the signal which cannot be associated by the imaged object.
In mammography systems quantum noise should be the limiting factor. The standard deviation in a ROI in the output image is taken as measure of noise.
Noise power spectrum (NPS): Function which describes image noise as a function of spatial frequency. P-value: See presentation value. Pixel: Picture element, the smallest unit in the image.

Addendum on digital mammography to chapter 3 of the European Guidelines, version 1.0
13
Pixel construction map: A pixel map in which is defined for each pixel what percentage of the pixel value is based on its own del reading.
Pixel pitch: Physical distance between the centres of adjacent pixels. In the DICOM tags
pixel pitch is called imager pixel spacing and is generally equal to detector element spacing.
Pixel value: Discrete value assigned to a pixel, in mammography systems the number of
pixel values range from 1024 (10-bits) to 16384 (14 bits), depending on the detector.
Pixel value offset: For some systems a constant value is added to the values of all pixels. This
constant value is defined as the pixel value offset. Presentation value: Pixel value after VOI LUT or window width and window level settings have
been applied. Primary class display device: A display device used for the interpretation of medical images (also referred
to in the text as ‘diagnostic display device’). Processed image: The image after image processing, ready for presentation on the monitor or
print-out. In the DICOM file the value of tag Pixel Intensity Relationship (0028,1040) is ‘for presentation’.
Raw image: See unprocessed image. Secondary class display device: A display device used for viewing the images, but not for diagnostics. Standard region-of-interest The region-of-interest ( � 4 cm²) in which mean pixel (ROI) values and standard deviation are measured. The centre of the region-of-
interest is positioned 60 mm perpendicular to the chest wall edge of the table and centred laterally.
(Nominal) sensitivity setting: Indication of the sensitivity setting of the system, comparable to the speed class in screen-film systems. The practical method to implement a (nominal) sensitivity setting will be discussed with manufacturers.
Screen processing: Image processing applied in a CR system during read-out of the imaging plate.
Signal to Noise Ratio (SNR): The SNR is calculated as follows for a specific ROI:
valuepixelin deviation standard
valuepixelin offset - valuepixelmean SNR =
Standard test block: PMMA test object to represent approximately the average breast (although
not an exact tissue-substitute) so that the X-ray machine operates correctly under automatic exposure control and the dose meter readings may be converted into dose to glandular tissue. The thickness is 45 ± 0.5 mm. The standard test block covers the whole detector.
Threshold contrast: The smallest detectable contrast for a given detail size that can be shown by
the imaging system with different intensity (density) over the whole dynamic range. The threshold contrast is a measure for imaging of low-contrast structures, and is largely determined by the DQE of the detector.

Addendum on digital mammography to chapter 3 of the European Guidelines, version 1.0
14
Uncorrected image: The image of a DR system before any image processing, including detector corrections and flat-fielding. The read-out signal from every del of the detector must be linear to the pixel value of the same del. The same linearity must apply for all dels.
Unprocessed image: The image of a DR system after flat-fielding and detector corrections but
before other image processing has been applied. The pixel value is in general linear to pixel exposure in the unprocessed image. In the DICOM file the value of tag Pixel Intensity Relationship (0028,1040) is ‘for processing’. IEC MT 31 refers to the unprocessed image as ‘raw data’.
Variation: mean value
valueminimum - valuemaximumVariation = x 100%
VOI LUT: Value of interest lookup table, defines the (non-linear) transformation of
pixel values into values meaningful for presentation (presentation values). Window centre: Setting defining (together with window width) a linear relationship between
modality pixel values and pixel values meaningful for presentation (presentation values).
Window width: Setting defining (together with window centre) a linear relationship between
modality pixel values and pixel values meaningful for presentation (presentation values).

Addendum on digital mammography to chapter 3 of the European Guidelines, version 1.0
15
2. Image acquisition
2.1 X-ray generation
2.1.1 X-ray source The measurements to determine the focal spot size, source-to-image distance, alignment of X-ray field and image receptor, radiation leakage and tube output are described in this section. 2.1.1.1 Focal spot size Use the methods and limiting values described in the European guidelines for quality assurance in mammography screening, third edition (page 73). Either film or the digital detector may be used, beware of detector saturation. 2.1.1.2 Source-to-image distance The source-to-image distance can be determined by imaging an object with known dimensions a (� 10 cm) positioned on the breast support table and positioned at a distance d (� 20 cm) above the breast support table. Measure the dimensions of the imaged object on image 1 (object on breast support table) and image 2 (object at distance d above the breast support table). The pixel pitch must be known for this calculation. Using formula 2.1 the source-to-image distance can be calculated.
Fig. 2.1 Source-to-distance measurement
���
����
�−
=
21
11
pppa
df (2.1)
f = source-to-image distance d = distance between the object in position 1 and 2 a = size of the imaged object p = pixel pitch p1 = size of the object on image 1 (object on the breast support table) in number of pixels p2 = size of the object on image 2 (object at a distance d above the breast support table) in number of pixels
d
p1*p
p2*p
object
object
f
breast support table image receptor

Addendum on digital mammography to chapter 3 of the European Guidelines, version 1.0
16
Limiting value Manufacturers specification Frequency At acceptance Equipment An arbitrary test object 2.1.1.3 Alignment of X-ray field/image area For CR systems use the method and limiting values described in the European guidelines for quality assurance in mammography screening, third edition (page 75). (Currently the most convenient method for DR systems is also with screen-film cassettes. In future this might be a problem. If cassettes and film processor are unavailable at the test site, use cassettes that can be read-out or processed elsewhere). 2.1.1.4 Radiation leakage For CR systems use the method and limiting values described in the European guidelines for quality assurance in mammography screening, third edition (page 76). (Currently the most convenient method for DR systems is with screen-film or CR cassettes. In future this might be a problem. If cassettes and film processor are unavailable at the test site, use cassettes that can be read-out or processed elsewhere). 2.1.1.5 Tube output (optional) Use the method and limiting values described in the European guidelines for quality assurance in mammography screening, third edition (page 76). Tube output measurements should be performed at all clinically used target-filter combinations. Measurements should be performed with compression paddle. To calculate the transmission factor of the compression paddle, which may be needed for glandular dose estimates, tube output measurements should also be performed without compression paddle. The transmission factor should be calculated as the measured air kerma in presence of the compression paddle, divided by the measured air kerma in absence of the compression paddle. 2.1.2 Tube voltage and beam quality The beam quality of the emitted X-ray beam is determined by tube voltage, anode material and filtration. Tube voltage and beam quality can be assessed by the measurements described below. 2.1.2.1 Tube voltage Both the accuracy and reproducibility of the tube voltage are measured. Use the method and limiting values described in the European guidelines for quality assurance in mammography screening, third edition (page 77). 2.1.2.2 Half Value Layer (HVL) Use the method described in the European guidelines for quality assurance in mammography screening, third edition (page 77). The compression paddle should be within the X-ray beam. The half value layers should be measured at all available target-filter combinations. For each target-filter combination a number of tube voltages in the clinically used range should be measured (for example: Mo/Mo and Mo/Rh at 25, 28 and 31 kV, values in between can be interpolated for glandular dose calculations). Limiting value Typical values are given in, appendix 1 Frequency At acceptance an extensive number of tube voltages at all available target-filter
combinations should be measured, yearly tests can be restricted to one tube voltage at each spectrum.
Equipment See European guidelines for quality assurance in mammography screening, third edition (page 77-78)

Addendum on digital mammography to chapter 3 of the European Guidelines, version 1.0
17
2.1.3 AEC-system It is generally recommended that systems used for mammography screening incorporate an AEC. The performance of the AEC system should be tested in terms of reproducibility and accuracy under varying conditions (object thickness and beam quality). The AEC system should adjust target, filter and tube voltage such that image quality is sufficient and dose is within an acceptable range. Semi-automated systems that start from a user defined target, filter and tube voltage but adapt dose according to breast transparency, are also acceptable. The use of a look-up-table (LUT) for the determination of target, filter, tube voltage and dose based on compressed breast thickness can only be allowed if this LUT is programmed into the X-ray unit. However, it must be realized that these systems do not take breast composition into account and therefore cannot be fully optimized with respect to image quality and dose. For this kind of system some guidance for QC measurements is given in appendix 5. For dose measurements it is essential that the dose detector is positioned outside the region in which the exposure settings are determined. Alternatively, dose can be calculated using tube loading (mAs) and tube output. 2.1.3.1 Exposure control steps: central value and difference per step (if applicable) This test item only applies to mammography units with exposure control steps. Image a standard test block at the different exposure control steps (or a relevant subset). Record entrance dose (or tube loading). Calculate exposure steps in entrance dose (or tube loading). Remark: If it is noticed that the system switches between two spectra, release the compression paddle and compress again or use another PMMA thickness (add for example 0.5 cm PMMA) to force the choice of one single spectrum and repeat the measurement. The central setting is the standard setting. In this setting image quality must be sufficient, this is determined by contrast detail threshold measurements, see section 2.4.1. Typical value 5-15% increase in exposure per step6 Frequency Every six months Equipment Standard test block, dose meter 2.1.3.2 Back-up timer and security cut-off Use the method described for the guard timer in the European guidelines for quality assurance in mammography screening, third edition (page 78). Make sure that the detector is completely covered, or tape some lead plates to the tube window. Limiting value The back-up timer and/or security cut off should function properly Frequency Yearly Equipment Sheet of lead Warning: An incorrect functioning of the back-up timer could damage the tube. To avoid excessive tube load, consult the manual for maximum permitted exposure time.
6 These values are derived from screen-film mammography. At this moment no limiting values on exposure increase per step for digital mammography have been set, but they should be approximately uniform.
Manufacturers of equipment, which do not incorporate an AEC, are urged to implement an AEC in their mammography X-ray units. The authors advise against the use of mammography X-ray units on which the exposure settings have to be set completely manually.

Addendum on digital mammography to chapter 3 of the European Guidelines, version 1.0
18
2.1.3.3 Short term reproducibility Use the method and limiting values described in the European guidelines for quality assurance in mammography screening, third edition (page 79). Remark: If it is noticed that the system switches between two spectra, release the compression paddle and compress again or use another PMMA thickness (add for example 0.5 cm PMMA) to force the choice of one single spectrum and repeat the measurement. 2.1.3.4 Long term reproducibility Use the weekly homogeneity check (see section 2.2.3.1) for long term reproducibility. Limiting value The variation of SNR in the standard ROI and dose < ±10% Frequency weekly Equipment Standard test block 2.1.3.5 Object thickness and tube voltage compensation Compensation for object thickness should be measured by exposures of PMMA plates in the thickness range from 20 to 70 mm (steps of 10 mm), using the clinical AEC settings (tube voltage, target, filter and mode). The compression paddle must be in contact with the PMMA plates. 2.1.3.5.1 Glandular dose per PMMA thickness Image PMMA plates of 20 mm thickness in clinical settings. Record the entrance surface air kerma and the exposure factors chosen by the AEC. Repeat this measurement for 30, 40, 45, 50, 60 and 70 mm PMMA thickness Calculate the average glandular dose for a breast equivalent to each PMMA thickness. A detailed description of the calculation of the average glandular dose can be found in appendix 1. Remark: For dose measurements it is essential that the dose detector is positioned outside the region in which the exposure settings are determined. Alternatively, dose can be calculated using tube loading (mAs) and tube output. Limiting value A maximum average glandular dose is set per PMMA thickness:
Thickness of PMMA
Equivalent breast thickness
Maximum average glandular dose to equivalent breasts
acceptable level7 achievable level [cm] [cm] [mGy] [mGy] 2.0 2.1 < 0.8 < 0.6 3.0 3.2 < 1.3 < 1.0 4.0 4.5 < 2.0 < 1.6 4.5 5.3 < 2.5 < 2.0 5.0 6.0 < 3.3 < 2.6 6.0 7.5 < 5.0 < 4.0 7.0 9.0 < 7.3 < 5.8
Frequency Every six months Equipment A set of 10 mm and 5 mm thick PMMA plates covering the complete detector
area, dose meter
7 In appendix 3 the justification of the limiting values can be found.
Addendum on digital mammography to chapter 3 of the European Guidelines, version 1.0
19
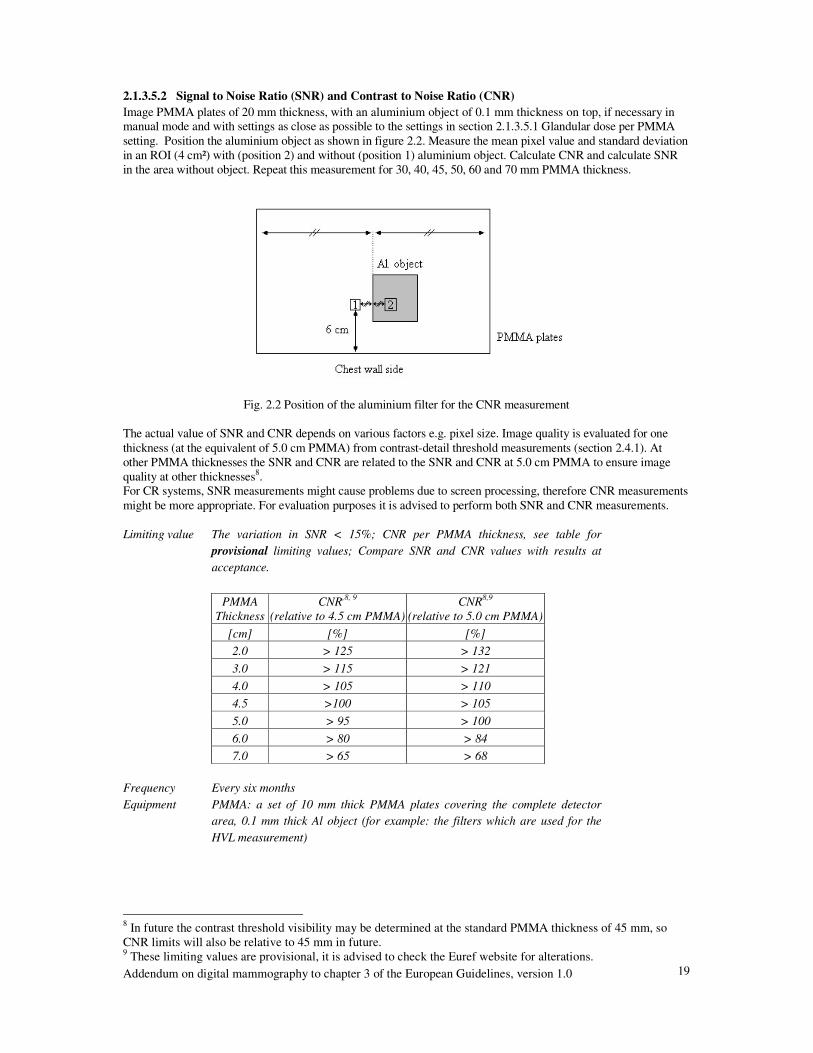
2.1.3.5.2 Signal to Noise Ratio (SNR) and Contrast to Noise Ratio (CNR) Image PMMA plates of 20 mm thickness, with an aluminium object of 0.1 mm thickness on top, if necessary in manual mode and with settings as close as possible to the settings in section 2.1.3.5.1 Glandular dose per PMMA setting. Position the aluminium object as shown in figure 2.2. Measure the mean pixel value and standard deviation in an ROI (4 cm²) with (position 2) and without (position 1) aluminium object. Calculate CNR and calculate SNR in the area without object. Repeat this measurement for 30, 40, 45, 50, 60 and 70 mm PMMA thickness.
Fig. 2.2 Position of the aluminium filter for the CNR measurement
The actual value of SNR and CNR depends on various factors e.g. pixel size. Image quality is evaluated for one thickness (at the equivalent of 5.0 cm PMMA) from contrast-detail threshold measurements (section 2.4.1). At other PMMA thicknesses the SNR and CNR are related to the SNR and CNR at 5.0 cm PMMA to ensure image quality at other thicknesses8. For CR systems, SNR measurements might cause problems due to screen processing, therefore CNR measurements might be more appropriate. For evaluation purposes it is advised to perform both SNR and CNR measurements. Limiting value The variation in SNR < 15%; CNR per PMMA thickness, see table for
provisional limiting values; Compare SNR and CNR values with results at acceptance.
PMMA
Thickness CNR,8, 9
(relative to 4.5 cm PMMA) CNR8,9
(relative to 5.0 cm PMMA) [cm] [%] [%] 2.0 > 125 > 132 3.0 > 115 > 121 4.0 > 105 > 110 4.5 >100 > 105 5.0 > 95 > 100 6.0 > 80 > 84 7.0 > 65 > 68
Frequency Every six months Equipment PMMA: a set of 10 mm thick PMMA plates covering the complete detector
area, 0.1 mm thick Al object (for example: the filters which are used for the HVL measurement)
8 In future the contrast threshold visibility may be determined at the standard PMMA thickness of 45 mm, so CNR limits will also be relative to 45 mm in future. 9 These limiting values are provisional, it is advised to check the Euref website for alterations.

Addendum on digital mammography to chapter 3 of the European Guidelines, version 1.0
20
2.1.4 Compression Use the method and limiting values described in the European guidelines for quality assurance in mammography screening, third edition (page 80). 2.1.5 Anti scatter grid The anti scatter grid is designed to absorb scattered photons. The tests in this section only apply to mammography units with (removable) grid. Some digital mammography systems do not incorporate anti scatter grids (e.g. scanning systems). 2.1.5.1 Grid system factor Image the standard test block in clinical setting with grid. Record entrance dose and measure the mean pixel value in the standard ROI. Expose two images without grid with mean pixel values respectively below and above the value of the image with grid. Interpolate the pixel values to obtain the entrance dose for which the pixel value is similar to the image with grid. Calculate the grid system factor by dividing the entrance dose with grid by the entrance dose without grid. Limiting value Manufacturers specification Frequency At acceptance Equipment Standard test block, dose meter 2.1.5.2 Grid imaging Use the method and limiting values described in the European guidelines for quality assurance in mammography screening, third edition (page 81). The imaging of the grid is not possible for some grids due to minimum required exposure times. 2.2 Image receptor
This section describes measurements applicable to both DR and CR systems i.e. the image receptor response and missed tissue at chest wall side. Other measurements apply to DR or CR systems only. For a DR system detector element failure is determined. The performance of the imaging plates of a CR system can be described by the CR plate sensitivity and the sensitivity to other sources of radiation. 2.2.1 Image receptor response The measurement of the response is performed to check compliance with manufacturers specifications, pixel value offset and the presence of additional noise sources beside quantum noise. 2.2.1.1 Response function The response function of the detector can be assessed by imaging a standard test block with different entrance doses (tube loading) at one fixed beam quality (for example: Mo/Mo 28 kV). Use the manual mode for this measurement. Use at least 10 different tube loadings (mAs values). The range of mAs values should be chosen such that the linearity measurement includes the range of 1/10 to 5 times the entrance surface air kerma for a routine exposure. For systems with a linear response, such as currently available DR systems, measure the mean pixel value and standard deviation in the standard ROI on the unprocessed image. Plot the mean pixel value against entrance surface air kerma. Determine linearity by plotting a best fit through all measured points and determine the zero crossing to check presence of a pixel value offset. Calculate the square of the correlation coefficient (R2).

Addendum on digital mammography to chapter 3 of the European Guidelines, version 1.0
21
For systems with a non-linear response, such as currently available CR systems, plot mean pixel value against . log relative entrance surface air kerma. Refer to the information provided by the manufacturer whether pixel value should be linear or logarithmic versus entrance surface air kerma at the applied screen processing. Post processing should be turned off. The screen processing should be turned off as much as possible (see appendix 4). Determine linearity by plotting a best fit through all measured points. Calculate the square of the correlation coefficient (R2). Appendix 4 provides information about the relation between entrance surface air kerma and exposure indicator for some CR systems and screen processing modes. Limiting value R² > 0.99, results at acceptance are used as reference Frequency Every six months. At acceptance: additional measurements at minimum and maximum tube
voltage used in clinical practice at every target-filter combination Equipment Standard test block, dose meter 2.2.1.2 Noise evaluation Measure the mean pixel value and standard deviation in the standard ROI on the unprocessed images of the response function measurement (2.2.1.1). For systems with a linear response, calculate the SNR and plot SNR2 against entrance surface air kerma. Determine linearity by plotting a best fit through all measured points. Calculate the square of the correlation coefficient (R2). Repeat this measurement for all available target-filter combinations. Non-linearity is an indication for the presence of additional noise sources besides quantum noise. (At acceptance: additional measurements at minimum and maximum tube voltage used in clinical practice for each target-filter combination). For systems with a logarithmic response plot standard deviation squared against 1/entrance surface air kerma. Determine linearity by plotting a best fit through all measured points. Calculate the square of the correlation coefficient (R2). The offset is an indication for the presence of additional noise sources besides quantum noise. Limiting value Results at acceptance are used as reference Frequency Every six months. At acceptance: additional measurements at minimum and maximum tube
voltage used in clinical practice at every target-filter combination Equipment Standard test block, dose meter 2.2.2 Missed tissue at chest wall side Determine the width of tissue not imaged between the edge of the breast support table and the imaged area. This can be done by several methods. In some phantoms markers at a fixed distance from chest wall side are incorporated. The position of these markers on the image can be used to determine the missed tissue at chest wall side. For CR systems, this measurement should be repeated 5 times to check whether the insertion of the plate in the cassette is reproducible. Limiting value Width of missed tissue at chest wall side � 5 mm Frequency At acceptance Equipment Phantom with markers positioned close to the bucky surface
Some specific designs of system will not comply with the limiting value of 5 mm. The radiologist must take that loss of information into account when a system is purchased. Manufacturers of systems that do not comply with this limiting value are urged to reduce the amount of missed tissue at chest wall side for their system(s).

Addendum on digital mammography to chapter 3 of the European Guidelines, version 1.0
22
2.2.3 Image receptor homogeneity and stability 2.2.3.1 Image receptor homogeneity The homogeneity of the image receptor can be obtained by exposing at clinical settings a standard test block covering the complete detector. Record the exposure settings and tube loading. Evaluate the unprocessed image by calculating the mean pixel value and standard deviation in an ROI (a square with an area of 1 cm2 ). Move the ROI over the whole image. Determine the mean pixel values in the whole image and the mean SNR in all ROI’s. Compare the mean pixel value and the SNR of each ROI to the overall mean pixel value and the mean SNR. Compare the SNR to previous homogeneity tests. Software for determining detector homogeneity is available on: www.euref.org. Check the homogeneity visually. The window width should be set at 10% of the mean pixel value. Repeat this measurement for different target-filter combinations. The pixel values of all images should be in the same order of magnitude for the different images. Perform the measurement at acceptance also with PMMA blocks of a thickness of 20 and 70 mm. To exclude failure due to inhomogeneities in the standard block, rotate the standard test block 180° and repeat the measurement. For CR systems: No post processing should be applied, the screen processing should be turned off as much as possible (see appendix 4). Alternative method: Evaluate the unprocessed image by calculating the mean pixel value and standard deviation in several ROI’s (each with an area of 4 cm²), see fig. 2.3. Calculate the SNR for each ROI. Compare the mean pixel values and SNR of all ROI’s.
Fig. 2.3 Positions of the ROI’s for the homogeneity measurement (alternative method)
Limiting value (provisional) Maximum deviation in mean pixel value < +15% of mean pixel
value in whole image, maximum deviation in SNR < +15% of mean SNR in all ROI’s, maximum variation of the mean SNR between images < +10%, entrance surface air kerma (or tube loading) between images < +10%.
Frequency Weekly, at acceptance also at 20 and 70 mm PMMA thickness Equipment Standard test block covering the complete detector, at acceptance also PMMA
blocks of 20 and 70 mm thickness covering the complete detector, software for determining detector homogeneity
It is acknowledged that the Heel effect and geometric effects influences the results of the homogeneity measurement. If a specific system does not comply with the provisional limiting values it is advised to check whether geometric or the Heel effect causes this deviation or some malfunction in the system. For CR systems an additional homogeneity image can be obtained by exposing a cassette using half dose under normal conditions and half dose with the cassette rotated 180º in the bucky to minimize the Heel effect and geometric effects.
Addendum on digital mammography to chapter 3 of the European Guidelines, version 1.0
23
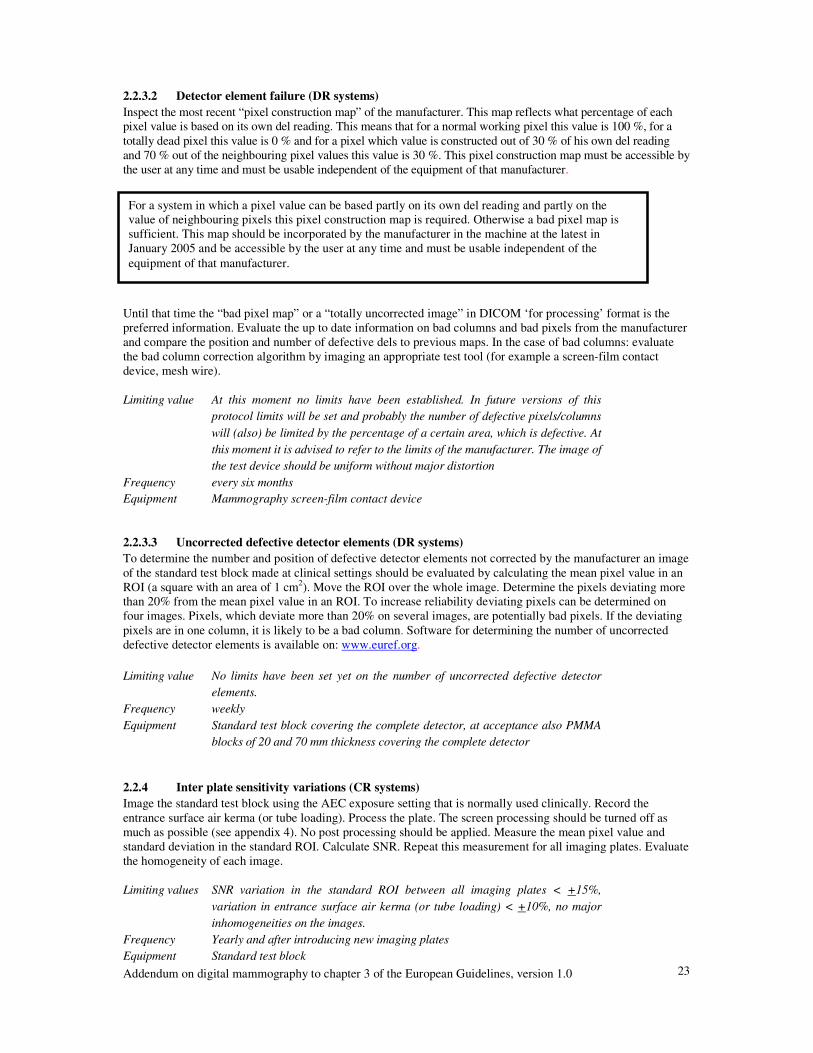
2.2.3.2 Detector element failure (DR systems) Inspect the most recent “pixel construction map” of the manufacturer. This map reflects what percentage of each pixel value is based on its own del reading. This means that for a normal working pixel this value is 100 %, for a totally dead pixel this value is 0 % and for a pixel which value is constructed out of 30 % of his own del reading and 70 % out of the neighbouring pixel values this value is 30 %. This pixel construction map must be accessible by the user at any time and must be usable independent of the equipment of that manufacturer. Until that time the “bad pixel map” or a “totally uncorrected image” in DICOM ‘for processing’ format is the preferred information. Evaluate the up to date information on bad columns and bad pixels from the manufacturer and compare the position and number of defective dels to previous maps. In the case of bad columns: evaluate the bad column correction algorithm by imaging an appropriate test tool (for example a screen-film contact device, mesh wire). Limiting value At this moment no limits have been established. In future versions of this
protocol limits will be set and probably the number of defective pixels/columns will (also) be limited by the percentage of a certain area, which is defective. At this moment it is advised to refer to the limits of the manufacturer. The image of the test device should be uniform without major distortion
Frequency every six months Equipment Mammography screen-film contact device 2.2.3.3 Uncorrected defective detector elements (DR systems) To determine the number and position of defective detector elements not corrected by the manufacturer an image of the standard test block made at clinical settings should be evaluated by calculating the mean pixel value in an ROI (a square with an area of 1 cm2). Move the ROI over the whole image. Determine the pixels deviating more than 20% from the mean pixel value in an ROI. To increase reliability deviating pixels can be determined on four images. Pixels, which deviate more than 20% on several images, are potentially bad pixels. If the deviating pixels are in one column, it is likely to be a bad column. Software for determining the number of uncorrected defective detector elements is available on: www.euref.org. Limiting value No limits have been set yet on the number of uncorrected defective detector
elements. Frequency weekly Equipment Standard test block covering the complete detector, at acceptance also PMMA
blocks of 20 and 70 mm thickness covering the complete detector 2.2.4 Inter plate sensitivity variations (CR systems) Image the standard test block using the AEC exposure setting that is normally used clinically. Record the entrance surface air kerma (or tube loading). Process the plate. The screen processing should be turned off as much as possible (see appendix 4). No post processing should be applied. Measure the mean pixel value and standard deviation in the standard ROI. Calculate SNR. Repeat this measurement for all imaging plates. Evaluate the homogeneity of each image. Limiting values SNR variation in the standard ROI between all imaging plates < +15%,
variation in entrance surface air kerma (or tube loading) < +10%, no major inhomogeneities on the images.
Frequency Yearly and after introducing new imaging plates Equipment Standard test block
For a system in which a pixel value can be based partly on its own del reading and partly on the value of neighbouring pixels this pixel construction map is required. Otherwise a bad pixel map is sufficient. This map should be incorporated by the manufacturer in the machine at the latest in January 2005 and be accessible by the user at any time and must be usable independent of the equipment of that manufacturer.

Addendum on digital mammography to chapter 3 of the European Guidelines, version 1.0
24
2.2.5 Influence of other sources of radiation (CR systems) Erase a single imaging plate. Tape two different coins, one on each side of the cassette. Store the imaging plate in the storage area during a maximal time period, for example during the complete acceptance test. Process the plate. The screen processing should be turned off as much as possible (see appendix 4). No post processing should be applied. Evaluate the visibility of the coins on the resulting image. Limiting value The coins should not be visible Frequency At acceptance and when changes in storage of the cassettes have occurred Equipment Two coins of different size (for example a one and a two Euro coin) 2.2.6 Fading of latent image (CR systems) Image the standard test block using one fixed exposure that is normally used clinically. Process the plate after 1 minute. Measure the mean pixel value in the standard ROI. Repeat the measurement with different time periods before read-out (2, 5, 10, 30 minutes). Limiting value Results at acceptance are used as reference Frequency At acceptance and when image quality problems are suspected Equipment Standard test block
2.3 Dosimetry
For dose measurements it is essential that the dose probe is positioned outside the region in which the exposure settings are determined. Image the standard test block with a routine exposure. Measure the entrance surface air kerma at the level of the test block. If necessary, correct the measured entrance surface air kerma to the entrance surface air kerma in the reference point. Calculate the average glandular dose of a breast equivalent to 45 mm thickness of PMMA as described in appendix 1. Repeat the measurement of entrance surface air kerma and calculation of average glandular dose for all AEC modes. Test all AEC modes at acceptance and the clinically used AEC mode every six months. This measurement is (partly) covered by section 2.1.3.5.1 Glandular dose per PMMA thickness. Limiting value Average glandular dose: acceptable < 2.5 mGy, achievable < 2 mGy Frequency Every six months, at acceptance: test all available AEC modes Equipment Dose meter, standard test block

Addendum on digital mammography to chapter 3 of the European Guidelines, version 1.0
25
2.4 Image Quality
2.4.1 Threshold contrast visibility Threshold contrast visibility is determined for circular details with diameters in the range from 0.1 to 2 mm. The details are imaged on a background object with a thickness equivalent (in terms of attenuation) to 50 mm of PMMA. The details must be positioned at a height of 20 to 25 mm above the breast support table10. Use the exposure factors that would be selected clinically. Make six images of the details and move the details slightly between the images to obtain images with different relative position of the details and the detector elements. Three experienced observers should determine the minimal contrast visible on two images. Every observer must score two different images. The whole detail diameter range specified in the table below must be covered. In this range minimal contrast visible for a large number of detail diameter must be determined at acceptance and at least 5 detail diameters in subsequent tests. This evaluation should be done on unprocessed images. The window width and level and zoom facilities must be adjusted to maximise the visibility of the details on the displayed images. The threshold contrast performance specified here relates to the nominal contrast calculated for the details for a 28 kV tube voltage with a molybdenum target and filter materials as explained in appendix 2. This nominal contrast depends on the thickness and materials used to manufacture the test object, and is independent of the actual spectrum used to form the image, which should be that used clinically. It does not include the effects of scatter. The average nominal threshold contrasts should be compared with the limiting values below. For CR systems: No post processing should be applied, the screen processing should be turned off as much as possible (see appendix 4). If the screens comply with the limiting values of section 2.2.4 inter plate sensitivity variations, it is not necessary to use the same screen in the threshold contrast visibility measurement. Limiting value See table
Threshold contrast Acceptable value Achievable value
Diameter of detail [mm]
radiation contrast using Mo/Mo 28 kV
[%]
equivalent gold thickness11
[�m]
radiation contrast using Mo/Mo 28 kV
[%]
equivalent gold thickness11
[�m] 5* < 0.85 0.056 < 0.45 0.032 2 < 1.05 0.069 < 0.55 0.038 1 < 1.40 0.091 < 0.85 0.056
0.5 < 2.35 0.150 < 1.60 0.103 0.25 < 5.45 0.352 < 3.80 0.244 0.1 < 23.0 1.68 < 15.8 1.10
* This diameter size is optional Frequency Yearly Equipment Contrast detail phantom
10 In future the PMMA thickness may change to the ‘standard thickness’ of 45 mm with the details positioned at a height of 40 to 45 mm above the breast support table. This may mean that the limiting values need slight adjustment. 11 CDMAM phantom with a 4 cm thickness of PMMA, see appendix 2.
It is acknowledged that at present it is not possible to get unprocessed images from some systems. For these systems threshold contrast visibility evaluation should be done on processed images. The image processing may introduce artefacts on phantom images and may be different from image processing for mammograms due to histogram or local texture based processing techniques. Therefore care needs to be taken in interpretation of these processed images.
Addendum on digital mammography to chapter 3 of the European Guidelines, version 1.0
26
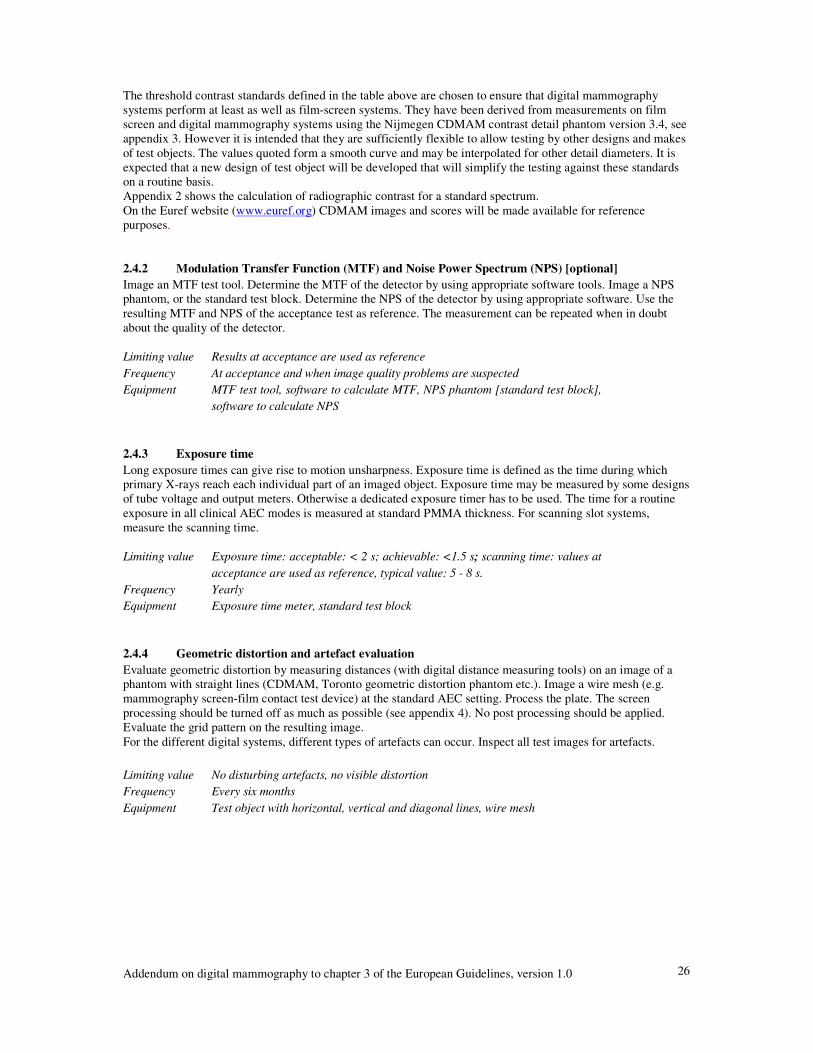
The threshold contrast standards defined in the table above are chosen to ensure that digital mammography systems perform at least as well as film-screen systems. They have been derived from measurements on film screen and digital mammography systems using the Nijmegen CDMAM contrast detail phantom version 3.4, see appendix 3. However it is intended that they are sufficiently flexible to allow testing by other designs and makes of test objects. The values quoted form a smooth curve and may be interpolated for other detail diameters. It is expected that a new design of test object will be developed that will simplify the testing against these standards on a routine basis. Appendix 2 shows the calculation of radiographic contrast for a standard spectrum. On the Euref website (www.euref.org) CDMAM images and scores will be made available for reference purposes. 2.4.2 Modulation Transfer Function (MTF) and Noise Power Spectrum (NPS) [optional] Image an MTF test tool. Determine the MTF of the detector by using appropriate software tools. Image a NPS phantom, or the standard test block. Determine the NPS of the detector by using appropriate software. Use the resulting MTF and NPS of the acceptance test as reference. The measurement can be repeated when in doubt about the quality of the detector. Limiting value Results at acceptance are used as reference Frequency At acceptance and when image quality problems are suspected Equipment MTF test tool, software to calculate MTF, NPS phantom [standard test block],
software to calculate NPS 2.4.3 Exposure time Long exposure times can give rise to motion unsharpness. Exposure time is defined as the time during which primary X-rays reach each individual part of an imaged object. Exposure time may be measured by some designs of tube voltage and output meters. Otherwise a dedicated exposure timer has to be used. The time for a routine exposure in all clinical AEC modes is measured at standard PMMA thickness. For scanning slot systems, measure the scanning time. Limiting value Exposure time: acceptable: < 2 s; achievable: <1.5 s; scanning time: values at
acceptance are used as reference, typical value: 5 - 8 s. Frequency Yearly Equipment Exposure time meter, standard test block 2.4.4 Geometric distortion and artefact evaluation Evaluate geometric distortion by measuring distances (with digital distance measuring tools) on an image of a phantom with straight lines (CDMAM, Toronto geometric distortion phantom etc.). Image a wire mesh (e.g. mammography screen-film contact test device) at the standard AEC setting. Process the plate. The screen processing should be turned off as much as possible (see appendix 4). No post processing should be applied. Evaluate the grid pattern on the resulting image. For the different digital systems, different types of artefacts can occur. Inspect all test images for artefacts. Limiting value No disturbing artefacts, no visible distortion Frequency Every six months Equipment Test object with horizontal, vertical and diagonal lines, wire mesh

Addendum on digital mammography to chapter 3 of the European Guidelines, version 1.0
27
2.4.5 Ghost image / erasure thoroughness A ghost image is the residue of a previous image on the present image. In this measurement an induced ghost image is related to the contrast of 0.1 mm Al at clinical setting. In manual mode an image of the 45 mm standard test block is made using clinical settings. The block is positioned such that half of the detector is covered and half of the detector is not covered. For the second image (at clinical settings) the standard test block covers the whole detector and the aluminium object is placed exactly centred on top of the standard block (see figure 2.4). The time between both images should be approximately one minute. For CR systems: No post processing should be applied, the screen processing should be turned off as much as possible (see appendix 4).
Fig. 2.4 Ghost image / erasure thoroughness measurement Measure the mean pixel value (PV) in the ROI (area: 4 cm²) on the locations shown in the figure above (on the second image) and calculate the ‘ghost image’-factor.
2)(regionvaluepixelmean1)(regionvaluepixelmean2)(regionvaluepixelmean3)(regionvaluepixelmean
factorimage"Ghost"−−
=
If the system fails to meet the limiting value, check the homogeneity of the image. If the Heel effect is large regions 1 to 3 should be chosen on a line parallel to chest wall side. Limiting value “Ghost image”-factor < 0.3 Frequency Yearly Equipment Standard test block, aluminium object of 0.1 mm thickness (for example: the
filters which are used for the HVL measurement)
3. Image processing
Image processing will not be considered in this version of the addendum. Manufacturers have to specify in general terms which image processing is applied.
2
1 4
3 Area with ghost Area without ghost
Aluminium object

Addendum on digital mammography to chapter 3 of the European Guidelines, version 1.0
28
4. Image presentation
The tests in this section are based upon the work of AAPM TG18 (American Association of Physicists in Medicine, Task Group 18). The TG18 test patterns described in this section should be obtained independently from the manufacturer, and can be downloaded from the TG18 website (2k versions should be used when available): http://deckard.mc.duke.edu/~samei/tg18. Some mammography display systems need adjusted versions of the test patterns, these will be available from the EUREF website. Some general remarks: - The test patterns have to be displayed at full resolution (exactly one display pixel for each pixel in the digital
image) or printed at full size, contrast and brightness of the images may not be adjusted. - For the tests in this chapter, the use of the display (primary class (diagnostic) or secondary class display
device) often determines the limiting values. - Some of the tests in this chapter are for Cathode Ray Tube (CRT) displays or Liquid Crystal Displays (LCDs)
only. - A magnifying glass may be used in the evaluation of printed images 4.1 Monitors
4.1.1 Ambient light Most of the quality tests in this chapter are highly sensitive to ambient light, therefore all of them should be performed under clinical conditions (room lights, light boxes and other display devices should be at the same luminance level as under clinical conditions). The ambient light should be measured at the centre of the display with the light detector facing outwards and the display switched off. Limiting value Ambient light should be less than 10 lux for primary display devices. [The
maximum ambient light actually depends on the reflection characteristics and minimum luminance of the monitor, but for reasons of simplicity this is ignored here.]
Frequency Every six months. (Every time the system is used, it has to be made sure that ambient light conditions have not changed.)
Equipment Illuminance meter

Addendum on digital mammography to chapter 3 of the European Guidelines, version 1.0
29
4.1.2 Geometrical distortion (CRT displays) Visually check whether the TG18-QC image (fig. 4.1) is displayed without geometrical distortion. To do so, inspect the lines and borders of the test pattern.
Limiting value Borders should be completely visible, lines should be straight, the active display area should be centred on the screen
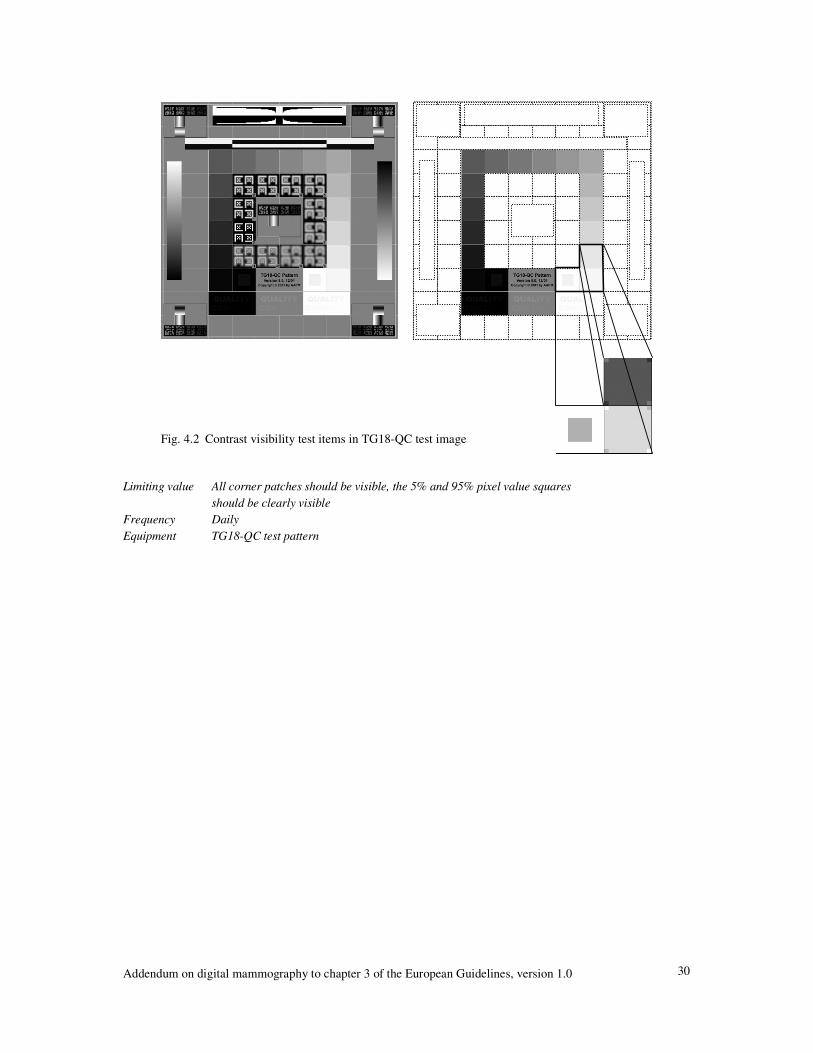
Frequency Daily Equipment TG18-QC test pattern 4.1.3 Contrast visibility The TG18-QC test pattern contains several items for evaluating the contrast visibility of a display. Each of the sixteen luminance patches located approximately equidistant from the centre of the image, contains four corner squares at equal low contrast steps to the patch (fig 4.2). The two patches in the bottom with minimum and maximum pixel value, surrounding the test pattern name, contain a centre square with a pixel value of 5% and 95% of the maximal grey level respectively. The letters “QUALITY CONTROL” in the three rectangles below these patches are displayed with decreasing contrast to the background. The visible part of the letters should be written down and checked with the visibility at acceptance, in order to keep track of contrast degradation. If contrast visibility is not sufficient, it may help to dim the room lights. If this is done however, the lights should also be dimmed while using the displaying system clinically. The appearance of the TG18-QC test pattern also depends on the mapping of pixel values to luminance. Therefore if this test has failed, the tests in sections 4.1.6 and 4.1.7 should be performed.
Fig. 4.1 TG18-QC test pattern
Addendum on digital mammography to chapter 3 of the European Guidelines, version 1.0
30
Limiting value All corner patches should be visible, the 5% and 95% pixel value squares
should be clearly visible Frequency Daily Equipment TG18-QC test pattern
Fig. 4.2 Contrast visibility test items in TG18-QC test image

Addendum on digital mammography to chapter 3 of the European Guidelines, version 1.0
31
4.1.4 Resolution Evaluate horizontal and vertical line patterns to check display resolution visually. AAPM Task Group 18 provides 6 line patterns at different background luminance levels. (Horizontal line patterns TG18-LPH10, -LPH50 and –LPH89; Vertical line patterns TG18-LPV10, -LPV50 and –LPV89.)
Limiting value All line patterns should be discernible Frequency Every 6 months Equipment 2kx2k TG18-LPH10, TG18-LPH50, TG18-LPH89, TG18-LPV10, TG18-
LPV50 and TG18-LPV89 test patterns 4.1.5 Display artefacts The TG18-QC test pattern also contains some elements, which can be used for recognising display artefacts. The image should be carefully checked for defect pixels (LCD only), steps in the black-to-white and white-to-black ramp bars (this can reveal an insufficient bit depth), and artefacts near the black-to-white and white-to-black transitions (video card). Also pay attention to temporal instability (flicker) and spatial instability (jitter). Limiting Values No disturbing artefacts should be visible Frequency Daily Equipment 2kx2k TG18-QC test pattern
Fig. 4.3 Zoomed versions of the TG18-LPH50 pattern

Addendum on digital mammography to chapter 3 of the European Guidelines, version 1.0
32
4.1.6 Luminance range Measure the maximum and minimum luminance of the display device. Test patterns TG18-LN12-01 and TG18-LN12-18 can be used. The ratio of maximum and minimum display luminance, in the presence of ambient light, is an indicator of luminance contrast response capabilities of the monitor (under the current environmental conditions). Both luminances should be measured using a telescopic luminance meter, to include the influence of ambient light. The ratio can be increased by reducing ambient light or by display adjustments. DICOM GSDF conformance (section 4.1.7) makes sure the available contrast is spread out in an appropriate and standard manner over the full greyscale range of the monitor. Limiting Values The maximum to minimum luminance ratio should be at least 250 for primary
display devices, or 100 for secondary display devices. The difference of maximum luminances between displays belonging to one displaying station should not exceed 1% of the lowest.
Frequency Every six months or when contrast visibility has changed Equipment Telescopic luminance meter, TG18-LN12-01 and TG18-LN12-18 test patterns 4.1.7 Greyscale Display Function To make sure a mammogram will appear similarly on different viewing stations and on printed film, the mapping of greyscale values to display luminance or optical density should be consistent. In this measurement it is determined whether a display conforms to the DICOM Greyscale Standard Display Function (GSDF). The greyscale display function (GDF) can be determined by measuring the luminance of the 18 AAPM luminance test patterns (TG18-LN12-01 through TG18-LN12-18). The test patterns should be displayed full screen and the luminance has to be measured at the centre of the screen. The shape of the GDF depends on the ambient light in the room. Therefore room lights, light boxes and other display devices should be at the same luminance level as when the system is used clinically. A telescopic luminance meter should be used to include the influence of ambient light. The measured values can be inserted into an spreadsheet (available on the Euref website: www.euref.org ) to automatically determine GSDF conformance. After doing this measurement, the amount of ambient light may not be increased anymore, otherwise the contrast response has to be measured again! Remark: This test only applies to primary and secondary display systems. The acquisition workstation monitor is excluded from this test. Due to the required ambient light levels in the mammography room the acquisition workstation monitor will not comply with the limiting values of primary and secondary displays. Therefore this monitor should only be used to check positioning techniques, not for diagnosis and image quality checks. Limiting value The calculated contrast response should fall within ± 10% of the GSDF contrast response for
primary class displays (± 20% for secondary class displays) Frequency Every six months and when contrast visibility has changed Equipment Telescopic luminance meter, TG18-LN12-01 through TG18-LN12-18 test patterns
It is acknowledged that some displaying systems do not comply with the DICOM Greyscale Standard Function. Manufacturers are urged to comply with this standard.

Addendum on digital mammography to chapter 3 of the European Guidelines, version 1.0
33
4.1.8 Luminance uniformity When the display has been tested for DICOM conformance at the centre of the monitor, this does not mean contrast visibility is optimal at every position on the monitor. One could test the GDF for several locations on the monitor, but it is more convenient to check display uniformity. Measure the display luminance at five locations for each monitor. The test patterns TG18-UNL10 and TG18-UNL80 can be used (fig. 4.4).
Limiting value Maximum luminance deviation of a display device should be less than 30% for
CRT displays and less than 10% for LCD displays ((Lmax-Lmin)/Lcentre<0.3). Frequency Every six months and when contrast visibility has changed Equipment Luminance meter (telescopic luminance meters should be equipped with a cone
or baffle for this measurement), TG18-UNL10 and TG18-UNL80 test patterns
Fig. 4.4 TG18-UNL10 and TG18-UNL80 test patterns

Addendum on digital mammography to chapter 3 of the European Guidelines, version 1.0
34
4.2 Printers
4.2.1 Geometrical distortion Print the TG18-QC test pattern (fig. 4.1) and check visually if the image is printed without geometrical distortion. Only the lines and borders of the test pattern are used to do this. Limiting value Borders should be completely visible, lines should be straight Frequency Daily Equipment TG18-QC test pattern 4.2.2 Contrast visibility Print the TG18-QC test pattern (see fig. 4.1). Check the visibility of the several items for evaluating the contrast visibility (see fig. 4.2). Be sure that the viewing box, on which the test pattern is checked, has sufficient luminance. If contrast visibility is not sufficient, it may help to use diaphragms (if clinically used) or dim the room lights. If this is done however, the lights should also be dimmed while using the displaying system clinically. The appearance of the TG18-QC test pattern also depends on the mapping of pixel values to densities. Therefore if this test has failed, the tests in sections 4.2.5 and 4.2.6 should be performed. Limiting value All corner patches should be visible, the 5% and 95% pixel value squares
should be clearly visible Frequency Daily Equipment TG18-QC test pattern 4.2.3 Resolution Evaluate horizontal and vertical line patterns to check the resolution of a print-out. The fine detail horizontal and vertical line patterns in the TG18-PQC test pattern (fig 4.5) can be used.
Limiting value All line patterns should be discernible12 Frequency At acceptance and when decreased resolution is suspected Equipment TG18-PQC test pattern
12 Aliasing problems may occur due to the difference in pixel size of the printer and test pattern.
Fig. 4.5 TG18-PQC test pattern

Addendum on digital mammography to chapter 3 of the European Guidelines, version 1.0
35
4.2.4 Printer artefacts Print the TG18-QC, -PQC, -UN80 and -UN10 test patterns. Check the image for printer artefacts, for example banding and streaking artefacts, pick-off artefacts, etc. Limiting Values No disturbing artefacts should be visible Frequency Daily Equipment TG18-QC, TG18-PQC, TG18-UN10 and TG18-UN80 test patterns 4.2.5 Optical Density Range (optional) Print the TG18-QC test pattern. Measure Dmin and Dmax on this image. Limiting value Dmin < 0.25 OD, Dmax > 3.40 OD13 (provisional) Frequency Every six months Equipment Densitometer, TG18-QC test pattern 4.2.6 Greyscale Display Function To make sure a mammogram will appear similarly on different viewing stations and on printed film, the mapping of greyscale values to display luminance or optical density should be consistent. In this measurement it is determined whether a printer conforms to the DICOM Greyscale Standard Display Function (GSDF). The greyscale display function (GDF) can be determined by printing the TG18-PQC test pattern and measuring the optical density of marked regions of the 18 bars. The GDF is determined by the luminance corresponding with the optical density. The relationship between the luminance (L) and the optical density (D) of the printed bars is: L = La + L0 * 10-D where: La is the luminance contribution due to ambient illuminance reflected off the film, and L0 is the luminance of the light box with no film present Printed mammograms may be viewed on different viewing boxes and under a variety of viewing conditions. It is not desirable to repeat this measurement for each viewing box. Assuming each viewing box, on which printed mammograms will be diagnosed, complies with the limiting values, a standard viewing box is defined. For this standard viewing box La is 10 cd/m2 and L0 is 4000 cd/m2. The measured values can be inserted into an spreadsheet (available on the Euref website: www.euref.org ) to automatically determine GSDF conformance. Limiting value The calculated contrast response should fall within ± 10% of the GSDF contrast response Frequency Every six months and when contrast visibility has changed Equipment Densitometer, TG18-PQC test pattern
13 Further research is necessary to investigate whether the Dmin and Dmax limiting values are appropriate.
Addendum on digital mammography to chapter 3 of the European Guidelines, version 1.0
36
4.2.7 Density uniformity Print the test patterns TG18-UNL10 and TG18-UNL80. Measure the optical density at the five marked locations. Limiting value Maximum optical density deviation should be less than 10% ((Dmax-Dmin)/Dcentre<0.1) Frequency Every six months and when contrast visibility has changed Equipment Densitometer, TG18-UNL10 and TG18-UNL80 test patterns
4.3 Viewing boxes
If mammograms are read on printed images, check the viewing boxes using the method and limiting values described in the European guidelines for quality assurance in mammography screening, third edition (page 87).
5. CAD software
May be considered in future versions of this protocol.

Addendum on digital mammography to chapter 3 of the European Guidelines, version 1.0
37
Bibliography Protocols 1. European Guidelines for Quality Assurance in Mammography Screening, third edition, European
Communities, 2001 2. Quality Control Procedures for Full-field Digital Mammography, 2002: ACRIN # 6652, Digital
Mammography Imaging Screening Trial, rev. 2.06, April 2002 3. Meetprotocol Digitale mammografie: Acceptatietest van Screeningseenheden voor
Bevolkingsonderzoek op Borstkanker, versie 2002, National Expert and Training Centre for Breast Cancer Screening, University Medical Centre Nijmegen
4. Recommandations pour un programme d'assurance de qualité en mammographie numérique. A. Noel, J. Stinès (red.). J. Radiol 2003; 84: 723-9
5. European protocol on dosimetry in mammography, European Communities, 1996. 6. IPSM: Commissioning and routine testing of mammography X-ray systems – second edition, The
Institute of Physical Sciences in Medicine, York, 1994 (report no. 59/2) 7. Guidelines on quality assurance visits, NHSBSP, Second edition October 2000 (NHSBSP Publication
No 40) Publications 1. E. Samei, J.A. Seibert, C.E. Willis, M.J. Flynn, E. Mah, K.L. Junck: Performance evaluation of
computed radiography systems 2001: Med. Phys 28(3): 361-371
2. C. Kimme-Smith, C. Lewis, M. Beifuss, L.W.Bassett: Establishing minimum performance standards, calibration intervals and optimal exposure values for a whole breast digital mammography unit. 1998: Med. Phys. 25 (12): December
3. H. Fujita, D.Tsai, T. Itoh, K. Doi, J. Morishita, K. Ueda, A. Ohtsuka: A simple method for determining the modulation transfer function in digital radiography 1992: IEEE Transactions on Medical Imaging 11(1): 34-39
4. E. Samei, M.J. Flynn, D.A. Reimann: A method for measuring the presampled MTF of digital radiographic systems using an edge test device. 1998: Med. Phys. 25(1): 102-113
5. A. Noël, J. Stines: Contrôle de qualité: du conventionnel au numérique 2002: J. Le Sein 12(1-2): 17-21 6. K.G. Lisk: SMPTE test pattern for certification of medical diagnostic display devices 1984: Proc. of SPIE 486: 79-82 7. W.Huda, A.M. Sajewicz, K.M. Ogden, E.M. Scalzetti, D.R. Dance: How good is the ACR accreditation
phantom for assessing image quality in digital mammography 2002: Acad. Radiol. 9: 764-772 8. J.T. Dobbins: Effects of undersampling on the proper interpretation of mudulation transfer function,
noise power spectra and noise equivalent quanta of digital imaging systems Med. Phys. 22: 171-181 9. J.P. Moy, B. Bosset: How does real offset and gain corrections affect the DQE in images from X-ray
Flat detectors 1999: proc. of SPIE 3659 10. C.K. Ly: Softcopy Display Quality Assurance Program at Texas Children’s Hospital 2002: Journal Of Digital Imaging, online publication: March 11. D.R. Dance et al., Monte Carlo calculation of conversion factors for the estimation of mean glandular
breast dose, Phys.Med.Biol., 1990, Vol. 35, 1211-1219 12. D.R. Dance et al., Additional factors for the estimation of mean glandular dose using the UK
mammography protocol, Phys.Med.Biol., 2000, Vol. 45, 3225-3240 13. Z.F. Lu et al., Monthly monitoring program on DryviewTM laser imager: One year experince on five
Imation units, Med. Phys. 26 (9), 1817-1821

Addendum on digital mammography to chapter 3 of the European Guidelines, version 1.0
38
Other reports 1. Assessment of display performance for medical imaging systems, pre-final draft (version 8.1), AAPM,
Task Group 18, E. Samei (chairman) et al. 2002: AAPM TG 18
2. Mammography – recent technical developments and their clinical potential, B. Hemdal et al. 2002: Statens strålskyddinstitut, Swedish Radiation Protection Authority
3. Quality Assurance, meeting the challenge in the Digital Medical Enterprise, B.I. Reiner, E.L. Siegel, J.A. Carrino (ed.)
2002: Society for Computer Applications in Radiology 4. Qualitätssicherung an Bildwiedergabegeräten, ed. D. Richter. 2002: ZVEI-Fachverband Elektromedizinische Technik 5. DIN 6868-13:2003-02 Sicherung der Bildqualität in röntgendiagnostischen Betrieben – Teil 13:
Konstanzprüfungbei Projektionsradiographie mit digitalen Bildempfänger-Systemen 6. DIN V 6868-58:2001-01 Sicherung der Bildqualität in röntgendiagnostischen Betrieben – Teil 58:
Abnahmeprüfung an medizinischen Röntgeneinrichtungen der Projektionsradiographie mit digitalen Bildempfängersystemen
7. IEC 61223-3-2, 2nd edition (IEC MT 31: draft for Wuerzburg), Part 3-2: Acceptance tests –Imaging performance of mammographic X-ray equipment, 2003
8. Handbook of Medical Imaging vol 1, J. Beutel, H.L. Kundel, R.L. Van Metter 2000: SPIE Press 9. Breast dose surveys in the NHSBSP, software and instruction manual, K.C. Young., NHS Cancer
Screening Programmes, 2001 (NHSBSP report no 01/10) 10. IPEM report 78 Catalogue of diagnostic X-ray spectra & other data, K. Cranley et al., 1997. 11. Performance of mammographic equipment in the UK breast cancer screening programme in 1998/99,
2000 (NHSBSP report no 45) 12. Review of radiation risk in breast screening, 2003 (NHSBSP report no 54) 13. Results of technical quality control in the Dutch breast cancer screening programme (2001-2002), S.W.
Beckers et al., Nijmegen 2003 14. Patientdoser från röntgenundersökningar i Sverige, W. Leitz et al. Statens strålskyddsinstitut 2001 15. Mammografiscreening, teknisk kvalitetskontroll – resultater og evaluering etter fire års prøveprosjekt,
K. Pedersen et al., Statens strålevern 2000 Internet 1. Euref website: www.Euref.org 2. AAPM Task group 18 (test patterns monitor QC): http://deckard.mc.duke.edu/~samei/tg18 3. DICOM standard: http://medical.nema.org

Addendum on digital mammography to chapter 3 of the European Guidelines, version 1.0
39
Appendix 1: Procedure for determination of average glandular dose in digital mammography
A1.1 Dose to typical breasts simulated with PMMA
The doses to a range of typical breasts can be assessed using blocks of PMMA as breast substitutes. This method relies on the equivalence in attenuation between different thicknesses of PMMA and typical breasts [Dance et al, 2000] as listed in tables A1.1 and A1.2. It should be noted that since PMMA is generally denser than breast tissue any automatic selection of kV, target or filter may be slightly different from real breasts. This can be corrected by adding expanded polystyrene blocks to the PMMA as a spacer to make up a total thickness equal to the equivalent breast. On systems that determine the exposure factors primarily on attenuation such as the GE 2000D this should not be necessary. The average glandular dose (D) to a typical breast of thickness and composition equivalent to the thickness of PMMA tested is calculated by applying the following formula. D = Kgcs (A1.1) where K is the entrance surface air kerma (without backscatter) calculated at the upper surface of the PMMA. The factor g, corresponds to a glandularity of 50%, and is derived from the values calculated by Dance et al 2000 and is shown in table A1.1 for a range of HVL. The c-factor corrects for the difference in composition of typical breasts from 50% glandularity [Dance et al 2000] and is given here for typical breasts in the age range 50 to 64 in table A1.2. Note that the c and g-factors applied are those for the corresponding thickness of typical breast rather than the thickness of PMMA block used. Where necessary interpolation may be made for different values of HVL. Typical values of HVL for various spectra are given in table A1.3. The factor s shown in table A1.4 corrects for differences due to the choice of X-ray spectrum (Dance et al 2000). The dose should be determined using the usual clinically selected exposure factors including any automatic selection of kV and target/filter combination. A1.2 Clinical breast doses
It is also possible to measure the average glandular doses for a series of breast examinations on each mammography system. To do this, the breast thickness under compression is measured, and the tube voltage, and tube loading delivered are recorded. From a knowledge of the output of the X-ray set for the kV and target and filter material used, this tube loading may be used to estimate average glandular dose using the following formula: D=Kgcs (A1.2) where K is the entrance surface air kerma calculated (in the absence of scatter) at the upper surface of the breast. The factor g, corresponds to a glandularity of 50%, and is shown in table A1.5 (Dance et al 2000). The factor c corrects for any difference in breast composition from 50% glandularity. C-factors for typical breast compositions in the age range 50 to 64 and 40 to 49 are shown in tables A1.6 and A1.7. The factor s corrects for differences due to the choice of X-ray spectrum as noted earlier. Measurement of compressed breast thickness for this purpose is performed by the radiographer, by reading the displayed compressed thickness on the X-ray set. The accuracy of the displayed thickness should be verified by applying a typical force (e.g. 100 N) to rigid material of known thickness. It may be necessary to apply correction factors if the displayed values are in error. An accuracy of better than ± 2 mm is required. Software for making such dose calculations has been published by the UK Breast Screening Programme (Young, 2001).

Addendum on digital mammography to chapter 3 of the European Guidelines, version 1.0
40
Table A1.1: g-factors for breasts simulated with PMMA g-factors (mGy/mGy)
HVL (mm Al)
PMMA thickness (mm)
Equivalent breast thickness
(mm) 0.25 0.30 0.35 0.40 0.45 0.50 0.55 0.60
20 21 0.329 0.378 0.421 0.460 0.496 0.529 0.559 0.585 30 32 0.222 0.261 0.294 0.326 0.357 0.388 0.419 0.448 40 45 0.155 0.183 0.208 0.232 0.258 0.285 0.311 0.339 45 53 0.130 0.155 0.177 0.198 0.220 0.245 0.272 0.295 50 60 0.112 0.135 0.154 0.172 0.192 0.214 0.236 0.261 60 75 0.088 0.106 0.121 0.136 0.152 0.166 0.189 0.210 70 90 0.086 0.098 0.111 0.123 0.136 0.154 0.172 80 103 0.074 0.085 0.096 0.106 0.117 0.133 0.149
Table A1.2: c-factors for breasts simulated with PMMA
c-factors HVL (mm Al)
PMMA thickness
(mm)
Equivalent breast thickness
(mm)
Glandularity of equivalent breast
0.30 0.35 0.40 0.45 0.50 0.55 0.60
20 21 97 0.889 0.895 0.903 0.908 0.912 0.917 0.921 30 32 67 0.940 0.943 0.945 0.946 0.949 0.952 0.953 40 45 41 1.043 1.041 1.040 1.039 1.037 1.035 1.034 45 53 29 1.109 1.105 1.102 1.099 1.096 1.091 1.088 50 60 20 1.164 1.160 1.151 1.150 1.144 1.139 1.134 60 75 9 1.254 1.245 1.235 1.231 1.225 1.217 1.207 70 90 4 1.299 1.292 1.282 1.275 1.270 1.260 1.249 80 103 3 1.307 1.299 1.292 1.287 1.283 1.273 1.262
Table A1.3: Typical HVL measurements for different tube voltage and target filter combinations. (Data includes the effect on measured HVL of attenuation by a compression plate.)
HVL (mm Al) for target filter combination kV Mo Mo Mo Rh Rh Rh W Rh 25 0.33 ± .02 0.40 ± .02 0.38 ± .02 0.52 ± .03 28 0.36 ± .02 0.42 ± .02 0.43 ± .02 0.54 ± .03 31 0.39 ± .02 0.44 ± .02 0.48 ± .02 0.56 ± .03
Table A1.4: s-factors for clinically used spectra [Dance et al 2000]
Spectrum s-factor Mo/Mo 1.000 Mo/Rh 1.017 Rh/Rh 1.061 Rh/Al 1.044 W/Rh 1.042

Addendum on digital mammography to chapter 3 of the European Guidelines, version 1.0
41
Table A1.5: g-factors (mGy/mGy) for breast thicknesses of 2-11 cm and the HVL range 0.30-0.60 mm Al. The g-factors for breast thicknesses of 2-8 cm are taken from Dance (1990), and for 9-11 cm from Dance et al (2000).
g-factors (mGy/mGy) HVL mm Al
Breast Thickness (cm)
0.30 0.35 0.40 0.45 0.50 0.55 0.60 2 0.390 0.433 0.473 0.509 0.543 0.573 0.587 3 0.274 0.309 0.342 0.374 0.406 0.437 0.466 4 0.207 0.235 0.261 0.289 0.318 0.346 0.374
4.5 0.183 0.208 0.232 0.258 0.285 0.311 0.339 5 0.164 0.187 0.209 0.232 0.258 0.287 0.310 6 0.135 0.154 0.172 0.192 0.214 0.236 0.261 7 0.114 0.130 0.145 0.163 0.177 0.202 0.224 8 0.098 0.112 0.126 0.140 0.154 0.175 0.195 9 0.0859 0.0981 0.1106 0.1233 0.1357 0.1543 0.1723 10 0.0763 0.0873 0.0986 0.1096 0.1207 0.1375 0.1540 11 0.0687 0.0786 0.0887 0.0988 0.1088 0.1240 0.1385
Table A1.6: c-factors for average breasts for women in age group 50 to 64 (Dance et al 2000)
c-factors HVL (mm Al)
Breast thickness
(cm) 0.30 0.35 0.40 0.45 0.50 0.55 0.60 2 0.885 0.891 0.900 0.905 0.910 0.914 0.919 3 0.925 0.929 0.931 0.933 0.937 0.940 0.941 4 1.000 1.000 1.000 1.000 1.000 1.000 1.000 5 1.086 1.082 1.081 1.078 1.075 1.071 1.069 6 1.164 1.160 1.151 1.150 1.144 1.139 1.134 7 1.232 1.225 1.214 1.208 1.204 1.196 1.188 8 1.275 1.265 1.257 1.254 1.247 1.237 1.227 9 1.299 1.292 1.282 1.275 1.270 1.260 1.249 10 1.307 1.298 1.290 1.286 1.283 1.272 1.261 11 1.306 1.301 1.294 1.291 1.283 1.274 1.266
Table A1.7: c-factors for average breasts for women in age group 40 to 49 (Dance et al 2000)
c-factors HVL (mm Al)
Breast thickness
(cm) 0.30 0.35 0.40 0.45 0.50 0.55 0.60 2 0.885 0.891 0.900 0.905 0.910 0.914 0.919 3 0.894 0.898 0.903 0.906 0.911 0.915 0.918 4 0.940 0.943 0.945 0.947 0.948 0.952 0.955 5 1.005 1.005 1.005 1.004 1.004 1.004 1.004 6 1.080 1.078 1.074 1.074 1.071 1.068 1.066 7 1.152 1.147 1.141 1.138 1.135 1.130 1.127 8 1.220 1.213 1.206 1.205 1.199 1.190 1.183 9 1.270 1.264 1.254 1.248 1.244 1.235 1.225 10 1.295 1.287 1.279 1.275 1.272 1.262 1.251 11 1.294 1.290 1.283 1.281 1.273 1.264 1.256

Addendum on digital mammography to chapter 3 of the European Guidelines, version 1.0
42
Appendix 2: Calculation of contrast for details in a contrast–detail test object
The minimum and achievable standards in section 2.4.1 depend on the calculation of nominal contrast for the details involved. To allow different designs of test object the standard is specified in terms of radiation contrast for a typical spectrum using a tube voltage of 28 kV, a molybdenum target material and a 30 µm thick molybdenum filter. (The spectrum was derived from IPEM Report 78). The contrast of the discs and the threshold limiting values have been determined using the CDMAM phantom with a 2 cm thickness of PMMA above and 2 cm thickness below the test object. The CDMAM phantom includes an aluminium base which is approximately equivalent to 1cm of PMMA in terms of attenuation. In the European guidelines third edition however 4.5 cm has been chosen as the standard thickness of PMMA. Therefore in future threshold contrast might be determined at a total thickness equivalent to 4.5 cm PMMA. Calculated contrast for various thicknesses of gold are shown in Table A2.1. The corresponding contrast calculated for the use of a CDMAM phantom with 4 cm of PMMA and for gold details on 4.5 cm PMMA is shown. In both cases the effect of scatter is not included in the calculation. Table A2.1: Calculated radiation contrast for various gold thickness’ on the standard test object
Thickness of gold (µm)
Radiation contrast (%) for gold disc on 4.5 cm PMMA
Radiation contrast (%) for CDMAM with 4 cm PMMA
0.1 1.63 1.57 0.5 7.83 7.60 1.0 15.02 14.55 1.5 21.57 20.92 2.0 27.56 26.76

Addendum on digital mammography to chapter 3 of the European Guidelines, version 1.0
43
Appendix 3: Justification of limiting values
In this addendum on digital mammography limiting values used in screen-film mammography have been applied as much as possible to digital mammography. To check whether digital mammography systems would comply tests have been performed on a number of different digital systems. For some tests limiting values were non-existent in screen-film mammography. In those cases limiting values are based on research and measurements on digital systems. If the limiting values are tentative they are marked ‘provisional’. In the next sections the choice of limiting values on dose and image quality will be explained in more detail. A3.1 Average glandular dose limiting values
It is reasonable to state that average glandular dose levels in digital mammography systems must be (at the most) comparable to screen-film systems. To ensure this the limiting dose values in the addendum have been changed compared to the third edition of the European guidelines for quality assurance in mammography screening in three aspects: In the addendum the clinical spectrum is used for dose measurements instead of a standard spectrum, the dose limits have been made independent of optical density and a limiting dose value per PMMA thickness is introduced. The reasons for these changes will be explained in the next paragraphs. o In the third edition limiting dose values were measured using a standard spectrum. This requirement of the
third edition cannot be fulfilled by some digital mammography systems due to the available spectra. For example: scanning slot systems use tungsten instead of molybdenum targets due to the required tube loading. Furthermore using clinical spectra in dose measurements is closer to clinical practice.
o In the third edition Entrance Surface Air Kerma limits at standard thickness are dependent on optical density. In practice ESAK values are found to be far below the limiting value for the relevant optical density. In digital mammography the link between limiting dose values and OD is non-existent. Therefore a choice had to be made which limiting dose value would be appropriate for digital mammography. In the view of the authors dose should not increase substantially when changing to digital mammography following the ALARA principle. Data from the Dutch (Beckers 2003), Swedish (Leitz 2001), Norwegian (Pedersen 2000) and UK (NHSBSP 2000, 2003) screening programmes show that average glandular dose levels in screen-film mammography systems are between 0.8 and 2.5 mGy for 4.5 cm PMMA in clinical settings (corrected for difference in standard PMMA thickness in the UK and the Netherlands). Therefore an average glandular dose limit of 2.5 mGy at standard thickness in clinical settings has been chosen to ensure that dose levels in digital mammography will not exceed those of screen-film mammography. This limiting value is comparable to the objective of the NHSBSP in the UK to have average glandular dose levels of 2 mGy or less (for 4.0 cm PMMA) and the limiting average glandular dose value for the Dutch screening programme (3 mGy for 5.0 cm PMMA). [In the fourth edition of the European guidelines the dose limits dependence on OD might be revised.]
o In the addendum limiting dose values per PMMA thickness have been introduced. This has been done because in some non-AEC systems it was noticed that manufacturers decreased dose at standard thicknesses to comply with the limiting value at standard thickness while dose levels at other thickness were found to be (much) higher than usual. Besides this it has been found that some systems did use much lower tube voltages than in screen-film mammography (thus increasing patient dose substantially). These very low values proved unnecessary for image quality, therefore the use of these tube voltages does not comply with the ALARA principle. Setting limiting dose levels per PMMA thickness prevents this situation. The limiting values for PMMA thicknesses other than standard thickness have been obtained by averaging all glandular dose levels per PMMA thickness from the Dutch screening programme. The resulting average glandular dose against PMMA thickness curve has been scaled to the limiting value at standard thickness. The results have been compared with the dose values per PMMA thickness found in the UK and some of the German screening projects (screen-film mammography). The limiting values were found to be reasonable.

Addendum on digital mammography to chapter 3 of the European Guidelines, version 1.0
44
A3.2 Image quality limiting values
It is reasonable to state that image quality of digital mammography must be (at least) comparable to screen-film mammography. Therefore the image quality of screen-film mammography systems in the UK has been determined using CD analysis. The CDMAM phantom version 3.4 has been used for these measurements. Because some older equipment is present in the screening, it has been decided that image quality limiting values for digital mammography should be at such level that 90% of the screen-film systems would comply. The resulting limiting values have been checked with the image quality levels found in the Dutch screening and in some of the German screening projects (of which data was available) and were found to be realistic. Furthermore the limiting values have been checked with the CD curves from some hospitals in which it was established (by radiologists) that image quality of the digital system was too low for mammography. The CD curves in these hospitals do not meet the limiting values.

Addendum on digital mammography to chapter 3 of the European Guidelines, version 1.0
45
Appendix 4: CR screen processing modes
For all test-items the following screen processing settings must be chosen except for the test-items listed below. If a specific system or screen processing mode is not mentioned below, it is advised to refer to the manual of the manufacturer: Fuji systems Use FIXED EDR screen processing, suggested: S=120, L=2 Kodak systems Use Pattern screen processing Agfa systems Use System diagnostics/flat field screen processing 2.1.3.5.2 Signal to Noise Ratio (SNR) and Contrast to Noise Ratio (CNR) Fuji systems Semi EDR screen processing
FIXED EDR screen processing, suggested: S=120, L=2 Kodak systems Use Pattern screen processing Agfa systems Use System diagnostics/flat field screen processing 2.2.1.1 Response function The following relations between pixel value (sensitivity/exposure index) and entrance surface air kerma should be linear (If a screen processing mode is not mentioned below, it is advised to refer to the manual of the manufacturer): Fuji systems: Linear relations: Fixed EDR screen processing suggested: S=120, L=2
Plot the mean pixel value in the standard ROI versus log entrance surface air kerma
Semi EDR screen processing Plot sensitivity index versus inverse entrance surface air kerma Kodak systems: Pattern screen processing Plot the mean pixel value in the standard ROI versus log entrance surface
air kerma Agfa systems: System diagnostics/flat field screen processing
Plot the mean pixel value in the standard ROI versus log entrance surface air kerma
2.4.1 Threshold contrast visibility Fuji systems Use FIXED EDR screen processing. The S and L value must be chosen
such that they are typical for the clinical situation. These values may differ from site to site. Typical values (according to Fuji): S=40 to 100, L=1.8 to 2.6.
Kodak systems Use Pattern screen processing Agfa systems Use System diagnostics/flat field screen processing

Addendum on digital mammography to chapter 3 of the European Guidelines, version 1.0
46
2.4.5 Ghost image / erasure thoroughness Fuji systems Use FIXED EDR screen processing. The S and L value must be chosen
such that they are typical for the clinical situation. These values may differ from site to site. Typical values (according to Fuji): S=40 to 100, L=1.8 to 2.6.
Kodak systems Use Pattern screen processing Agfa systems Use System diagnostics/flat field screen processing

Addendum on digital mammography to chapter 3 of the European Guidelines, version 1.0
47
Appendix 5: Guidance for QC measurements on systems which only use breast thickness to determine exposure settings
Currently some digital mammography X-ray systems do not incorporate an AEC. Some of this equipment does incorporate an exposure control device, which uses the height of the compression paddle to set the exposure factors. These systems do not take breast composition into account and therefore cannot be fully optimized with respect to image quality and patient dose. It is generally recommended that systems incorporating an AEC are used for mammography screening. The authors advise against the use of mammography X-ray units on which the exposure settings have to be set completely manually. This appendix will give some guidance on QC measurements on non-AEC systems, which do incorporate a programmed look-up-table (LUT) based on the measured thickness of the compressed breast. The mammography system must be tested as clinically used. Some systems do incorporate several different exposure tables (with different dose levels) for different breast compositions. It is up to the user to determine breast composition. This may lead to under-exposure (lower image quality) or overexposure (higher patient dose than necessary) if breast composition is different than expected. Because the exposure is determined by breast thickness instead of PMMA thickness, PMMA thickness has to be recalculated to equivalent breast thickness for measurement A5.1 and A5.2. To get the correct exposure, position the compression paddle at the equivalent breast thickness or set the exposure from the LUT manually. Exposure factors between given breast thicknesses in the LUT may be interpolated. Because exposure is determined by thickness indication, it is essential that this indication is correct. Therefore thickness indication must be checked for this kind of non-AEC systems, see section A5.3.
Table A5.1 Conversion table between PMMA thickness and equivalent breast thickness (Dance et al 2000) PMMA thickness
(mm) Equivalent breast
thickness (mm)
20 21 30 32 40 45 45 53 50 60 60 75 70 90 80 103
A5.1 Threshold contrast visibility
Contrast threshold measurements should be done according to clinical practice. If different LUTs based on breast compositions are available (and used), measure contrast threshold in the standard mode (as described in section 2.4.1). The system must comply with the contrast threshold limits as described in section 2.4.1. The dose for fatty and dense breasts should respectively be about 0.7 and 1.4 times the dose in the standard LUT. If only one LUT is available for all breast types or only the standard LUT is used, add 0.5 cm of PMMA on top of the PMMA pile in contrast threshold measurements to simulate dense breasts. With this extra 0.5 cm PMMA the system must be able to pass the contrast threshold limiting values (see section 2.4.1).
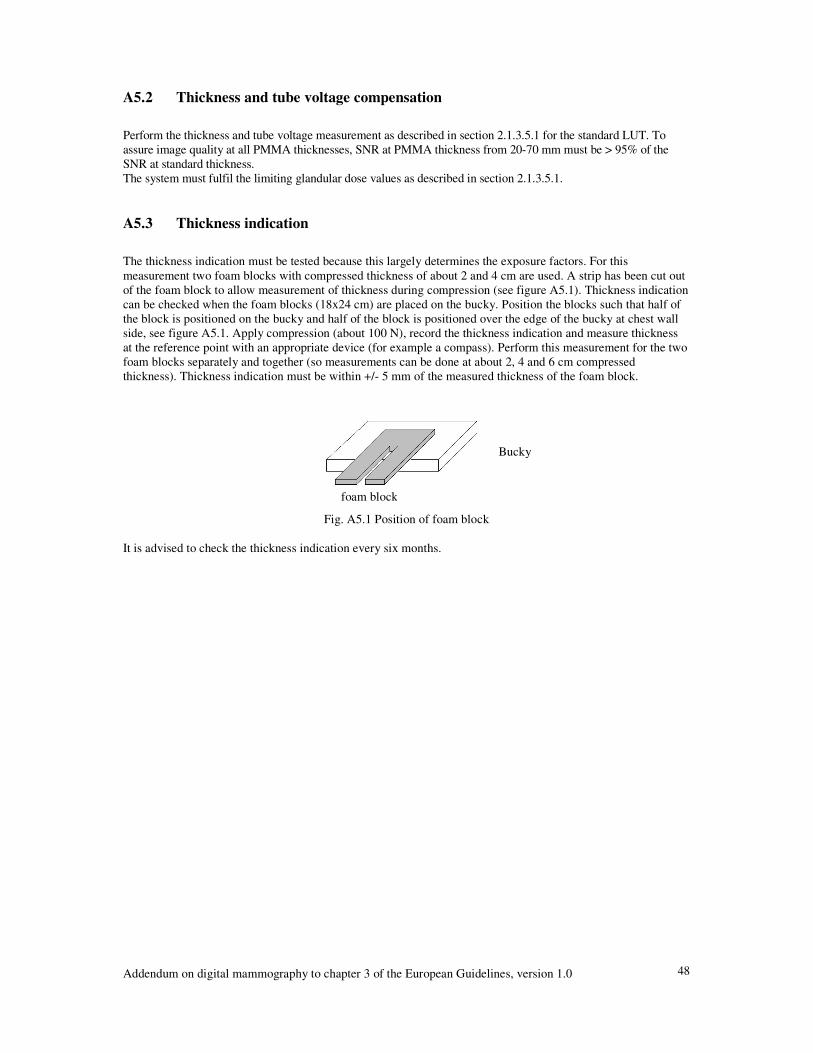
Addendum on digital mammography to chapter 3 of the European Guidelines, version 1.0
48
A5.2 Thickness and tube voltage compensation
Perform the thickness and tube voltage measurement as described in section 2.1.3.5.1 for the standard LUT. To assure image quality at all PMMA thicknesses, SNR at PMMA thickness from 20-70 mm must be > 95% of the SNR at standard thickness. The system must fulfil the limiting glandular dose values as described in section 2.1.3.5.1. A5.3 Thickness indication
The thickness indication must be tested because this largely determines the exposure factors. For this measurement two foam blocks with compressed thickness of about 2 and 4 cm are used. A strip has been cut out of the foam block to allow measurement of thickness during compression (see figure A5.1). Thickness indication can be checked when the foam blocks (18x24 cm) are placed on the bucky. Position the blocks such that half of the block is positioned on the bucky and half of the block is positioned over the edge of the bucky at chest wall side, see figure A5.1. Apply compression (about 100 N), record the thickness indication and measure thickness at the reference point with an appropriate device (for example a compass). Perform this measurement for the two foam blocks separately and together (so measurements can be done at about 2, 4 and 6 cm compressed thickness). Thickness indication must be within +/- 5 mm of the measured thickness of the foam block.
Fig. A5.1 Position of foam block
It is advised to check the thickness indication every six months.
Bucky
foam block

Addendum on digital mammography to chapter 3 of the European Guidelines, version 1.0
49
Appendix 6: Frequencies of Quality Control
This addendum to the European protocol is work-in-progress and subject to improvements as more experience in digital mammography is obtained and new types of digital mammography equipment are developed. Therefore the frequencies of quality control may change in future. Updates on version 1.0 will be made available on the Euref website (www.Euref.org). It is recommended that users check the website for updates before testing digital mammography equipment. Table A6.1 Frequencies of Quality Control test-item acceptance
and on indication
yearly six monthly weekly daily
2. Image acquisition 2.1 X-ray generation 2.1.1 X-ray source 2.1.1.1 Focal spot size X 2.1.1.2 Source-to–image distance X if adjustable 2.1.1.3 Alignment of X-ray field/image area X X 2.1.1.4 Radiation leakage X 2.1.1.5 Radiation output O O 2.1.2 Tube voltage and beam quality 2.1.2.1 Tube voltage X X 2.1.2.2 Half Value Layer X 2.1.3 AEC-system 2.1.3.1 Exposure control steps X X 2.1.3.2 Back-up timer and security cut-off X X 2.1.3.3 Short term reproducibility X X 2.1.3.4 Long term reproducibility X X 2.1.3.5 Object thickness and tube voltage compensation
X X
2.1.4 Compression X X 2.1.5 Anti scatter grid 2.1.5.1 Grid system factor (if present) X 2.1.5.2 Grid imaging O O 2.2 Image receptor 2.2.1 Image receptor response 2.2.1.1 Response function X X 2.2.1.2 Noise evaluation X X 2.2.2 Missed tissue at chest wall side X 2.2.3 Detector homogeneity and stability 2.2.3.1 Detector homogeneity X 2.2.3.2 Detector element failure (DR) X X 2.2.3.3 Uncorrected defective DELs (DR) X X 2.2.4 Inter plate sensitivity variations (CR) X X 2.2.5 Influence of other sources of radiation (CR) X 2.2.6 Fading of latent image (CR) X 2.3 Dosimetry X X 2.4 Image quality 2.4.1 Threshold contrast visibility X X 2.4.2 MTF and NPS O 2.4.3 Exposure time X X 2.4.4 Geometric distortion and artefact evaluation X X 2.4.5 Ghost image / erasure thoroughness X X O: optional test, X: required test => This table is continued on the next page

Addendum on digital mammography to chapter 3 of the European Guidelines, version 1.0
50
Table A6.1 continued. Frequencies of quality control test-item acceptance
and on indication
yearly six monthly weekly daily
4. Image presentation 4.1 Monitors 4.1.1 Ambient light X X 4.1.2 Geometrical distortion (CRT) X X 4.1.3 Contrast visibility X X 4.1.4 Resolution X X 4.1.5 Displaying artefacts X X 4.1.6 Luminance range X X 4.1.7 DICOM Greyscale Standard Display Function X X 4.1.8 Luminance uniformity X X 4.2 Printers 4.2.1 Geometrical distortion X X 4.2.2 Contrast visibility X X 4.2.3 Resolution X 4.2.4 Printer artefacts X X 4.2.5 Optical Density range O O 4.2.6 DICOM GSDF X X 4.2.7 Density uniformity X X 4.3 Viewing boxes X X A5. QC measurements on systems which only use breast thickness to determine exposure settings
A5.1 Threshold contrast visibility X X A5.2 Thickness and tube voltage compensation X X A5.3 Thickness indication X X O: optional test, X: required test

Appendix 7: Limiting values
Table A7.1. Limiting values. limiting value 2 Image acquisition
X-ray generation typical value acceptable achievable
unit
X-ray source See European Guidelines, third edition, page 97. tube voltage See European Guidelines, third edition, page 97. AEC - exposure control steps
- back-up timer and security cut-off - short term reproducibility - long term reproducibility variation in SNR variation in dose - object thickness and tube voltage compensation 1. Glandular dose PMMA thickness (cm) 2.0 3.0 4.0 4.5 5.0 6.0 7.0 2. variation in SNR CNR1
PMMA thickness (cm) 2.0 3.0 4.0 4.5 5.0 6.0 7.0
15% - - - - - - - - - - - - - - - - - - -
function properly
< ± 5 %
< ± 10% < ± 10%
< 0.8 < 1.3 < 2.0 < 2.5 < 3.3 < 5.0 < 7.3 <15%
> 125 % > 115 % > 105 % > 100 % > 95% > 80 % > 65 %
< ± 2 %
< 0.6 < 1.0 < 1.6 < 2.0 < 2.6 < 4.0 < 5.8
mGy or mAs
mGy mGy
mGy
mGy mGy mGy mGy mGy mGy mGy
compression See European Guidelines, third edition, page 97. anti scatter grid See European Guidelines, third edition, page 98.
1 Provisional limiting value => This table is continued on next page.

Addendum on digital mammography to chapter 3 of the European Guidelines, version 1.0
52
Table A7.1 continued. Limiting values. limiting value
typical value acceptable achievable
unit
Image receptor response function missed tissue at chest wall side detector homogeneity detector element failure uncorrected dels inter plate sensitivity variations influence of other sources of radiation fading of latent image
- linearity - noise evaluation - variation in mean pixel value (on image) - variation in SNR (on image) - variation in mean SNR (between images) - variation in dose (between images) - number of defective dels - position of defective dels - number of uncorrected defective dels - position of uncorrected defective dels - variation in SNR - variation in dose
- - - - - - - - - - - - - - -
R² > 0.99 - � 5
< ± 15 % < ± 15 % < ± 15 % < ± 10%
not yet established not yet established not yet established not yet established
< ± 15 % < ± 10 %
coin not visible -
- - - - - - -
not yet established not yet established not yet established not yet established
- - - -
- -
mm - - -
mGy - - - - - - - -
Dosimetry - average glandular dose - < 2.5 < 2 mGy Image quality threshold contrast visibility MTF and NPS exposure time scanning time geometric distortion and artefact evaluation ghost image factor
- Detail 5.0 mm (optional) 2.0 mm 1.0 mm 0.5 mm 0.25 mm 0.10 mm - MTF (optional) - NPS (optional) - geometric distortion - artefact evaluation
- - - - - - - - -
5 to 8 - - -
< 0.85 % < 1.05 % < 1.40 % < 2.35 % < 5.45 % < 23.0%
- -
< 2.0
no distortions no disturbing artefacts
0.3
< 0.45 % < 0.55 % < 0.85 % < 1.60 % < 3.80 % < 15.8 %
- -
< 1.5 - - -
- - - - - - - - s s - - -
=> This table is continued on next page.

Addendum on digital mammography to chapter 3 of the European Guidelines, version 1.0
53
Table A7.1 continued. Limiting values.
limiting value Image presentation typical
value acceptable achievable
unit
Monitors ambient light geometrical distortion contrast visibility resolution display artefacts luminance range DICOM greyscale standard display function luminance uniformity
- ratio maximum/minimum luminance - difference in luminance left and right monitor - deviation in luminance (CRT display) - deviation in luminance (LCD display)
- - - - - - - - - -
< 10 straight lines
corner patches visible squares visible
line pattern discernible no disturbing artefacts
250 1%
± 10% of GSDF
30% 10%
- - - - - - - - - - -
lux
Cd/m²
Cd/m² Cd/m²
Printers geometrical distortion contrast visibility resolution printer artefacts optical density range (optional) DICOM greyscale standard display function density uniformity
- deviation in optical density
- - - - - - -
straight lines corner patches visible
squares visible line pattern discernible no disturbing artefacts
Dmin < 0.251, Dmax > 3.41
± 10% of GSDF
< 10 %
- - - - - - - -
OD
OD
Viewing boxes Viewing boxes See European Guidelines, third edition, page 99.
1 Provisional limiting value