addendum 3.5-a vegetation study
TRANSCRIPT

United States Nuclear Regulatory Commission Official Hearing Exhibit
In the Matter of: STRATA ENERGY, INC. (Ross In Situ Recovery Uranium Project)
ASLBP #: 12-915-01-MLA-BD01 Docket #: 04009091 Exhibit #: Identified: Admitted: Withdrawn: Rejected: Stricken:
Other:
SEI016E-00-BD01 9/30/20149/30/2014
ADDENDUM 3.5-A
VEGETATION STUDY
- 1 -
SEI016E

Ross ISR Project i ER Addendum 3.5-A
VEGETATION STUDY
STRATA ENERGY
ROSS ISR PROJECT
Prepared by
Intermountain ResourcesP.O. Box 1589
Laramie, Wyoming 82073307-745-3803
October, 2010
- 2 -

Ross ISR Project ii ER Addendum 3.5-A
ADDENDUM 3.5-A
VEGETATION STUDY
TABLE OF CONTENTS
1.0 LOCATION .........................................................................................................................1
2.0 METHODS ..........................................................................................................................1
3.0 RESULTS ............................................................................................................................3
3.1 Plant Community Types / Map Units .......................................................................... 3
3.2 Extended Reference Area............................................................................................. 7
3.3 Cover Data.................................................................................................................... 8
3.4 Statistical Evaluations .................................................................................................. 8
3.5 Species Diversity .......................................................................................................... 8
3.6 Threatened, Endangered and Species of Concern .....................................................14
3.7 Noxious Weeds...........................................................................................................14
3.8 Trees............................................................................................................................15
4.0 IMPACTS AND MITIGATION ........................................................................................15
5.0 SUMMARY .......................................................................................................................17
6.0 SOURCES .........................................................................................................................19
TABLESTable 1 Vegetation or Map Unit Type Acreages for the Ross Project Area, 2010 ...............4
Table 2 Absolute and Relative Percent Vegetation Cover Data for the Ross ISR Project Area by Vegetation Type, 2010* .............................................................................9
Table 3 Statistical Evaluations for the Vegetation Cover Data Collected on the Ross ISR Project Area, 2010 .................................................................................................12
- 3 -

Ross ISR Project iii ER Addendum 3.5-A
Table 4 Number of Plant Species Recorded in Cover Data for Each Vegetation Type Sampled on the Ross ISR Project in 2010 ..............................................................13
Table 5 Summary by Section and Quarter/Quarter for Trees Located on the Ross ISR Project Area, 2010. ................................................................................................16
ADDENDA
Addendum 3.5-B Plant Species List
Addendum 3.5-C Photographs
Addendum 3.5-D Computer Generated Field Data Sheets
Addendum 3.5-E Sampling Plan
- 4 -

Ross ISR Project 1 ER Addendum 3.5-A
1.0 LOCATION
VEGETATION STUDY
Vegetation baseline surveys were completed during the 2010 field season by Intermountain
Resources on the Ross ISR Project proposed by Peninsula Minerals Ltd, dba Strata Energy Inc.
(Strata). This study area is located in northwest Crook County, Wyoming, approximately 25 miles
north of Moorcroft. Access to the site is via the D Road. The permit area encompasses
approximately 1,721.31 acres. The permit area is situated Sections 12, 13, 14 and 24 T53N R68W,
and Sections 7, 18 and 19 T53N R67W as shown on ER Figure 3.5-2.
2.0 METHODS
Plant community types and map units within the study area were mapped during field
surveys in 2009-2010 and included one half mile beyond the permit boundary. The plant
community and map unit types were delineated based on topographical locations and plant species
dominating the vegetation. Aerial photography from 2006 and 2009 was used to map pre-existing
disturbance areas and current plant community types. Photographs were taken of each vegetation
type found within the study area. A detailed species list of plants observed within each plant
community type within the study area is included in Addendum 3.5-B.
The Upland Grassland, Sagebrush Shrubland and Pastureland were the major vegetation
types identified within the permit area. These vegetation types were sampled separately for
vegetation cover. Additional map units found within the permit area included Hayland,
Reservoir/Stockpond, Wetland, Disturbed Land, Cropland and Wooded Draw. These map units
were not required to be sampled in this study. The Wetland and Reservoir/Stockpond map units
were inventoried using US Corps of Engineers criteria and are described in Section 3.4.2 of the
Environmental Report. The cover samplings for the three plant community types were completed
- 5 -

Ross ISR Project 2 ER Addendum 3.5-A
from June 21 through June 24 of 2010. The extended reference area concept will be used for final
bond release studies as discussed later in this report. The random sample sites were selected using
two sets of computer generated random numbers, one set corresponding to the x axis of a grid and
the other corresponding to the y axis. Grids are always orientated North/South and East/West to
avoid bias. Sample site grid intervals were no more than 65 meters on the ground. The grid
intersections represented the prospective sample points and were located in the field using aerial
photography and topographic maps. Sampling sites were randomly located with cover transects
situated in random compass directions (from a random numbers table, 0o to 359o) from this point.
If a transect ran out of the vegetation type sampled then a new random compass direction (from
a random numbers table, 0o to 180o) was selected, at the point the transect left the type, that
returned the transect back into the currently sampled vegetation type without overlapping the
current transect. Vegetation and ground cover class data were collected from these 50 meter
transects with a vertical pin (one meter long by 1/8 inch around and sharpened to a point) dropped
by hand at one meter intervals for 50 data points per transect. The first hit encountered from each
pin drop was recorded for data analysis. Sample adequacy followed WDEQ-LQD Guideline No. 2.
Production and shrub density data were not required as approved by the WDEQ-LQD.
Trees present within the permit area were inventoried. The tree data collected on the permit
area included numbers, locations, and sizes (DBH – Diameter at Breast Height in inches and height
of each tree in feet). Surveys were also completed for the Ute ladies-tresses orchid (Spiranthes
diluvialis) as discussed in the results section of this report. The sampling plan for this vegetation
study was presented to the WDEQ-LQD and approved by that agency. That sampling plan is
included in Addendum 3.5-B of this report.
- 6 -

Ross ISR Project 3 ER Addendum 3.5-A
3.0 RESULTS
3.1 Plant Community Types / Map Units
Surveys of the study area identified nine vegetation or other map units of which three were
sampled for vegetative and total ground cover under this study. The plant community types
observed and sampled for vegetative and total ground cover were the Upland Grassland, Sagebrush
Shrubland and Pastureland. The other map units within the permit area included Hayland,
Reservoir/Stockpond, Wetland, Disturbed Land, Cropland and Wooded Draw but these map units
were not sampled for vegetative or total ground cover. Table 1 provides the acreages for each plant
community or map unit types within the study area and proposed permit area. A list of plant
species observed during the 2010 study is included in Addendum 3.5-B and Addendum 3.5-C
shows photographs of the plant community/map unit types. Vegetation cover descriptions for the
Upland Grassland, Sagebrush Shrubland and Pastureland types are based on the cover data
presented in Section 3.3 of this report.
The Upland Grassland plant community type occurs on approximately 917.55 acres or 53.3
percent of the permit area. The perennial grass life form dominated this type in terms of cover. The
most dominant individual species recorded was needleandthread (Stipa comata) followed by
western wheatgrass (Agropyron smithii), bulbous bluegrass (Poa bulbosa), Kentucky bluegrass
(Poa pratensis), buffalograss (Buchloe dactyloides) and prairie junegrass (Koeleria macrantha).
The Upland Grassland type is found throughout the permit area on relatively flat to steep slopes
with generally shallow sandy to sandy loam and loamy soils.
Upland Grassland (G)
- 7 -

Ross ISR Project 4 ER Addendum 3.5-A
Table 1 Vegetation or Map Unit Type Acreages for the Ross Project Area, 2010
1 Potential wetland areas identified in Section 3.4.2 of the Environmental Report (refer to Table 3.4-18) include both Wetland and Reservoir/Stockpond vegetation or map units in this table.
Permit AreaVegetation or Map Unit Type Acres %
Upland Grassland (G) 917.55 53.3
Sagebrush Shrubland (S) 377.05 21.9
Pastureland (P) 125.94 7.3
Hayland (H) 121.15 7.0
Reservoir/Stockpond (R)1 33.85 2.0
Wetland (W)1 31.15 1.8
Disturbed Land (D) 56.99 3.3
Cropland (C) 48.71 2.8
Wooded Draw (T) 8.92 0.5
Total 1,721.31 100.0
- 8 -
Ross ISR Project 5 ER Addendum 3.5-A
Sagebrush Shrubland (S)
The Sagebrush Shrubland vegetation type occupies approximately 377.05 acres or 21.9
percent of the entire permit area. This type is dominated by the perennial grass and shrub life
forms. The most common individual species recorded on this type was Kentucky bluegrass
followed by bulbous bluegrass, western wheatgrass, big sagebrush (Artemisia tridentata),
buffalograss and silver sagebrush (Artemisia cana). This vegetation type is found throughout the
study area and occurs on relatively flat to gentle slopes within a variety of soil types from shallow to
moderately deep, primarily loams.
Pastureland (P)
The Pastureland vegetation type (approximately 125.94 acres or about 7.3 percent of the
permit area) was mapped primarily in the western portion of the study area. This type was
dominated by perennial grass species. The most dominant plant species recorded was intermediate
wheatgrass (Agropyron intermedium). Other common plant species recorded on this type were
smooth brome (Bromus inermis), crested wheatgrass (Agropyron cristatum), bulbous bluegrass and
western wheatgrass. This vegetation type is found on relatively flat to gently sloping areas with
moderately deep, sandy loam to loamy soils. The Pasturelands within the permit area are primarily
grazed by cattle but may also be hayed.
This map unit is dominated by the perennial grass life form. The most dominant species
observed were smooth brome and crested wheatgrass. Another common plant species observed
was alfalfa (Medicago sativa). This plant community type is found on relatively flat to gently
sloping areas with moderately deep, sandy loam to loamy soils. This vegetation type occupies
Hayland (H)
- 9 -

Ross ISR Project 6 ER Addendum 3.5-A
about 121.15 acres or 7.0 percent of the permit area. These Haylands are generally harvested every
year in July and may be grazed following harvest.
Reservoir/Stockpond (R)
The Reservoir/Stockpond map unit (approximately 33.85 acres or about 2.0 percent of the
permit area) was made up primarily of the Oshoto Reservoir. Several smaller stockponds exist
within the permit area but may not hold water throughout the entire summer. The Oshoto Reservoir
holds water year round and is supplied by springs, Deadman Creek and the Little Missouri River.
Wetland (W)
This map unit occupies approximately 31.15 acres or about 1.8 percent of the permit area
This map unit transects the northern and central portion of the permit area and is primarily
associated with Deadman Creek, Little Missouri River and its’ tributaries and the Oshoto Reservoir.
Topography is relatively flat with shallow to deep soils underlain by sand or gravel which allows
for natural subirrigation. Mapping was based on aerial photography and surveying completed by
Intermountain Resources. A complete description of wetland attributes is detailed in the wetlands
report (Appendix D10).
Disturbed Lands (D)
This map unit consists primarily of past oil and gas development related disturbance and
existing roads. Mapping was based on aerial photography and surveying completed by
Intermountain Resources. These sites are generally lacking vegetation and topsoil. This map unit
occupies approximately 56.99 acres or about 3.3 percent of the permit area.
- 10 -

Ross ISR Project 7 ER Addendum 3.5-A
Cropland (C)
This map unit was seeded to wheat (Triticum aestivum) in 2010 but has also been used for
the production of oats (Avena sativa) and barley (Hordeum vulgare) in the past. This map unit is
found on relatively flat to gently sloping areas with moderately deep, sandy loam to loamy soils.
This map unit occupies about 48.71 acres or 2.8 percent of the permit area.
3.2 Extended Reference Area
Wooded Draw (W)
The Wooded Draw vegetation type comprised approximately 8.92 acres or about 0.5
percent of the permit area. Dominant woody species are plains cottonwood (Populus deltoides),
boxelder maple (Acer negundo), peachleaf willow (Salix amygdaloides), snowberry
(Symphoricarpos occidentalis), big sagebrush and silver sagebrush. Common understory species
are Kentucky bluegrass, smooth brome, Japanese chess (Bromus japonicus) and stinging nettle
(Urtica dioica). The Wooded Draw type is only found in a few small stands within ephemeral
drainages and will not be disturbed by mining activities. Soils are generally loamy and moderately
deep to deep.
The extended reference area concept for final bond release will be used for lands disturbed
by mining activities in this permit area. The extended reference area will consist of all undisturbed
lands within the permit area and may be delineated by individual plant community types. Due to
the nature of solution mining proposed for this site, sufficient acreage of each plant community type
within the permit area will remain undisturbed for use as extended reference area(s).
- 11 -
Ross ISR Project 8 ER Addendum 3.5-A
3.3 Cover Data
Cover data was collected on the Ross ISR Project Permit Area from June 21 through June
24, 2010. The Upland Grassland, Sagebrush Shrubland, and Pastureland plant community/habitat
types were sampled. Cover sampling was not required on the other map units as agreed upon with
the WDEQ-LQD. Twenty-one cover samples were collected on the Upland Grassland type while
20 samples where collected on the Sagebrush Shrubland and the Pastureland types in 2010. Note
that two cover sample sites for the Upland Grassland are located immediately north of the current
permit boundary. That area was proposed as part of the permit area at the time of sampling but
those lands were removed from consideration at a later date. Table 2 provides the results of the
cover sampling for the three plant community types inventoried in 2010 and Addendum 3.5-D
contains the computer generated field data sheets.
3.4 Statistical Evaluations
Statistical evaluations were made on the total perennial plant cover, total vegetation cover
and total ground cover data for each of the vegetation types surveyed. Sample adequacy was met
based on LQD Guideline No. 2 for all parameters as shown in Table 3.
3.5 Species Diversity
Table 4 shows the diversity of plant species encountered in cover sampling for each
vegetation type sampled on the Ross ISR Project in 2010. The Sagebrush Shrubland vegetation
type exhibited the highest total number of individual plant species recorded in cover transects
during the 2010 survey followed by the Upland Grassland and Pastureland vegetation types. The
Upland Grassland type exhibited the highest number of species with greater than 2% relative cover
followed by the Sagebrush Shrubland and Pastureland.
- 12 -

Ross ISR Project 9 ER Addendum 3.5-A
Table 2 Absolute and Relative Percent Vegetation Cover Data for the Ross ISR Project Area by Vegetation Type, 2010*
Vegetation TypeUpland Grassland Sagebrush Shrubland Pastureland
Life Form / Species%
CoverRelative Cover
%Cover
Relative Cover
%Cover
RelativeCover
Perennial GrassAgropyron cristatum 0.9 1.2 0.6 0.9 9.0 14.1Agropyron dasystachyum - - 0.3 0.4 - -Agropyron intermedium - - - - 15.2 23.8Agropyron smithii 7.0 10.1 6.2 8.9 5.4 8.4Agropyron spicatum 0.3 0.4 - - - -Aristida purpurea 0.5 0.7 - - - -Bouteloua gracilis 2.3 3.3 1.1 1.6 - -Bromus inermis 2.8 4.0 0.6 0.9 14.7 23.0Buchloe dactyloides 3.6 5.2 3.4 4.9 3.2 5.0Calamovilfa longifolia 1.0 1.5 0.6 0.9 - -Distichlis stricta - - 0.4 0.6 - -Koeleria macrantha 2.9 4.1 2.2 3.1 - -Poa bulbosa 6.8 9.8 7.0 10.0 6.9 10.8Poa pratensis 6.2 9.0 11.4 16.3 - -Poa secunda 2.0 2.9 1.1 1.6 3.2 5.0Schizachyrium scoparium 1.2 1.8 0.4 0.6 - -Sporobolus airoides - - 0.2 0.3 - -Sporobolus cryptandrus 0.5 0.7 - - - -Stipa comata 9.3 13.5 2.5 3.6 0.1 0.2Stipa viridula 2.4 3.4 2.0 2.9 1.0 1.6
Subtotal 49.5 71.7 40.0 57.2 58.7 91.7
GrasslikeCarex filifolia 1.9 2.8 0.7 1.0 - -Carex pensylvanica 1.4 2.1 0.2 0.3 - -
Subtotal 3.3 4.8 0.9 1.3 - -
Perennial ForbAchillea millefolium 0.6 0.8 1.0 1.4 - -Allium textile - - 0.1 0.1 - -Ambrosia psilostachya 0.3 0.4 - - - -Antennaria dimorpha 0.1 0.1 - - - -Antennaria rosea 0.5 0.7 0.2 0.3 - -Arnica fulgens 0.8 1.1 0.2 0.3 - -Astragalus bisulcatus*** 0.2 0.3 0.3 0.4 - -Astragalus spp. 0.5 0.7 0.7 1.0 - -Besseya wyomingensis 0.2 0.3 0.1 0.1 - -Cerastium arvense 0.5 0.7 1.0 1.4 0.1 0.2Comandra umbellata - - 0.1 0.1 - -Erigeron pumilus 0.1 0.1 - - - -
- 13 -

Ross ISR Project 10 ER Addendum 3.5-A
Table 2. Absolute and Relative Percent Vegetation Cover Data (Continued)Vegetation Type
Upland Grassland Sagebrush Shrubland Pastureland
Life Form / Species%
CoverRelative Cover
%Cover
Relative Cover
%Cover
Relative Cover
Perennial Forb (Cont.)Euphorbia esula** - - 0.5 0.7 - -Gaura coccinea 0.4 0.6 0.1 0.1 - -Geum triflorum - - 0.1 0.1 - -Haplopappus spinulosus 0.2 0.3 - - - -Helianthus maximiliani 0.1 0.1 - - - -Heterotheca villosa 0.1 0.1 0.2 0.3 - -Hymenoxys acaulis 0.1 0.1 - - - -Liatris punctata 0.4 0.6 0.3 0.4 - -Lithospermum incisum 0.1 0.1 0.1 0.1 - -Lupinus argentea 0.5 0.7 0.3 0.4 - -Lygodesmia juncea 0.2 0.3 0.1 0.1 - -Medicago sativa - - 0.2 0.3 2.5 3.9Melilotus officinalis 0.6 0.8 0.9 1.3 0.2 0.3Musineon divaricatum - - 0.2 0.3 - -Oxytropis spp. 0.1 0.1 0.2 0.3 - -Phlox hoodii 0.3 0.4 0.3 0.4 - -Psoralea argophylla 2.2 3.2 1.0 1.4 - -Psoralea esculenta 0.1 0.1 - - - -Ratibida columnifera - - 0.1 0.1 - -Sphaeralcea coccinea 0.6 0.8 0.4 0.6 0.5 0.8Taraxacum officinale 1.2 1.8 2.2 3.1 0.3 0.5Vicia americana - - 1.1 1.6 1.1 1.7Zigadenus venenosus 0.2 0.3 0.1 0.1 - -
Subtotal 10.9 15.7 12.1 17.3 4.7 7.3
SubshrubArtemisia frigida 0.6 0.8 1.0 1.4 0.4 0.6Artemisia ludoviciana 0.1 0.1 0.7 1.0 - -Atriplex gardneri - - 0.1 0.1 - -Gutierrezia sarothrae 0.1 0.1 0.1 0.1 - -Yucca glauca 0.4 0.6 - - - -
Subtotal 1.1 1.7 1.9 2.7 0.4 0.6
ShrubArtemisia cana - - 2.8 4.0 0.1 0.2Artemisia tridentata 0.1 0.1 5.4 7.7 - -Chrysothamnus nauseosus - - 0.2 0.3 - -Sarcobatus vermiculatus - - 0.2 0.3 - -Symphoricarpos occidentalis - - 1.0 1.4 - -
Subtotal 0.1 0.1 9.6 13.7 0.1 0.2
- 14 -

Ross ISR Project 11 ER Addendum 3.5-A
Table 2 Absolute and Relative Percent Vegetation Cover Data (Continued)Vegetation Type
Upland Grassland Sagebrush Shrubland Pastureland
Life Form / Species%
CoverRelative Cover
%Cover
Relative Cover
%Cover
Relative Cover
SucculentOpuntia polyacantha 0.1 0.1 0.5 0.7 - -
_____ _____ _____ _____ _____ _____Total Perennials 65.0 94.2 65.0 93.0 63.9 99.8
Annual GrassBromus japonicus 2.6 3.7 2.6 3.7 - -Bromus tectorum 0.2 0.3 0.7 1.0 - -
Subtotal 2.8 4.0 3.3 4.7 - -
Annual ForbAlyssum alyssoides 1.0 1.4 0.6 0.9 - -Alyssum desertorum - - - - 0.1 0.2Camelina microcarpa - - 0.1 0.1 - -Descurainia pinnata - - 0.3 0.4 - -Filago arvensis 0.1 0.1 0.3 0.4 - -Medicago lupulina 0.2 0.3 0.1 0.1 - -Plantago patagonica - - 0.1 0.1 - -Thlaspi arvense - - 0.1 0.1 - -
Subtotal 1.2 1.8 1.6 2.3 0.1 0.2_____ _____ _____ _____ _____ _____
Total Annuals 4.0 5.8 4.9 7.0 0.1 0.2
Total Vegetation Cover 69.0 100.0 69.9 100.0 64.0 100.0
Lichen 0.9 - 0.2 - - -Litter 19.2 - 17.9 - 26.1 -Rock 0.1 - - - 0.1 -
Total Ground Cover 89.2 - 88.0 - 90.2 -Bare Ground 10.8 - 12.0 - 9.8 -
* = Subtotal and totals may not be exact due to computer rounding** = State listed noxious weeds*** = Selenium indicator species
% Cover = Percent absolute cover
- 15 -

Ross ISR Project 12 ER Addendum 3.5-A
Table 3 Statistical Evaluations for the Vegetation Cover Data Collected on the Ross ISR Project Area, 2010
Parameters__
Plant Community Type X s-1 N Nmin
Upland Grassland (G)Total Perennial Cover 65.0 9.3 21 2Total Vegetation Cover 69.0 8.0 21 5Total Ground Cover 89.2 6.2 21 2
Sagebrush Shrubland (S)Total Perennial Cover 65.0 10.2 20 3Total Vegetation Cover 69.9 11.5 20 9Total Ground Cover 88.0 10.0 20 5
Pastureland (P)Total Perennial Cover 63.9 6.3 20 1Total Vegetation Cover 64.0 6.3 20 4Total Ground Cover 90.2 5.3 20 2
__X = Means-1 = Sample Standard DeviationN = Number of SamplesNmin = Minimum Number of Samples Needed to Meet Sample Adequacy
- 16 -

Ross ISR Project 13 ER Addendum 3.5-A
Table 4 Number of Plant Species Recorded in Cover Data for Each Vegetation Type Sampled on the Ross ISR Project in 2010
Plant Community Type
Upland Grassland Sagebrush Shrubland Pastureland
Total
> 2% RelativeCover Total
> 2% Relative Cover Total
> 2% Relative Cover
PERENNIALSGrass 16 10 16 7 9 7Grasslike 2 2 2 - - -Forb 27 1 28 1 6 1Subshrub 4 - 4 - 1 -Full Shrub 1 - 5 2 1 -Succulent 1 - 1 - -
Subtotal-
51 13 56 10 17 8
ANNUALSGrass 2 1 2 1 - -Forb 3 - 7 - 1
Subtotal-
5 1 9 1 1 0____ ____ ____ ____ ____ ____
ALL TOTAL 56 14 65 11 18 8
- 17 -

Ross ISR Project 14 ER Addendum 3.5-A
3.6 Threatened, Endangered and Species of Concern
There were no threatened or endangered plant species encountered within the permit area
during the 2010 surveys. Habitat for the Ute ladies’-tresses orchid (Spiranthes diluvialis) was
encountered in the wetlands within the permit area. These wetlands were found primarily along
Deadman Creek, Little Missouri River and along the Oshoto Reservoir. These wetland habitats
were surveyed on August 11, 12 and 13 of 2010 but no orchids were observed. Typical habitat for
the blowout penstemon (Penstemon haydenii) is not found on the permit area.
No rare or sensitive plant species of concern as listed by state agencies, federal agencies or
the Wyoming Natural Diversity Data Base were found on the study area.
3.7 Noxious Weeds
Several species of designated and prohibited noxious weeds listed by the Wyoming Weed
and Pest Control Act were identified on the permit area. These species included field bindweed
(Convolvulus arvensis), perennial sow thistle (Sonchus arvensis), Quackgrass (Agropyron repens),
Canada thistle (Cirsium arvense), hounds tongue (Cynoglossum officinale), leafy spurge
(Euphorbia esula), common burdock (Arctium minus), Scotch thistle (Onopordum acanthium),
Russian olive (Eleagnus angustifolia) and skeletonleaf bursage (Ambrosia tomentosa). These
species may be abundant in small localities, especially around the Oshoto Reservoir and along the
Little Missouri River and Deadman Creek, but were not common throughout the area.
Selenium indicator species identified on the permit area in 2010 included two-grooved
milkvetch (Astragalus bisulcatus), woody aster (Xylorhiza glabriuscula) and Stemmy goldenweed
(Haplopappus multicaulis). These selenium indicator species were not abundant on the permit
area. Little larkspur (Delphinium bicolor), locoweed (Oxytropis sericea and Oxytropis lambertii)
- 18 -

Ross ISR Project 15 ER Addendum 3.5-A
and meadow deathcamus (Zigadenus venenosus) were poisonous plants commonly observed on the
area in limited amounts. Cheatgrass although not a state listed noxious weed was abundant on
some sites within the permit area.
3.8 Trees
A survey of the trees within the permit area shows that four species of trees were present
and included boxelder maple, plains cottonwood, peachleaf willow and Russian olive. Table 5
shows the results of the tree survey within the permit area in 2010. The tree survey was
summarized for the entire permit area as well as for each Quarter Quarter of each Section that trees
were located in. The boxelder maple was the most common tree species recorded (Table 5) on the
permit area followed by the plains cottonwood, peachleaf willow and Russian olive. The average
height calculated for the boxelder maple for the entire permit area was 19.2 feet and exhibited an
average DBH (Diameter at breast height) of 11.2 inches. The plains cottonwood averaged a height
of 47.5 feet and an average DBH of 29.0 inches for the entire permit area. The average height
calculated for the peachleaf willow for the entire permit area was 27.4 feet and exhibited an average
DBH of 15.3 inches. The Russian olive averaged a height of 5.2 feet and an average DBH of 3.0
inches for the entire permit area. Due to the nature of solution mining proposed for the permit area,
no trees should be removed by the operation.
4.0 IMPACTS AND MITIGATION
Operations will disturb several of the vegetation plant communities within the permit area.
Some of these impacts will be long term such as the plant facilities while other temporary
disturbances will be short term.
- 19 -

Ross ISR Project 16 ER Addendum 3.5-A
Table 5 Summary by Section and Quarter/Quarter for Trees Located on the Ross ISR Project Area, 2010.
Permit AreaBoxelder
MaplePlains
CottonwoodPeachleaf Willow
Russian Olive
Area N H DBH N H DBH N H DBH N H DBH
T53N R68WSWNE4, Section 13 4 18.8 11.3 - - - - - - - - -
SESE4, Section 13 1 10.0 3.0 - - - - - - - - -
SENE4, Section 13 - - - 1 30.0 15.0 - - - - - -
NWNE4, Section 13 4 17.5 11.3 - - - - - - - - -
NESE4, Section 13 3 21.7 10.3 1 65.0 74.0 1 25.0 18.0 - - -
NENE4, Section 24 8 20.6 10.8 29 52.4 30.8 15 28.7 14.7 1 10.0 3.0
NWNE4, Section 24 69 19.4 12.2 9 40.0 25.2 25 27.4 15.9 - - -
T53N R67WSWSW4, Section 18 1 8.0 3.0 - - - - - - - - -
SENE4, Section 18 3 16.7 8.3 - - - - - - 1 6.0 3.0
NWSW4, Section 18 - - - 1 6.0 1.0 - - - - - -
NWNE4, Section 18 2 12.5 5.0 - - - 1 10.0 6.0 - - -
NENE4, Section 18 19 20.8 10.3 - - - - - - - - -
NWNW4, Section 19 1 15.0 7.0 1 15.0 7.0 3 3.3 0.0 3 - -
____ ____ ____ ____ ____ ____ ____ ____ ____ ____ ____ ____ALL TOTAL 115 19.2 11.2 42 47.5 29.0 42 27.4 15.3 5 5.2 3.0
N - Number of TreesH - Average Height of Trees (feet)
DBH - Average Diameter at Breast Height (inches)
- 20 -

Ross ISR Project 17 ER Addendum 3.5-A
The plant facilities will be located within the Hayland type so native vegetation types will
not be affected by construction activities on this site. Following termination of operations the plant
facility location will be reclaimed back to Hayland.
Disturbances related to well field, pipeline and road construction will occur primarily in the
Upland Grassland and Sagebrush Shrubland vegetation types. Only a minor amount of disturbance
may occur in other vegetation map units within the permit area. Temporary disturbances will be
reclaimed as soon as possible following completion of construction which will reduce the amount
of impacts and disturbed lands. Permanent surface features will remain for the life of mine.
Seed mixtures used in reclamation are presented in the Reclamation Plan. Native plant
species will be seeded on the native vegetation types affected. These species are selected based on
the ability of establishment and their values in supporting the post mine land uses of wildlife habitat
and livestock grazing.
5.0 SUMMARY
The Ross ISR Project Permit Area shows a high diversity of plant species with
needleandthread, Kentucky bluegrass, western wheatgrass, bulbous bluegrass, big sagebrush and
buffalograss being the dominant species observed on the native Upland Grassland and Sagebrush
Shrubland vegetation types. On the Pastureland type, which has been cultivated and seeded in the
past, was dominated by intermediate wheatgrass, smooth brome, crested wheatgrass, bulbous
bluegrass and western wheatgrass. Grass-like species, perennial forbs, subshrubs and shrubs were
common on some locations. Trees were only common in the drainages along Deadman Creek, the
Little Missouri River and various tributaries.
Cover data was collected on the Upland Grassland, Sagebrush Shrubland and Pastureland
plant community/habitat types. All cover data met the required sample adequacy.
- 21 -

Ross ISR Project 18 ER Addendum 3.5-A
Noxious weeds and poisonous plants were common in localized areas. Selenium indicator
plant species were uncommon and a few poisonous plants were present. No T&E plants were
identified within the permit area.
- 22 -

Ross ISR Project 19 ER Addendum 3.5-A
6.0 SOURCES
Beetle A.A., 1977, Grasses of Wyoming, Agricultural Experiment Station, University of Wyoming, Laramie.
Dorn, R.D., 2001, Manual of the Vascular Plants of Wyoming. 2nd edition. Mountain West Publishing, Cheyenne.
International Environmental Consultants, Inc. 1980. Baseline Vegetation Studies for the Sundance Project, Crook County, Wyoming. Prepared for Nuclear Dynamics, Inc. Casper, Wyoming.
USDI - Fish and Wildlife Service, 2010, Endangered and Threatened Wildlife and Plants,Department of the Interior, U.S. Fish and Wildlife Service.
- 23 -
ADDENDUM 3.5-B
PLANT SPECIES LIST
- 24 -

Ross ISR Project 1 ER Addendum 3.5-B
List of Plant Species Recorded on the Ross ISR project in 2010.
Code Scientific Name Common Name
PERENNIAL GRASS
AGCR Agropyron cristatum Crested wheatgrassAGDA Agropyron dasystachyum Thickspike wheatgrass
(Elymus lanceolatusAGEL Agropyron elongatum Tall wheatgrass
(Elymus elongates)AGIN Agropyron intermedium Intermediate wheatgrass
(Elymus hispidus) AGRE Agropyron repens Quackgrass
(Elymus repens) AGRI Agropyron riparium Streambank wheatgrass
(Elymus lanceolatus)AGSM Agropyron smithii Western wheatgrass
(Elymus smithii)AGSP Agropyron spicatum Bluebunch wheatgrass
(Elymus spicatus)AGTR Agropyron trachycaulum Slender wheatgrass
(Elymus trachycaulus)AGSC Agrostis scabra Winter bent AGST Agrostis stolonifera Redtop bent ALAR Alopecurus arundinaceus Reed foxtailARPU Aristida purpurea ThreeawnBOCU Bouteloua curtipendula Side oats gramaBOGR Bouteloua gracilis Blue gramaBRIN Bromus inermis Smooth brome BUDA Buchloe dactylodes BuffalograssCALO Calomovifla longifolia Prairie sandreedCAMO Calamagrosits montanensis Plains reedgrassDAGL Dactylus glomeratus OrchardgrassDAUN Danthonian unispicata Onespike danthonia DIST Distichlis stricta Inland saltgrassELCA Elymus canadensis Canada wildryeELCI Elymus cinereus Basin wildryeELJU Elymus junceus Russian wildrye
- 25 -

Ross ISR Project 2 ER Addendum 3.5-B
List of Plant Species Continued.
Code Scientific Name Common Name
Perennial Grass (Continued)
HOJU Hordeum jubatum Foxtail barleyKOMA Koeleria macrantha Prairie junegrassMUAS Muhlenbergia asperifolia Alkali muhlyMUCU Muhlenbergia cuspidata Stoneyhills muhlyORHY Oryzopsis hymenoides Indian ricegrassPHPR Phleum pratensis TimothyPOBU Poa bulbosa Bulbous bluegrass POIN Poa interior Interior bluegrass POJU Poa juncifolia Alkali bluegrassPOPR Poa pratensis Kentucky bluegrass POSE Poa secunda Sandberg bluegrass POA Poa spp. BluegrassPUNU Puccinelia nuttalliana Nuttall alkaligrassSCPA Schedonnardus paniculatus TumblegrassSCSC Schizachyrium scoparius Little bluestemSIHY Sitanion hystrix Bottlebrush squirreltailSPAI Sporobolus airoides Alkali sacatonSPCR Sporobolus cryptandrus Sand dropseed SPGR Spartina gracilis Alkali cordgrassSPPE Spartina pectinata Prairie cordgrassSTCO Stipa comata NeedleandthreadSTVI Stipa viridula Green needlegrass
GRASSLIKE
CAR Carex spp. SedgeCAFI Carex filifolia Threadleaf sedgeCANE Carex nebrascensis Nebraska sedgeCAPE Carex pensylvanica Sun sedge CAPEL Carex pellita Wooly sedge CAPR Carex praegracilis Fieldclustered sedgeCAST Carex stenophylla Needleleaf sedgeEQLA Equisetum laevigatum Horsetail
- 26 -
Ross ISR Project 3 ER Addendum 3.5-B
List of Plant Species Continued.
Code Scientific Name Common Name
Grasslike (Continued)
ELAC Eleocharis acicularis Slender spikerush ELPA Eleocharis palustris Creeping spikerush JUBA Juncus balticus Baltic rushJUIN Juncus interior Inland rush JUTE Juncus tenuis Poverty rush JUTO Juncus torreyi Torrey rushSCAC Scirpus acutus Tule bulrush
(Schoenoplectus acutus) SCMA Scirpus maritimus Bulrush
(Bolboschoenus maritimus) SCPU Scirpus pungens Bulrush
(Schoenoplectus punngens) TYLA Typha latifolia Cattail
PERENNIAL FORB
ACMI Achillea millefolium Western yarrowAGGL Agoseris gluaca False dandelionALTE Allium textile Prairie onion AMPS Ambrosia psilostachya RagweedAMTO Ambrosia tomentosa Skeletonleaf bursageANDI Antennaria dimorpha Low pussytoes ANRO Antennaria rosea Rose pussytoes ARHO Arenaria hookeri Hooker sandwort ARHOL Arabis holboellii Holboell rockcress ARFU Arnica fulgens Orange arnicaASER Aster ericoides Heath asterASFA Aster falcatus Whiteprairie asterASPU Asclepias pumila Low milkweedASSP Asclepias speciosa Showy milkweedASAD Astragalus adsurgens Standing milkvetch
(Astragalus laxmanii)ASBI Astragalus bisulcatus Two-groved milkvetch ASMI Astragalus missouriensis Missouri milkvetch____________________________________________________________________________
- 27 -

Ross ISR Project 4 ER Addendum 3.5-B
List of Plant Species Continued.
Code Scientific Name Common Name
Perennial Forb (Continued)
ASPUR Astragalus purshii Pursh milkvetch ASSPA Astragalus spatulatus Spoonleaf milkvetch BEWY Besseya wyomingensis Wyoming kittentailsCANU Calochortus nuttallii Mariposa lilyCARO Campanula rotundifolia HarebellCASE Calylophus serrulata Shrubby primrose CASES Castilleja sessiflora Largeflowered paintbrush CASU Castilleja sulphurea Sulphur paintbrush CEAR Cerastium arvense Field cerastiumCIAR Cirsium arvense Canada thistleCICA Cirsium canescens Platte thistleCIUN Cirsium undulatum Wavyleaf thistleCIVU Cirsium vulgare Bull thistleCLSE Cleome serrulata Rockymountain beeplant COUM Comadra umbellata BastardtoadflaxCOAR Convolvulus arvensis Field bindweed CRAC Crepis acuminata Tapertip hawksbeardCYAC Cymopterus acaulis Stemless springparsleyCYMO Cymopterus montanus Mountain springparsley DAPU Dalea purpurea Purple prairiecloverDEBI Dephinium bicolor Little larkspurECAN Echinacea angustifolia Blacksamson echinaceaEPCI Epilobium ciliatum Fringed willowherb ERAS Erysimum asperum Plains wallflowerEROC Erigeron ochroleucus Buff fleabaneERPU Erigeron pumilus Low fleabaneEUES Euphorbia esula Leafy spurgeGABO Galium boreale Northern bedstraw GACO Gaura coccinea Scarlet gauraGETR Geum triflorum Prairie smokeGLLE Glycyrrhiza lepidota American licoriceGRSQ Grindelia squarrosa Curlycup gumweed HAMU Haplopappus multicaulis Stemmy goldenweed
- 28 -

Ross ISR Project 5 ER Addendum 3.5-B
List of Plant Species Continued.
Code Scientific Name Common Name
Perennial Forb (Continued)
HASP Haplopappus spinulosus Ironplant goldenweed HEMA Helianthus maximiliana Maximilian sunflowerHEPA Helianthus pauciflorus Stiff sunflowerHEVI Heterotheca villosa Golden asterHYAC Hymenoxis acaulis Stemless actineaIPCO Ipomopsis congesta IpomopsisIVAX Iva axillaris PovertyweedLAPU Lactuca puchella Chickory lettuce LASE Lactuca serriola Prickly lettuceLELU Lesquerella ludoviciana Bladderpod LEMO Leucocrinum montanum StarlilyLERE Lewisia rediviva BitterrootLILE Linum lewisii Lewis flaxLIPU Liatris punctata Gay featherLIIN Lithospermum incisum Narrowleaf gromwellLIRU Lithospermum ruderale Wayside gromwellLIPA Lithophragma parviflorum Woodland star LOFO Lomatium foeniculum Hairyseed lomatiumLOOR Lomation orientale Idaho biscuitroot LUAR Lupinus argenteus Silvery lupine LYJU Lygodesmia juncea Skeleton plant MACA Machaeranthera canescens Hoary asterMAGR Machaeranthera grindelioides Nuttall goldenweedMEAL Melilotus albus White sweetcloverMELA Mertensia lanceolata BluebellMEAR Mentha arvensis Field mintMEOF Melilotus officinalis Yellow sweetcloverMESA Medicago sativa AlfalfaMINU Microseris nutans Nodding microserisMOFI Monarda fistulosa Horsemint MUDI Musineon divaricatum Musineon OECO Oenothera coronopifolia Crownleaf eveningprimrose
- 29 -

Ross ISR Project 6 ER Addendum 3.5-B
List of Plant Species Continued.
Code Scientific Name Common Name
Perennial Forb (Continued)
OECE Oenothera cespitosa Gumbo lilyONAC Onopordum acanthium Scotch thistleORFA Orobanche fasciculata Cancer rootOXSE Oxytropis sericea Silky locoOXLA Oxytropis lambertii LocoweedPEAL Penstemon albidus White penstemonPEGL Penstemon glaber Smooth beardtongue PHHO Phlox hoodii Hoods phlox PIOP Picradeniopsis oppositifolia BahiaPOAR Potentilla arguta Tall cinquefoil POGR Potentilla gracilis Cinquefoil PSAR Psoralea argophylla Silverleaf scurfpeaPSES Psoralea esculenta Indian breadroot PSTE Psoralea tenuiflora Slimflower ScurfpeaRAAQ Ranunculus aquatilis Water buttercupRACO Ratibida columnifera Prairie coneflowerRUCR Rumex crispus Curly dock RUSA Rumex salicifolius Willowleaf dockSACU Sagitaria cuneata ArrowheadSELA Sedum lanceolatum Stonecrop SEDA Selaginella densa Little club mossSIDR Silene drummondii Drummond campion SOAR Sonchus arvensis Sow thistleSOMI Solidago missouriensis Missouri goldenrod SOMO Solidago mollis Velvety goldenrod SPCO Sphaeralcea coccinea Scarlet globemallowTAOF Taraxacum officinale Dandelion THRH Thermopsis rhombifolia Prairie thermopsisTRDU Tragopogon dubius Yellow salsifyTRI Trifolium spp. Clover
- 30 -

Ross ISR Project 7 ER Addendum 3.5-B
List of Plant Species Continued.
Code Scientific Name Common Name
Perennial Forb (Continued)
URDI Urtica dioica Stinging nettleVEBR Verbena bracteata Bigtract verbenaVIAM Vicia americana American vetchXYGL Xylorhiza glabriuscula Woody aster ZIVE Zigadenus venenosus Meadow Deathcamas
SUBSHRUB
ARFR Artemisia frigida Fringed sagewortARLU Artemisia ludoviciana Louisiana sagewortATGA Atriplex gardneri Gardner saltbush ERFL Eriogonum flavum Golden wildbuckwheat ERMI Eriogonum microthecum Slender wildbuckwheat ERPA Eriogonum pauciflorum Wildbuckwheat GUSA Gutierrezia sarothrae Broom snakeweedLEPU Leptodactylon pungens PricklygiliaYUGL Yucca glauca Small soapweed
SHRUB
ATCA Artemisia cana Silver sagebrushARTR Artemisia tridentata Big sagebrushCHNA Chrysothamnus nauseosus Rubber rabbitbrush CHVI Chrisothamnus viscidiflorus Douglas rabbitbrush CRCH Crataegus chrysocarpa HawthornPRVI Prunus virginiana Chokecherry RHTR Rhus trilobata Skunkbush sumac RIAU Ribes aureum Golden current RIB Ribes sp. CurrentROWO Rosa woodsii Woods rose SAVE Sarcobatus vermiculatus Black greasewoodSYOC Symphoricarpos occidentalis Western snowberry
- 31 -

Ross ISR Project 8 ER Addendum 3.5-B
List of Plant Species Continued.
Code Scientific Name Common Name
SUCCULENT
OPPO Opuntia polyacantha Prickly pearPESO Pediocactus simpsonii Barrel cactus
TREE
ACNE Acer negundo Boxelder mapleELAN Eleagnus angustifolia Russian olive PODE Populus deltoides Plains cottonwood SAAM Salix amygdaloides Peach-leaved willow
ANNUAL GRASS
ALCA Alopecurus carolinianus Carolina foxtailBESY Beckmania syzigachne American sloughgrassBRCO Bromus commutatus Hairy bromeBRJA Bromus japonicus Japanese chessBRTE Bromus tectorum CheatgrassECCR Echinochloa crusgalli BarnyardgrassERTR Eremopyrum triticeum FalsewheatgrassPACA Panicum capillare Witchgrass panicVUOC Vulpia octoflora Sixweeksgrass
ANNUAL FORB
ALAR Alyssum alyssoides Pale alyssumALDE Alyssum desertorum Desert alyssumAMBL Amaranthus blitoides Prostrate pigweedAMRE Amaranthus retroflexus Redroot pigweed ARMI Arctium minus Burdock ATAR Atriplex argentea Silvery oracheCAPU Capsella bursa-pastoris Sheperd’s purse CAMI Camelina microcarpa Smallseed falseflaxCHAL Chenopodium album Goosefoot
- 32 -

Ross ISR Project 9 ER Addendum 3.5-B
List of Plant Species Continued.
Code Scientific Name Common Name
Annual Forb (Continued)
CHFR Chenopodium femontii Fremont goosefoot CHTE Chorispora tenella Blue mustardCLSE Cleome serrulata Rockymountain beeplant COLI Collomia linearis CollomiaCOCA Conyza canadensis Canada horseweedDEPI Descurainia pinnata Pinnate tansymustardDESO Descurainia Sophia FlixweedERGL Euphorbia glytosperma Ridgeseed spurge FIAR Filago arvensis FilagoHEHI Hedeoma hispida False pennyroyalHEAN Helianthus annuus Annual sunflower HELA Heracleum lanatum Cow parsnip IVXA Iva xanthifolia Marsh-elderKOSC Kochia scoparia Summer cypressLARE Lappula redowski Bluebur stickseedLEDE Lepidium densiflorum Prairie pepperweedLEPE Lepidium perfoliatum Clasping pepperweedLUPU Lupinus pusillus Low lupine MANE Malva neglecta Common mallowMELU Medicago lupulina Black medicOEAL Oenothera albicaulis Evening primrose ORLU Orthocarpus luteus Owl CloverPHLI Phacelia linearis Bluebell phaceliaPLPA Plantago patagonica Wooly plantain POAV Polygonum aviculare Prostrate knotweedPOLA Polygonum lapathifolium Curlythumb knotweed RATE Ranunculus testicularis Testiculate buttercupSAKA Salsola kali Russian thistleSIAL Sisymbrium altissimum Tumbling hedge mustard THAR Thlaspi arvensis Field pennycressVIVI Vicia villosa Winter vetchXAST Xanthium strumarium Cocklebur
- 33 -

ADDENDUM 3.5-C
VEGETATION PHOTOGRAPHS
- 34 -

Ross ISR Project 1 ER Addendum 3.5-C
Photo 1. Ross ISR Project Upland Grassland Vegetation Type in June of 2010.
Photo 2. Ross ISR Project Upland Grassland Vegetation Type in June of 2010.
- 35 -

Ross ISR Project 2 ER Addendum 3.5-C
Photo . Ross ISR Project Sagebrush Shrubland Vegetation Type in June of 2010.
Photo . Ross ISR Project Sagebrush Shrubland Vegetation Type in June of 2010.
- 36 -

Ross ISR Project 3 ER Addendum 3.5-C
Photo . Ross ISR Project Pastureland Vegetation Type in June of 2010.
Photo . Ross ISR Project Pastureland Vegetation Type in June of 2010.
- 37 -
Ross ISR Project 4 ER Addendum 3.5-C
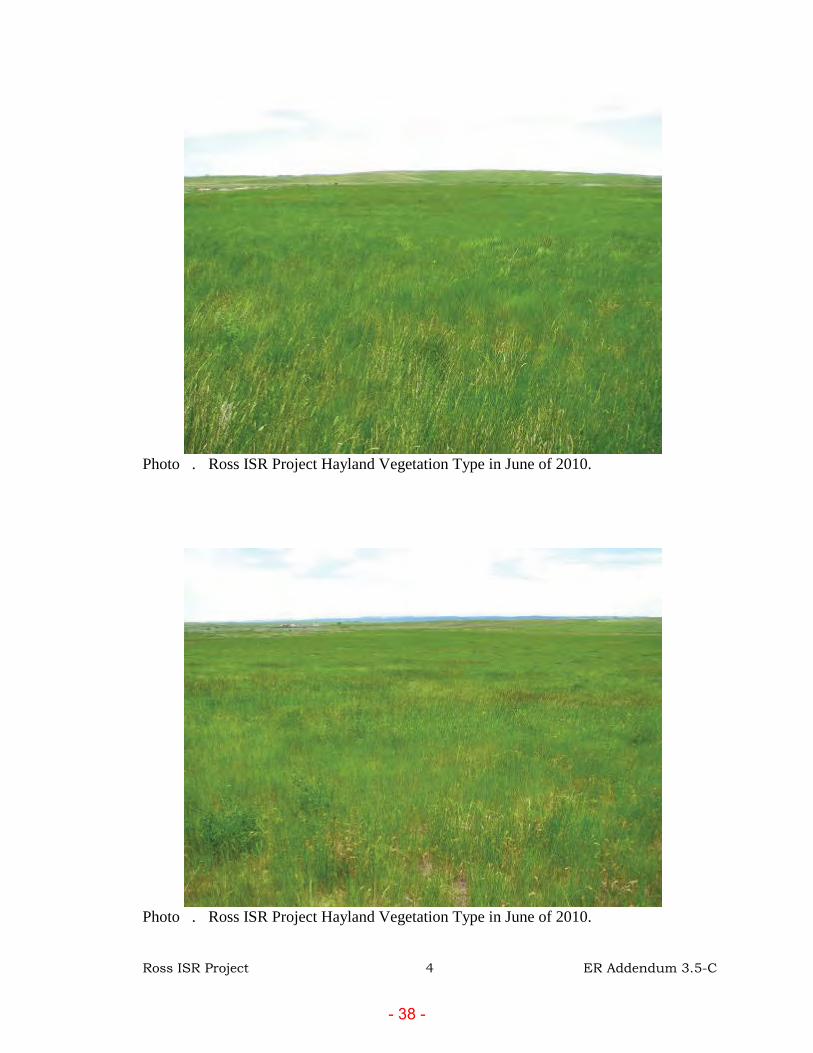
Photo . Ross ISR Project Hayland Vegetation Type in June of 2010.
Photo . Ross ISR Project Hayland Vegetation Type in June of 2010.
- 38 -

Ross ISR Project 5 ER Addendum 3.5-C
Photo . Ross ISR Project Wetland Vegetation Type in June of 2010.
Photo 10. Ross ISR Project Reservoir Stockpond Vegetation Type in June of 2010.
- 39 -

Ross ISR Project 6 ER Addendum 3.5-C
Photo 11. Ross ISR Project Cropland Map Unit in June of 2010.
Photo 12. Ross ISR Project Cropland Map Unit in June of 2010.
- 40 -

Ross ISR Project 7 ER Addendum 3.5-C
Photo 1 . Ross ISR Project Wooded Draw Vegetation Type in June of 2010.
Photo 1 . Ross ISR Project Wooded Draw Vegetation Type in June of 2010.
- 41 -

ADDENDUM 3.5-D
COMPUTER GENERATED DATA SHEETS
- 42 -

Ross ISR Project i ER Addendum 3.5-D
Computer Generated Data Sheets
Table of Contents
Upland Grassland Cover Data ............................................................................................1 Page
Sagebrush Shrubland Cover Data ........................................................................................ Pastureland Cover Data .......................................................................................................
- 43 -

Ross ISR ProjectUPLAND GRASSLAND
Cover Data ( 21-2 2010)
Ross ISR Project 1 ER Addendum 3.5-D
Life Form Species 1 2 10 11 12 1 1 1Perennial GrassAgropyron cristatum 0 0 0 0 0 0 0 0 0 1 0 0 0 0Agropyron smithii 2 0 2 1 1 1 1Agropyron spicatum 0 0 0 0 0 0 0 0 0 0 0 0 0 0 0Aristida purpurea 0 0 0 0 0 1 0 0 0 0 0 0 0 0Bouteloua gracilis 1 0 0 0 1 0 0 2 0 1 0 1 0 0Bromus inermis 0 0 2 0 0 0 0 11 0 0 0 0Buchloe dactyloides 0 0 0 0 1 2 0 0 1 0 0 0 2Calamovilfa longifolia 0 0 0 0 0 0 0 0 2 0 0 0 0 1Koeleria macrantha 1 0 0 0 0 0 0 10 0 2 0 1 2Poa bulbosa 0 0 1 2 2 2 2 0Poa pratensis 0 1 2 0 0 0 1Poa secunda 1 0 1 2 1 0 0 2 0 0 0 0 2 2 2Schizachyrium scoparium 0 0 0 0 0 0 0 0 1 0 0 1 0 0 0Sporobolus cryptandrus 0 0 0 0 0 0 0 0 0 0 0 0 0 0Stipa comata 1 1 0 2 0 1 1 1Stipa viridula 0 0 1 0 0 0 0 0 0 1 2 0
Grass-likeCarex filifolia 2 0 0 0 0 0 0 0 1 0 2 0 0 2Carex pensylvanica 0 1 0 0 0 0 1 0 1 1 2 0 0 1
Perennial ForbAchillea millefolium 0 1 0 0 0 0 0 0 2 0 1 0 1 0 0Ambrosia psilostachya 0 0 0 1 0 0 0 0 2 0 0 0 0 0 0Antennaria dimorpha 0 0 0 0 0 0 0 0 0 0 0 0 0 0 0Antennaria rosea 0 0 0 0 1 0 0 0 1 0 0 2 1 0 0Arnica fulgens 0 0 0 0 0 0 0 1 0 0 1 2 0 0Astragalus bisulcatus 0 0 0 0 0 0 0 0 0 0 0 0 1 1 0Astragalus spp. 0 0 0 0 0 0 0 0 0 0 0 0 0 0Besseya wyomingensis 0 0 0 0 0 0 0 1 0 0 1 0 0 0 0Cerastium arvense 0 0 0 0 0 1 0 0 0 0 0 0 0 0 2Erigeron pumilus 0 0 0 0 0 0 0 0 1 0 0 0 0 0 0Gaura coccinea 0 0 0 0 1 0 0 0 0 0 0 1 0 0 1Haplopappus spinulosus 0 0 0 1 0 0 0 0 0 0 0 0 0 0 0Helianthus maximiliani 0 0 0 1 0 0 0 0 0 0 0 0 0 0 0Heterotheca villosa 0 0 0 0 0 1 0 0 0 0 0 0 0 0 0Hymenoxys acaulis 0 0 0 0 0 0 0 0 0 0 0 0 0 0 0Liatris punctata 0 0 0 0 1 1 0 0 0 1 1 0 0 0 0Lithospermum incisum 0 0 0 0 0 0 0 0 0 0 0 0 0 0 0Lupinus argentea 0 1 1 1 1 0 0 0 0 0 0 0 0 0 1Lygodesmia juncea 0 0 0 1 0 0 0 0 0 0 0 0 1 0 0Melilotus officinalis 0 0 0 0 0 0 0 0 0 0 0 0 1 0Oxytropis spp. 0 0 0 0 0 1 0 0 0 0 0 0 0 0 0Phlox hoodii 0 0 0 0 1 1 0 0 0 0 0 0 0 1 0Psoralea argophylla 1 0 0 1 0 0 1 1 1 1 0 0 0
Transect
- 44 -

Ross ISR ProjectUPLAND GRASSLAND
Cover Data ( 21-2 2010)
Ross ISR Project 2 ER Addendum 3.5-D
Life Form SpeciesPerennial GrassAgropyron cristatumAgropyron smithiiAgropyron spicatumAristida purpurea Bouteloua gracilisBromus inermisBuchloe dactyloidesCalamovilfa longifoliaKoeleria macranthaPoa bulbosaPoa pratensisPoa secundaSchizachyrium scopariumSporobolus cryptandrusStipa comataStipa viridula
Grass-likeCarex filifoliaCarex pensylvanica
Perennial ForbAchillea millefoliumAmbrosia psilostachya Antennaria dimorpha Antennaria roseaArnica fulgensAstragalus bisulcatusAstragalus spp.Besseya wyomingensisCerastium arvenseErigeron pumilus Gaura coccineaHaplopappus spinulosus Helianthus maximilianiHeterotheca villosaHymenoxys acaulis Liatris punctataLithospermum incisumLupinus argenteaLygodesmia junceaMelilotus officinalisOxytropis spp.Phlox hoodiiPsoralea argophylla
Relative1 1 1 1 20 21 Total Mean Cover Cover
0 0 0 0 0 0. 0. 1.20 1 1 2 . .0 10.1
0 0 0 0 0 0.1 0. 0.0 0 0 0 1 0 0.2 0. 0.0 2 0 1 2 1.1 2. .0 0 0 0 0 0 2 1. 2. .00 2 0 1 2 0 1. . .20 0 0 0 0 11 0. 1.0 1.2 1 0 0 0 0 1. 2. .1
2 1 1 . . .0 2 2 0 1 0 .1 .2 .00 0 2 2 1 21 1.0 2.0 2.
11 0 0 0 0 0 1 0. 1.2 1.0 0 0 0 0 0 0.2 0. 0.
1 1 1 . . 1 .0 0 0 0 0 2 1.2 2. .
1 0 1 0 0 2 20 1.0 1. 2.0 0 0 0 2 1 0. 1. 2.1
0 0 0 0 1 0 0. 0. 0.0 0 0 0 0 0 0.1 0. 0.1 0 0 0 0 0 1 0.0 0.1 0.10 0 0 0 0 0 0.2 0. 0.0 0 0 0 0 0 0. 0. 1.10 0 0 0 0 0 2 0.1 0.2 0.0 0 1 0 1 0 0.2 0. 0.0 0 0 0 0 0 2 0.1 0.2 0.1 1 0 0 0 0 0.2 0. 0.0 0 0 0 0 0 1 0.0 0.1 0.10 0 0 0 1 0 0.2 0. 0.0 0 0 0 1 0 2 0.1 0.2 0.0 0 0 0 0 0 1 0.0 0.1 0.10 0 0 0 0 0 1 0.0 0.1 0.11 0 0 0 0 0 1 0.0 0.1 0.10 0 0 0 0 0 0.2 0. 0.0 0 0 1 0 0 1 0.0 0.1 0.10 0 0 0 0 0 0.2 0. 0.0 0 0 0 0 0 2 0.1 0.2 0.0 0 0 0 0 0 0. 0. 0.0 0 0 0 0 0 1 0.0 0.1 0.10 0 0 0 0 0 0.1 0. 0.0 2 0 2 1 1 2 1.1 2.2 .2
Transect
- 45 -

Ross ISR ProjectUPLAND GRASSLAND
Cover Data ( 21-2 2010)
Ross ISR Project 3 ER Addendum 3.5-D
Life Form Species 1 2 10 11 12 1 1 1Transect
Psoralea esculenta 0 0 0 0 0 0 0 0 0 0 0 0 0 0 0Sphaeralcea coccinea 1 1 0 0 1 0 0 0 0 0 0 1 0 0 0Taraxacum officinale 1 2 0 0 0 1 2 0 1 0 1 1 1 2 0Zigadenus venenosus 0 0 0 0 0 0 0 2 0 0 0 0 0 0 0
SubshrubArtemisia frigida 0 0 1 0 0 1 0 2 0 1 0 0 0 0 0Artemisia ludoviciana 0 0 0 0 0 0 0 0 0 0 1 0 0 0 0Gutierrezia sarothrae 0 0 0 0 0 0 0 1 0 0 0 0 0 0 0Yucca glauca 0 0 0 0 1 1 0 0 0 0 0 0 0 0 0
ShrubArtemisia tridentata 0 0 0 0 0 0 0 0 0 0 0 0 0 1 0
SucculentOpuntia polyacantha 0 0 0 0 0 0 0 0 0 0 0 0 0 0 0
Total Perennials 24 35 35 34 42 26 28 35 38 34 37 39 29 29 28
Annual GrassBromus japonicus 1 0 2 0 0 1 0 1 0 1 2 2 1Bromus tectorum 2 0 0 0 0 0 0 0 0 0 0 0 0 0 0
Annual ForbAlyssum alyssoides 1 0 0 0 0 0 1 0 2 0 0 1 0 0Filago arvensis 0 0 0 1 0 0 0 0 0 0 0 0 0 0 0Medicago lupulina 0 0 0 0 0 0 2 0 0 0 0 0 0 0 0
Total Veg Cover 2 2 2 1 1 1 2
Lichens 0 0 0 0 0 0 0 0 0 0 0 0 0Litter 11 12 1 10 12 10 1Rock 0 0 0 0 0 0 0 0 0 0 0 0 0 0 0
Bare Ground 11 0 1 2 0 10
Total Ground Cover 0 2 2 0 0
- 46 -

Ross ISR ProjectUPLAND GRASSLAND
Cover Data ( 21-2 2010)
Ross ISR Project 4 ER Addendum 3.5-D
Life Form SpeciesPsoralea esculentaSphaeralcea coccineaTaraxacum officinaleZigadenus venenosus
SubshrubArtemisia frigidaArtemisia ludovicianaGutierrezia sarothraeYucca glauca
ShrubArtemisia tridentata
SucculentOpuntia polyacantha
Total Perennials
Annual GrassBromus japonicusBromus tectorum
Annual ForbAlyssum alyssoidesFilago arvensisMedicago lupulina
Total Veg Cover
LichensLitterRock
Bare Ground
Total Ground Cover
Relative1 1 1 1 20 21 Total Mean Cover Cover
Transect
0 0 0 0 0 1 1 0.0 0.1 0.10 0 1 0 0 1 0. 0. 0.0 1 0 0 0 0 1 0. 1.2 1.0 0 0 0 0 0 2 0.1 0.2 0.
0 0 1 0 0 0 0. 0. 0.0 0 0 0 0 0 1 0.0 0.1 0.10 0 0 0 0 0 1 0.0 0.1 0.10 1 1 0 0 0 0.2 0. 0.
0 0 0 0 0 0 1 0.0 0.1 0.1
0 0 1 0 0 0 1 0.0 0.1 0.1S-1 Nmin
29 31 37 29 31 33 683 32.5 65.0 94.2 . 2
0 0 2 0 2 1. 2. .0 0 0 0 0 0 2 0.1 0.2 0.
0 1 0 1 0 0 10 0. 1.0 1.0 0 0 0 0 0 1 0.0 0.1 0.10 0 0 0 0 0 2 0.1 0.2 0.
S-1 Nmin2 2 . .0 .02
0 0 0 0 0 0 0. 0.11 11 11 10 12 202 . 1 .21 0 0 0 0 0 1 0.0 0.1
2 11 . 10.S-1 Nmin
1 . .2 .12 2
- 47 -

Ross ISR ProjectSAGEBRUSH SHRUBLAND
Cover Data ( 21-2 2010)
Ross ISR Project 5 ER Addendum 3.5-D
Life Form Species 1 2 10 11 12 1 1 1Perennial GrassAgropyron cristatum 0 0 0 0 2 0 0 0 0 0 1 0 0 0Agropyron dasystachyum 0 0 0 0 0 0 0 0 0 0 1 0 0 0 1Agropyron smithii 2 1 1 1 0 2 11Bouteloua gracilis 0 0 0 1 0 2 0 0 0 0 0 2 0 0Bromus inermis 0 0 2 1 0 0 0 0 0 0 0 0 0 0Buchloe dactyloides 1 0 2 0 1 0 0 2 0 0 0Calamovilfa longifolia 0 0 0 0 0 0 0 0 0 0 0 0 0 0Distichlis stricta 0 0 0 0 0 0 0 0 0 0 0 0 0 0 1Koeleria macrantha 0 0 0 1 0 1 0 2 1 0 1 0Poa bulbosa 0 1 1 0Poa pratensis 1 10 10 1 0 2Poa secunda 0 1 0 0 0 0 0 1 0 1 0 0 2 1Schizachyrium scoparium 0 0 0 0 2 0 0 0 2 0 0 0 0 0 0Sporobolus airoides 0 0 0 0 0 0 0 0 0 0 0 0 0 0 0Stipa comata 2 0 0 0 0 0 2 0 1 0 1 0 0Stipa viridula 0 0 0 0 1 0 1 0 1 1 0 1 0
Grass-likeCarex filifolia 0 0 0 0 0 0 0 2 0 0 0 1 0 0Carex pensylvanica 0 0 0 0 0 0 0 0 2 0 0 0 0 0 0
Perennial ForbAchillea millefolium 1 2 0 2 1 1 0 0 0 0 0 0 0 0 1Allium textile 0 0 0 0 0 0 0 0 0 0 0 0 1 0 0Antennaria rosea 0 0 0 0 0 1 0 1 0 0 0 0 0 0 0Arnica fulgens 0 0 0 0 0 0 0 1 0 0 0 0 0 0 0Astragalus bisulcatus 0 0 0 0 1 2 0 0 0 0 0 0 0 0 0Astragalus spp. 1 0 0 0 2 2 0 1 0 0 0 0 0 0 0Besseya wyomingensis 0 0 0 0 0 0 0 0 1 0 0 0 0 0 0Cerastium arvense 0 0 0 1 1 1 1 1 0 0 0 0 2 0 0Comandra umbellatum 0 0 0 0 0 0 0 0 0 0 0 0 0 0 0Euphorbia esula 0 0 0 0 0 0 0 0 0 0 0 0 0 0Gaura coccinea 0 0 0 0 0 1 0 0 0 0 0 0 0 0 0Geum triflorum 0 0 0 0 1 0 0 0 0 0 0 0 0 0 0Heterotheca villosa 0 0 0 0 0 0 0 2 0 0 0 0 0 0 0Liatris punctata 0 0 0 0 0 0 0 2 0 0 0 0 1 0 0Lithospermum incisum 0 0 1 0 0 0 0 0 0 0 0 0 0 0 0Lupinus argentea 0 0 0 0 1 0 0 0 0 0 0 1 0 0 0Lygodesmia juncea 0 0 0 0 0 1 0 0 0 0 0 0 0 0 0Medicago sativa 0 0 0 0 0 0 0 0 0 0 0 2 0 0 0Melilotus officinalis 0 0 0 0 1 0 0 0 1 0 2 0 0 0Musineon divaricatum 0 0 0 0 0 0 0 0 0 1 0 0 0 0 1Oxytropis spp. 0 0 0 0 0 0 0 1 0 0 0 0 1 0 0Phlox hoodii 0 0 0 0 0 0 0 1 2 0 0 0 0 0 0Psoralea argophylla 1 0 0 0 1 1 1 2 0 0 0 1 0 0
Transect
- 48 -

Ross ISR ProjectSAGEBRUSH SHRUBLAND
Cover Data ( 21-2 2010)
Ross ISR Project 6 ER Addendum 3.5-D
Life Form SpeciesPerennial GrassAgropyron cristatumAgropyron dasystachyumAgropyron smithiiBouteloua gracilisBromus inermisBuchloe dactyloidesCalamovilfa longifoliaDistichlis strictaKoeleria macranthaPoa bulbosaPoa pratensisPoa secundaSchizachyrium scoparium Sporobolus airoidesStipa comataStipa viridula
Grass-likeCarex filifoliaCarex pensylvanica
Perennial ForbAchillea millefoliumAllium textileAntennaria rosea Arnica fulgensAstragalus bisulcatusAstragalus spp.Besseya wyomingensis Cerastium arvense Comandra umbellatumEuphorbia esula Gaura coccineaGeum triflorum Heterotheca villosaLiatris punctataLithospermum incisum Lupinus argenteaLygodesmia juncea Medicago sativaMelilotus officinalisMusineon divaricatum Oxytropis spp.Phlox hoodiiPsoralea argophylla
Relative1 1 1 1 20 Total Mean Cover Cover
0 0 0 0 0 0. 0. 0.0 0 0 0 1 0.2 0. 0.
1 1 2 .1 .2 .2 0 0 1 0 11 0. 1.1 1.0 0 0 0 0 0. 0. 0.0 1 0 0 1. . .0 0 0 2 0 0. 0. 0.0 0 0 0 0.2 0. 0.0 1 0 1 0 22 1.1 2.2 .1
0 . .0 10.02 1 2 11 . 11. 1 .
0 0 0 0 1 11 0. 1.1 1.0 0 0 0 0 0.2 0. 0.0 2 0 0 0 2 0.1 0.2 0.
0 0 0 2 2 1. 2. .1 0 0 20 1.0 2.0 2.
0 0 0 0 0 0. 0. 1.00 0 0 0 0 2 0.1 0.2 0.
1 0 0 1 0 10 0. 1.0 1.0 0 0 0 0 1 0.1 0.1 0.10 0 0 0 0 2 0.1 0.2 0.0 0 0 1 0 2 0.1 0.2 0.0 0 0 0 0 0.2 0. 0.0 0 0 1 0 0. 0. 1.00 0 0 0 0 1 0.1 0.1 0.11 0 1 1 0 10 0. 1.0 1.1 0 0 0 0 1 0.1 0.1 0.10 0 0 0 0 0. 0. 0.0 0 0 0 0 1 0.1 0.1 0.10 0 0 0 0 1 0.1 0.1 0.10 0 0 0 0 2 0.1 0.2 0.0 0 0 0 0 0.2 0. 0.0 0 0 0 0 1 0.1 0.1 0.10 0 0 1 0 0.2 0. 0.0 0 0 0 0 1 0.1 0.1 0.10 0 0 0 0 2 0.1 0.2 0.1 0 0 0 1 0. 0. 1.0 0 0 0 0 2 0.1 0.2 0.0 0 0 0 0 2 0.1 0.2 0.0 0 0 0 0 0.2 0. 0.0 0 0 0 0 10 0. 1.0 1.
Transect
- 49 -

Ross ISR ProjectSAGEBRUSH SHRUBLAND
Cover Data ( 21-2 2010)
Ross ISR Project 7 ER Addendum 3.5-D
Life Form Species 1 2 10 11 12 1 1 1Transect
Ratibida columnifera 0 0 0 0 0 0 0 0 0 0 1 0 0 0 0Sphaeralcea coccinea 1 1 1 1 0 0 0 0 0 0 0 0 0 0 0Taraxacum officinale 1 0 0 1 1 0 0 1 1 1 0Vicia americana 0 0 0 0 0 0 0 0 0 0 0 0 2Zigadenus venenosus 0 0 0 0 0 0 0 0 1 0 0 0 0 0 0
SubshrubArtemisia frigida 0 0 0 0 1 0 2 0 1 0 0 2 0 1Artemisia ludoviciana 0 0 0 0 1 0 0 0 0 0 0 0 0 2Atriplex gardneri 0 0 0 0 0 0 0 0 0 0 0 0 0 0 0Gutierrezia sarothrae 0 0 0 0 0 0 0 0 0 0 1 0 0 0 0
ShrubArtemisia cana 2 2 0 0 0 1 0 0 0 0 0 0Artemisia tridentata 0 0 0 0 2 0 2Chrysothamnus nauseosus 0 0 0 1 0 0 0 0 0 0 0 0 0 0 0Sarcobatus vermiculatus 0 0 0 0 0 0 0 0 0 0 0 0 0 0 1Symphoricarpos occidentalis 2 2 0 0 0 0 0 0 0 0 0 0 0 0 2
SucculentOpuntia polyacantha 0 0 0 0 0 0 0 1 0 2 0 0 0 0 0
Total Perennials 40 37 32 40 35 32 35 42 33 29 29 23 33 31 33
Annual GrassBromus japonicus 1 0 0 0 1 0 0 0 0 2 10 0 0 1Bromus tectorum 0 0 2 0 0 0 0 0 0 0 0 0 0 0
Annual ForbAlyssum alyssoides 0 0 2 1 0 0 0 0 0 0 1 2 0 0 0Camelina microcarpa 0 0 0 0 0 0 0 0 0 0 0 1 0 0 0Descurainia pinnata 0 0 0 0 0 0 0 0 0 0 0 0 0 0Filago arvensis 0 0 0 0 0 0 0 0 0 0 0 0 0 0Medicago lupulina 0 0 0 0 0 0 0 0 0 1 0 0 0 0 0Plantago patagonica 0 0 0 0 0 0 0 0 0 0 0 0 0 0 0Thlaspi arvense 0 1 0 0 0 0 0 0 0 0 0 0 0 0 0
Total Veg Cover 1 1 2 0 2 1
Lichens 1 0 0 0 0 0 0 0 0 0 0 0 1 0 0Litter 1 10 10 1 11 1 12
Bare Ground 2 0 0 2 1 1 12 10 10
Total Ground Cover 0 0 0 0
- 50 -

Ross ISR ProjectSAGEBRUSH SHRUBLAND
Cover Data ( 21-2 2010)
Ross ISR Project 8 ER Addendum 3.5-D
Life Form SpeciesRatibida columniferaSphaeralcea coccineaTaraxacum officinaleVicia americanaZigadenus venenosus
SubshrubArtemisia frigidaArtemisia ludovicianaAtriplex gardneriGutierrezia sarothrae
ShrubArtemisia canaArtemisia tridentataChrysothamnus nauseosusSarcobatus vermiculatusSymphoricarpos occidentalis
SucculentOpuntia polyacantha
Total Perennials
Annual GrassBromus japonicusBromus tectorum
Annual ForbAlyssum alyssoidesCamelina microcarpaDescurainia pinnataFilago arvensis Medicago lupulina Plantago patagonicaThlaspi arvense
Total Veg Cover
LichensLitter
Bare Ground
Total Ground Cover
Relative1 1 1 1 20 Total Mean Cover Cover
Transect
0 0 0 0 0 1 0.1 0.1 0.10 0 0 0 0 0.2 0. 0.1 1 0 2 0 22 1.1 2.2 .10 0 1 0 1 11 0. 1.1 1.0 0 0 0 0 1 0.1 0.1 0.1
0 0 0 0 0 10 0. 1.0 1.1 0 0 0 0 0. 0. 1.00 1 0 0 0 1 0.1 0.1 0.10 0 0 0 0 1 0.1 0.1 0.1
1 1 0 0 2 1. 2. .01 1 2. . .0 1 0 0 0 2 0.1 0.2 0.0 1 0 0 0 2 0.1 0.2 0.
0 0 0 0 10 0. 1.0 1.
0 0 0 1 1 0. 0. 0.S-1 Nmin
33 25 32 33 23 650 32.5 65.0 93.0 .1
1 2 0 0 0 2 1. 2. .0 0 0 0 0 0. 0. 1.0
0 0 0 0 0 0. 0. 0.0 0 0 0 0 1 0.1 0.1 0.10 0 0 0 0 0.2 0. 0.0 0 0 0 0 0.2 0. 0.0 0 0 0 0 1 0.1 0.1 0.11 0 0 0 0 1 0.1 0.1 0.10 0 0 0 0 1 0.1 0.1 0.1
S-1 Nmin2 2 2 . . .
0 0 0 0 0 2 0.1 0.210 1 12 10 1 .0 1 .
1 120 .0 12.0S-1 Nmin
1 0 .0 .0 .01
- 51 -

Ross ISR ProjectPASTURE
Cover Data ( 21-2 2010)
Ross ISR Project 9 ER Addendum 3.5-D
Life Form Species 1 2 10 11 12 1 1 1Perennial Grass Agropyron cristatum 0 0 0 0 2 1 2 12 0 0 0 1 1Agropyron intermedium 10 12 12 0 1 0 10 0 0 0 1 0Agropyron smithii 0 0 1 0 1 0 1 0 2 0 2Bromus inermis 0 1 2 0 21 1 2 2 1 0Buchloe dactyloides 0 0 0 0 0 0 0 1 12 0 0 0 0Poa bulbosa 0 0 1Poa secunda 2 1 0 2 2 0 0 1 0 0 0 2Stipa comata 1 0 0 0 0 0 0 0 0 0 0 0 0 0 0Stipa viridula 0 0 0 0 0 0 0 0 0 0 0 0 1
Perennial ForbCerastium arvense 0 0 0 0 0 0 0 0 1 0 0 0 0 0 0Medicago sativa 1 1 1 1 0 1 1 0 0 2 0 0Melilotus officinalis 0 1 0 0 0 0 0 0 0 0 0 0 0 0 0Sphaeralcea coccinea 0 0 0 0 0 0 0 0 2 2 0 0 0 1 0Taraxacum officinale 0 0 0 0 0 0 0 1 0 0 0 0 0 0 0Vicia americana 0 1 0 2 0 0 0 0 0 0 0 0 0 0 0
SubshrubArtemisia frigida 0 1 0 0 0 0 0 0 0 0 0 0 0 0 0
ShrubArtemisia cana 0 0 0 0 0 0 0 0 0 0 0 0 0 1 0
Total Perennials 28 30 31 30 33 32 29 35 36 33 31 29 29 36 36
Annual ForbAlyssum desertorum 0 1 0 0 0 0 0 0 0 0 0 0 0 0 0
Total Veg Cover 2 1 1 0 2 2 1 2 2
Litter 1 1 1 1 1 1 1 11 11 1 10 1 10 10Rock 0 0 0 0 0 0 0 0 0 1 0 0 0 0 0
Bare Ground 1 11
Total Ground Cover
Transect
- 52 -

Ross ISR ProjectPASTURE
Cover Data ( 21-2 2010)
Ross ISR Project 10 ER Addendum 3.5-D
Life Form SpeciesPerennial Grass Agropyron cristatumAgropyron intermediumAgropyron smithiiBromus inermisBuchloe dactyloidesPoa bulbosaPoa secundaStipa comataStipa viridula
Perennial ForbCerastium arvenseMedicago sativaMelilotus officinalisSphaeralcea coccineaTaraxacum officinaleVicia americana
SubshrubArtemisia frigida
ShrubArtemisia cana
Total Perennials
Annual ForbAlyssum desertorum
Total Veg Cover
LitterRock
Bare Ground
Total Ground Cover
Relative1 1 1 1 20 Total Mean Cover Cover
0 0 0 0 0 . .0 1 .11 2 11 11 1 2 . 1 .2 2 .
2. . .0 0 0 1 . 1 . 2 .01 1 0 0 2 1. .2 .0
0 0 2 . . 10.2 0 2 2 2 1. .2 .00 0 0 0 0 1 0.1 0.1 0.21 0 0 0 1 10 0. 1.0 1.
0 0 0 0 0 1 0.1 0.1 0.22 0 0 0 1 2 1. 2. .1 0 0 0 0 2 0.1 0.2 0.0 0 0 0 0 0. 0. 0.0 0 2 0 0 0.2 0. 0.2 0 1 0 11 0. 1.1 1.
0 0 0 2 1 0.2 0. 0.
0 0 0 0 0 1 0.1 0.1 0.2S-1 Nmin
36 34 35 25 31 639 32.0 63.9 99.8 .1 1
0 0 0 0 0 1 0.1 0.1 0.2
S-1 Nmin2 1 0 2.0 .0 .1
1 1 10 1 1 2 1 1 .1 2 .10 0 0 0 0 1 0.1 0.1
0 1 10 . .S-1 Nmin
0 0 02 .1 0.2 2. 2
Transect
- 53 -

ADDENDUM 3.5-E
VEGETATION SAMPLING PLAN
Ross ISR Project ER Addendum 3.5-E- 54 -
Ross ISR Project 1 ER Addendum 3.5-E- 55 -

Ross ISR Project 2 ER Addendum 3.5-E- 56 -
Ross ISR Project 3 ER Addendum 3.5-E- 57 -

Ross ISR Project 4 ER Addendum 3.5-E- 58 -

Ross ISR Project 5 ER Addendum 3.5-E- 59 -

Ross ISR Project 6 ER Addendum 3.5-E- 60 -

Ross ISR Project 7 ER Addendum 3.5-E- 61 -
Ross ISR Project 8 ER Addendum 3.5-E- 62 -

ADDENDUM 3.5-F
WILDLIFE INVENTORY
- 63 -
Ross ISR Project i ER Addendum 3.5-F
F T
ST ATA G
SS S P T
By
Intermountain Resources P.O. Box 1
Laramie WY 20 0 - - 0
October 2010
- 64 -

Ross ISR Project ii ER Addendum 3.5-F
TA F T TS
1.0 Description of the Study Area ...............................................................................................1
1.1 Agencies Consulted .......................................................................................................... 1
2.0 Habitat Description ...............................................................................................................2
.0 Species List ...........................................................................................................................
.0 Methods.................................................................................................................................
.1 File Searches ....................................................................................................................
.2 Field Surveys ....................................................................................................................
.0 Results ...................................................................................................................................
.1 Big Game..........................................................................................................................
.2 Upland Game Birds ..........................................................................................................
. Waterfowl and Shorebirds ................................................................................................
. Raptors ........................................................................................................................... 11
. Passerine Birds ............................................................................................................... 11
. Other Mammals .............................................................................................................. 1
. Migratory Birds of High Federal Interest (MBHFI) ...................................................... 1
. BLM Sensitive Species .................................................................................................. 1
. Threatened or Endangered Species (T E) and Candidate Species ............................... 20
.10 Reptiles and Amphibians ............................................................................................... 21
.11 Fish ................................................................................................................................. 22
.0 Impacts ................................................................................................................................22
.0 Mitigation and Monitoring ..................................................................................................2
.0 Conclusion ..........................................................................................................................2
.0 References ...........................................................................................................................2
ST F TA S
Table 1 ............ Habitat Types and Acreages for the Ross ISR Project Permit Area ........................
Table 2 ............ Ross ISR Project Sage-grouse Lek Activity Summary ............................................
Table ............ Ross ISR Project Raptor Production Summary for Nests Located Within One Mile of the Permit Area in 2010 ............................................................................12
- 65 -

Ross ISR Project iii ER Addendum 3.5-F
TABLE OF CONTENTS (CONTINUED)
Table ............ Bird Species Observed During Passerine Bird Belt Transect Surveys Completed on the Ross ISR Project Permit Area 2010. ..........................................................1
Table ............ Level I Species Migratory Birds of High Federal Interest (MBHFI) (USFWS 2002) ......................................................................................................................1
Table ............ BLM Sensitive Wildlife Species List for Newcastle Field Office .........................1
LIST OF ADDENDA
Addendum . -G Wildlife Species List
Addendum . -H Wildlife Sampling Plan
Addendum . -I Correspondence
- 66 -

Ross ISR Project 1 ER Addendum 3.5-F
F T
1.0 escri tion o the Stu Area
Intermountain Resources completed wildlife surveys on the Ross ISR Project proposed
by Peninsula Minerals Ltd dba Strata Energy Inc. (Strata) in late November of 200 through
September of 2010. Surveys were completed as required by state and federal agencies. This
study was completed to permit an in-situ uranium mine.
The study area is located in Crook County Wyoming about 2 miles north of the town of
Moorcroft. The permit area is situated within Sections 12 1 1 and 2 T N R W and
Sections 1 and 1 T N R W. This area is shown on ER Figure . - . The wildlife study
area includes the permit area and one to two mile perimeter for selected species.
The permit area is under primarily private ownership but some state of Wyoming and
Bureau of Land Management (BLM) lands exist within the site. Intermittent waters (Deadman
Creek Little Missouri River and its tributaries) as well as the Oshoto Reservoir exist within the
permit area. Several other ephemeral water sources (stockponds) are also located within the
permit area.
1.1 Agencies Consulted
Field surveys and reporting specific to this project were completed by Intermountain
Resources personnel. Agencies contacted included the Wyoming Game and Fish Department
(WG FD) the Wyoming Department of Environmental Quality-Land Quality Division
(WDEQ-LQD) the Bureau of Land Management (BLM) and the United States Fish and Wildlife
Service (USFWS). Written correspondence with some of the agencies is provided in Addendum
. -I.
- 67 -

Ross ISR Project 2 ER Addendum 3.5-F
2.0 abitat escri tion
The permit area is predominantly upland grassland with some sagebrush shrubland
pastureland hayland reservoir stockpond wetland disturbed land cropland and wooded draw
habitats. Table 1 provides acreages by habitat type for the permit area while the habitat locations
are shown on ER Figure . -2. No cliffs or perennial streams exist within the permit area.
The upland grassland habitat type is characterized by flat to steeply sloping gradients
with variable relief. The dominant plant species of the upland grassland type include western
wheatgrass followed by needleandthread bulbous bluegrass Kentucky bluegrass buffalograss and
smooth brome. A variety of forbs is also present within this habitat type.
The sagebrush shrubland habitat type is characterized by gently rolling to steep slopes
minor draws and drainages. The dominant plant species for this type include Kentucky bluegrass
followed by bulbous bluegrass western wheatgrass big sagebrush buffalograss silver sagebrush
and Japanese chess.
The pastureland habitat type is characterized by gently rolling to flat slopes with
moderately deep soils. This habitat type is used primarily for grazing cattle and is rarely hayed.
Dominant plant species are intermediate wheatgrass smooth brome crested wheatgrass and
western wheatgrass.
The hayland habitat type is characterized by gently rolling to flat slopes with moderately
deep soils. This habitat type was used primarily for grass hay and alfalfa production and winter
time pasture land for cattle and horses. Dominant species are alfalfa crested wheatgrass smooth
brome and intermediate wheatgrass.
- 68 -

Ross ISR Project 3 ER Addendum 3.5-F
Table 1 Habitat Types and Acreages for the Ross ISR Project Permit Area
Permit AreaHabitat Unit Acres Percent
Upland Grassland 1 . .
Sagebrush Shrubland .0 21.
Pastureland 12 . .
Hayland 121.1 .0
Reservoir Stockpond . 2.0
Wetland 1.1 1.
Disturbed Land . .
Cropland . 1 2.
Wooded Draw . 2 0._______ _____
Total 1721.31 100.0
- 69 -

Ross ISR Project 4 ER Addendum 3.5-F
The reservoir stockpond habitat type occurs along major drainage bottoms (Deadman
Creek Little Missouri River and Oshoto Reservoir) found within the permit area. A detailed
wetland inventory is provided in the Addendum . -A. Oshoto Reservoir provides a permanent
water source but is not considered a viable fisheries. The other reservoir stockpond sites are
relatively small and are semi-permanent to ephemeral in nature.
The wetland habitat type occurs along major drainage bottoms (Deadman Creek Little
Missouri River and Oshoto Reservoir) found within the permit area. A detailed wetland
inventory is provided in the wetland report (Addendum . -A). The wetlands are generally
vegetated with sedges rushes and bulrushes.
The disturbed habitat type occurs where roads cross the area and sites of energy (oil gas)
development and production. Little to no vegetation is established on these disturbed sites.
The cropland habitat type is characterized by moderate to deep topsoil with moderate to
little slope. The crops planted and harvested on this type have been wheat oats and barley.
The wooded draw habitat type is found in a few small drainage bottoms and typically has
moderately deep soils. The most common woody plant species encountered on this habitat type
includes plains cottonwood boxelder maple peachleaf willow and snowberry. Common
understory species are Kentucky bluegrass smooth brome big sagebrush silver sagebrush and
Japanese chess.
3.0 S ecies ist
A list of wildlife species with common and scientific names that may potentially occur
on the permit area or within several miles is provided in Addendum . -G. All species that were
actually observed on the permit or adjacent areas are indicated on the list with an asterisk. The
observations recorded are based on November of 200 through September of 2010 surveys. The
- 70 -

Ross ISR Project 5 ER Addendum 3.5-F
2010 WG FD computer printouts from their wildlife observation system and other studies
completed in the area were also used for compilation of the species list.
4.0 etho s
File searches and field surveys were the basis of data collection for this inventory. These
methods are described in the following section.
.1 File Searches
File searches were the primary sources of agency data collection for this study. These
searches included applicable independent publications BLM sources Wyoming Natural
Diversity data base USFWS WG FD Publications and the WG FD computerized Wildlife
Observation System.
.2 Field Surveys
The 200 and 2010 field surveys covered the entire permit area and a one to two mile
perimeter for selected species. These surveys were designed to locate any proposed candidate or
T E species including habitat for those species (i.e. prairie dog towns nest sites roosts leks
etc.) Migratory Birds of High Federal Interest (MBHFI species) BLM sensitive species
document raptor nest sites and record any wildlife species or their sign observed. Surveys were
completed by traversing the area and suitable habitats in a four-wheel drive vehicle ATV or on
foot. Specific survey methods for individual species or groups of species are included in the
results sections for those species. The sampling plan submitted to the WG FD and USFWS is
provided in Addendum . -H. Two sage-grouse leks have been documented within about two
miles of the permit area.
- 71 -

Ross ISR Project 6 ER Addendum 3.5-F
5.0 esults
The following sections provide the results of the file searches and field inventories. ER
Figure . - shows the permit area location and selected wildlife information. Addendum . -G
provides a list of common names and scientific names for wildlife species that have been
observed or which have the potential for occurring in the study area. Addendum . -H contains
the wildlife sampling plan submitted to the WG FD and USFWS. Addendum . -I includes
correspondence with state and federal agencies.
.1 Big Game
Specific surveys for big game animals were not required by the WG FD for this permit
area in 2010. Mule deer pronghorn and white-tailed deer were the only big game species
recorded on the study area in 200 and 2010 based on records kept from opportunistic
observations. Mule deer and pronghorn were common but not abundant on the study area. Mule
deer had an affinity for the sagebrush shrubland habitats while pronghorn were observed in the
sagebrush shrubland and upland grassland habitats. Mule deer and pronghorn frequented
haylands and cultivated lands in the spring and fall. The white-tailed deer was not very abundant
and was observed in the riparian habitats as well as the cultivated fields on the permit area in
200 -2010.
Mule deer pronghorn white-tailed deer and elk were the big game animals recorded for
the study area by the WG FD. Their observations conclude that mule deer and pronghorn are
the most common species in the area. Mule deer utilized all habitats pronghorn were most
common on sagebrush and upland grassland habitats the white-tailed deer typically used the
riparian areas and the elk used sagebrush and upland grassland habitats.
- 72 -

Ross ISR Project 7 ER Addendum 3.5-F
Mule deer use of the area as determined by the WG FD is winter yearlong. Pronghorn
use was classified by the WG FD as yearlong. The white-tailed deer use was classified by the
WG FD as primarily out of normal range with some yearlong use. The permit area is out of the
normal use range for elk. No crucial winter ranges have been delineated on the permit or
adjacent areas.
The study area is located within the WG FD Powder River Mule Deer Herd Unit the
North Black Hills Pronghorn Herd Unit and the Thunder Basin white-tailed deer herd unit. The
mine permit is not within a specific elk herd unit but is included in hunt area 12 .
.2 Upland Game Birds
The mourning dove wild turkey sharp-tailed grouse and sage-grouse were the only
upland game bird species observed on the study area in 200 -2010. The mourning dove is a
common summer resident and undoubtedly breed and nest in the area. Mourning doves were
recorded using the area during the spring and summer months in various habitat types. Four wild
turkeys were observed within pine habitat within two miles east of the permit area in January of
2010. A flock of wild turkeys also wintered around ranch facilities about two miles northwest of
the permit area in 200 -2010. Marginal habitat is present on the permit area for the wild turkey.
Sharp-tailed grouse and sage-grouse strutting ground surveys were conducted for the
permit area and two mile perimeter on March 1 April 1 1 2 and 2 of 2010. Surveys were
conducted by surveying all suitable habitat at dawn using a four-wheel drive vehicle and ATV.
Searches were conducted for new strutting grounds during all survey dates while previously
identified strutting grounds were surveyed on April 1 and 2 of 2010. The permit area is not
located within a designated sage-grouse core breeding area. Sharp-tailed grouse were only
recorded on the area during the 200 winter surveys but are considered yearlong residents in the
- 73 -

Ross ISR Project 8 ER Addendum 3.5-F
area. No sharp-tailed grouse strutting grounds were identified on or within two miles of the
permit area. Two sage-grouse strutting grounds are known to occur within two miles of the
permit area. The Oshoto Lek (Sections 2 and 2 T N R W) and the Cap’n Bob Lek
(Section 2 T N R W) were identified from the WG FD sage-grouse database. No other
sage-grouse leks were identified during the 2010 surveys. Details of sage-grouse strutting
activities for these leks is summarized in Table 2. Ground surveys of the Oshoto and Cap’n Bob
leks were conducted on April 1 and 2 of 2010. On the Cap’n Bob Lek a total of two males and
one female were observed on April 1 and two males were recorded on this lek on April 2
during the 2010 surveys. No sage-grouse were observed on the Oshoto Lek during either of
these survey dates. No broods or brood rearing areas were identified during the 2010 field
surveys. No sage-grouse wintering areas were identified within the permit area during the 2010
surveys.
. Waterfowl and Shorebirds
Other than the Oshoto Reservoir only small ponds intermittent and ephemeral water is
found within the permit area. Excluding the Oshoto Reservoir these small waterbodies provide
primarily seasonal and limited habitat for waterfowl and shorebirds. The waterbodies present
consist of the Oshoto Reservoir small stockponds and intermittent ephemeral streams which are
fed by spring or storm water run off. Some perennial springs and seeps are also present. The
majority of the water birds were observed during spring migration when most of the waterbodies
present contained water. The most common species observed were the Canada goose mallard
widgeon gadwall pintail blue-winged teal and American coot. As the smaller waterbodies
dried up the water birds either left the area or moved to the Oshoto Reservoir or other sites where
- 74 -

Ross ISR Project 9 ER Addendum 3.5-F
Table 2 Ross ISR Project Sage-grouse Lek Activity SummarySage-grouse Lek Data
-OshotoSWSE Sec. 2 T N R W -Cap’n Bob
Year Date SENW Sec. 2 T N R W SESW Sec. 2 T N R W
males1985 -
nc1986 -
nc1987 -
19881 0 -22 0 -
nc1989 -
nc1990 -
01991 -
nc1992 -
nc1993 -
01994 -
nc1995 -
nc1996 -
01997 -
nc1998 -
nc1999 -
200012 0 -
20011 males -
- 75 -

Ross ISR Project 10 ER Addendum 3.5-F
Table 2 Ross ISR Project Sage-grouse Activity Summary (Continued).Sage-grouse Lek Data
-OshotoSWSE Sec. 2 T N R W -Cap’n Bob
Year Date SENW Sec. 2 T N R W SESW Sec. 2 T N R W
nc2002 -
nc2003 -
20041 2 males -
nc2005 -
nc2006 -
20070 10 males
1 0 10 males
nc2008 nc
nc2009 nc
20101 0 2 males 1 female2 0 2 males
Past sage-grouse data obtained from the WG FD.nc not checked
- 76 -

Ross ISR Project 11 ER Addendum 3.5-F
water was present. Several waterfowl broods were observed on the area in 2010. The species
list in Addendum . -G provides all the waterfowl and shorebirds identified on the area.
. Raptors
Raptor nest searches were conducted on the ground over suitable habitats from January
through August of 2010. A total of eight intact nest sites were recorded on the study area in
2010 as shown on ER Figure . - and Table . The raptor species that were recorded nesting
on the permit area in 2010 included the ferruginous hawk and red-tailed hawk. Other species of
raptors observed in the area during 2010 include the golden eagle bald eagle great horned owl
Cooper’s hawk northern harrier Swainson’s hawk rough-legged hawk American kestrel short-
eared owl and osprey. The northern harrier short-eared owl and American kestrel may have
nested on the permit area in 2010 but due to the nature and location of their nest sites those
nests have remained undetected during the breeding season. The golden eagle great horned owl
and Cooper’s hawk nest in the region but no nest sites were located within two miles of the
permit area. The bald eagle osprey and rough-legged hawk are migrants to the area.
A detailed summary of nesting raptor species nest sites activity and nest production for
the 2010 study is exhibited in Table .
. Passerine Birds
Specific surveys for passerine bird species were conducted in 2010 on this study area.
These surveys consisted of walking 1000 meter by 100 meter belt transects and counting all bird
species heard or seen within that transect. The passerine bird surveys were completed twice on
the four major habitat types first on May 2 and again on June 10 of 2010. Surveys were
conducted between hour prior to sunrise and 0 AM. The passerine bird transects covered
- 77 -

Ross ISR Project 12 ER Addendum 3.5-F
Table Ross ISR Project Raptor Production Summary for Nests Located Within One Mile of the Permit Area in 2010
Survey Year
Species Nest No. Legal DescriptionNest Substrate
Condition 2010Ferru inous a kFH-1a SENE Sec. 12 Hilltop A-T
T N R W Good
FH-1b SWNW Sec. Hilltop ALTT N R W Poor
FH-1c NESW Sec. 10 Power pole D-NT N R W D-N
FH-2a NWNW Sec. 12 Hilltop IT N R W Good
FH-2b SWNW Sec. 12 Hilltop ALTT N R W Poor
FH-2c SWNW Sec. 12 Hilltop ALTT N R W Good
________TOTAL intact nests 1 0 0
RTH-1T - e -taile a k
SENW Sec. 2 Cottonwood A 0 0T N R W Good
RTH-2 NESE Sec. 1 Cottonwood A 2 2T N R W Good
________TOTAL 2 intact nests 2 2 2
SH-1S - S ainson s a k
SWNE Sec. 1 Boxelder Maple IT N R W Good
________TOTAL 1 intact nest 0 0 0
________Total estin Success 8 total intact nests 3 2 2
- 78 -

Ross ISR Project 13 ER Addendum 3.5-F
Table Ross ISR Project Raptor Production Summary (Continued).
Legend
A 2 2 - Active two young hatched two fledgedD-N - Nest destroyed by natural causesA - Active undetermined undetermined
I - InactiveALT - Alternate nest site for same pair
- 79 -

Ross ISR Project 14 ER Addendum 3.5-F
during the 2010 surveys are shown on ER Figure . - and included the upland grassland
sagebrush shrubland pastureland and reservoir stockpond wetland habitat types. All such
species observed during the course of other field work or by other sources are also documented
with an asterisk on the species list in Addendum . -G. The permit area and adjacent lands have
the potential habitats to support a good diversity of passerine species. The most common species
observed on the permit area overall were the western meadowlark red-winged blackbird horned
lark killdeer grasshopper sparrow Brewers sparrow and brown-headed cowbird. A detailed list
of all bird species recorded during the passerine surveys is shown in Table . In the upland
grassland type the western meadowlark was the most common species followed by the horned
lark killdeer and grasshopper sparrow. The western meadowlark was the most common bird
species in the sagebrush shrubland followed by the killdeer Brewer’s sparrow and brown-headed
cowbird. In the pastureland the western meadowlark was also the most common species
observed followed by the grasshopper sparrow rough-winged swallow red-winged blackbird
and eastern kingbird. The red-winged blackbird was the most common species in the
reservoir stockpond wetland habitat type followed by the American coot western meadowlark
American widgeon brown-headed cowbird and rough-winged swallow.
. Other Mammals
Specific surveys for other mammals (i.e. small mammal trapping lagomorph surveys
and predator surveys) were not conducted in 2010. All mammal species or their sign observed
during the course of other field work were recorded and are documented with an asterisk on the
species list in Addendum . -G. Other mammal species recorded by the WG FD for the study
area are also included. A total of 2 mammal species other than big game have been
documented on or within several miles of the permit area. The permit area and one mile
- 80 -

Ross ISR Project 15 ER Addendum 3.5-F
Table Bird Species Observed During Passerine Bird Belt Transect Surveys Completed on the Ross ISR Project Permit Area 2010.
Habitat Type Survey Period
PasturelandSagebrush Shrubland
Reservoir Stockpond Wetland
Upland Grassland
Species May June May June May June May June
Western Meadowlark 1 1 11 1 2 10Red-winged Blackbird 0 2 0 11 1 0 0Horned Lark 0 0 0 0 0 0Killdeer 0 0 2 1 2 0Grasshopper Sparrow 1 0 0 0 0 0 2Brewer’s Sparrow 1 0 0 0 0 0Brown-headed Cowbird 0 2 2 0 0 0Rough-winged swallow 0 0 0 0 0 0American Coot 0 0 0 0 2 0 0Cliff Swallow 0 0 0 0 2 0 0Canada Goose 0 0 0 2 0 0 0Mallard 2 0 0 0 2 0 0 0American Widgeon 0 0 0 0 0 0 0Gadwall 0 0 0 0 1 0 0Vesper Sparrow 1 0 1 0 0 0 1 0Eastern Kingbird 2 1 0 0 0 0 0 0Mourning Dove 0 0 1 0 1 0 0 1Say’s Phoebe 0 0 2 0 0 0 0 0Tree Swallow 0 0 0 0 2 0 0 0Cliff Swallow 0 0 0 0 2 0 0 0Great Blue Heron 0 0 0 0 1 1 0 0Spotted Sandpiper 0 0 0 0 1 1 0 0American Robin 0 2 0 0 0 0 0 0European Starling 0 0 1 0 0 0 0 0Pied-billed Grebe 0 0 0 0 1 0 0 0Rock Wren 0 0 0 0 0 1 0 0Blue-wing Teal 0 0 0 0 0 1 0 0
- 81 -

Ross ISR Project 16 ER Addendum 3.5-F
perimeter were searched for prairie dog towns but no prairie dog towns were observed.
However a black-tailed prairie dog town is known to exist over two miles northeast of the
permit area.
The white-tailed jackrabbit and cottontail rabbit were the most common mammal species
observed. The coyote red fox raccoon striped skunk and bobcat were the mammalian predators
observed in 2010.
All site visits included surveys for the swift fox. These swift fox surveys were generally
conducted during early morning and evening hours when this species is active. Daylight surveys
included the investigation of potential den sites. Night surveys were conducted in conjunction
with other night time wildlife surveys. No swift fox were recorded on the area during the 200 -
2010 wildlife surveys and no records of prior swift fox observations in the area were found.
. Migratory Birds of High Federal Interest (MBHFI)
Field surveys were completed in November and December of 200 and January through
September of 2010 for MBHFI species. This was accomplished by searching all suitable or
potentially suitable habitats and recording any species encountered. Breeding bird surveys were
also conducted as discussed in Section . of this report. Discussions here will concentrate on
level 1 species based on the USFWS list of May 2 2002. These species are listed in Table .
Level 1 MBHFI species observed on the study area in 200 -2010 include the sage-
grouse ferruginous hawk Brewer’s sparrow Wilson’s phalarope Swainson s hawk short-eared
owl bald eagle and upland sandpiper. The trumpeter swan was observed on the area during the
mid 1 0’s but not in 200 or 2010.
- 82 -

Ross ISR Project 17 ER Addendum 3.5-F
Table Level I Species Migratory Birds of High Federal Interest (MBHFI) (USFWS 2002)
RegionalRecorded on Study Area Expected
Species Primary Habitat Type(s) Status 200 2010 Occurrence
Mountain Plover Shortgrass Prairie Shrub-steppe Breeder No RareTrumpeter Swan Wetlands Migrant No RareSage-grouse Shrub-steppe Breeder Yes CommonMcCown s Longspur Shortgrass Prairie Shrub-steppe Breeder No UncommonBaird s Sparrow Shortgrass Prairie Breeder No RareFerruginous Hawk Shrub-steppe Shortgrass Prairie Breeder Yes CommonBrewer s Sparrow Shrub-steppe Mountain-foothills Breeder Yes CommonWilson’s Phalarope Wetlands Breeder Yes UncommonFranklin’s Gull Wetlands Migrant No RareSage Sparrow Mountain-foothills Shrub Steppe Breeder No RareSwainson s Hawk Plains Basin Riparian Breeder Yes CommonLong-billed Curlew Shortgrass Prairie Migrant
Breeder No Uncommon Short-eared Owl Short grass Prairie Breeder Yes UncommonNorthern Goshawk High Mid Elevation Conifer and Aspen Migrant No RarePeregrine Falcon Cliffs Migrant No RareBurrowing Owl Shortgrass Prairie Breeder No UncommonForster’s Tern Wetlands Migrant No RareBald Eagle Montane and Basin Riparian Plains Winter
Migrant Yes OccasionalUpland Sandpiper Shortgrass Prairie Breeder Yes UncommonBlack Tern Wetlands Migrant No RareWhooping Crane Wetlands Migrant No RarePiping Plover Wetlands Aquatic Migrant No Rare
Habitat types based on USFWS 2002 List.This species was recorded in the area in the past by the WG FD.
- 83 -

Ross ISR Project 18 ER Addendum 3.5-F
The mountain plover is a MBHFI species that has not been recorded in the study area.
Suitable habitat for the mountain plover is very limited on the study area due to good vegetation
cover and this species was not observed in 200 -2010. The sage-grouse ferruginous hawk
Brewer’s sparrow and Swainson’s hawk were observed as breeders in suitable habitats on the
study area in 2010. The short-eared owl bald eagle and upland sandpiper were only observed as
migrants or transients during 2010. The trumpeter swan was observed in the past by the
WG FD on or near the Oshoto Reservoir
. BLM Sensitive Species
In 2010 the BLM provided direction to their list of sensitive wildlife species for the
Newcastle Field Office in whose jurisdiction the project is located. Only about 0 acres of
surface controlled by the BLM located in the NWSE of Section 1 T N R W is found
within the permit area. Surveys for BLM sensitive species were conducted in conjunction with
all other wildlife surveys completed on the area.
The 0 acres of BLM surface within the permit area is all upland grassland habitat with
the exception of disturbed lands composed of an oil well located in the center of this parcel. No
BLM sensitive species were recorded on this 0 acre tract during the 200 -2010 surveys and no
sensitive species have previously been recorded on this site.
Table provides the list of BLM sensitive wildlife species for the area covered by the
Newcastle Field Office. As shown on this list the ferruginous hawk sage-grouse sage thrasher
loggerhead shrike Brewer’s sparrow and northern leopard frog were recorded on the study area
(but not BLM surface) during the 200 -2010 surveys. The ferruginous hawk was discussed in
Section . the sage-grouse was presented in Section .2 and the northern
- 84 -
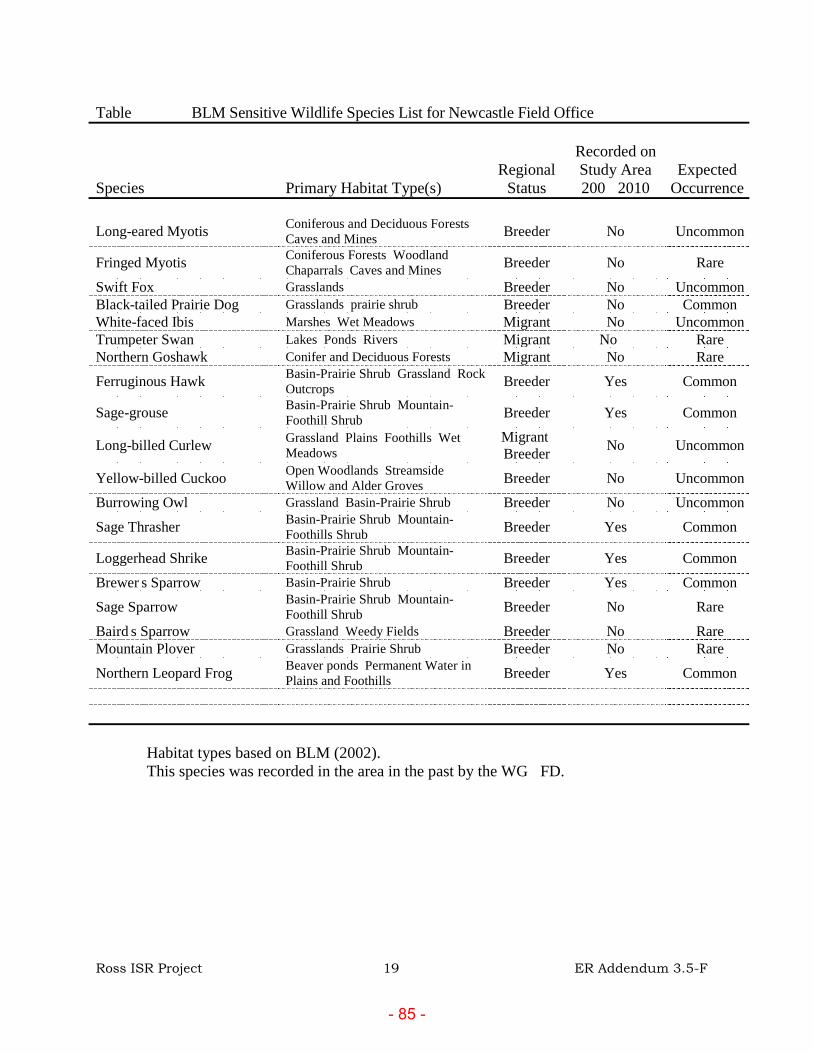
Ross ISR Project 19 ER Addendum 3.5-F
Table BLM Sensitive Wildlife Species List for Newcastle Field Office
RegionalRecorded on Study Area Expected
Species Primary Habitat Type(s) Status 200 2010 Occurrence
Long-eared Myotis Coniferous and Deciduous Forests Caves and Mines Breeder No Uncommon
Fringed Myotis Coniferous Forests Woodland Chaparrals Caves and Mines Breeder No Rare
Swift Fox Grasslands Breeder No UncommonBlack-tailed Prairie Dog Grasslands prairie shrub Breeder No CommonWhite-faced Ibis Marshes Wet Meadows Migrant No UncommonTrumpeter Swan Lakes Ponds Rivers Migrant No RareNorthern Goshawk Conifer and Deciduous Forests Migrant No RareFerruginous Hawk Basin-Prairie Shrub Grassland Rock
Outcrops Breeder Yes Common
Sage-grouse Basin-Prairie Shrub Mountain-Foothill Shrub Breeder Yes Common
Long-billed Curlew Grassland Plains Foothills Wet Meadows
MigrantBreeder No Uncommon
Yellow-billed Cuckoo Open Woodlands Streamside Willow and Alder Groves Breeder No Uncommon
Burrowing Owl Grassland Basin-Prairie Shrub Breeder No UncommonSage Thrasher Basin-Prairie Shrub Mountain-
Foothills Shrub Breeder Yes Common
Loggerhead Shrike Basin-Prairie Shrub Mountain-Foothill Shrub Breeder Yes Common
Brewer s Sparrow Basin-Prairie Shrub Breeder Yes CommonSage Sparrow Basin-Prairie Shrub Mountain-
Foothill Shrub Breeder No RareBaird s Sparrow Grassland Weedy Fields Breeder No RareMountain Plover Grasslands Prairie Shrub Breeder No RareNorthern Leopard Frog Beaver ponds Permanent Water in
Plains and Foothills Breeder Yes Common
Habitat types based on BLM (2002).This species was recorded in the area in the past by the WG FD.
- 85 -

Ross ISR Project 20 ER Addendum 3.5-F
leopard frog is discussed in Section .10 of this report. The sage thrasher loggerhead shrike and
Brewer’s sparrow were recorded as seasonal breeders primarily in the sagebrush shrubland
habitat type.
. Threatened or Endangered Species (T E) and Candidate Species
T E species and other wildlife species surveys were conducted during November and
December of 200 and January through September of 2010. One former T E (bald eagle) and
one candidate (sage-grouse) wildlife species were observed during those surveys. As of July
2010 the USFWS has listed two individual wildlife species and one individual plant species for
Crook County Wyoming. The wildlife species listed are the sage-grouse (Candidate) and
mountain plover (Proposed). The plant species listed is the threatened Ute Ladies’-tresses
(Spiranthes diluvialis).
The bald eagle (a former T E species) was observed on the study area during December
200 and during January of 2010. This species was removed from the T E list in July of 200
but is still discussed in this section for informative purposes. Potential nesting and roosting
habitat (large trees) is present but very limited on the study area. Bald eagle roosts or
concentration areas were not observed during the 200 (December) or 2010 (January) roost
surveys. The bald eagle appears to be a transient on the site for foraging in the winter or during
migration.
Prairie dog towns provide habitat for black-footed ferrets. No prairie dog towns were
observed on the study area or within one mile as presented in Section . . Black-footed ferret
surveys are currently not required for black-tailed prairie dog towns statewide (USFWS 200 ).
The sage-grouse was listed as a candidate species in 2010. Two leks have been recorded
within several miles of the permit area. The sage-grouse was observed infrequently on the study
- 86 -
Ross ISR Project 21 ER Addendum 3.5-F
area but was not recorded within the permit area. More discussion on this species was presented
previously in the upland game bird Section .2 of this report. The permit area is not located
within a designated sage-grouse core area.
The mountain plover is an MBHFI species that is currently listed as a proposed species.
This bird has not been recorded during wildlife surveys completed on this area as discussed in
Section . and the permit area does not contain optimal habitat for this species.
No T E plant species were recorded on the permit area during the 2010 surveys. The
T E plant species surveys conducted on the permit area are discussed in Addendum . -A.
.10 Reptiles and Amphibians
Specific surveys for reptiles and amphibians were conducted for this project. Two frog
species were recorded during vocalization surveys and during other field surveys. These frog
species included the leopard frog and the chorus frog. During vocalization surveys completed in
May and June of 2010 at the six sites (F1-F ) shown on ER Figure . - the leopard frog
appeared to be uncommon while the chorus frog appeared to be common and abundant. No egg
masses were definitively identified during the egg mass surveys completed in early June of 2010.
The reason may have been that recent high winds could have broken up the masses and dispersed
the eggs. During walking surveys along shorelines and riparian areas in August of 2010 the
leopard frog appeared to be quite common (over 00 individual adults counted) while the chorus
frog was uncommon. A listing of potentially occurring reptile and amphibian species and
observations from the 200 -2010 surveys or from other sources are documented in Addendum
. -G.
- 87 -

Ross ISR Project 22 ER Addendum 3.5-F
.11 Fish
Specific collections of fish were conducted for this project as a component of the
radiological study. Part of the radiological surveys included analyzing fish species caught in the
Oshoto Reservoir for radiation levels. During this survey several fish species were caught. This
survey was conducted under a Chapter Permit from the WG FD issued to WWC
Engineering. Fish species encountered during this survey included green sunfish black bullhead
and white sucker. The black bullhead was by far the most common fish species collected.
Numerous schools of black bullhead fry were observed during the shoreline surveys conducted
in August of 2010. Waterbodies within the permit area are not considered as viable sport
fisheries.
6.0 acts
The major contiguous block disturbance within the permit area will be the construction
and operation of the plant and associated facilities. This disturbance will occur on haylands so
native habitats will not be affected. The other disturbances will consist of well fields roads and
pipelines. These disturbances will affect primarily upland grassland and sagebrush shrubland
habitats. Many of these disturbances will be temporary and short-term since they may be
reclaimed immediately following installation.
Crucial or critical wildlife habitats have not been documented on the permit or adjacent
areas so will not be affected. A few big game animals may be displaced during mining activities
but based on the limited disturbance and animal densities these numbers would be insignificant.
Habitat for waterfowl and shorebirds is limited to the Deadman Creek Little Missouri
River Oshoto Reservoir and several ponds within the permit area. These habitats will not be
- 88 -
Ross ISR Project 23 ER Addendum 3.5-F
disturbed by mining so habitat for waterfowl shorebirds fish amphibians and other species with
an affinity for water or wetlands should not be affected.
Impacts to sage-grouse should be minimal if at all. The reason low impacts are expected
is this species does not frequent the area and the site does not contain an abundance of suitable
sagebrush shrubland habitat. Suitable habitat is present east of the permit area but there is the
potential for this species to be transient on the project site.
Raptor species may be affected by mining activities or by altered prey abundance due to
removal of vegetation and soils. Raptor nest sites could be impacted by the location of the well
fields or facilities. A total of about eight currently known intact nest sites exist within the permit
area. Raptor nest impacts will be mitigated through avoiding activities in these areas during the
breeding season or moving nests when impacts are unavoidable.
Other bird mammal reptile or amphibian species may be displaced from areas where
vegetation and soils are removed. Displacement or impacts could also occur from increased
human activity in the area.
Currently several MBHFI raptor species may be impacted by this operation. The
ferruginous hawk and Swainson s hawk have intact nest sites on or adjacent to the permit area
but were not productive within the permit area during 2010. Other MBHFI species which
probably nest in suitable habitats on the permit area include the Brewer s sparrow and short-
eared owl. There is also the potential for the sage-grouse McCown’s longspur Wilson’s
phalarope burrowing owl upland sandpiper and long-billed curlew to nest on the site. Even if
they do not nest on the permit area these species may be impacted as transients. Mountain
plovers have not been recorded in the area and only a minor amount of sparsely vegetated habitat
- 89 -
Ross ISR Project 24 ER Addendum 3.5-F
is present in the permit area so this species should not be affected. Due to the small size of this
project all impacts to MBHFI species would be minor and should not affect overall populations.
BLM sensitive species should not be affected by disturbances on the 0 acres of BLM
surface within the permit area. This is because these species either do not have habitat within
that 0 acre parcel or have not been found there. Potential impacts to BLM sensitive species are
discussed in general terms within the other paragraphs of this section.
T E or other species of concern should not be greatly impacted by this operation. The
bald eagle (a former T E species) is only a winter transient and migrant through the area and
should not be adversely affected by this project. There were no active or historic prairie dog
towns existing on or within one mile of the permit area so potential habitat for black-footed
ferrets is not present. The mountain plover (Proposed species) has not been recorded on the area.
The sage-grouse (Candidate species) has not been recorded on the permit area and does not
appear to frequent the area. The Ute ladies’-tresses orchid was not recorded along any of the
wetland portions of the permit area.
7.0 iti ation an onitorin
Impacted wildlife habitats will be mitigated following disturbance by establishing
vegetation in accordance with the approved seeding and reclamation plan. Fences if needed
will be constructed to the required WG FD standards. Raptor nests will be protected or
relocated. New powerlines will be constructed in accordance with the Avian Power Line
Interaction Committee (APLIC) 200 Suggested Practices for Avian Protection on Power
Lines The state of the Art in 200 . All ponds with toxic water will be covered or otherwise
protected to prevent wildlife use. Controlled speed limits will be implemented to reduce
wildlife vehicle collisions. Employees will be educated about wildlife protection sensitive
- 90 -
Ross ISR Project 25 ER Addendum 3.5-F
species and game laws through use of applicable publications and during safety meetings. The
implementation of all of the above commitments will help alleviate impacts to wildlife.
Wildlife monitoring may be completed for game birds raptors T E MBHFI and
proposed or candidate species as required by the USFWS and or WG FD.
8.0 onclusion
This report provides wildlife baseline data for the Strata Ross ISR Project Permit area.
Investigated were big game game birds raptors migratory birds of high federal interest BLM
sensitive species threatened or endangered species proposed or candidate species reptiles and
amphibians and fish. One proposed species the mountain plover one candidate species the
sage-grouse and two threatened or endangered species the black-footed ferret and Ute ladies’-
tresses orchid have habitat within the region locally or seasonally. However the permit area
itself only contains preferred habitat for the Ute ladies-tresses orchid. The bald eagle (a former
T E species) has been observed on site but is only a transient or migrant to the area. The Ute
ladies’-tresses orchid was not observed in 2010 on the permit area. The sage-grouse has been
observed infrequently within two miles of the permit area and the mountain plover has not been
recorded on the area. The limited amount of disturbance projected by this mining operation will
have minimal impacts on most wildlife species. No crucial big game winter ranges or critical
endangered species habitats will be affected. Wildlife monitoring will be implemented as
required but is not projected at this time.
- 91 -
Ross ISR Project 26 ER Addendum 3.5-F
9.0 e erences
Baxter G.T. and M.D. Stone 1 0. Amphibians and Reptiles of Wyoming. Wyoming Game and Fish Department. 1 pp.
Baxter G.T. and M.D. Stone 1 . Fishes of Wyoming. Wyoming Game and Fish Department. 2 0 pp.
Clark T.W. and M.R. Stromberg 1 . Mammals in Wyoming. Museum of Natural History University of Kansas. 1 pp.
University of Michigan School of Natural Resources. 200 -2010. Endangered Species Update.
USDI-Bureau of Land Management 2010. Personal Communication and Unpublished Data.
USDI-U.S. Fish and Wildlife Service. 2002. Migratory Bird Species of Management Concern in Wyoming.
USDI-U.S. Fish and Wildlife Service. 200 . Black-footed Ferret Block Clearance Memorandum.
USDI-U.S. Fish and Wildlife Service. 2010. Endangered and Threatened Wildlife Species.
Wyoming Game and Fish Department 200 . Atlas of Birds Mammals Reptiles and Amphibians in Wyoming. Wyoming Game and Fish Department. 1 0 pp.
Wyoming Game and Fish Department 200 . 200 Annual Big Game Herd Unit Reports. Wyoming Game and Fish Department.
Wyoming Game and Fish Department 200 -2010. Personal Communication and Unpublished Data.
- 92 -
ADDENDUM 3.5-G
WILDLIFE SPECIES LIST
- 93 -
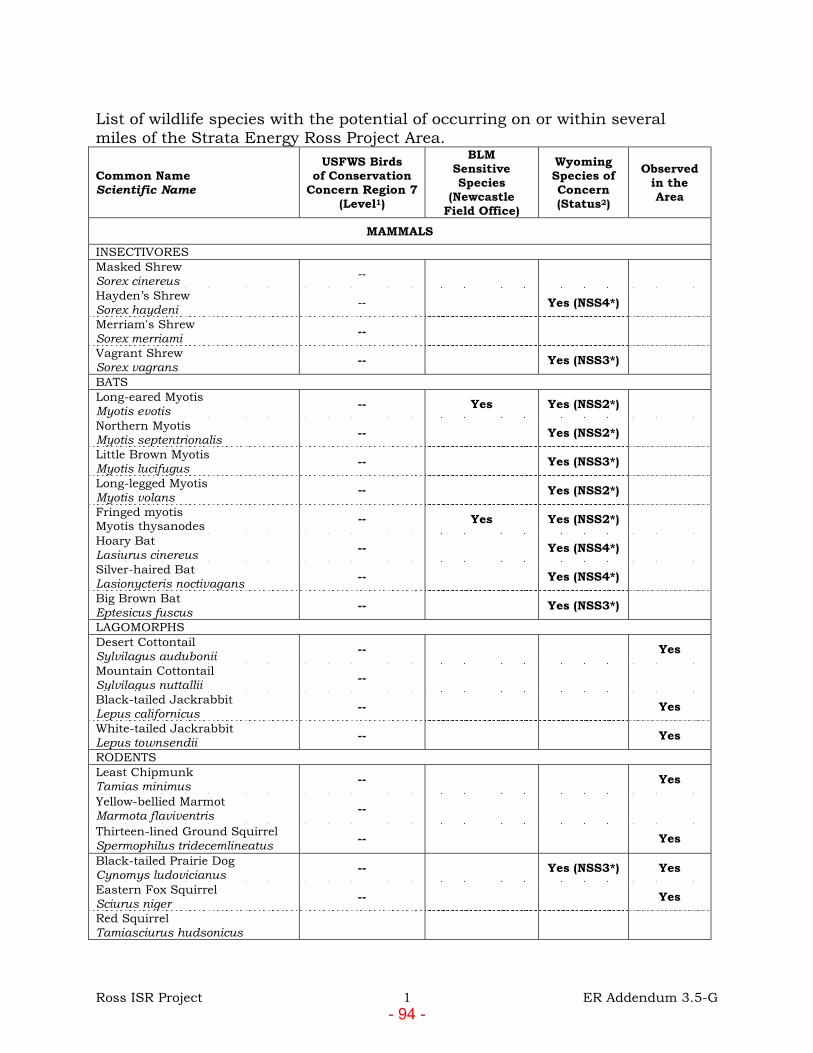
Ross ISR Project 1 ER Addendum 3.5-G
List of wildlife species with the potential of occurring on or within several miles of the Strata Energy Ross Project Area.
Common Name Scientific Name
USFWS Birds of Conservation
Concern Region 7 (Level1)
BLM Sensitive Species
(Newcastle Field Office)
Wyoming Species of Concern (Status2)
Observed in the Area
MAMMALS INSECTIVORES Masked ShrewSorex cinereus --
Hayden’s Shrew Sorex haydeni -- Yes (NSS4*)
Merriam's Shrew Sorex merriami --
Vagrant Shrew Sorex vagrans -- Yes (NSS3*)
BATS Long-eared Myotis Myotis evotis -- Yes Yes (NSS2*)
Northern Myotis Myotis septentrionalis -- Yes (NSS2*)
Little Brown Myotis Myotis lucifugus -- Yes (NSS3*)
Long-legged Myotis Myotis volans -- Yes (NSS2*)
Fringed myotis Myotis thysanodes -- Yes Yes (NSS2*)
Hoary Bat Lasiurus cinereus -- Yes (NSS4*)
Silver-haired Bat Lasionycteris noctivagans -- Yes (NSS4*)
Big Brown Bat Eptesicus fuscus -- Yes (NSS3*)
LAGOMORPHS Desert Cottontail Sylvilagus audubonii -- Yes
Mountain Cottontail Sylvilagus nuttallii --
Black-tailed Jackrabbit Lepus californicus -- Yes
White-tailed Jackrabbit Lepus townsendii -- Yes
RODENTS Least Chipmunk Tamias minimus -- Yes
Yellow-bellied Marmot Marmota flaviventris --
Thirteen-lined Ground Squirrel Spermophilus tridecemlineatus -- Yes
Black-tailed Prairie Dog Cynomys ludovicianus -- Yes (NSS3*) Yes
Eastern Fox Squirrel Sciurus niger -- Yes
Red Squirrel Tamiasciurus hudsonicus
- 94 -

Ross ISR Project 2 ER Addendum 3.5-G
List of wildlife species with the potential of occurring on or within several miles of the Strata Energy Ross Project Area.
Common Name Scientific Name
USFWS Birds of Conservation
Concern Region 7 (Level1)
BLM Sensitive Species
(Newcastle Field Office)
Wyoming Species of Concern (Status2)
Observed in the Area
Northern Pocket Gopher Thomomys talpoides -- Yes
Plains Pocket Gopher Geomys bursarius -- Yes (NSS4*)
Olive-backed Pocket Mouse Perognathus fasciatus -- Yes (NSS3*)
Silky Pocket Mouse Perognathus flavus -- Yes (NSS3*)
Hispid Pocket Mouse Chaetodipus hispidus --
Ord's Kangaroo Rat Dipodomys ordii -- Yes
Beaver Castor Canadensis -- Yes
Western Harvest Mouse Reithrodontomys megalotis -- Yes (NSS3*)
Plains Harvest Mouse Reithrodontomysmontanus --
White-footed Mouse Peromyscus leucopus
Deer Mouse Peromyscus maniculatus -- Yes
Northern Grasshopper Mouse Onychomys leucogaster --
Bushy-tailed Woodrat Neotoma cinerea -- Yes
Long-tailed Vole Microtus longicaudus --
Prairie Vole Microtus 0ochrogaster -- Yes (NSS3*) Yes
Meadow Vole Microtus pennsylvanicus --
Sagebrush Vole Lemmiscus curtatus -- Yes (NSS4*)
Muskrat Ondatra zibethicus -- Yes
Norway Rat Rattus norvegicus --
House Mouse Mus musculus --
Meadow Jumping Mouse Zapus hudsonius --
Western Jumping Mouse Zapus princeps --
Porcupine Erethizon dorsatum -- Yes
- 95 -
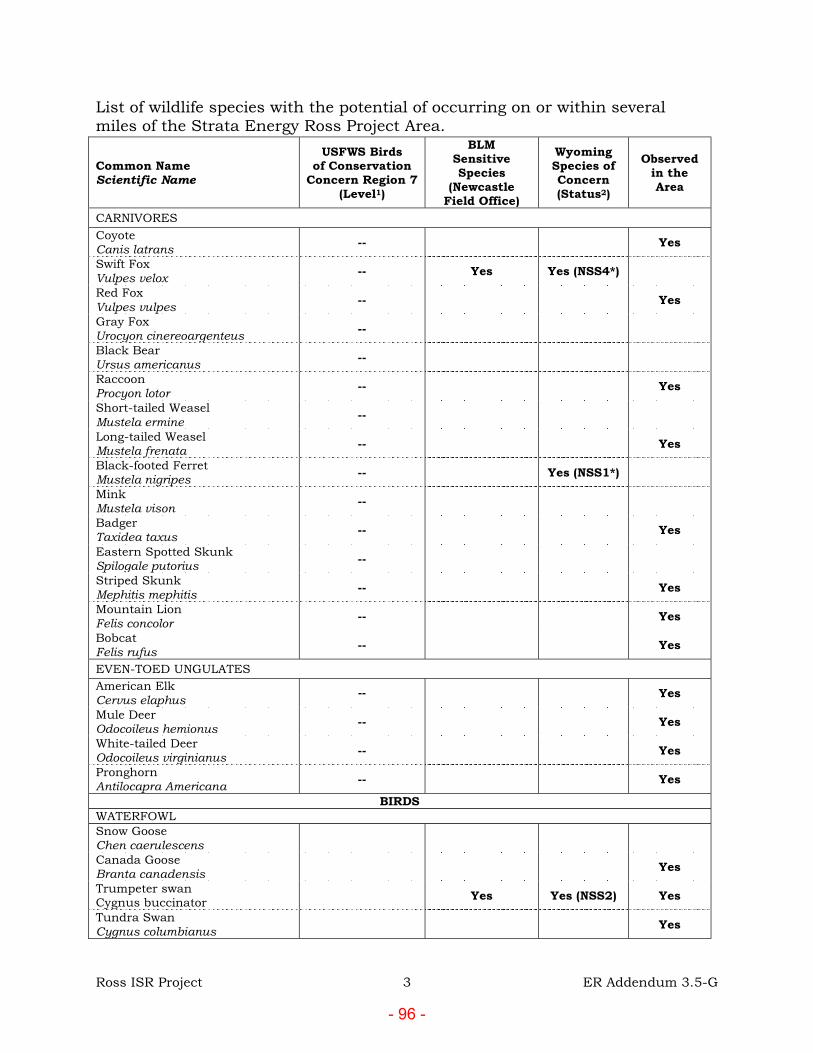
Ross ISR Project 3 ER Addendum 3.5-G
List of wildlife species with the potential of occurring on or within several miles of the Strata Energy Ross Project Area.
Common Name Scientific Name
USFWS Birds of Conservation
Concern Region 7 (Level1)
BLM Sensitive Species
(Newcastle Field Office)
Wyoming Species of Concern (Status2)
Observed in the Area
CARNIVORES Coyote Canis latrans -- Yes
Swift Fox Vulpes velox -- Yes Yes (NSS4*)
Red Fox Vulpes vulpes -- Yes
Gray Fox Urocyon cinereoargenteus --
Black Bear Ursus americanus --
Raccoon Procyon lotor -- Yes
Short-tailed Weasel Mustela ermine --
Long-tailed Weasel Mustela frenata -- Yes
Black-footed Ferret Mustela nigripes -- Yes (NSS1*)
Mink Mustela vison --
Badger Taxidea taxus -- Yes
Eastern Spotted Skunk Spilogale putorius --
Striped Skunk Mephitis mephitis -- Yes
Mountain Lion Felis concolor -- Yes
Bobcat Felis rufus -- Yes
EVEN-TOED UNGULATES American Elk Cervus elaphus -- Yes
Mule Deer Odocoileus hemionus -- Yes
White-tailed Deer Odocoileus virginianus -- Yes
Pronghorn Antilocapra Americana -- Yes
BIRDS WATERFOWL Snow Goose Chen caerulescens
Canada Goose Branta canadensis Yes
Trumpeter swan Cygnus buccinator Yes Yes (NSS2) Yes
Tundra Swan Cygnus columbianus Yes
- 96 -

Ross ISR Project 4 ER Addendum 3.5-G
List of wildlife species with the potential of occurring on or within several miles of the Strata Energy Ross Project Area.
Common Name Scientific Name
USFWS Birds of Conservation
Concern Region 7 (Level1)
BLM Sensitive Species
(Newcastle Field Office)
Wyoming Species of Concern (Status2)
Observed in the Area
Wood Duck Aix sponsa
Gadwall Anas strepera Yes
American Wigeon Anas americana Yes
Mallard Anas platyrhynchos Yes
Blue-winged Teal Anas discors Yes
Green-winged Teal Anas crecca Yes
Cinnamon Teal Anas cyanoptera Yes
Northern Shoveler Anas clypeata Yes
Northern Pintail Anas acuta Yes (NSS3) Yes
Canvasback Aythya valisineria Yes (NSS3) Yes
Redhead Aythya americana Yes (NSS3) Yes
Ring-necked Duck Aythya collaris Yes
Lesser Scaup Aythya affinis Yes (NSS3) Yes
Bufflehead Bucephala albeola Yes
Common Goldeneye Bucephala clangula
Common Merganser Mergus merganser
Ruddy Duck Oxyura jamaicensis Yes
GREBES Pied-billed Grebe Podilymbus podiceps Yes
Horned Grebe Podiceps auritus Yes (NL) Yes
Eared Grebe Podiceps nigricollis Yes
Western Grebe Aechmophorus occidentalis Yes (NSS4)
PELICANS White Pelican Pelecanus erythrorhynchos Yes (NSS3) Yes
Double-crested Cormorant Phalacrocorax auritus Yes
- 97 -

Ross ISR Project 5 ER Addendum 3.5-G
List of wildlife species with the potential of occurring on or within several miles of the Strata Energy Ross Project Area.
Common Name Scientific Name
USFWS Birds of Conservation
Concern Region 7 (Level1)
BLM Sensitive Species
(Newcastle Field Office)
Wyoming Species of Concern (Status2)
Observed in the Area
HERONS American Bittern (Botauosus lentiginosus) Yes (I) Yes (NSS3)
Great Blue Heron Ardea Herodias Yes (NSS4) Yes
Green Heron Butorides striatus
Black-crowned Night-Heron Nycticorax nycticorax Yes (NSS3)
White-faced Ibis Plegadis chihi Yes Yes (NSS3)
VULTURES, HAWKS, AND FALCONS Turkey Vulture Cathartes aura Yes
Osprey Pandion haliaetus Yes
Bald Eagle Haliaeetus leucocephalus Yes (I) Yes (NSS2) Yes
Northern Harrier Circus cyaneus Yes
Sharp-shinned Hawk Accipiter striatus Yes
Cooper's Hawk Accipiter cooperii Yes
Northern Goshawk Accipiter gentilis Yes Yes (NSS4*)
Swainson's Hawk Buteo swainsoni Yes (NSS4) Yes
Red-tailed Hawk Buteo jamaicensis Yes
Ferruginous Hawk Buteo regalis Yes (I) Yes Yes (NSS3*) Yes
Rough-legged Hawk Buteo lagopus Yes
Golden Eagle Aquila chrysaetos Yes (III) Yes
American Kestrel Falco sparverius Yes
Merlin Falco columbarius Yes (NSS3*)
Gyrfalcon Falco rusticolus
Peregrine Falcon Falco peregrinus Yes (I) Yes (NSS3*)
Prairie Falcon Falco mexicanus Yes (III) Yes
GALLINACEOUS BIRDS Gray Partridge Perdix perdix
Greater Sage-grouse Centrocercus urophasianus Yes Yes (NSS2) Yes
- 98 -

Ross ISR Project 6 ER Addendum 3.5-G
List of wildlife species with the potential of occurring on or within several miles of the Strata Energy Ross Project Area.
Common Name Scientific Name
USFWS Birds of Conservation
Concern Region 7 (Level1)
BLM Sensitive Species
(Newcastle Field Office)
Wyoming Species of Concern (Status2)
Observed in the Area
Sharp-tailed grouse Tympanuchus phasianellus Yes
Turkey Meleagris gallopavo Yes
CRANES AND RAILS Sora Rail Porzana Carolina Yes
American Coot Fulica americana Yes
Sandhill Crane Grus canadensis Yes (NSS3)
SHOREBIRDS Semipalmated Plover Charadrius semipalmatus
Killdeer Charadrius vociferus Yes
Mountain Plover Charadrius montanus Yes (I) Yes Yes (NSS4*)
Black-necked Stilt Himantopus mexicanus
American Avocet Recurvirostra americana Yes
Greater Yellowlegs Tringa melanoleuca
Lesser Yellowlegs Tringa flavipes
Solitary Sandpiper Tringa solitaria
Willet Catoptrophorus semipalmatus
Spotted Sandpiper Actitis macularia Yes
Upland Sandpiper Bartramia longicauda Yes (I) Yes (NSS4) Yes
Whimbrel Numenius phaeopus
Marbled Godwit (Limosa fedoa) Yes (NL)
Long-billed Curlew Numenius americanus Yes (I) Yes Yes (NSS3*)
Semipalmated Sandpiper Calidris pusilla
Western Sandpiper Calidris mauri
Least Sandpiper Calidris minutilla
Baird's Sandpiper Calidris bairdii
Pectoral Sandpiper Calidris melanotos
- 99 -

Ross ISR Project 7 ER Addendum 3.5-G
List of wildlife species with the potential of occurring on or within several miles of the Strata Energy Ross Project Area.
Common Name Scientific Name
USFWS Birds of Conservation
Concern Region 7 (Level1)
BLM Sensitive Species
(Newcastle Field Office)
Wyoming Species of Concern (Status2)
Observed in the Area
Long-billed Dowitcher Limnodromus scolopaceus
Wilson’s Snipe Gallinago delicata Yes
Wilson's Phalarope Phalaropus tricolor Yes
Red-necked Phalarope Phalaropus lobatus
Franklin's Gull Larus pipixcan Yes (NSS3)
Bonaparte’s Gull Larus philladelphia
Ring-billed Gull Larus delawarensis
California Gull Larus californicus Yes
Herring Gull Larus argentatus Yes
Common Tern Sterna hirundo
Forster's Tern Sterna forsteri Yes (NSS3)
Black Tern Chlidonias niger Yes (NSS3) Yes
PIGEONS AND DOVES Rock Pigeon Columba livia Yes
Eurasian Collard-dove Streptopelia decaocto
Mourning Dove Zenaida macroura Yes
CUCKOOS Black-billed Cuckoo Coccyzus erythropthalmus Yes (II)
Yellow-billed Cuckoo Coccyzus americanus Yes (II) Yes Yes (NSS2*)
OWLS Barn Owl Tyto alba
Eastern Screech-Owl Otus asio
Great Horned Owl Bubo virginianus Yes
Burrowing Owl Athene cunicularia Yes (I) Yes Yes (NSS4)
Long-eared Owl Asio otus
Short-eared Owl Asio flammeus Yes (I) Yes (NSS4) Yes
Northern Saw-whet Owl Aegolius acadicus
- 100 -

Ross ISR Project 8 ER Addendum 3.5-G
List of wildlife species with the potential of occurring on or within several miles of the Strata Energy Ross Project Area.
Common Name Scientific Name
USFWS Birds of Conservation
Concern Region 7 (Level1)
BLM Sensitive Species
(Newcastle Field Office)
Wyoming Species of Concern (Status2)
Observed in the Area
GOATSUCKERS Common Nighthawk Chordeiles minor Yes
Common Poorwill Phalaenoptilus nuttallii
SWIFTS Chimney Swift Chaetura pelagica
White-throated Swift Aeronautes saxatalis
HUMMINGBIRDS Broad-tailed Hunningbird Selasphorus platycercus
Rufous Hummingbird Selasphorus rufus
KINGFISHERS Belted Kingfisher Ceryle alcyon Yes
WOODPECKERS Lewis’s Woodpecker Melanerpes lewis Yes (II) Yes (NSS3*)
Red-headed Wooodpecker Melanerpes erythrocephalus
Red-naped Sapsucker Sphyrapicus varius
Downy Woodpecker Picoides pubescens
Hairy Woodpecker Picoides villosus Yes
Northern Flicker Colaptes auratus Yes
FLYCATCHERS Western Wood-Pewee Contopus sordidulus Yes
Willow Flycatcher Empidonax traillii Yes (II) Yes (NSS3)
Least Flycatcher Empidonax minimus
Cordilleran Flycatcher Empidonax occidentalis
Say's Phoebe Sayornis saya Yes
Cassin’s Kingbird Tyrannus vociferous
Western Kingbird Tyrannus verticalis Yes
Eastern Kingbird Tyrannus tyrannus Yes
LARKS Horned Lark Eremophila alpestris Yes
- 101 -
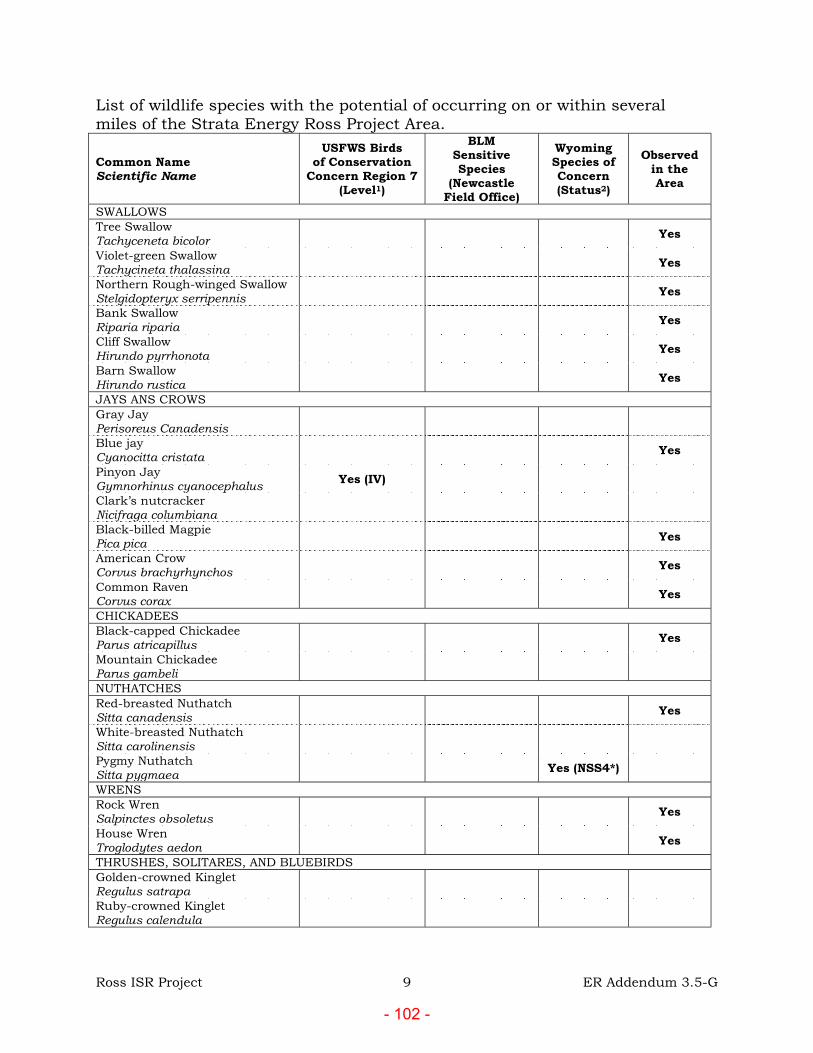
Ross ISR Project 9 ER Addendum 3.5-G
List of wildlife species with the potential of occurring on or within several miles of the Strata Energy Ross Project Area.
Common Name Scientific Name
USFWS Birds of Conservation
Concern Region 7 (Level1)
BLM Sensitive Species
(Newcastle Field Office)
Wyoming Species of Concern (Status2)
Observed in the Area
SWALLOWS Tree Swallow Tachyceneta bicolor Yes
Violet-green Swallow Tachycineta thalassina Yes
Northern Rough-winged Swallow Stelgidopteryx serripennis Yes
Bank Swallow Riparia riparia Yes
Cliff Swallow Hirundo pyrrhonota Yes
Barn Swallow Hirundo rustica Yes
JAYS ANS CROWS Gray Jay Perisoreus Canadensis
Blue jay Cyanocitta cristata Yes
Pinyon Jay Gymnorhinus cyanocephalus Yes (IV)
Clark’s nutcracker Nicifraga columbiana
Black-billed Magpie Pica pica Yes
American Crow Corvus brachyrhynchos Yes
Common Raven Corvus corax Yes
CHICKADEES Black-capped Chickadee Parus atricapillus Yes
Mountain Chickadee Parus gambeli
NUTHATCHES Red-breasted Nuthatch Sitta canadensis Yes
White-breasted Nuthatch Sitta carolinensis
Pygmy Nuthatch Sitta pygmaea Yes (NSS4*)
WRENS Rock Wren Salpinctes obsoletus Yes
House Wren Troglodytes aedon Yes
THRUSHES, SOLITARES, AND BLUEBIRDS Golden-crowned Kinglet Regulus satrapa
Ruby-crowned Kinglet Regulus calendula
- 102 -

Ross ISR Project 10 ER Addendum 3.5-G
List of wildlife species with the potential of occurring on or within several miles of the Strata Energy Ross Project Area.
Common Name Scientific Name
USFWS Birds of Conservation
Concern Region 7 (Level1)
BLM Sensitive Species
(Newcastle Field Office)
Wyoming Species of Concern (Status2)
Observed in the Area
Mountain Bluebird Sialia currucoides Yes
Townsend's Solitaire Myadestes townsendii
Veery Cartharus fuscens
Swainson's Thrush Catharus ustulatus
Hermit Thrush Catharus gattatus
American Robin Turdus migratorius Yes
MOCKINGBIRDS AND THRASHERS Gray Catbird Dumetalla carolinensis
Northern Mockingbird Mimus polyglottos
Sage Thrasher Oreoscoptes montanus Yes (II) Yes Yes (NSS4*) Yes
Brown Thrasher Toxostoma rufum Yes
STARLINGS European Starling Sturnus vulgaris Yes
PIPITS AND WAGTAILS American Pipit Anthus rubescens
WAXWINGS Bohemian Waxwing Bombycilla garrulus
Cedar Waxwing Bombycilla cedrorum
SHRIKES Northern Shrike Lanius excubitor
Loggerhead Shrike Lanius ludovicianus Yes (II) Yes Yes
VIREOS Solitary Vireo Vireo solitarius
Warbling Vireo Vireo gilvus
Red-eyed Vireo Vireo olivaceus
WARBLERS Orange-crowned Warbler Vermivora celata Yes
Yellow Warbler Dendroica petechia Yes
Chestnut-sided Warbler Dendroica pensylvanica
- 103 -

Ross ISR Project 11 ER Addendum 3.5-G
List of wildlife species with the potential of occurring on or within several miles of the Strata Energy Ross Project Area.
Common Name Scientific Name
USFWS Birds of Conservation
Concern Region 7 (Level1)
BLM Sensitive Species
(Newcastle Field Office)
Wyoming Species of Concern (Status2)
Observed in the Area
Yellow-rumped Warbler Dendroica coronata Yes
Townsend’s Warbler Dendroica townsendi
Black-and-white Warbler Mniotilta varia
American Redstart Setophaga ruticilla
Northern Waterthrush Seiurus noveboracensis
MacGillivray's Warbler Oporornis tolmiei
Common Yellowthroat Geothlypis trichas Yes
Wilson's Warbler Wilsonia pusilla Yes
Yellow-breasted Chat Icteria virens
TANAGERS Western Tanager Piranga ludoviciana
GROSBEAKS AND BUNTINGS Rose-breasted Grosbeak Pheucticus ludovicianus
Black-headed Grosbeak Pheucticus meloncephalus
Lazuli Bunting Passerina amoena
Indigo Bunting Passerina cyanea
CROSSBILLS Dickcissel Spiza americana Yes (II) Yes (NSS4)
Red Crossbill Loxia curvirostra
TOWHEES Green-tailed Towhee Pipilo chlorurus
Spotted Towhee Pipilo maculatus
SPARROWS American Tree Sparrow Spizella arborea
Chipping Sparrow Spizella passerina Yes
Clay-colored Sparrow Spizella pallida
Brewer's Sparrow Spizella breweri Yes (I) Yes Yes (NSS4) Yes
- 104 -

Ross ISR Project 12 ER Addendum 3.5-G
List of wildlife species with the potential of occurring on or within several miles of the Strata Energy Ross Project Area.
Common Name Scientific Name
USFWS Birds of Conservation
Concern Region 7 (Level1)
BLM Sensitive Species
(Newcastle Field Office)
Wyoming Species of Concern (Status2)
Observed in the Area
Field Sparrow Spizella pusilla
Vesper Sparrow Pooecetes gramineus Yes
Lark Sparrow Chondestes grammacus Yes
Sage Sparrow Amphispoza belli Yes (I) Yes Yes (NSS4)
Lark Bunting Calamospiza melanocorys Yes (II) Yes (NSS4) Yes
Savannah Sparrow Passerculus sandwichensis
Baird's Sparrow Ammodramus bairdii Yes (I) Yes
Grasshopper Sparrow Ammodramus savannarum Yes (II) Yes (NSS4) Yes
Fox Sparrow Passerella iliaca
Song Sparrow Melospiza melodia
Lincoln's Sparrow Melospiza lincolnii
White-throated Sparrow Zonotrichia albicollis
White-crowned Sparrow Zonotrichia leucophrys
Harris' Sparrow Zonotrichia querula
Dark-eyed Junco Junco hyemalis Yes
LONGSPURS McCown's Longspur Calcarius mccownii Yes (I) Yes (NSS4) Yes
Lapland Longspur Calcarius lapponicus
Chestnut-collared Longspur Calcarius ornatus Yes (NSS4)
Snow Bunting Plectrophenax nivalis
BLACKBIRDS, ORIOLES, AND COWBIRDS Bobolink Dolichonyz oryzivorus Yes (NSS4)
Red-winged Blackbird Agelaius phoeniceus Yes
ROSY FINCHES, FINCHES, AND REDPOLLS Western Meadowlark Sturnella neglecta Yes
Yellow-headed Blackbird Xanthocephalus xanthocephalus Yes
- 105 -

Ross ISR Project 13 ER Addendum 3.5-G
List of wildlife species with the potential of occurring on or within several miles of the Strata Energy Ross Project Area.
Common Name Scientific Name
USFWS Birds of Conservation
Concern Region 7 (Level1)
BLM Sensitive Species
(Newcastle Field Office)
Wyoming Species of Concern (Status2)
Observed in the Area
Brewer's Blackbird Euphagus cyanocephalus Yes
Common Grackle Quiscalus quiscula Yes
Brown-headed Cowbird Molothrus ater Yes
Bullock's Oriole Icterus bullockii Yes
Gray-crowned Rosy Finch Leucosticte tephrocotis
Cassin's Finch Carpodacus cassinii Yes (IV)
House Finch Carpodacus mexicanus Yes
Common Redpoll Carduelis flammea
Pine Siskin Carduelis pinus Yes
American Goldfinch Carduelis tristis
Evening Grosbeak Coccothraustes vespertinus
WEAVER FINCHES House sparrow Passer domesticus Yes
AMPHIBIANS Tiger Salamander Ambystoma tigrinum -- Yes (NSS4*) Yes
Plains Spadefoot Scaphiopus bombifrons -- Yes (NSS4*)
Great Plains Toad Bufo cognatus -- Yes (NSS4*)
Woodhouse's Toad Bufo woodhousei woodhousei --
Boreal Chorus Frog Pseudaris triseriata maculate -- Yes (NSS4*) Yes
Bullfrog Rana catesbeiana -- Yes (NSS4*)
Northern Leopard Frog Rana pipiens -- Yes Yes (NSS4*) Yes
REPTILES Eastern Short-horned Lizard Phrynosoma douglassi brevirostre -- Yes Northern Sagebrush Lizard Sceloporus graciosus graciosus -- Yes (NSS4*) Yes Common Snapping Turtle Chelydra serpentina serpentina -- Yes Western Painted Turtle Chrysemys picta belli -- Yes (NSS4*) Yes Prairie Rattlesnake Crotalus viridis viridis -- Yes (NSS3*) Yes
- 106 -

Ross ISR Project 14 ER Addendum 3.5-G
List of wildlife species with the potential of occurring on or within several miles of the Strata Energy Ross Project Area.
Common Name Scientific Name
USFWS Birds of Conservation
Concern Region 7 (Level1)
BLM Sensitive Species
(Newcastle Field Office)
Wyoming Species of Concern (Status2)
Observed in the Area
Plains Hognose Snake Heterondon nasicus nasicus -- Yes (NSS4*) Bullsnake Pituophis melanoleucas sayi -- Yes (NSS4*) Yes Wandering Garter Snake Thamnophis elegans vagrans -- Yes (NSS4*) Yes Eastern Yellowbelly Racer Coluber constrictor flaviventris -- Yes (NSS4*)
FISH Common Carp Cyprinus carpio -- Golden Shiner Notemigonus crysoleucas -- Fathead Minnow Pimephales promelas -- Plains Minnow Hybognathus placitus -- Black Bullhead Ameiurus melas -- Yes Green Sunfish Lepomis cyanellus -- Yes Bluegill Lepomis macrochirus -- Yes White Sucker Catastomus commersoni Yes 1USFWS Level:
Level I (Conservation Action): Species clearly needs conservation action Level II (Monitoring): The action and focus for the species is monitoring (M). Declining population trend
and habitat loss are not significant at this point Level III (Local Interest): Species that Wyoming Partners In Flight may recommend for conservation
action (CA) that are not otherwise high priority but are of local interest (LI) Level IV (Not Considered Priority): Additional species of concern, but not considered a priority species
Source: USFWS, Wyoming Ecological Services http://www.fws.gov/wyominges/Pages/Species/Species_ SpeciesConcern/BirdsConsvConcern.html
2WGFD Status: NSS1: 1996 Nongame Bird and Mammal Plan Species of Special Concern with a Native Species Status
of 1 NSS2: 1996 Nongame Bird and Mammal Plan Species of Special Concern with a Native Species Status
of 2 NSS3: 1996 Nongame Bird and Mammal Plan Species of Special Concern with a Native Species Status
of 3 NSS4: 1996 Nongame Bird and Mammal Plan Species of Special Concern with a Native Species Status
of 4 * - Species listed wholly or in part due to absence of data
- 107 -

A 3.5-
F SA P G P A
- 108 -

Ross ISR Project 1 ER Addendum 3.5-H
2010 Strata ner oss Pro ect
abitat a in an escri tions
A en i 9 il li e aseline n entor Sa lin Plan
RE WGFD-WER 120 0
Wildlife habitats will be mapped and defined as required with data included in Appendix D . Any habitat information presented in Appendix D for this area will also be referenced in Appendix D . Surveys already completed indicate that upland grassland is the major habitat type. Some sagebrush shrubland habitats are present also but in lesser amounts. Other habitats present are wetlands along ephemeral or intermittent streams reservoirs pastureland hayland and cropland. Prior disturbance is present on the site from oil wells and county roads. No crucial or critical habitats are currently known to exist within the area. Table 1 presents a preliminary delineation of habitat types and acreages present within the proposed permit area and the site is shown on the attached map.
abitat A init
Habitat affinities for wildlife species on the area will be determined by seasonal data to be collected for each class of wildlife discussed in the following sections.
i Ga e
Specific big game surveys will not be required for this permit area. A review of WGFD information indicates that no crucial big game ranges are present. Incidental observations of big game species will be recorded for the habitat affinity analyses.
lan Ga e ir s
Lek surveys for sage-grouse and sharp-tailed grouse will be completed during the late March to early May period. Surveys will be conducted for the permit area and two mile perimeter. An initial search of BLM and WGFD records indicates no sage-grouse leks are present in the permit area. This may be due to the lack of extensive sagebrush shrublands within the permit area. However the Oshoto Lek is located about two miles away and the Cap’n Bob Lek is about 2. miles away. If a sage-grouse lek is found within two miles of the permit area then a total of three counts will be made for each lek discovered. Brood surveys will not be required.
a tors
Raptor nest surveys will be conducted during the breeding season and during all survey periods beginning in February of 200 and will follow WGFD and USFWS protocols. Surveys will include the permit area and one mile perimeter. Nest activity and production surveys will be completed in March through July.
- 109 -

Ross ISR Project 2 ER Addendum 3.5-H
ater o l an Shorebir s
The permit area contains the Oshoto Reservoir several small stock ponds and ephemeral or intermittent drainages. Some of these areas may contain water during the waterfowl migration or breeding season. Opportunistic observations will be made during the various surveys for other species (game birds raptors T E MBHFI etc.) to document use of the area by waterbirds.
Passerine ir s
The USFW has requested breeding bird surveys as a method of identifying Migratory Birds of High Federal Interest that may inhabit the area. These surveys will consist of belt transects 1000 meters long by 100 meters wide. At least one belt transect will be located within each of the major habitat types of Upland Grassland Sagebrush Shrubland Pastureland Hayland and Wetland Reservoir as listed in Table 1. The width and length of transects will have to be adjusted for the Wetland Reservoir habitats. Each transect will be surveyed twice approximately two weeks apart between May 1 and June 1 . The transects will be surveyed by walking the centerline and recording each bird observed or heard within 0 meters on either side of the observer. The surveys will be completed between hour prior to sunrise and 0AM. All species of passerine or other bird species observed during other surveys will also be recorded.
ther a als Pre ators S all a als a o or hs
Surveys will be completed for the presence of swift fox and den sites as requested by the WGFD. No specific surveys are proposed for other predators or small mammals. However all species of mammals observed during other surveys will be recorded.
Threatene or n an ere S ecies
The surveys required by the USFWS will be completed for T E species that have the potential for inhabiting the area. At this time the USFWS Ecological Services Office in Cheyenne Wyoming does not include any wildlife on their list of T E species that occur or may be affected by projects located in Crook County. The site does contain habitat for the Ute Ladies’-tresses orchid. Surveys for that plant species will be completed with the vegetation surveys.
i rator ir s o i h Fe eral nterest F
MBHFI and BLM Sensitive Species surveys will be completed as required for species that have habitat present on the permit area. Additional MBHFI surveys will be completed as the breeding bird surveys presented in a previous section for passerine birds. Bald eagle winter roost surveys will be conducted in December and January.
- 110 -

Ross ISR Project 3 ER Addendum 3.5-H
e tiles an A hibians
The WGFD requested surveys for leopard frogs. Specific s surveys for leopard frogs and other amphibians or reptiles will be completed during the May-June period. These surveys will consist of three aural surveys completed right after dark. The first survey will be about the second week of May the second survey will be about the last week in May and the third survey will be about the first week of June. Survey locations will be approximately 0. miles apart and will incorporate some form of calling index. Egg mass surveys will be completed in June. Additional surveys may include walking suitable habitats such as wetland and other aquatic sites and recording species observations or vocalizations. Any amphibians or reptiles observed during other surveys completed on the area will also be documented.
Fish an enthic n ertebrates
The proposed permit area does not contain any perennial streams but does contain the Oshoto Reservoir. However Oshoto Reservoir is relatively small and shallow and has not been documented to support a fishery. The Little Missouri River is also within the permit area. This drainage is not perennial within the proposed permit area but is ephemeral and intermittent. Aquatic surveys will not be conducted due to the lack of suitable waters that would support viable fisheries lack of perennial streams and the fact there will be minimal to no disturbance of aquatic habitats from this project. The WGFD has agreed with this determination.
S ecies ist
A wildlife species list will be prepared for the permit area. This list will include species actually observed in the area and species with the potential to occur within the area.
etlan s
Wetland surveys will be completed by others as directed by the Corps and will be included in Appendix D10 as required.
- 111 -

Ross ISR Project 4 ER Addendum 3.5-H
Table 1. Estimated Acreages for Pre-mine Wildlife Habitat Types on the Ross ISRUranium Project Permit Area.
Habitat Type Acreage Percent of Area
Upland Grassland .1 .
Sagebrush Shrubland . 21.0
Pastureland Hayland 22 .1 1 .
Wetland Reservoir 2. .1
Disturbed Land . 2.
Cropland 2.1 2.
Wooded Draw . 0.
Totals 1 . 100.0
- 112 -

A 3.5-
F SP
- 113 -

Ross ISR Project ER Addendum 3.5-I1- 114 -

Ross ISR Project ER Addendum 3.5-I2- 115 -

Ross ISR Project ER Addendum 3.5-I3- 116 -

Ross ISR Project ER Addendum 3.5-I4- 117 -

Ross ISR Project ER Addendum 3.5-I5- 118 -

Ross ISR Project ER Addendum 3.5-I6- 119 -

Ross ISR Project ER Addendum 3.5-I7- 120 -

Ross ISR Project ER Addendum 3.5-I8- 121 -

Ross ISR Project ER Addendum 3.5-I9- 122 -

Ross ISR Project ER Addendum 3.5-I10- 123 -

Ross ISR Project ER Addendum 3.5-I11- 124 -

Ross ISR Project ER Addendum 3.5-I12- 125 -

Ross ISR Project ER Addendum 3.5-I13- 126 -

Ross ISR Project ER Addendum 3.5-I14- 127 -

Ross ISR Project ER Addendum 3.5-I15- 128 -

Ross ISR Project ER Addendum 3.5-I16- 129 -

Ross ISR Project ER Addendum 3.5-I17- 130 -

Ross ISR Project ER Addendum 3.5-I18- 131 -

Ross ISR Project ER Addendum 3.5-I19- 132 -
Ross ISR Project ER Addendum 3.5-I20- 133 -

Ross ISR Project ER Addendum 3.5-I21- 134 -
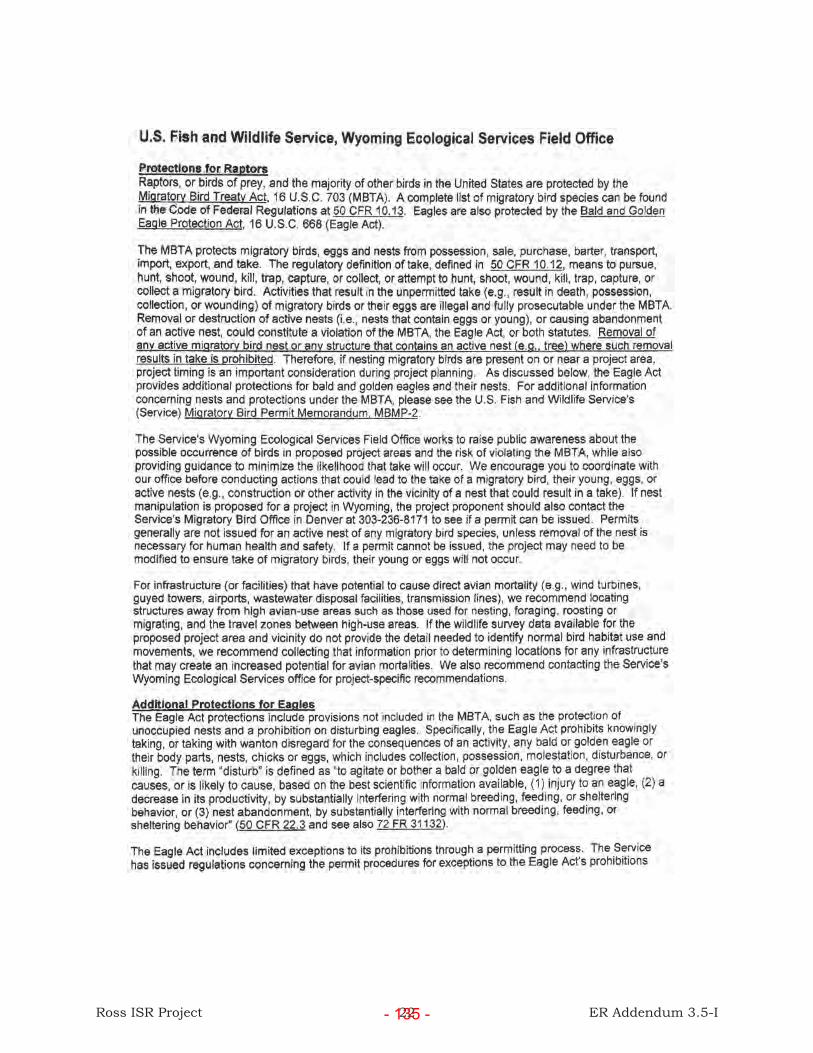
Ross ISR Project ER Addendum 3.5-I22- 135 -

Ross ISR Project ER Addendum 3.5-I23- 136 -

Ross ISR Project ER Addendum 3.5-I24- 137 -

Ross ISR Project ER Addendum 3.5-I25- 138 -

Ross ISR Project ER Addendum 3.5-I26- 139 -

Ross ISR Project ER Addendum 3.5-I27- 140 -

ADDENDUM 3.6-A
METEOROLOGICAL MONITORING
AND AIR SAMPLING PLAN
- 141 -

Ross ISR Uranium Project Strata Energy
Addendum 3.6-A
Meteorological Monitoring and Air Sampling Plan
Updated November 13, 2010
Prepared by:
Air Sciencea division of Inter-Mountain Laboratories, Inc.
555 Absaraka Sheridan, Wyoming 82801
(307) 674-7506 www.imlairscience.co
Ross ISR Project i ER Addendum 3.6-A- 142 -

The following baseline meteorological monitoring and ambient air sampling plan is being followed at the Ross ISR Project in conformance with published NRC standards and guidelines. The results of this monitoring program will be:
Introduction
1. Twelve months of on-site hourly meteorological data to support NRC licensing, air permitting through the Wyoming Department of Environmental Quality, Air Quality Division (WDEQ-AQD), and dispersion modeling.
2. Four quarters of particulate sampling and radionuclide analysis for five project locations, to support NRC licensing. A sixth location was added in October of 2010, after cumulative wind monitoring made it clear that prevailing winds are from the South.
Meteorological monitoring will be supplemented with hourly National Weather Service (NWS) data available from two Meteorological data sources within 80 kilometers of the project area. These include a NWS station at the Gillette, Wyoming airport (approximately 35 miles from the project), and a Remote Automated Weather Station (RAWS) station operated by the Bureau of Land Management near Devils Tower (approximately 15 miles from the project). Figure 1 shows NWS stations in Wyoming. The Gillette and Devils Tower sites are labeled on the map. The nearest available upper air data will be obtained from the NWS station in Rapid City, South Dakota (approximately 100 miles from the project).
FIGURE 1 – National Weather Service Stations in Wyomingyo ng
Ross ISR Project 1 ER Addendum 3.6-A- 143 -

Hourly meteorological data from surface coal mines in the region will be compared to data from the Ross ISR meteorological station. For at least the past 15 years, IML Air Science has operated meteorological stations at Dry Fork Mine, located 25 miles west-southwest of the project site, and Buckskin Mine, located 30 miles west-southwest of the project site. In addition, some hourly meteorological data are available from the Thunder Basin National Grassland monitoring station, located 18 miles west of the project site.
Meteorological data collection, management and reporting methods conform to NRC atmospheric dispersion modeling requirements for uranium milling operations, and meet the acceptance criteria established in the NRC’s NUREG-1569. The on-site monitoring program has been developed according to NRC Regulatory Guide 3.63, “Onsite Meteorological Measurement Program For Uranium Recovery Facilities – Data Acquisition and Reporting.” The meteorological monitoring program will also meet the Wyoming Department of Environmental Quality requirements for land and air quality permit applications and compliance.
On-Site Meteorological Monitoring Plan
The project site meteorology is being monitored for a minimum of 12 months, at the site labeled “Met Station” in Figure 3. A collocated air sampler will collect air particulates as part of the air quality baseline monitoring program (see below). Prevailing winds at the Gillette airport are typically from the southwest and northwest, as shown in Figure 4. According to Section 2.5.3 of the original Nubeth application to NRC for an exploration license just south of the project site, winds are predominantly westerly. Based on these information sources, the “Met Station” location was chosen to represent conditions upwind from the project area. It issituated on an unobstructed knoll roughly two miles northwest of the proposed plant site. The meteorological station is approximately 150 feet higher in elevation than the plant site. The terrain in the area is characterized by mildly rolling hills and ephemeral drainages. There are no pronounced topographic features in the area that would create weather conditions significantly different between the meteorological station and the plant site. Figure 2 shows aview from the meteorological station looking to the east, and a view of the meteorological site from a point north of the site. Figure 3 shows a map of the project area, including permit boundary and monitoring locations. The site labeled “MET” in the northwest corner of the map is the meteorological monitoring station.
Ross ISR Project 2 ER Addendum 3.6-A- 144 -

FIGURE 2 – Meteorological (Met Station) Site
Hourly meteorological values are recorded for wind speed, wind direction, standard deviation of wind direction (sigma theta), ambient temperature, relative humidity, precipitation, evaporation, and evaporation pan temperature. These values are generated by field instruments and recorded by a continuous data logger, all operated and maintained by IML Air Science. The data logger polls all instruments every second, and invalidates any hourly record for which an instrument output is missing for more than 10 seconds during that hour. This assures continuous temporal representation and surpasses the NRC requirement of at least 15 minutes of data in each hour.
The Ross ISR Project meteorological station is inspected on a weekly basis. Meteorological instruments were calibrated upon installation in January, 2010 and again in July of 2010,according to the requirements of NRC Regulatory Guide 3.63. Appendix 1 to this document contains calibration and audit records for all meteorological instruments, along with specified tolerances for each parameter. These instruments meet the accuracy and threshold specifications listed in the EPA’s “On-Site Meteorological Program Guidance for Regulatory Modeling Applications,” which match or exceed NRC requirements in Regulatory Guide 3.63.Table 1 presents specifications for each instrument. Audit procedures are specified in EPA’s Quality Assurance Handbook for Air Pollution Measurement Systems, Volume 4: Meteorological Measurements. The Standard Operation Procedure (SOP) employed by IML Air Science appears in Appendix 3 to this document.
Meteorological Data Quality Assurance
All hourly data are downloaded weekly from the data logger to IML Air Science’s relational database. The database software provides for quality assurance, invalidation of suspect or erroneous data, and various forms of data presentation. Data are summarized in weeklyreports, which also include data recovery statistics and diagnosis of invalidated records. The level of rigor associated with collecting and validating on-site meteorological data is comparable, or superior to National Weather Service standards. Data recovery for the Ross ISR Project so far has been over 95% for wind data and over 97% for other parameters. This is typical of meteorological monitoring conducted by IML Air Science in Wyoming.
Ross ISR Project 3 ER Addendum 3.6-A- 145 -

FIGURE 3
Ross ISR Project 4 ER Addendum 3.6-A- 146 -

TABLE 1
Ross ISR Met Station
Parameter Instrument Range Accuracy ThresholdInstrument
HeightWind Speed RM Young 05305
Winder Monitor AQ0 to 112
mph±0.4 mph or
1% of reading
0.9 mph 10 meters
Wind Dir RM Young 05305Winder Monitor AQ
0 to 360º ±3º 1.0 mph 10 meters
Temp Vaisalla HMP50-L15Temp and RH Probe
-25º to 50º C
±0.5º C @ given range
-- º C 2 meters
Rel Humidity Vaisalla HMP50-L15Temp and RH Probe
0 to 98% ±3% at 20 º C
-- 2 meters
Precip Hydrologic ServicesTB3/0.01P TippingBucket Rain Gauge
Temp: -20ºto 50º C
±0.5% @ 0.5 in/hr rate
-- 1 meter
Evaporation Novalynx 255-100Evaporation Gauge
0 to 944" 0.25% -- 1 meter
Evaporation Pan Temperature Gauge
Fenwal 107 Temperature Probe
-35º to 50º C
±0.2º C @ 0 - 60º C,
±0.4º C @ -35º C
-- 1 meter
Data Logger Campbell ScientificCR1000 DataLogger
-- -- -- --
Ross ISR Project 5 ER Addendum 3.6-A- 147 -

FIGURE 4 – Gillette, Wyoming Wind Rose (2000 – 2007)
Ross ISR Project 6 ER Addendum 3.6-A- 148 -

IML Air Science conducts baseline air quality sampling in accordance with NRC Regulatory Guide 4.14. Ambient air is sampled continuously for total suspended particulates (TSP),using low-volume air samplers positioned at five sites in the project vicinity. Figure 3 shows the locations of these sites. Three of these are situated near the permit boundary, labeled “Southwest”, “East” and “South” on the Figure 3. As recommended in NRC Regulatory Guide 4.14, the East site was positioned where the air at the permit boundary is closest to, or most likely to be impacted by the proposed milling operation. A fourth sampler was placed at the Met Station site, along with the meteorological monitoring tower and instruments. AC power is not available at any of the above sites, necessitating solar power supplies and battery operation. The fifth site was located in Oshoto, near the Ross ISR project office (labeled “Office”). At less than 400 meters from the Ross ISR permit boundary, this site originally represented the nearest dwelling or occupiable structure outside the permit boundary as stipulated in NRC Regulatory Guide 4.14. AC power, available at this location, is used to operate the air sampler.
Baseline Air Sampling Plan
Historical data from the northeast Wyoming region indicate that the dominant winds are from the west or northwest, with a secondary mode from the southwest. Six months of meteorological monitoring at the Ross ISR Project, however, demonstrated that prevailing winds in this locale are from the south, with a secondary mode from the northwest. This pattern has persisted through the latter part of 2010 (Figure 5).
FIGURE 5 – Ross ISR Wind Rose (Jan - Nov 2010)
Ross ISR Project 7 ER Addendum 3.6-A- 149 -
Since there is a residence a few hundred meters north of the permit boundary (and in a northerly direction from the proposed plant site), a decision was made to install a sixth air sampler at this residence (“North” site on Figure 3) to comply with the intent of Regulatory Guide 4.14:
“Air particulate samples should be collected continuously at a minimum of three locations at or near the site boundary. If there are residences or occupiable structures within 10 kilometers of the site, a continuous outdoor air sample should be collected at or near the structure with the highest predicted airborne radionuclide concentration due to milling operations and at or near at least one structure in any area where predicted doses exceed 5 percent of the standards in 40 CFR Part 190. A continuous air sample should also be collected at a remote location that represents background conditions at the mill site; in general, a suitable location would be in the least prevalent wind direction from the site and unaffected by mining or other milling operations.”
The North site is intended to account for prevailing south winds that could impact airborne radionuclide concentrations at the Wesley residence (Figure 3). The secondary mode of northwest winds is covered by the East sampler, located on the permit boundary a few hundred meters from the Strong residence. The Southwest site is least likely to be impactedeither by the primary or secondary wind direction mode, and is therefore intended to represent the area unaffected by mining or milling operations.
Air particulates are sampled continuously by a low-volume, continuous air sampler installed at each of the five monitoring sites. The air samplers pull ambient air continuously through 47-millimeter, Teflon filters. The samplers are housed in weather enclosures and equipped with gooseneck inlets to insure unobstructed access to ambient air (Figure 6). The exposed filters are collected and replaced with clean filters on a weekly basis. After each quarter (13 weeks) all exposed filters from a given site are combined into a composite sample and analyzed for the radionuclides specified in NRC Guide 4.14: Uranium-238, Thorium-230, Radium-226 and Lead-210. Teflon membrane filters are used to minimize radiological interference during laboratory analysis.
Ross ISR Project 8 ER Addendum 3.6-A- 150 -

FIGURE 6 – Southwest Sampler Setup
Sampler flow rates range from 20 to 30 liters/minute for the solar-operated samplers (F&J Specialty Products, Model DF-40L-AC) and from 60 to 80 liters/minute for the AC-powered sampler (F&J Specialty Products, Model LV-1D). Sampler flow rates are recorded for the AC-powered sampler before and after the weekly filter exchange. The air volume associated with this sample is calculated as the average sampler flow rate multiplied by the elapsed time between change-outs. The DC-powered samplers display cumulative time and flow volumedirectly; these data are recorded at each filter change-out. Each sampler is checked for air flow rate every week. All sampler calibrations are performed by the manufacturer and are represented as valid for one year. Calibration records for the air samplers appear in Appendix 2 to this document.
At the conclusion of the baseline monitoring period, meteorological data will be presented in the form of a 1-year meteorological summary, wind rose, wind speed frequency graph, precipitation and evaporation summaries, and diurnal graphs of temperature and wind speed. The report will also include a Joint Frequency Distribution for the mine sites using Pasquill atmospheric stability classes. Data recovery statistics will be reported for all logged parameters. The information from this report, along with NWS data from the region, will provide the basis for the baseline meteorological analysis submitted in the NRC License Application.
Data Reporting and Analysis
Air particulate sampling results will be reported for each of the four quarters sampled, as well as in summary fashion. This report will include air volumes sampled by each sampler, results from composite filter analysis, and implied radio-isotope concentrations (if detectable) at each of the five sampler sites. A demonstration will be made that sampled air volumes, coupled
Ross ISR Project 9 ER Addendum 3.6-A- 151 -

with laboratory detection limits, meet the requirement for minimum detectable ambient concentrations of radionuclides as specified in Regulatory Guide 4.14. The information from this report will provide the basis for the baseline air quality analysis submitted in the NRC License Application.
A draft of this monitoring plan was submitted to WDEQ-AQD, the state agency responsible for issuing an air quality permit as necessary to construct a uranium mining and milling facility. A letter from WDEQ-AQD approving this monitoring plan is presented in Appendix 4 to this document.
Ross ISR Project 10 ER Addendum 3.6-A- 152 -

References
1. Quality Assurance Handbook for Air Pollution Measurement Systems: Volume IV. Meteorological Measurements; EPA/600/4-90/003; August 1989; U.S. Environmental Protection Agency
2. Quality Assurance Handbook for Air Pollution Measurement Systems: Volume V. Precipitation Measurement Systems; EPA/600/R-94/038e; April 1994; U.S. Environmental Protection Agency
3. On-Site Meteorological Program Guidance for Regulatory Modeling Applications; EPA-450/4-87-013; June, 1987; U.S. Environmental Protection Agency
4. Ambient Monitoring Guidelines for Prevention of Significant Deterioration (PSD); EPA-450/4-87-007; May, 1987; U.S. Environmental Protection Agency
Ross ISR Project 11 ER Addendum 3.6-A- 153 -

APPENDIX 1
METEOROLOGICAL CALIBRATIONS
Ross ISR Project 12 ER Addendum 3.6-A- 154 -

Ross IS
R Project
13E
R A
ddendu
m 3.6-A
- 155 -
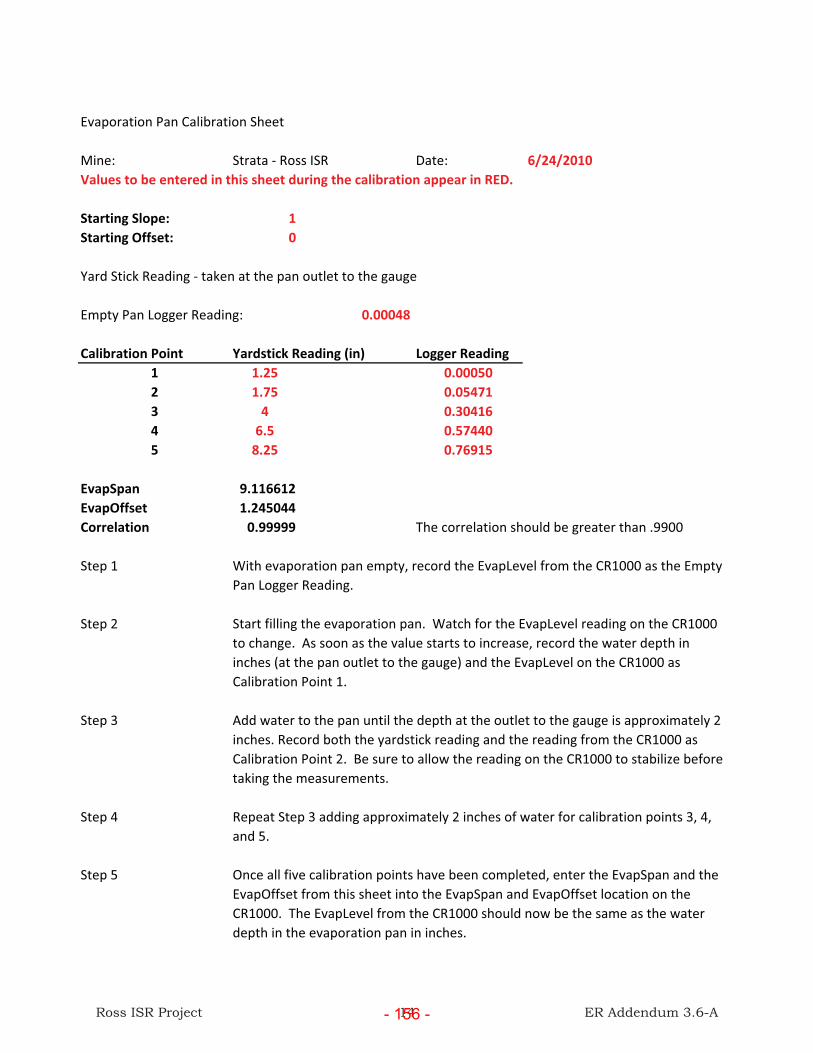
Evaporation�Pan�Calibration�Sheet
Mine: Strata���Ross�ISR Date: 6/24/2010Values�to�be�entered�in�this�sheet�during�the�calibration�appear�in�RED.
Starting�Slope: 1Starting�Offset: 0
Yard�Stick�Reading���taken�at�the�pan�outlet�to�the�gauge
Empty�Pan�Logger�Reading: 0.00048
Calibration�Point Yardstick�Reading�(in) Logger�Reading1 1.25 0.000502 1.75 0.054713 4 0.304164 6.5 0.574405 8.25 0.76915
EvapSpan 9.116612EvapOffset 1.245044Correlation 0.99999 The�correlation�should�be�greater�than�.9900
Step�1
Step�2
Step�3
Step�4
Step�5
Add�water�to�the�pan�until�the�depth�at�the�outlet�to�the�gauge�is�approximately�2�inches.�Record�both�the�yardstick�reading�and�the�reading�from�the�CR1000�as�Calibration�Point�2.��Be�sure�to�allow�the�reading�on�the�CR1000�to�stabilize�before�taking�the�measurements.
Repeat�Step�3�adding�approximately�2�inches�of�water�for�calibration�points�3,�4,�and�5.��
Once�all�five�calibration�points�have�been�completed,�enter�the�EvapSpan�and�the�EvapOffset�from�this�sheet�into�the�EvapSpan�and�EvapOffset�location�on�the�CR1000.��The�EvapLevel�from�the�CR1000�should�now�be�the�same�as�the�water�depth�in�the�evaporation�pan�in�inches.�
With�evaporation�pan�empty,�record�the�EvapLevel�from�the�CR1000�as�the�Empty�Pan�Logger�Reading.
Start�filling�the�evaporation�pan.��Watch�for�the�EvapLevel�reading�on�the�CR1000�to�change.��As�soon�as�the�value�starts�to�increase,�record�the�water�depth�in�inches�(at�the�pan�outlet�to�the�gauge)�and�the�EvapLevel�on�the�CR1000�as�Calibration�Point�1.
Ross ISR Project 14 ER Addendum 3.6-A- 156 -

Met Station: StrataAudit Date: 15-Jul-10
Audit Performed By: S. Hansen, Tim Mendenhall, IML -- Air Science
Sensor Mfr./Model Serial NumberWind Speed (WS):Wind Direction (WD):Temperature @ 2 Meters:Relative Humidity:Evaporation: Novalynx Evap PanPrecipitation: Hydrological TB3Data acquisition system:
Audit ResultsReference Reference
RPM mph DAS Value |Difference| SpecificationWS (m/sec) 0 0.00 0.00 0.00 below threshold
300 3.44 3.44 0.00 0.56 (2)800 9.16 9.16 0.00 0.56 (2)3000 34.34 34.35 0.01 0.56 (2)8000 91.60 91.60 0.00 0.56 (2)
Reference DAS Value |Difference| SpecificationWS start torque (gm-cm) t<1 1 0 1.0 (3)
Crossarm Alignment: 183° 181.5
WD (degrees) Clockwise 0.0 0.7 0.7 5.0 (2)90.0 90.6 0.6 5.0 (2)
180.0 180.4 0.4 5.0 (2)270.0 270.4 0.4 5.0 (2)
Counter clockwise 0.0 0.2 0.2 5.0 (2)90.0 90.8 0.8 5.0 (2)
180.0 180.2 0.2 5.0 (2)270.0 270.2 0.2 5.0 (2)
Temp. (°F): 36.09 36.11 0.02 0.9 (2)80.26 80.02 0.24 0.9 (2)120.60 120.05 0.55 0.9 (2)
Relative Humidity (%) 16.0 17.3 1.3 7.0 (2)
Evaporation: 6.875 6.885 0.01 5.0 (4)
DAS Value (in) Reference (ml) DAS Equivalent |Difference| SpecificationPrecipitation (0.1" equiv.) 0.11 88.2 87.7 0.5 8.7 (2)
0.10 79.8 79.9 0.1 7.9 (2)0.10 75.8 79.9 4.1 7.9 (2)
Average Diff: 1.6 7.9 (2)
BOLD difference values exceed performance specifications(1)= Performance specification listed in facilities' Quality Assurance Project Plan
(2)= EPA Quality Assurance Manual for Air Pollution Measurement Systems, Vol. IV, 1989
(3)= Manufacturer's Specifications
(4)= EPA On-Site Meteorological Program Guidance for Regulatory Modeling Applications
Notes, RecommendationsSystem taken offline at 15:07 MST and returned online at 16:20 MST.Calibrated evap.
CSI CR1000 dataloggerN/AN/A
N/AN/A
METEOROLOGICAL STATION AUDIT SUMMARY
CS215
Serial/ID NumberRM Young Wind Monitor AQRM Young Wind Monitor AQ
IML 1407IML 1405IML 1402CS215IML 0892
N/A
Reference Devicequartz referenced drive motor
transit, compassdigital thermistor
digital hygrometer
lab grade burette
Ross ISR Project 15 ER Addendum 3.6-A- 157 -
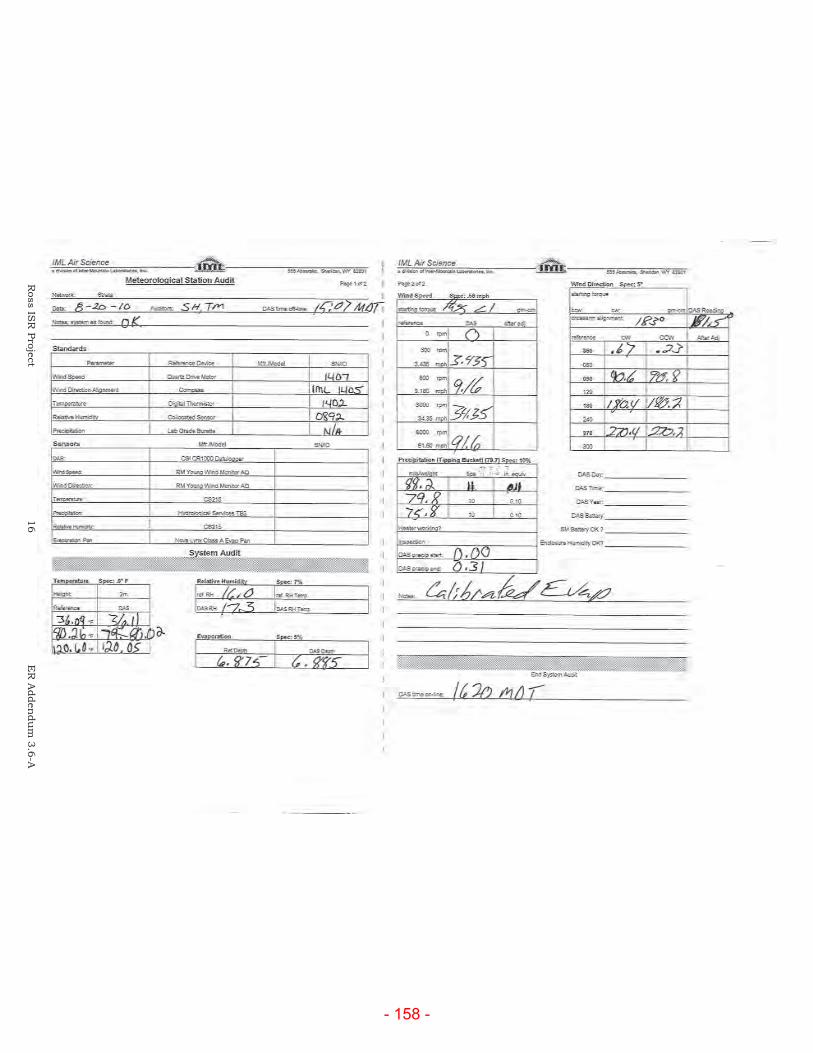
Ross IS
R Project
16E
R A
ddendu
m 3.6-A
- 158 -

APPENDIX 2
SAMPLER CALIBRATIONS
Ross ISR Project 17 ER Addendum 3.6-A- 159 -

Ross ISR Project 18 ER Addendum 3.6-A- 160 -
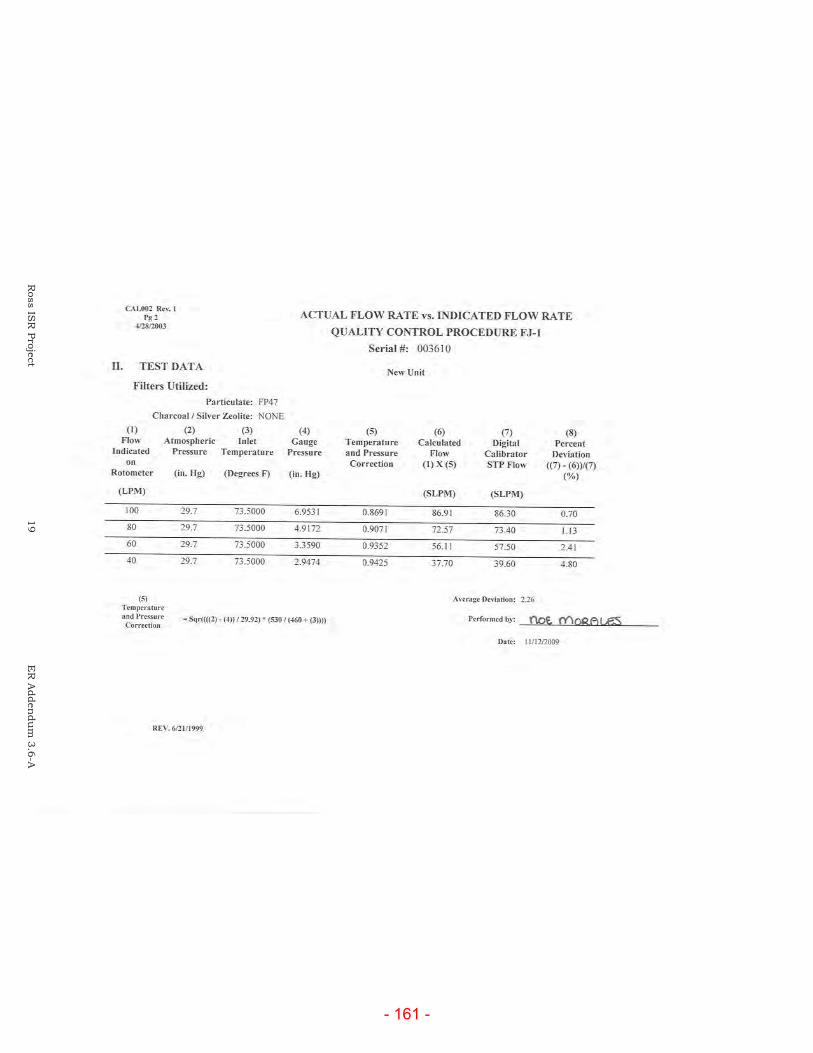
Ross IS
R Project
19E
R A
ddendu
m 3.6-A
- 161 -
Ross IS
R Project
20E
R A
ddendu
m 3.6-A
- 162 -

Ross ISR Project 21 ER Addendum 3.6-A- 163 -

Ross IS
R Project
22E
R A
ddendu
m 3.6-A
- 164 -

Ross ISR Project 23 ER Addendum 3.6-A- 165 -

Ross ISR Project 24 ER Addendum 3.6-A- 166 -

Ross ISR Project 25 ER Addendum 3.6-A- 167 -

Ross ISR Project 26 ER Addendum 3.6-A- 168 -

Ross IS
R Project
27E
R A
ddendu
m 3.6-A
- 169 -

Ross ISR Project 28 ER Addendum 3.6-A- 170 -

Ross ISR Project 29 ER Addendum 3.6-A- 171 -

Ross ISR Project 30 ER Addendum 3.6-A- 172 -

Ross ISR Project 31 ER Addendum 3.6-A- 173 -

Ross IS
R Project
32E
R A
ddendu
m 3.6-A
- 174 -

Ross ISR Project 33 ER Addendum 3.6-A- 175 -
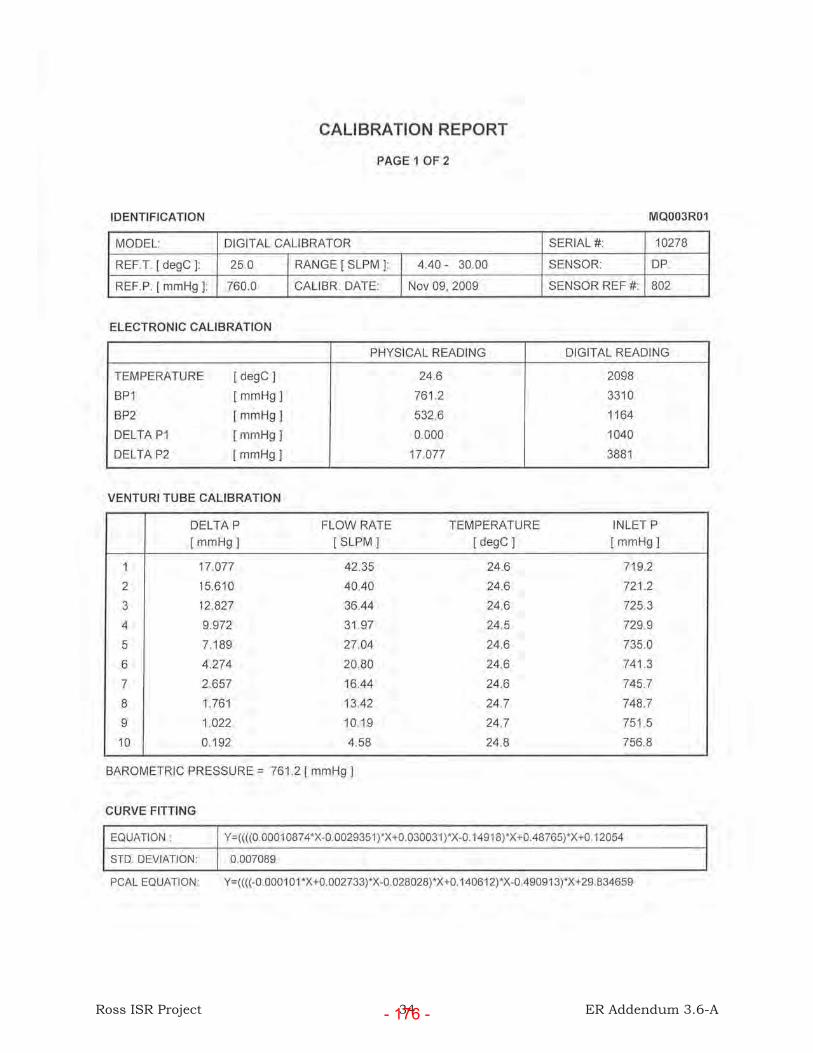
Ross ISR Project 34 ER Addendum 3.6-A- 176 -

Ross ISR Project 35 ER Addendum 3.6-A- 177 -

Ross ISR Project 36 ER Addendum 3.6-A- 178 -

Ross IS
R Project
37E
R A
ddendu
m 3.6-A
- 179 -
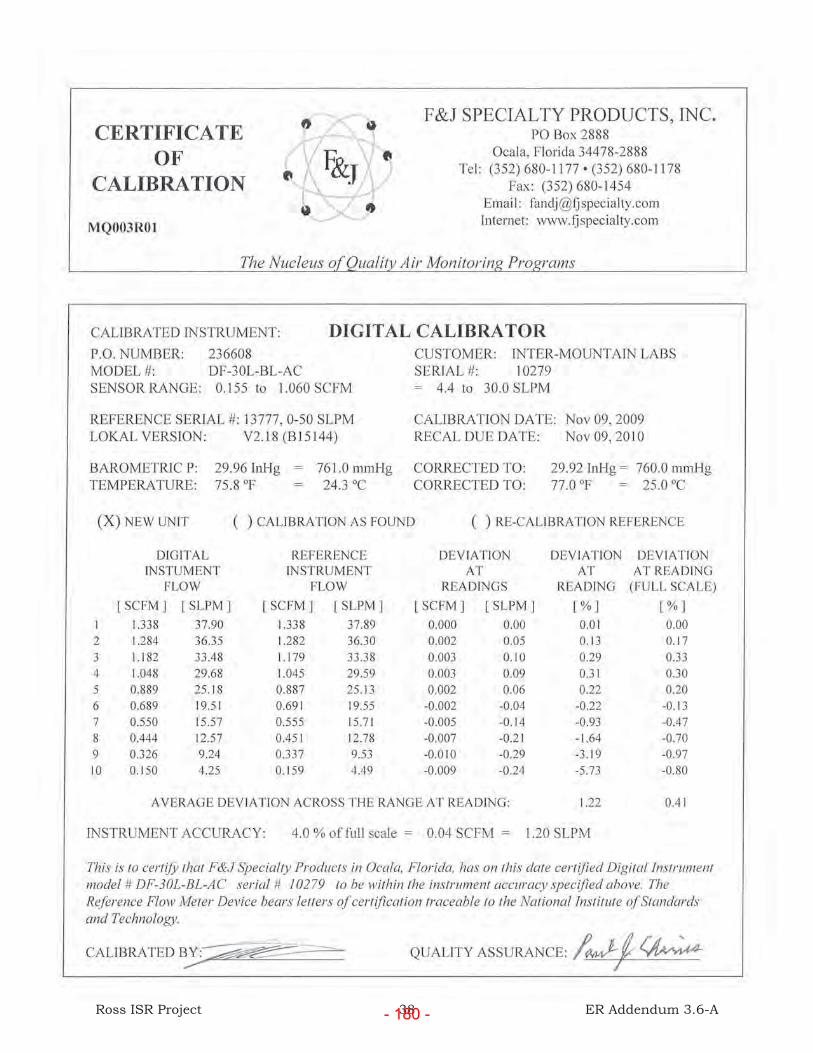
Ross ISR Project 38 ER Addendum 3.6-A- 180 -

Ross ISR Project 39 ER Addendum 3.6-A- 181 -

Ross ISR Project 40 ER Addendum 3.6-A- 182 -

Ross ISR Project 41 ER Addendum 3.6-A- 183 -

Ross IS
R Project
42E
R A
ddendu
m 3.6-A
- 184 -

Ross ISR Project 43 ER Addendum 3.6-A- 185 -

Ross ISR Project 44 ER Addendum 3.6-A- 186 -
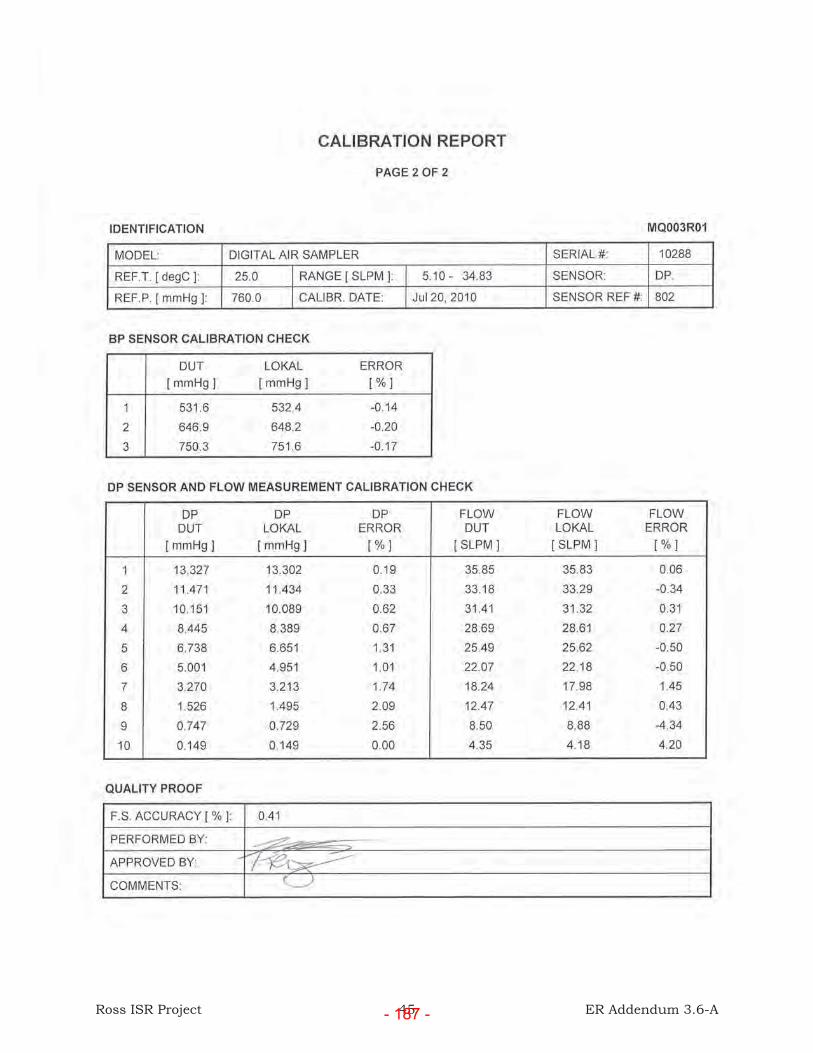
Ross ISR Project 45 ER Addendum 3.6-A- 187 -

APPENDIX 3
STANDARD OPERATING PROCEDURE
Ross ISR Project 46 ER Addendum 3.6-A- 188 -

Standard Operating Procedure For
Meteorological Station Audit SOP AIR-12
Procedural Section
1.0 Scope and Application
1.1 In 1970 the Clean Air Act (CAA) was signed into law. The CAA and itsamendments provide the framework for all pertinent organizations to protect air quality. On July 18, 1997, in Federal Register: Vol. 62, No. 138, the United States Environmental Protection Agency (EPA) revised the particulate matter ambient air standards. Along with the establishment of the standard is the requirement for a national monitoring network utilizing a filter-based method adopted by EPA.
1.2 This procedure applies to the following equipment: RM Young 0535 Wind Monitor AQ, Hydrologic Services TB3/0.01P tipping bucket precipitation device, Vaisalla CS215-L11 Temperature and RH Probe, and Campbell Scientific CR-1000 data logger, which are used in the particulate monitoring network.
1.3 The elements of this SOP are applicable for all sampling frequencies.
1.4 To ensure that the recorded meteorological data for wind speed, wind direction, temperature, and precipitation match readings provided by known references, within acceptable limits.
2.0 Summary of Method
2.1 IML Air Science is responsible for the accuracy audit of their Meteorological station. The procedure is performed by IML field personnel.
2.2 The meteorological audit consists of checking current readings for all parameters against reference values.
3.0 Health and Safety Warnings
3.1 General safety precautions related to electrical hazards must be observed at all times when working with electronic equipment. Electrical receptacles and equipment must be properly grounded. Use caution when servicing or operating electrical equipment in wet conditions.
Ross ISR Project 47 ER Addendum 3.6-A- 189 -

2
3.2 General precautions for working with heavy equipment and electro-mechanical equipment should be taken.
4.0 Cautions
4.1 Damage to the instrument may result if caution is not taken to properly install and maintain the device. Follow the manufacturer's instructions for maintenance of all equipment and for safe, secure installation.
5.0 Personnel Qualifications
5.1 Persons performing this SOP must be familiar with the operation of environmental measurement instrumentation.
5.2 Computer skills are necessary for programming the sampler and for troubleshooting.
5.3 Familiarity with electronic and mechanical test equipment is required.
6.0 Equipment
6.1 Quartz-referenced wind speed motor, with adapters
6.2 Starting torque measurement disc and weights
6.3 NIST traceable thermometer
6.4 Two insulated containers (one with ice water and the other with hot water)
6.5 Engineer’s transit
6.6 Class B pipette
6.7 Field data sheet
6.8 Miscellaneous tools
7.0 Meteorological Station Audit Procedure
7.1 Record the date, station ID, auditor(s), description of sensors, and noteany visible anomalies in the field log book. Check that the data logger is displaying reasonable current readings.
Ross ISR Project 48 ER Addendum 3.6-A- 190 -
3
7.2.1 Check the initial alignment of the wind direction sensor using the transit, being sure to adjust for the local declination of 12° East.
7.3 Locate the reference, aspirated thermometer near the met station’s temperature sensor, allow each sensor to reach equilibrium and record both readings.
7.4 Record the “time system off line”, just before lowering the tower. Remove the appropriate base mounting bolts, detach the guy wire perpendicular to the base hinge, and carefullylower the tower.
7.5 Remove the anemometer propeller. Attach the propeller torque disc to the shaft and record the starting torque in the counter-clockwise direction.
7.6 Attach the anemometer drive motor to the shaft and rotate at speeds corresponding to approximately 3 mph, 9 mph, 30 mph, and 90 mph,
recording the motor speeds and wind speed readings from the data logger.
7.7 Assess the linearity of the wind direction sensor by physically holding the anemometer at 0°, 90°, 180°, and 270°, recording the corresponding readings from the data logger.
7.8 Immerse the reference thermometer and met station temperature sensor in an ice bath.After the sensors have attained equilibrium, record the measurements from both. Repeat the procedure for a warm water bath (approximately 80°F - 100°F).
7.9 After all measurements on the tower have been taken, inspect the sensors and all cables and mounting hardware. Repair or replace any damaged components if indicated.
7.10 Make sure all cables and mounting hardware are sound and secure.Carefully raise the tower, secure the base, and equalize the guy wire
tensions.
7.11 Using the pipette, admit water slowly into the inlet of the precipitation gauge (as found, i.e. do not clean) until the bucket tips 10 times (0.1” precipitation equivalent). Record the amount of water required for the 10 tips, and the amount registered on the data logger.Repeat the procedure two more times. After the readings have been taken, clean the inlet, and perform any indicated adjustments and/or repairs can be performed and noted. Note the condition of the gauge prior to, and after the audit. If the ambient temperature is cold enough, assess whether the heater is working.
7.12 Record any findings, repairs, replacements and any other anomalies in the field log book.Record the time the station was returned to normal
operating condition.
Ross ISR Project 49 ER Addendum 3.6-A- 191 -

Ross ISR Project 50 ER Addendum 3.6-A- 192 -

Ross ISR Project 51 ER Addendum 3.6-A- 193 -
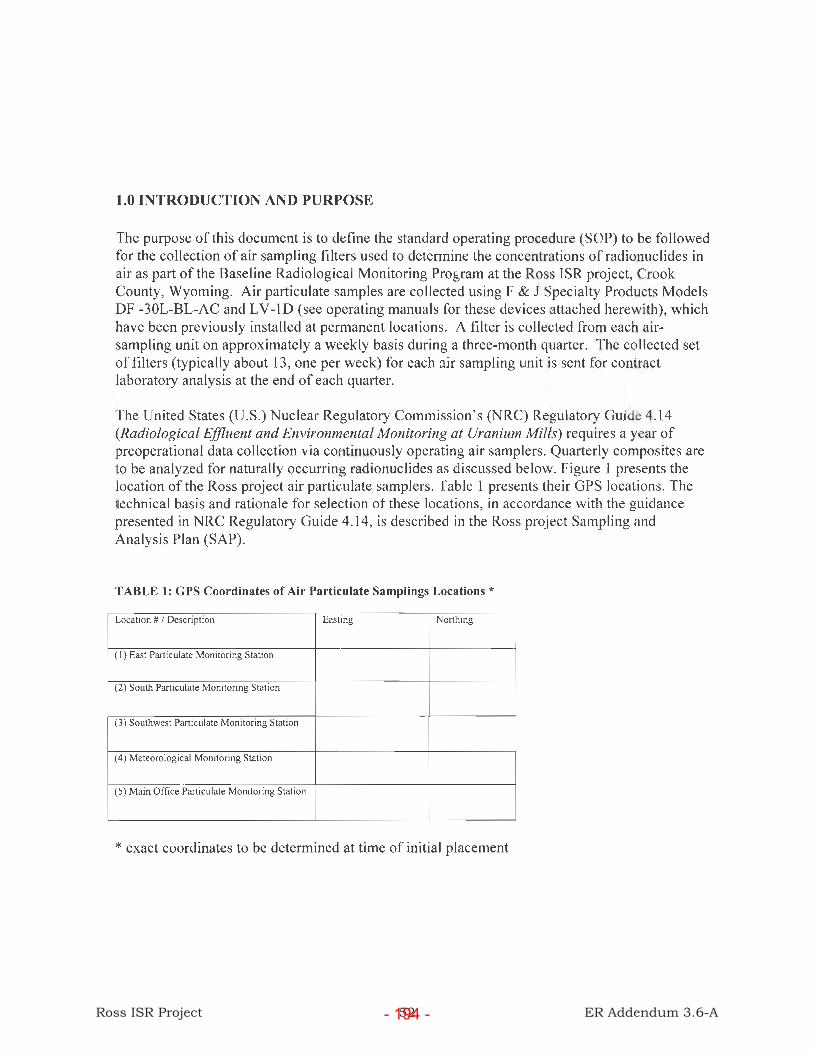
Ross ISR Project 52 ER Addendum 3.6-A- 194 -
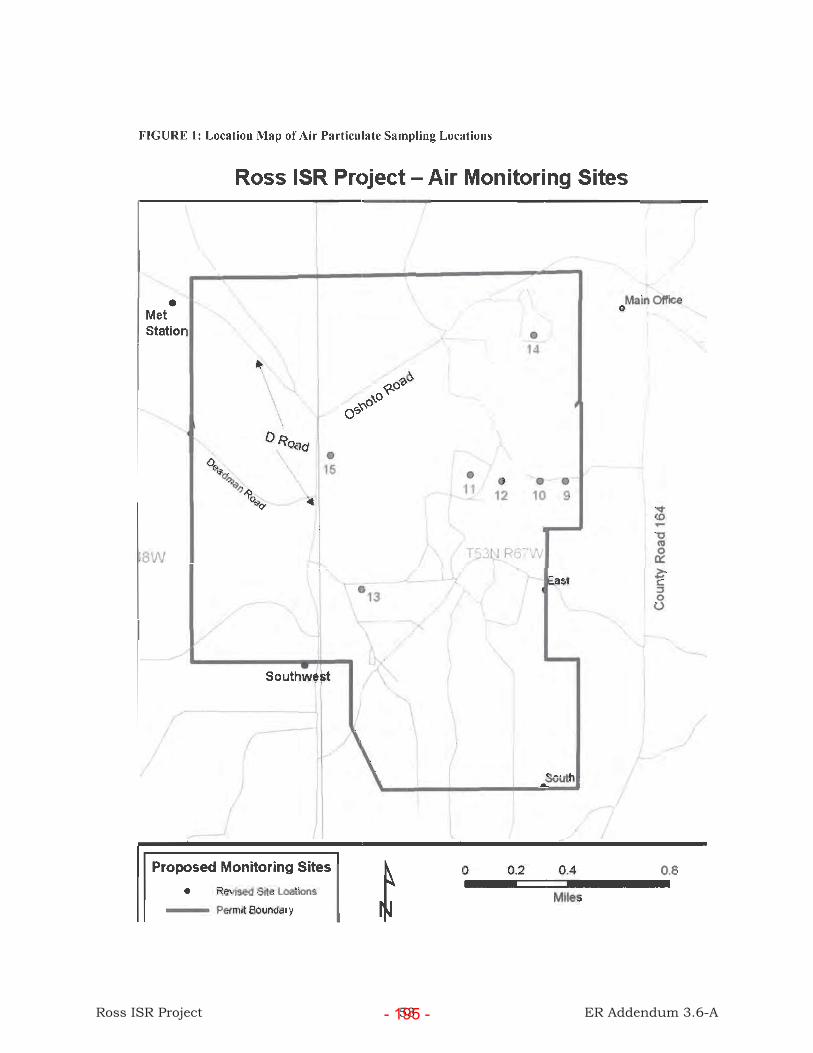
Ross ISR Project 53 ER Addendum 3.6-A- 195 -

Ross ISR Project 54 ER Addendum 3.6-A- 196 -

Ross ISR Project 55 ER Addendum 3.6-A- 197 -

Ross ISR Project 56 ER Addendum 3.6-A- 198 -

Ross ISR Project 57 ER Addendum 3.6-A- 199 -

Ross ISR Project 58 ER Addendum 3.6-A- 200 -

Ross ISR Project 59 ER Addendum 3.6-A- 201 -

APPENDIX 4
WDEQ APPROVAL
Ross ISR Project 60 ER Addendum 3.6-A- 202 -

Ross ISR Project 61 ER Addendum 3.6-A- 203 -

ADDENDUM 3.6-B
SITE – SPECIFIC METEOROLOGY AND CLIMATOLOGY
DATA
- 204 -

Ross ISR Project i ER Addendum 3.6-B
TABLE OF CONTENTS
LIST OF TABLES
Table 1. Ross ISR Maximum, Minimum, and Average Monthly Temperatures ................... 1Table 2. Ross ISR Joint Frequency Distribution for 2010 ..................................................... 2Table 3. Ross ISR 1st Quarter Joint Frequency Distribution ................................................. 8Table 4. Ross ISR 2nd Quarter Joint Frequency Distribution ............................................... 10Table 5. Ross ISR 3rd Quarter Joint Frequency Distribution ............................................... 12Table 6. Ross ISR 4th Quarter Joint Frequency Distribution ............................................... 14
LIST OF FIGURES
Figure 1. Ross ISR Meteorological Summary for 2010 ........................................................ 16Figure 2. 2010 Gillette AP Meteorological Summary ........................................................... 17Figure 3. Ross ISR (Oshoto) Monthly Average Temperatures ............................................. 18Figure 4. 2010 Average Monthly Temperatures: Ross ISR vs. Gillette AP .......................... 19Figure 5. Ross ISR Diurnal Average Temperatures .............................................................. 20Figure 6. Ross ISR Project Wind Rose .................................................................................. 21Figure 7. Ross ISR Monthly Wind Roses: January – April ................................................... 22Figure 8. Ross ISR Monthly Wind Roses: May – August ..................................................... 23Figure 9. Ross ISR Monthly Wind Roses: September – December ...................................... 24Figure 10. 2010 Gillette AP Wind Rose .................................................................................. 25Figure 11. 2010 Average Monthly Wind Speeds: Ross ISR vs. Gillette AP ........................... 26Figure 12. Project Area Monthly Average Wind Speeds ........................................................ 27Figure 13. Ross ISR Wind Summary ...................................................................................... 28Figure 14. Ross ISR Wind Speed Frequency Distribution ...................................................... 29Figure 15. Ross ISR 1st Quarter Wind Summary .................................................................... 30Figure 16. Ross ISR 2nd Quarter Wind Summary .................................................................... 31Figure 17. Ross ISR 3rd Quarter Wind Summary .................................................................... 32Figure 18. Ross ISR 4th Quarter Wind Summary .................................................................... 33Figure 19. Ross ISR (Oshoto) Diurnal Average Wind Speeds ................................................ 34Figure 20. Ross ISR Monthly Precipitation ............................................................................. 35Figure 21. 2010 Monthly Precipitation: Ross ISR vs. Gillette AP .......................................... 36Figure 22. Ross ISR Monthly Evaporation .............................................................................. 37Figure 23. Ross ISR Typical Evaporation Pan Water Temperature Correlation ..................... 38Figure 24. Ross ISR Diurnal Average Relative Humidity ...................................................... 39
References ..................................................................................................................................... 40
- 205 -

Ross ISR Project 1 ER Addendum 3.6-B
Table 1. Ross ISR Maximum, Minimum, and Average Monthly Temperatures
MONTH
Average Temperature
(°F)
Minimum Temperature
(°F)
Maximum Temperature
(°F) Jan 22.1 -15.9 43.2 Feb 20.8 -8.6 40.8 Mar 37.5 19.2 67.0 Apr 42.9 25.5 66.7 May 51.1 32.1 81.9 Jun 60.9 42.6 90.0 Jul 68.5 47.0 92.6 Aug 70.5 46.0 98.0 Sep 59.6 35.6 88.3 Oct 51.8 24.9 85.2 Nov 41.1 18.9 71.7 Dec
Year-Round 47.9 24.3 75.0 Source: IML (2010)
- 206 -

Table 2. Ross ISR Joint Frequency Distribution for 2010
Ross ISR Project Oshoto, Wyoming
Frequency Distribution Hourly Average Wind Speed, Wind Direction and Sigma
IML Air Science Sheridan, WY
Calm Readings 14 Total Readings 7135 Possible Readings 7511 Data Capture 95.0%
From 1/5/2010 To 11/13/2010 Stability Class A Wind Speed (mph) Direction < 3.4 3.4 – 6.9 6.9 – 11.5 11.5 - 18.4 18.4 - 24.0 > 24.0 Row Total E 0.00072 0.00168 0.00014 0.00255 ENE 0.00072 0.00168 0.00098 0.00028 0.00367 ESE 0.00072 0.00182 0.00255 N 0.00029 0.00238 0.00112 0.00379 NE 0.00058 0.00280 0.00112 0.00450 NNE 0.00014 0.00224 0.00084 0.00323 NNW 0.00043 0.00322 0.00182 0.00014 0.00562 NW 0.00029 0.00294 0.00210 0.00533 S 0.00130 0.00126 0.00084 0.00340 SE 0.00072 0.00182 0.00042 0.00297 SSE 0.00116 0.00224 0.00098 0.00014 0.00452 SSW 0.00043 0.00140 0.00126 0.00310 SW 0.00087 0.00252 0.00168 0.00014 0.00014 0.00535 W 0.00014 0.00294 0.00140 0.00014 0.00463 WNW 0.00043 0.00308 0.00238 0.00014 0.00604 WSW 0.00043 0.00266 0.00252 0.00014 0.00576 Sum 0.00940 0.03672 0.01962 0.00112 0.00014 0.06701
Ross IS
R Project
2
Adden
dum
3.6-B
- 207 -

Table 2. Ross ISR Joint Frequency Distribution for 2010 (Continued)
From 1/5/2010 To 11/13/2010 Stability Class B Wind Speed (mph) Direction < 3.4 3.4 – 6.9 6.9 – 11.5 11.5 - 18.4 18.4 - 24.0 > 24.0 Row Total E 0.00014 0.00014 0.00028 ENE 0.00014 0.00056 0.00028 0.00099 ESE 0.00014 0.00056 0.00014 0.00085 N 0.00042 0.00098 0.00014 0.00154 NE 0.00014 0.00042 0.00042 0.00028 0.00127 NNE 0.00014 0.00042 0.00057 NNW 0.00028 0.00140 0.00042 0.00014 0.00224 NW 0.00014 0.00056 0.00224 0.00070 0.00365 S 0.00072 0.00126 0.00112 0.00028 0.00339 SE 0.00014 0.00042 0.00028 0.00014 0.00099 SSE 0.00087 0.00084 0.00084 0.00070 0.00325 SSW 0.00058 0.00070 0.00098 0.00042 0.00268 SW 0.00070 0.00140 0.00028 0.00014 0.00252 W 0.00056 0.00154 0.00210 WNW 0.00014 0.00028 0.00126 0.00014 0.00014 0.00014 0.00211 WSW 0.00029 0.00098 0.00042 0.00169 Sum 0.00362 0.00771 0.01430 0.00392 0.00028 0.00028 0.03011
Ross IS
R Project
3
Adden
dum
3.6-B
- 208 -
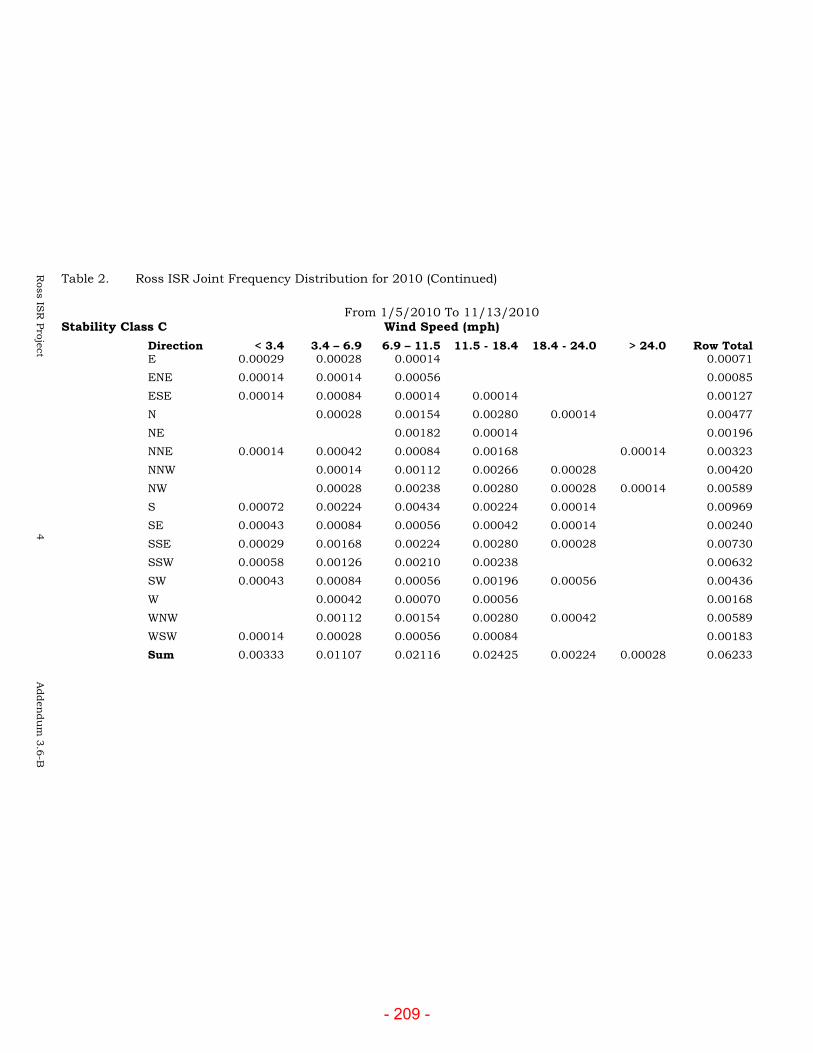
Table 2. Ross ISR Joint Frequency Distribution for 2010 (Continued)
From 1/5/2010 To 11/13/2010
Stability Class C Wind Speed (mph) Direction < 3.4 3.4 – 6.9 6.9 – 11.5 11.5 - 18.4 18.4 - 24.0 > 24.0 Row Total E 0.00029 0.00028 0.00014 0.00071 ENE 0.00014 0.00014 0.00056 0.00085 ESE 0.00014 0.00084 0.00014 0.00014 0.00127 N 0.00028 0.00154 0.00280 0.00014 0.00477 NE 0.00182 0.00014 0.00196 NNE 0.00014 0.00042 0.00084 0.00168 0.00014 0.00323 NNW 0.00014 0.00112 0.00266 0.00028 0.00420 NW 0.00028 0.00238 0.00280 0.00028 0.00014 0.00589 S 0.00072 0.00224 0.00434 0.00224 0.00014 0.00969 SE 0.00043 0.00084 0.00056 0.00042 0.00014 0.00240 SSE 0.00029 0.00168 0.00224 0.00280 0.00028 0.00730 SSW 0.00058 0.00126 0.00210 0.00238 0.00632 SW 0.00043 0.00084 0.00056 0.00196 0.00056 0.00436 W 0.00042 0.00070 0.00056 0.00168 WNW 0.00112 0.00154 0.00280 0.00042 0.00589 WSW 0.00014 0.00028 0.00056 0.00084 0.00183 Sum 0.00333 0.01107 0.02116 0.02425 0.00224 0.00028 0.06233
Ross IS
R Project
4
Adden
dum
3.6-B
- 209 -

Table 2. Ross ISR Joint Frequency Distribution for 2010 (Continued)
From 1/5/2010 To 11/13/2010 Stability Class D Wind Speed (mph) Direction < 3.4 3.4 – 6.9 6.9 – 11.5 11.5 - 18.4 18.4 - 24.0 > 24.0 Row Total E 0.00029 0.00266 0.00252 0.00168 0.00716 ENE 0.00014 0.00182 0.00463 0.00589 0.00098 0.00028 0.01374 ESE 0.00058 0.00266 0.00154 0.00042 0.00520 N 0.00029 0.00210 0.00925 0.02705 0.00687 0.00140 0.04696 NE 0.00072 0.00196 0.00336 0.00799 0.00154 0.01558 NNE 0.00101 0.00182 0.00603 0.01345 0.00392 0.00168 0.02792 NNW 0.00029 0.00210 0.00757 0.02733 0.00771 0.00350 0.04850 NW 0.00266 0.00575 0.02523 0.00897 0.00813 0.05074 S 0.00203 0.02242 0.03308 0.05858 0.02313 0.00771 0.14694 SE 0.00014 0.00322 0.00294 0.00294 0.00028 0.00014 0.00968 SSE 0.00087 0.00925 0.01388 0.03027 0.02200 0.01261 0.08888 SSW 0.00289 0.01962 0.01416 0.01079 0.00252 0.00336 0.05335 SW 0.00188 0.00631 0.00252 0.00406 0.00280 0.00350 0.02108 W 0.00112 0.00519 0.01416 0.00238 0.00266 0.02551 WNW 0.00238 0.00505 0.01808 0.00771 0.00617 0.03938 WSW 0.00072 0.00308 0.00491 0.00897 0.00126 0.00098 0.01992 Sum 0.01186 0.08521 0.12235 0.25690 0.09208 0.05214 0.62055
Ross IS
R Project
5
Adden
dum
3.6-B
- 210 -

Table 2. Ross ISR Joint Frequency Distribution for 2010 (Continued)
From 1/5/2010 To 11/13/2010 Stability Class E Wind Speed (mph) Direction < 3.4 3.4 – 6.9 6.9 – 11.5 11.5 - 18.4 18.4 - 24.0 > 24.0 Row Total E 0.00058 0.00210 0.00112 0.00380 ENE 0.00224 0.00266 0.00491 ESE 0.00058 0.00070 0.00056 0.00184 N 0.00029 0.00280 0.00799 0.01108 NE 0.00043 0.00210 0.00491 0.00744 NNE 0.00029 0.00266 0.00827 0.01122 NNW 0.00029 0.00294 0.01261 0.01585 NW 0.00058 0.00252 0.01163 0.01473 S 0.00145 0.01065 0.01528 0.02737 SE 0.00101 0.00098 0.00182 0.00382 SSE 0.00130 0.00463 0.00589 0.01181 SSW 0.00260 0.00897 0.00603 0.01760 SW 0.00159 0.00350 0.00084 0.00594 W 0.00029 0.00168 0.00953 0.01150 WNW 0.00058 0.00224 0.00897 0.01179 WSW 0.00029 0.00224 0.00939 0.01192 Sum 0.01215 0.05298 0.10750 0.17263 )
Ross IS
R Project
6
Adden
dum
3.6-B
- 211 -

Table 2. Ross ISR Joint Frequency Distribution for 2010 (Continued)
From 1/5/2010 To 11/13/2010
Stability Class F Wind Speed (mph) Direction < 3.4 3.4 – 6.9 6.9 – 11.5 11.5 - 18.4 18.4 - 24.0 > 24.0 Row Total E 0.00174 0.00084 0.00258 ENE 0.00072 0.00210 0.00283 ESE 0.00231 0.00140 0.00372 N 0.00043 0.00182 0.00226 NE 0.00159 0.00084 0.00243 NNE 0.00101 0.00126 0.00227 NNW 0.00101 0.00070 0.00171 NW 0.00087 0.00196 0.00283 S 0.00304 0.00252 0.00556 SE 0.00217 0.00112 0.00329 SSE 0.00159 0.00252 0.00411 SSW 0.00275 0.00224 0.00499 SW 0.00101 0.00126 0.00227 W 0.00101 0.00168 0.00269 WNW 0.00072 0.00098 0.00170 WSW 0.00087 0.00126 0.00213 Sum 0.02285 0.02453 0.04738
Source: IML (2010)
Ross IS
R Project
7
Adden
dum
3.6-B
- 212 -

Ross ISR Project 8 ER Addendum 3.6-B
Table 3. Ross ISR 1st Quarter Joint Frequency Distribution Source: IML (2010)
3 3 - 6 6 - 10 10 - 16 16 - 21 21NNNE 0.000525 0.000525NEENE 0.001576 0.000978 0.002553E 0.000525 0.000525ESE 0.000525 0.001955 0.002480SE 0.000978 0.000978SSE 0.001051 0.000978 0.002028S 0.002626 0.000489 0.000978 0.004093SSW 0.001576 0.001466 0.003042SW 0.000525 0.001466 0.000978 0.002969WSW 0.001051 0.000978 0.001466 0.003494W 0.000978 0.000978WNW 0.000978 0.001466 0.002444NW 0.001051 0.000489 0.001539NNW 0.000525 0.001955 0.002480N 0.000489 0.000489 0.000978NNENE 0.000525 0.000489 0.001014ENE 0.000489 0.000489E 0.000525 0.000489 0.001014ESE 0.001466 0.001466SE 0.000489 0.000489SSE 0.001576 0.000978 0.002553S 0.001576 0.001955 0.000489 0.000489 0.004508SSW 0.001466 0.001466SW 0.001466 0.000978 0.000978 0.003421WSW 0.000978 0.000978W 0.000489 0.000978 0.001466WNW 0.000525 0.000489 0.001014NW 0.000525 0.000489 0.001014NNW 0.000489 0.000489N 0.000489 0.000978 0.001466NNENEENE 0.000525 0.000525E 0.000489 0.000489ESE 0.000525 0.000525SE 0.001051 0.001466 0.002517SSE 0.002933 0.000489 0.003421S 0.001051 0.002933 0.001466 0.000978 0.006427SSW 0.001051 0.003421 0.000489 0.000978 0.005938SW 0.001051 0.000978 0.000489 0.000489 0.000489 0.003494WSW 0.000525 0.000489 0.000489 0.001503WWNW 0.001955 0.000489 0.002444NW 0.000489 0.000978 0.001466NNW 0.000978 0.000978
A
B
C
Wind Speed ( nots) - 1st Quarter 2010Stability Class
Wind Direction Row Total
- 213 -

Ross ISR Project 9 ER Addendum 3.6-B
Table 3. Ross ISR 1st Quarter Joint Frequency Distribution (continued)
3 3 - 6 6 - 10 10 - 16 16 - 21 21N 0.000525 0.003910 0.008798 0.036168 0.011241 0.060643NNE 0.001576 0.000489 0.001955 0.009286 0.001955 0.015261NE 0.001576 0.002933 0.000978 0.005486ENE 0.001466 0.001466E 0.001955 0.000489 0.002444ESE 0.001051 0.002444 0.000489 0.003983SE 0.002933 0.003421 0.000489 0.006843SSE 0.002101 0.010264 0.014174 0.021505 0.010753 0.000489 0.059286S 0.004202 0.032258 0.044966 0.081134 0.024927 0.007331 0.194818SSW 0.004202 0.032747 0.022483 0.012219 0.001466 0.000978 0.074095SW 0.002626 0.009286 0.001466 0.003421 0.002444 0.001955 0.021199WSW 0.000525 0.003421 0.004888 0.009775 0.000978 0.019587W 0.000978 0.004888 0.017107 0.002444 0.000489 0.025904WNW 0.004399 0.001466 0.020039 0.006354 0.002444 0.034702NW 0.003910 0.003910 0.022972 0.008798 0.017595 0.057185NNW 0.001051 0.004888 0.006843 0.034702 0.007331 0.002444 0.057258N 0.001051 0.005865 0.009286 0.016202NNE 0.000525 0.002933 0.002444 0.005902NE 0.000525 0.001466 0.000978 0.002969ENE 0.001466 0.000489 0.001955E 0.000525 0.001955 0.002480ESE 0.001051 0.000489 0.000489 0.002028SE 0.001051 0.000489 0.000978 0.002517SSE 0.002101 0.006843 0.006354 0.015298S 0.002101 0.015640 0.024438 0.042179SSW 0.005778 0.018084 0.013685 0.037547SW 0.003152 0.004399 0.001955 0.009506WSW 0.000525 0.002933 0.012708 0.016166W 0.000525 0.001955 0.012708 0.015188WNW 0.001051 0.003910 0.014174 0.019135NW 0.002101 0.002444 0.018573 0.023118NNW 0.000525 0.004399 0.015152 0.020076NNNE 0.001576 0.001576NE 0.002101 0.000489 0.002590ENE 0.000489 0.000489E 0.001576 0.001576ESE 0.002626 0.000978 0.003604SE 0.002101 0.000978 0.003079SSE 0.001051 0.003421 0.004472S 0.003677 0.002933 0.006609SSW 0.004202 0.001466 0.005668SW 0.001576 0.000978 0.002553WSW 0.001051 0.001955 0.003006W 0.002101 0.000978 0.003079WNW 0.000525 0.000978 0.001503NW 0.002101 0.000978 0.003079NNW 0.000525 0.000489 0.001014
E
F
D
Stability Class
Wind Direction
Wind Speed ( nots) - 1st Quarter 2010Row Total
- 214 -

Ross ISR Project 10 ER Addendum 3.6-B
Table 4. Ross ISR 2nd Quarter Joint Frequency Distribution Source: IML (2010)
3 3 - 6 6 - 10 10 - 16 16 - 21 21N 0.000496 0.001489 0.001985NNE 0.002481 0.000993 0.003474NE 0.003970 0.000993 0.004963ENE 0.001489 0.000496 0.001985E 0.000993 0.002481 0.003474ESE 0.001985 0.001985SE 0.001489 0.001489 0.000993 0.003970SSE 0.000496 0.002481 0.000993 0.000496 0.004467S 0.000993 0.000993 0.000993 0.002978SSW 0.000993 0.000993 0.001985SW 0.001985 0.000496 0.002481WSW 0.000496 0.000496 0.000993W 0.001985 0.001985 0.003970WNW 0.000993 0.001985 0.001489 0.000496 0.004963NW 0.003474 0.000496 0.003970NNW 0.001489 0.000993 0.002481N 0.000993 0.001489 0.002481NNE 0.000496 0.000496NE 0.000993 0.000496 0.001489ENE 0.000496 0.000496EESE 0.000496 0.000496SE 0.000993 0.000496 0.001489SSE 0.001489 0.000496 0.000993 0.000993 0.003970S 0.001489 0.000496 0.000496 0.002481SSW 0.000496 0.000496 0.001489 0.002481SW 0.000993 0.000993 0.001985WSW 0.000993 0.001489 0.002481W 0.000496 0.000496WNW 0.000993 0.000496 0.001489NW 0.002481 0.000496 0.002978NNW 0.000993 0.000993 0.000496 0.002481N 0.000496 0.000496 0.001489 0.002481NNE 0.000993 0.000993 0.000993 0.002978NE 0.002978 0.002978ENE 0.000496 0.000496 0.000993E 0.000993 0.000496 0.000496 0.001985ESE 0.001985 0.000496 0.000496 0.002978SE 0.000993 0.000993 0.001489 0.003474SSE 0.000496 0.000993 0.002978 0.005459 0.009926S 0.001985 0.006452 0.002481 0.010918SSW 0.000496 0.001489 0.001985 0.003970SW 0.000496 0.000993 0.000496 0.004963 0.001489 0.008437WSW 0.001489 0.002481 0.003970W 0.001489 0.001985 0.003474WNW 0.000496 0.001489 0.006948 0.000496 0.009429NW 0.000496 0.002978 0.003474 0.006948NNW 0.000496 0.001489 0.003474 0.000993 0.006452
A
B
C
Stability Class
Wind Direction
Wind Speed ( nots) - 2nd Quarter 2010Row Total
- 215 -

Ross ISR Project 11 ER Addendum 3.6-B
Table 4. Ross ISR 2nd Quarter Joint Frequency Distribution (continued)
3 3 - 6 6 - 10 10 - 16 16 - 21 21N 0.001489 0.008437 0.022829 0.004963 0.001489 0.039206NNE 0.001985 0.009429 0.018362 0.004963 0.001985 0.036725NE 0.000496 0.002978 0.004963 0.012903 0.002481 0.023821ENE 0.000496 0.001489 0.008437 0.009926 0.001985 0.000993 0.023325E 0.000993 0.003474 0.003970 0.002978 0.011414ESE 0.000993 0.002978 0.000993 0.000496 0.005459SE 0.000496 0.002978 0.002978 0.005955 0.000496 0.012903SSE 0.000496 0.008437 0.011414 0.041687 0.033747 0.037221 0.133002S 0.000496 0.014392 0.016873 0.039702 0.025310 0.012407 0.109181SSW 0.001985 0.009926 0.005955 0.006452 0.000993 0.003474 0.028784SW 0.001985 0.003970 0.004467 0.004963 0.002978 0.004467 0.022829WSW 0.000993 0.002978 0.004963 0.014888 0.003474 0.001985 0.029280W 0.000993 0.005955 0.013896 0.005955 0.008437 0.035236WNW 0.001985 0.008933 0.016873 0.009429 0.013400 0.050620NW 0.001985 0.005955 0.022829 0.006948 0.000496 0.038213NNW 0.000496 0.007444 0.024814 0.013400 0.008933 0.055087N 0.001985 0.008933 0.010918NNE 0.000993 0.011911 0.012903NE 0.001985 0.007444 0.009429ENE 0.001985 0.004963 0.006948E 0.000993 0.002978 0.001985 0.005955ESE 0.000496 0.000993 0.000496 0.001985SE 0.001489 0.001985 0.002978 0.006452SSE 0.002481 0.007444 0.009926S 0.001489 0.006452 0.012903 0.020844SSW 0.000496 0.003474 0.002481 0.006452SW 0.000496 0.002481 0.000993 0.003970WSW 0.000496 0.001489 0.007444 0.009429W 0.000496 0.001489 0.008437 0.010422WNW 0.000496 0.000496 0.004467 0.005459NW 0.001489 0.006948 0.008437NNW 0.002481 0.015881 0.018362N 0.000496 0.001985 0.002481NNE 0.000993 0.001985 0.002978NE 0.000496 0.000496 0.000993ENE 0.000496 0.001985 0.002481E 0.000993 0.000496 0.001489ESE 0.001985 0.000993 0.002978SE 0.001489 0.001489 0.002978SSE 0.000993 0.000993 0.001985S 0.002481 0.001985 0.004467SSW 0.000993 0.003474 0.004467SW 0.001985 0.000496 0.002481WSW 0.000993 0.000993 0.001985W 0.000993 0.001985 0.002978WNW 0.000496 0.000496NW 0.001489 0.001489NNW 0.000496 0.000496 0.000993
E
F
D
Stability Class
Wind Direction
Wind Speed ( nots) - 2nd Quarter 2010Row Total
- 216 -

Ross ISR Project 12 ER Addendum 3.6-B
Table 5. Ross ISR 3rd Quarter Joint Frequency Distribution Source: IML (2010)
3 3 - 6 6 - 10 10 - 16 16 - 21 21N 0.000497 0.006907 0.003947 0.011351NNE 0.005427 0.001973 0.007400NE 0.001492 0.005427 0.002960 0.009879ENE 0.000497 0.002960 0.002960 0.000987 0.007404E 0.000995 0.001973 0.000493 0.003461ESE 0.001989 0.001480 0.003469SE 0.000995 0.002960 0.000493 0.004448SSE 0.001989 0.003453 0.002467 0.007909S 0.000497 0.002467 0.000493 0.003457SSW 0.001973 0.001480 0.003453SW 0.001989 0.004440 0.004440 0.000493 0.000493 0.011856WSW 0.000497 0.005427 0.006413 0.000493 0.012831W 0.000497 0.005920 0.002960 0.000493 0.009871WNW 0.007893 0.004933 0.012827NW 0.006413 0.006413 0.012827NNW 0.000497 0.007400 0.005427 0.000493 0.013818N 0.001973 0.001973NNE 0.000497 0.000987 0.001484NE 0.000987 0.000493 0.001480ENE 0.001480 0.000493 0.001973EESE 0.000497 0.000497SE 0.000497 0.000493 0.000991SSE 0.000987 0.001480 0.001480 0.003947S 0.000987 0.001973 0.002960SSW 0.000497 0.000493 0.001973 0.001480 0.004444SW 0.001480 0.000493 0.001973WSW 0.000497 0.000987 0.001484W 0.001480 0.001480 0.002960WNW 0.000987 0.001973 0.000493 0.003453NW 0.000987 0.003453 0.001973 0.006413NNW 0.000493 0.003947 0.000493 0.004933N 0.000493 0.003947 0.006413 0.000493 0.011347NNE 0.000497 0.000493 0.001973 0.003453 0.000493 0.006911NE 0.002960 0.000493 0.003453ENE 0.000987 0.000987EESE 0.000493 0.000493SE 0.000493 0.000987 0.000493 0.001973SSE 0.000497 0.000493 0.002960 0.003947 0.000987 0.008884S 0.000497 0.001973 0.005427 0.004440 0.000493 0.012831SSW 0.000497 0.000987 0.004933 0.004440 0.010857SW 0.000987 0.000987 0.001480 0.003453WSW 0.000493 0.000493 0.000987W 0.000987 0.000987WNW 0.001480 0.002467 0.001480 0.000987 0.006413NW 0.003453 0.002467 0.000987 0.000493 0.007400NNW 0.001973 0.003453 0.005427
A
B
C
Stability Class
Wind Direction
Wind Speed ( nots) - 3rd Quarter 2010Row Total
- 217 -

Ross ISR Project 13 ER Addendum 3.6-B
Table 5. Ross ISR 3rd Quarter Joint Frequency Distribution (continued)
3 3 - 6 6 - 10 10 - 16 16 - 21 21N 0.001480 0.013814 0.030587 0.005427 0.002467 0.053774NNE 0.001492 0.002467 0.009373 0.017267 0.006907 0.003947 0.041453NE 0.000497 0.000987 0.004933 0.012333 0.002960 0.021711ENE 0.003453 0.007400 0.008387 0.001480 0.020720E 0.003947 0.003947 0.002960 0.010853ESE 0.001480 0.003453 0.000987 0.005920SE 0.004440 0.002960 0.003947 0.000493 0.000493 0.012333SSE 0.000497 0.007893 0.010360 0.028614 0.026147 0.001973 0.075485S 0.001989 0.012827 0.028614 0.055254 0.020720 0.004933 0.124338SSW 0.002984 0.013320 0.011840 0.009373 0.004440 0.003947 0.045905SW 0.001492 0.005920 0.002960 0.001480 0.001973 0.002960 0.016786WSW 0.000497 0.003947 0.005920 0.003947 0.000987 0.000493 0.015791W 0.001973 0.004440 0.006907 0.013320WNW 0.001480 0.003453 0.009867 0.004933 0.000493 0.020227NW 0.001973 0.005920 0.023680 0.003453 0.001973 0.037000NNW 0.000987 0.009867 0.019734 0.003453 0.000987 0.035027N 0.001480 0.004933 0.006413NNE 0.000497 0.005427 0.013320 0.019244NE 0.000995 0.003453 0.007400 0.011848ENE 0.003947 0.003947 0.007893E 0.000497 0.002467 0.001973 0.004937ESE 0.000493 0.000987 0.001480SE 0.000497 0.000987 0.001480 0.002964SSE 0.002487 0.004933 0.004933 0.012354S 0.000995 0.005427 0.007400 0.013822SSW 0.001492 0.004440 0.001973 0.007905SW 0.000995 0.003453 0.004448WSW 0.001480 0.006413 0.007893W 0.000987 0.004440 0.005427WNW 0.001480 0.003453 0.004933NW 0.002960 0.008880 0.011840NNW 0.001480 0.004933 0.006413N 0.000497 0.003453 0.003951NNE 0.000497 0.002467 0.002964NE 0.002487 0.001973 0.004460ENE 0.001989 0.003453 0.005443E 0.002487 0.002467 0.004953ESE 0.002487 0.002467 0.004953SE 0.003481 0.000493 0.003975SSE 0.002984 0.002960 0.005944S 0.002487 0.001973 0.004460SSW 0.002487 0.001973 0.004460SW 0.001973 0.001973WSW 0.000497 0.000987 0.001484W 0.001480 0.001480WNW 0.001492 0.000987 0.002479NW 0.000995 0.002960 0.003955NNW 0.001492 0.001480 0.002972
E
F
D
Stability Class
Wind Direction
Wind Speed ( nots) - 3rd Quarter 2010Row Total
- 218 -

Ross ISR Project 14 ER Addendum 3.6-B
Table 6. Ross ISR 4th Quarter Joint Frequency Distribution Source: IML (2010)
3 3 - 6 6 - 10 10 - 16 16 - 21 21NNNENE 0.000955 0.000955 0.001910ENE 0.000955 0.000955 0.001910E 0.002865 0.002865ESE 0.001910 0.001910SE 0.001910 0.001910SSE 0.000955 0.001910 0.002865S 0.000955 0.000955 0.000955 0.002865SSW 0.003820 0.000955 0.004776SW 0.000955 0.001910 0.002865WSW 0.004776 0.000955 0.005731W 0.002865 0.002865WNW 0.000955 0.000955 0.001910NW 0.000955 0.000955NNW 0.000955 0.000955 0.001910NNNENE 0.000955 0.000955ENE 0.000955 0.000955EESE 0.000955 0.000955SE 0.000955 0.000955SSE 0.000955 0.000955 0.001910S 0.001910 0.001910 0.003820SSW 0.001910 0.001910SW 0.002865 0.002865WSW 0.000955 0.000955 0.001910W 0.004776 0.004776WNW 0.002865 0.002865NW 0.000955 0.003820 0.004776NNWN 0.000955 0.001910 0.002865NNE 0.002865 0.002865NE 0.000955 0.000955ENE 0.000955 0.000955EESE 0.000955 0.000955SE 0.000955 0.000955SSE 0.002865 0.002865 0.000955 0.006686S 0.001910 0.001910 0.003820 0.007641SSW 0.000955 0.001910 0.002865SWWSWW 0.002865 0.002865WNW 0.002865 0.001910 0.004776NW 0.003820 0.005731 0.009551NNW 0.000955 0.002865 0.003820
A
B
C
Stability Class
Wind Direction
Wind Speed ( nots) - 4th Quarter 2010Row Total
- 219 -

Ross ISR Project 15 ER Addendum 3.6-B
Table 6. Ross ISR 4th Quarter Joint Frequency Distribution (continued)
3 3 - 6 6 - 10 10 - 16 16 - 21 21N 0.000955 0.000955 0.002865 0.010506 0.004776 0.001910 0.021968NNE 0.000955 0.002865 0.000955 0.004776 0.009551NE 0.003820 0.003820 0.007641ENE 0.000955 0.004776 0.005731E 0.000955 0.000955ESE 0.004776 0.000955 0.005731SE 0.001910 0.001910 0.003820SSE 0.011461 0.024833 0.028653 0.013372 0.009551 0.087870S 0.000955 0.037249 0.049666 0.057307 0.020057 0.004776 0.170010SSW 0.001910 0.024833 0.018147 0.019102 0.003820 0.006686 0.074499SW 0.000955 0.005731 0.008596 0.004776 0.005731 0.025788WSW 0.000955 0.000955 0.002865 0.005731 0.010506W 0.005731 0.022923 0.000955 0.029608WNW 0.000955 0.007641 0.032474 0.012416 0.010506 0.063992NW 0.002865 0.008596 0.037249 0.023878 0.016237 0.088825NNW 0.001910 0.004776 0.032474 0.005731 0.044890N 0.000955 0.009551 0.010506NNE 0.002865 0.002865NE 0.000955 0.002865 0.003820ENE 0.000955 0.000955EESE 0.000955 0.000955 0.001910SE 0.000955 0.001910 0.002865SSE 0.003820 0.003820 0.007641S 0.000955 0.019102 0.017192 0.037249SSW 0.002865 0.010506 0.005731 0.019102SW 0.001910 0.003820 0.005731WSW 0.003820 0.012416 0.016237W 0.002865 0.015282 0.018147WNW 0.000955 0.003820 0.018147 0.022923NW 0.003820 0.012416 0.016237NNW 0.000955 0.003820 0.016237 0.021012N 0.000955 0.001910 0.002865NNE 0.000955 0.000955NE 0.000955 0.000955ENE 0.002865 0.002865E 0.001910 0.001910ESE 0.001910 0.000955 0.002865SE 0.000955 0.001910 0.002865SSE 0.000955 0.002865 0.003820S 0.003820 0.003820 0.007641SSW 0.003820 0.001910 0.005731SW 0.001910 0.001910WSW 0.000955 0.000955 0.001910W 0.000955 0.002865 0.003820WNW 0.000955 0.001910 0.002865NW 0.002865 0.002865NNW 0.001910 0.001910
E
F
D
Stability Class
Wind Direction
Wind Speed ( nots) - 4th Quarter 2010Row Total
- 220 -

Ross ISR Project 16 ER Addendum 3.6-B
Figure 1. Ross ISR Meteorological Summary for 2010 Source: IML (2010)
- 221 -

Ross ISR Project 17 ER Addendum 3.6-B
Figure 2. 2010 Gillette AP Meteorological Summary Sources: IML (2010), WRCC (2010)
- 222 -

Ross ISR Project 18 ER Addendum 3.6-B
Ross ISR Monthly Average Temperatures
0
10
20
30
40
50
60
70
80
1 2 3 4 5 6 7 8 9 10 11 12Month
Tem
p (F
)
Ross ISR (2010)
Buckskin Mine(2000-2009)
Figure 3. Ross ISR (Oshoto) Monthly Average Temperatures
Sources: IML (2009), IML (2010)
- 223 -

Ross ISR Project 19 ER Addendum 3.6-B
2010 Monthly Average Temperatures Ross ISR vs NWS (Gillette AP)
0
10
20
30
40
50
60
70
80
1 2 3 4 5 6 7 8 9 10 11 12Month
Tem
p (F
)
Gillette AP (2010)
Ross ISR (2010)
Figure 4. 2010 Average Monthly Temperatures: Ross ISR vs. Gillette AP
Sources: IML (2010), WRCC (2010)
- 224 -

Ross ISR Project 20 ER Addendum 3.6-B
Ross ISR iurnal Average Temperature by Season
0
10
20
30
40
50
60
70
80
0 4 8 12 16 20 24Hour o ay
Tem
pera
ture
F
Jul-SepApr-JunOct-NovJan-Mar
Figure 5. Ross ISR Diurnal Average Temperatures
Source: IML (2010)
- 225 -

Ross ISR Project 21 ER Addendum 3.6-B
Figure 6. Ross ISR Project Wind Rose
Source: IML (2010)
- 226 -

Figure 7. Ross ISR Monthly Wind Roses: January – April
Source: IML (2010) R
oss ISR
Project 22
ER
Adden
dum
3.6-B
- 227 -

Figure 8. Ross ISR Monthly Wind Roses: May – August
Source: IML (2010) R
oss ISR
Project 23
ER
Adden
dum
3.6-B
- 228 -

Figure 9. Ross ISR Monthly Wind Roses: September – December
Source: IML (2010) R
oss ISR
Project 24
ER
Adden
dum
3.6-B
- 229 -

Ross ISR Project 25 ER Addendum 3.6-B
Figure 10. 2010 Gillette AP Wind Rose
Sources: IML (2010), WRCC (2010)
- 230 -
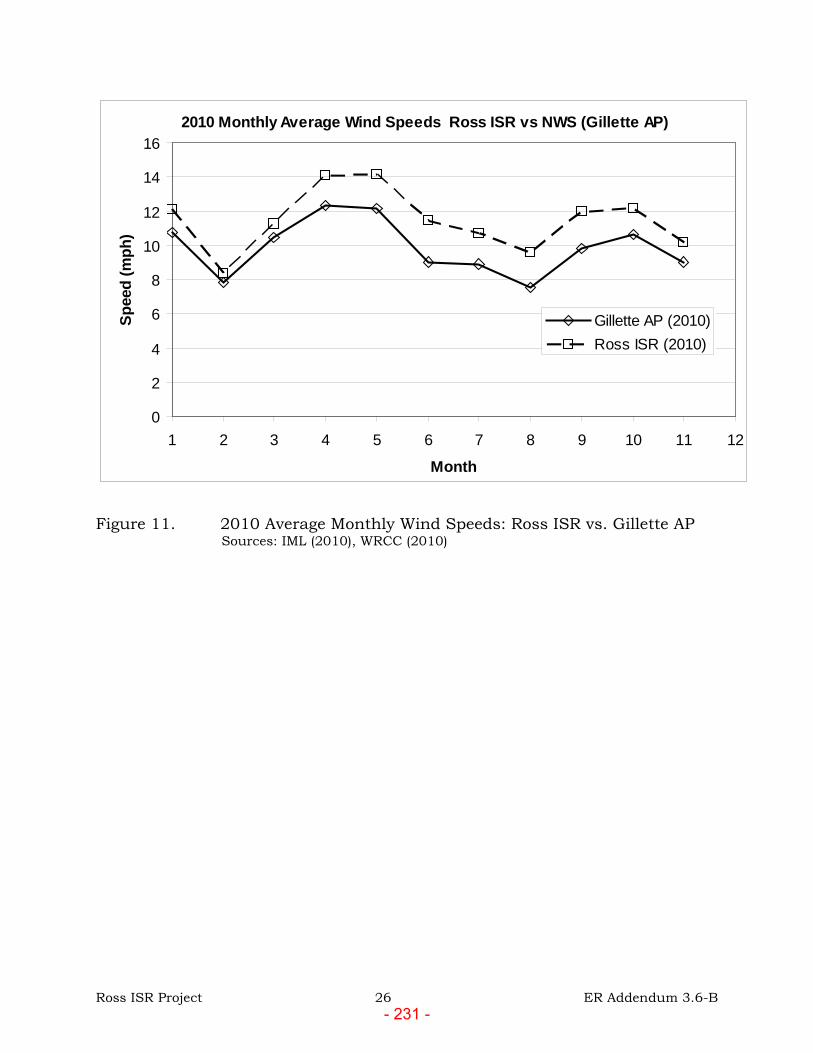
Ross ISR Project 26 ER Addendum 3.6-B
2010 Monthly Average Wind Speeds Ross ISR vs NWS (Gillette AP)
0
2
4
6
8
10
12
14
16
1 2 3 4 5 6 7 8 9 10 11 12Month
Spee
d (m
ph)
Gillette AP (2010)Ross ISR (2010)
Figure 11. 2010 Average Monthly Wind Speeds: Ross ISR vs. Gillette AP
Sources: IML (2010), WRCC (2010)
- 231 -

Ross ISR Project 27 ER Addendum 3.6-B
Ross ISR Monthly Average Wind Speeds
0
2
4
6
8
10
12
14
16
1 2 3 4 5 6 7 8 9 10 11 12Month
Spee
d (m
ph)
Ross ISR (2010)TBNG (2003-2007)
Figure 12. Project Area Monthly Average Wind Speeds
Sources: IML (2010b), WDEQ/AQD (2010)
- 232 -

Ross ISR Project 28 ER Addendum 3.6-B
RRoss ISR
Wind Data Summary
11/5/2010 5:00:00 PM - 11/13/2010 3:00:00 PM
Hourly Data
Average Max MinWind Speed (mph) 11.51 45.63 0.51Sigma Theta (º) 11.93 73.99 0.47Wind Direction
N 12.22 33.04 2.00NNE 11.36 31.68 0.79NE 9.22 22.45 0.68ENE 9.05 24.93 0.94E 6.22 18.25 0.54ESE 5.17 17.13 0.73SE 7.28 25.60 1.41SSE 13.86 35.96 0.98S 11.79 33.36 0.51SSW 8.60 42.43 0.95SW 10.49 45.63 0.53WSW 10.03 34.08 1.19W 11.52 38.01 1.37WNW 13.30 34.23 0.55NW 13.79 35.17 1.26NNW 12.85 40.06 1.18
Predominant wind direction was from the S sector, accounting for 19.6%of the winds, the average wind direction was 223 .
Data Recovery
Possible Reported Recovery(hours) (hours)
Wind Speed 7510 7144 95.13%Sigma Theta 7510 7144 95.13%Wind Direction 7510 7144 95.13%
Figure 13. Ross ISR Wind Summary Source: IML (2010)
- 233 -

Ross ISR Project 29 ER Addendum 3.6-B
Ross ISR Wind Speed Fre uency istribution
0%
10%
20%
30%
40%
50%
60%
70%
80%
90%
100%
0 5 10 15 20 25 30 35 40 45 50mph
umul
ativ
e W
ind
Spee
d Fr
actio
n
0%
2%
4%
6%
8%
10%
12%
14%
16%1 5 2010 4 00 00 PM to 11 13 2010 3 00 00 PM
Win
d Sp
eed
Frac
tion
CumulativeFrequency
Frequency
Figure 14. Ross ISR Wind Speed Frequency Distribution
Source: IML (2010)
- 234 -

Ross ISR Project 30 ER Addendum 3.6-B
RRoss ISR 1st Quarter
Wind Data Summary
11/5/2010 5:00:00 PM - 3/31/2010
Hourly Data
Average Max MinWind Speed (mph) 10.55 43.19 0.51Sigma Theta (º) 10.02 61.91 1.89Wind Direction
N 12.58 23.79 2.47NNE 10.29 20.50 0.79NE 4.68 15.95 0.68ENE 4.29 9.62 0.94E 3.89 7.22 0.54ESE 3.97 8.84 0.73SE 5.67 12.13 2.05SSE 10.23 27.13 0.98S 11.14 29.67 0.51SSW 7.05 26.02 1.10SW 8.36 43.19 0.53WSW 9.52 28.31 1.19W 11.11 24.90 1.48WNW 11.88 32.76 0.55NW 15.34 35.17 1.26NNW 12.16 29.17 2.36
Predominant wind direction was from the S sector, accounting for 25.9%of the winds, the average wind direction was 222 .
Data Recovery
Possible Reported Recovery(hours) (hours)
Wind Speed 2047 2046 99.95%Sigma Theta 2047 2046 99.95%Wind Direction 2047 2046 99.95%
Figure 15. Ross ISR 1st Quarter Wind Summary
Source: IML (2010)
- 235 -

Ross ISR Project 31 ER Addendum 3.6-B
RRoss ISR 2nd Quarter
Wind Data Summary
44/1/2010 - 6/30/2010
Hourly Data
Average Max MinWind Speed (mph) 13.17 45.63 1.36Sigma Theta (º) 11.33 67.89 2.25Wind Direction
N 11.94 28.51 2.00NNE 11.60 27.27 2.31NE 10.51 22.37 3.10ENE 10.50 24.93 1.51E 6.82 18.25 2.00ESE 5.85 17.13 1.58SE 8.08 23.87 2.63SSE 17.18 35.96 1.64S 13.19 33.36 1.83SSW 9.99 42.43 2.68SW 12.56 45.63 1.73WSW 12.34 34.08 1.36W 14.42 38.01 1.37WNW 15.69 34.23 2.97NW 12.37 29.94 3.48NNW 15.12 40.06 2.75
Predominant wind direction was from the SSE sector, accounting for 16.3%of the winds, the average wind direction was 217 .
Data Recovery
Possible Reported Recovery(hours) (hours)
Wind Speed 2184 2015 92.26%Sigma Theta 2184 2015 92.26%Wind Direction 2184 2015 92.26%
Figure 16. Ross ISR 2nd Quarter Wind Summary
Source: IML (2010)
- 236 -

Ross ISR Project 32 ER Addendum 3.6-B
RRoss ISR 3rd Quarter
Wind Data Summary
77/1/2010 - 9/30/2010
Hourly Data
Average Max MinWind Speed (mph) 10.82 37.90 0.95Sigma Theta (º) 15.16 73.99 0.47Wind Direction
N 11.97 33.04 2.68NNE 11.61 31.68 2.44NE 9.20 22.45 1.48ENE 8.69 23.86 1.41E 6.67 16.71 1.40ESE 5.79 14.33 1.32SE 7.81 25.60 1.41SSE 12.64 27.04 1.97S 12.53 30.65 1.60SSW 9.77 37.90 0.95SW 9.62 36.03 1.36WSW 8.64 28.70 2.52W 8.59 17.16 3.00WNW 10.87 24.97 2.03NW 11.66 26.98 2.71NNW 11.11 24.34 1.18
Predominant wind direction was from the S sector, accounting for 16.2%of the winds, the average wind direction was 222 .
Data Recovery
Possible Reported Recovery(hours) (hours)
Wind Speed 2208 2027 91.80%Sigma Theta 2208 2027 91.80%Wind Direction 2208 2027 91.80%
Figure 17. Ross ISR 3rd Quarter Wind Summary Source: IML (2010)
- 237 -

Ross ISR Project 33 ER Addendum 3.6-B
RRoss ISR 4th Quarter
Wind Data Summary
110/1/2010 - 11/13/2010 3:00:00 PM
Hourly Data
Average Max MinWind Speed (mph) 11.55 32.63 1.29Sigma Theta (º) 10.54 56.17 1.59Wind Direction
N 12.79 27.90 3.18NNE 10.26 17.38 1.56NE 9.38 16.26 2.51ENE 9.23 16.11 3.29E 4.60 6.92 2.26ESE 4.62 10.01 1.59SE 5.49 9.66 3.16SSE 12.44 28.47 2.10S 10.45 31.04 1.29SSW 9.33 28.09 2.35SW 12.55 29.99 1.83WSW 8.42 16.24 1.98W 10.16 28.34 3.28WNW 14.03 29.36 3.19NW 15.64 32.63 3.49NNW 12.40 23.33 1.92
Predominant wind direction was from the S sector, accounting for 22.7%of the winds, the average wind direction was 231 .
Data Recovery
Possible Reported Recovery(hours) (hours)
Wind Speed 1071 1056 98.60%Sigma Theta 1071 1056 98.60%Wind Direction 1071 1056 98.60%
Figure 18. Ross ISR 4th Quarter Wind Summary
Source: IML (2010)
- 238 -

Ross ISR Project 34 ER Addendum 3.6-B
Ross ISR iurnal Average Wind Speed by Season
0
2
4
6
8
10
12
14
16
18
0 4 8 12 16 20 24Hour o ay
Win
d Sp
eed
mph
Jan-MarApr-JunJul-SepOct-Nov
Figure 19. Ross ISR (Oshoto) Diurnal Average Wind Speeds
Source: IML (2010)
- 239 -

Ross ISR Project 35 ER Addendum 3.6-B
Ross ISR Monthly Average Precipitation
0
0.5
1
1.5
2
2.5
1 2 3 4 5 6 7 8 9 10 11 12Month
Prec
ip (i
nche
s)
Ross ISR (2010)
Buckskin Mine(2000-2009)
Figure 20. Ross ISR Monthly Precipitation
Sources: IML (2009a), IML (2010)
- 240 -

Ross ISR Project 36 ER Addendum 3.6-B
2010 Monthly Precipitation Ross ISR vs NWS (Gillette AP)
0.000.501.001.502.002.503.003.504.004.505.00
1 2 3 4 5 6 7 8 9 10 11 12Month
Prec
ip (i
nche
s)
Gillette AP
Ross ISR (2010)
Figure 21. 2010 Monthly Precipitation: Ross ISR vs. Gillette AP
Sources: IML (2010), WRCC (2010)
- 241 -

Ross ISR Project 37 ER Addendum 3.6-B
Pan Evaporation Rates
0
2
4
6
8
10
12
April May June July August September October
Month
Inch
es E
vapo
ratio
n
Gillette (1958-1979)Ross ISR (2010)
Figure 22. Ross ISR Monthly Evaporation
Sources: IML (2010), Martner (1986)
- 242 -

Ross ISR Project 38 ER Addendum 3.6-B
Ross ISR Temperatures
0
10
20
30
40
50
60
70
80
90
100
7/1/10 7/3/10 7/5/10 7/7/10 7/9/10 7/11/10 7/13/10 7/15/10
ate
Tem
p (F
)
Air TemperaturePan Water Temp
Figure 23. Ross ISR Typical Evaporation Pan Water Temperature
Correlation Source: IML (2010)
- 243 -

Ross ISR Project 39 ER Addendum 3.6-B
Ross ISR iurnal Average Relative Humidity by Season
0
10
20
30
40
50
60
70
80
90
0 4 8 12 16 20 24Hour o ay
Rel
ativ
e H
umid
ity (
)
WinterSpringSummerFall
Figure 24. Ross ISR Diurnal Average Relative Humidity
Source: IML (2010)
- 244 -

Ross ISR Project 40 ER Addendum 3.6-B
References
IML (Inter-Mountain Laboratories), 201�, Ross ISR Meteorological Database maintained by IML.
, 2009, Northern Powder River Basin Mine Meteorological Database (1986-2009).
Martner, B.E., 1986, Wyoming Climate Atlas, University of Nebraska Press, Lincoln, NE.
WDEQ/AQD (Wyoming Department of Environmental Quality/Air Quality Division), 2010, Wyoming Air Quality Monitoring Network. Available from website on the Internet as of November 2010: <http://www.wyvisnet.com/>
WRCC (Western Regional Climate Center), 2010, Local Climate Data Summaries. Available from website on the Internet as of November 2010: <http://www.wrcc.dri.edu/summary/lcd.html>
- 245 -

ADDENDUM 3.7-A
NOISE STUDY RESULTS
- 246 -

Ross ISR ProjectResults of Noise Study at N-1 Residence
Direction Date Time
Avg. NoiseLevel(dBA)
Max. Noise Level(dBA)
Min. Noise Level(dBA)
WindSpeed(mph)
Wind Direc-tion(°)
AirTemp.
(°F)
2/15/2010 10:23 AM 31.1 37.7 27.72/15/2010 10:23 AM 30.1 32.9 27.52/15/2010 10:24 AM 29.6 32.3 27.02/15/2010 10:24 AM 29.4 32.3 27.12/15/2010 10:25 AM 29.0 32.1 27.12/15/2010 10:25 AM 28.2 30.5 26.9
Avg., max. or min. 29.6 37.7 26.92/15/2010 10:28 AM 28.4 31.4 27.52/15/2010 10:28 AM 29.1 30.0 28.32/15/2010 10:29 AM 29.4 30.5 28.22/15/2010 10:29 AM 28.1 29.3 27.42/15/2010 10:30 AM 29.2 30.7 27.92/15/2010 10:30 AM 29.1 30.9 27.9
Avg., max. or min. 28.9 31.4 27.42/15/2010 10:32 AM 65.9 72.1 49.62/15/2010 10:33 AM 60.4 71.4 37.82/15/2010 10:33 AM 40.0 42.5 36.72/15/2010 10:34 AM 39.8 41.9 37.72/15/2010 10:34 AM 40.6 42.4 38.32/15/2010 10:35 AM 40.3 42.6 36.5
Avg., max. or min. 47.8 72.1 36.52/15/2010 10:46 AM 37.2 51.3 26.92/15/2010 10:47 AM 27.1 28.4 26.72/15/2010 10:47 AM 29.7 32.3 27.62/15/2010 10:48 AM 27.8 29.0 27.32/15/2010 10:48 AM 52.8 61.0 29.02/15/2010 10:49 AM 38.3 45.0 28.0
Avg., max. or min. 35.5 61.0 26.735.4 50.6 29.4
72.1 26.7
Notes:
2) Climatological data were obtained from the Ross ISR MET station.3) Wind direction: 0° is N, 90° is E, 180° is S and 270° is W.
5) The duration of each measurement was 30 seconds.
East
4) Measurements were recorded with a Quest SoundPro DL-2 handheld sound level meter.
North4.5 211.6 10.7
South4.5 211.6 10.7
Overall Average (dBA)Overall Range (dBA)
1) Measurements were recorded near the N-1 (Strong) residence facing each of the four cardinal directions. Refer to ER Figure 3.7-2 for measurement locations.
4.5 211.6 10.7
West4.5 211.6 10.7
Ross ISR Project 1 ER Addendum 3.7-A- 247 -

Ross ISR ProjectResults of Noise Study at N-2 Residence
Direction Date Time
Avg. NoiseLevel(dBA)
Max. Noise Level(dBA)
Min. Noise Level(dBA)
WindSpeed(mph)
Wind Direc-tion(°)
AirTemp.
(°F)
2/15/2010 11:17 AM 40.5 54.7 27.32/15/2010 11:18 AM 27.5 29.1 26.92/15/2010 11:18 AM 37.5 45.1 27.02/15/2010 11:19 AM 41.0 46.4 30.92/15/2010 11:19 AM 36.3 44.8 27.22/15/2010 11:20 AM 37.3 46.8 27.5
Avg., max. or min. 36.7 54.7 26.92/15/2010 11:22 AM 33.2 45.6 28.32/15/2010 11:22 AM 37.7 45.3 29.42/15/2010 11:23 AM 45.7 55.6 34.72/15/2010 11:23 AM 63.9 73.4 30.62/15/2010 11:24 AM 30.5 33.6 28.62/15/2010 11:24 AM 29.7 30.9 28.6
Avg., max. or min. 40.1 73.4 28.32/15/2010 11:26 AM 33.5 43.1 29.42/15/2010 11:26 AM 32.1 35.1 29.52/15/2010 11:27 AM 31.9 34.4 29.42/15/2010 11:27 AM 31.3 34.5 29.62/15/2010 11:28 AM 31.1 32.8 29.92/15/2010 11:28 AM 31.8 35.4 29.6
Avg., max. or min. 32.0 43.1 29.42/15/2010 11:30 AM 41.5 46.0 35.12/15/2010 11:30 AM 58.3 68.8 35.12/15/2010 11:31 AM 45.1 49.8 32.92/15/2010 11:31 AM 33.1 37.0 31.12/15/2010 11:32 AM 35.0 38.4 32.52/15/2010 11:32 AM 32.9 35.7 29.8
Avg., max. or min. 41.0 68.8 29.837.4 60.0 28.6
73.4 26.9
Notes:
2) Climatological data were obtained from the Ross ISR MET station.3) Wind direction: 0° is N, 90° is E, 180° is S and 270° is W.
5) The duration of each measurement was 30 seconds.4) Measurements were recorded with a Quest SoundPro DL-2 handheld sound level meter.
7.7
North3.2 170.9 7.7
South3.2 170.9 7.7
Overall Average (dBA)Overall Range (dBA)
1) Measurements were recorded near the N-2 (Wood) residence facing each of the four cardinal directions. Refer to ER Figure 3.7-2 for measurement locations.
East3.2 170.9 7.7
West3.2 170.9
Ross ISR Project 2 ER Addendum 3.7-A- 248 -

Ross ISR ProjectResults of Noise Study at N-3 Pump Jack
Facing Pump
Jack from Direction Date Time
Avg. NoiseLevel(dBA)
Max. Noise Level(dBA)
Min. Noise Level(dBA)
WindSpeed(mph)
Wind Direc-tion(°)
AirTemp.
(°F)
2/19/2010 11:18 AM 43.6 46.9 40.62/19/2010 11:19 AM 42.6 45.5 39.42/19/2010 11:19 AM 43.6 48.5 39.22/19/2010 11:20 AM 43.0 46.4 39.92/19/2010 11:20 AM 42.2 45.7 39.22/19/2010 11:21 AM 42.4 46.2 39.1
Avg., max. or min. 42.9 48.5 39.12/19/2010 11:23 AM 42.8 48.5 38.62/19/2010 11:23 AM 42.2 46.2 38.92/19/2010 11:24 AM 42.3 47.4 38.82/19/2010 11:24 AM 42.4 46.6 39.22/19/2010 11:25 AM 42.3 46.8 39.22/19/2010 11:25 AM 42.7 47.0 39.0
Avg., max. or min. 42.5 48.5 38.62/19/2010 11:27 AM 43.5 47.4 39.92/19/2010 11:28 AM 43.7 47.9 40.22/19/2010 11:28 AM 43.6 48.1 40.32/19/2010 11:29 AM 43.4 47.3 40.52/19/2010 11:29 AM 44.5 47.8 40.92/19/2010 11:30 AM 44.6 47.7 41.7
Avg., max. or min. 43.9 48.1 39.92/19/2010 11:31 AM 45.0 47.3 41.52/19/2010 11:32 AM 43.2 45.8 40.22/19/2010 11:32 AM 42.7 45.3 40.72/19/2010 11:33 AM 43.2 45.5 41.32/19/2010 11:33 AM 42.7 45.1 39.82/19/2010 11:34 AM 42.3 44.4 39.2
Avg., max. or min. 43.2 47.3 39.243.1 48.1 39.2
48.5 38.6
Notes:
2) Climatological data were obtained from the Ross ISR MET station.3) Wind direction: 0° is N, 90° is E, 180° is S and 270° is W.
5) The duration of each measurement was 30 seconds.4) Measurements were recorded with a Quest SoundPro DL-2 handheld sound level meter.
19.2
North5.0 169.3 19.2
South5.0 169.3 19.2
Overall Average (dBA)Overall Range (dBA)
1) Measurements were recorded a distance of approximately 130 feet from the pump jack, facing the pump jack from each direction.
East5.0 169.3 19.2
West5.0 169.3
Ross ISR Project 3 ER Addendum 3.7-A- 249 -

Ross ISR ProjectResults of Noise Study at N-4 Drill Rigs
Sample Set Date Time
Avg. NoiseLevel(dBA)
Max. Noise Level(dBA)
Min. Noise Level(dBA)
WindSpeed(mph)
Wind Direc-tion(°)
AirTemp.
(°F)
2/19/2010 11:56 AM 43.2 46.9 40.82/19/2010 11:57 AM 45.4 48.3 43.82/19/2010 11:57 AM 44.6 45.3 43.12/19/2010 11:58 AM 43.8 44.4 42.82/19/2010 11:58 AM 44.0 45.0 42.92/19/2010 11:59 AM 43.9 44.6 43.2
Avg., max. or min. 44.2 48.3 40.82/19/2010 12:06 PM 44.3 46.5 43.22/19/2010 12:06 PM 45.3 47.1 42.62/19/2010 12:07 PM 48.9 51.8 44.82/19/2010 12:07 PM 49.4 51.0 48.02/19/2010 12:08 PM 53.3 56.9 50.52/19/2010 12:08 PM 53.6 56.9 49.1
Avg., max. or min. 49.1 56.9 42.62/19/2010 12:34 PM 55.1 59.2 51.62/19/2010 12:34 PM 57.8 59.7 55.32/19/2010 12:35 PM 56.3 58.6 52.92/19/2010 12:35 PM 59.1 61.5 57.02/19/2010 12:36 PM 59.9 61.6 57.32/19/2010 12:36 PM 59.8 62.2 57.4
Avg., max. or min. 58.0 62.2 51.62/19/2010 12:38 PM 58.9 60.9 56.82/19/2010 12:39 PM 58.7 60.9 56.12/19/2010 12:39 PM 58.9 61.2 57.02/19/2010 12:40 PM 58.8 61.4 56.32/19/2010 12:40 PM 57.2 60.4 53.62/19/2010 12:41 PM 56.3 59.4 52.8
Avg., max. or min. 58.1 61.4 52.852.4 57.2 47.0
62.2 40.8
Notes:
2) Climatological data were obtained from the Ross ISR MET station.3) Wind direction: 0° is N, 90° is E, 180° is S and 270° is W.
5) The duration of each measurement was 30 seconds.4) Measurements were recorded with a Quest SoundPro DL-2 handheld sound level meter.
23.7
15.0 169.3 19.2
28.5 208.3 23.7
Overall Average (dBA)Overall Range (dBA)
1) Measurements were recorded a distance of approximately 200 feet from the nearest of two operating exploration drill rigs. All measurements were collected from the same location south of the drill rigs and facing the rigs.
38.5 208.3 23.7
48.5 208.3
Ross ISR Project 4 ER Addendum 3.7-A- 250 -

Ross ISR ProjectResults of 7-Day Noise Study at Strata Field Office
Date and Weekday(Daytime/Nighttime)
TimeInterval
Average Hourly Noise
Level(dBA)
PeakHourly
Noise Level(dBA)
WindSpeed(mph)
Wind Direction
(°)Air Temp.
(°F)
8:00 - 9:00 42.7 83.0 9.1 194.3 14.49:00 - 10:00 45.5 86.5 8.6 176.3 15.510:00 - 11:00 45.1 85.0 10.0 177.1 16.411:00 - 12:00 41.5 82.6 9.4 184.5 17.212:00 - 13:00 41.9 86.2 10.1 173.4 18.713:00 - 14:00 39.9 83.1 9.9 168.4 20.514:00 - 15:00 39.7 83.9 8.7 174.1 22.915:00 - 16:00 38.8 84.3 6.6 170.2 25.816:00 - 17:00 42.6 79.6 2.6 209.8 30.617:00 - 18:00 37.1 88.0 5.7 283.0 33.718:00 - 19:00 37.1 76.3 3.2 103.0 31.119:00 - 20:00 35.9 82.0 3.8 207.6 28.120:00 - 21:00 36.7 74.0 4.2 217.3 27.621:00 - 22:00 33.3 66.0 4.3 195.0 26.6
22:00 - 23:00 35.0 63.9 3.5 220.2 25.5
23:00 - 0:00 32.8 39.3 4.3 187.2 22.90:00 - 1:00 35.3 48.2 7.1 183.2 21.41:00 - 2:00 33.8 45.0 7.9 178.8 19.32:00 - 3:00 35.5 78.5 8.1 183.1 19.23:00 - 4:00 36.9 79.8 9.1 186.2 17.84:00 - 5:00 38.5 84.4 10.3 190.9 17.75:00 - 6:00 39.7 85.7 12.1 189.3 16.16:00 - 7:00 39.9 85.8 12.7 190.5 16.17:00 - 8:00 46.3 83.5 15.2 179.0 16.88:00 - 9:00 45.9 80.5 16.6 180.4 16.39:00 - 10:00 45.5 85.6 15.7 173.5 17.010:00 - 11:00 44.7 83.2 14.9 172.2 19.411:00 - 12:00 42.1 82.1 17.2 177.4 21.912:00 - 13:00 43.9 85.8 12.5 194.8 24.613:00 - 14:00 40.2 81.7 12.7 172.0 28.114:00 - 15:00 37.7 73.9 12.1 164.0 32.215:00 - 16:00 43.6 81.8 9.6 172.3 33.816:00 - 17:00 41.6 84.6 12.4 187.8 33.317:00 - 18:00 38.8 73.4 10.2 178.3 34.118:00 - 19:00 37.0 77.4 15.2 173.0 33.619:00 - 20:00 36.9 70.0 10.0 186.3 31.020:00 - 21:00 36.9 69.5 5.0 185.9 32.021:00 - 22:00 35.2 69.0 3.2 22.3 33.5
2/23/2010Tuesday(Daytime)
2/24/2010Wednesday(Daytime)
2/23/2010Tuesday
(Nighttime)
2/24/2010Wednesday(Nighttime)
Ross ISR Project 5 ER Addendum 3.7-A- 251 -

Ross ISR ProjectResults of 7-Day Noise Study at Strata Field Office
Date and Weekday(Daytime/Nighttime)
TimeInterval
Average Hourly Noise
Level(dBA)
PeakHourly
Noise Level(dBA)
WindSpeed(mph)
Wind Direction
(°)Air Temp.
(°F)
22:00 - 23:00 37.1 68.4 3.0 28.6 30.6
23:00 - 0:00 37.5 46.1 5.6 351.2 31.90:00 - 1:00 37.5 46.1 8.0 329.0 29.01:00 - 2:00 37.8 45.1 9.3 323.6 31.92:00 - 3:00 36.5 46.6 8.9 313.3 32.03:00 - 4:00 35.6 44.9 12.1 289.4 30.94:00 - 5:00 29.3 67.9 14.5 285.3 31.55:00 - 6:00 30.9 65.5 11.5 295.6 30.96:00 - 7:00 34.1 80.0 9.4 294.6 30.87:00 - 8:00 37.7 80.0 12.0 287.8 31.48:00 - 9:00 42.9 84.0 10.5 275.3 31.79:00 - 10:00 44.6 78.6 15.0 273.7 32.110:00 - 11:00 40.9 68.9 16.2 293.6 33.011:00 - 12:00 44.8 78.2 14.9 292.4 34.312:00 - 13:00 39.6 77.9 15.9 285.0 35.313:00 - 14:00 37.4 78.9 16.5 287.9 36.114:00 - 15:00 39.2 87.2 14.9 290.3 36.615:00 - 16:00 38.8 83.2 11.7 302.8 38.116:00 - 17:00 35.2 77.7 13.8 318.3 37.917:00 - 18:00 36.1 80.3 11.0 317.2 37.718:00 - 19:00 35.6 86.0 11.6 315.6 36.919:00 - 20:00 34.5 75.0 9.7 312.3 36.320:00 - 21:00 34.3 52.0 6.7 318.0 35.721:00 - 22:00 33.9 72.1 7.1 303.1 35.0
22:00 - 23:00 33.4 48.6 11.8 276.5 33.9
23:00 - 0:00 34.4 41.3 11.0 271.9 32.70:00 - 1:00 35.1 41.3 11.2 277.4 32.01:00 - 2:00 34.5 40.9 11.4 270.0 30.22:00 - 3:00 32.5 42.6 12.6 268.7 30.03:00 - 4:00 33.6 77.0 14.1 261.9 28.64:00 - 5:00 37.4 84.0 15.3 261.8 28.15:00 - 6:00 36.8 88.3 14.8 261.6 27.86:00 - 7:00 36.7 83.0 13.4 262.7 27.8
2/26/2010Friday
(Nighttime)
2/25/2010Thursday(Daytime)
2/24/2010Wednesday(Nighttime)
2/25/2010Thursday
(Nighttime)
2/25/2010Thursday
(Nighttime)
Ross ISR Project 6 ER Addendum 3.7-A- 252 -

Ross ISR ProjectResults of 7-Day Noise Study at Strata Field Office
Date and Weekday(Daytime/Nighttime)
TimeInterval
Average Hourly Noise
Level(dBA)
PeakHourly
Noise Level(dBA)
WindSpeed(mph)
Wind Direction
(°)Air Temp.
(°F)
7:00 - 8:00 39.2 84.2 12.3 270.4 28.18:00 - 9:00 39.1 83.8 13.2 265.2 27.59:00 - 10:00 35.9 85.1 14.0 271.5 28.610:00 - 11:00 34.4 82.8 12.1 275.5 30.711:00 - 12:00 38.9 82.9 12.0 262.9 32.812:00 - 13:00 39.7 85.4 10.1 276.2 35.513:00 - 14:00 39.6 81.1 6.3 278.4 37.514:00 - 15:00 42.1 80.9 6.2 290.5 39.215:00 - 16:00 40.4 79.0 6.5 281.0 39.716:00 - 17:00 37.0 83.0 4.0 275.7 40.817:00 - 18:00 36.5 77.0 4.2 169.7 38.218:00 - 19:00 38.0 76.1 2.5 178.6 38.819:00 - 20:00 37.2 77.3 2.6 201.5 36.120:00 - 21:00 35.9 80.2 2.5 195.7 34.921:00 - 22:00 33.9 66.6 2.3 136.0 34.1
22:00 - 23:00 35.5 67.5 4.3 177.3 32.0
23:00 - 0:00 33.8 41.9 5.7 200.8 30.00:00 - 1:00 36.7 44.9 6.1 186.1 28.11:00 - 2:00 38.1 45.3 5.3 184.8 26.42:00 - 3:00 35.3 44.2 5.6 166.7 25.13:00 - 4:00 34.2 40.8 8.3 161.2 24.34:00 - 5:00 36.4 44.5 9.6 170.4 25.05:00 - 6:00 36.2 69.2 8.0 149.9 23.66:00 - 7:00 38.0 65.1 15.6 162.2 22.9
2/26/2010Friday
(Nighttime)
2/27/2010Saturday
(Nighttime)
2/26/2010Friday
(Daytime)
Ross ISR Project 7 ER Addendum 3.7-A- 253 -

Ross ISR ProjectResults of 7-Day Noise Study at Strata Field Office
Date and Weekday(Daytime/Nighttime)
TimeInterval
Average Hourly Noise
Level(dBA)
PeakHourly
Noise Level(dBA)
WindSpeed(mph)
Wind Direction
(°)Air Temp.
(°F)
7:00 - 8:00 36.4 85.7 9.0 145.7 22.88:00 - 9:00 39.3 83.2 12.0 165.6 23.29:00 - 10:00 39.7 81.3 7.4 182.3 24.510:00 - 11:00 40.1 77.4 11.3 167.2 25.611:00 - 12:00 44.2 82.9 14.1 167.6 28.112:00 - 13:00 44.5 82.2 18.0 182.2 29.713:00 - 14:00 40.8 81.0 18.7 182.0 32.014:00 - 15:00 40.5 75.1 20.4 168.5 34.215:00 - 16:00 42.4 81.6 21.4 170.4 35.116:00 - 17:00 41.6 77.7 15.9 160.1 36.617:00 - 18:00 36.9 67.4 16.6 166.6 36.818:00 - 19:00 38.5 79.5 17.1 167.3 36.319:00 - 20:00 36.9 70.7 14.4 163.9 35.020:00 - 21:00 37.9 65.3 8.2 159.1 33.321:00 - 22:00 38.4 80.2 5.2 159.4 33.1
22:00 - 23:00 37.1 43.3 11.1 174.5 32.5
23:00 - 0:00 37.1 78.3 10.4 182.2 32.10:00 - 1:00 37.4 43.9 8.5 185.1 32.01:00 - 2:00 34.6 45.2 10.5 160.8 32.82:00 - 3:00 35.5 43.8 12.1 169.1 32.33:00 - 4:00 39.8 48.7 11.5 176.8 33.64:00 - 5:00 36.5 46.3 16.2 165.3 34.45:00 - 6:00 41.4 50.2 19.3 171.3 34.06:00 - 7:00 37.5 43.5 8.0 178.4 32.8
2/27/2010Saturday
(Nighttime)
2/28/2010Sunday
(Nighttime)
2/27/2010Saturday(Daytime)
Ross ISR Project 8 ER Addendum 3.7-A- 254 -

Ross ISR ProjectResults of 7-Day Noise Study at Strata Field Office
Date and Weekday(Daytime/Nighttime)
TimeInterval
Average Hourly Noise
Level(dBA)
PeakHourly
Noise Level(dBA)
WindSpeed(mph)
Wind Direction
(°)Air Temp.
(°F)
7:00 - 8:00 39.5 75.7 15.4 170.9 32.18:00 - 9:00 37.9 75.2 14.0 160.6 31.09:00 - 10:00 41.1 83.4 11.6 161.1 30.110:00 - 11:00 36.4 63.2 9.0 171.1 31.511:00 - 12:00 36.0 75.2 4.2 123.4 31.112:00 - 13:00 39.1 77.6 4.1 73.7 29.513:00 - 14:00 37.6 81.6 2.2 64.5 31.314:00 - 15:00 35.1 71.2 4.1 101.6 32.915:00 - 16:00 35.9 76.2 9.1 163.7 35.116:00 - 17:00 38.2 72.1 9.0 170.3 35.117:00 - 18:00 39.6 76.3 7.3 184.8 34.318:00 - 19:00 36.7 74.5 6.7 162.1 33.119:00 - 20:00 37.1 72.1 6.8 150.2 32.620:00 - 21:00 40.5 66.0 7.9 147.2 31.421:00 - 22:00 40.7 64.4 12.0 166.2 31.3
22:00 - 23:00 40.1 50.6 14.6 192.0 31.4
23:00 - 0:00 38.7 47.4 14.4 192.2 31.10:00 - 1:00 36.2 41.8 14.4 194.5 31.01:00 - 2:00 36.3 42.2 14.8 192.4 30.82:00 - 3:00 37.1 42.1 10.3 215.0 30.83:00 - 4:00 37.8 44.6 8.5 205.1 30.94:00 - 5:00 38.6 80.8 8.1 205.4 30.75:00 - 6:00 38.4 88.0 5.3 183.5 29.56:00 - 7:00 35.0 87.9 4.6 193.5 27.7
3/1/2010Monday
(Nighttime)
2/28/2010Sunday
(Daytime)
2/28/2010Sunday
(Nighttime)
Ross ISR Project 9 ER Addendum 3.7-A- 255 -

Ross ISR ProjectResults of 7-Day Noise Study at Strata Field Office
Date and Weekday(Daytime/Nighttime)
TimeInterval
Average Hourly Noise
Level(dBA)
PeakHourly
Noise Level(dBA)
WindSpeed(mph)
Wind Direction
(°)Air Temp.
(°F)
7:00 - 8:00 39.6 83.3 4.5 164.7 27.18:00 - 9:00 38.6 86.9 5.8 201.6 26.19:00 - 10:00 40.7 82.4 4.0 190.0 28.110:00 - 11:00 39.6 84.7 4.2 196.7 30.811:00 - 12:00 36.9 84.2 5.4 162.3 32.412:00 - 13:00 39.6 82.5 9.3 177.1 32.413:00 - 14:00 36.5 84.0 8.0 179.3 34.014:00 - 15:00 35.6 80.4 6.3 182.1 35.415:00 - 16:00 38.3 81.6 3.7 162.8 36.916:00 - 17:00 40.7 80.4 2.9 161.6 38.417:00 - 18:00 40.5 76.8 2.0 168.8 41.618:00 - 19:00 38.4 81.9 1.2 193.5 42.919:00 - 20:00 34.6 80.0 0.8 22.7 39.720:00 - 21:00 33.2 41.3 1.5 299.9 37.521:00 - 22:00 36.8 66.2 2.3 228.3 36.1
22:00 - 23:00 39.1 80.1 3.3 234.9 35.9
23:00 - 0:00 35.6 60.6 3.5 222.5 36.10:00 - 1:00 35.0 42.6 3.1 192.7 32.61:00 - 2:00 34.7 42.3 4.0 198.1 31.02:00 - 3:00 35.2 62.4 4.5 181.8 28.03:00 - 4:00 35.0 80.2 6.6 193.3 27.84:00 - 5:00 34.4 80.8 7.2 185.4 29.05:00 - 6:00 36.4 83.8 6.3 189.3 28.06:00 - 7:00 36.0 75.7 5.3 200.5 28.6
3/1/2010Monday
(Daytime)
3/1/2010Monday
(Nighttime)
3/2/2010Tuesday
(Nighttime)
Ross ISR Project 10 ER Addendum 3.7-A- 256 -

Ross ISR ProjectResults of 7-Day Noise Study at Strata Field Office
Date and Weekday(Daytime/Nighttime)
TimeInterval
Average Hourly Noise
Level(dBA)
PeakHourly
Noise Level(dBA)
WindSpeed(mph)
Wind Direction
(°)Air Temp.
(°F)
7:00 - 8:00 38.6 70.1 5.4 199.3 29.08:00 - 9:00 38.2 82.9 5.6 204.1 29.29:00 - 10:00 39.5 85.5 3.9 214.0 30.910:00 - 11:00 35.0 83.8 5.6 213.3 32.211:00 - 12:00 40.0 80.3 5.7 195.2 35.512:00 - 13:00 39.4 82.1 4.3 144.6 34.613:00 - 14:00 40.7 82.7 5.3 197.2 36.614:00 - 15:00 37.2 74.4 5.2 184.9 39.215:00 - 16:00 40.7 82.9 3.6 155.6 42.016:00 - 17:00 42.7 84.0 3.3 145.6 43.6
38.0 71.5 9.1 202.3 30.6
Notes:1) Measurements were recorded at the Strata Field Office near Oshoto.2) Climatological data were obtained from the Ross ISR MET station.3) Wind direction: 0° is N, 90° is E, 180° is S and 270° is W.4) Measurements were recorded with a Quest SoundPro DL-2 handheld sound level meter.
6) Daytime hours defined as 7:00 a.m. to 10:00 p.m. per EPA (1974).
Average
7) In ER Table 3.7-4, the noise levels on Tuesday include February 23 and March 2 measurements.
5) The duration of each measurement was 30 seconds. The hourly average and peak noise levels were calculated from all 120 measurements recorded each hour.
3/2/2010Tuesday(Daytime)
Ross ISR Project 11 ER Addendum 3.7-A- 257 -

Ross ISR ProjectResults of 7-Day Noise Study at Strata Field Office
Comparison between Average Hourly Noise Level and Wind Speed
25.0
30.0
35.0
40.0
45.0
50.0
Ave
rage
Hou
rly
Noi
se L
evel
(dB
A)
Comparison between Average Hourly Noise Level and Air Temperature
0.0 5.0 10.0 15.0 20.0 25.0
Average Hourly Wind Speed (mph)
25.0
30.0
35.0
40.0
45.0
50.0
10.0 15.0 20.0 25.0 30.0 35.0 40.0 45.0 50.0
Ave
rage
Hou
rly
Noi
se L
evel
(dB
A)
Average Hourly Air Temperature (°F)Ross ISR Project 12 ER Addendum 3.7-A
- 258 -

ADDENDUM 4.6-A
PRELIMINARY EMISSIONS INVENTORY
- 259 -

TABLE OF CONTENTS
1.0 INTRODUCTION .................................................................................... 1
2.0 EQUIPMENT SUMMARY ........................................................................ 1
3.0 COMBUSTION EMISSIONS .................................................................... 2 3.1 Preliminary Combustion Emission Estimates using
NONROAD2008 .................................................................................. 3 3.2 Preliminary Combustion Emission Estimates using AP-42 .................. 3
4.0 FUGITIVE EMISSIONS ........................................................................... 4
5.0 REFERENCES ..................................................................................... 11
LIST OF TABLES
Table 1. Estimated Power Rating and Operation Hours of Diesel Engine Construction Equipment ............................................... 6
Table 2. EPA NONROAD2008 Emission Factors ..................................... 7 Table 3. Ross ISR Project Combustion Emissions Estimates using
NONROAD2008 Model .............................................................. 8 Table 4. Ross ISR Project Combustion Emissions Estimates using
EPA AP-42 ............................................................................... 9 Table 5. PM10 Fugitive Emissions Estimates for the Proposed Ross
ISR Project ............................................................................. 10
Ross ISR Project i ER Addendum 4.6-A- 260 -

1.0 INTRODUCTION
A preliminary emissions inventory for the proposed Ross ISR Project was completed by Strata to estimate potential combustion and fugitive emissions during each of the four phases (construction, operation, aquifer restoration and decommissioning). Since the greatest source of combustion emissions will be from industrial equipment, Strata did not calculate combustion emissions for passenger vehicles or shipments traveling to and from the site. The following provides an overview of the methods and the results of the preliminary emissions inventory for the proposed project. A final emissions inventory is planned to be completed in February 2011 to accompany the application for the WDEQ Air Quality Permit for the proposed Ross ISR Project.
2.0 EQUIPMENT SUMMARY
The equipment accounted for in the preliminary emissions inventory was based on typical equipment anticipated for the proposed activities (i.e., wellfield drilling, access road construction, etc.). In order to estimate annual hours of operation, specific details of the proposed project were utilized. These included:
1. Area of disturbance associated with wellfields, roads, CPP, etc. (Section 4.1 of the ER)
2. Number of proposed wells (injection, recovery, monitor and deep disposal from Section 3.1 of the TR)
3. Proposed project schedule (Section 1.3 of the ER)
Table 1 provides a summary of the anticipated operating hours and power rating for the equipment during each phase of the project. The make and model of each piece of equipment was based on typical construction equipment, while specific details, such as power rating and gross vehicle weight, were based on manufacturer specifications, when available. Actual equipment used at the Ross ISR Project may differ from that presented in this report; however, combustion and fugitive emissions should not vary significantly.
Ross ISR Project 1 ER Addendum 4.6-A- 261 -

3.0 COMBUSTION EMISSIONS
Combustion emissions were calculated using emission factors obtained from the EPA NONROAD2008 emissions model (EPA 2010a). EPA originally developed the model in 2002 to assist state and local regulatory agencies in developing emission inventories. The model is primarily used to estimate emissions for a specific geographic area over a set period of time. In the case of the proposed Ross ISR Project, the emission factors were used in conjunction with estimated annual operating hours, presented in Table 1, to calculate combustion emissions. Combustion emissions using NONROAD2008 emission factors were calculated using the following equation:
E = Power x LF x A x EF x U
Where: E = Emissions (tons/yr) Power = Power rating (hp) LF = Load factor (fraction of available power) A = Activity (hrs/yr) EF = Emission Factor (g/hp-hr) U = Unit conversion (ton/2000 lb) (lb/453.6 g)
Inputs into the NONROAD2008 model were limited to the diesel sulfur content. In June 2010, the EPA lowered the diesel fuel standard for non-road diesel fuel production from 500 ppm to 15 ppm. The lower sulfur fuel is known as ultra-low sulfur diesel (ULSD) and is required for diesel-powered engines constructed after 2007 to meet EPA’s Tier 4 emission standards. Although older equipment will be capable of burning ULSD, the Tier 4 emissions standards will not apply to pre-2007 diesel engines. To provide a conservatively high estimate of sulfur emissions, a sulfur content of 500 ppm was entered into the model.
Load factors for each piece of equipment were obtained from an EPA guidance document for the NONROAD2008 model (EPA 2010b). Table 2 provides the diesel engine emission factors generated from the NONROAD2008 model for the 2011 calendar year.
Ross ISR Project 2 ER Addendum 4.6-A- 262 -

3.1 Preliminary Combustion Emission Estimates using NONROAD2008
Results of the preliminary combustion emissions inventory are summarized in Table 3. Calculations of emissions by equipment and phase are provided in detail in Appendix A. The emissions presented in the table are meant to provide conservatively high estimates. For example, for the construction phase it was assumed that all proposed construction will be completed within the first year with the exception of the wellfields, which will be developed over three to five years as stated in Section 1.3 of the ER.
Table 3 shows that the construction and decommissioning phases are expected to generate the highest levels of combustion emissions, while operation and aquifer restoration will generate similarly lower combustion emissions. Overall, drilling rigs associated with ISR wellfield development and deep disposal wells are expected to contribute the most (about 40% of the total combustion emissions) during the construction phase.
3.2 Preliminary Combustion Emission Estimates using AP-42
The WDEQ/AQD emission inventory guidance for minor sources (WDEQ/AQD 2010) references EPA AP-42 guidance (EPA 1995) for emission factors associated with construction and heavy equipment. Strata completed a separate emissions inventory to allow comparison between combustion emissions calculated using NONROAD2008 and AP-42 emission factors.
The AP-42 report provides emission factors for various pieces of equipment, sources and activities. Emission factors in AP-42 Chapter 3, Stationary Internal Combustion Sources, were used to estimate emissions during each phase of the project. Engines less than 600 HP utilized emission factors from AP-42 Table 3.3-1, while emission factors for larger engines were obtained from AP-42 Table 3.4-1. Emissions for each pollutant were calculated using the following equations:
E = A x EF x LF x U
Where: E = Emissions (tons/yr) A = Activity (hrs/yr) EF = Emission factor (g/hp-hr) LF = Load factor (fraction of available power) U = Unit conversion (ton/2000 lb) (lb/453.6 g)
Ross ISR Project 3 ER Addendum 4.6-A- 263 -

Strata estimated a 40 percent load factor for all emission calculations. This is believed to be a conservatively high estimate based on actual operation and idle time. The results of the combustion emissions estimates using AP-42 guidance are summarized in Table 4.
A comparison of the two sources (NONROAD2008 and AP-42) indicate similar combustion emissions estimates for CO and CO2, while the AP-42 methods estimates higher emissions of , SO2, PM10 and NOx. The difference in emissions may be attributed to AP-42 basing emission factors from uncontrolled diesel engines, while NONROAD2008 accounts for changes to the sulfur content of fuel and the Tier 4 emission standards.
Overall, the combustion emissions estimated by both sources are expected to be conservatively high since they are based on load factor rather than actual fuel consumption. This was confirmed by a mass balance calculation completed for the drill rigs used for pre-application monitoring. Combustion emissions were calculated using the actual fuel consumption for the drill rigs used during installation of the regional baseline monitor wells, the NONROAD2008 and AP-42 emission factors, and heat content of diesel fuel. Based on similar hours of annual operation the combustion emission were approximately 80 percent lower than those estimated using a load factor. The CO2 and NOx emissions estimated using a drill rig load factor of 0.59 were 2,189 and 23.8 tons/yr, respectively. Using the mass balance method the CO2 emissions were calculated as 452 tons/yr, while NOx emissions were 5 tons/yr. Calculations and assumptions for the mass balance are presented in Appendix B.
4.0 FUGITIVE EMISSIONS
Fugitive particulate matter emissions, as PM10, were estimated for each phase of the project using the following chapters from the EPA AP-42 report:
Chapter 11.9 Western Surface Coal Mining Chapter 13.2.2 Unpaved Roads Chapter 13.2.3 Heavy Construction Equipment Chapter 13.2.4 Aggregate Handling and Storage Piles
The fugitive emissions were calculated based on the operation summarized in Table 1 and the estimated daily travel distance for each piece of equipment. Additionally, during the construction and decommissioning phases, fugitive emissions were also calculated for activities associated with
Ross ISR Project 4 ER Addendum 4.6-A- 264 -

earthwork including construction or reclamation of the wellfields, roads and central plant area. The preliminary fugitive emissions results are summarized in Table 5. Appendix C provides the calculations and assumptions.
Ross ISR Project 5 ER Addendum 4.6-A- 265 -

Table 1. Estimated Power Rating and Operation Hours of Diesel Engine Construction Equipment
Equipment Make/ Model1 HP
Equipment Operation (hrs/yr)
Construction Operation Aquifer Restoration Decommissioning
Cementing unit Unknown 75 4,939 - - 4,360 Drilling rig Unknown 475 13,376 - -
Deep drilling rig Unknown 1,500 3,600 - - Pulling unit SEMCO 75 4,459 1,300 1,300 2,320
Backhoe CAT 420E 101 22,235 1,820 1,820 5,872 Bulldozer CAT D7 235 2,120 - - 2,256
Front end loader CAT 420E 101 1,940 - - 1,144 Grader CAT 140M 183 2,830 520 520 1,892
Roller compactor CAT 815F 253 1,390 - - 585 Scraper CAT 627 330 3,080 - - 3,140
Trackhoe CAT 953D 148 3,030 - - 4,096
Trencher Vermier RTX1250 120 3,540 - - 40
Dump truck Kenworth 260 1,715 - - 1,600
Hydraulic crane Link-Belt RTC-8050 174 560 - - -
Mix truck Kenworth 260 1,410 - - - Semi-haul truck Kenworth 260 3,032 - - 12,488
Water truck Kenworth 260 15,256 520 520 3,888 Disc tractor John Deere 101 760 - - 716
Seed drill tractor John Deere 101 576 - - 475 Forklift CAT RC60 83 5,799 1,040 520 - Manlift Genie S-60X 46 2,000 - - - Picker CAT TL1255 141 1,280 - - -
Skid-steer loader CAT 256C 84 576 - - 1,464 Welding machine Perkins 10 6,909 780 780 -
Air compressor Ingersoll-Rand 25 780 - - -
Generator Wacker Newson GP4000
9 3,789 780 780 6,656
Integrity testing unit Ford 350 6 4,459 3,120 1,560 -
Flat bed truck Ford 450 8 209 - - - Logging truck Ford 350 6 3,344 - - - Pickup truck Ford 350 6 8,919 8,840 5,200 4,000
Swab rig Ford 350 6 - 4,160 2,080 - 1 Typical make/model for anticipated type of equipment. Actual equipment may differ.
Ross ISR Project 6 ER Addendum 4.6-A- 266 -

Table 2. EPA NONROAD2008 Emission Factors
Equipment Emission Factors (g/hp-hr) THC NOx CO PM10 SO2 CO2
Cementing unit 0.4477 4.6024 4.0350 0.6030 0.1822 594.7 Drilling rig 0.3837 5.7681 1.8598 0.3178 0.1600 529.8
Deep drilling rig 0.3198 10.8864 2.4948 0.3175 0.1835 526.2 Pulling unit 0.4477 4.6024 4.0350 0.6030 0.1822 594.7
Backhoe 0.9288 5.9484 3.8524 0.6954 0.1911 623.6 Bulldozer 0.2369 3.1904 1.0992 0.2476 0.1586 536.1
Front end loader 0.9288 5.9484 3.8524 0.6954 0.1911 623.6 Grader 0.2351 3.1595 1.0949 0.2470 0.1585 536.1
Roller compactor 0.2575 3.5428 1.1749 0.2625 0.1595 536.0 Scraper 0.2073 3.8871 1.6115 0.2491 0.1603 536.2
Trackhoe 0.2586 3.3247 1.4265 0.3437 0.1642 536.0 Trencher 0.3251 4.2397 1.6670 0.3611 0.1642 535.8
Dump truck 0.1955 2.5837 1.0311 0.2448 0.1550 536.2 Hydraulic crane 0.2878 4.0041 1.0028 0.2584 0.1624 530.1
Mix truck 0.4352 5.7512 1.6821 0.3270 0.1599 529.7 Semi-haul truck 0.1955 2.5837 1.0311 0.2448 0.1550 536.2
Water truck 0.1955 2.5837 1.0311 0.2448 0.1550 536.2 Disc tractor 0.3213 4.2044 1.6457 0.3590 0.1642 535.8
Seed drill tractor 0.3213 4.2044 1.6457 0.3590 0.1642 535.8 Forklift 2.1962 6.2593 8.1968 1.1762 0.2111 689.0 Manlift 2.1962 6.2593 8.1968 1.1762 0.2111 689.0 Picker 2.1962 6.2593 8.1968 1.1762 0.2111 689.0
Skid-steer loader 1.5859 6.5081 8.1442 1.2687 0.2117 690.9 Welding machine 2.0370 7.2416 10.6755 1.4502 0.2112 689.5 Air compressor 0.3916 4.8088 1.7272 0.3606 0.1806 589.3
Generator 0.9416 6.1520 4.7813 0.7367 0.1800 587.4
Ross ISR Project 7 ER Addendum 4.6-A- 267 -

Table 3. Ross ISR Project Combustion Emissions Estimates using NONROAD2008 Model
Equipment Type Maximum Combustion Emissions (short tons/yr) THC NOx CO PM10 SO2 CO2
Construction 6.32 97.5 36.0 5.9 2.9 9,254 Operation 0.97 12.8 6.6 1.0 0.4 1,445
Aquifer Restoration 0.59 7.8 4.0 0.6 0.3 892 Decommissioning 1.73 21.7 10.3 2.0 1.0 3,441
Ross ISR Project 8 ER Addendum 4.6-A- 268 -

Table 4. Ross ISR Project Combustion Emissions Estimates using EPA AP-42
Equipment Type Combustion Emissions (short tons/yr) TOC NOx CO PM10 SO2 CO2
Construction 13.3 181.8 39.5 11.9 10.8 7,015 Operation 3.1 38.8 8.4 2.8 2.6 1,439
Aquifer Restoration 1.8 22.7 4.9 1.6 1.5 843 Decommissioning 5.1 64.3 13.9 4.6 4.3 2,385
Ross ISR Project 9 ER Addendum 4.6-A- 269 -

Table 5. PM10 Fugitive Emissions Estimates for the Proposed Ross ISR Project
Phase PM10 Emissions (short tons/yr) Construction 171.8 Operation 14.3 Aquifer Restoration 9.8 Decommissioning 82.9
Ross ISR Project 10 ER Addendum 4.6-A- 270 -

5.0 REFERENCES
EPA, 2010a, NONROAD Model. Available from website on the Internet as of November 2010: <http://www.epa.gov/oms/nonrdmdl.htm>
____, 2010b, Median Life, Annual Activity, and Load Factor Values for Nonroad Engine Emissions Modeling, EPA-420-R-10-016.
____, 1995, Compilation of Air Pollutant Emission Factors, Volume I: Stationary Point and Area Sources, AP-42.
WDEQ/AQD (Wyoming Department of Environmental Quality/Air Quality Division), 2010, 2008 Annual Minor Source Inventory. Available from website on the Internet as of November 2010: <http://deq.state.wy.us/aqd/ei.asp>
Ross ISR Project 11 ER Addendum 4.6-A- 271 -

Appendix A
Combustion Emissions Calculations
by Equipment/Phase
Ross ISR Project 12 ER Addendum 4.6-A- 272 -

Ross ISR Project Proposed Equipment Summary and Emission Factors
THC4 NOx CO PM10 SO2 CO2 TOC5 NOx CO PM10 SO2 CO2
Cementing unit 2270002081 Diesel 75 Unknown 20 0.59 0.4477 4.6024 4.0350 0.6030 0.1822 594.7 0.0025 0.031 0.0067 0.0022 0.0021 1.15Drilling rig 2270002033 Diesel 475 Unknown 20 0.59 0.3837 5.7681 1.8598 0.3178 0.1600 529.8 0.0025 0.031 0.0067 0.0022 0.0021 1.15
Deep drilling rig 2270002033 Diesel 1,400 Unknown 43 0.59 0.3198 10.8864 2.4948 0.3175 0.1835 526.2 0.0007 0.024 0.0055 0.0007 0.0004 1.16Pulling unit 2270002081 Diesel 75 SEMCO 8 0.59 0.4477 4.6024 4.0350 0.6030 0.1822 594.7 0.0025 0.031 0.0067 0.0022 0.0021 1.15
Backhoe 2270002066 Diesel 101 CAT 420E 8 0.21 0.9288 5.9484 3.8524 0.6954 0.1911 623.6 0.0025 0.031 0.0067 0.0022 0.0021 1.15Bulldozer 2270002069 Diesel 235 CAT D7 28 0.59 0.2369 3.1904 1.0992 0.2476 0.1586 536.1 0.0025 0.031 0.0067 0.0022 0.0021 1.15
Front end loader 2270002066 Diesel 101 CAT 420E 8 0.21 0.9288 5.9484 3.8524 0.6954 0.1911 623.6 0.0025 0.031 0.0067 0.0022 0.0021 1.15Grader 2270002048 Diesel 183 CAT 140M 18 0.59 0.2351 3.1595 1.0949 0.2470 0.1585 536.1 0.0025 0.031 0.0067 0.0022 0.0021 1.15
Roller compactor 2270002015 Diesel 253 CAT 815F 23 0.59 0.2575 3.5428 1.1749 0.2625 0.1595 536.0 0.0025 0.031 0.0067 0.0022 0.0021 1.15Scraper 2270002018 Diesel 330 CAT 627 41 0.59 0.2073 3.8871 1.6115 0.2491 0.1603 536.2 0.0025 0.031 0.0067 0.0022 0.0021 1.15
Trackhoe 2270002036 Diesel 148 CAT 953D 17 0.59 0.2586 3.3247 1.4265 0.3437 0.1642 536.0 0.0025 0.031 0.0067 0.0022 0.0021 1.15
Trencher 2270002030 Diesel 120 Vermier RTX1250 7 0.59 0.3251 4.2397 1.6670 0.3611 0.1642 535.8 0.0025 0.031 0.0067 0.0022 0.0021 1.15
Dump truck 2270002051 Diesel 260 Kenworth 20 0.59 0.1955 2.5837 1.0311 0.2448 0.1550 536.2 0.0025 0.031 0.0067 0.0022 0.0021 1.15
Hydraulic crane 2270002045 Diesel 174 Link-Belt RTC-8050 36 0.43 0.2878 4.0041 1.0028 0.2584 0.1624 530.1 0.0025 0.031 0.0067 0.0022 0.0021 1.15
Mix truck 2270002042 Diesel 260 Kenworth 20 0.43 0.4352 5.7512 1.6821 0.3270 0.1599 529.7 0.0025 0.031 0.0067 0.0022 0.0021 1.15Semi-haul truck 2270002051 Diesel 260 Kenworth 20 0.59 0.1955 2.5837 1.0311 0.2448 0.1550 536.2 0.0025 0.031 0.0067 0.0022 0.0021 1.15
Water truck 2270002051 Diesel 260 Kenworth 20 0.59 0.1955 2.5837 1.0311 0.2448 0.1550 536.2 0.0025 0.031 0.0067 0.0022 0.0021 1.15Disc tractor 2270002081 Diesel 101 John Deere 4 0.59 0.3213 4.2044 1.6457 0.3590 0.1642 535.8 0.0025 0.031 0.0067 0.0022 0.0021 1.15
Seed drill tractor 2270002081 Diesel 101 John Deere 4 0.59 0.3213 4.2044 1.6457 0.3590 0.1642 535.8 0.0025 0.031 0.0067 0.0022 0.0021 1.15Forklift 2270003020 Diesel 83 CAT RC60 14 0.59 2.1962 6.2593 8.1968 1.1762 0.2111 689.0 0.0025 0.031 0.0067 0.0022 0.0021 1.15Manlift 2270003010 Diesel 46 Genie S-60X 10 0.21 2.1962 6.2593 8.1968 1.1762 0.2111 689.0 0.0025 0.031 0.0067 0.0022 0.0021 1.15Picker 2270003010 Diesel 141 CAT TL1255 18 0.21 2.1962 6.2593 8.1968 1.1762 0.2111 689.0 0.0025 0.031 0.0067 0.0022 0.0021 1.15
Skid-steer loader 2270002072 Diesel 84 CAT 256C 4 0.21 1.5859 6.5081 8.1442 1.2687 0.2117 690.9 0.0025 0.031 0.0067 0.0022 0.0021 1.15Welding machine 2270006025 Diesel 10 Perkins N/A 0.21 2.0370 7.2416 10.6755 1.4502 0.2112 689.5 0.0025 0.031 0.0067 0.0022 0.0021 1.15Air compressor 2270006015 Diesel 25 Ingersoll-Rand N/A 0.43 0.3916 4.8088 1.7272 0.3606 0.1806 589.3 0.0025 0.031 0.0067 0.0022 0.0021 1.15
Generator 2270006005 Diesel 9 Wacker Newson GP4000 N/A 0.43 0.9416 6.1520 4.7813 0.7367 0.1800 587.4 0.0025 0.031 0.0067 0.0022 0.0021 1.15
Integrity testing unit 2270002081 Diesel 350 Ford 350 6 0.12 0.3149 4.8867 2.3447 0.3428 0.1613 535.8 0.0025 0.031 0.0067 0.0022 0.0021 1.15Flat bed truck 2270002081 Diesel 390 Ford 450 8 0.59 0.3149 4.8867 2.3447 0.3428 0.1613 535.8 0.0025 0.031 0.0067 0.0022 0.0021 1.15Logging truck 2270002081 Diesel 350 Ford 350 6 0.12 0.3149 4.8867 2.3447 0.3428 0.1613 535.8 0.0025 0.031 0.0067 0.0022 0.0021 1.15Pickup truck 2270002081 Diesel 350 Ford 350 6 0.59 0.3149 4.8867 2.3447 0.3428 0.1613 535.8 0.0025 0.031 0.0067 0.0022 0.0021 1.15
Swab rig 2270002081 Diesel 350 Ford 350 6 0.12 0.3149 4.8867 2.3447 0.3428 0.1613 535.8 0.0025 0.031 0.0067 0.0022 0.0021 1.15
4 Total hydrocarbon5 Total ogranic carbon
HP Make/Model1GVW (tons)
1 Typical make/model for anticipated type of equipment. Actual equipment may differ.2 Values from EPA's NONROAD2008 Emissions Model (EPA 2010a)3 Values from EPA's AP-42 Table 3.3-1 and Table 3.4-1 (EPA 1995)
Load Factor2
(%)
AP-42 Emission Factors (lb/hp-hr)3NONROAD2008 Emission Factors (g/hp-hr)2Equipment Description
Standard Classification
CodeFuel
Ross IS
R Project
13E
R A
ddendu
m 4.6-A
- 273 -

Ross ISR Project Proposed Equipment Summary and Emission Factors
THC NOx CO PM10 SO2 CO2 TOC NOx CO PM10 SO2 CO2
Cementing Unit 4,939 0.11 1.11 0.97 0.15 0.04 143.3 0.18 2.30 0.49 0.16 0.15 85.2Drilling rig 13,376 1.59 23.83 7.68 1.31 0.66 2,189.3 3.14 39.39 8.49 2.80 2.60 1,461.3
Deep Drilling rig 3,600 1.05 35.68 8.18 1.04 0.60 1,724.7 0.71 24.19 5.54 0.71 0.41 1,169.3Pulling Unit 4,459 0.10 1.00 0.88 0.13 0.04 129.3 0.17 2.07 0.45 0.15 0.14 76.9
Backhoe 22,235 0.48 3.09 2.00 0.36 0.10 324.2 1.11 13.92 3.00 0.99 0.92 516.5Bulldozer 2,120 0.08 1.03 0.36 0.08 0.05 173.7 0.25 3.09 0.67 0.22 0.20 114.6
Front end loader 1,940 0.04 0.27 0.17 0.03 0.01 28.3 0.10 1.21 0.26 0.09 0.08 45.1Grader 2,830 0.08 1.06 0.37 0.08 0.05 180.6 0.26 3.21 0.69 0.23 0.21 119.1
Roller compactor 1,390 0.06 0.81 0.27 0.06 0.04 122.6 0.17 2.18 0.47 0.15 0.14 80.9Scraper 3,080 0.14 2.57 1.07 0.16 0.11 354.4 0.50 6.30 1.36 0.45 0.42 233.8
Trackhoe 3,030 0.08 0.97 0.42 0.10 0.05 156.3 0.22 2.78 0.60 0.20 0.18 103.1Trencher 3,540 0.09 1.17 0.46 0.10 0.05 148.0 0.21 2.63 0.57 0.19 0.17 97.7
Dump truck 1,715 0.06 0.75 0.30 0.07 0.04 155.5 0.22 2.76 0.60 0.20 0.18 102.5Hydraulic crane 560 0.01 0.18 0.05 0.01 0.01 24.5 0.05 0.60 0.13 0.04 0.04 22.4
Mix truck 1,410 0.08 1.00 0.29 0.06 0.03 92.0 0.18 2.27 0.49 0.16 0.15 84.3Semi-haul truck 3,032 0.10 1.32 0.53 0.13 0.08 274.9 0.39 4.89 1.05 0.35 0.32 181.3
Water truck 15,256 0.50 6.67 2.66 0.63 0.40 1,383.2 1.96 24.59 5.30 1.75 1.63 912.3Disc tractor 760 0.02 0.21 0.08 0.02 0.01 26.7 0.04 0.48 0.10 0.03 0.03 17.7
Seed drill tractor 576 0.01 0.16 0.06 0.01 0.01 20.3 0.03 0.36 0.08 0.03 0.02 13.4Forklift 5,799 0.69 1.96 2.57 0.37 0.07 215.7 0.24 2.98 0.64 0.21 0.20 110.7Manlift 2,000 0.05 0.13 0.17 0.03 0.00 14.7 0.05 0.57 0.12 0.04 0.04 21.2Picker 1,280 0.09 0.26 0.34 0.05 0.01 28.8 0.09 1.12 0.24 0.08 0.07 41.5
Skid-steer loader 576 0.02 0.07 0.09 0.01 0.00 7.7 0.02 0.30 0.06 0.02 0.02 11.1Welding machine 6,909 0.03 0.12 0.17 0.02 0.00 11.0 0.03 0.43 0.09 0.03 0.03 15.9Air compressor 780 0.00 0.04 0.02 0.00 0.00 5.4 0.01 0.12 0.03 0.01 0.01 4.5
Generator 3,789 0.02 0.10 0.08 0.01 0.00 9.5 0.02 0.21 0.05 0.02 0.01 7.8Integrity testing unit 4,459 0.07 1.01 0.48 0.07 0.03 110.6 0.77 9.68 2.08 0.69 0.64 358.9
Flat bed truck 209 0.02 0.26 0.12 0.02 0.01 28.4 0.04 0.51 0.11 0.04 0.03 18.7Logging truck 3,344 0.05 0.76 0.36 0.05 0.02 83.0 0.58 7.26 1.56 0.51 0.48 269.2Pickup truck 8,919 0.64 9.92 4.76 0.70 0.33 1,087.8 1.54 19.35 4.17 1.37 1.28 718.0
TOTAL 6.32 97.53 35.96 5.87 2.85 9,254.3 13.27 181.77 39.50 11.89 10.83 7,014.91 Combustion emissions calculated using EPA NONROAD2008 Emission Factors2 Combustion emissions calculated using AP-42, Table 3.3-1 and Table 3.4-1 emission factors and 40% load factor
NONROAD2008 Combustion Emissions (tons/yr)1Total Operating
HoursEquipment Type
AP-42 Combustion Emissions (tons/yr)2
Ross IS
R Project
14E
R A
ddendu
m 4.6-A
- 274 -

Ross ISR Project Proposed Equipment Summary and Emission Factors
THC NOx CO PM10 SO2 CO2 TOC NOx CO PM10 SO2 CO2
Pulling unit 1,300 0.03 0.29 0.26 0.04 0.01 37.7 0.05 0.60 0.13 0.04 0.04 22.4Backhoe 1,820 0.04 0.25 0.16 0.03 0.01 26.5 0.09 1.14 0.25 0.08 0.08 42.3Grader 520 0.01 0.20 0.07 0.02 0.01 33.2 0.05 0.59 0.13 0.04 0.04 21.9
Water truck 520 0.02 0.23 0.09 0.02 0.01 47.1 0.07 0.84 0.18 0.06 0.06 31.1Forklift 1,040 0.12 0.35 0.46 0.07 0.01 38.7 0.04 0.54 0.12 0.04 0.04 19.9
Welding machine 780 0.00 0.01 0.02 0.00 0.00 1.2 0.00 0.05 0.01 0.00 0.00 1.8Generator 780 0.00 0.02 0.02 0.00 0.00 2.0 0.00 0.04 0.01 0.00 0.00 1.6
Integrity testing unit 3,120 0.05 0.71 0.34 0.05 0.02 77.4 0.54 6.77 1.46 0.48 0.45 251.2Pickup truck 8,840 0.63 9.83 4.72 0.69 0.32 1,078.2 1.53 19.18 4.13 1.36 1.27 711.6
Swab rig 4,160 0.06 0.94 0.45 0.07 0.03 103.2 0.72 9.03 1.95 0.64 0.60 334.9TOTAL 0.97 12.83 6.58 0.98 0.43 1,445.2 3.09 38.78 8.36 2.75 2.56 1,438.6
1 Combustion emissions calculated using EPA NONROAD2008 Emission Factors2 Combustion emissions calculated using AP-42, Table 3.3-1 and Table 3.4-1 emission factors and 40% load factor
Equipment Type
Total Operating
Hours
NONROAD2008 Combustion Emissions (tons/yr)1 AP-42 Combustion Emissions (tons/yr)2
Ross IS
R Project
15E
R A
ddendu
m 4.6-A
- 275 -

Ross ISR Project Proposed Equipment Summary and Emission Factors
THC NOx CO PM10 SO2 CO2 TOC NOx CO PM10 SO2 CO2
Pulling unit 1,300 0.03 0.29 0.26 0.04 0.01 37.7 0.05 0.60 0.13 0.04 0.04 22.4Backhoe 1,820 0.04 0.25 0.16 0.03 0.01 26.5 0.09 1.14 0.25 0.08 0.08 42.3Grader 520 0.01 0.20 0.07 0.02 0.01 33.2 0.05 0.59 0.13 0.04 0.04 21.9
Water truck 520 0.02 0.23 0.09 0.02 0.01 47.1 0.07 0.84 0.18 0.06 0.06 31.1Forklift 520 0.06 0.18 0.23 0.03 0.01 19.3 0.02 0.27 0.06 0.02 0.02 9.9
Welding machine 780 0.00 0.01 0.02 0.00 0.00 1.2 0.00 0.05 0.01 0.00 0.00 1.8Generator 780 0.00 0.02 0.02 0.00 0.00 2.0 0.00 0.04 0.01 0.00 0.00 1.6
Integrity testing unit 1,560 0.02 0.35 0.17 0.02 0.01 38.7 0.27 3.39 0.73 0.24 0.22 125.6Pickup truck 5,200 0.37 5.78 2.78 0.41 0.19 634.2 0.90 11.28 2.43 0.80 0.75 418.6
Swab rig 2,080 0.03 0.47 0.23 0.03 0.02 51.6 0.36 4.51 0.97 0.32 0.30 167.4TOTAL 0.59 7.78 4.01 0.61 0.27 891.6 1.8 22.7 4.9 1.61 1.50 842.6
1 Combustion emissions calculated using EPA NONROAD2008 Emission Factors2 Combustion emissions calculated using AP-42, Table 3.3-1 and Table 3.4-1 emission factors and 40% load factor
Equipment Type
Total Operating
Hours
NONROAD2008 Combustion Emissions (tons/yr)1 AP-42 Combustion Emissions (tons/yr)2
Ross IS
R Project
16E
R A
ddendu
m 4.6-A
- 276 -

Ross ISR Project Proposed Equipment Summary and Emission Factors
THC NOx CO PM10 SO2 CO2 TOC NOx CO PM10 SO2 CO2
Cementing unit 4,360 0.10 0.98 0.86 0.13 0.04 126.5 0.16 2.03 0.44 0.14 0.13 75.2Pulling unit 2,320 0.05 0.52 0.46 0.07 0.02 67.3 0.09 1.08 0.23 0.08 0.07 40.0
Backhoe 5,872 0.13 0.82 0.53 0.10 0.03 85.6 0.29 3.68 0.79 0.26 0.24 136.4Bulldozer 2,256 0.08 1.10 0.38 0.09 0.05 184.8 0.26 3.29 0.71 0.23 0.22 121.9Grader 1,892 0.05 0.71 0.25 0.06 0.04 120.7 0.17 2.15 0.46 0.15 0.14 79.6
Roller compactor 585 0.02 0.34 0.11 0.03 0.02 51.6 0.07 0.92 0.20 0.07 0.06 34.1Scraper 3,140 0.14 2.62 1.09 0.17 0.11 361.3 0.51 6.42 1.38 0.46 0.42 238.3
Trackhoe 4,096 0.10 1.31 0.56 0.14 0.06 211.3 0.30 3.76 0.81 0.27 0.25 139.4Semi-haul truck 12,488 0.41 5.46 2.18 0.52 0.33 1,132.3 1.60 20.13 4.34 1.43 1.33 746.8
Water truck 3,888 0.13 1.70 0.68 0.16 0.10 352.5 0.50 6.27 1.35 0.44 0.41 232.5Disc tractor 716 0.02 0.20 0.08 0.02 0.01 25.2 0.04 0.45 0.10 0.03 0.03 16.6
Seed drill tractor 475 0.01 0.13 0.05 0.01 0.01 16.7 0.02 0.30 0.06 0.02 0.02 11.0Skid-steer loader 1,464 0.05 0.19 0.23 0.04 0.01 19.7 0.06 0.76 0.16 0.05 0.05 28.3
Generator 6,656 0.03 0.17 0.14 0.02 0.01 16.7 0.03 0.37 0.08 0.03 0.02 13.8Pickup truck 4,000 0.29 4.45 2.13 0.31 0.15 487.9 0.69 8.68 1.87 0.62 0.57 322.0
TOTAL 1.73 21.72 10.32 1.95 1.02 3,441.3 5.1 64.3 13.9 4.56 4.25 2,385.01 Combustion emissions calculated using EPA NONROAD2008 Emission Factors2 Combustion emissions calculated using AP-42, Table 3.3-1 and Table 3.4-1 emission factors and 40% load factor
Equipment Type
Total Operating
Hours
NONROAD2008 Combustion Emissions (tons/yr)1 AP-42 Combustion Emissions (tons/yr)2
Ross IS
R Project
17E
R A
ddendu
m 4.6-A
- 277 -

Appendix B
Combustion Emissions
Alternate Calculations for Drill Rigs
Ross ISR Project 18 ER Addendum 4.6-A- 278 -

Ross ISR Project Proposed Equipment Summary and Emission Factors
Assumptions1400-1600 injection/recovery wells
140-200 monitor wells1740 wells (average)580 wells per year (3 years of construction)12 drilling rigs23 hrs/well Average drilling time per well1
13,376 hrs/yr3 gal/hr Fuel consumption2
40,128 gal/yr Annual fuel use137,000 btu/gal Heat content of diesel fuel
Pollutant
AP-42 Emission Factor1
(lb/MMBtu)
NONROAD2008 Emission Factor
for Drill Rig (lb/MMBtu)
AP-42 Emissions (tons/yr)
NONROAD2008 Emissions (tons/yr)
NOx 4.41 1.79 12.12 4.92
CO 0.95 0.58 2.61 1.59
SO2 0.29 0.05 0.80 0.14
PM10 0.31 0.10 0.85 0.27
CO2 164 164.55 450.8 452.30
THC - 0.12 - 0.33
TOC 0.35 - 0.96 -1 Based on installation of regional baseline monitor wells
3 Uncontrolled Diesel Industrial Engines (EPA AP-42)
2 Personal communication between R. Taylor, Kid Pronghorn and B. Kelly, WWC Engineering, December 1, 2010.
Ross IS
R Project
19E
R A
ddendu
m 4.6-A
- 279 -

Appendix C
Fugitive Emission Calculations
Ross ISR Project 20 ER Addendum 4.6-A- 280 -

Ross ISR Project Proposed Equipment Summary and Emission Factors
Inputs:CPP Area Material Moisture Content (%) - Overburden 11.7 Ross 2010 Soil SurveyCPP Area Material Moisture Content (%) - Topsoil 9.8 Ross 2010 Soil SurveyCPP Area Material Silt Content (%) - Overburden 39.8 Ross 2010 Soil SurveyCPP Area Material Silt Content (%) - Topsoil 38.6 Ross 2010 Soil SurveyMean Vehicle Speed (mph) 5 WWC EstimateWellfield Material Moisture Content (%) - Overburden 9.5 Ross 2010 Soil SurveyWellfield Material Moisture Content (%) - Topsoil 8.1 Ross 2010 Soil SurveyWellfield Material Silt Content (%) - Overburden 29 Ross 2010 Soil SurveyWellfield Material Silt Content (%) - Topsoil 23.8 Ross 2010 Soil SurveyAverage Wind Speed (mph) 11.5 IML (1/5-11/13/10)Scraper Mean Vehicle Weight (tons) 41 CAT Spec SheetRoad Base Material Moisture Content (%) 15 WWC Estimate
Site Preparation Central Plant Area
<10 μm <2.5 μmBulldozing Overburden (Table 11.9-1) lb/hr 19.37 8.02 0.52 0.03 4.17 0.58 -1/-2Scrapers unloading topsoil (13.2.4) lb/ton 0.0008 0.0005 0.0010 0.0006 0.0002 -1Scrapers in travel (13.2.2 Eqn 1a) lb/VMT 15.62 4.76 0.48 -0/-1Scrapers removing topsoil (Table 13.2.3-1) lb/VMT 20.20 ETruck dumping of fill material, road base, or other material (13.2.4) lb/ton 0.0012 0.0008 0.0006 0.0003 0.0001 -0/-1Compacting (Table 11.9-1) lb/hr 19.37 8.02 0.52 0.03 4.17 0.58 -1/-2Motor grading (11.9-1) lb/VMT 2.24 1.28 0.60 0.03 0.77 0.07 -1/-2VMT - vehicle mile traveled
Site Preparation Wellfield
<10 μm <2.5 μmBulldozing Overburden (Table 11.9-1) lb/hr 17.37 6.68 0.52 0.03 3.47 0.52 -1/-2Scrapers unloading topsoil (13.2.4) lb/ton 0.0029 0.0019 0.0014 0.0008 0.0002 -1Scrapers in travel (13.2.2 Eqn 1a) lb/VMT 13.50 3.94 0.39 -0/-1Scrapers removing topsoil (Table 13.2.3-1) lb/VMT 20.20 ETruck dumping of fill material, road base, or other material (13.2.4) lb/ton 0.0012 0.0008 0.0006 0.0003 0.0001 -0/-1Compacting (Table 11.9-1) lb/hr 17.37 6.68 0.52 0.03 3.47 0.52 -1/-2Motor grading (11.9-1) lb/VMT 2.24 1.28 0.60 0.03 0.77 0.07 -1/-2VMT - vehicle mile traveled
Activity <10 μm <2.5 μm<5 μm
ActivityTSP
<30 μm < 15 μm <10 μm <5 μmScaling Factor
Rating Adjustment (Table 13.2.3-1)
<2.5 μmRating Adjustment
(Table 13.2.3-1)
TSP <30 μm < 15 μm
Scaling Factor
Ross IS
R Project
21E
R A
ddendu
m 4.6-A
- 281 -

Ross ISR Project Proposed Equipment Summary and Emission Factors
Vehicles Traveling Unpaved Roads (AP-42, 13.2.2 Eqn 1a)Unpaved Surfaces at Industrial Sites, lb/VMT
PM2.5 PM10 PM30
Backhoe 8 0.516027 5.16027 14.1297Bulldozer 28 0.906782 9.06782 24.8293Cementing unit 20 0.779373 7.79373 21.3406Disc tractor 4 0.377754 3.77754 10.3436Drilling rig 20 0.779373 7.79373 21.3406Dump truck 20 0.779373 7.79373 21.3406Forklift 14 0.663803 6.63803 18.1761Front end loader 8 0.516027 5.16027 14.1297Grader 18 0.743283 7.43283 20.3524Hydraulic crane 36 1.015355 10.1535 27.8022Manlift 10 0.570534 5.70534 15.6222Mix truck 20 0.779373 7.79373 21.3406Picker 18 0.743283 7.43283 20.3524Pulling unit 8 0.516027 5.16027 14.1297Roller compactor 23 0.829964 8.29964 22.7259Scraper 41 1.076551 10.7655 29.4779Seed drill tractor 4 0.377754 3.77754 10.3436Semi-haul truck 20 0.779373 7.79373 21.3406Skid-steer loader 4 0.377754 3.77754 10.3436Trackhoe 17 0.724409 7.24409 19.8356Trencher 7 0.485932 4.85932 13.3057Water truck 20 0.779373 7.79373 21.3406
Vehicles Traveling Unpaved Roads (AP-42, 13.2.2 Eqn 1b) - Light Duty VehiclesUnpaved Surfaces on Publicly Accessible Roads, lb/VMT
Surface silt content (%) 23.8 Ross 2010 Soil SurveySurface moisture content (%) 11 EstimateSpeed Limit (mph) 15 Planned
PM2.5 PM10 PM30
Light duty vehicle 0.1356806 1.359936 3.82347Equipment
Emission Factor (lb/VMT)
Equipment
Emission Factor (lb/VMT)Mean
Vehicle Weight (tons)
Ross IS
R Project
22E
R A
ddendu
m 4.6-A
- 282 -

Ross ISR Project Proposed Equipment Summary and Emission Factors
Construction Phase Estimated Total Fugitive PM10 Emissions 171.80 tons/yr
Heavy Construction Operations (AP-42) Fugitive Emissions from Vehicles Traveling Unpaved Roads (AP-42 13.2.2 Eqn 1a)
Activity
Site Preparation
Central Plant Area
Wellfield and Roads
Preparation Equipment1
PM10 Emission
Factor (lb/VMT)
Est Max Distance Traveled (mi/day)
Equipment Operating
Days (days/yr)
VMT (mi/yr)PM10
Emissions (tons/yr)
Emission Factor (lb/hr) 4.17 3.47 Cementing unit 7.79 0.5 617 309 0.60Activity (hr/yr) 680 2,080 Drilling rig 7.79 0.5 1,672 836 1.63Control Efficiency (%)1 50 50 Pulling unit 5.16 0.5 557 279 0.36PM10 Emissions (tons/yr) 0.71 1.81 Backhoe 5.16 3 2,779 8,338 10.76Emission Factor (lb/ton) 0.0010 0.0014 Bulldozer 9.07 5 265 1,325 3.00Area (ac/yr) 55 160 Front end loader 5.16 5 243 1,213 1.56Stripping Depth (ft) 2 2 Grader 7.43 20 354 7,075 13.15Topsoil (CY/yr) 177,467 516,267 Roller compactor 8.30 10 174 1,738 3.61Density of Topsoil (tons/CY) 1.25 1.25 Trackhoe 7.24 2 379 758 1.37Control Efficiency (%)1 50 50 Trencher 4.86 2 443 885 1.08PM10 Emissions (tons/yr) 0.06 0.22 Dump truck 7.79 15 214 3,215 6.26Emission Factor (lb/VMT) 4.76 3.94 Hydraulic crane 10.15 0.2 70 14 0.04Scraper VMT (mi/day) 15 15 Mix truck 7.79 2 176 353 0.69Scraper Operation (day/yr) 200 185 Semi-haul truck 7.79 15 379 5,685 11.08Control Efficiency (%)1 50 50 Water truck 7.79 20 1,907 38,140 74.31PM10 Emissions (tons/yr) 3.57 2.74 Disc tractor 3.78 10 95 950 0.90Emission Factor (lb/VMT) 20.2 20.2 Seed drill tractor 3.78 10 72 720 0.68Scraper VMT (mi/day) 5 5 Forklift 6.64 0.5 725 362 0.60Scraper Operation (day/yr)2 200 185 Manlift 5.71 0.25 250 63 0.09Control Efficiency (%)1 50 50 Picker 7.43 0.25 160 40 0.07PM10 Emissions (tons/yr) 5.05 4.67 Skid-steer loader 3.78 5 72 360 0.34Emission Factor (lb/ton) 0.0006 0.0006 Integrity testing unit 1.36 1 557 557 0.19Aggregate Material (CY) 2,800 16,000 Flat bed truck 1.36 10 26 261 0.09Material Density (tons/CY) 1.5 1.5 Logging truck 1.36 5 418 2,090 0.71Control Efficiency (%)1 50 50 Pickup truck 1.36 25 1,115 27,871 9.48PM10 Emissions (tons/yr) 1.20 6.87 142.64Emission Factor (lb/hr) 4.17 3.47 1 Scraper not included, accounted for in Heavy Construction Operations Fugitive Emissions Activity (hr/yr) 910 480Control Efficiency (%)1 50 50PM10 Emissions (tons/yr) 0.95 0.42Emission Factor (lb/hr) 0.77 0.77Activity (hr/yr) 790 3,960Control Efficiency (%)1 50 50PM10 Emissions (tons/yr) 0.15 0.76
11.69 17.481 Assume 50% control efficiency2 Based on 8 hr work days
Vehichle Traveling Unpaved Roads Fugitive PM10 Emissions (tons/yr)
Truck Dumping Fill Material
Compacting
Grading
Heavy Contstruction Fugitvie PM10 Emissions (tons/yr)
Bulldozing
Scraper Unloading Topsoil
Scrapers in Travel
Scrapers Removing Topsoil
Ross IS
R Project
23E
R A
ddendu
m 4.6-A
- 283 -

Ross ISR Project Proposed Equipment Summary and Emission Factors
Operation Phase Total Estimated Fugitive PM10 Emissions 14.29 tons/yr
Fugitive Emissions from Vehicles Traveling Unpaved Roads (AP-42 13.2.2 Eqn 1a)
Equipment
PM10 Emission
Factor (lb/VMT)
Est Max Distance Traveled (mi/day)
Annual Operation1
(hrs/yr)
Activity (mi/yr)
PM10 Emissions (tons/yr)
Pulling unit 5.16 5 1,300 813 1.05Backhoe 5.16 5 1,820 1,138 1.47Grader 7.43 5 520 325 0.60Water truck 7.79 20 520 1,300 2.53Forklift 6.64 0.5 1,040 65 0.11Integrity testing unit 1.36 1 3,120 390 0.13Pickup truck 1.36 20 8,840 22,100 7.51Swab rig 1.36 5 4,160 2,600 0.88
14.291 Based on 8 hr work daysVehichle Traveling Unpaved Roads Fugitive PM10 Emissions (tons/yr)
Ross IS
R Project
24E
R A
ddendu
m 4.6-A
- 284 -

Ross ISR Project Proposed Equipment Summary and Emission Factors
Aquifer Restoration Phase Total Estimated Fugitive PM10 Emissions 9.80 tons/yr
Fugitive Emissions from Vehicles Traveling Unpaved Roads (AP-42 13.2.2 Eqn 1a)
Equipment
PM10
Emission Factor
(lb/VMT)
Est Max Distance Traveled (mi/day)
Annual Operation1
(hrs/yr)
Activity (mi/yr)
PM10 Emissions (tons/yr)
Pulling unit 5.16 1 1,300 163 0.21Backhoe 5.16 5 1,820 1,138 1.47Grader 7.43 5 520 325 0.60Water truck 7.79 20 520 1,300 2.53Forklift 6.64 0.5 520 33 0.05Integrity testing unit 1.36 1 1,560 195 0.07Pickup truck 1.36 20 5,200 13,000 4.42Swab rig 1.36 5 2,080 1,300 0.44
9.801 Based on 8 hr work daysVehichle Traveling Unpaved Roads Fugitive PM10 Emissions (tons/yr)
Ross IS
R Project
25E
R A
ddendu
m 4.6-A
- 285 -
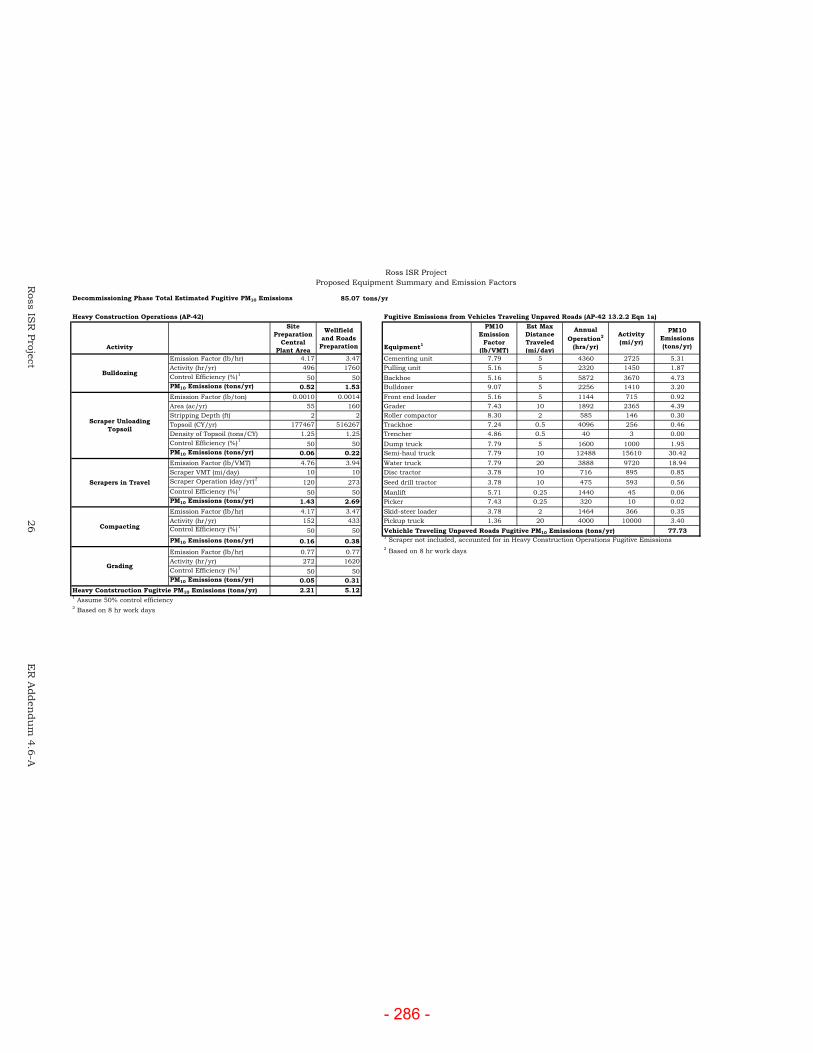
Ross ISR Project Proposed Equipment Summary and Emission Factors
Decommissioning Phase Total Estimated Fugitive PM10 Emissions 85.07 tons/yr
Heavy Construction Operations (AP-42) Fugitive Emissions from Vehicles Traveling Unpaved Roads (AP-42 13.2.2 Eqn 1a)
Activity
Site Preparation
Central Plant Area
Wellfield and Roads
Preparation Equipment1
PM10 Emission
Factor (lb/VMT)
Est Max Distance Traveled (mi/day)
Annual Operation2
(hrs/yr)
Activity (mi/yr)
PM10 Emissions (tons/yr)
Emission Factor (lb/hr) 4.17 3.47 Cementing unit 7.79 5 4360 2725 5.31Activity (hr/yr) 496 1760 Pulling unit 5.16 5 2320 1450 1.87Control Efficiency (%)1 50 50 Backhoe 5.16 5 5872 3670 4.73PM10 Emissions (tons/yr) 0.52 1.53 Bulldozer 9.07 5 2256 1410 3.20Emission Factor (lb/ton) 0.0010 0.0014 Front end loader 5.16 5 1144 715 0.92Area (ac/yr) 55 160 Grader 7.43 10 1892 2365 4.39Stripping Depth (ft) 2 2 Roller compactor 8.30 2 585 146 0.30Topsoil (CY/yr) 177467 516267 Trackhoe 7.24 0.5 4096 256 0.46Density of Topsoil (tons/CY) 1.25 1.25 Trencher 4.86 0.5 40 3 0.00Control Efficiency (%)1 50 50 Dump truck 7.79 5 1600 1000 1.95PM10 Emissions (tons/yr) 0.06 0.22 Semi-haul truck 7.79 10 12488 15610 30.42Emission Factor (lb/VMT) 4.76 3.94 Water truck 7.79 20 3888 9720 18.94Scraper VMT (mi/day) 10 10 Disc tractor 3.78 10 716 895 0.85Scraper Operation (day/yr)2 120 273 Seed drill tractor 3.78 10 475 593 0.56Control Efficiency (%)1 50 50 Manlift 5.71 0.25 1440 45 0.06PM10 Emissions (tons/yr) 1.43 2.69 Picker 7.43 0.25 320 10 0.02Emission Factor (lb/hr) 4.17 3.47 Skid-steer loader 3.78 2 1464 366 0.35Activity (hr/yr) 152 433 Pickup truck 1.36 20 4000 10000 3.40Control Efficiency (%)1 50 50 77.73PM10 Emissions (tons/yr) 0.16 0.38
1 Scraper not included, accounted for in Heavy Construction Operations Fugitive Emissions
Emission Factor (lb/hr) 0.77 0.77 2 Based on 8 hr work daysActivity (hr/yr) 272 1620Control Efficiency (%)1 50 50PM10 Emissions (tons/yr) 0.05 0.31
2.21 5.121 Assume 50% control efficiency2 Based on 8 hr work days
Vehichle Traveling Unpaved Roads Fugitive PM10 Emissions (tons/yr)
Grading
Heavy Contstruction Fugitvie PM10 Emissions (tons/yr)
Bulldozing
Scraper Unloading Topsoil
Scrapers in Travel
Compacting
Ross IS
R Project
26E
R A
ddendu
m 4.6-A
- 286 -