added value within the automotive logistics industry ... · do this is to understand what is seen...
TRANSCRIPT
Graduate Business School
Logistics and Transport Management Master Thesis No. 2006:73 Supervisor: Rikard Engström
Added Value within the Automotive Logistics
Industry: Volvo Logistics Corporation
Veronica Zackrisson and Dro Gabriel Zogbe

i
Abstract Players in the automotive industry are predicting a downturn in the business the coming years.
This will affect automotive logistics service providers such as Volvo Logistics Corporation
(VLC). In order to prevent being severely affected by the incoming challenges VLC is
seeking a competitive niche through delivering added value services to existing and potential
customers.
The purpose is to investigate what is added value from the customers’ perspective within the
automotive logistics industry, and what are the drivers behind it. We also look into how our
findings can help VLC to better value its customers, giving more benefits to its customers,
and become more competitive.
Our research has shown that there are different perceptions of added value. The findings has
also revealed why VLC fails to match its customers’ perception.
This report suggests that communication and marketing can contribute to narrow the gaps
between VLC and its customers. The report also recommends VLC to review its current
management culture, and its strategy to cope with present and futures challenges on customer
related issues.
Key words Volvo Logistics Corporation, automotive logistics industry, added value, value added,
customer satisfaction, customer value, and competitive advantage.

ii
Acknowledgement We would like to start to thank our two supervisors Rikard Engström, Ph D at the School of
Business Economics and Law at Göteborg University and Johan Lindh at the strategic
planning department at Volvo Logistics Corporation, Göteborg for their support and guidance
through this research project. Then we would like to say a big thank you to all the people
within Volvo Logistics Corporation, VLC’s customers, and competitors that have helped us
by participating in the interviews and responding to our questionnaires. Without your help this
research would not have been possible to conduct.
On a personal level Veronica would like to say a big thank you to her family: father, mother,
sister, and niece for all the support and encouragement during the months that the research
project has been conducted.
Dro Gabriel says: “It would not have been possible to achieve this study without the help of
three of my dearest: Justine Bile, Sambat Gueye, and Solange Ouanda. I would like to thank
them for believing in me, for their trust, and for their unforgettable support which is beyond
common understanding”.
Göteborg, January 2007
Veronica Zackrisson and Dro Gabriel Zogbe

iii
Abbreviations C
CPV Customer Perceived Value
CSI Customer Satisfaction Index
CV Core Value
CVM Customer Value Management
E
Emballage VLC’s word for its packaging material
K
KPI Key Performance Indicator
M
MT Mack Trucks
R
RT Renault Trucks
V
VBC Volvo Bus Corporation
VCC Volvo Car Corporation
VCE Volvo Construction Equipment
VLC Volvo Logistics Corporation
VTC Volvo Truck Corporation

iv
TABLE OF CONTENTS
1 INTRODUCTION..............................................................................................................................................1 1.1 BACKGROUND .............................................................................................................................................2 1.2 PURPOSE......................................................................................................................................................2
1.2.1 Problem .................................................................................................................................................3 1.2.2 Research questions ................................................................................................................................3 1.2.3 Report layout .........................................................................................................................................3
1.3 DELIMITATIONS...........................................................................................................................................4 1.4 VOLVO LOGISTICS CORPORATION...............................................................................................................5
1.4.1 VLC’s vision and mission ......................................................................................................................5 1.4.2 The Volvo Group....................................................................................................................................6
Volvo’s core values........................................................................................................................................................... 6 1.4.3 VLC’s processes and markets ................................................................................................................7
VLC’s processes ............................................................................................................................................................... 8 Inbound........................................................................................................................................................................ 9 Outbound ..................................................................................................................................................................... 9 Emballage .................................................................................................................................................................. 10
VLC’s customers ............................................................................................................................................................ 10 VLC’s contractors........................................................................................................................................................... 11
2 RESEARCH METHODOLOGY....................................................................................................................12 2.1 RESEARCH APPROACH ...............................................................................................................................12
2.1.1 Exploratory research ...........................................................................................................................12 2.1.2 Descriptive research ............................................................................................................................13
2.2 RESEARCH METHODS.................................................................................................................................13 2.2.1 Quantitative research method..............................................................................................................13 2.2.2 Qualitative research method................................................................................................................14 2.2.3 Mixed-method research .......................................................................................................................14 2.2.4 Total study versus selective study ........................................................................................................15 2.2.5 Research approach in this report ........................................................................................................16
2.3 METHODS OF DATA COLLECTION...............................................................................................................16 2.3.1 Secondary data ....................................................................................................................................17 2.3.2 Primary data........................................................................................................................................17
Interview ......................................................................................................................................................................... 18 Face-to-face interview..................................................................................................................................................... 19 Telephone interview........................................................................................................................................................ 19 Questionnaire .................................................................................................................................................................. 20
Questionnaire design ................................................................................................................................................. 21 2.3.3 Methods of data collection in this report .............................................................................................22
Selection of interviewees ................................................................................................................................................ 23 2.4 SUMMARY OF RESEARCH STRUCTURE........................................................................................................24 2.5 RELIABILITY AND VALIDITY ......................................................................................................................25
2.5.1 Sources of errors in this report............................................................................................................25 2.5.2 Reliability and validity in this report ...................................................................................................26
3 THEORETICAL FRAMEWORK .................................................................................................................27 3.1 ADDED VALUE IN DIFFERENT PERSPECTIVES .............................................................................................27
3.1.1 Added value ≠ value added ..................................................................................................................27 3.1.2 Added value from the shareholders’ perspective .................................................................................28 3.1.3 Added value from the customers’ perspective......................................................................................29
3.2 RELATED CONCEPTS TO ADDED VALUE .....................................................................................................30 3.2.1 Customer satisfaction ..........................................................................................................................31 3.2.2 Customer value ....................................................................................................................................32 3.2.3 Competitive advantage ........................................................................................................................35
Sources of competitive advantage/disadvantage ............................................................................................................. 35 Competitive advantage through the value chain ............................................................................................................. 36
3.3 SOURCES OF ADDED VALUE.......................................................................................................................37

v
3.3.1 Competition..........................................................................................................................................38 3.3.2 Management competence.....................................................................................................................38 3.3.3 Process improvement...........................................................................................................................39 3.3.4 Innovation............................................................................................................................................40 3.3.5 Costs ....................................................................................................................................................41 3.3.6 Relationship marketing ........................................................................................................................42
3.4 CHARACTERISTICS OF ADDED VALUE ........................................................................................................43 3.4.1 Added value and life cycle ...................................................................................................................43 3.4.2 Measurement of added value ...............................................................................................................45
4 EMPIRICAL FINDINGS................................................................................................................................46 4.1 PROCESSING COLLECTED DATA .................................................................................................................46
4.1.1 Processing quantitative data................................................................................................................46 Processing of question 1 ................................................................................................................................................. 47 Processing of question 2 – 4 and 7 – 8 ............................................................................................................................ 47 Processing of question 5 ................................................................................................................................................. 48 Processing of question 6 ................................................................................................................................................. 48
4.1.2 Processing qualitative data .................................................................................................................48 4.2 QUESTIONNAIRE FINDINGS ........................................................................................................................49
4.2.1 Findings on question 1.........................................................................................................................49 4.2.2 Findings on question 2.........................................................................................................................50 4.2.3 Findings on question 3.........................................................................................................................51 4.2.4 Findings on question 4.........................................................................................................................52 4.2.5 Findings on question 5.........................................................................................................................53 4.2.6 Findings on question 6.........................................................................................................................54 4.2.7 Findings on question 7.........................................................................................................................55 4.2.8 Findings on question 8.........................................................................................................................56
4.3 INTERVIEW FINDINGS ................................................................................................................................57 4.3.1 General questions to our research market...........................................................................................57 4.3.2 General question to VLC and its customers.........................................................................................60 4.3.3 Findings on the questions to VLC’s customers ....................................................................................61 4.3.4 Findings on the questions to VLC’s competitors .................................................................................65
5 ANALYSIS .......................................................................................................................................................67 5.1 THE MARKET’S PERCEPTION OF ADDED VALUE..........................................................................................67
5.1.1 General perception ..............................................................................................................................67 Gap in the identification.................................................................................................................................................. 67 Gap in the definition ....................................................................................................................................................... 69 Gap in the benchmarking approach................................................................................................................................. 69
5.1.2 Perception within the automotive logistics industry ............................................................................70 The automotive logistics in general ................................................................................................................................ 70 VLC service–based offers ............................................................................................................................................... 71
5.2 THE DRIVERS BEHIND THE ADDED VALUE PERCEPTION..............................................................................72 5.2.1 Added value determinants....................................................................................................................73
Customer maturity .......................................................................................................................................................... 73 Industry competition ....................................................................................................................................................... 74 Market development ....................................................................................................................................................... 74 Political & cultural environment ..................................................................................................................................... 75
5.2.2 General management and strategy ......................................................................................................76 Logistics competence...................................................................................................................................................... 76 Continuous improvement................................................................................................................................................ 77
5.2.3 Relationship marketing ........................................................................................................................78 Trust................................................................................................................................................................................ 78 Communication............................................................................................................................................................... 78 Marketing........................................................................................................................................................................ 79 Educate the customers..................................................................................................................................................... 80
5.3 VLC’S STRENGTHS AS COMPETITIVE ADVANTAGE ....................................................................................80 5.3.1 VLC’s competitiveness.........................................................................................................................80
Complete solution ........................................................................................................................................................... 80

vi
Emballage ....................................................................................................................................................................... 81 Business relationship ...................................................................................................................................................... 81 Consolidation .................................................................................................................................................................. 82
5.3.2 VLC’s challenges .................................................................................................................................82 VLC’s long term strategy................................................................................................................................................ 82
Dedication to the Volvo Group business areas .......................................................................................................... 83 Prospect of being a business area............................................................................................................................... 83
Process assessment.......................................................................................................................................................... 83 The dilemma of contractors/suppliers being competitors................................................................................................ 84
6 CONCLUSION.................................................................................................................................................85 6.1 SUMMARY .................................................................................................................................................85 6.2 RECOMMENDATION...................................................................................................................................87 6.3 CONTRIBUTION..........................................................................................................................................89 6.4 AREAS FOR FURTHER RESEARCH ...............................................................................................................91
REFERENCES ..........................................................................................................................................................93
APPENDIX 1 QUESTIONNAIRE APPENDIX 2 FACE-TO-FACE QUESTIONS APPENDIX 3 SUMMARY OF QUESTIONNAIRE FINDINGS APPENDIX 4 SUMMARY OF INTERVIEW FINDINGS

1
1 Introduction Today’s global business is becoming more fierce and unpredictable as a result of volatile
variables in the market environment. For a company to stay profitable as well as competitive in
this kind of environment it has to focus on the drivers that help the specific company to be
competitive. One major driver for most companies is the cost. The cost reduction is
overwhelming for the business’s competition.
Companies within the automotive industry today put high pressure on their logistics service
providers by having suppliers and manufacturing plants scattered across the globe. The logistics
service providers have to not only have an efficient global network, but must also see to keep the
logistics costs down to help the individual firm in the automotive industry to stay or become
competitive.
Players in the automotive industry such as Håkan Samuelsson, CEO of MAN1 and Åke
Niklasson CEO of Volvo Logistics Corporation (VLC)2 are predicting a downturn in the
business the coming years. The causes of the downturn are expected to be the rise in
development costs, fluctuations in the oil price, and the introduction of new emission standards
for vehicles. The expected downturn puts extra pressure on all sources of costs, for instance the
workforce, the parts suppliers, and the logistics service providers. Costs savings within the
supply chain are in focus where lead time reduction in order handling, more automated systems
and sophisticated information technology are required alongside processing accuracy, and better
transportation network. With all these cost savings in mind there is also a pressure on the
logistics service providers to find solutions that at the same time exceeds customers’
expectations and requirements.
VLC who handles and develops business logistics systems for exclusively the automotive and
the aviation industries worldwide has understood it will be affected by the changes in the
automotive industry and is consequently seeking a niche to tackle the incoming challenges.
1 Financial Times, 2 August 2006, pp14 2 Volvo Logistics Corporation’s Business Plan 2006, pp2
2
Amongst the tactics there is the delivery of added value to increase the customer satisfaction and
strengthen VLC’s position in the market.
1.1 Background The present research project on the concept of added value has been assigned by the department
of strategic planning at Volvo Logistics Corporation (VLC) in Göteborg to address a subject
believed to be a competitive differentiator. The ideas behind the initiation of this research were
to stimulate the customer satisfaction and prepare the corporate for future challenges. Our
research findings would be for people with interest in strategy for customer satisfaction within
the automotive logistics industry or other logistics industries.
Customer satisfaction is now in focus within VLC. The reason for this is, even though the
customer satisfaction index (CSI) target has been reached, it has had a negative turn for two
years in a row, 2004 and 2005. This means that the distance between the target and the actual
result is decreasing in a negative way. The negative trend has to be broken and one way to try to
do this is to understand what is seen as added value within the automotive logistics industry.
First of all it is important to stress that there is a distinction between value added and added
value services. The first term refers to any activities adding a value to the product during the
operation process. These activities are easy to identify since they are cost related and their
implementation during the process generally leads to an increase of the product’s price. The
second term is more complex because it has to take into account the receiver of the product
perception. Here, the difficulty is to know what the drivers are behind the customers’ perceptions
in expressing their views on what is added value or not.
1.2 Purpose The purpose is to investigate what is added value from the customers’ perspective within the
automotive logistics industry, and what are the drivers behind it. We aim to, based on this
investigation, look into how our findings can help VLC to better value its customers, giving
more benefits to its customers, and become more competitive.

3
1.2.1 Problem
VLC is experiencing difficulties to define and evaluate added value services and also understand
the perception of its customers regarding this subject as the yearly customer satisfaction index
(CSI) has failed to address this issue. Some services already provided are seen by VLC as added
value services while the customers seen them as standard services or core service and vice versa.
This situation shows a gap in the perception of added value between VLC and its customers
regarding the services offered.
To some extend services currently provided by VLC might not be well marketed and valued in
order for them to have a greater impact on the customers’ perception. For instance we did not
find any record of any other lead logistics provider (LLP) or third party logistics provider (3PL)
in the automotive logistics industry offering the combined logistics services: inbound, outbound,
and emballage. Neither did we notice any information from VLC of the value brought by
purchasing the complete solution.
1.2.2 Research questions
Our research questions which will be targeted to our research market aim to trace the route we
need to satisfy our purpose, and also guide and structure our research project. By saying our
research market we mean our research population comprising VLC, VLC’s customers, and
VLC’s competitors. The research is built around three questions, which are:
1. What is our research market’s ability to identify added value services?
2. What are the drivers behind the added value perception?
3. Which of VLC’s strengths have potential for giving VLC a competitive advantage?
1.2.3 Report layout
In order to fulfil the above, we intend to pursue the following structure: first of all to understand
the theoretical concept of added value and the interaction with the related concepts including
customer satisfaction, customer value, and competitive advantage.
4
Secondly, conduct interviews and questionnaires with VLC stakeholders including customers
and contractors/competitors to understand the different perceptions of added value services.
Look into the existence of eventual gaps between what the different customers expect and what
VLC offers. Although some of VLC’s contractors are also its competitors we have chosen to
treat them in this research more as competitors than contractors, to receive a better market view.
Finally, to analyse the data and make recommendation to VLC regarding how the gaps
eventually discovered could be addressed, and how the existing services delivered by VLC could
be more valued.
1.3 Delimitations The concept of added value in this report will be treated from the customers’ perspective and not
the shareholders’ perspective. It will then be further narrowed down in different respects
including the industry, the geographical location, the choice of the market, and the organisational
structure level involved. The automotive logistics industry will be the base of our report
development because it is the industry in which Volvo Logistics Corporation mainly operates.
The choice of the market has been limited to VLC, its most important customers who stand for
over 90 percent of VLC’s turnover, and a few competitors who are also contractors of VLC. We
will cover VLC’s three geographical areas, however the view collected on those different
markets will be for VLC and its customers wider than the competitors whose views will
predominantly be based on their Swedish operations.
Our research concentrates on the strategic input of the concept of added value since the people
involved in the research have a position at the level of decision making-process in their
corporation.

5
1.4 Volvo Logistics Corporation Volvo Logistics Corporation (VLC) is a third party logistics provider that started off as a
logistics department within the Volvo Group to handle the logistics for the Volvo Group business
areas. In 1984 it became a subsidiary wholly owned by AB Volvo. As a part of the Volvo Group
Volvo Logistics has become a global company and it “design, run and develop comprehensive
business logistics systems not only for the Volvo Group companies, but also for external
customers in the automotive, transport and aviation industries”3.
VLC has today approximately 950 employees worldwide, and is represented in 30 places in
Europe, North and South America, and Asia. VLC’s strategy is to be located near its customers’
large plants and important logistics hubs. Since the automotive industry today is so widely
spread out with production sites and suppliers across the globe their logistics service providers
have to be able to meet their needs by having global networks. To be able to serve its customers
VLC has built up a global network of hauliers and logistics service providers that are contracted
since VLC does not perform activities such as transportation and warehousing in-house. The
different businesses VLC conducts are: inbound, outbound, emballage, aviation, logistics
consulting, and logistics development. The ability to deliver a complete solution meaning
inbound, outbound, and emballage to its customers is something that VLC sees as vital though
customers tend “to seek one or few logistics providers for their entire logistics needs.”4
1.4.1 VLC’s vision and mission
VLC’s vision is “to be recognised as the leading logistics partner within the automotive,
commercial transport, and aviation industries.”5 The prime purpose of VLC is to support the
Volvo Group. To fulfil this purpose VLC needs to increase its volumes. In order to do that, new
businesses and new customers need to be gained. VLC is actively focusing on companies within
industries that are “leading to most synergies with the Volvo Group, namely automotive,
commercial transport and aviation.”6
3 Volvo Logistics Corporation’s Internet site 4 Ibid 5 Volvo Logistics Corporation’s Business Plan 2006 6 Ibid

6
The mission of VLC as stated in its business plan of 2006 is to “deliver complete supply chain
solutions that add value for our customers worldwide.” On its Internet site VLC states its mission
as “to develop, manage and continuously improve global logistics systems that strengthens our
customers' competitiveness.”7 To add value to, and strengthen its customers will also reflect on
VLC’s competitiveness in the automotive logistics industry. This will help VLC to grow, and
support the Volvo Group as stated in VLC’s vision.
1.4.2 The Volvo Group
The Volvo Group is made up by the following business areas: Volvo Aero, Volvo Buses, Volvo
Construction Equipment, Volvo Financial Services, Volvo Penta, Volvo Trucks, Mack Trucks,
and Renault Trucks. Volvo Logistics is together with Volvo 3P, Volvo Powertrain, Volvo Parts,
and Volvo IT business units within the Volvo Group supporting the business areas, see figure 1.1
below. Being a part of the Volvo Group and have Volvo in the name can both help and hinder
VLC. When trying to expand the business outside the Volvo Group to new external customers it
might not always be good to be associated with the Volvo Group though the new customer might
see a company within the Volvo Group as a competitor. On the contrary to be associated with the
Volvo Group might help VLC to gain new customers or new businesses. New customers might
associate VLC with the Volvo image and core values.
Volvo’s core values
As a part of the Volvo Group VLC and the other business areas and units share the same core
values. These are values that all the companies in the Volvo Group identify themselves with, and
they are: quality, safety, and environment. With safety comes now also security. These values are
well known by customers, however their importance differ depending on where in the world the
customer is located.
7 Volvo Logistics Corporation’s Internet site

7
Figure 1.1: The Volvo Group’s organisation chart: business areas and business units.8
1.4.3 VLC’s processes and markets
As mentioned above VLC’s market is companies within the automotive, transport, and aviation
industries. In 2005 VLC’s controlled turnover was 9.2 billion SEK, figure 1.2 below shows how
it was divided looking at three different perspectives: customer base, regions, and processes. The
largest customer base for VLC is the Volvo Group followed by the largest external customer
Volvo Cars. Looking at the regions, the Scandinavia and Overseas region is the largest followed
by North America, and Europe. The largest process is inbound followed by outbound. Emballage
and aviation are still small in comparison. As shown in the brackets are the numbers from 2004
turnover split. We can see that the Volvo Group has increased in the customer base, North
America of the three regions, and inbound was the process that increased.
8 Volvo Group’s Internet site

8
Figure 1.2: The controlled turnover split for VLC in 2005. (Source: VLC’s Business Plan 2006)
Looking at VLC’s four processes: inbound, outbound, emballage, and aviation VLC’s position in
the market differs. For inbound and outbound, which represent the two largest processes, VLC is
an established third party logistics provider (3PL) however VLC’s size is still small in
comparison to the competitors. Regarding emballage VLC is since long established and offers to
its customers a total concept of emballage services. There are only a few players in this field and
VLC is in the top regarding the emballage services provided, and in the middle regarding its size.
When it comes to aviation VLC is quite small compared to its competitors, but this is only a
minor business still for VLC so with time this might change.
One reason to why VLC is smaller than its competitors is that until 1999 when Volvo Cars was
sold from the Volvo Group to the Ford Motor Company VLC only worked within the Volvo
Group. With the sale of Volvo Cars VLC got its first external customer. This means that VLC is
still new to non Volvo Group companies, with exception of Volvo Cars.
VLC’s processes
VLC offers to its customer the complete solution of inbound, outbound, and emballage services,
see figure 1.3. VLC is looking at each customer’s specific needs and requirements when creating
the complete solution, this to be able to offer the best solution to the customer. To be able to
create the best solution it is important to have a close relationship with the customer and it is
preferable if VLC can be involved already in the development process of new products.

9
Inbound
VLC’s major process is inbound. Inbound means the handling of the material supply to the
different customers’ factories. VLC works mainly with two different flows regarding the
inbound, and these are full truck loads and the so called milk rounds. The full truck loads are
directly between the supplier and the VLC’s customer’s factory, whereas the milk rounds are a
preset route where materials are collected from more than one supplier, and goes to either a
terminal or to one or more customers’ factories.
In the inbound process VLC does not only offers the customer the transport of the material, but
also additional services such as warehousing, sequencing and goods reception9 to mention some
of them.
VLC is now in the process of setting up a sophisticated IT tool called ATLAS (Advanced Total
Logistics for Automotive Supply)10 which will be a worldwide information base regarding the
material flow.
Outbound
Outbound is the second largest process for VLC, and it deals with the delivery from the
customers’ factories to dealers or end customers. VLC’s internal customers work after a so called
pull system, meaning that the products are build to order, which can lead to fluctuations in the
9 Volvo Logistics Corporation’s Internet site 10 Ibid
Inbound Outbound
Factory
Emballage
Dealers or end customer
Sub-supplier / supplier
Figure: 1.3: Complete solution (Source: Volvo Logistics One company – we deliver)
10
capacity needed, and a well functional outbound is required. The quality must be guaranteed
though each finished product is unique, and cannot be quickly replaced.
In the outbound process VLC uses an IT system called A4D (Application for Distribution)11.
With the A4D system it is possible to calculate the delivery date as soon as the order has been
placed. If there are any changes during the completion of the order, the A4D system will
automatically be updated and inform the new delivery date. This information can then be seen by
not only VLC, but also the dealers around the world.
Emballage
Emballage is the packaging materials that are in motion in VLC’s inbound and outbound
processes. With over 50 years experience regarding packaging processes for the automotive
industry VLC has managed to develop a very well working global emballage pool system.
With the different emballage offerings from VLC the customers can utilise the transportations
better due to the stackability of the emballage. The emballage is also one way for the customers
to secure a high quality of the goods during the transportation.
Within the emballage process VLC uses a system called VEMS (Volvo Emballage Management
System)12. With this integrated system support VLC can offer its customer a web-based service
called Emballage Pool Online13, through which the customers can receive online statements of
their emballage accounts.
VLC’s customers
Today VLC has both internal and external customers. Internal customers refer to the customers
that are part of the Volvo Group, making the customers outside the Volvo Group the external
customers. As shown in figure 1.2 the Volvo Group represents VLC’s largest customer share,
and the most important external customer for VLC is Volvo Cars.
11 Volvo Logistics Corporation’s Internet site 12 Volvo Logistics One company – we deliver 13 True Business Logistics: Inbound – Outbound – Emballage, pp10

11
VLC would like to increase its business both with internal and existing external customers as
well as with new external customers. VLC is focusing on the Ford Motor Company’s Premier
Automotive Group where companies such as Aston Martin, Jaguar, and Land Rover are
included. Today VLC is concentrating only on the automotive, transport, and aviation industries,
but maybe this will be changed in the future. As long as synergies can be made to the Volvo
Group new industries might be explored.
VLC’s contractors
VLC does not perform the transportation or warehousing activities in-house, instead all services
are bought from hauliers and other logistics providers. Some of these logistics providers are also
VLC’s competitors such as DHL and Schenker.
Since VLC is buying services for all the companies in the Volvo Group, VLC can consolidate
transports and receive a better price per kilogram than what the companies would have been
given if buying the service separate from the Volvo Group. The reason for this is that many of
the internal customers have the need for the same routes. This is one of the reasons why it is hard
for VLC’s competitors to take over VLC business. Another reason is that VLC knows the
customers inside the Volvo Group so well, and have build such a strong relationship with them
that it is difficult for competitors to compete for these customers.

12
2 Research methodology Before doing a research it helps to design the process that the research should follow. Aaker et
al. (2004, pp74) divide the research design process into three sections: preliminary planning,
research design, and implementation. In the preliminary planning the purpose and the objective
of the research are considered, and they have been discussed in the introduction of this report.
The implementation includes the collection and the analysis of the data as well as the conclusion
and the recommendations of the findings, which will be dealt with later on in this report. In this
chapter we will be looking into the research design, where the different characteristics of the
research approach and methods are presented.
2.1 Research approach When choosing which research approach to use, the nature of the research, and the degree of
knowledge regarding the research topic should be considered. Aaker et al. (2004, pp75) classify
a research approach into three different categories: exploratory, descriptive, and causal. In this
report we will focus on the first two research approaches. These will then determine how the
information for the research will be obtained.
2.1.1 Exploratory research
An exploratory research should be used if not much is known about the specific topic or situation
that will be studied, or the researcher lacks a clear idea of the problems that will be met in the
study, or if the researcher seeks insights into the general nature of a problem (Aaker et al., 2004;
Cooper and Schindler, 1998; and Sekaran, 2000).
According to Cooper and Schindler (1998, pp131) the purpose of an exploratory research is to
develop hypotheses or questions on which further research can be conducted. This means that all
studies have elements of exploration in them.

13
2.1.2 Descriptive research
A study can be exploratory or formal, “the formal study begins where the exploration leaves
off” (Cooper and Schindler, 1998, pp131). One kind of formal study is called descriptive
research.
If the characteristics of the studied phenomena are known, the descriptive research approach
can be used to describe or make a profile of them. This can be done from an individual,
organisational, industry-oriented, or other perspective (Sekaran, 2000, pp125). To find out the
who, what, when, where, and how are seen by Cooper and Schindler (1998) as the objective of
this approach. While the purpose of this approach is seen by Aaker et al. (2004) as to provide
a true picture of the studied phenomena in the market environment at a specific point in time.
2.2 Research methods Depending on which research approach that is applicable for the study, the researcher has to
consider if quantitative, qualitative, or a combination of the two methods of data collection
should be used. Svenning (2003, pp73) states that it is difficult to differentiate quantitative
and qualitative research methods, and that it should be the question(s) at issue in the research
that should decide which method to use.
2.2.1 Quantitative research method
A quantitative research method is used to determine the relationship amongst different
variables of phenomena within a given population. It aims “at producing data that can be
statistically analysed and results that can be expressed numerically” (Dibb et al., 1997,
pp166). Quantitative research is generally more structured than qualitative research, though
the questions are principally preset and closed with provided answer alternatives for example
questionnaires.
Even though quantitative data can provide the researcher with statistics, it cannot give the
underlying reasons for the data. To be able to find the underlying reasons qualitative data
need to be used.

14
2.2.2 Qualitative research method
When it is needed to go more in-depth to understand the situation studied qualitative research
method is used. In qualitative research there can be preset questions or areas of questions,
however the respondent does not have any answer alternatives though it is the respondent’s
own views that the researcher would like to know. Interviews where there is an open
communication between the researcher and the respondent are commonly used to gather the
data needed.
The findings of a qualitative research method are usually presented “through narrative or
verbal means” (Lodico et al. 2006, pp15). Decisions taken only from the qualitative data can
have faults inserted in them due to the lacking of hard statistical data (Sekaran, 2000).
2.2.3 Mixed-method research
A mixed-method research is when the two research methods, quantitative and qualitative, are
conducted in the same study. According to Lindblad (1998, pp25) “different methods often
complement each other. The research is broadened and generates more knowledge if
quantitative and qualitative methods are combined to illustrate different problems.” Lodico et
al. (2006, pp17) state that one method might be emphasised more than the other, but both are
important for the research. They also mention that the two methods can be undertaken at the
same time, or after each other.
Depending on the level of emphasis given to the two methods, and in which sequence they are
conducted, the design of the mixed-method research can be divided into three categories. The
explanatory design is where the quantitative data have been collected first, and where the
qualitative data are collected to follow-up or refine the quantitative data. It emphasises on
quantitative data. The exploratory design is the opposite, it emphasises on qualitative data,
meaning that the quantitative data are collected afterwards to build on or explain the
qualitative data. The triangulation design is when the two methods are given equal emphasis,
are conducted at the same time, and are analysed together (Lodico et al. 2006, pp284-286).

15
2.2.4 Total study versus selective study
No matter if a quantitative, a qualitative, or a combination of the two methods is going to be
used in the research, all of them require a population to study. How to decide the population
depends not only on which method to use, but also on the time and the resources that the
researcher has for the project. Either a total study with the whole population or a selective
study with a selective part of the population can be studied.
To do a total study is expensive and very time consuming if it involves a large population, but
it would give the most precise answers. However if the population is small then a total study
is recommended. For a large population it is more common to do a selective study where a
random sampling of the population is done to represent the population as a whole, a so called
statistical selection. If the selective population does not have to represent the population as a
whole a non-statistical selection also referred to as a selective selection is used.
Total study Selective study
Statistical selection Non-statistical selection
(Selective selection)
Figure 2.1: Different kind of study selections. (Source: Svenning, 2003, pp102)
In general the quantitative research method is to be more precise, and a total study would be
to recommend, or if limited by time and resources a statistical selection. In the qualitative
research method a selective study is usually done even if the population is very small, and the
reason for this according to Svenning (2003, pp101) is that “qualitative researches are
resource demanding.” For the qualitative research method the non-statistical selection is used.
The most common way of conducting a non-statistical selection for a qualitative research is
through purposeful sampling. It “is a procedure where the researcher identifies key
informants: persons who have some specific knowledge about the topic being investigated”
(Lodico et al., 2006, pp140).

16
2.2.5 Research approach in this report
When starting with this report we did not have much knowledge about the automotive
logistics industry, and there were no previous written information to be found about added
value within the industry. For this report we would not be able to look at the whole
automotive logistics industry, so we have chosen to focus on Volvo Logistics Corporation
(VLC) and its stakeholders. We intend to do a research that combines the two approaches
explorative and descriptive. By conducting an explorative research through interviews, we
hope to find out what is perceived as added value within the automotive logistics industry
today, and what is believed to be perceived as added value in the future. With the descriptive
research, conducted through questionnaires, we want to explain what VLC has today that
customers perceive as added value, and what VLC needs to focus on in the future. For these
two approaches we plan to conduct interviews as well as sending out questionnaires to the
interviewees, so a mixed-method research particularly the triangulation design will be used.
Though we will focus on VLC and its stakeholders the population of this research is related to
VLC in one way or another, such as being an employee, a customer, or a competitor. The
population that we will be studying has been selected through a purposeful sampling by our
supervisor at VLC.
2.3 Methods of data collection “Data are any type of information collected for use in research” (Lodico et al., 2006, pp66).
Data can be collected using different methods. The most common methods are: reading
(literature review), interviews, surveys, observations, and experiments. When deciding what
kind of data that are needed and how to collect the data aspects such as resources including
time and finances, and availability have to be considered.
The researcher can have a team that is helping to collect the data, however if this is the case it
is very important that they all follow the same structure and criteria to avoid introducing
biases (Cooper and Schindler, 1998, and Sekaran, 2000).
The data needed for the research can be collected either as secondary data or as primary data.
Cooper and Schindler (1998, pp256) explain the difference between them as follows: primary

17
data are collected by the researcher especially to answer the research question(s), whereas
“studies made by others for their own purposes represent secondary data” to the researcher.
2.3.1 Secondary data
Since all secondary data for a research have been “collected for some purpose other than
solving the present problem” (Aaker et al., 2004, pp80), it is important to be able to select the
information relevant to the undertaken research. Secondary data can be found for example in
literature (books, journals, articles), Internet, databases, and from organisations/companies. A
researcher should always start to look at secondary data available when beginning the
research. To gather secondary data is the cheapest way to collect data considering both time
and money, and if an organisation or a company is to be studied it is a good place to start
collecting data.
Secondary data can be divided into internal and external14 data if the study is conducted
within, for, or about a company. Internal secondary data are collected from within the related
company for example from the company’s business plan, or findings from its customer
satisfaction surveys. All other secondary data gathered from sources such as libraries and
databases are external.
A research can be conducted by only studying secondary data however this is mostly used in
situations where a primary study cannot be conducted due to physical, legal or cost influences
(Cooper and Schindler, 1998, pp257).
2.3.2 Primary data
As previously explained primary data means that the data are collected by the researcher just
for this specific research, and not for any other purpose. Primary data collected by asking
questions can according to Kylén (2004) only be done in four ways: interviews, surveys,
observations, and reading. Collecting data through the three first mentioned methods are both
time consuming and expensive.
14 Steppingstones Partnership, Inc.

18
Primary data can be both qualitative and quantitative, where interviews and some
observations fall under qualitative research methods, and other observations and surveys fall
under quantitative research methods.
Interview
There are three different kinds of interviews depending on the number of people that are
involved: individual interview, group interview, and panel interview (Kylén 2004, pp22-23).
An individual interview is when there is one interviewer and one interviewee. In a group
interview there is one interviewer and minimum two interviewees. A panel interview means
that there are two or more interviewers and one interviewee.
When it comes to the interview structure most authors talk about structured and unstructured
interviews referring most of the time only to the presentation of the interview questions (see
for example Sekaran, 2000, and Lodico et al., 2006), and not how the answers are registered
(see Hellevik, 1977). However these are the two extreme structures, there are of course other
structures of interviews in between, so called semi-structured interviews. The structure of the
interview also influences the length of the interview. According to Kylén (2004, pp18) an
interview that is between 40 to 60 minutes can “cover many questions or areas of questions
and go into depth on the most interesting ones”.
When conducting interviews a common model used is called the funnel model (Kylén, 2004),
where the interview starts very broad then as time elapse the interview is becoming more
concentrated.
When conducting an interview it is recommended to take notes to help not only remembering,
but also processing the information gathered. Since most of us do not write as fast as we
speak many interviewers use tape recorders or video cameras to record the interview, and to
be able to revise it again afterwards. By recording the interview the respondent might feel
obstructed which can lead to biases being introduced into the data.
If the interview is recorded, then Kvale (1997) states that it is common to transfer the
interview into written text. How this transfer should be done, depends on who the transfer is
made for, and what it should be used for.

19
Face-to-face interview
A face-to-face interview is conducted when the researcher is in direct personal contact with
the interviewee. The participation rate is usually higher when conducting face-to-face
interviews compared to other data collecting methods, however it is the most expensive and
time consuming way to collect data (Cooper and Schindler, 1998). Most face-to-face
interviews are also limited to a specific geographical area.
When an interview is conducted face-to-face, the researcher should be aware that the
environment where the interview is held as well as the interviewer can influence the
respondent (Sekaran, 2000). Also depending on what kind of interview it is: individual, group
or panel the interviewee can respond differently. It is therefore important, that the interviewee
feels comfortable in the situation, to be able to give the researcher its genuine answers, and
not to introduce bias to the data.
In a face-to-face interview the researcher has the possibility to explain or clarify questions as
well as answers if needed (Sekaran, 2000). The way that the interviewee expresses its
answers, through facial expressions or body movements can also be observed and studied at
the same time as the interview is undertaken.
Telephone interview
Telephone interviews are mostly used to conduct shorter interviews with a number of people.
Compared to face-to-face interviews, telephone interviews are cheaper, they save time since
no travel is needed, and they can cover a larger geographical area. The interviewee will most
likely also feel more comfortable though s/he is in his/her own environment, and more
anonymous towards the interviewer than in a face-to-face interview (Sekaran, 2000). One
disadvantage of telephone interviews according to Sekaran (2000, pp230-231) is that the
interviewee can at any time under the interview hang up the phone without any warning or
explanation making it a non-response. To avoid this to happen, Sekaran (2000) suggest that
the researcher contacts the interviewee in advance to request the interviewee’s participation in
the research, and together they set an appropriate time for the interview.

20
Questionnaire
Sekaran (2000, pp233) defines a questionnaire as “a pre-formulated written set of questions to
which respondents record their answers, usually within rather closely defined alternatives”. A
questionnaire can have both open and closed questions, but it is more common to have mainly
closed ones, though these are easier to analyse. The distribution of questionnaires can be
conducted in different ways for example individually, sent out by ordinary or electronic mail,
and be available on-line. Through questionnaires a larger population or a population that is
more geographically spread can easier be covered compared to when interviews are
conducted. Different languages can be used if necessary, and the answers can still be put
together or compared though all questions are the same. Also with a questionnaire the
respondents usually have more time to think about the questions before answering them.
One negative aspect of questionnaires is the low response rate. Some authors state that a
response rate of 30 percent is acceptable (see for example Sekaran, 2000), while Wiersma and
Jurs state “writers differ on suggested minimum response rates, and the rates also may vary
somewhat depending on the population being surveyed” (2005, pp175). This means that the
researcher should look at the specific population for this specific research to determine if the
response rate received is acceptable or not. Sekaran (2000) recommends contacting the
respondents in advance to increase the response rate. Cooper and Schindler (1998) agree that
a so called preliminary notification can help increasing the response rate, but state that follow-
ups or reminders are more efficient.
Three other negative aspects with using questionnaires are worth mentioning. Firstly, if the
questionnaires are not conducted face-to-face the questions cannot be explained. This can lead
to the respondent misinterprets the questions and unintentionally entails bias in the
questionnaire answers. Because of this the questions should be as clear and understandable as
possible for the targeted population. Secondly, it is difficult to go deep into the questions and
to have follow-up questions if needed. Finally a questionnaire can not be long, cause then the
respondent may be put off to fill it in. Cooper and Schindler (1998, pp305) mention a general
rule of thumb regarding questionnaires; they should not take longer than ten minutes to fill in.

21
If a questionnaire is not conducted face-to-face it is important to attach a letter in which the
purpose of the research is explained and where, if necessary, instructions regarding how to fill
in and return the questionnaire are given.
Questionnaire design
A questionnaire can be designed in different ways (Frankfort-Nachmias and Nachmias, 1996).
Data that has been gathered through quantitative research method can be measured using four
different layouts, so called scales of measurement: nominal, ordinal, interval, and ratio
(Lodico et al., 2006).
Scale of measurement Description
Nominal Categories
Ordinal Categories and ranking
Interval Categories, ranking and equal spacing
Ratio Categories, ranking, equal spacing and true zero
Table 2.1: Descriptions of the different scales of measurement (Source: Lodico et al., 2006, pp72)
As shown in table 2.1, all scales include categories, and all scales except nominal include also
ranking. Then it is only interval and ratio that have equal spacing between the scale steps.
What differentiate the two is that the ratio scale also has a true zero answering alternative
which none of the other scales have. The scale layout is decided to best suit a specific
question.
Regarding the question format, which can also differ in the questionnaire, there can be
different types of scales. The type of scale depends on the question format, and the question
format depends on the question itself and what is expected to get out from the answers related
to that question. The question formats and the types of scales that we will be using will be
discussed under the section processing collected data in the empirical findings chapter.

22
2.3.3 Methods of data collection in this report
Even before we started to collect data for this report we had to contact the people we wanted
to interview. Since it is difficult to get an appointment with them, we tried to contact them
well in advance, preferably before they went off on holiday. So in end of June we first tried to
call them to introduce ourselves and our research project, and give them an explanation why
we wanted to interview them. The ones we could not get hold of through the telephone during
June and July, we sent an e-mail to with an introduction and an explanation, and then tried
again in August to reach them over the telephone. In August we also called back to the
interviewees, which had already during the summer agreed to participate, to set the interview
dates in September.
When it comes to data collection we started with secondary data. For the external secondary
data we reviewed books available from the libraries in Gothenburg, related articles and
journals from different databases mainly Business Source Premier and Emerald. As internal
secondary data we went through information from VLC such as VLC’s business plan, other
corporate reports and information leaflets, as well as some presentation files provided to us by
VLC. After we had gained some background knowledge we began preparing interview and
questionnaire questions that would be used to gather primary data.
We decided to conduct panel interviews, so that we both would be attending and one could
focus more on taking notes while the other was mainly asking the questions. We agreed on
using a tape recorder to be able to go back and listen to the interview one more time, and fill
in the gaps in our notes. The structure of the interviews was semi-structure where we used a
structured list of questions, but we also allowed follow-up questions, and the registration of
the answers were less structured. A semi-structured interview made it possible for us to divide
the time differently between the questions when one question needed to be looked at more in-
depth. The interview model used was the funnel model, though we felt that it is a natural
model to use when performing interviews.
For this report we knew we had to conduct interviews with people within VLC, with VLC’s
internal as well as external customers, and with VLC’s competitors. When the interview list
was given to us from our supervisor at VLC, we were also requested to interview two
logistics experts that are affiliated with VLC. The interviews were face-to-face interviews
23
where ever possible; telephone interviews were only conducted with the people not located in
Gothenburg, Sweden. The interviews were limited to maximum one hour though the
interviewees are very busy.
Regarding our questions for the interviews we had a base of questions which we proceeded
from. The interviewees from VLC have different positions, so the questions for the personal
interviews had to be adapted to the specific interviewee. Of all the interviewees there were
some that were given the same questions, these can be divided into five groups: the three
regional managers, the two involved in Vision 2015, the two logistics experts, the customers,
both internal and external, and the three competitors. The questionnaires were in general the
same only some words in the questions itself were changed depending on if the questionnaire
was sent to VLC or the stakeholders. All the interviewees received a few days prior to the
interview the specific interview questions and our questionnaire over e-mail. We decided to
do this because all interviewees are very busy, and by providing the questions in advance they
could if they felt it was necessary prepare themselves.
Selection of interviewees
When it came to whom we were going to interview, we were given a list from our supervisor
at VLC. The list contained names of people within VLC, VLC’s internal and external
customers, competitors, and two logistics experts from Linköping University that are
affiliated with VLC. These people were a sample of the entire population within VLC and its
stakeholders that had been chosen through a purposeful sampling. The list was put together by
our supervisor at VLC after discussions and consultations with different people within the
company and approved by key members of VLC. We contacted in total 25 people and we
conducted 24 interviews during the weeks 37 to 41; 14 with VLC personnel including the two
logistics experts, seven with customers, and three with competitors. The majority of the
interviews were face-to-face interviews, only seven were telephone interviews. We also
received back 24 questionnaire responses.

24
2.4 Summary of research structure Figure 2.2 summarises the research structure in this report after the layout in this chapter.
Figure 2.2: Summary of research structure (Source: Zackrisson and Zogbe)
Exploratory research Descriptive research
Qualitative Quantitative
Purposeful sampling (25)
Selective study
Mixed-methods
Triangulation design
• Executive management • Logistics experts • Logistics directors etc.
• VLC (14) • VLC’s customers (8) • VLC’s competitors (3)
Interview (24) Questionnaire (24)
Face-to-face (17) Telephone (7)
Processing Processing
Analysis
Conclusion and recommendation

25
2.5 Reliability and validity To evaluate the quality and the credibility of a research the two criteria reliability and validity
can be used. Wiersma and Jurs (2005) divide validity into internal and external validity and
define the two validities and reliability as follows. Internal validity deals with how the
research results can be interpreted correctly and with confidence. External validity refers to
which degree the research results can be generalised to other populations and/or conditions.
The reliability relates to how consistent and replicable the methods that were used are, the
conditions which the research was undertaken in, and also the results that were given.
Wiersma and Jurs stress that a study that lacks reliability cannot be a valid one, therefore
“reliability is a necessary characteristic for validity” (2005, pp9). For a research to be of good
quality and credible it should be as free of bias as possible. Sekaran states the following
regarding biases: “bias refers to errors or inaccuracies in the data collected” (2000, pp226).
There are however many factors that can influence the reliability of the research for example
the interview form, the interviewer, or the environment where the interview is held (Svenning,
2003).
2.5.1 Sources of errors in this report
We have done our best to avoid any errors or biases in this report, but one can never be
hundred percent sure. Before the interview questions and the questionnaire were sent out to
the participants we went through the questions to be sure we did not intentionally included
any biases in the questions, nor in the answer alternatives in the questionnaire. Also when
transferring the quantitative data into excel we checked and re-checked that we did the correct
transfer.
Before interviewing our participants we contacted them well in advance to set the
appointment to make sure that they took their time to see us, though stressed people are more
likely to introduce biases (Sekaran, 2000). For the interview itself we tried to, in as many
cases as possible, be at the interviewee’s office or office building so that it would be a
familiar and safe environment for the interviewee. We believe that we as interviewers were
consistent in all the interviews we conducted.

26
By using a tape recorder and going through the interview once again we reduced the influence
of biases from memories. We are also convinced that our respondents were not inducing
biases into their answers due to the fact that we recorded the interviews, though we made it
clear that the recording was only for us interviewers to be able to fully get their answers and
to fill in the gaps in our notes. None of the interviewees had any problems or objections to us
using the tape recorder.
2.5.2 Reliability and validity in this report
When it comes to reliability and validity in this report we believe that the reliability and the
internal validity are high. External validity is not of importance here though we are looking at
what VLC and mainly its customers perceive as added value, and where there are mismatches
in the perceptions that need to be dealt with. We are not looking at the automotive logistics
industry as a whole, and it would be wrong of us to generalise our findings related to VLC to
the rest of the companies within the industry.
Why do we believe that the reliability and the internal validity are high? Well, first of all the
participants have been very interested in this study, and the results of the research are in
favour for all the participants, so we feel that they have been very open and honest towards us
in their answers. If the interviews and the questionnaires would be conducted again in the
nearest future we believe that the data gathered would be very much the same. However, it is
important to remember that what is perceived as added value changes over time, so if the
study would be done again in a year the data could have changed depending on different
variables in the industry.
When looking at the purposeful sampling population that we interviewed, that was provided
to us by VLC, one might wonder if the result of this research would be different if we would
have chosen the interviewees ourselves. Well, prior to us being provided with the list of
interviewees we had done a list with titles of the people that we had in mind for the research.
The only thing that differed from the two lists was that we had also put some people with
operational duties, such as line managers and blue collar workers. Now in the aftermath we
believe that the list provided to us was a very good and representative list for this research.

27
3 Theoretical framework The concept of added value is diversely interpreted and means different things to different
people. The confusion in the meaning of added value leads to indifferently use of added value
and value added to describe the same things (Grönroos, 1997), while others distinguish the
differences in the two terms (Chernatony et al., 2000). Also the term added value is perceived
in different perspective.
This chapter will be divided in four main headings. The first part: added value in different
perspectives, we will try to explain the difference between the concepts of added value and
value added, and go further by explaining and distinguish the different perspectives of added
value. The second part: related concepts to added value will be a prerequisite to better
understand our approach of added value through customer satisfaction, customer value, and
competitive advantage. The two last parts will deal with the concept drivers involving its
sources and characteristics.
3.1 Added value in different perspectives Under this heading we will try to make a clear distinction between added value and value
added, we will go on to also explain the different perspectives of added value, to finally focus
on what is of our interest in this report.
3.1.1 Added value ≠ value added
The terms added value and value added have been used indifferently by Grönroos (1997,
pp412) to describe the additional services to the core value or core product, while Christopher
(1998, pp44) refers precisely to the same additional services by only using the term added
value. Of the two concepts clearly the latter concept, value added, which should be
distinguished from the former, added value, refers to the additional value created at a
particular stage of the production or delivery process such as time, raw material, additional
services, or processing. For instance the value added time is described by Christopher (1998)
as the time spent doing something which creates a benefit for which the customer is ready to

28
pay, while Mattsson (2000) describes value added processing as processes including for
example kitting, storing, packaging and labelling.
In this regard, value added is an integrated part of the product, for instance the transportation
activity provided by a manufacturer to its customers can give different perceptions. The
following scenarios give a clearer picture of the differences between the concepts.
In the first scenario, the transport service is a value added services if the customer buys the
product only when the product reaches its door steps. The customer would then pay the
invoice of the product delivered regardless the transport distance or condition. The customer
pay just for what he has received. The transport service is a part of the process which ends not
at the factory, but at the doorstep of the customer. The transport cost might certainly be
included in the invoice, but not specified. The transport in this specific case appears as an
integrated part of the core product or service.
In the second scenario the transport service could appear as an added value service when the
customer buys the goods from the manufacturing site and has to find its own transport to
deliver to its doorstep. If, in that situation, the manufacturer can provide a transport service to
the customer at a competitive price and competitive quality, then the customer might perceive
an added value in the transport service. The customer perceive more benefits in buying the
complete package from the manufacturer for at least two reasons: the time saving and the
reliability by dealing with a single provider, and the relative low cost attraction as the
customer finds it more beneficial to buy the transport from the manufacturer instead of
contracting with a third party.
3.1.2 Added value from the shareholders’ perspective
Added value from the shareholders’ perspective is purely economical in the sense that only
shareholders’ concerns matter, which contrasts with the approach we want to highlight in this
report. In this regard Kay (1993) considers the concept of added value as a “key measure of
corporate success” and defines it by using accounting figures such as input costs and output
revenues to determine added value. Those figures include material costs, wages and salaries,
and capital costs. In general terms Kay (1993) defines added value as being the difference
between the comprehensively accounted value of the firm’s output and the comprehensively

29
accounted costs of the firm’s output, see figure 3.1. In that sense the concept of added value
from Kay (1993) appears to be a tangible asset.
Figure 3.1 shows clearly that added value in Kay’s (1993) perspective occurs only when the
output revenues are superior to the input costs. Walters (2002) describes this approach of Kay
(1993) “as a proper motivation of corporate activity and the measurement of its achievement”.
Walters (2002) will support Kay (1993) by further emphasising the shareholders’ interest by
stating that: “if marketing is to play a role in the strategy direction of the organisation, it
should consider where best the company can maximise its return”. Walters (2002) as well as
Kay (1993) basically focus on optimising shareholders’ value through return on investment
and return on capital employed, and not on the customer value.
3.1.3 Added value from the customers’ perspective
Added value has been advocated as a strategic tool to achieve competitive advantage in an
increasingly hostile environment. Chernatony et al. (2000) have admitted that little has been
written about added value, and that it was predominantly mentioned in publications related to
trade.
Added value
Capital cost
Materials
Wages and salaries
Capital cost
Input costs
No added value Value is added
Materials
Wages and salaries
> Output revenues
Input costs
Output revenues
<
Input
Gross output %
Figure 3.1: Kay’s added value perspective (Source: Adapted from Kay (1993)

30
Our literature review has revealed that added value has been used in a more descriptive way
instead of being seen as a dynamic concept with a straight forward meaning and role in the
marketing and strategy literature. In their research findings, Chernatony et al. (2000) have
extensively explained the difficulties of determining a consensus over the meaning of added
value. The concept appears to be controversial amongst scholars and leading practitioners in
market research, corporate communication, brand consultancies companies, and advertising
agencies.
Added value has a multiform dimension which stretches from the operational to the strategic
level. Through our literature review we have retained six areas as sources that can generate
added value. These sources are: competition, management competence, process improvement,
innovation, costs, and relationship marketing, see figure 3.5. In this report we will take
Grönroos’ (2000) view of added value as the difference between the customer perceived value
and the core value.
This approach of added value, which has been deducted from Grönroos’ (2000) model of the
customer perceived value, has a more dynamic approach of added value in comparison with
Christopher (1998) for the use of core value instead of core product to describe added value.
The use of the term core product to describe the added value, might literally exclude service
related activities and other sources of added value, and it might also give a static character to
the term core. By preferring core value, we open the possibility to include core product as
well as a core service, and also the management culture.
3.2 Related concepts to added value Despite the diversity in the interpretation of the concept of added value, it is widely associated
to competitive advantage, a tool that assesses firms’ competitiveness and furthermore should
reflect on their customer value. Added value from the customer value perspective as we
understand and would like to develop will require the understanding of concepts related to
added value including customer satisfaction, customer value, and competitive advantage.

31
3.2.1 Customer satisfaction
Customer satisfaction is mostly associated to its measurement which aims to measure how
customers perceive the performance of their suppliers, or as Hill and Alexander (2000) put it
“customer satisfaction is a measure of how your organisation’s total product performs in
relation to a set of customer requirements”. Customer satisfaction measurement is viewed as
one of the most important types of marketing research a firm can conduct, as it provides
useful information on what needs to be improved (Naumann, 1995).
Customer satisfaction has gained such attention from firms, that the firms tend to associate
customer satisfaction with customer loyalty and/or customer retention. Organisations expect
to keep their customers by increasing the customer satisfaction index. We believe the
correlation between customer satisfaction and customer loyalty is not always established, and
depends on two main factors: the degree of competitiveness in the market, and the number of
suppliers in the market.
The more the market is competitive, the less is the correlation between customer satisfaction
and customer loyalty, and the less the market is competitive, the greater is the correlation. In
the same way, the greater the choice for the customer with many offering companies, the
more difficult it will be to secure a loyalty from a satisfied customer. According to Barlow
and Maul (2000, pp256), researchers at Harvard Graduate School of Business Administration
have found that it is only at the highest level of satisfaction that loyalty is created. This shows
that customers’ loyalty is not guaranteed if the customer is just very satisfied, but not highly
satisfied by the service provided.
Customers could be genuinely satisfied by a service provided, but might express a different
view for some reasons. Either the customers make a comparison analysis with other service
providers, or the customers’ expectations have changed and/or risen faster than the service
provider has improved its services. A rigorous customer satisfaction measurement might
address the issues previously highlighted, but fails to do a comparative value assessment
across the marketplace, which could be done by collecting data from competitors’ customers,
and fails to measure the performance of competitors’ services (Gale, 1994).

32
The previous paragraph actually highlights the limits of the concept of customer satisfaction
as a predominant strategic tool to guarantee a company’s competitive advantage. The reason
is that “many of the customer satisfaction surveys appear to be just random data gathering of
customer perceptions and opinions with little effort for intelligent follow-up and meaningful
investigations” (Godfrey, 1993) quoted in Lin and Jones (1997).
Naumann (1995, pp138) advocates another serious issue in failing to conduct an effective and
efficient customer satisfaction programme when he states that: “a poor customer satisfaction
programme not only yields vague data, but also raises customer’s expectations. If customer’s
expectations increase and a firm’s performance do not, customer satisfaction will decrease”.
Indeed the way, and the fact of conducting a customer survey gives the customer the feeling
that the service will be improved; consequently the customer upgrades its expectations.
3.2.2 Customer value
The value of the product depends on where it is located. A product has more value in the
hands of the customer, than on the production site, which means the “value of the product is
not what the producer puts in, but what the consumer get out” (Doyle, 1989). The product has
to solve the concerns of the customer, which could be emotional, psychological, material, as
well as economical. The benefits of the customer’s consumption reveal two characters: the
tangible dimension which is material, and the intangible dimension which is emotional.
The tangible value results from the trade-off that the customer makes between the perceived
benefits of the product, and the price the customer is willing to pay for it. The intangible
dimension of the value is the feeling or emotion expressed regarding the consumption of the
purchased product. The customer feels either satisfied or dissatisfied after consuming the
product. The value of the product goes beyond the physical consumption to reach the feeling
of the customer during the consumption process, which also includes the after-consumption.
That feeling is described as emotional by Barlow and Maul (2000).
Barlow and Maul (2000, pp220) explain the emotional value by arguing that the mistake that
is fixed by the company can end up adding value to customers that would never have been
there if zero defect has been initially achieved. Barlow and Maul (2000) also stress that
“concentrating on emotional value forces companies to look at their customers while

33
concentrating on quality encourages companies, in large part, turn in toward themselves…”
To support that statement, Barlow and Maul (2000) refer to the ISO9000 quality certification
which enables the firms to improve, and provide quality products. Although buyers are
confident that what they are buying meet recognised quality specification, there is no
guarantee that the purchase will meet the buyer’s needs.
The concept of customer value management (CVM) has been initiated by Gale (2000) and
addresses issues which go beyond the traditional customer satisfaction measurement, and it is
praised as the most reliable approach towards customers. ”There are two complementary
approaches to CVM. The first attempt is to measure and evaluate the perceived value placed
on goods/services by customers…, the second approach measures the value of specific
customers or customer segments, to the organisation…”(Evans, 2002, pp134).
Customer satisfaction is embedded in the first approach of CVM, but what the CVM does
further is to identify how customers evaluate competing offerings, and to measure the value
perception of competitors’ customers to establish the market perceived quality and value
relative to competitors. CVM does not just enhance customer satisfaction through quality, but
relates this satisfaction to the price paid to reach the measurement of perceived value and
customer value (Evans, 2002). Leszinski and Marn (1997) state in the McKinsey Quarterly
that customers do not buy solely on low price, they buy according to customer value, that is,
the difference between the benefits a company gives customers, and the price it charges.
Leszinski and Marn (1997) go on by stating that the customer value (CuV) is measured by the
customer perceived benefits (CPB) minus customer perceived price (CPP).
Customer Value = Customer Perceived Benefits – Customer Perceived Price
or
CuV = CPB – CPP
Consequently, the “higher the perceived benefits and/or lower the price of a product, the
higher the customer value” (Leszinski and Marn, 1997, pp100). The customer value in
relations with a changing market share has been illustrated by Leszinski and Marn (1997) in
the map value, figure 3.2.

34
The present map value is based on the assumption that the market share is not static, but
dynamic. The horizontal axis in figure 3.2 quantifies the benefits as perceived by the customer
and the vertical axis shows the perceived price. Each dot represents the competitor’s product
or service. The dots that are located on the value equivalence line (VEL) represent the market
situation where the customer receives what he pays for.
Based on the assumption that the market is not in a monopolistic situation, the share gainer
will be positioned below the VEL because the company operating below is more competitive
in terms of providing higher customer value. Indeed a customer searching for a service or
product in the range of A and B, would more likely choose A since the perceived price of A is
relatively lower than B for the same perceived benefits provided. In the same way the
customer who has the choice between A and C, will choose A because of the relatively higher
perceived benefits A provide for the same perceived price as C.
Equally, the same line of reasoning is true in the area above the VEL described as share loser.
Competitor E who is offering the same level of perceived benefits to the customer as
competitor D will loose market share to D since its perceived price is relatively higher.
Cus
tom
er p
erce
ived
pri
ce
Figure 3.2: Map value (Source: Adapted from Mckinsey Quarterly, 1997, No1)
Value disadvantage
Customer perceived benefits
VEL
Value advantage
Share loser
Share gainer D
E C
B
A

35
3.2.3 Competitive advantage
The ultimate objective of the customers’ perspective of added value is to create competitive
advantage for companies. Competitive advantage is defined by Barney and Hesterly (2006) as
the ability for a company to create more economic value than its rivals. The economic value is
defined by the authors as the difference between the perceived benefits gained by a customer
that purchases the company’s products, and the full economic cost of these products.
Competitive disadvantage occurs when the company creates less economic value than its
rivals.
Sources of competitive advantage/disadvantage
According to Christopher (1998) the competitive advantage has two sources: firstly the ability
of the organisation to differentiate itself, in the eyes of the customer, from its rivals
consequently providing better customer perceived value, and secondly be able to operate at a
lower cost. Barney and Hesterly (2006, pp12) have illustrated in figure 3.3 the different
sources of competitive advantage.
Economic value created = £150
Total cost = £50
Total cost = £60
A)
Firm I’s competitive advantage when it creates more perceived value
Firm I
Firm II
Firm II
Firm I
B)
Firm I’s competitive advantage when it has lower cost
Total perceived customer benefits = £230
Total cost = £50
Economic value created = £180 Total perceived
customer benefits = £200
Total perceived customer benefits = £210
Economic value created = £180
Total cost = £30
Total perceived customer benefits= £210
Figure 3.3: Sources of firm’s competitive advantage (Source: Barney and Hesterly, 2006, pp12)
Economic value created = £150

36
In panel A, firm I and firm II compete in the same market. Firm I generates more economic
value than firm II (£180 > £150) for the same amount of cost, which means, since firm I
generates more economic value each time it sells a product, it has a competitive advantage
over firm II. The authors explain that the competitive advantage of firm I over firm II might
come from the ability of firm I to create comparatively higher customer perceived benefits
(£230 > £200).
In panel B, firm I and firm II have the same customer perceived benefits, but still firm II has a
competitive disadvantage over firm I due to the comparatively lower economic value firm II
has created (£150 < £180). The reason behind this situation is that firm I has managed to
achieve lower cost than firm II, which has enhanced its economic value.
Competitive advantage through the value chain
The value chain is according to Shank and Govindarajan (1993, pp50) a method for breaking
down the chain from raw materials to end customers into strategically relevant activities in
order to understand cost behaviours and the resources of differentiation. While companies
competing within the same industry might have a similar chain, the value chain might differ.
The value chain as a source of competitive advantage is a result of the firm’s history,
management culture, strategy, and approach of implementation (Porter, 1985, pp36).
Porter (1985) divides the generic value activities into two broad activities: primary activities
and supporting activities see figure 3.4 below. Porter isolates primary activities from
supporting activities based on the fact that they are either technically or strategically oriented.
The primary activities are those involved in the creation of the service or product and include:
inbound logistics, operations, outbound logistics, market & sales, and service. The support
activities are divided into four generic categories: procurement, technology development,
human resource management, and firm infrastructure (Porter, 1985). Each of the different
activities is vital for the competitive advantage, and depends on how they can be creative and
performing.

37
3.3 Sources of added value The sources of added value mentioned earlier are presented in figure 3.5. They aim to find the
way for a company to provide added value.
Added value
Costs
Innovation
Process improvement
Management competence
Relationship marketing
Figure 3.5: Sources of added value (Source: Zogbe and Zackrisson)
Competition
Margin
Support Activities
Firm infrastructure
Human resource management
Technology development
Procurement
Inbound logistics
Outbound logistics
Marketing
& sales
Service
Operations
Primary Activities
Figure 3.4: The generic value chain (Source: Porter, M., Competitive advantage, 1985, pp37)

38
3.3.1 Competition
Competition as a source of added value results from the comparison the customer makes
between the service received and the service provided by its suppliers’ competitors. If the
customer is convinced that the service he received is relatively better than what is offered in
the market, then added value occurred for him. The persuasion of the customer can be
achieved by image, marketing, as well as information.
Competition is also one of the most used benchmarks by companies to value the services they
provide. Conceiving an added value by ignoring what the market offers might lead to question
the establishment of that added value. Meaning companies should seek and examine the best
practices and offers in their industry, and use that knowledge as the basis to provide added
value.
3.3.2 Management competence
The management competence refers to the quality of the human resources and their skills and
commitment in what they are in charge of. The management competence is also about the
corporate structure and its management culture. The interaction level between all the
departments and services within the corporate plays a great role in the company’s ability to
get the customers’ intimacy and strategically act upon it. The interaction includes
communication frequency, information transparency, and cross-functional meetings. A close
relationship with the customer might lead to implement some management techniques such as
vendor management inventory (VMI).
Human resources are people from the front-line workers so called blue collar workers to the
executive management who should share and believe in their corporate vision and objectives,
but most importantly should take a very active role in the implementation process to achieve
them. The performance of the transport activities for example can make a difference between
two logistics providers. The transport activity can be described to some extent as a basic
logistics service, but can be a source of added value if it is performed and exceed customers’
expectations in an outstanding way comparatively to what the market offers.

39
People should be treated as the most important asset within the corporate culture as prescribed
by the management philosophy of total quality management (TQM). The questions which
arise are: how to create competence, what to expect from its performance, and how this
competence should effectively be used to give value to the customer as well as to the
company?
Competency is created through the attraction of competent and talented people. It is also
created through a continuous monitoring of the staff performance, the provision of
appropriate training to update staff skills and reinforce their commitment, and develop an
appropriate reward scheme such as a pay rise. This pay rise can be a percentage linked to the
employees individual performance during the past year, or a pay rise that reflects the over all
performance of the company. The company would expect high skilled handling, sharing of
information and knowledge about the customers’ requirements, and anything else which can
be of the corporate interest. The company should also benefit from its staff, more
proactiveness in dealing with customers’ requirements and other disturbances occurring
during the operations.
3.3.3 Process improvement
A process is a critical part of any business as its design and improvement can achieve
significant productivity, optimisation, and costs reduction which implicitly will contribute to
create value for the customer and for the company. Process is described as the way of
planning, implementing, and controlling the efficient and effective flow and storage of goods,
services, and related information from the point of origin to the point of consumption for the
purpose of confirming to customers’ requirements.15
Simply defined as “how things get done” by Jackson (1994), the process is precisely a
benchmark against the way of doing things at the right time, in the right manners, at the right
place, for the right target to reach the set up objectives. To do things right will involve a
setting up of a dynamic structure which align with the defined objectives and supported by a
system planning to reduce errors and wastes. It will also involve the acquisition of appropriate
equipment, machinery, and technology to deal with customers’ increasing demands.
15 Logistics dictionary

40
Processes in logistics are basically operational and deal with activities such as pick-up,
transportation, warehousing, distribution and delivery, and network planning. The success of
these different processes and their ability to be a source of added value will depend on the
implementation of successful and advanced application of information technology and
information system for instance the electronic data interchange (EDI) and the global
positioning system (GPS) an advanced track & trace service. There are many other
information technologies and systems for instance the radio frequency identification (RFID)
and the warehouse management system (WMS).
The network planning process should serve as the base to implement the integrated four
processes mentioned above. The network planning could be based on country, regional,
continental, or global level depending on the company’s willingness to be a truly global
company and the logistics solutions required by its customers.
3.3.4 Innovation
Innovation can be described as the ability to create and revitalise, in a distinctive way, the
business idea/concept of the company to always value the customer and/or satisfy the
customer, also to respond to the market competitiveness and be differentiated by using the
competencies, resources, and business systems of the company. Innovation is a key factor if
the company wants to grow, be ahead of the mainstream and stay in the business.
According to Lorente et al. (1999), innovation can take several forms in products, services,
production processes, and management systems. They go on and explain the forms as follows:
innovation in products and services is related with R&D and meeting customers’ needs.
Innovation in production processes relates to changes in machinery, equipments, and other
elements not directly associated with the manpower; however has the aim of increasing
productivity through increasing quality and reducing costs. Innovation in respect with
management systems is in response with new environmental conditions and improving the
way people are managed and work is organised.
Be innovative is to be creative to meet customers’ expected as well as unexpected
requirements with new ideas, new approaches of problem solving, and new products or
solutions.

41
3.3.5 Costs
A cost reduction should in normal circumstances lead to a price cut of the service offered for
the same quality. Consequently the customer perceives a relative higher benefit or value for
the service received, and subsequently it is described as an added value. The cost cuts in the
supply chain which do not affect the quality level of the service provided can be branded
unnecessary costs. What are the sources of unnecessary costs within the supply chain which
include logistics activities, and how would the cost reductions occur are two questions that
should be looked at.
Unnecessary costs are associated with wastes in the supply chain and operations management
literature, and have been the object of the emergence of the lean thinking concept. The lean
thinking concept is basically a strategic and operational philosophy which aims to identify
and eliminate muda (waste) in the entire supply chain. “A critical point in the lean thinking is
the focus on value. Often however, value creation is seen as equal to cost reduction” (Hines et
al., 2004, pp995). The concept of lean thinking emerged on the shop floor of Japanese
manufacturers and particularly at Toyota Motor Corporation resulting from a scarcity of
resources and an intense domestic competition on the Japanese market for automobiles (Hines
et al., 2004, pp994).
Initially developed in 1995 according to Hines et al. (1998), the value stream mapping
appears as a tool to achieve the aim of the concept lean thinking. The aim to determine what
operation is non-value adding, what operation is necessary but non-value adding, and what
operation is value adding. Toyota Production System (TPS) has defined seven wastes:
overproduction, waiting, transport, inappropriate processing, unnecessary inventory,
unnecessary motion and defects. Initially applied to the manufacturing activity, these seven
wastes can also be true for a logistics service provider. Three of the wastes need to be
explained as difference might occur when it comes to services instead of products. The term
overproduction put into that context would be described as a situation where the service
provided is over the necessary request. The defect as waste should be perceived as a failure in
the delivery process of the service. Although being a core competence of a logistics service
the transport could actually be reduced by providing hubs to shorten the distance between
suppliers and customers.

42
Another way of determining unnecessary costs is the use of the activity-based costing (ABC)
analysis. Here causes and effects relationships between inputs and outputs are identified
within the supply chain, in order to define the true costs of operations and identify those
which are unnecessary and unproductive. The ABC analysis implies in its first step two
distinct initiatives: “identify firm resources and mapping firm activities, firm resources
include direct and indirect costs of operations” (Goldsby et al., 2000, pp502). The second step
is about tracing costs from resources to activities mapped out in the previous step. The aim in
the second step is to identify the costs drivers per activity. The final step will be concerned
with tracing the costs from activities to costs objects to identify areas of high overhead costs
per unit.
3.3.6 Relationship marketing
Added value is also about perception and feeling; in that sense marketing and particularly
relationship marketing can play a great role. Grönroos (2004, pp99) describes the relationship
marketing perspective as being based on the idea that “on top of the value of products and/or
services that are exchanged, the existence of a relationship between two parties creates
additional value for the customer and also for the supplier or the service provider. An on-
going relationship may offer the customer security, a feeling of control and a sense of trust...”
He goes on and defines three areas that are vital for the success of relationship marketing: the
interaction, a planned communication, and the value process involvement.
According to Grönroos (2004, pp.102), the interaction in the context of relationship marketing
implies that the service provider should shift its focus from the product to the customer’s
internal value-generating processes at the centre of marketing. The planned marketing
communication as he explains it, is predominantly mass marketing with a growing emphasis
on direct marketing. We believe, the service provider needs to inform its industry market in
general and particularly its customers on how the work is done, its results, its projects, and its
distinctive competences. The service provider can improve customers’ perceptions on the
services provided through information and communication, in which it can highlight and
promote its services features which might have been taken for granted.
In the value process as an area of relationship marketing, Grönroos (2004) encourages the
involvement of the service provider in the internal value process of the customer. To do this,

43
in order to have a better knowledge of the customer, and consequently align successfully its
resources and competences which will eventually lead to an additional value creation. He also
adds that this creation of value should be supported by a marketing communication.
3.4 Characteristics of added value When studying the characteristics of added value we will be looking into the distinctive
features of added value, and how added value can be identified over time. Knowing the
characteristics of added value are particularly interesting in the sense that it will highlight the
evolutive and changing dimension of the concept.
3.4.1 Added value and life cycle
The concept of added value is a dynamic concept which changes over time and over some
various determinants such as customer maturity, industry competition, market development,
and political & cultural development. What is seen as added value today might not be the
same tomorrow depending on what the sources are.
A new product, solution or idea brought into the market can provide an added value over time
until the mainstream catches the same idea, reproduce and proliferate it. Once the same
solution is widely offered in the market, in the same manner, the distinctive character of
innovation can no longer be prevailed. The solution falls into the range of standard solution,
and therefore becomes an obsolete selling argument to value customers. Figure 3.6 shows the
life cycle of added value over time.

44
From the introduction to the growth stage, the new product, solution or idea has a potential to
provide added value. At the maturity stage, customers start questioning the relevancy of the
added value because of the widespread availability of the idea across the market. Unless the
provider of the new idea does something to revive its idea, the idea will loose all potential to
create added value. For instance if the idea was in terms of process improvement, the speed of
that improvement could be something new and distinctive if all competitors did improve their
processes.
Point A in figure 3.6 shows the time where firms have to probably revive their idea or decide
to focus on something else. Revive the new idea which is about to decline will be an
opportunity to create further potential of added value shown by the red dotted line after point
A.
Figure 3.6: Life cycle of added value (Source: Adapted by Zogbe and Zackrisson)
Time
Added value
Introduction Maturity Decline Growth
A

45
3.4.2 Measurement of added value
The measurement of added value that we are proposing is deducted from the original formula
of the customer perceived value (CPV) by Grönroos (2004, pp141):
Customer Perceived Value (CPV) = Core Value (CV) +/– Added Value (AV)
We deduct the added value formula from the above equation and write:
Added Value = Customer Perceived Value – Core Value
or
AV = CPV – CV
Core value (CV) is defined by Grönroos and quoted by Khalifa (2004) as the benefits of the
core solution compared with the price paid. We understand that the core value is materialised
by the product or a solution at a selling price in the market. Zeithmal (1988) defined the
customer perceived value (CPV) as the consumer’s overall assessment of the utility of a
product based on the perception of what is received and what is given. We suggest that the
assessment goes beyond the direct benefits received to also include the indirect benefits
gained by buying the product or the service. As pointed out by Grönroos (2004), the
relationship between the customer and the service provider might have a major effect on the
total value perceived.
There is a possibility to have a negative added value depending on the weight and the
performance of the CPV in comparison with the CV. For instance if the product is sold at a
price higher than the benefits it provides, the core value will tend to be negative. In the same
way, if the customer perceived benefits is less than expected then the customer perceived
value becomes lower and tends to be negative.

46
4 Empirical findings This chapter will be concerned with presenting the results of the questionnaires and the
interviews, which details can be found in appendix 1 and 2. We will begin with explaining the
techniques used in processing the questionnaires and the interviews, and then present the
questionnaire and interview findings. We will mainly focus the findings on the customers’
perspectives.
All answers, both from the questionnaires and the interviews, were split into our research
market’s different interview groups: VLC (personnel including the two logistics experts),
customers, and competitors. Out of the 25 people that we contacted we interviewed 24, only
Volvo Aero was not interviewed, and we received back 24 questionnaires though VLC’s HR
manager declined to fill it in.
4.1 Processing collected data As mentioned in the research methodology chapter “data are any type of information collected
for use in research” (Lodico et al., 2006, pp66). Lodico et al. (2006) divide data into three
different types: numerical, verbal and graphic information. As soon data are starting to be
collected by the researcher it needs to be processed, so that the data gathered can be structured
before being analysed. Structuring the data collected helps the researcher to easier analyse it.
4.1.1 Processing quantitative data
Our questionnaire has been organised by using the interval scale layout and a mix of two
question formats and two types of scales. The summary of the questionnaire processing in
table 4.1 shows that we will use three different approaches.

47
Question format Type of scale Question Number
Matrix questions format
Semantic differential format
Likert scale Numerical Scale
Question 1 X X Question 2-4 X X Question 5-6 X X Question 7-8 X X
Table 4.1: The questionnaire processing summary
We collected the quantitative data and transferred the information into excel. After the
transfer we started to look at the measures of central tendency. According to Lodico et al.
(2006) the three most common are mode, mean, and median. We choose to use primarily the
mode, and then the median whenever a mode is lacking.
If one or more of the measures of central tendency have been used these can be compared
between the interview groups. If the distribution of the data has more than one cluster of
frequency, meaning the distribution has more than one mode, there will be a so called
bimodal distribution. If there was a bimodal distribution we have looked at the percentage
representing the occurrence of the modes to see which mode was given higher ranking.
Processing of question 1
The question has been set in the semantic differential format with a numerical scale. Question
1 is a prerequisite question for the report and also for the credibility of the respondent
regarding the understanding of the added value concept. The question is aiming to weigh
across our three different groups of respondents the ability to identify added value based on a
7-point scale. We have used the pie chart to illustrate the findings.
Processing of question 2 – 4 and 7 – 8
These questions have been set using the matrix questions format and the numerical scale. The
questions are aiming to know the specific drivers of the respondents’ perceptions of added
value, and the intensity of those drivers in the respondents’ conceptions, which naturally will
lead to establish the rate of importance. We have established the ranking of the overall group

48
of respondents by using the mode. We have used the histogram graph to show the drivers for
each group within our research market, and then used the soft line graph to compare them.
Processing of question 5
This question is a combination of the matrix question format and the likert scale. It aims to
establish which of the current services provided by VLC are perceived as added value
services, have a potential of becoming adding value services, or are primary services. The
mode (M) within each group of questions will be used as follows: if M ≤ 4 the service will be
described as a primary service, if 4 < M < 7 the service has a potential of adding value, and if
M = 7 the service is an established added value. A table has been used to summarise the rate
given by each respondent group.
Processing of question 6
Question 6 has the same format as question 5, and has been summarised in the same way. The
question is to find where in the order processing VLC could put more emphasis in order to
deliver added value. The mode (M) will be used as follows: if M ≤ 4 the customers do not
expect any added value, and if M > 4 the expectations of added value are not yet fulfilled.
4.1.2 Processing qualitative data
Processing and analysing of qualitative data will be an ongoing process from the time the data
have been collected, until the researcher considers the analysis as complete. It is an iterative
process (Lodico et al., 2006).
For this research we transferred each interview from the tape into a written text. This transfer
was only to help us to fill in the gaps in our notes, and write down exactly what the
interviewee has said. When having the interview answers written down it was easier for us to
code the answers. “Coding is the process of identifying different segments of the data that
describe related phenomena and labelling these parts using broad category names” (Lodico et
al., 2006, pp.305).

49
We have two general questions that are the same to all the interviewees, and one question that
is the same for VLC and its customers. These answers were grouped during the processing.
The remaining questions were more specific for the individual group and have been processed
separately.
4.2 Questionnaire findings Our questionnaires were very much the same for all the respondents, only some minor
changes related to the interview groups were made. The questionnaires were made out of
eight questions using various and combined techniques as described above in table 4.1. All
the underlying data to the graphs/tables related to question 2 until 8 are to be found in
appendix 3.
4.2.1 Findings on question 1
Would you be able to identify added value services?
Our literature review and the pre-interview meetings with our VLC supervisor Johan Lindh
and his colleague Eva Viktorsson, VLC manager for Global Development Outbound, gave us
an idea of a discrepancy in the understanding of the concept of added value. Question 1 of the
questionnaire relates to the ability of our research market to identify an added value. The
question was a prerequisite to further investigate the concept in its entire dimension. The
question displayed a rating scale of seven, one (1) representing not at all and seven (7)
representing every time.
As presented in figure 4.1 the response of the question showed that 16.7 percent of the VLC
representatives believe to identify added value every time it occurs against 12.5 percent of the
customers, and 0 percent of the competitors. For the average knowledge of added value
VLC’s stakeholders feel confident while 25 percent of the customers are not sure about their
ability against 16.7 percent for VLC, and 33.3 percent for the competitors.

50
VLC
16.7%
33.3%33.3%
16.7%
4 5 6 7
Customers12.5%
12.5%
25.0%
12.5%
37.5%
3 4 5 6 7
Competitors
33.3%
66.7%
4 5
Figure 4.1: Response on question 1
4.2.2 Findings on question 2
Of the below descriptions of added value service how would you grade them according
to your priorities 1 = less important and 7 = most important?
We provided our respondents with some definitions of added value, and we wanted to see
how they graded them to know which one of the definitions reflect their understanding of
added value the most. Every definition was emphasising a keyword so the choice could help
us to determine the drivers they prioritise in their perception of added value. The keywords
emphasised were: competition, management/handling, innovation, processing, and cost. The
full text of each definition can be found in appendix 3.1. Figure 4.2 shows the pattern of our
findings on question 2.
Question 2
0123456
Compe
tition
Manage
ment /
Handlin
g
Innov
ation
Proces
sing
Cost
Descriptions
Prio
rity VLC
CustomersCompetitors
Figure 4.2: Findings on question 2

51
The above graph actually shows the existence of a discrepancy between VLC and its
customers in terms of what counts the most when describing added value. The main priority
of the customers was the definition related to cost, and then came equally the definitions
related to competition and innovation. VLC, on the other hand, is more focused on the
management/handling and the processing in its definition of added value. In addition to the
above facts, the graph also shows an overall symmetric opposition between VLC and its
customers, and a smooth synergy between the customers and the competitors.
4.2.3 Findings on question 3
How would you identify added value services 1 = low and 7 = high?
Once our respondents had defined added value and set the direction in terms of which areas
are in focus to deliver added value, the question 3 is to know whose judgement or expertise
matter when it comes to agree on the identification of added value. Five choices have been
displayed which are based on: the customers’ perception; the respondent’s personal
perception, the respondent is here considered as a logistics actor; the comparison made with
competitors’ practices; the respondent’s corporate standards; and the description made by
the customers or suppliers. Figure 4.3 shows the pattern of the results, and the more detailed
information can be found in appendix 3.2.
Question 3
0123456
Cus
tom
ers'
perc
eptio
n
Pers
onal
perc
eptio
n
Thro
ugh
com
petit
ors'
prac
tices
Thro
ugh
corp
orat
est
anda
rds
Whe
neve
rde
scrib
edby
sup
plie
rs/ c
usto
mer
s
Descriptions
Iden
tific
atio
n fa
ctor
VLCCustomersCompetitors
Figure 4.3: Findings on question 3

52
In contrary to question 2, there is a synergy between VLC and its customers comparatively to
the competitors. The statements made through customers’ perception and whenever described
by customers or suppliers as a reflection of the added value are strongly shared by all three
groups. There is however a disagreement regarding the personal perception to identify added
value. The customers give more credit to their own individual opinion in making a statement
over added value while VLC and the competitors do not.
4.2.4 Findings on question 4
How do you benchmark the added value services you/VLC provide 1 = low and 7 =
high?
This question aims to determine how added value is benchmarked. This question is basically
to find out how a potential added value service is benchmarked to conclude its existence or
not. The question might to some extend be confusing with question 3, but it should not be,
because the idea behind the two questions are different. The different benchmarks proposed to
the respondents were: the corporate perceptions; the customers’ perceptions; the competitors’
practices; the corporate standards; and finally whenever described by suppliers or customers.
The corporate standard is different to the corporate perception, as the former is a written
guideline or objectives set by the corporate, while the latter are the overall opinions of
managers and directors of the corporate. Figure 4.4 shows the pattern of the results, and
appendix 3.3 provides more detailed information.
Question 4
0123456
Agai
nst
corp
orat
epe
rcep
tions
Agai
nst
cust
omer
s'pe
rcep
tions
Agai
nst
com
petit
ors'
prac
tices
Agai
nst
corp
orat
est
anda
rds
Whe
neve
rde
scrib
edby
sup
plie
rs/ c
usto
mer
s
Descriptions
Ben
chm
arki
ng g
rade
VLCCustomersCompetitors
Figure 4.4: Findings on question 4

53
The three parties disagree on how to benchmark an added value service. For VLC,
benchmarking against the description made by the customers and the customers’ perceptions
are the most important ones. For the customers, benchmarking against corporate perceptions
and at a lower degree against competitors’ practices is important, while competitors favour
their corporate standards and the description made by their customers.
4.2.5 Findings on question 5
To what extent do you agree or disagree that the below services provided by VLC/your
company are added values?
With this question, which actually scrutinise the services provided by VLC, we have tried to
group the services based on the segmentations used by VLC. The question has been asked to
competitors just to know their opinion as they might not provide the same type of services. As
shown in the table 4.2 each customer has a different view on the services provided by VLC.
Customers Competitors VLC VAC VBC VCE VTC MT RT VCC DHL DFDS Schenker
Complete solution 6 7 4 6 6 4 4 2 6 4 2 Design, planning and execution 5 6 4 2 7 6 6 5 7 4 5 Cross-docking activities 5 4 4 2 7 4 4 7 3 5 2 Information flow 6 7 4 4 7 4 4 7 5 5 6 Management 5 4 5 2 6 4 6 7 5 6 7 Warehouse 5 6 4 6 0 4 4 6 2 5 5 Logistics services 5 5 4 6 7 4 4 4 4 6 7 Risk management 5 5 5 2 7 4 6 7 6 6 5
Others 4 4 5 2 4 4 4 4 5 5 6 Table 4.2: Findings on question 5
The table shows that the information flow, the risk management service, and the cross-
docking activities are the current services provided by VLC where at least two customers
believe there is added value. VLC does not appreciate its own services at the same level as its
customers. VLC sees the offer of the complete solution as a high potential added value
service, a view which is not shared at the same level by all the customers, neither by the
competitors. The customers as well as the competitors do not believe that providing the
complete solution is on its own an added value service. Four out of seven customers do not

54
perceive any added value in the current services provided by VLC. They however find a lot of
the services having a real potential to deliver added value. The customers who need to be
convinced with regard of the VLC services to be added value are Volvo Construction
Equipment, Mack Trucks, Volvo Buses and Renault Trucks.
4.2.6 Findings on question 6
In which step of the order processing (from order placement to order delivery) do you
believe an added value service can be provided by VLC/your company?
The question was aiming to know where in the current services provided by VLC customers
have strong expectations of improvement and where they believe potential exists to deliver
added value. Once again we have grouped all the services based on VLC’s segmentation,
however this time some services have been split because we believe they are specific, such as
track & trace, and they need to be highlighted, see table 4.3.
Customers Competitors VLC VAC VBC VCE VTC MT RT VCC DHL DFDS Schenker
The logistics system (IS/IT) 6 6 5 6 7 7 6 6 6 6 6 The JIT process management 7 5 5 2 7 6 5 7 6 6 6 Cross-docking and dispatch 5 5 4 2 7 6 4 4 5 6 7 Warehousing 6 4 4 2 7 4 4 3 6 6 7 Logistics services 5 6 5 6 6 5 5 5 2 6 0 Risk management 6 6 5 2 7 6 7 7 6 6 6 Customs/documentation handling 6 5 5 2 7 6 4 7 5 6 6 Customer service 5 4 5 6 6 4 3 7 6 6 6 E-business 5 5 5 6 6 6 4 7 3 6 6 Cost control 4 6 5 6 7 7 5 7 5 6 6 Secrecy transportation 5 4 4 2 4 4 2 5 3 6 4 Track and trace 5 6 4 2 7 7 6 7 7 6 7 Damage prevention/quality assurance 5 6 5 2 7 7 6 7 5 6 5
Table 4.3: Findings on question 6
Once again customers have different views on what they expect as added value. However four
out of the 13 services listed, rated by at least two customers are subject of higher expectation
to deliver added value, and they are: risk management, cost control, track & trace, and the
damage prevention/quality assurance. They are followed by three others services, the logistics

55
system (IS/IT), the JIT process management, and the customs/documentation handling. VLC
does only share the customers’ view regarding the JIT process management.
4.2.7 Findings on question 7
Of the below values what do you consider in evaluating the added value services 1 = less
important and 7 = most important?
We wanted to know from a list of six values which are the most important when evaluating a
service as added value, see figure 4.5. Appendix 3.6 shows the underlying data.
Question 7
01234567
Pric
ing/
valu
efo
r mon
ey
Cus
tom
ersa
tisfa
ctio
n
Rel
iabi
lity
Cre
atio
n of
com
petit
ive
adva
ntag
e
Flex
ibilit
y
Man
agem
ent
expe
rtise
Descriptions
Eva
luat
ion
grad
e
VLCCustomersCompetitors
Figure 4.5: Findings on question 7
Customer satisfaction and creation of competitive advantage are values strongly shared by
VLC and its customers as a part of the evaluation criteria of added value. Figure 4.5 show this
through the intersection for the two lines. Flexibility is also an important element for
customers and for the competitors but VLC demonstrates less interest in this regard.

56
4.2.8 Findings on question 8
How would you grade your contractors/VLC on the following four dimensions of
services?
As we already mentioned in the introduction chapter, VLC contracts hauliers and other
logistics service providers to provide logistics services on its behalf. Question 8 aims to know
what was expecting from the contractors when performing their duties. A list of four strengths
has been provided to choose from. Figure 4.6 summarise the results of the respondents, and
appendix 3.7 shows the more detailed information.
Question 8
0
1
2
3
4
5
Reliab
ility
Respo
nsive
ness
Assura
nce
Empathy
Descriptions
Gra
ding VLC
CustomersCompetitors
Figure 4.6: Findings on question 8
Responsiveness is most important for VLC, and secondly comes the reliability. The assurance
sounds to be the highest priority for the customers and this concern is well shared by the
competitors. Unfortunately VLC in this regard lacks to back its customers’ opinion as the
graph shows that assurance comes only third for VLC.

57
4.3 Interview findings As mentioned in the research methodology chapter we had a base of questions which we
adapted to each individual or group of interviewees. Some interviewees were given the same
questions and those were divided into five groups: regional managers, Vision 2015, logistics
experts, customers, and competitors. We will present the empirical findings from the
interviews per customer and per competitor against VLC as a whole. Appendix 4 provides the
underlying tables used in the interview findings.
In this section we will use abbreviations related to each customer: Volvo Bus Corporation
(VBC), Volvo Construction Equipment (VCE), Volvo Truck Corporation (VTC), Mack
Trucks (MT), Renault Trucks (RT), and Volvo Car Corporation (VCC).
4.3.1 General questions to our research market
Amongst our interview questions we had two general questions that were the same to every
one in our research market. These two questions were related to what the individual
interviewee sees as added value activities in the automotive logistics industry today, and what
s/he believes will become added value activities in the future. The questions aim to know the
mindset of the interviewees regarding added value.
For these two general questions our 24 interviewees were not only divided into the original
three interview groups, but also divided into ten groups though each customer and each
competitor is looked at separately while VLC is seen as one unified company.
After coding all of the interview answers related to the two questions we came to six
categories that summarises the answers in a presentable way. As shown in table 4.4 and 4.5
below the categories are: general management competency & strategy, business relationship,
cost reduction, logistics competence & strategy, IS/IT system, and finally VLC’s core values.
What the categories include is listed in appendix 4.1.
Due to the high number of interviewees within VLC the chance to have widespread opinions
is greater which explains why VLC is in each of the six categories for both added value

58
activities today as well as for the future. However, this does not mean that everyone within
VLC agrees to it, but it represents a view within the corporation.
Which activities are seen as added value activities within the automotive logistics
industry today?
As shown in table 4.4, five out of six customers believe that activities we have grouped under
logistics competence & strategy such as proactiveness, continuously improvements, precision,
and lead time reduction deliver added value today.
VLC Customers Competitors VBC VCE VTC MT RT VCC DFDS DHL Schenker General management competence & strategy
X X X X
Business relationship X X X Cost reduction X X X X X X Logistics competence & strategy
X X X X X X X
IS/IT System X X X X X X VLC’s core values X
Table 4.4: Summary of added value categories today
VBC, VTC, and VCC then consider cost reduction as an added value activity, particularly
activities such as consolidation, utilisation, and risk management. VCE, MT, and RT mention
IS/IT system where they all stress the ability to track & trace a shipment or parts of a
shipment. All three agrees however that the track & trace service can be improved to add
more value than it already does today.
If we look at the competitors there is not one out of the six categories that all three of them
agree is an added value activity today. However they all agree on that VLC’s core values are
not added value activities today. This perception is, in this question, shared with all the
customers, making VLC the only one with the perception that its core values do add value
today.

59
Which activities are believed to be seen in the future as added value activities within the
automotive logistics industry?
VLC, the customers, and the competitors all agree that added value in the future will come
from the activities within the category logistics competence & strategy as shown in table 4.5.
The customers would like to see emphasis being put on creating competitive advantage by
managing long and complex supply chains, have logistics hubs to shorten the distance
between the parts suppliers and the customers, as well as offering the customers vendor
managed inventory (VMI).
Seven out of the ten groups, whereof four customers, then put the focus on IS/IT system.
Information technology is a part of the future challenges, and it should be able to deliver real
time information, create more transparency in the different flows, as well as give early
warnings when abnormalities occur.
VLC Customers Competitors VBC VCE VTC MT RT VCC DFDS DHL Schenker General management competence & strategy
X X X X
Business relationship X X X X Cost reduction X X Logistics competence & strategy
X X X X X X X X X X
IS/IT System X X X X X X X VLC’s core values X X Table 4.5: Summary of added value categories in the future
General management competence & strategy and business relationship are sharing the third
place of importance for providing added value in the future. VLC’s general management
competence & strategy covers VLC’s global presence, its flexibility, and its ability to
innovate. The two keywords in the business relationship are communication and trust.
For the future added value activities VLC is supported by VCE when it comes to the core
values. VCE mentions that activities related to the environment and security will increase in
importance, and to offer these services will add value.

60
To summaries the activities that are mainly seen as added value activities today as well as in
the future by the majority of our interviewees are the activities within the two categories
logistics competence & strategy, and IS/IT system.
4.3.2 General question to VLC and its customers
What should VLC do to increase its customer satisfaction, flexibility, and reliability?
The question was asked to both VLC and its customers, and with this question we wanted to
see where VLC and the customers put their focus. As shown in table 4.6 we coded the
answers into seven different categories which speak very much for themselves. The tables
related to flexibility and reliability can be found in appendix 4.2.
Table 4.6 shows that VLC stresses six of seven categories to improve its customer
satisfaction. The only category that VLC do not focus on is IS/IT system. Looking at the
customers responses four out of six mean that VLC should first of all focus on its general
management competence, and secondly on proactiveness to be able to improve its customer
satisfaction. While proactiveness speaks for itself the customers want to see VLC focus on
training its personnel on problem solving.
Customers
VLC VBC VCE VTC MT RT VCC
General management competence X X X X X Business relationship X X Cost transparency X X X Processing transparency X X X Proactiveness X X X X IS/IT System X Continuous improvement X X X
Table 4.6: Improvements needed to increase VLC’s customer satisfaction
Also for improving VLC’s flexibility and reliability the customers stress the importance of
changes in VLC’s general management competence. Customers suggest that VLC should, to
improve its flexibility, limit and define its scope of competency, and focus on doing the
current services 100 percent before adding on new ones. For improving VLC’s reliability the
customers mention capacity of both equipment and staff, and that VLC is today dependent on
its contractors.

61
Four out of six customers mention that they experience VLC as reliable or even very reliable,
whereas only two, VCE and MT state that they find VLC flexible. VLC personnel do believe
the company is very reliable and that VLC is too flexible. To improve its flexibility the
personnel state that VLC has to change and to become flexible in a smarter way in the future
compared with today. With smarter they have mentioned that VLC might have to say no to
some requests from the customers, though VLC knows that in the long run it will not work or
it will be too high costs involved.
4.3.3 Findings on the questions to VLC’s customers
Since all customers interviewed were given the same questions we here want to summarise
their answers to the questions related to the top added values in their whole supply chain;
their key buying criterion; added value services provided by VLC today compared to
competitors; what VLC’s competitors do better today; of the VLC services what is good now,
what needs to be improved, and what is missing; if the customers feel that VLC is doing
everything it can to best serve them; and finally VLC’s core values. Appendix 4.3 shows all
the tables that have been used to process the empirical findings from the customers.
Which are the top added values in the whole supply chain for your company?
We wanted to find out what the different customers see as added value activities in their
whole supply chain, not only regarding the logistics services. Our findings show that VTC
only sees the manufacturing activities as added value activities and the remaining activities
they believe are only adding costs. The other five customers see more activities as added
value activities within the whole supply chain. The reoccurring ones can be grouped into
quality, lead time in the whole supply chain, precision, material control, and relationship
within the complete supply chain.
What is your company’s key buying criterion when dealing with VLC or its
competitors?
When looking at the customers’ key buying criterion the majority of the customers see the
price/costs of the service as the main buying criteria. This is then followed by quality, lead
time, and flexibility.

62
Which kind of added value services does VLC offer that no other company does, if any?
We wanted to know if VLC offers any services that the customers perceive as added value
that is not offered by VLC’s competitors. The answers given are presented in table 4.7. Five
out of the six customers state that VLC offers added value services that no other logistics
service provider do. The keyword from four of the customers is founded in business
relationship, all refer to the close business relationship they have with VLC. VBC however
focus on VLC’s logistics competence & strategy.
Customer Added value services only provided by VLC and not by competitors VBC Better price per kilogram, due to consolidating services for the whole Volvo Group.
Returnable pallets. VCE Better understanding of VCE
Closer relationship Same core values
VTC IT systems such as A4D and the coming ATLAS Co-ordination of the whole supply chain
MT None. RT Risk management
Claims handling Loading tests Delivery accuracy and information
VCC High knowledge of VCC culture, processes, and systems Cost savings
Table 4.7: Added value services only provided by VLC
In the areas/activities where your company is not using VLC, what do the VLC
competitors better than VLC?
On this question the three Volvo business areas VBC, VCE and VTC did not answer though it
was not applicable for them in Sweden since they all use only VLC. However for MT, RT and
VCC there were some activities where VLC could not out conquer its competitors. MT
reckons that VLC’s competitors in the U.S. market have a better and more mature delivery
system related to outbound. MT is also dependent on the sub-contractors for their data
information. Both RT and VCC mention that the competitors are doing better when it comes
to flexibility as well as relation with dealers or transporters. RT sees also that competitors are
better with national call centres available for both RT and RT dealers. VCC states that VLC
must benchmark more against competitors to reach the level that the competitors do today.

63
Of the services provided by VLC today what is good now, what needs to be improved,
and what is missing?
This question is very essential, and with this information VLC can see what the customers
appreciate today of VLC’s service offerings, and what the customers would like VLC to focus
on in the future for each one of them. The answers to this question have been summarised in
table 4.8 below. Looking at VLC’s largest external customer VCC, they are concerned about
VLC’s strategy. VCC would like to receive a clear direction of VLC’s long term strategy to
see if it is align with VCC’s long term strategy. This will help VCC to decide if VLC will
continue to be their main logistics service provider in the future or if they should look towards
other solutions.
Does your company feel that VLC is doing everything it can to be able to serve your
company in the best way?
Of the six customer groups interviewed only VTC feels that VLC is not doing everything it
can to best serve them. VTC would like to see more flexibility and innovation from VLC.
VCC does believe VLC is doing everything for them, but has chosen to exclude the IT
optimisation systems where they believe VLC can do more already today.
Do you see the quality, environment, safety and security offerings as added value
services?
VLC sees its core values: quality, environment, safety and security as added value activities
which are shown in table 4.4 and 4.5. On the two general questions related to added value
services today and in the future only VCE mentioned the core values as added value activities
in the future specifying environment and security. However on the direct question if the
customers see VLC’s core values as added value services we received a different answer. The
two customers VBC and RT do not see VLC’s core values as added value services; instead
they state that they are standard services. VCE does see the core values as added value
services, but believe that they should be standard today, however so far they are not. The
remaining three believe that the core values are added value services.

64
Customer What is good now? What needs to be improved? What is missing? Volvo Buses • Improvements based on the yearly
survey. • Cost/price structure
development. • A logistics hub in Europe.
Volvo CE • Good co-operation on daily bases. • Very good management logistics
services. • Good financial routines.
• Quality and capacity in the cross-docking activities in Gothenburg.
• Track & trace on component/part level. • Marketing what has been achieved in environment and
safety issues.
Volvo Trucks • Good transportation. • Good operational service. • Good network. • Good global presence.
• Improvements in emballage (ISPM)
• Cheaper emballage service.
• More active in being service provider for the customers’ suppliers. VLC should show the customers’ suppliers that they are capable to do the service. VLC must be more visible.
• Take full responsibility of the contractors. Mack Trucks • Good business relationship. • Cost/price transparency.
• Activity-Based Cost analysis. • Marketing of the service offers.
Renault Trucks
• Close relationship with VLC in Lyon.
• Involvement in discussions and projects at Renault Trucks.
• Re-engineering traffic/transport planning. (Current routes are out of date)
• The speed of improvement.
• More operational staff dedicated to Renault Trucks. • To be able to reach VLC staff better and longer hours.
Volvo Cars • Very good co-operation. • Good logistics service provider
management. • Good traffic management. • VLC’s good relationship with
Gothenburg harbour, shipping liners and transporters.
• The speed of improvement. • The speed of taking on new
technology. • IT systems for transport
network planning and optimisation.
• Transparency and communication regarding VLC’s long term strategies, priorities and directions.
• Systems to support a global network plan. • Catch new ideas and implement them.
Table 4.8: The customers ’ answers related to the question regarding what is good now, what needs to be improved, and what is missing

65
4.3.4 Findings on the questions to VLC’s competitors
The three competitors that we interviewed all received the same questions, and here we want to
summarise their answers related to the threats they see from competitors, what the most frequent
requirements are from their customers, the main challenges they see in their customers’
requirements, how they measure added value from their customers, and finally if they see VLC’s
core values as added value services. All tables used to process the empirical findings from the
competitors can be seen in appendix 4.4.
What does your company see as threats from competitors?
On this DFDS answered that they do not see competitors or their services as threats, however
DHL and Schenker both see potential threats from competitors. DHL sees a threat if VLC
decides to reduce its number of hauliers used today. This would lead to an even more
competitive environment, and the service offerings would be very much the same amongst the
remaining ones. However DHL is at the same time confident that they would be one of the
remaining hauliers, though they believe they are in the top of the hauliers used by VLC today.
Schenker sees new entrants in the industry that are willing to invest heavily and maybe run the
business with a loss the first few years as the largest threat.
What are the most frequent requirements from your customers?
The most frequent requirements that VLC’s competitors receive from their customers are first of
all related to the price of the service. This is then followed by flexibility which is important in
the automotive logistics industry. After the top two requirements come reliability, performance,
precision, and quality.
What do you generally see as the main challenges regarding customers’ requirements?
The main challenge faced by the competitors regarding their customers’ requirements is first of
all the ability to recognise the real requirements of each customer to be able to satisfy them. The
second major challenge is flexibility when it comes to capacity. A third challenge is that it is
difficult for them as logistics service providers to plan after numbers that are estimated instead of
having access to true numbers.

66
How does your company measure added value from its customers?
To compare with VLC we asked the three competitors how they measure added value from their
customers. All three mentions that they use different KPIs to do so. Only DHL stated that they
send out a yearly customer survey on top of the KPIs.
Do you see quality, environment, safety and security as added value services?
As mentioned above VLC sees its core values as added value services and when the customers
were asked the question directly four out of six agreed with VLC. None of the competitors
mentioned the activities as added value in the two general questions, however when also they
were asked the question directly they all said that the activities are added value. All three
competitors also mention the cost of delivering these activities, and agree on that many
customers are not willing to take the costs that are attached to the core value services.

67
5 Analysis The structure of the data analysis is based on our research questions highlighted in the
introduction chapter. The analysis will be organised under three headings: the market’s
perception of added value, the drivers behind the added value perception, and finally VLC’s
strengths as competitive advantage. All the data gathered during the interviews and through the
questionnaires will be analysed in relation to our research purpose.
5.1 The market’s perception of added value In the introduction chapter we did precise that the market was referring to our research market
which is comprised of VLC, its customers, and its competitors. In this section we will analyse
the empirical findings of the questions related to our respondents’ perceptions of added value
from a general view, as well as the view from within the automotive logistics industry.
5.1.1 General perception
General speaking, there is a common ground in the understanding of added value as most of the
respondents link it to their overall satisfaction of the services they receive or provide in the sense
that they can enhance their competitive advantage. What makes or creates a competitive
advantage depends on the situation of each company. It depends on its strategy which is built up
around its strengths and opportunities as well as its weaknesses and threats. Since the outcome of
the strategy analysis varies from one company to another, it might explain why companies have a
different approach towards the concept of added value.
Gap in the identification
The question related to the market’s ability to identify added value has shown a gap between
VLC and its customers in favour of VLC, where the average respondent was more confident to
recognise an added value activity. Reasons that can be considered to explain this, are that it
might depend on the respondent population from VLC outnumbering the customers, or maybe

68
because VLC, the one who provides the service, knows better than anybody else the resources
invested in the actual service, and therefore VLC is prompt to give a value to the service. The
first reason is not that relevant, since the impact of outnumbering can be influential in one way or
another. So if the gap is explained by the knowledge of the resources invested in the service, then
there is a serious problem related to communication between VLC and its customers regarding
the information sharing on the service processing.
The perception of a service goes beyond its consumption and takes into account the pre-
consumption as well as the after-consumption. The pre-consumption refers to all activities
undertaken by the service provider before the customer uses or consumes the product or service.
The pre-consumption includes the interaction with the customer to know its needs, transparent
communication with the customer on the resources invested to satisfy its needs and the
implication on the costs, the relationship marketing which deals with the product promotion and
image, and the purchase which deals with the price. The after-consumption includes the after
sales service, the reliability of the product, and the judgement of the product in terms of meeting
promises made over its purchase. In these three different aspects of the consumption process
VLC fails in the first aspect, pre-consumption, by not providing comprehensive information to
its customers on the service processing.
VLC understands the value that has been put into each service, but the customers might not
understand it in the same way or level as VLC. In this case, the same issue remains: the
information sharing. The problem of sharing information is in first place within VLC and that is
carried out externally to the customers. The understanding of the added value concept, and what
is today seen as added value did not meet any homogeneous view from VLC respondents. Some
of VLC respondents have shown a very good understanding of the customers, while others
showed comparatively a poor understanding. This situation questions the involvement of the
VLC personnel participating in the decision making-process at its strategic level on issues related
to customers during their discussions and meetings.

69
Gap in the definition
The findings have actually proved what we have already acknowledged in the theoretical
framework regarding the different meanings of added value to people. The challenges which rise
from that situation are for the service provider, VLC, to try to catch its customers’ views on the
question and find ways to narrow the gaps if any. The empirical findings showed existence of
gaps between VLC and its customers on every proposed definition of added value. Another
concern raised is the fact that competitors are getting more close to customers than VLC on the
definition of added value, leading to a competitive disadvantage for VLC over the understanding
of its customers.
A better understanding of customers can lead VLC to better deliver what the customers want,
how they want it, and when they want it. By not doing so, it exposes the service provider to lose
its customers. VLC’s customers have emphasised cost reduction in their approach of added value
in the questionnaires, and that has been confirmed during the interviews where 50 percent of the
customers believed that cost reduction is important in their definition of added value. The fact
that VLC does not widely share this idea, could suggest a misunderstanding of its customers
concerns.
The price VLC applies to its customers might be justified however the customers do not
understand it. In this case, it might be a failure of transparency in the cost development, and lack
of a clear communication over the issue. If the two are improved, the customers can see that the
price applied is comparatively the best offer on the market.
Gap in the benchmarking approach
Benchmarking can be a source of identification as well as a tool of assessing added value. All
respondents agree that it is the customers’ views that should count in deciding if there is a value
creation or not. The gap between VLC and its customers occurs at two levels, though VLC’s
customers use the competitors’ practices both for identifying and benchmarking added value
activities.

70
By focusing on customers’ views to identify added value and then rely on the customers’
descriptions as a benchmark of its services, VLC is undertaking an unproductive and a
misleading strategy. This puts VLC in the position of a follower instead of a leader. As
understood from the previous analysis of the findings VLC’s customers have comparatively to
VLC a poor rate in identifying added value, and therefore rely on the competitors’ practices to
make their opinions. VLC who shows high confidence in identifying added value, however rely
on its customers’ opinions and undermine competitors’ practices in the market in terms of
benchmarking. Finally VLC ends up with a second hand opinion from its customers in the
logistics area where VLC is supposed to be the expert.
The consequences are: first of all, VLC wants to agree on all its customers’ demands, therefore
VLC sometimes does inappropriate concessions. This becomes a source of failure and
disappointment where VLC should take full responsibility as an expert to inform and propose
better solutions to its customers. Secondly, VLC will experience difficulties to be ahead of the
mainstream in the sense that all the sources of improvement are based on customers’ requests
instead of analysing the market or benchmarking against competitors. In fact, it seems that VLC
has kept towards its customers, its routine of an internal department as it has been in the past
which might weaken its competitive advantage.
5.1.2 Perception within the automotive logistics industry
The perception of added value within the automotive logistics industry is first of all based on the
open questions during which the interviewees could freely state what really matter for their
corporate, and secondly on the services currently offered by VLC presented in the questionnaire.
The automotive logistics in general
Across our market research, the focus in terms of added value is mainly on logistics competence
and strategy, and particularly on proactiveness, continuous improvement, precision, and lead
time reduction. Regarding proactiveness VLC does not deliver according to its customers. The
customers believe that VLC fails in proposing reliable solutions when problems occur because it
does not anticipate on problems and whenever they happens, VLC tend to just fix it. This attitude

71
which has been described by some of the customers as a fixing attitude instead of a proactive
attitude is a sign of lacking expertise competence, and therefore VLC affects customers’
competitiveness with more delays in the execution planning and by increasing the lead time.
Volvo Trucks judges VLC as being slow in improvements and changes, while Volvo Cars
blames VLC as being slow in catching new ideas. Volvo Trucks has particularly complained on
the way VLC is dealing with the wood worms in the emballage, which increases VTC’s
operational costs and prevents VTC to wholly use its leased emballage in the global market.
Regarding the wood worms VLC is content about how the issue is being dealt with.
The precision index is a problem in the outbound process because VLC is weakening in meeting
its target, and that is not to please the customers because of the costs and the bad image that can
result from it. The under performance in this area is acknowledged by VLC, but a solution or a
strategy has not yet been raised to reliably deal with this issue.
Another area of concern is in the cost reduction, and also the transparency in the cost
development. VLC claims in its 2006 business plan the cost savings improvements from 2003 to
2005. This performance would be more appreciated if it had an impact on the customers’
invoices. VCC is happy about this performance when VCC benchmarks against other logistics
providers of the Ford Motor Company, who charges their customers for every penny saved.
However, expectation is to see the impact on the invoice by a price reduction which is more
visible and convincing.
VLC service–based offers
The analysis in this section will be particularly based on the questionnaire questions 5 and 6,
because these questions are specifically dealing with VLC’s current operations. The complete
solution (inbound, outbound, and emballage) has been rated 6 and therefore cannot be an
established added value based on our data processing approach (see section 4.1.1). However we
did stress (see section 4.2.5) that people within VLC believes that the complete solution is of
high potential, and almost seen as an added value. To be able to sell the inbound, outbound, and
emballage as a single package to a customer, will certainly generate more revenues for VLC, and

72
can be described as added value from the shareholders’ perspective, but not necessarily from the
customers’ perspective as we deal with in this report. We have not been able to hear from VLC
what are the real benefits gained by the customers who buy the complete solution. As far as we
know, there is not a special treatment or offer such as rebate or price incentive over buying the
complete solution from VLC.
VLC’s services perceived as added value by at least two customers are activities related to the
information flow, the risk management, and the cross-docking activities. The customers’
perception of added value should be taken on a case by case basis, because of the different
opinions from one customer to another. This can be explained by several reasons, amongst them
we can cite the customers being subject to different treatments, the customers have different
matters or issues in their agendas, and/or the customers have different priorities in relation to
their strategy.
The cost control, track & trace, and the damage prevention/quality assurance are the services
which require much attention from VLC because of the high expectation from the customers.
The track & trace system of VLC is behind competitors, and it is not offered to VLC’s customers
across all regions. Although the risk management is said to be an added value in the previous
paragraph, not all the customers perceive the same benefits out of it. Customers such as Volvo
Construction Equipment and Volvo Buses still have some expectations towards the service
which are not yet fulfilled.
5.2 The drivers behind the added value perception Our second research question relates to the drivers behind the added value perception of VLC
and its stakeholders. After our data collection we believe that the drivers can be divided under
three headings: added value determinants, general management and strategy, and relationship
marketing.

73
5.2.1 Added value determinants
The analysis of our findings shows different influential factors in the perception of added value.
The factors that were mentioned in the interviews are shown in figure 5.1 and they are: customer
maturity, industry competition, market development, and political & cultural environment.
Customer maturity
The perception of an activity as an added value depends on the maturity of the customer.
Different customers perceive different activities as added value. As stated by VLC’s European
regional manager some customers see added value in VLC’s logistics knowledge from a
transportation standpoint, while other customers, that are more mature, need service offers such
as advanced logistics engineering. An example related to VLC’s emballage offerings where
some customers see VLC’s standard emballage as an added value, more mature customers need
VLC’s help to develop special emballage from which they expect added value.
The customers that we have interviewed for this research could be believed to be at the same
maturity stage, but they are not. Volvo Buses state that they are several years behind other
companies within the Volvo Group giving Volvo Trucks as an example. This can be illustrated
by VLC’s consolidation activity, for which Volvo Buses perceive an added value.
Political & cultural environment Industry competition
Market development
Customer maturity
Added value
Figure 5.1: Determinants of added value (Source: Zogbe and Zackrisson)

74
Industry competition
The market that the logistics industry is working within is developed, and there are many actors
in various sizes competing. However for most of VLC’s internal customers, the Volvo Group
business areas that share the Volvo name, it is more a monopoly market than an open market
when buying the logistics services, with VLC in a monopolistic role. Since VLC has its
foundation as a logistics department within the Volvo Group all the original business units of the
group use VLC for their logistics services. On the Swedish market VBC, VCE, and VTC only
use VLC’s services even though there might be other logistics service providers that are offering
similar services to a better price. Outside the Swedish market there are other logistics service
providers that have been contracted, but naturally the Volvo Group wishes to see that VLC is
used as much as possible for the Volvo Group to get return on its investments.
The monopolistic role in which VLC finds itself might hinder both internal customers’ as well as
VLC’s competitiveness. On one hand the internal customers are restrained to go to the open
market and find more competitive offers, and on the other hand VLC has less pressure to speed
up the improvements of its services.
Two reasons why customers stay with VLC are first of all the very close business relationship
that has been build up during the years. This is not easy to replace just because other logistics
service providers offer similar services to better prices. The other providers cannot in a short
time become as close to the internal customers as VLC already is. The second reason is the
advantage resulting from sharing the same information systems, which provides an interface
between VLC and its internal customers.
Market development
VLC’s North America region is not as developed in certain areas as VLC’s other two regions.
The regional manager for VLC North America informed us that in her region VLC does not use
its A4D system for outbound, neither does VLC have a transportation management system, nor a
track & trace system. Compared to customers in the other two regions the customers in North
America do not purchase the VLC services under the same conditions.
75
When the systems used in the other two regions will begin to be used in North America they will
most likely be seen as added value to the customers. One of the reasons for which they will not
be seen as added value is if the costs related to them are perceived higher than the benefits
received. Another reason is if the benchmarking against competitors reveals a competitive
disadvantage. As a result of the differences between the regions there is a potential to deliver
added value services in the North American market.
Political & cultural environment
Finally the political and cultural environment does influence the perception of added value. It is
important when doing business globally to be aware of the political situation and regulations in
each country or market, and to understand the culture within it. To understand the culture in the
country where business will be made is important, though business is not done between
corporations, but between the people within the corporations. If the culture is not understood
there will be difficulties and most likely misinterpretations within the business relationship. To
have local knowledge helps. One way that VLC is trying to gain this knowledge, is by moving
around some of the employees so that they can gain hands on experiences, and bring the
knowledge back to their home offices when completed.
VLC’s core values, that are the same for all the companies within the Volvo Group, are
perceived differently around the world. Quality and safety were the first two core values and is
today well connected with the Volvo name. Later environment and security were added to the
core values. According to VLC’s European regional manager the issue concerning the
environment is more in focus in Europe compared to the rest of the world, and it can be due to
the stricter European emission regulations. However within Europe there is a different view
between the north and the south, where more customers in the north are asking for
environmentally friendly services and are more willing to take the costs related to them. The
Volvo Group and VCC have started to use environment as a selling argument in China, and it
starts to become more important on the U.S. market. Security is very much in focus in North
America and it received more attention after the attacks in September 2001. Security is also
gaining significance in Europe where the U.S. market is used for benchmarking.

76
Volvo Trucks has been pushing the European market to introduce long combination vehicles
(LCVs) with a length of 25.25 meters, which today is allowed in Sweden and Finland. The
Netherlands is now in its second trial period of testing LCVs, and hauliers within the country
hope that there will be a new legislation allowing these vehicles on the European market in the
future. The European countries are working towards reducing the emission, but do not facilitate
the use of the 25.25 meter LCVs. The use of this kind of vehicles will be beneficial for
governments as well as companies. Countries will gain from reduced congestion through fewer
vehicles on the roads, which mean less emissions of carbon dioxide. With a better flow on the
roads time will be saved for logistics companies and their customers. Companies will also gain
from optimising their transportation flows. An important decision is indicated by the regional
manager of North America. Customers have to decide on keeping material on stock, or receive
frequent deliveries. It is a decision that comes down to costs.
5.2.2 General management and strategy
The corporate strategic management has an important role to play in the customers’ perception of
its activities. Decisions that involve the global presence of the company, how flexible VLC
should be in its service offerings, how innovative the company should be, what kind of people
should be hired to execute the strategy, and what training and/or education do the employees
need to make VLC grow in the right direction are just a few decisions that the management
takes, and which influence the customers’ perception. Most important for the management is to
find the most beneficial solutions that will lead to optimisation of the systems, as well as cost
reductions for both VLC and its customers. As our findings showed the price/cost of the service
is what the customers see as the key buying criteria.
Logistics competence
To be able to find the most beneficial solutions for both VLC and its customers the right people
have to be employed and they need to possess the right competence. It is crucial for VLC to have
the competence to manage the global coverage that its customers demand. To meet this
requirement VLC has to have skills for each market and a well established network of logistics
providers and/or hauliers that can assist in the fulfilment of the demand.

77
For VLC to be proactive the employees need to work with scenarios through a line of
questioning such as what should be done if a certain problem occurs. By having solutions for
situations/problems that can arise will help VLC to faster solve the issue properly, not only
fixing it for the moment. One issue can be VLC’s flexibility. To be flexible towards customers,
in a way that is also beneficial for VLC, requires not only logistics competence, but also the
understanding that sometimes VLC might have to say no to some of the requirements from the
customers. VLC employees need to know what they and the corporate are capable of doing, and
not promise to fulfil the requirement just to please the customer, because in the end both might
be disappointed.
Continuous improvement
The continuous improvement regards not only the processes, but also the people in charge of the
processes. That is why it is important to have the right people within the company, and to offer
them ongoing training during their years within the company in pace with the changes that occur
in the industry. VLC should focus on developing skills within problem solving. With this skill
VLC can come to the customer with suggestions of solutions for a better or cheaper logistics
layout instead of the customer asking VLC to solve a problem.
On the transport planning level, VLC needs to improve the current setting and the handling of
the operation by keeping away from the routine culture. Renault Trucks has revealed that its
current traffic/transport routes are outdated, and they also add that not much is needed to be
done, to make an efficient change; it is just a matter of a review. Improvement is also expected in
the cross-docking activities in Gothenburg by Volvo Construction Equipment
IS/IT systems are one major area where continuous improvements is important though new
technology are always coming into the market. To be the first with a certain system will give an
advantage over competitors, for instance VLC’s A4D system. However having delays with these
important systems as VLC has with its ATLAS system for inbound will mean a major cost for
the business, and in the end it might not be adding value to the customers though competitors
have similar or even better systems already in practice. The IS/IT systems are also expected to
support VLC in planning and optimising its transport network.

78
5.2.3 Relationship marketing
Relationship marketing adds value to both VLC and its customers. Drivers that add value within
the relationship marketing are trust, communication, marketing, and education.
Trust
Of all the VLC personnel interviewed there is a homogeneous view regarding VLC’s business
relationship with its clientele. With all its internal customers and VCC, which together represent
more than 90 percent of VLC’s turnover, VLC is said to have a very good and close relationship.
When it comes to the remaining external customers it is stressed that VLC still has to work on
the relationships to reach the same level as it currently has with the others.
This well established business relationship as it has been explained to us is reflected in the fact
that VLC is allowed to take part in its customers’ product development. To be able to be
involved in this core activity a high level of trust exists and that is the foundation of a good
business relationship. Renault Trucks praises VLC on its involvements in different discussions
and projects, for instance regarding the launch of a new product at the Nissan plant.
Communication
VLC’s strategic IS/IT department feels that it knows what its customers expect from the systems,
however the head of strategic IS/IT stresses that what her department discusses with the
customers IS/IT department might not be the same as what the two corporations agree on overall.
It is through open communication amongst the right people at the right level in both companies:
VLC and the customer, that issues can be discussed and actions to be taken can be suggested by
both parties. Equally important is it that both VLC and the customer have an open
communication within its own company. Everyone within VLC that is involved with one specific
customer should be aware of the discussions that are undergoing or decisions that have been
made. From our interviews we have realised that this is not the situation today, and that the
sharing of information regarding customers is very much unstructured.

79
The current integrated meeting structure between VLC and its customer, shown in figure 5.2, is
today lacking the internal communication and sharing of information. From the statement made
by VLC’s head of strategic IS/IT we believe that both within VLC and VLC’s customer the
internal communication is lacking.
Figure 5.2: VLC’s integrated meeting structure with customer (Source: VLC information)
Marketing
After interviewing 12 VLC personnel it was clear to us that they all were reserved to express
what VLC is good at. Instead of being proud and inform the customers and the customers’
suppliers what the company is good at, they used the sentence “we are quite good at …”. By
doing so gives us the impression that they under value their own performance and competence.
This can be seen in the failing of VLC to wholly market its services to its customers’ suppliers
around the world. This concern has been raised by Volvo Trucks who does not want to take the
responsibility to impose VLC to its suppliers, but however provides a list of six global logistics
providers including VLC.
VLC’s head of strategic IS/IT mentions that VLC needs to market its services to its customers in
the right way, and may need to convince the customers that a specific service and/or solution is
right for them. This might take some time, but in the long run it is beneficial for both parties. The
Strategical
(Global)
Tactical
(Regional)
Operative
(Operational)
Strategical
> 4 times/year; 1 to 3 years time horizon;
global process manager.
Tactical
6-8 times/year; 3 to 12 months time horizon;
regional manager, regional process manager, and/or customer responsible.
Operative
12 times/year; < 1 month up to 12 months time horizon; customer responsible.

80
head of strategic IS/IT also states that in areas where VLC today is not meeting the customers’
requirements 100 percent VLC should show how it plans to proceed to fulfil the requirements.
Educate the customers
One of VLC’s board members that we have interviewed with regards to his logistics expertise
states that “VLC has an educating role towards its customers”. With this he means that VLC
needs to educate its customers and show them how the services they buy from VLC add value to
their own businesses. The education of the customers should also include making the customers
better buyers of logistics services, which will develop their own systems. By helping the
customers become more efficient when planning its logistics purchases the customers will value
VLC’s relationship, and might even build on it and give more business to VLC.
5.3 VLC’s strengths as competitive advantage For VLC to be able to offer customers services that add value to them can be seen as a
competitive tool towards its competitors. We will here look at VLC’s competitiveness and some
of the challenges that VLC is facing.
5.3.1 VLC’s competitiveness
We see that VLC has a competitive edge towards its competitors in its strengths: complete
solution, emballage, business relationship, and consolidation.
Complete solution
We believe that to be able to provide the complete solution can be a competitive advantage for
VLC in the automotive logistics industry where we have not yet found another single logistics
service provider offering the three combined processes to customers. However, unless VLC turns
the complete solution into a more incentive package with an aggressive marketing the customers,
especially the external ones and the newest internal companies: Mack Trucks and Renault Trucks
81
will not see any advantage to buy the complete solution. They would instead prefer to stay with
their existing business partners for each process.
Again we will come back to the importance that the internal departments need to communicate.
The customers’ different departments related to each process need to agree that buying the
complete solution from VLC will benefit their overall business in the long run. If the customers’
different departments do not co-operate internally it will be harder for VLC to convince them
about the advantage of buying the complete solution from one single source.
Emballage
One of the logistics experts interviewed sees the emballage service as a unique competitive
advantage for VLC. Today there are few competitors for VLC when it comes to the emballage
services, but by being born into the automotive industry and by having more than 50 years
experience when it comes to emballage for the automotive logistics industry VLC has an
advantage over its competitors, however this needs to be translated into a competitive advantage.
Customers using VLC’s emballage pool system receives advantages such as cost control, global
system, economies of scale, quality, and environmental care. The competitors can offer similar
services however none of the two biggest competitors: Nefab and CHEP do originate from the
automotive industry, nor do they specialise only in the automotive logistics industry. We see
therefore that VLC has a better understanding of its customers’ industry and markets, and also
the specific knowledge to best develop the emballage needed compared to the competitors.
However VLC faces an issue which can hinder the emballage potential on the North American
market, and that is the high price charged in that region compared to the European market. This
issue has to be dealt with for VLC to have a competitive advantage.
Business relationship
To have such a strong business relationship that VLC has with its two major customer groups:
Volvo Group and VCC, other logistics service providers might never reach. To have gone from
an internal department to a business unit the knowledge of each company with in the Volvo

82
Group as well as the industry is rooted in VLC. Many of the VLC competitors are not originally
from the automotive industry instead they have grown into it from other logistics industries. The
time it takes to build up an established relationship might not be given to the logistics service
providers, though most contracts signed today are only valid for a time period of two years.
Consolidation
With all its customers within the same industry VLC can consolidate many of its services and
shipments for all the customers in its clientele. We have mentioned that the customers do receive
a better price per kilogram through VLC’s consolidation compared to if they buy the services
individually. This is a service that would be difficult for VLC’s competitors to compete with. For
them to offer each individual VLC customer a better price per kilogram than what VLC is doing
today would make the business unprofitable for the competitors. This however do not apply to
each of the markets that VLC’s customers have activity within. VLC is not able to offer better
prices than its competitors to the individual customer, for instance in Finland where VBC is
using Schenker as its logistics service provider.
5.3.2 VLC’s challenges
The challenges VLC is facing are of three orders: the corporate long term strategy, its process
assessment, and the dilemma of contractors/suppliers being competitors.
VLC’s long term strategy
We have barely seen what VLC’s long term strategy is. However we know the reason of its
existence, which is to support the Volvo Group business areas. The support of the Volvo Group
can be explained in different ways, for instance operational support by primarily be dedicated to
the Volvo Group’s different business areas, and provide all the necessary resources and
competences, or act like a truly independent company as the other Volvo business areas. VLC is
currently in between these two commitments, and the challenge is to balance its dedication to
serve the Volvo Group business areas and its ambitions to grow independently.

83
Dedication to the Volvo Group business areas
The Volvo Group business areas can be qualified as the home market for VLC. The role of this
market and the attitude of VLC can be beneficial as well as a hinder for both. If the home market
can serve as a test to improve its services and for VLC to take into consideration all the
requirements, complaints, and observations made by the home market, then VLC will be better
prepared to compete in the open market. If VLC’s attitude is to take the home market for granted
and have a monopolistic behaviour, then VLC will not only fail its home market, but it will
experience difficulties to compete in the open market.
Prospect of being a business area
To be an independent company might be far away in VLC’s agenda, but the question will rise
sooner or later in this context of globalisation with fierce competition. The necessity to
implement some strategies might result in overshadowing some of VLC’s commitments to the
Volvo Group business areas if for instance they become less profitable for VLC. The prospect of
being an independent company should go hand in hand with the possibility of Volvo Group
business areas to also go out on the open market for better offers. As a result VLC would have to
be more competitive, and more innovative if it wants to survive and stay in business. Pressure
will certainly increase the speed of improvements and better offers are more likely to come.
Process assessment
A common way a corporate assess its operation processes is to use key performance indicators
(KPIs). On the list of eleven KPIs that VLC is conducting, eight we believe are related to
operational processes, or can have some impacts on the processes. These eight are: inbound
transport precision, outbound transport precision, emballage availability, customer satisfaction
index, customer cost savings, employee satisfaction index, logistics competence, and damage
free vehicles. These KPIs are certainly important and maybe sufficient, but not enough for the
data collection enabling a proper evaluation of the different processes, and help VLC to catch its
customers’ intimacy and perception over the services it provides.

84
The purpose of the KPIs is not only about measuring, but it also has a strategic implication for
the corporate in the sense that it is helpful to redirect and correct its short term strategy, and to
see which areas that need more improvements. Customers being the focus of VLC, a formal KPI
on customer complaints/claims could support the customer satisfaction index analysis to make a
diagnostic over VLC’s service performance. We have been informed during our interviews that
VLC is not conducting a KPI on its contractors’ performance, but instead is using the fulfilment
of the contracts as a basis to evaluate the contractors. We believe that the contract terms are not
sufficient, neither is the request for quotation (RFQ) to evaluate the contractors.
The dilemma of contractors/suppliers being competitors
At least two of VLC’s contractors: DHL and Schenker are competitors to VLC, not only in
Sweden, but also on the global market. The two competitors are established logistics services
providers, and have departments specialised in the automotive industry. One advantage that the
two contractors have over VLC is that they both own parts of the fleet that they use. This
situation creates a competitive advantage for DHL and Schenker towards VLC in the sense that
VLC depends on its competitors assets to perform its services. Whatever the competitors do will
be on behalf of VLC, and it is VLC which will be countable in the eyes of the customers.
One of the drawbacks of the relationship between VLC and its contractors being competitors is
the level of flexibility that the competitors can benefit from comparatively to VLC in the peak
periods where demand is raising for the entire logistics service industry. In this kind of
circumstance competitors might certainly try to respect the terms of their contract with VLC, but
any decisions on additional demand from VLC against an additional demand from another of
their customers, to whom they also sell logistics solutions, will be made on the best interest of
the competitors. This actually questions the sustainability of the reliability and the commitment
of VLC contractors who are competitors.
During our interviews we have understood that it has helped competitors by having VLC in their
customer portfolio to market themselves towards other existing and potential customers. In other
words competitors are using the Volvo name as a selling argument to gain new businesses.

85
6 Conclusion In this final chapter we will begin with a summary of our findings and analysis, and particularly
emphasise our research questions, followed by our recommendations to VLC, then our
contribution on the concept of added value, before we conclude with our suggestion of areas for
further research.
6.1 Summary In our summary we will cover the gaps that we have found, the drivers behind the perception of
added value, the activities that are seen as added value today and the ones that are believed to be
added value in the future, and end with VLC’s strengths and challenges.
Gap existence
We have through our empirical findings and our analysis found out that there are gaps in the
ability of the respondents to identify, how they describe, and how the respondents define through
benchmarking a service as an added value. The gap related to the identification, where VLC’s
personnel showed a higher ability to identify, we say depends on VLC not sharing the
information about the service processing, nor marketing the full advantage of the activities to its
customers.
Regarding the description of added value VLC sees added value coming from
management/handling and processing, while its customers as well as its competitors see it
coming from cost and innovation. That the competitors have the same understanding as the
customers can be a future threat for VLC, if VLC does not start to listen to what is most
important to its customers.
Finally for the gap when it comes to benchmarking VLC’s customers use the competitors’
practices, while VLC uses the customers’ views. As stated in the analysis chapter this then puts
VLC in the position of a follower instead of a leader. To be a leader for its customers VLC needs

86
to benchmark against its competitors and overtake them, so that the customers in the future will
use VLC’s practices to benchmark and identify added value services.
Drivers of the added value perception
We have in our analysis showed that there are different drivers that are underlying the perception
of added value. The determinants were: customer maturity which is not at the same level within
VLC’s clientele, industry competition where VLC has a monopolistic role, market development
where the customers in the North American region do not purchase VLC’s services under the
same conditions, and finally the political & cultural environment where for instance VLC’s core
values are perceived differently around the globe.
We then continued with drivers that came under VLC’s general management and strategy such
as logistics competence and continuous improvement, before ending with drivers within
relationship marketing. In our final section of drivers we highlight trust, communication,
marketing, and education.
VLC’s added value activities
Activities that adds value to VLC’s customers today, and activities that are believed to add value
in the future are mainly activities within the category we have named logistics competence and
strategy. To be proactive and continuously work for improvements, reduce lead times for
instance by providing logistics hubs, reduce waste from the processes, and have market skills are
some of the activities within the category, see appendix 4.1 for the complete list.
Secondly comes the IS/IT system category where real time information as well as transparency
are asked for, as this can lead to early warnings and reduced costs. We also mentioned that the
current track & trace system used by VLC needs to be improved, and become more advanced to
be able to track each component in the shipments.
Thirdly, today activities within the cost reduction category such as VLC’s ability to consolidate
shipments, utilise the trailers, and constantly working with risk management are seen as added
value. However for the future it is activities that are within the business relationship that are
believed to add value. The two keywords here are communication and trust.

87
VLC’s strengths and challenges
We see some of VLC’s strengths as services adding value to its customers, and which give VLC
a competitive advantage over its competitors. These activities are the offering of the complete
solution however this is not yet marketed in the right way towards the customers, VLC’s
emballage service offering a pool system with its returnable pallets, the well established and
rooted relationship VLC has with the customers it shares the Volvo name, and finally VLC’s
ability to consolidate its services and shipments for its entire clientele.
VLC does also face some challenges for the future and we have focused on three. Firstly, for its
long term strategy VLC should consider if the corporate should stay dedicated to the Volvo
Group, or if it has the prospect of growing into an independent company and move from a
business unit to a business area within the Volvo Group. Secondly, VLC needs to upgrade its
current settings of key performance indicators. Thirdly is the dilemma that some of VLC’s
contractors/suppliers are also being competitors to VLC. This situation shows that VLC is
depended on its own competitors, and its competitors’ performance is reflected back to VLC’s
own performance in the eyes of VLC’s customers.
6.2 Recommendation Our recommendations to VLC are within the areas of communication improvement,
benchmarking, be a logistics expert, and process improvements. We believe that if VLC focus on
improving in these areas there will be potentials of providing more added value services to its
clientele and new potential customers, as well as move VLC from being a follower into the
position of a leader.
Communication improvement
Under relationship marketing in our analysis we talked about the importance of communication
both within VLC and towards its customers and potential customers. If VLC want to be seen as a
unified company, one face, towards its customer the internal communication is crucial. The
different levels need to communicate between themselves as shown in figure 6.1. The head of
strategic planning and core values mentioned a customer relation management system, and we
are wondering why this system does not already exist within VLC. We believe that with such a

88
system VLC’s internal communication regarding each customer would be very much improved,
and each decision made can easily be shared, traced and followed up.
Figure 6.1: Suggested integrated meeting structure (Source: Adapted from VLC information)
Improvement of the internal communication will lead to improvements in the external
communication. With the external communication we mean VLC’s marketing of its service
offers. Compared with today VLC needs to believe in its competence, be proud of its
performances, and inform its customers, its customers’ suppliers, as well as sub-suppliers about
its capabilities through a well defined marketing strategy. VLC needs to show how its service
offers will help them improve their own businesses.
Benchmarking
Volvo Cars state that VLC is not benchmarking its services against competitors, and this has
been confirmed in the data we collected from VLC. Instead VLC is focusing on the customers’
views, which we have said might be misleading. We recommend that VLC should get a broader
view of the market instead of narrowing it down to its customers’ perceptions. This will help
VLC to know what is offered on the market, what the trend is, what others are doing better, and
who the best is.
Strategical
(Global)
Tactical
(Regional)
Operative
(Operational)

89
Be a logistics expert
VLC should believe in itself and better value its own services, and not be completely driven by
the customers for the interest of both parties. VLC is the expert, which means VLC should advise
its customers on the feasibility of any demand. VLC should not take on duties if it is not capable
of meeting its promises.
Process improvement
For VLC to break the negative trend that has occurred two years in a row, 2004 and 2005 in the
measurement of its customer satisfaction index, VLC should be more proactive and improve its
general management performance by speeding up project executions and catching up on new
ideas and be innovative. Also VLC needs to look within itself and become more efficient if it
wants to increase its customer satisfaction. Flexibility and reliability should be part of the general
management competence, but the flexibility VLC is performing should be reviewed to match its
capability and resources.
Since VLC buys services from contractors to perform its services, it should extend its current key
performance indicators to the contractors’ different duties, and not only evaluate them based on
their contract terms. The KPIs should also be extended to the claims/complaints in order to
support the customer satisfaction index.
6.3 Contribution Our contribution is on the development of the measurement of added value. This measurement is
actually a framework. It has an implication on the theoretical level as well as on the practical
level, where it provides a guideline to the corporate in evaluating if the services, and the products
they supply, their business culture, and their management performance are align with added
value creation for their customers.
In the original formula Grönroos (2000) gives a good theoretical explanation on the different
terms of the formula, but does not explain how the corporate practically can determine the
customer perceived value and the core value. We believe that the framework of the added value
measurement we provide in figure 6.2 is another step forward.

90
Scenarios CPV
Scenarios CV
CPV > 0
CPV = 0 CPV < 0 CV > 0
CV = 0 CV < 0
CV > 0
CV = 0 CV < 0
CPV > 0
Net added value creation
Potential of added value creation
If CPV > /CV/ Potential of non sustainable added value If CPV < /CV/ Negative value creation
CPV = 0
Potential of added value creation
No value creation
Negative value creation
CPV < 0
If /CPV/ > CV Negative value creation If /CPV/ < CV Potential of non sustainable added value
Negative value creation
Net negative value creation
Customer Perceived Value (CPV)
Core Value (CV)
Process improvement
Costs Relationship marketing
Innovation Competition Ratio perceived benefit, price
Management competence
• KPIs on various processes • Survey on complaints and overall improvements • Staff training, employee satisfaction survey
• Costs saving using the ABC analysis • Staff training • Systems re-engineering
• Business relationship survey • Transparency and information survey • Marketing
• R&D • Benchmarking • Developing market intelligence
• Service quality survey • Benchmarking • Customer satisfaction survey
• Survey on meeting promises and precision • KPIs on contractors performance • KPIs on claims/complaints • Training for managerial staff
• Survey on market price strategy • Developing marketing intelligence
Diff
eren
t sc
enar
io r
esul
ts
Mat
rix
of a
dded
val
ue
Mea
sure
men
t (s
oft &
har
d)
Dri
vers
A
dded
va
lue
Figure 6.2: Added value measurement framework (Source: Zogbe and Zackrisson)

91
The added value measurement framework shows clearly that the determination of added
value will go through five different steps starting by the separation of the two different
components of added value: the customer perceived value and the core value.
The following step is to determine the different drivers of the added value components,
and it should be related to a specific industry. As those components are dynamics they are
subject to change depending on various circumstances which can influence the market,
the product, and the service provider’s management culture. Changes might also occur at
the measurement level which could be soft as well as hard. The choice of drivers and
measurements in the model are those we believe are essential for the automotive logistics
industry. Those measurements are a combination of well known performance
measurements such as KPIs, benchmarking, surveys such as customer as well as
employee satisfaction, and other sources of collecting information: business relations and
relationship marketing with the objective to know the customers’ feelings and needs.
At the fourth step, the corporate should be able to establish the performance rate for each
driver and sum them up per component of added value. Three possible scenarios for each
component: positive, negative, and nil. The combination of the different scenarios for
each component will lead to a matrix of nine outcomes, with one outcome displaying an
absolute added value creation as a result of the customer perceived value and the core
value being positive.
6.4 Areas for further research This section will be concerned with areas where research could be carried out for further
improvement on the empirical as well as on the theoretical level. We found three
domains: the added value measurement framework, VLC’s emballage process in North
America, and VLC’s challenges in its long term strategy.
The added value measurement framework
We believe that our measurement framework while giving a relative thorough approach
to measure added value, it will need further development on how the calculation of each

92
driver should be set, and how the different measures, especially those which are soft can
be turned in quantitative data in order to proceed.
VLC’s emballage process in North America
When it comes to VLC’s emballage in North America it should be looked into if instead
of sending the emballage broken down and empty back to Europe, the emballage might
be used within other industries where European countries import goods from the U.S.
market. If there can be a more efficient use of the emballage also the customer in the
North America region will receive cheaper emballage and gain more added value from
the service.
VLC’s challenges in its long term strategy
Under this section there are two areas of research: the first is related to VLC’s position
within the Volvo Group, and the second is the relation between VLC and its contractors,
which are also its competitors. We express the different research topics as follows:
VLC’s long term competitiveness, and its commitment to support the Volvo Group
business areas: Volvo Aero, Volvo Buses, Volvo Construction Equipment, Volvo Penta,
Volvo Trucks, Mack Trucks, and Renault Trucks.
VLC competitiveness and the power balance in its relationship with its contractors being
also its competitors.

93
References
Books Aaker, D.A., Kumar, V., and Day, G.S., 2004, Marketing Research, 8th edition, John
Wiley & Sons, Inc., U.S.A.
Barlow, J., and Maul, D., 2000, Emotional Value: Creating Strong Bonds with Your
Customers, Berrett-Koehler Publishers, Inc., San-Francisco.
Barney, J.B., and Hesterley, W.S., 2006, Strategic management and competitive
advantage concepts, Pearson, Prentice Hall, New Jersey, U.S.A.
Bryman, A., and Bell, E., 2003, Business Research Methods, Oxford University Press
Inc., New York.
Christopher, M., 1998, Logistics and supply chain management: Strategies for reducing
cost and improving service, 2nd edition, Prentice Hall.
Cooper, D.R., and Schindler, P.S., 1998, Business Research Methods, 6th edition, Irwin
McGraw-Hill, U.S.A.
Dibb, S., Simkin, L., Pride, W.M., Ferrell, O.C., 1997, Marketing – Concepts and
Strategies, 3rd edition, Houghton Mifflin, Boston, U.S.A.
Frankfort-Nachmias, C., and Nachmias, D., 1996, Research Methods in the Social
Sciences, Arnold, London.
Gale, B., 1994, Managing customer value, The Free Press, New York.
Grönroos, C, 2000, Service management and Marketing: A customer relationship
approach, 2nd edition, John Wiley & Sons Ltd, England.
Hellevik, O., 1977, Forskningsmetode i Sociologi og Statvitenskap, Universitetsförlaget,
Oslo.
Hill, N., and Alexander, J., 2000, Handbook of Customer Satisfaction and Loyalty
Measurement, 2nd edition, Gower Publishing Ltd, England.
Kay, J., 1993, Foundation of corporate success, Oxford University Press, Oxford.
Kvale, S., 1997, Den kvalitativa forskningsintervjun, Studentlitteratur, Lund.
Kylén, J-A., 2004, Att få svar; intervju – enkät – observation, Bonnier Utbildning,
Stockholm.

94
Lindblad, I-B., 1998, Uppsatsarbete – En kreativ process, Studentlitteratur, Lund.
Lodico, M.G., Spaulding, D.T., and Voegtle, K.H., 2006, Methods in Educational
Research – from theory to practice, Jossey-Bass, San Francisco.
Naumann, E., 1995, Creating customer value: The path to sustainable competitive
advantage, Thomson Executive Press, Ohio, U.S.A.
Porter, M., 1985, Competitive advantage: Creating and sustaining superior performance,
The Free Press, New York.
Sekaran, U., 2000, Research Methods for Business, A skill-building approach, 3rd edition,
John Wiley & Sons, Inc., U.S.A.
Shank, J.K., and Govindarajan, V., 1993, Strategic cost management, The Free Press,
New York, U.S.A.
Svenning, C., 2003, Metodboken, 5th edition, Lorentz Förlag, Eslöv.
Wiersma, W., and Jurs, S.G., 2005, Research Methods in Education, 8th edition, Pearson,
U.S.A.
Journals Bititci, U.S., Martinez, V., Albores, P., and Parung, J., 2004, “Creating and managing
value in collaborative networks”, International Journal of Physical Distribution &
Logistics Management, Vol. 34, No. 3/4, pp251-268.
Chernatony, L., Harris, F., and Riley, F.D., 2000, “Added value: its nature, roles and
sustainability”, European Journal of Marketing, Vol. 34, No. 1/2, pp39-56.
Daniels, S., 2000, “Customer value management”, Work Study, Vol. 49, No. 2, pp 67-70.
Doyle, P., 1989, “Building successful Brands: The Strategy Options”, Journal of
Marketing Management, Vol. 5, No. 1, pp77-95.
Drejer, A., 2006 “Strategic innovation: A new perspective on strategic management”
Handbook of Business Strategy, pp143-147.
Evans, G., 2002, “Measuring and managing customer value”, Work study, Vol. 51, No. 3,
pp134-139.
Grönroos, C., 2004, “The relationship marketing process: communication, interaction,
dialogue, value”, Journal of Business & Industrial Marketing, Vol. 19, No. 2, pp99-113.

95
Grönroos, C., 1997, “Value-driven Relational Marketing: From product to resources and
competencies”, Journal of Marketing Management, Vol. 13, pp407-419.
Hines, P., Holweg, M., and Rich, N., 2004, “Learning to evolve, A review of
contemporary lean thinking”, International Journal of Operations & Production
Management, Vol. 24, No. 10, pp994-1011.
Hines, P., and Rich, N., 1997, “The seven value stream mapping tools”, International
Journal of Operations & Production Management, Vol. 17, No. 1, pp46-64.
Hines, P., Rich, N., Bicheno, J., Brunt, D., and Taylor, D., 1998, “Value stream
management”, International Journal of Logistics Management, Vol. 9, No. 1, pp25-42.
Jackson, D., 1994, “BPR: Hype or Reality”, The TQM Magazine, Vol. 6, No. 6, pp19-22.
Jones, D. T., Hines, P., and Rich, N., 1997, “Lean logistics”, International Journal of
Physical Distribution & Logistics Management, Vol. 27, No. 3/4, pp153-173.
Khalifa, A., 2004, “Customer value: a review of recent literature and an integrative
configuration”, Management Decision, Vol. 42, No. 5, pp645-747.
Leszinski, R., and Marn, M., 1997, “Setting Value, not price”, The McKinsey Quarterly,
No.1.
Lin, B., and Jones, C.A., 1997, “Some issues in conducting customer satisfaction
surveys”, Journal of Marketing Practice: Applied Marketing Science, Vol. 3, pp4-13.
Lorente, A.R.M., Dewhurst, F., Dale, B.G., 1999, “TQM and business innovation”
European Journal of Innovation Management, Vol. 2, No.1, pp12-19.
Walters, D., Halliday, M., and Glaser, S., 2002 “Added value enterprise value and
competitive advantage” <http://www.emaraldinsight.com/0025-1747.htm> (10 July
2006).
Zairi, M., 1996, “Competition what does it mean?”, The TQM Magazine, Vol. 8, No. 1,
pp54-59.
Articles Milne, R., 2006, “MAN chief predicts consolidation”, Financial Times, w. 31, 2 August
2006, pp14.

96
Ramberg, K., “Fewer Trucks Improve the Environment”, Svenskt Näringsliv, October
2004,
<http://sn.svensktnaringsliv.se/sn/publi.nsf/Publikationerview/439AF17E1ECCFC53C12
56F310036B566/$File/PUB200410-004-1.pdf > (6 January 2007).
Tamme, T., 2006, “Holland testar 25,25 meter”, Transport iDag & iTrafik, No. 13/06,
pp14-15.
“Volvo Pushes For Road Trains”, Transport News Network, 15 August 2005, <
http://www.tnn.co.uk/Manufacturers/plonearticle.2005-04-25.0354147078 > (6 January
2007).
Internet CHEP: < http://www.chep.com/chepapp/chep > (6 January 2007).
Nefab: < http://www.nefab.com/ > (6 January 2007).
The Ford Motor Company: <http://www.ford.com/en/company/about/brands/volvo.htm>
(2 December 2006).
Logistics dictionary: <http://www.quartermaster.army.mil/ltd/logisticsdictionary.htmL>
(1 October 2006).
Steppingstones Partnership, Inc. – Business Reference Library:
<http://www.steppingstones.ca/artman/publish/article_60.shtml> (29 December 2006).
Volvo Group: <http://www.volvo.com/group/global/en-gb> (18 November 2006).
Volvo Logistics: <http://www.volvo.com/logistics/global/en-gb> (18 November 2006).
Reports Volvo Logistics Corporation Business Plan 2006
Volvo Logistics One company – we deliver
True Business Logistics: Inbound – Outbound – Emballage

97
Appendix 1 Questionnaire Questionnaire regarding Master thesis for Volvo Logistics Corporation
1. Would you be able to identify added value services?
Not at all Every time
2. Of the below descriptions of added value service how would you grade them according to your priorities 1 = less important and 7 = most important?
Added value service is described as:
A) The contents or features that make the essence of the service(s) being provided better than those offered by competitors. Keyword: competition.
B) The distinguished part of the service or the special handling of the service provided that enhance your customers’ satisfaction. Keyword: management/handling.
C) The value that is added to the service as a result of the innovative process. Keyword: innovation.
D) The increase in worth of the service as a result of a particular activity. Keyword: processing.
E) The ratio of the perceived benefits of the service to the perceived cost created. Keyword: cost.
Others: …………………………………………………………………………………………….…………………………………………………………………………………………………….….…………
3. How would you identify added value services 1 = low and 7 = high?
Through your customers’ satisfaction or perception.
A) Through your own satisfaction or perception.
B) By benchmarking against competitors’ practices.
C) By benchmarking against your corporate standards and requirements.
D) Whenever described as added value by your suppliers/customers.
Others: …………………………………………………………………………………………….………………………………
32 6 5 4 71
32 6 5 4 71

98
4. How do you benchmark the added value services you/VLC provide 1 = low and 7 = high?
A) Against your corporate perceptions.
B) Against your customers’ perceptions.
C) Against competitors’ practices.
D) Against your corporate standards or requirements.
E) Whenever described as added value services by your customer.
Others: …………………………………………………………………………………………….………………………………
5. To what extent do you agree or disagree that the below services provided by VLC/your company are added values? N.B.: If a service provided is not an added value it is considered as a standard/primary service in the industry.
D
isag
ree
st
ongl
y N
eith
er
ag
ree
or
disa
gree
A
gree
st
rong
ly
Complete solution
The combination of the Inbound, Outbound and Emballage delivered by a single company.
Design, Planning and Execution
Track and Trace.
Exception management (Express freight).
Freight payment/control.
Cross-docking activities
32 6 5 4 71

99
Handling.
Short term storage.
Time table delivery.
Information flow
Pre-advice.
Transparency.
Management
Order handling
Help desk for dealers and factories.
Co-productive relationship to cut cost and improve management.
Warehousing
Temporary responsibility of material.
Logistics services
Sub-assembly.
Kitting.
Repacking.
Sequencing.
Risk management

100
Insurance.
Damage prevention.
Service after damage has occurred.
Others
The use of A4D.
Transport from factory to harbour.
Bespoke delivery.
Secrecy transport.
Delivery to VIP customer.
Simulation of scenarios to enable analysis.
Packaging design.
6. In which step of the order processing (from order placement to order delivery) do you believe an added value service can be provided by VLC/your company?
D
isag
ree
st
ongl
y N
eith
er
ag
ree
or
disa
gree
A
gree
st
rong
ly
The logistics system (IS/IT)
The Just-in-Time process management.
Cross-docking and dispatch.
Warehousing (incl. goods reception and material control).
Logistics services. (Details in Q5.)

101
Risk management.
Customs/documents handling.
Customer service. (Order booking, help desk, follow-up etc.)
E-business. (Internet services)
Cost control.
Secrecy transportation.
Track and Trace.
Damage prevention/quality assurance.
Others: …………………………………………………………………………………………….………………………………
7. Of the below values what do you consider in evaluating the added value services 1 = less
important and 7 = most important?
A) Pricing/value for money.
B) Customer satisfaction.
C) Reliability.
D) Creation of competitive advantage.
E) Flexibility.
F) Management expertise.
Others: …………………………………………………………………………………………….………………………………
32 6 5 4 71

102
8. How would you grade your contractors/VLC on the following four dimensions of services?
A) Reliability
B) Responsiveness
C) Assurance
D) Empathy
Others: …………………………………………………………………………………………….………………………………
32 6 5 4 71

103
Appendix 2 Face-to-face questions Face-to-face interview questions to VLC personnel: Head of Human Resources Manager of Region North America Manager of Region Europe Manager of Region Scandinavia & Overseas Chief Financial Officer Executive Vice President Head of Vision 2015 Vision 2015 Head of Strategic Planning & Core values Global Contracting Manager Sales and Marketing Head of Strategic IS/IT Logistics experts: VLC Board member and Logistics expert Logistics expert (professor) Face-to-face interview questions to VLC’s customers: Volvo Trucks Logistics director Volvo Buses Logistics & SCM director Volvo CE Logistics director Volvo Cars Manager Inbound Transport Development Volvo Cars Logistics Purchasing Director Renault Trucks Logistics and Distribution Engineering Manager Mack Trucks Order Fulfilment Director Face-to-face interview questions to VLC’s competitors: DHL Express Key Account Manager Automotive DFDS Transport Managing Director Schenker Consulting Key Account Manager Automotive

104
Day Company Position I* Q** September 11 Sep. VLC Head of Strategic IS/IT F Y 13 Sep. VLC Regional Manager Scandinavia and
Overseas F Y
13 Sep. VLC Regional Manager Europe F Y 13 Sep. VLC Executive Vice President F Y 14 Sep. VLC & Linköping
University VLC Board Member Logistics expert
T Y
14 Sep. VLC Head of Strategic Planning and Core Values
F Y
15 Sep. VLC Head of Vision 2015 F Y 15 Sep. VLC Global Contracting Manager F Y 18 Sep. Linköping University Professor
Logistics expert T Y
19 Sep. VLC Vision 2015 F Y 19 Sep. VLC Chief Financial Officer F Y 20 Sep. Volvo Trucks Logistics Director F Y 21 Sep. Schenker Key Account Manager Automotive F Y 21 Sep. Renault Trucks Manager distribution operations T Y 22 Sep. Volvo Cars Purchasing Director F Y 22 Sep. Volvo Cars Manager Inbound F Y 25 Sep. DFDS Division managing director of DFDS
Transport Ltd. T Y
26 Sep. Volvo Buses Logistics and SCM Director F Y 26 Sep. VLC Regional Manager North America T Y 27 Sep. VLC Sales and Marketing F Y October 2 Oct. Volvo CE Logistics Director T Y 2 Oct. DHL Key Account Manager Automotive F Y 4 Oct. Mack Trucks Order Fulfilment Director T Y 11 Oct. VLC Head of Human Resources F N/A Volvo Aero Logistics Director N Y
* I = Interview – F = face-to-face interview, T = telephone interview, and N = no interview. ** Q = Questionnaire – Y = yes received completed questionnaire, N = no did not receive completed questionnaire, and N/A = not applicable to fill in the questionnaire.

105
Head of Human Resources
1) A) Which activities do you see as added value within the automotive industry today?
B) Of those activities, which do you see comes from the point of view of employee quality? 2) Does VLC conduct skills assessment for all employees and use the results to develop education
and training performance that improve quality skills, knowledge and awareness of VLC’s present and future challenges?
3) A) What is the full purpose of the employee satisfaction index?
B) Does VLC have other key indicators besides employee satisfaction index such as co-operation/teamwork, participation/commitment and 6sigma that are used to evaluate and improve VLC’s performance?
C) If yes, how do you use this data? If no, is the employee satisfaction index really enough?
4) Would you say that VLC has good knowledge about their customers’ requirements? Please give
examples.
5) What do you think VLC should do to increase the following: customer satisfaction, flexibility, and reliability?
The Regional Managers
1) A) In your relation with your customers or others is the term added value commonly used?
B) What are the perceptions that are being raised in general? 2) Which activities do you see as added value within the automotive logistics industry today?
3) The added value services of yesterday are today seen as standard services, and today’s added value
services will tomorrow be seen as standard services. What do you see will become the future added values within the automotive logistics industry and why?
4) Would you say that VLC has good knowledge about their customers’ requirements? Please give
examples.
5) A) What are the frequent requirements of your customers?
B) What do you believe differ them from other regions? C) What are the reasons?
6) What are your performance in meeting those requirements (refer. to Q5A) in the Inbound and
Outbound? Please explain also the failures.
7) How are the Emballage activities perceived by your customers?
8) What do you think VLC should do to increase the following: customer satisfaction, flexibility, and reliability?
9) A) To win over a customer from a competitor are VLC willing to give some services away?
B) How far are VLC willing to go?

106
Chief Financial Officer
1) Which activities do you see as added value within the automotive logistics industry today?
2) The added value services of yesterday are today seen as standard services, and today’s added value services will tomorrow be seen as standard services. What do you see will become the future added values within the automotive logistics industry and why?
3) Would you say that VLC has good knowledge about their customers’ requirements?
4) We have noticed through our research that VLC is not conducting a performance assessment
relative to customers’ priorities, why is that?
5) Would you say that it is due to the VLC pricing that VLC fails to provide the complete package of Inbound, Outbound and Emballage to some of its customers i.e. Renault Truck?
6) What do you think VLC should do to increase the following: customer satisfaction, flexibility, and
reliability?
7) A) To win over a customer from a competitor are VLC willing to give some services away?
B) How far are VLC willing to go? 8) How does VLC measure the added value from their suppliers?
Executive Vice President
1) Which activities do you see as added value within the automotive logistics industry today?
2) The added value services of yesterday are today seen as standard services, and today’s added value services will tomorrow be seen as standard services. What do you see will become the future added values within the automotive logistics industry and why?
3) Would you say that VLC has good knowledge about their customers’ requirements?
4) We have noticed through our research that VLC is not conducting a performance assessment
relative to customers’ priorities, why is that?
5) A) Why does VLC fail to provide the complete package of Inbound, Outbound and Emballage to Renault truck?
B) Is your price too high in certain areas so that the relative perceived benefits of the customer i.e. Renault Truck are low, and as a result they will not outsource the complete logistics services to VLC?
6) Why is VLC not involved in services after sales such as car parts logistics? 7) A) How often and why is the offer portfolio changed?
B) How is this change communicated to VLC’s customers? C) How are the customers involved in the change?
8) A) To win over a customer from a competitor are VLC willing to give some services away?
B) How far are VLC willing to go?

107
9) What do you think VLC should do to increase the following: customer satisfaction, flexibility, and reliability? 10) How does VLC measure the added value from their suppliers?
Vision 2015
1) Which activities do you see as added value within the automotive logistics industry today?
2) The added value services of yesterday are today seen as standard services, and today’s added value services will tomorrow be seen as standard services. What do you see will become the future added values within the automotive logistics industry and why?
3) Would you say that VLC has good knowledge about their customers’ requirements?
4) We have noticed through our research that VLC is not conducting a performance assessment
relative to customers’ priorities, why is that?
5) What do you think VLC should do to increase the following: customer satisfaction, flexibility, and reliability?
6) We have been informed that VLC sees its core values as added value services to its customers’;
however we make a distinction between their service function and their service performance. How do you relate your core values to added value services?
7) A) What do you believe is your current comparative competitive advantage?
B) What will be your future comparative competitive advantage?
Head of Strategic Planning & Core Values
1) Which activities do you see as added value within the automotive logistics industry today?
2) The added value services of yesterday are today seen as standard services, and today’s added value services will tomorrow be seen as standard services. What do you see will become the future added values within the automotive logistics industry and why?
3) Would you say that VLC has good knowledge about their customers’ requirements?
4) We have noticed through our research that VLC is not conducting a performance assessment
relative to customers’ priorities, why is that?
5) What do you think VLC should do to increase the following: customer satisfaction, flexibility, and reliability?
6) We have been informed that VLC sees its core values as added value services to its customers’;
however we make a distinction between their service function and their service performance. How do you relate your core values to added value services?
7) A) Why does VLC fail to provide the complete package of Inbound, Outbound and Emballage to
Renault truck?
B) Is your price too high in certain areas so that the relative perceived benefits of the customer i.e. Renault Truck are low, and as a result they will not outsource the complete logistics services to VLC?

108
Manager of global contracting
1) A) Which activities do you see as added value within the automotive logistics industry today?
C) Do your customers share the same understanding?
2) The added value services of yesterday are today seen as standard services, and today’s added value services will tomorrow be seen as standard services. What do you see will become the future added values within the automotive logistics industry and why?
3) Is the term added value mentioned in your contract terms or verbally with your customers? 4) Would you say that VLC has good knowledge about their customers’ requirements?
5) A) How often do VLC’s customers evolve or change their requirements to meet new demands?
B) How do VLC cope with those changes?
6) What are the main selling arguments when approaching an existing customer to propose a new
service and with a new customer to sell the VLC services? 7) What are the main concerns/requests of the companies while you are contracting a new deal? In
others terms what matter to your customers?
8) What do you believe is your comparative competitive advantage? 9) What do you promise to your customer in term of: customer satisfaction, flexibility, and
reliability?
10) A) To win over a customer from a competitor are VLC willing to give some services away?
B) How far are VLC willing to go?
11) How do you value your relation with your existing customers and with your potential customers? Meaning how do you show that they are valuable for you?
Sales and Marketing
1) A) Which activities do you see as added value within the automotive logistics industry today?
B) Do your customers share the same understanding?
2) The added value services of yesterday are today seen as standard services, and today’s added value services will tomorrow be seen as standard services. What do you see will become the future added values within the automotive logistics industry and why?
3) Is the term added value mentioned in your contract terms or verbally with your customers? 4) Would you say that VLC has good knowledge about their customers’ requirements?
5) A) How often do VLC’s customers evolve or change their requirements to meet new demands?
B) How do VLC cope with those changes?
6) What are the main selling arguments when approaching an existing customer to propose a new service and with a new customer to sell the VLC services?

109
7) What are the main concerns/requests of the companies while you are contracting a new deal? In others terms what matter to your customers?
8) What do you believe is your comparative competitive advantage? 9) What do you promise to your customer in term of: customer satisfaction, flexibility, and
reliability?
10) A) To win over a customer from a competitor are VLC willing to give some services away?
B) How far are VLC willing to go?
11) How do you value your relation with your existing customers and with your potential customers? Meaning how do you show that they are valuable for you?
Head of Strategic IS/IT
1) A) Which activities do you see as added value within the automotive logistics industry today?
B) Do your customers share the same understanding?
2) The added value services of yesterday are today seen as standard services, and today’s added value services will tomorrow be seen as standard services. What do you see will become the future added values within the automotive logistics industry and why?
3) Would you say that VLC has good knowledge about their customers’ requirements? 4) What are the main selling arguments in IS/IT when approaching an existing customer to propose a
new service and with a new customer to sell the VLC services? 5) What are the main concerns/requests of the companies in IS/IT while you are contracting a new
deal? In others terms what matter to your customers IS/IT?
6) A) How often do VLC’s customers evolve or change their requirements to meet new demands?
B) How do VLC cope with those changes? 7) How do you value your relation with your existing customers and with your potential customers?
Meaning how do you show that they are valuable for you? 8) What should VLC do to increase the following: customer satisfaction, flexibility, and reliability?
Logistics experts
1) Which activities do you see as added value within the automotive logistics industry today?
2) The added value services of yesterday are today seen as standard services, and today’s added value services will tomorrow be seen as standard services. What do you see will become the future added values within the automotive logistics industry and why?
3) Would you say that VLC has good knowledge about their customers’ requirements? 4) What should be the main selling arguments when VLC is approaching an existing customer to
propose a new service and a new customer to sell the VLC services?

110
5) What should be the main concerns/requests of the companies when they are contracting a new deal with VLC?
6) What do you believe is VLC’s comparative competitive advantage? 7) What do you think VLC should promise to its customers in terms of: customer satisfaction,
flexibility, and reliability? Customers
1) Which activities do you see as added value within the automotive logistics industry today?
2) The added value services of yesterday are today seen as standard services, and today’s added value
services will tomorrow be seen as standard services. What do you see will become the future added values within the automotive logistics industry and why?
3) What is your company’s key buying criterion when dealing with VLC or its competitors? 4) Which kind of added value services does VLC offer that no other company does, if any? 5) A) Of the services provided by VLC today what is good now?
B) What needs to be improved? C) What is missing?
6) A) How would you compare VLC’s offerings regarding quality, environment, safety and security
compared with VLC’s competitors?
Quality Environment Safety & Security Management system Reduced emissions Road safety Customer satisfaction Carrier development Transportation security Continuous improvement Environmental assessments Site security Process orientation Site related environmental impacts Dangerous goods
B) Do you see the quality, environment, safety and security offerings as added value services?
7) Which are the top five added values in the whole chain for your company? 8) A) In the areas/activities where your company is not using VLC, what do the VLC competitors
better than VLC? Please give examples.
B) Are these added values for your company? 9) Does your company feel that VLC is doing everything it can to be able to serve your company in
the best way? 10) Would you say that your relationship with VLC is a high stake relationship, meaning that the
service/s they offer is/are vital to your success?
11) What do you think VLC should do to increase the following: customer satisfaction, flexibility, and reliability?

111
Competitors/suppliers
1) Which activities do you see as added value within the automotive logistics industry today?
2) The added value services of yesterday are today seen as standard services, and today’s added value services will tomorrow be seen as standard services. What do you see will become the future added values within the automotive logistics industry and why?
3) What does your company see as threats from competitors?
4) What do you generally see as the main challenges regarding customers’ requirements?
5) How does your company measure added value from its customers?
6) A) What are your core values?
B) Do you see your core values as added value services for your customers? C) Do your customers see your core values as added values services?
7) Do you see quality, environment, safety and security as added value services? 8) A) What are the most frequent requirements from your customers?
B) What are your customers’ priorities? C) What is your performance in meeting those requirements? Please explain also the failures.
9) A) In your relation with your customers or others is the term added value commonly used?
B) What are the perceptions that are being raised in general? 10) How do you increase the following: customer satisfaction, flexibility, and reliability?
11) A) To win over a customer from a competitor are you willing to give some services away?
B) How far are you willing to go? 12) What are the main selling arguments when approaching an existing customer to propose a new
service and with a new customer to sell your services?

112
Appendix 3 Summary of questionnaire findings 3.1: Question 2 VLC
Priority in describing added value
0
1
2
3
4
5
6
7
Sources
Deg
ree
of p
riori
ty CompetitionManagement / HandlingInnovationProcessingCost
Priority in describing added value
30,8
46,2
30,8
46,238,5
0
20
40
60
80
100
Sources
Pro
port
ion
of V
LC c
hoic
es
CompetitionManagement / HandlingInnovationProcessingCost
Customers
Priority in describing added value
0
1
2
3
4
5
6
7
Sources
Degr
ee o
f prio
rity Competition
Management / HandlingInnovationProcessingCost
Priority in describing added value
50
75
50
37,5
62,5
0
20
40
60
80
100
Sources
Pro
port
ion
of c
usto
mer
s' c
hoic
es
CompetitionManagement / HandlingInnovationProcessingCost
Competitors
Priority in describing added value
0
1
2
3
4
5
6
7
Sources
Deg
ree
of p
rior
ity CompetitionManagement / HandlingInnovationProcessingCost
Priority in describing added value
67 67 67 67 67
0
20
40
60
80
100
SourcesProp
ortio
n of
com
petit
ors'
cho
ices
CompetitionManagement / HandlingInnovationProcessingCost

113
3.2: Question 3 VLC
Identification approach of added value
0
1
2
3
4
5
6
7
Identification methods
Degr
ee o
f cho
ices
Customers' satisfaction orperceptionPersonal satisfaction orperceptionBenchmarking againstcompetitorsBenchmarking against corporatestandards and requirementsWhenever described by suppliers/ customers
Identification approach of added value
53,8
30,8
69,2
23,130,8
0
20
40
60
80
100
Identification methods
Pro
port
ion
of V
LC c
hoic
es
Customers' satisfaction orperceptionPersonal satisfaction orperceptionBenchmarking againstcompetitorsBenchmarking against corporatestandards and requirementsWhenever described bysuppliers / customers
Customers
Identification approach of added value
0
1
2
3
4
5
6
7
Identification methods
Deg
ree
of c
hoic
es
Customers' satisfactionor perception
Personal satisfaction orperception
Benchmarking againstcompetitors
Benchmarking againstcorporate standards andrequirementsWhenever described bysuppliers / customers
Identification approach of added value
62,5
12,5 12,5
50
12,5
0
20
40
60
80
100
Identification methods
Prop
ortio
n of
cus
tom
ers'
cho
ices Customers' satisfaction
or perception
Personal satisfaction orperception
Benchmarking againstcompetitors
Benchmarking againstcorporate standards andrequirementsWhenever described bysuppliers / customers
Competitors
Identification approch of added value
0
1
2
3
4
5
6
7
Identification methods
Deg
ree
of c
hoic
es
Customers' satisfactionor perception
Personal satisfaction orperception
Benchmarking againstcompetitors
Benchmarking againstcorporate standards andrequirementsWhenever described bysuppliers / customers
Identification approach of added value
67
33 33 33 33
0
20
40
60
80
100
Identification methodsProp
ortio
n of
com
petit
ors'
cho
ices Customers' satisfaction
or perception
Personal satisfaction orperception
Benchmarking againstcompetitors
Benchmarking againstcorporate standards andrequirementsWhenever described bysuppliers / customers

114
3.3: Question 4 VLC
Sources of benchmarking
0
1
2
3
4
5
6
7
Benchmarking methods
Degr
ee o
f cho
ices
Against corporate perceptions
Against customers' perceptions
Against competitors' practices
Against corporate standards andrequirementsWhenever described as addedvalue by customers
Sources of benchmarking
53,8
30,823,1 23,1
38,5
0
20
40
60
80
100
Benchmarking methods
Prop
ortio
n of
VLC
cho
ices
Against corporate perceptions
Against customers' perceptions
Against competitors' practices
Against corporate standards andrequirementsWhenever described as addedvalue by customers
Customers
Sources of benchmarking
0
1
2
3
4
5
6
7
Benchmarking methods
Degr
ee o
f cho
ices
Against corporateperceptions
Against customers'perceptions
Against competitors'practices
Against corporatestandards andrequirementsWhenever described bycustomers
Sources of benchmarking
37,5 37,5
25
50
12,5
0
20
40
60
80
100
Benchmarking methods
Pro
porti
on o
f cus
tom
ers'
cho
ices
Against corporateperceptions
Against customers'perceptions
Against competitors'practices
Against corporatestandards andrequirementsWhenever described bycustomers
Competitors
Sources of benchmarking
0
1
2
3
4
5
6
7
Benchmarking methods
Degr
ee o
f cho
ices
Against corporateperceptions
Against customers'perceptions
Against competitors'practices
Against corporatestandards andrequirementsWhenever described bycustomers
Sources of benchmarking
67
33 33
100
67
0
20
40
60
80
100
Benchmarking methodsPro
porti
on o
f com
petit
ors'
cho
ices Against corporate
perceptions
Against customers'perceptions
Against competitors'practices
Against corporatestandards andrequirementsWhenever described bycustomers
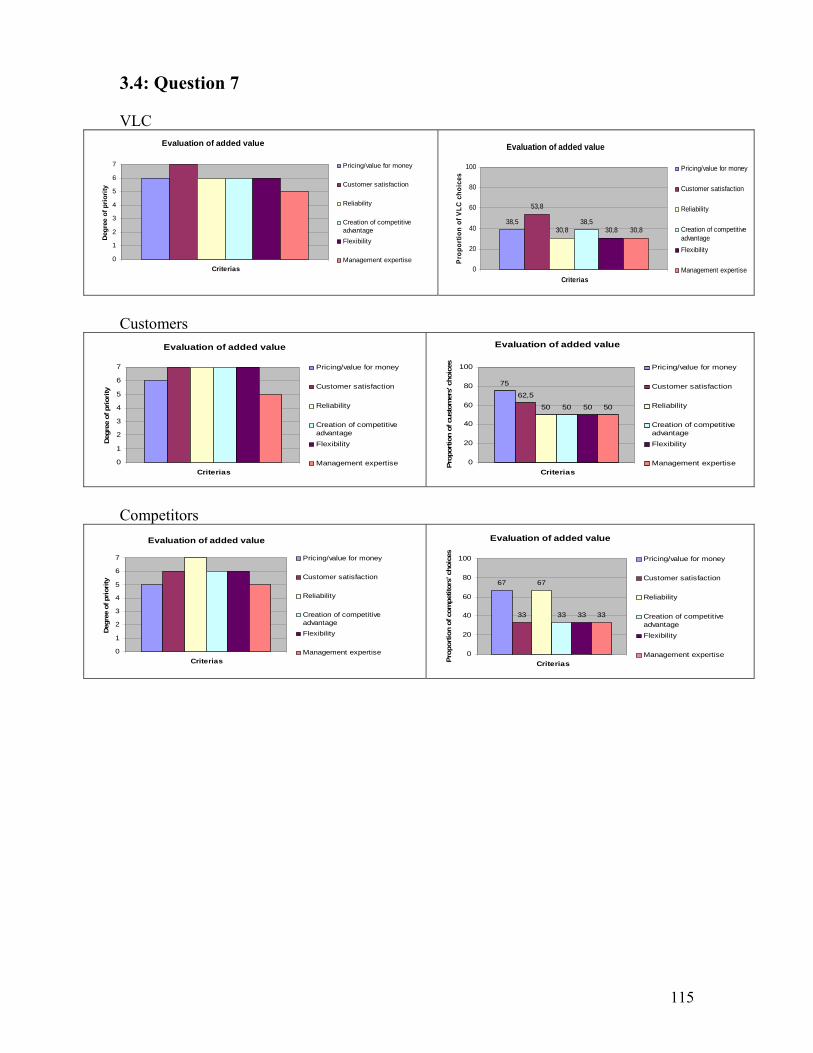
115
3.4: Question 7 VLC
Evaluation of added value
0
1
2
3
4
5
6
7
Criterias
Deg
ree
of p
rior
ity
Pricing/value for money
Customer satisfaction
Reliability
Creation of competitiveadvantageFlexibility
Management expertise
Evaluation of added value
38,5
53,8
30,838,5
30,8 30,8
0
20
40
60
80
100
Criterias
Prop
ortio
n of
VLC
cho
ices
Pricing/value for money
Customer satisfaction
Reliability
Creation of competitiveadvantageFlexibility
Management expertise
Customers
Evaluation of added value
0
1
2
3
4
5
6
7
Criterias
Degr
ee o
f prio
rity
Pricing/value for money
Customer satisfaction
Reliability
Creation of competitiveadvantageFlexibility
Management expertise
Evaluation of added value
75
62,5
50 50 50 50
0
20
40
60
80
100
Criterias
Pro
port
ion
of c
usto
mer
s' c
hoic
es Pricing/value for money
Customer satisfaction
Reliability
Creation of competitiveadvantageFlexibility
Management expertise
Competitors
Evaluation of added value
0
1
2
3
4
5
6
7
Criterias
Degr
ee o
f pri
ority
Pricing/value for money
Customer satisfaction
Reliability
Creation of competitiveadvantageFlexibility
Management expertise
Evaluation of added value
67
33
67
33 33 33
0
20
40
60
80
100
CriteriasProp
ortio
n of
com
petit
ors'
cho
ices Pricing/value for money
Customer satisfaction
Reliability
Creation of competitiveadvantageFlexibility
Management expertise

116
3.5: Question 8 VLC
Grading of contractors
0
1
2
3
4
5
6
7
Dimension of services
Degr
ee o
f prio
rity
ReliabilityResponsivenessAssuranceEmpathy
Grading of contractors
38,546,2
38,5
23,1
0
20
40
60
80
100
Dimension of services
Prop
ortio
n of
VLC
cho
ices
ReliabilityResponsivenessAssuranceEmpathy
Customers
Grading of VLC
0
1
2
3
4
5
6
7
Dimension of services
Degr
ee o
f prio
rity
ReliabilityResponsivenessAssuranceEmpathy
Grading of VLC
14,3
71,4
57,1
42,9
0
20
40
60
80
100
Dimension of services
Prop
ortio
n of
cus
tom
ers'
cho
ices
ReliabilityResponsivenessAssuranceEmpathy
Competitors
Grading of VLC
0
1
2
3
4
5
6
7
Dimension of services
Degr
ee o
f pri
ority
ReliabilityResponsivenessAssuranceEmpathy
Grading of VLC
67 67 67 67
0
20
40
60
80
100
Dimension of servicesPro
port
ion
of c
ompe
titor
s' c
hoic
es
ReliabilityResponsivenessAssuranceEmpathy

117
Appendix 4 Summary of interview findings 4.1: General questions categories Category: Including: General management competence & strategy
Strategy. Management and leadership. Education and training of personnel. Innovation. Global network. Flexibility.
Business relationship Communication. Transparency. Trust. Involvement in product development. Involvement in packaging or even factory design.
Cost reduction Cost related issues. Consolidation. Utilisation – stackability of emballage. Risk management. Customs handling. Documentation handling.
Logistics competence & strategy Proactiveness. Speed – reduce lead time. Precision – JIT. Consolidation as well as deconsolidation. Route engineering. Continuous improvement. Have the right equipment needed. Trailer design. Take more responsibility to release time from the customers. Take out waste from the processes. Manage long and complex supply chains. Intermodal capabilities. Market skills. Material control. Warehousing. Logistics hubs. VMI.
IS/IT System Real time information. EDI. Transparency. Track and trace systems – traceability of each component. Early warning systems. RFID.
VLC’s core values Environment. Safety and security.

118
4.2: What VLC should do to increase its flexibility and reliability Flexibility
Customers
VLC VBC VCE VTC MT RT VCC
General management competence X X X X Business relationship X X Cost transparency X Processing transparency Proactiveness X IS/IT System Continuous improvement X X Flexible X X X
Reliability
Customers
VLC VBC VCE VTC MT RT VCC
General management competence X X X X Business relationship X Cost transparency X Processing transparency X Proactiveness X IS/IT System X Continuous improvement X X Reliable X X X X X
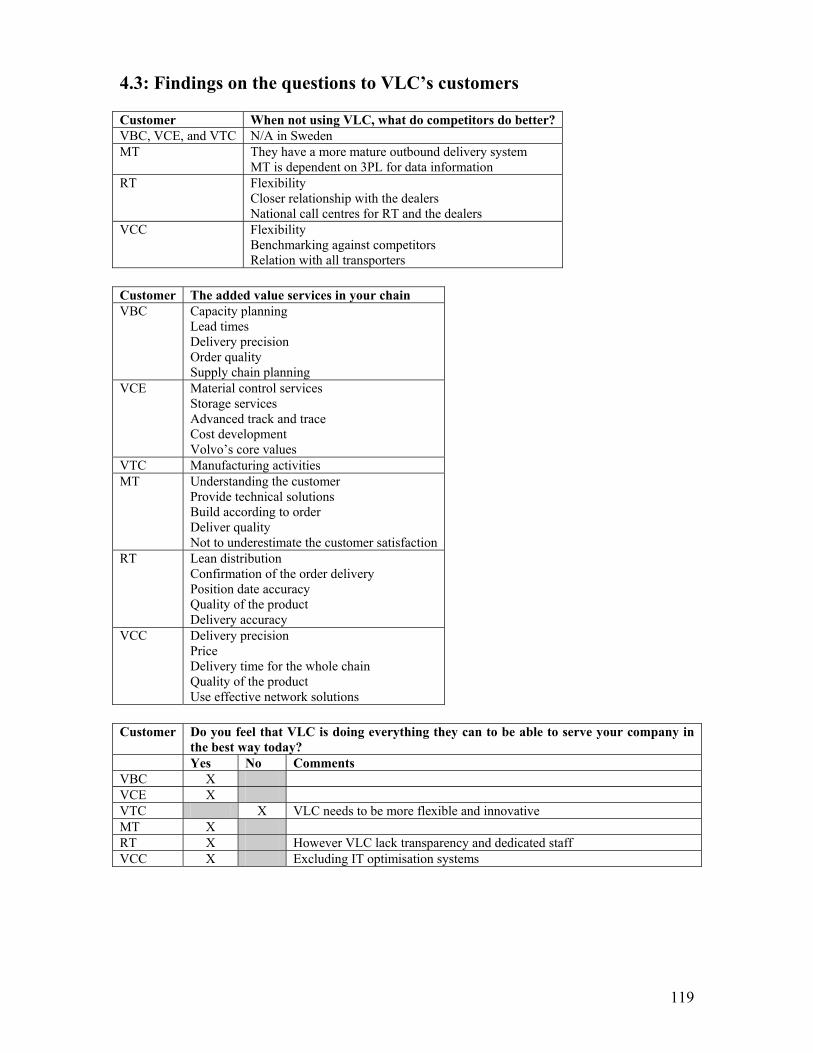
119
4.3: Findings on the questions to VLC’s customers Customer When not using VLC, what do competitors do better? VBC, VCE, and VTC N/A in Sweden MT They have a more mature outbound delivery system
MT is dependent on 3PL for data information RT Flexibility
Closer relationship with the dealers National call centres for RT and the dealers
VCC Flexibility Benchmarking against competitors Relation with all transporters
Customer The added value services in your chain VBC Capacity planning
Lead times Delivery precision Order quality Supply chain planning
VCE Material control services Storage services Advanced track and trace Cost development Volvo’s core values
VTC Manufacturing activities MT Understanding the customer
Provide technical solutions Build according to order Deliver quality Not to underestimate the customer satisfaction
RT Lean distribution Confirmation of the order delivery Position date accuracy Quality of the product Delivery accuracy
VCC Delivery precision Price Delivery time for the whole chain Quality of the product Use effective network solutions
Customer Do you feel that VLC is doing everything they can to be able to serve your company in
the best way today? Yes No Comments VBC X VCE X VTC X VLC needs to be more flexible and innovative MT X RT X However VLC lack transparency and dedicated staff VCC X Excluding IT optimisation systems

120
Is VLC’s core values added value services? Customer Yes No Comment
VBC X Standard VCE X They should however be standard VTC X They give a competitive advantage MT X RT X Standard VCC X 4.4: Findings on the questions to VLC’s competitors Competitor What do you see as threats from competitors? DFDS None DHL Reduction of the number of hauliers used Schenker New entrants who are willing to invest heavily Competitor Frequent requirements from your customers Price Flexibility Reliability Performance Precision Quality DFDS X X DHL X X X Schenker X X X X Competitor What do you see as the main challenges regarding customers’ requirements DFDS Recognising the customers’ real requirements
To satisfy the requirements DHL Flexibility
Working with estimates, no true numbers Schenker Flexibility
Capacity of trucks, trailers, and qualified drivers Competitor How do you measure added value
from your customers? KPIs Yearly survey DFDS X DHL X X Schenker X
Are quality, environment, safety and security added value services? Competitor Yes No Comment
DFDS X Social conscious. Who will pay for it? DHL X It cost a lot, and customers can see it as standard services. Schenker X It cost to deliver it, who should take the cost?