adb annual report 2011 - volume 2: financial statements ... · volume 2 financial report ......
TRANSCRIPT

2011A
sian Developm
ent Bank 2011 An
nu
Al Repo
Rt Volum
e 2
About the Asian Development Bank
ADB’s vision is an Asia and pacific region free of poverty. Its mission is to help its developing member countries reduce poverty and improve the quality of life of their people. Despite the region’s many successes, it remains home to two-thirds of the world’s poor: 1.8 billion people who live on less than $2 a day, with 903 million struggling on less than $1.25 a day. ADB is committed to reducing poverty through inclusive economic growth, environmentally sustainable growth, and regional integration. Based in Manila, ADB is owned by 67 members, including 48 from the region. Its main instruments for helping its developing member countries are policy dialogue, loans, equity investments, guarantees, grants, and technical assistance.
printed in the philippines
ISBN 978-92-9092-634-4
789290 9263449
Asian Development Bank6 ADB Avenue, Mandaluyong City1550 Metro Manila, philippineswww.adb.org
printed on recycled paper
V o l u M e 2Financial Report

overall productionDepartment of External Relations
FulfillmentOffice of Administrative Services, Printing Unit
The Annual Report 2011 is printed using vegetable oil-based inks on recycled paper.
The Annual Report 2011 can be downloaded from ADB’s website at www.adb.org

Annual Report 2011V O L U M E 2Financial Report

© 2012 Asian Development Bank
All rights reserved. Published in 2012.Printed in the Philippines.
ISSN 306-8370ISBN 978-92-9092-634-4 (Print), 978-92-9092-635-1 (PDF)Publication Stock No. FLS124311
Cataloging-In-Publication Data
Asian Development Bank. Annual report 2011.Mandaluyong City, Philippines: Asian Development Bank, 2012.
1. Inclusive growth. 2. Asia and the Pacific. 3. Asian Development Bank. 4. Annual report.I. Asian Development Bank.
Every effort has been made to ensure the accuracy of the data used in this publication. Variations in data in ADB publications often result from different publication dates, although differences may also come from source and interpretation of data. ADB accepts no responsibility from any consequence of their use.
By making any designation of or reference to a particular territory or geographic area, or by using the term “country” in this document, ADB does not intend to make any judgments as to the legal or other status of any territory or area.
ADB encourages printing or copying information exclusively for personal and noncommercial use with proper acknowledgment of ADB. Users are restricted from reselling, redistributing, or creating derivative works for commercial purposes without the express, written consent of ADB.
Note:In this report, “$” refers to US dollars.
Asian Development Bank6 ADB Avenue, Mandaluyong City1550 Metro Manila, PhilippinesTel +63 2 632 4444Fax +63 2 636 2444www.adb.org
For orders, please contact:Department of External RelationsFax +63 2 636 [email protected]
Printed on recycled paper

ManagEMEnt’s DiscUssiOn anD anaLysis
i. OVERViEw 7
ii. ORDinaRy capitaL REsOURcEs 7Basis of Financial Reporting 7selected Financial Data 8Overall Financial Results 8Operating activities 11
Loans 11guarantees 13syndications 14Equity investments 14
Financing Resources 14capital and Reserves 14Borrowings 15
Liquidity portfolio 17contractual Obligations 18Risk Management 18
credit Risk 18Market Risk 25Liquidity Risk 26Operational Risk 26capital adequacy 26asset and Liability Management 27
internal control over Financial Reporting 27critical accounting policies and Estimates 27
iii. spEciaL FUnDs 28asian Development Fund 28technical assistance special Fund 31Japan special Fund 32aDB institute 32asian tsunami Fund 32pakistan Earthquake Fund 33Regional cooperation and integration Fund 33climate change Fund 33asia pacific Disaster Response Fund 34
iV. gRant cOFinancing 34Japan Fund for poverty Reduction 35Japan scholarship program 35
appEnDix: cOnDEnsED ManagEMEnt REpORting BaLancE shEEts 37
Contents

FinanciaL statEMEnts
i. Ordinary capital Resources (OcR)Management’s Report on internal control over Financial Reporting 39independent auditors’ Report on internal control over Financial Reporting 40independent auditors’ Report on Financial statements 42OcR-1 Balance sheet, 31 December 2011 and 2010 44OcR-2 statement of income and Expenses for the years Ended 31 December 2011 and 2010 46OcR-3 statement of comprehensive income for the years Ended 31 December 2011 and 2010 47OcR-4 statement of changes in capital and Reserves for the years Ended
31 December 2011 and 2010 48OcR-5 statement of cash Flows for the years Ended 31 December 2011 and 2010 50OcR-6 summary statement of Loans, 31 December 2011 and 2010 51OcR-7 summary statement of Borrowings, 31 December 2011 and 2010 53OcR-8 statement of subscriptions to capital stock and Voting power, 31 December 2011 55OcR-9 notes to Financial statements, 31 December 2011 and 2010 57
ii. asian Development Fund (aDF)Management’s Report on internal control over Financial Reporting 104independent auditors’ Report on internal control over Financial Reporting 105independent auditors’ Report on Financial statements 107aDF-1 special purpose statement of assets, Liabilities, and Fund Balances,
31 December 2011 and 2010 109aDF-2 special purpose statement of Revenue and Expenses for the years Ended
31 December 2011 and 2010 110aDF-3 special purpose statement of comprehensive Loss for the years Ended
31 December 2011 and 2010 111aDF-4 special purpose statement of changes in Fund Balances for the years Ended
31 December 2011 and 2010 112aDF-5 special purpose statement of cash Flows for the years Ended
31 December 2011 and 2010 113aDF-6 special purpose summary statement of Loans, 31 December 2011 and 2010 114aDF-7 special purpose statement of Resources, 31 December 2011 116aDF-8 notes to special purpose Financial statements, 31 December 2011 and 2010 117
iii. technical assistance special Fund (tasF)Management’s Report on internal control over Financial Reporting 131independent auditors’ Report on internal control over Financial Reporting 132independent auditors’ Report on Financial statements 134tasF-1 statement of Financial position, 31 December 2011 and 2010 136tasF-2 statement of activities and changes in net assets for the years Ended
31 December 2011 and 2010 137tasF-3 statement of cash Flows for the years Ended 31 December 2011 and 2010 138tasF-4 statement of Resources, 31 December 2011 139tasF-5 summary statement of technical assistance approved and Effective for the year Ended
31 December 2011 140tasF-6 notes to Financial statements, 31 December 2011 and 2010 141
iV. Japan special Fund (JsF)Management’s Report on internal control over Financial Reporting 148independent auditors’ Report on internal control over Financial Reporting 149independent auditors’ Report on Financial statements 151JsF-1 statement of Financial position, 31 December 2011 and 2010 152JsF-2 statement of activities and changes in net assets for the years Ended
31 December 2011 and 2010 153JsF-3 statement of cash Flows for the years Ended 31 December 2011 and 2010 154JsF-4 notes to Financial statements, 31 December 2011 and 2010 155
V. asian Development Bank institute (aDBi)independent auditors’ Report 162aDBi-1 statement of Financial position, 31 December 2011 and 2010 163aDBi-2 statement of activities and changes in net assets for the years Ended
31 December 2011 and 2010 164aDBi-3 statement of cash Flows for the years Ended 31 December 2011 and 2010 165aDBi-4 notes to Financial statements, 31 December 2011 and 2010 166
Vi. asian tsunami Fund (atF)Management’s Report on internal control over Financial Reporting 179independent auditors’ Report on internal control over Financial Reporting 180independent auditors’ Report on Financial statements 182atF-1 statement of Financial position, 31 December 2011 and 2010 183atF-2 statement of activities and changes in net assets for the years Ended
31 December 2011 and 2010 184atF-3 statement of cash Flows for the years Ended 31 December 2011 and 2010 185atF-4 notes to Financial statements, 31 December 2011 and 2010 186
Vii. pakistan Earthquake Fund (pEF)Management’s Report on internal control over Financial Reporting 191independent auditors’ Report on internal control over Financial Reporting 192independent auditors’ Report on Financial statements 194pEF-1 statement of Financial position, 31 December 2011 and 2010 195pEF-2 statement of activities and changes in net assets for the years Ended
31 December 2011 and 2010 196pEF-3 statement of cash Flows for the years Ended 31 December 2011 and 2010 197pEF-4 notes to Financial statements, 31 December 2011 and 2010 198
Viii. Regional cooperation and integration Fund (RciF)Management’s Report on internal control over Financial Reporting 204independent auditors’ Report on internal control over Financial Reporting 205independent auditors’ Report on Financial statements 207RciF-1 statement of Financial position, 31 December 2011 and 2010 208RciF-2 statement of activities and changes in net assets for the years Ended
31 December 2011 and 2010 209RciF-3 statement of cash Flows for the years Ended 31 December 2011 and 2010 210RciF-4 notes to Financial statements, 31 December 2011 and 2010 211
ix. climate change Fund (ccF)Management’s Report on internal control over Financial Reporting 216independent auditors’ Report on internal control over Financial Reporting 217independent auditors’ Report on Financial statements 219ccF-1 statement of Financial position, 31 December 2011 and 2010 220ccF-2 statement of activities and changes in net assets for the years Ended
31 December 2011 and 2010 221ccF-3 statement of cash Flows for the years Ended 31 December 2011 and 2010 222ccF-4 notes to Financial statements, 31 December 2011 and 2010 223
x. asia pacific Disaster Response Fund (apDRF)Management’s Report on internal control over Financial Reporting 228independent auditors’ Report on internal control over Financial Reporting 229independent auditors’ Report on Financial statements 231apDRF-1 statement of Financial position, 31 December 2011 and 2010 232apDRF-2 statement of activities and changes in net assets for the years Ended
31 December 2011 and 2010 233apDRF-3 statement of cash Flows for the years Ended 31 December 2011 and 2010 234apDRF-4 notes to Financial statements, 31 December 2011 and 2010 235
statisticaL annExEs 240

Management’s Discussion and Analysis

7
OVERVIEW
The Asian Development Bank (ADB) is an international development financial institution whose vision is an Asia and Pacific region free of poverty. ADB was established in 1966 through the Agreement Establishing the Asian Development Bank (the Charter), ratified by 31 countries,
to promote the social and economic development of the region and reduce poverty. ADB is owned by 67 members, 48 of which are in the region.
ADB provides various forms of financial assistance to its developing member countries (DMCs). The main instruments are loans, technical assistance (TA), grants, guarantees, and equity investments. These instruments are financed through ordinary capital resources (OCR), Special Funds, and trust funds. ADB operations are financed from OCR and Special Funds. The Charter requires that funds from each resource be kept separate from the others. Trust funds are generally financed by contributions and administered by ADB as the trustee.
ADB also provides policy dialogue and advisory services, and mobilizes financial resources through its cofinancing operations that tap official, commercial, and export credit sources to maximize the development impact of its assistance. Cofinancing for ADB projects can be in the form of external loans, grants for TA and components of loan projects, and credit enhancement products such as guarantees and syndications.
ORDINARY CAPITAL RESOURCES
Funding for OCR operations comes from three distinct sources: funds borrowed from capital markets and private placements, paid-in capital provided by shareholders, and accumulated retained income (reserves). The financial strength of OCR is largely based on the support of shareholders and on a sound financial policy framework. Shareholder support is reflected in the form of capital backing from members and in the record of borrowing members in meeting their debt service obligations.
Borrowed funds, together with equity, are used to fund OCR lending and investment activities and other general operations. Loans are generally provided to DMCs that have attained a higher level of economic development and to nonsovereign borrowers. Sovereign loans are priced on a cost pass-through basis, which means the cost of funding the loans plus a contractual spread is passed to the borrowers. ADB applies market-based pricing for nonsovereign loans. In addition to direct lending, ADB also provides guarantees to assist DMC governments and nonsovereign borrowers in securing commercial funds for ADB-assisted projects.
Basis of Financial Reporting
Statutory reporting. ADB prepares OCR financial statements in accordance with accounting principles generally accepted in the United States (US GAAP), referred to in this document as the “statutory reporting basis.”
ADB manages its balance sheet by selectively using derivatives to minimize interest rate and currency risks associated with its financial instruments. Derivatives are used to enhance asset and liability management of individual positions and overall portfolios. ADB has elected not to adopt hedge accounting, but reports all derivative instruments on the balance sheet at fair value and recognizes the changes in fair value for the period as part of net income. Although most of ADB’s derivatives are highly effective in hedging the underlying transactions, compliance with hedge accounting would have imposed undue constraints on future borrowings, loans, and hedge programs, which likely would have detracted from ADB’s efforts to effectively and efficiently minimize the funding costs for its DMCs.
Effective 1 January 2008, ADB elected to fair value financial instruments selectively and opted to fair value borrowings with associated swaps to apply a consistent accounting treatment between the borrowings and their related swaps. ADB continues to report its loans and borrowings that are not swapped at amortized cost and reports most of its investments (except time deposits that are recorded at cost) at fair value.

Asian Development Bank Annual Report 2011
8
Management reporting. Since certain financial instruments (including all derivatives, swapped borrowings, and certain investments) are recorded at their fair value, while loans and a portion of borrowings and investments are recorded at amortized cost, Management believes that statutory income may not fully reflect the overall economic value of ADB’s financial position because of the asymmetric accounting treatment. Accordingly, ADB also reports operating income, which excludes the impact of the fair value adjustments associated with financial instruments from the results of OCR operations. ADB uses operating income as the key measure to manage its financial position, make financial management decisions, and monitor financial ratios and parameters.
The operating income does not include unrealized gains or losses of the portfolio. The unrealized gains or losses, although an important indicator of the portfolio performance, generally represent changes in income as a result of fluctuations in the fair value. Since ADB does not trade these financial instruments actively, such gains or losses are generally not realized unless ADB is forced to do so by risk events before maturity. ADB has instituted conservative risk management policies to mitigate such risks.
Since ADB intends to hold most borrowings and related swaps until maturity or call, the interim unrealized gains and losses reported under statutory basis are expected to converge with the net realized income and expenses ADB recognizes over the life of the transaction.
The management reporting basis balance sheet reconciled from the statutory reporting basis balance sheet as of 31 December 2011 can be found in the Appendix.
Selected Financial Data
Table 1a presents selected financial data on two bases: statutory reporting basis and management reporting basis. Ratios under statutory and management reporting bases, except for return on equity, were all lower than in 2010 because of the decrease in interest rates, especially in the US dollar market (see Table 1b). The increase in return on equity reflects higher operating income compared with 2010. A discussion on revenue and expenses is in the Overall Financial Results section.
Overall Financial Results
Net income. Table 2 presents overall financial results in 2011. Net income for the year was $609.5 million compared with $625.8 million for 2010. The decrease in net income was mainly because of a $54.9 million decrease in net unrealized gains from changes in fair value of financial instruments, offset by an increase of $38.6 million in operating income.
Operating income. Operating income1 for 2011 was $586.6 million compared with $548.0 million for 2010. The increase in operating income was predominantly because of the following:
• $48.3 million increase in overall investment income mainly because of a $50.5 million increase in realized gains from the sale of investments. This was offset by the $2.2 million decrease in interest income compared with the same period in 2010;
• $75.3 million increase in income from equity investments mainly because of a $67.0 million increase in profit on the divestment of shares from publicly traded companies and a $8.3 million net increase in other income; and
• $22.2 million decrease in overall borrowings and related expenses resulting mainly from the declining cost of borrowings and realized gains from buyback activity.
1 Operating income is defined as statutory net income before unrealized gains (or losses) on fair value changes of borrowings and derivatives, and ADB’s proportionate share in unrealized gains (or losses) from equity investment accounted under the equity method.

Management’s Discussion and Analysis
9
Table 1a: selected Financial Data for the year Ended 31 December($ million)
item 2011 2010 2009 2008 2007
statutory Reporting Basis Revenue
From Loans 649.6 680.5 959.8 1,358.0 1,442.3
From Investments 365.3 367.5 459.4 677.2 683.2
From Guarantees 15.7 11.3 9.2 6.9 5.1
From Equity Investments 44.0 58.4 24.5 3.7 58.9
From Other Sources 20.5 24.2 18.6 18.7 18.8
total Revenue 1,095.1 1,141.9 1,471.5 2,064.5 2,208.3
Borrowings and Related Expenses 367.9 386.0 741.7 1,208.4 1,389.8
Administrative Expensesa 315.9 294.3 193.6 141.0 127.3
(Write Back on) Provision for Loan Losses (7.4) (44.7) 115.8 (3.5) (0.6)
Other Expenses 5.0 3.5 5.1 14.7 3.3
total Expenses 681.4 639.1 1,056.2 1,360.6 1,519.8
Net Realized Gains (Losses) 190.1 80.3 23.3 (28.1) 22.9
Net Unrealized Gains (Losses) 5.7 42.7 (466.2) 450.6 53.8
net income (Loss) 609.5 625.8 (27.5) 1,126.3 765.2
Average Earning Assetsb 69,111.9 62,444.5 54,655.0 50,394.0 42,780.0
Annual Return on Average Earning Assets (%) 0.88 1.00 (0.05) 2.24 1.79
Return on Equity (%) 3.74 3.97 (0.18) 7.65 11.29
Return on Loans (%) 1.34 1.61 2.67 3.84 5.00
Return on Investments (%) 2.04 2.17 2.93 3.20 4.68
Cost of Borrowings (%) 1.13 2.06 2.91 4.11 4.32
Management Reporting Basis
Operating Incomec 586.6 548.0 420.1 699.8 711.4
Average Earning Assetsb 69,098.6 62,555.4 54,828.0 50,443.0 42,757.0
Annual Return on Average Earning Assetsd (%) 0.85 0.88 0.77 1.39 1.66
Return on Equity (%) 3.58 3.54 2.84 4.82 5.20
Return on Loans (%) 1.36 1.56 2.55 4.14 5.14
Return on Investments (%) 2.11 2.16 2.87 3.70 4.72
Cost of Borrowings (%) 0.69 0.81 1.83 3.29 4.68
( ) = negative.a Net of administration expenses allocated to the Asian Development Fund and loan origination costs that are deferred.b Composed of investments and related swaps, outstanding loans (excluding net unamortized loan origination cost and/or front-end fees) and related swaps and
equity investments.c Starting September 2009, management reporting income is defined as the operating income. Operating income is defined as statutory net income before
unrealized gains and/or losses on fair value changes of borrowings and derivatives and ADB’s proportionate share in unrealized gains and/or losses from equity investment accounted under equity method.
d Represents operating income over average earning assets.
Table 1b: selected Us Dollar interest Rates (%)
item 2011 2010 2009 2008 2007
6-Month US Dollar LIBOR 0.81 0.46 0.43 1.75 4.60
2-Year US Treasury 0.24 0.60 1.14 0.77 3.06
LIBOR = London interbank offered rate, US = United States.

Asian Development Bank Annual Report 2011
10
Table 2: Overall Financial Results for the year Ended 31 December($ million)
item 2011 2010 change
income from loans 657.0 703.4 (46.4)
Interest income 664.3 688.0 (23.7)
Write back of loan losses 7.4 22.9 (15.5)
Others (14.7) (7.5) (7.2)
income from investments 449.6 401.3 48.3
Interest income 365.3 367.5 (2.2)
Realized gain 84.3 33.8 50.5
income from equity investments 146.8 71.5 75.3
Profit on sale 122.7 55.7 67.0
Realized gain on proportionate share of income from EI accounted under the equity method 11.8 4.8 7.0
Impairment loss (2.1) (7.6) 5.5
Dividend income 14.1 17.8 (3.8)
Others 0.3 0.7 (0.4)
Other income/expenses—net 11.5 50.7 (39.2)
Borrowings and related expenses 362.4 384.6 (22.2)
Interest and other expenses 367.9 386.0 (18.1)
Realized gain (5.5) (1.4) (4.1)
administrative expenses—OcR 315.9 294.3 21.6
Operating income 586.6 548.0 38.6
net unrealized gains 5.7 42.7 (37.1)
net unrealized gains on proportionate share of income from Ei accounted under the equity method 17.2 35.0 (17.8)
net income 609.5 625.8 (16.3)
EI = equity investments, OCR = ordinary capital resources.Note: Numbers may not sum precisely because of rounding.
These were partially offset by the following:
• $46.4 million decrease in overall loan income primarily because of a $23.7 million decrease in interest income and a $15.5 million decrease in the write-back of provision for nonsovereign loans;
• $21.6 million increase in administrative expenses because of the planned increase in administrative expenses in 2011 offset by the increase in the estimated deferred loan origination costs, which decreased the net administrative expense, mainly resulting from the accounting adjustments made in 2010; and
• $39.2 million decrease in other income and expenses, mainly attributed to the $21.7 million write-back of contingent loss on nonsovereign guarantee obligations in 2010 and a $16.8 million increase in impairment loss on debt securities from nonsovereign operations.
Net unrealized gains and losses. During 2011, ADB posted a net unrealized gain of $5.7 million. This primarily consisted of fair value adjustments on the swapped borrowings and the derivatives. These resulted from the downward shift of the yield curves of some of the major currencies and the tightening of ADB’s credit spreads.

Management’s Discussion and Analysis
11
Operating Activities
ADB provides financial assistance through loans, TA, guarantees, and equity investments to its DMCs to help them meet their developmental needs. ADB also promotes cofinancing of its projects and programs to complement its own assistance with funds from both official and commercial sources, including export credit agencies.
Loans
Loans based on the London interbank offered rate (LIBOR) have been the primary lending facility for OCR sovereign operations since 2001. The LIBOR-based loan (LBL) is designed to meet borrowers’ demand for loan products that suit project needs and effectively manage their external debt. The LBL also gives borrowers a high degree of flexibility in managing interest rate and exchange rate risks, while providing low intermediation risk to ADB. Since November 2002, ADB has been offering local currency loans to nonsovereign borrowers; in August 2005, this was expanded to sovereign borrowers. In June 2009, ADB established the Countercyclical Support Facility (CSF) in response to the global economic crisis that spread to Asia and the Pacific. The CSF is a sovereign lending instrument available to support the countercyclical development expenditure and/or policy program of DMCs. Five sovereign loans totaling $2.5 billion were approved and fully disbursed as of the end of 2010.
ADB’s discontinued loan products currently consist of the pool-based single currency loan, the market-based loan, and fixed-rate multicurrency loans. With the introduction of the LBLs, these are no longer offered.
Loan approvals, disbursements, repayments, and prepayments. ADB responded promptly to help its DMCs weather the global economic crisis through record assistance in 2009. With developing Asia rebounding quickly, the level of assistance in 2010 and 2011 stabilized but continued to remain above the pre-2009 level. In 2011, the Board of Directors approved 60 sovereign loans totaling $9.1 billion and 15 nonsovereign loans totaling $1.6 billion, compared with 2010 approvals of 54 sovereign loans totaling $8.2 billion and 12 nonsovereign loans totaling $1.0 billion. Disbursements in 2011 totaled $6.3 billion ($5.6 billion for sovereign loans and $0.7 billion for nonsovereign loans), an increase of 6.6% from the $6.0 billion in disbursements in 2010. Regular principal repayments in 2011 were $2.7 billion (2010: $2.3 billion), while prepayments totaled $104.7 million (2010: $33.5 million). In 2011, five loans were fully prepaid for $67.9 million and two loans were partially prepaid for $36.8 million. As of 31 December 2011, loans outstanding after allowance for loan losses and net unamortized loan origination cost totaled $49.8 billion, of which $47.1 billion were sovereign loans and $2.7 billion were nonsovereign loans.
ADB offers the multitranche financing facility (MFF), a debt financing facility that delivers financial resources for a program or investment in a series of separate financing tranches over a fixed period. Financing tranches may be provided as loans, guarantees, or any combination of these instruments based on periodic financing requests submitted by the borrower. In 2011, 12 MFFs totaling $4.8 billion (2010: 12 MFFs totaling $3.9 billion) were approved under OCR. Periodic financing requests under MFFs totaling $3.7 billion were approved in 2011 (2010: $3.1 billion).
ADB provides lending without sovereign guarantee to entities that can be considered public sector borrowers but are structurally separate from the sovereign or central government. Such entities include state-owned enterprises, government agencies, municipalities, and local government units. Three loans to state-owned enterprises without sovereign guarantee totaling $600.0 million were approved in 2011 (2010: nil).
Status of loans. One nonsovereign loan with an outstanding principal balance of $22.8 million was in non-accrual status as of 31 December 2011 (2010: two nonsovereign loans totaling $31.9 million).
Loan charges on sovereign loans. LBLs and loans approved under the CSF carry a floating lending rate that consists of funding cost margin over or under the 6-month LIBOR and an effective contractual spread. The lending rate is reset every 6 months on each interest reset date and can be converted into a fixed rate at a borrower’s request. The lending rates for pool-based single currency loans are based

Asian Development Bank Annual Report 2011
12
on the previous semester’s average cost of borrowing. Interest rates for market-based loans are either fixed or floating. The floating rates are determined based on 6-month LIBOR with reset dates of either 15 March and 15 September or 15 June and 15 December. Effective 2000, all sovereign loans without specific provisions in the loan agreements were charged a lending spread of 60 basis points over the base lending rate. Since 2004, 20 basis points of the lending spread were waived on borrowers or guarantors under ADB’s sovereign operations that do not have OCR loans in arrears. Subsequently, the waiver policy was extended to cover the period up to December 2012.
In December 2007, the Board of Directors revised the pricing structure for all sovereign LBLs negotiated on or after 1 October 2007 by providing a credit of 0.4% for the duration of the loan. This resulted in an effective contractual spread of 20 basis points over the base lending rate. The waiver mechanism for such loans was eliminated.
In April 2010, the Board approved for all LBLs to sovereign borrowers or with sovereign guarantees and local currency loans with sovereign guarantees (i) that are negotiated from 1 July 2010 up to and including 30 June 2011, that the credit of 0.4% be reduced to 0.3% for the duration of the loan, to result in a contractual spread of 0.3% over the base lending rate; and (ii) that are negotiated from 1 July 2011, that the credit of 0.4% be reduced to 0.2% for the duration of the loan, to result in a contractual spread of 0.4% over the base lending rate.
In December 2011, the Board approved the introduction of maturity premiums for all LlBOR-based loans to sovereign borrowers or with sovereign guarantees (other than project design and facility loans) and local currency loans with sovereign guarantees, for which formal loan negotiations are completed on or after 1 April 2012: (i) 10 basis points per annum on loans with an average loan maturity of greater than 13 years and up to 16 years, and (ii) 20 basis points per annum on loans with an average maturity of greater than 16 years and up to 19 years. ADB also introduced a limit on the average maturity for new loans to not exceed 19 years.
The loans approved under the CSF carry a lending spread of 2.0% over the base lending rate.ADB’s lending rates for pool-based single currency loans in US dollars and in yen are shown
in Table 3. ADB applied a progressive commitment fee of 75 basis points on undisbursed loan balances
for sovereign project loans and a flat commitment fee of 75 basis points for sovereign program loans. In October 2006, as part of the enhancement of ADB’s loan and debt management products, all sovereign project loans negotiated after 1 January 2007 carried a flat commitment fee of 35 basis points on the full amount of undisbursed loan balances. In April 2007, the Board approved a waiver of 10 basis points of the commitment charge on the undisbursed balances of sovereign project loans negotiated after 1 January 2007 and 50 basis points of the commitment charge on the undisbursed balances of sovereign program loans. The waiver is applicable to all interest periods starting from 1 January 2007 up to and including 31 December 2012.
In December 2007, the Board approved a reduction in the commitment charge to 15 basis points for both sovereign program and project loans negotiated on or after 1 October 2007, and eliminated the waiver for such loans.
Table 3: Lending Ratesa
(% per year)
2011 2010 pscLs
1 January 1.53 1.62 yen
4.11 4.14 US dollar
1 July 1.53 1.62 yen
4.19 3.83 US dollar
PSCL = pool-based single currency loan, US = United States.a Lending rates are set on 1 January and 1 July every year and are valid for 6 months and are represented net of 20 basis points lending spread waiver.

Management’s Discussion and Analysis
13
Table 4: Funding cost Margin(% per year)
(Rebate) or surcharge
type 1 July 2011 1 January 2011 1 July 2010 1 January 2010
LIBOR-based Loans
US dollar (0.21) (0.23) (0.26) (0.28)
yen (0.27) (0.27) (0.27) (0.28)
CSF Loans – US dollar 0.18 0.18 0.18 0.22
CSF = Countercyclical Support Facility, LIBOR = London interbank offered rate, US = United States.
Rebates and surcharges are standard features of sovereign LBLs and loans approved under the CSF. To maintain the principle of the cost pass-through pricing policy, ADB returns the actual funding cost margin above or below LIBOR to its sovereign borrowers through a surcharge or rebate. The funding cost margins are reset on 1 January and 1 July every year, and are based on the actual average funding cost margin for the preceding 6 months. The rebates or surcharges are passed on to the borrowers by incorporating them into the interest rate for the succeeding interest period. ADB returned an actual sub-LIBOR funding cost margin of $81.5 million to its LBL sovereign borrowers in 2011 (2010: $85.4 million) based on the rebate rates, and collected a surcharge of $4.5 million on loans under the CSF in 2011 (2010: $4.1 million).
Loan charges on nonsovereign loans. For nonsovereign loans, ADB applies market-based pricing to determine the lending spread, front-end fees, and commitment charges for each loan. The lending spread is intended to cover ADB’s risk exposure to specific borrowers and projects and the front-end fee to cover the administrative costs incurred in loan origination. Front-end fees typically range from 1% to 1.5% depending on the transaction. ADB applies a commitment fee typically in the range of 0.50% to 0.75% per year on the undisbursed commitment.
Local currency loans are priced based on relevant local funding benchmarks or ADB’s funding costs and a market-based spread.
Project design facility. In April 2011, ADB established the project design facility (PDF) on a pilot basis to support project preparation, particularly detailed engineering designs, through project design advances. Loans approved under the PDF carry standard interest of OCR or the Asian Development Fund (ADF). Payment of interest is deferred until the project design advance is refinanced out of the proceeds of the loan, or other repayment terms take effect. As of 31 December 2011, there were no projects approved under PDF.
Policy-based lending. Effective 14 October 2011, ADB introduced policy-based lending, which enhanced the program lending policy by mainstreaming the programmatic budget support and enhancing the crisis response capacity. All features of the previous program lending were carried over to the policy-based lending.
Official cofinancing for loans. In 2011, $2,307.5 million from official sources was mobilized in loan cofinancing for 14 loan projects, of which $107.0 million is with ADB’s administration and $2,200.5 million is under collaborative arrangements. Refer to Note E of OCR Financial Statement for loans administered by ADB as of 31 December 2011.
Guarantees
ADB provides guarantees2 as credit enhancements for eligible projects to cover risks that the project and its commercial cofinancing partners cannot easily absorb or manage on their own. Reducing these risks can make a significant difference in mobilizing debt funding for projects.
2 Under its Charter, ADB may guarantee debt transactions. Guarantees are typically designed to facilitate cofinancing by mitigating risk exposure of commercial lenders and capital market investors. A political risk guarantee (one form of guarantee offered by ADB) covers specifically defined political risks. Other guarantees provide comprehensive cover for debt service.

Asian Development Bank Annual Report 2011
14
ADB has used its guarantee instruments successfully for infrastructure projects, financial institutions, capital markets, and trade finance. These instruments generally are not recognized in the balance sheet and have off-balance sheet risks. For guarantees issued and modified after 31 December 2002, ADB recognized at the inception of a guarantee the noncontingent aspect of its obligations. In 2011, ADB approved four new guarantees totaling $416.6 million (2010: three guarantees totaling $700.0 million).
Trade Finance Program. The Trade Finance Program, which started operations in 2004, consists of three products: (i) a credit guarantee facility, under which ADB issues guarantees to participating international and regional banks to guarantee payment obligations issued by approved DMC and/or local banks in selected DMCs; (ii) a revolving credit facility, under which ADB provides trade-related loans to DMC banks in support of DMC companies’ export and import activities; and (iii) a risk participation agreement, under which ADB shares risk with international banks to support and expand trade in challenging and frontier markets. The credit guarantee and risk participation agreement are unfunded products, while the revolving credit facility is funded.
As of 31 December 2011, outstanding Trade Finance Program loans amounted to $8.8 million (2010: nil) and guarantees amounted to $579.2 million (2010: $567.1 million).
Syndications
Syndications enable ADB to mobilize cofinancing by transferring some or all of the risks associated with its loans and guarantees to other financing partners.3 Thus, syndications decrease and diversify the risk profile of ADB’s financing portfolio. Syndications may be on a funded or unfunded basis, and they may be arranged on an individual, portfolio, or any other basis consistent with industry practices. In 2011, $200.0 million for syndications through B-loans4 was provided for two projects (2010: $320.0 million for three projects).
Equity Investments
The Charter allows the use of OCR for equity investments in private enterprises up to 10% of its unimpaired paid-in capital actually paid up together with reserves and surplus, excluding special reserves. At the end of 2011, the total equity investment portfolio for OCR for both outstanding and undisbursed approved facilities totaled $1,240.1 million, or about 79% of the ceiling defined by the Charter.
In 2011, ADB approved six equity investments totaling $239.0 million (2010: seven equity investments totaling $235.0 million). In the same period, ADB disbursed a total of $76.7 million in equity investments, a 60.2% decrease from $192.6 million disbursed in 2010, and received a total of $207.4 million from capital distributions and divestments, whether in full or in part, in 38 projects. The divestments were carried out in a manner consistent with good business practices, after ADB’s development role in its investments had been fulfilled, and without destabilizing the companies concerned.
Financing Resources
Capital and Reserves
In April 2009, the Board of Governors adopted Resolution No. 336, which provides for a fifth general capital increase (GCI V) in ADB’s authorized capital stock and subscriptions of an additional 7,092,622 shares by ADB members. As of 31 December 2011, ADB had received subscriptions from 66 of 67 members totaling $108.0 billion, representing about 99.2% of the shares authorized under GCI V. Following the remaining member’s advice that it will no longer
3 Depending on whether ADB retains risk or not, ADB may or may not have a contingent liability.4 A B-loan is a tranche of a direct loan nominally advanced by ADB, subject to eligible financial institutions’ taking funded risk
participations within such a tranche and without recourse to ADB. It complements an A-loan funded by ADB.

Management’s Discussion and Analysis
15
subscribe to the allocated shares, the Board of Directors approved the conclusion of the GCI V subscription in January 2012.
The total authorized capital of ADB was 10,638,933 shares valued at $163.3 billion as of 31 December 2011. Subscribed capital as of 31 December 2011 was 10,583,580 shares valued at $162.5 billion. Of the subscribed capital, $8.2 billion was for paid-in ($4.7 billion of which was paid as of 31 December 2011) and $154.3 billion was for callable. Callable capital can be called only if required to meet ADB’s obligations incurred on borrowings or guarantees under OCR. No call has ever been made on ADB’s callable capital.
In accordance with Article 40 of the Charter, the Board of Governors annually approves the allocation of the previous year’s net income to reserves and/or surplus. In addition, to the extent feasible, it approves the transfer of part of the net income to Special Funds to support development activities in its DMCs. In May 2011, the Board of Governors approved the allocation of 2010 net income of $614.5 million, after appropriation of guarantee fees to the special reserve, as follows: (i) $45.9 million be transferred from the Loan Loss Reserve; (ii) $77.8 million, representing the Financial Accounting Standards Board’s Accounting Standards Codification (ASC) 815 and 825 adjustments and the unrealized portion of net income from equity investments accounted under equity method, to the Cumulative Revaluation Adjustments account; (iii) $422.6 million to ordinary reserve; (iv) $120.0 million to the ADF; and (v) $40.0 million to the Technical Assistance Special Fund (TASF).
Total shareholders’ equity increased from $15,878.5 million as of 31 December 2010 to $16,533.5 million as of 31 December 2011. This was primarily because of (i) the net effect of the change in the value of the special drawing right (SDR) on capital and reserves of $32.6 million, (ii) a $541.0 million increase in paid-in capital for the installment payments received, and (iii) net income for the year of $609.5 million, before appropriation to special reserve of $15.7 million guarantee fees. The increases were offset mainly by the net increase in other comprehensive loss of $367.9 million and allocations to the Special Funds totaling $160 million ($120 million to the ADF, and $40 million to the TASF).
ADB limits the total amount of outstanding loans and guarantees, as well as outstanding equity investments including undisbursed commitments, to the total amount of ADB’s unimpaired subscribed capital, reserves, and surplus. In addition, the gross outstanding borrowings cannot exceed the sum of callable capital from nonborrowing members, paid-in capital, and reserves (including surplus). As of 31 December 2011, headroom for lending was $123.3 billion ($108.6 billion as of 31 December 2010) and for borrowings was $57.9 billion ($44.9 billion as of 31 December 2010).
Borrowings
ADB’s primary borrowing objective is to ensure the availability of funds at the most stable and lowest possible cost for its operations. Subject to this objective, ADB seeks to diversify its funding sources across markets, instruments, and maturities. In 2011, ADB continued to employ a strategy of issuing liquid benchmark bonds to maintain its strong presence in key currency bond markets, and raising funds through opportunistic financing and private placements, such as retail-targeted transactions and structured notes, which provide ADB with cost-efficient funding levels.
Summary of 2011 funding operations. In 2011, ADB completed 68 borrowing transactions, raising about $14.0 billion in long- and medium-term funds (2010: $14.9 billion). The new borrowings were raised in nine currencies: Australian dollar, Brazilian real, Mexican peso, New Zealand dollar, Norwegian krone, pound sterling, South African rand, Turkish lira, and US dollar. Of the 2011 borrowings, $10.6 billion was raised through 16 public offerings, including three global benchmark bond issues denominated in US dollars totaling $5.5 billion. The remaining $3.4 billion were raised through 52 private placements. The average maturity of these borrowings was 4.6 years (2010: 4.9 years). All of the 2011 borrowings were converted into US dollar floating-rate liabilities. Aside from the medium- and long-term borrowings, ADB also raised $620.6 million in short-term funds under its Euro-commercial paper program to enhance its presence in the market and to meet temporary cash needs.

Asian Development Bank Annual Report 2011
16
a Other currencies include Brazilian real, Canadian dollar, yuan, Hong Kong dollar, Indian rupee, Kazakhstan tenge, ringgit, Mexican peso, New Zealand dollar, Norwegian krone, Philippine peso, pound sterling, Singapore dollar, South African rand, Swiss franc, baht, and Turkish lira.
b Other currencies include yuan, Indian rupee, Kazakhstan tenge, and Swiss franc.
Figure 1: Effect of swaps on currency composition of BorrowingsAs of 31 December 2011
Currency Composition ofOutstanding Borrowings
(Before Swaps)
Other Currenciesa
19.5%
Japanese yen6.4%
Australian dollar16.8%
US dollar57.3%
Currency Composition ofOutstanding Borrowings
(After Swaps)
Japanese yen7.2%
US dollar91.4%
Other Currenciesb
1.4%
Table 5: Borrowings($ million)
item 2011 2010
Long term
Total Principal Amount 14,008.8 14,940.1
Average Maturity to First Call (years) 4.6 4.9
Average Final Maturity (years) 6.8 6.1
Number of Transactions
Public Offerings 16 20
Private Placements 52 72
Number of Currencies (before swaps)
Public Offerings 6 6
Private Placements 7 7
short terma
Total Principal Amountb 620.6 30.0
Number of Transactions 8 1
Number of Currencies 2 1 a All euro-commercial papers.b At year-end, the outstanding principal amount was $437.6 million in 2011 and nil in 2010.
As of the end of 2011, only $437.6 million of Euro-commercial paper borrowings were outstanding. Table 5 shows details of 2011 borrowings as compared with borrowings in 2010.
In May 2011, ADB launched its first NKr1.25 billion ($227 million) public bond offering; in October 2011, ADB reopened the existing Norwegian krone issue in the amount of NKr250 million ($43.1 million), bringing the outstanding principal to NKr1.5 billion ($270.2 million). ADB also issued its first pound sterling-denominated floating rate note totaling £400 million ($645.4 million). Following the success of its thematic bonds in 2010, ADB issued two water themed private placements in 2011 totaling $40 million. ADB also completed buyback transactions with the total notional amount of about $298.9 million in 2011.
Local currency bonds. ADB continued to explore and pursue its objective to contribute to the development of regional bond markets and provide the appropriate local currency funding for its borrowers. ADB works closely with the Private Sector Operations Department and regional departments to track local currency financing requirements and, where required, help with financial structuring and pricing aspects of projects. In 2011, ADB successfully executed a long-dated

Management’s Discussion and Analysis
17
Figure 2: Effect of swaps on interest Rate structures of BorrowingsAs of 31 December 2011
Interest Rate Structure ofOutstanding Borrowings
(Before Swaps)
Fixed93.9%
Variable6.1%
Interest Rate Structure ofOutstanding Borrowings
(After Swaps)
Fixed8.2%
Variable91.8%
Table 6: year-End Balance of Liquidity portfolioa
($ million)
item 2011 2010
Core Liquidity Portfolio 14,399.5 12,591.6
Operational Cash Portfolio 195.9 218.2
Cash Cushion Portfolio 2,136.0 1,933.0
Discretionary Liquidity Portfolio 4,407.5 3,090.5
Other Portfolio 562.4 453.1
total 21,701.3 18,286.4a Including receivables for securities repurchased under resale arrangements, securities transferred under securities lending arrangements, unsettled trades, and
accrued interest. The composition of the liquidity portfolio may shift from 1 year to another as part of ongoing liquidity management.
and highly structured cross-currency swap to finance the disbursement of ADB’s first sovereign- guarantee local currency loan denominated in Kazakhstan tenge.
Use of derivatives. ADB undertakes currency and interest rate swaps to raise, on a fully hedged basis, currencies needed for operations in a cost-efficient way, while maintaining its borrowing presence in major capital markets. Figures 1 and 2 show the effects of swaps on the currency composition and interest rate structure of ADB’s outstanding borrowings as of 31 December 2011. Interest rate swaps are also used for asset and liability management purposes to match the liabilities with the interest rate characteristics of loans.
Liquidity Portfolio
The liquidity portfolio helps ensure the uninterrupted availability of funds to meet loan disbursements, debt servicing, and other cash requirements; provides a liquidity buffer in the event of financial stress; and contributes to ADB’s earning base. ADB’s Investment Authority governs management of ADB’s liquidity investments. The primary objective is to maintain the security and liquidity of funds invested. Subject to these two parameters, ADB seeks to maximize the total return on its investments. ADB does not switch currencies to maximize returns on investments, and investments are generally made in the same currencies in which they are received. At the end of 2011, ADB held liquid investments in 23 currencies.
Liquid investments are held in government and government-related debt instruments, time deposits, and other unconditional obligations of banks and financial institutions. To a limited extent, they are also held in corporate bonds that are rated at least A–. These investments are held in five portfolios—core liquidity, operational cash, cash cushion, discretionary liquidity, and ad hoc—all of which have different risk profiles and performance benchmarks. The year-end balance of the portfolios in 2011 and 2010 is presented in Table 6.

Asian Development Bank Annual Report 2011
18
Table 7: Return on Liquidity portfolio(%)
annualized Financial Return
item 2011 2010
Core Liquidity Portfolio 3.44 3.50
Operational Cash Portfolio 0.09 0.15
Cash Cushion Portfolio 0.57 0.46
Discretionary Liquidity Portfolioa 0.44 0.30
Other Portfolio 3.57 1.36 a Spread over funding cost at 31 December.
The core liquidity portfolio (CLP) is invested to ensure that the primary objective of a liquidity buffer is met. Cash inflows and outflows are minimized to maximize the total return relative to a defined level of risk. The portfolio has been funded by equity, and the average duration of the major currencies in the portfolio was about 2.26 years at 31 December 2011.
The operational cash portfolio is designed to meet net cash requirements over a 1-month horizon. It is funded by equity and invested in short-term highly liquid money market instruments.
The cash cushion portfolio holds the proceeds of ADB’s borrowing transactions pending disbursement. It is invested in short-term instruments and aims to maximize the spread earned between the borrowing cost and the investment income.
The discretionary liquidity portfolio is used to support medium-term funding needs and is funded by debt to provide flexibility in executing the funding program over the medium term, and to opportunistically permit borrowing ahead of cash-flow needs and bolster ADB’s access to short-term funding through continuous presence in the market.
Contractual Obligations
In the normal course of business, ADB enters into contractual obligations that may require future cash payments. Table 8 summarizes ADB’s significant contractual cash obligations as of 31 December 2011 and 2010. Long-term debt includes direct medium- and long-term borrowings, excluding swaps, and excludes unamortized premiums, discounts, and the effects of applying ASC 815. Other long-term liabilities correspond to accrued liabilities, including pension and postretirement medical benefits.
Table 8: contractual cash Obligations($ million)
item 2011 2010
Long-Term Debt 56,902.6 52,142.8
Undisbursed Loan Commitments 28,349.9 24,577.0
Undisbursed Equity Investment Commitments 611.5 471.5
Guarantee Commitments 2,480.4 2,331.7
Other Long-Term Liabilities 1,573.9 1,267.6
total 89,918.3 80,790.6

Management’s Discussion and Analysis
19
Table 9: aDB internal Risk Rating scale
aDB internal Rating scale credit Rating agency Equivalent aDB Definitions
1 AAA/Aaa to A/A2 Lowest expectation of credit risk
2 A–/A3 Very low credit risk
3 BBB+/Baa1 Low credit risk
4 BBB/Baa2 Low credit risk
5 BBB–/Baa3 Low to medium credit risk
6 BB+/Ba1 Medium credit risk
7 BB/Ba2 Medium credit risk
8 BB–/Ba3 Medium credit risk
9 B+/B1 Significant credit risk
10 B/B2 Significant credit risk
11 B–/B3 Significant credit risk
12 CCC+/Caa1 High credit risk
13 CCC/Caa2 to C Very high credit risk
14 D Default
ADB = Asian Development Bank.
Risk Management
In its operations, ADB faces various kinds of risks, including financial, operational, and other organizational risks. The active management of these risks is a key determinant of ADB’s ability to maintain its AAA rating. ADB has a comprehensive risk management framework that is built on the three core components of governance, policies, and processes. Governance starts with the Board of Directors, which plays a key role in reviewing and approving risk policies that define ADB’s risk appetite. ADB also maintains an independent risk management group and has various management- level committees with oversight responsibility for and decision-making authority on risk issues. ADB’s risk management framework also includes the Risk Committee, which provides high-level oversight of ADB’s risks and recommends risk policies and actions to the President.
ADB monitors the credit of existing transactions in the nonsovereign portfolio, conducts risk assessments of new nonsovereign transactions, and assumes responsibility for resolving distressed transactions when necessary. It also monitors market and credit risks in treasury operations, such as the credit quality of counterparties, interest rate risk, and foreign exchange risk. For the aggregate portfolio, ADB monitors limits and concentrations, sets aside loan loss reserves and provides loan loss provisions including collective provision requirements, and assesses its capital adequacy.
In carrying out its mission, ADB is exposed to various risks: (i) credit risk, (ii) market risk, (iii) liquidity risk, and (iv) operational risk. This section will discuss each of these risks as well as ADB’s capital adequacy—ADB’s ultimate protection against unexpected losses—and its asset and liability management.
Credit Risk
Credit risk is the loss that could result if a borrower or counterparty defaults or if its creditworthiness deteriorates. Related to credit risk, ADB also faces concentration risk, which arises when a high proportion of the portfolio is allocated to a specific country, industry sector, obligor, type of instrument, or individual transaction.
ADB assigns a risk rating to each loan, guarantee, and treasury counterparty on an internal scale from 1 to 14 (Table 9). For sovereign and treasury counterparties, the external rating is used in assigning the internal rating. For nonsovereign transactions, the rating typically is not better than that of the sovereign.

Asian Development Bank Annual Report 2011
20
ADB is exposed to credit risk in its sovereign, nonsovereign, and treasury operations. The sovereign portfolio includes sovereign loan and guarantees, while the nonsovereign portfolio includes nonsovereign loan and guarantees, publicly traded equity, and private equity. The treasury portfolio includes fixed-income securities, cash and cash equivalents, and derivatives. Table 10 details the credit risk exposure and weighted average risk rating for each asset class. These figures are gross of collateral, other credit enhancements, and impairment provisions. Overall, aggregate credit risk improved from 4.4 (BBB) in 2010 to 4.1 (BBB) in 2011.
Credit risk in the sovereign portfolio. Sovereign credit risk is the risk that a sovereign borrower or guarantor will default on its loan or guarantee obligations. ADB manages its sovereign credit risk through loan loss reserves and maintaining conservative equity levels. OCR has not experienced any loss of principal from sovereign operations. When countries have delayed payments, they have generally returned their loans to accrual status and ADB has never had to write off a sovereign loan funded from OCR.
Table 10: Exposure to credit RiskAs of 31 December 2011 and 2010
2011 2010
itemExposure ($ million)
Rating (1–14)
Exposure ($ million)
Rating (1–14)
Sovereign operations (loan and guarantee) 47,930.5 5.4 / BBB– 44,424.2 5.7 / BB+
Nonsovereign operations 4,622.7 4,416.3
a. Loan and guarantee 3,466.1 6.3 / BB+ 3,138.6 7.1 / BB
b. Publicly traded equity 297.7 n/a 491.6 n/a
c. Private equity 858.9 n/a 786.1 n/a
Treasury 22,981.0 1.0 / AA 20,486.5 1.0 / AA+
a. Fixed income 16,605.7 1.0 / AA+ 15,472.2 1.0 / AA+
b. Cash instruments 5,771.3 1.1 / AA– 3,916.3 1.0 / AA
c. Derivatives 604.0 1.4 / A+ 1,098.0 1.0 / AA–
aggregate Exposure 75,534.2 4.1 / BBB 69,327.0 4.4 / BBB
n/a = not applicable. Note: Numbers may not sum precisely because of rounding.
Figure 3: sovereign Exposure by credit QualityAs of 31 December 2011 and 2010 (%)
Notes: (i) 0.0 = % is less than 0.05. (ii) low credit risk = exposures with risk rating 1–5, medium credit risk = exposures with risk rating 6–11, high credit risk = exposures with risk rating 12–14.
2011
Lowcredit risk
48.0
Mediumcredit risk
51.9
Highcredit risk
0.1
Lowcredit risk
44.9
Mediumcredit risk
55.1
Highcredit risk
0.0
2010

Management’s Discussion and Analysis
21
Table 11: sovereign country ExposureAs of 31 December 2011 and 2010
2011 2010
country $ million % $ million %
People’s Republic of China 11,693.4 24.4 10,462.6 23.6
India 9,844.3 20.5 8,736.2 19.7
Indonesia 9,503.5 19.8 9,887.8 22.3
Philippines 5,569.0 11.6 5,465.0 12.3
Pakistan 5,296.6 11.1 5,089.1 11.5
Others 6,023.7 12.6 4,783.5 10.8
Note: Percentages may not total 100% because of rounding.
ADB charges provisions against income for a specific transaction if it is considered impaired. In addition, ADB also appropriates loan loss reserves in the equity for the average loss that ADB could incur in the course of lending. The provisions are based on projections of future repayment capacity. The loan loss reserve is based on the historical default experience of sovereign borrowers to multilateral development banks. The sum of the provisions and loan loss reserve represents ADB’s expected loss for sovereign operations. The 2011 results are discussed below.
Sovereign credit quality. The weighted average risk rating of the sovereign credit portfolio improved from 5.7 (BB+) in 2010 to 5.4 (BBB–) in 2011 because of improving sovereign credit conditions in many of ADB’s DMCs and more disbursements to high rated countries, such as the People’s Republic of China (PRC) (Figure 3). Refer to Note E of OCR Financial Statements for additional information.
Sovereign concentrations. Because Asia’s population is concentrated in a few countries, ADB assumes higher concentration risk to the most populous countries to fulfill its development mandate. The three largest borrowers—the PRC, India, and Indonesia—represented 64.8% of the portfolio (Table 11).
Expected loss. Improvements in credit quality offset increases in expected loss from portfolio growth, reducing the expected loss for the sovereign portfolio from $164.2 million in 2010 to $158.2 million in 2011 (Table 12).
Credit and equity risks in the nonsovereign portfolio. Nonsovereign credit risk is the risk that a borrower will default on its loan or guarantee obligations where ADB does not have recourse to a sovereign entity. ADB’s nonsovereign credit risk is considered more significant because of the uncertain economic environment in some of ADB’s markets. In addition, ADB’s exposure is concentrated in the energy and finance sectors. ADB employs various policy-based measures to manage these risks.
The Investment Committee and the Risk Committee oversee risks in the nonsovereign portfolio. The Investment Committee, chaired by a vice-president, reviews all new nonsovereign transactions for creditworthiness and pricing. The Risk Committee, chaired by the managing director general, monitors aggregate portfolio risks and individual transactions whose creditworthiness has deteriorated. The Risk Committee also approves or endorses policy changes in managing the portfolio’s risks and approves provisions for impaired transactions.
Table 12: Sovereign portfolio Expected Loss As of 31 December 2011 and 2010
2011 2010
item $ million% of sO portfolio $ million
% of sO portfolio
Provision for Loan Losses – – – –
Loan Loss Reserve Requirementa 158.2 0.3 164.2 0.4
Expected Loss 158.2 0.3 164.2 0.4
– = nil, SO = sovereign operations.a Loan loss reserve requirement is subject to Board of Governors’ approval during the Annual Meeting in May 2012.

Asian Development Bank Annual Report 2011
22
ADB manages its nonsovereign credit risk by assessing all new transactions at the concept clearance stage and before final approval. Following approval, all exposures are reviewed at least annually; more frequent reviews are performed for those that are more vulnerable to default or have defaulted. In each review, ADB assesses whether the risk profile has changed, takes necessary actions to mitigate risks and either confirms or adjusts the risk rating, and updates the valuation for equity investments including assessing whether impairments are considered other than temporary. ADB will provide specific provisions where necessary in accordance with its provisioning policy.
ADB recognizes specific provisions in the net income for known or probable losses in loans or guarantee transactions, and collective provisions for unidentified probable losses that exist in disbursed loan transactions rated below investment grade. In addition, ADB appropriates loan loss reserves in the equity for the average loss that ADB would expect to incur in the course of lending for credit transactions rated investment grade and for the undisbursed portions of credit transactions rated worse than investment grade. Specific provisions are based on projections of future repayment capacity. The collective provision and loan loss reserve are based on historical default data from Moody’s Investors Service that is mapped to ADB’s portfolio. ADB annually tests whether this external data reasonably corresponds to ADB’s actual loss experience and may adjust estimates on the basis of this back testing. The sum of the specific provision, collective provision, and loan loss reserve represents ADB’s expected loss for nonsovereign operations.
Figure 4: nonsovereign Exposure by credit QualityAs of 31 December 2011 and 2010 (%)
Notes: (i) Percentages may not total 100% because of rounding. (ii) low credit risk = exposures with risk rating 1–5, medium credit risk = exposures with risk rating 6–11, high credit risk = exposures with risk rating 12–14.
2011
Lowcredit risk
39.4
Mediumcredit risk
58.0
Highcredit risk
2.6
Lowcredit risk
29.0
Mediumcredit risk
61.7
Highcredit risk
9.4
2010
Table 13: nonsovereign country ExposureAs of 31 December 2011 and 2010
2011 2010
country $ million % $ million %
People’s Republic of China 1,055.0 22.8 1,058.5 24.0
India 668.1 14.5 690.5 15.6
Pakistan 394.6 8.5 293.6 6.6
Philippines 288.1 6.2 326.7 7.4
Indonesia 227.2 4.9 193.4 4.4
Viet Nam 214.3 4.6 396.1 9.0
Others 1,775.4 38.4 1,457.5 33.0
Note: Percentages may not total 100% because of rounding.

Management’s Discussion and Analysis
23
ADB uses limits for countries, industry sectors, corporate groups, obligors, and individual transactions to manage concentration risk in the nonsovereign portfolio. The 2011 results are discussed below.
Nonsovereign loan and guarantee portfolio. ADB assigns a risk rating to each nonsovereign loan and guarantee. During 2011, ADB’s weighted average risk rating improved from 7.1 (BB) to 6.3 (BB+). The improvement was mainly driven by disbursements to better rated projects, risk transfer agreements with stronger rated entities, and an improving economic climate in Asia (Figure 4). Refer to Note E of OCR Financial Statements for additional information.
Publicly traded equity portfolio. The exposure of ADB’s publicly traded equity portfolio declined from $491.6 million in 2010 to $297.7 million in 2011. The drop was because of equity exits during the year.
Private equity portfolio. The private equity portfolio has two components: (i) direct equity investments, where ADB owns shares in investee companies; and (ii) private equity funds, where ADB has partial ownership of a private equity fund, managed by a fund manager, which takes equity stakes in investee companies.
Nonsovereign concentrations. The three largest nonsovereign country exposures as of 31 December 2011 were the PRC (22.8%), India (14.5%), and Pakistan (8.5%). The exposure of the top three countries decreased from 48.6% in 2010 to 45.8% in 2011 (Table 13). All country exposures complied with ADB’s credit limits.
The nonsovereign portfolio is dominated by energy and finance (Table 14). ADB maintains higher exposures to these sectors because of the importance of infrastructure and the finance sector to economic development. To mitigate sector concentration, ADB conducts additional monitoring of and reporting on these sectors and employs specialists in these areas.
Expected loss. Expected loss in the nonsovereign portfolio decreased in 2011 (Table 15). The primary driver of this decline was the upgrading of a number of transactions and countries.
Credit risk in the treasury portfolio. Issuer default and counterparty default are credit risks that affect the treasury portfolio. Issuer default is the risk that a bond issuer will default on its interest or principal payments, while counterparty default is the risk that a counterparty will not meet its contractual obligations to ADB.
Table 14: nonsovereign sector ExposureAs of 31 December 2011 and 2010
2011 2010
sector $ million % $ million %
Energy 2,082.7 45.1 1,966.3 44.5
Finance 1,739.4 37.6 1,682.0 38.1
Investment Funds 374.7 8.1 355.0 8.0
Others 425.9 9.2 413.1 9.3
Note: Percentages may not total 100% because of rounding.
Table 15: nonsovereign portfolio Expected Loss As of 31 December 2011 and 2010
2011 2010
item $ million% of nsO portfolioa $ million
% of nsO portfolioa
Specific Provision for Loan Losses 9.6 0.3 9.2 0.3
Collective Provision for Loan Losses 25.4 0.7 33.4 1.1
Loan Loss Reserve Requirementb 35.5 1.0 35.9 1.1
Expected Loss 70.6 2.0 78.4 2.5
NSO = nonsovereign operations.Note: Numbers may not sum precisely because of rounding.a Percentage only applies to the loan and guarantee operations of the nonsovereign portfolio.b The loan loss reserve requirement is subject to Board of Governors’ approval during the Annual Meeting in May 2012.

Asian Development Bank Annual Report 2011
24
To mitigate issuer and counterparty credit risks, ADB only transacts with financially sound institutions with ratings from at least two reputable external rating agencies. Moreover, the treasury portfolio is generally invested in conservative assets, such as money market instruments and government securities. In addition, ADB has established prudent exposure limits for its corporate investments, depository relationships, and other investments.
ADB has strict counterparty eligibility criteria to mitigate counterparty credit risk arising through derivative transactions. In general, ADB will only undertake swap transactions with counterparties that meet the required minimum counterparty credit rating, have executed an International Swaps and Derivatives Association Master Agreement or its equivalent, and have signed a credit support annex. Under the credit support annex, derivative positions are marked to market daily, and the resulting exposures are generally collateralized by US dollar cash and/or US Treasuries. ADB also sets exposure limits for individual swap counterparties and monitors these limits against current and potential exposures. ADB enforces daily collateral calls as needed to ensure that counterparties meet their collateral obligations. The 2011 results are discussed below.
The weighted average credit rating for the treasury portfolio was AA in 2011. About 98% of the portfolio was rated A or better.
At 31 December 2011, no fixed-income instruments, derivatives, or other treasury exposures were past due or impaired, the same as in 2010.
Deposits. ADB deposits funds only in institutions that have a minimum long-term average credit rating of A+ or short-term credit rating of A-1 and P-1. ADB maintains a watch list of institutions that it perceives as potentially riskier based on internal credit risk assessments. Moreover, the size of the deposit is limited by the counterparty’s equity and creditworthiness. Generally, depository credit risk is low, and all deposits are with institutions rated A+ or better.
Fixed income. ADB has a conservative policy towards fixed-income securities, and the credit risk is low. Sovereign and sovereign-guaranteed securities represent 91% of ADB’s fixed-income assets. The remainder are in corporate bonds that are rated at least A– (Table 16). ADB has monitored market developments closely, such as the US sovereign credit rating downgrade and the European sovereign debt crisis, and adjusted its risk exposures accordingly. ADB’s mortgage-backed securities and asset-backed securities portfolios were liquidated shortly after the US credit rating downgrade in August 2011.
Derivatives. Derivatives counterparty credit risk is low. All swap counterparties are rated at least A–. The current exposure to counterparties rated A– through A+ is generally fully collateralized, while the uncollateralized exposure to those rated AA– and above are subject to specified thresholds. ADB maintains a watch list of institutions that it perceives as potentially riskier based on internal credit risk assessments. At the end of 2011, 87% of the marked-to-market exposure was collateralized. ADB significantly reduced its counterparty risk by moving to a higher rated cash custodian for cash collateral deposited against swaps exposures.
Country exposure. At the end of 2011, treasury credit risk exposure was allocated across 29 countries with the largest exposure in Japan (Table 17).
Table 16: Fixed income portfolio by asset classAs of 31 December 2011 and 2010
2011 2010
item $ million % $ million %
Government 7,332.4 44.2 5,672.2 36.7
Government Guaranteed 3,982.7 24.0 4,476.9 28.9
Government-Sponsored Enterprises and Supranationals 3,722.7 22.4 3,067.9 19.8
Asset-Backed and Mortgage-Backed Securities Rated AAA – – 934.9 6.0
Corporations 1,567.9 9.4 1,320.4 8.5
total 16,605.7 100.0 15,472.2 100.0
Note: Numbers may not sum precisely because of rounding.

Management’s Discussion and Analysis
25
Table 17: treasury country ExposureAs of 31 December 2011 and 2010
2011 2010
country $ million % $ million %
Japan 7,740.0 33.7 4,439.7 21.7
United States 5,088.0 22.1 6,213.7 30.3
Australia 1,757.3 7.6 2,273.9 11.1
Germany 1,622.1 7.1 1,404.8 6.9
France 1,123.6 4.9 1,490.5 7.3
Others 5,650.0 24.6 4,663.8 22.8
total 22,981.0 100.0 20,486.5 100.0
Note: Numbers may not sum precisely because of rounding.
European exposure. Exposure to the European credits have been monitored by conducting daily surveillance of the rating and fair value of the exposure and has limited entering into new transactions. As of 31 December 2011, ADB held one Italian government bond with a notional amount of $85.0 million and associated interest rate swaps which ADB entered to hedge the fixed interest rate of its investment. ADB classified the bond as “available for sale securities.” in its financial statement. The fair value of the bond was $82.0 million, and the $3.0 million cumulative unrealized loss on the bonds was reported in the other comprehensive income. ADB recognized $14.1 million unrealized loss related to the interest rate swap for the year ending 31 December 2011.
Market Risk
Market risk is the risk of loss on financial instruments because of changes in market prices. ADB principally faces three forms of market risk: (i) equity price risk, which was discussed above with the nonsovereign portfolio; (ii) interest rate risk; and (iii) foreign exchange risk. Interest rate risk and foreign exchange risk are discussed in this section.
Interest rate. Interest rate risk in the operations portfolio is hedged as the basis for borrowers’ interest payments are matched to ADB’s borrowing expenses. Therefore, the borrower must assume or hedge the risk of fluctuating interest rates, whereas ADB’s margins remain largely constant.
ADB is primarily exposed to interest rate risk through the liquidity portfolio. ADB monitors and manages interest rate risks in the liquidity portfolio by employing various quantitative methods. It marks all positions to market, monitors interest rate risk metrics, and employs stress testing and scenario analysis.
ADB uses duration and interest rate value-at-risk (VaR) to measure interest rate risk in the treasury portfolio. Duration is the estimated percentage change in the portfolio’s value in response to a 1% parallel change in interest rates. Interest rate VaR is a measure of possible loss at a given confidence level in a given time frame because of changes in interest rates. ADB uses a 95% confidence level and a 1-year horizon. In other words, ADB would expect to lose at least this amount once every 20 years because of fluctuations in interest rates. ADB uses duration and VaR to measure interest rate risk across the liquidity portfolio, with particular attention to the CLP, which is the most exposed to interest rate risk.
Foreign exchange. ADB ensures that its operations have minimal exposure to exchange rate risk. In both the operations and treasury portfolios, ADB is required to match the currency of its assets with the currencies of liabilities and equity. Borrowed funds or funds to be invested may only be converted into other currencies provided that they are fully hedged through cross-currency swaps or forward exchange agreements. However, because of its multicurrency operations, ADB is exposed to fluctuations in reported US dollar results due to currency translation adjustments.
ADB monitors VaR and duration, and performs stress testing to manage market risk in the investment portfolio. The major currencies of the CLP bear the majority of ADB’s market risks and

Asian Development Bank Annual Report 2011
26
account for 66% of ADB’s OCR, while major currencies account for 95% of the CLP. Major currencies include the US dollar, yen, euro, pound sterling, Australian dollar, and Canadian dollar.
Value-at-risk. Aggregate VaR of major currencies of the CLP, which includes interest rate and foreign exchange risks, decreased from 4.1% in 2010 to 3.5% in 2011. This means that there is a 5% probability that the portfolio will lose more than 3.5% ($475.2 million) of its value over the next year. These potential loss estimates continued to decrease in 2011 in line with the decrease in portfolio duration.
Duration. The major CLP’s interest rate sensitivity, as reflected in its weighted portfolio duration, decreased from 2.6 years as of 2010 to 2.3 years as of 2011.
Stress testing. ADB measures how sensitive the major CLP is to interest rate changes. If interest rates were to rise 2%, the major CLP portfolio would be expected to lose 4.5% ($621.0 million). ADB also uses scenario analysis to assess how the major CLP would respond to significant changes in market factors, such as those that have occurred in the past. Because of the high quality of ADB’s investments, scenario analysis suggests that the treasury portfolio would appreciate during many stressed scenarios as demand for highly rated securities increases.
Liquidity Risk
Liquidity risk can arise if ADB is unable to raise funds to meet its financial and operational commitments. ADB maintains core liquidity to safeguard against a liquidity shortfall in case its access to the capital market is temporarily denied. The overriding objective of the liquidity policy is to enable ADB to obtain the most cost-efficient funding under both normal and stressed situations and manage liquidity optimally to achieve its development mission. The Board of Directors approved a revised liquidity policy framework in December 2011. The revised policy was designed to follow sound banking principles in supporting and sustaining ADB’s superior financial strength. It redefined the prudential minimum liquidity as 45% of the 3-year net cash requirements. This represents the minimum amount of liquidity necessary for ADB to continue operations even if access to capital markets is temporarily denied. Maintaining the prudential minimum liquidity level is designed to enable ADB to cover normal net cash requirements for 18 months under the normal and stressed situations without borrowing. The liquidity levels and cash requirements are monitored on an ongoing basis and reviewed by the Board of Directors quarterly. The new policy allows for discretionary liquidity portfolio to maintain a debt funded sub-portfolio that will be excluded from the net cash requirements and prudential minimum liquidity calculations.
Operational Risk
Operational risk is the risk of loss resulting from inadequate or failed internal processes, people, and systems; or from external events. ADB is exposed to many types of operational risk, which it mitigates by applying sound internal controls and monitoring areas of particular concern. In addition, ADB has rolled out operational risk self assessments in several departments for risk identification and assessment to ensure operational risks are managed effectively. In 2011, ADB also conducted a Business Impact Analysis to further strengthen business continuity, including business continuity of information technology infrastructure and at selected Resident Missions, to reduce the impact of disruptions.
Capital Adequacy
ADB’s most significant risk is if a large portion of its loan portfolio were to default. Credit risk is measured in terms of both expected and unexpected losses. For expected losses, ADB holds loan loss reserves and provisions. For unexpected losses, ADB relies on its income-generating capacity and capital, which is a financial institution’s ultimate protection against unexpected losses that may arise from credit and other risks.
ADB principally uses stress testing to assess the capacity of its capital to absorb unexpected losses. The framework has two objectives. First, it measures ADB’s ability to absorb income losses because of a credit shock. Through this monitoring, ADB reduces the probability that it would have to rely on shareholder support, such as additional paid-in capital or a capital call. As a result, ADB not only

Management’s Discussion and Analysis
27
protects its shareholders but also supports its AAA credit rating, which reduces ADB’s borrowing costs and consequently its lending rates.
Second, the framework evaluates ADB’s ability to generate sufficient income to support loan growth after a credit shock. As a development institution, ADB’s mandate becomes more important during a financial crisis when some DMCs may find their access to capital markets limited. This second requirement ensures that ADB will have the capacity to lend under such adverse conditions.
For the stress test, ADB generates thousands of potential portfolio scenarios and imposes credit shocks that are large enough to account for 99% of those scenarios. ADB then assesses the impact of these shocks on its capital by modeling the ratio of equity to loans over the next 10 years. Throughout 2011, the stress test indicated that ADB had adequate capital to absorb the losses of a severe credit shock and to continue its development lending.
Asset and Liability Management
The objectives of asset and liability management for ADB are to safeguard ADB’s net worth and capital adequacy, promote steady growth in ADB’s risk-bearing capacity, and define sound financial policies to undertake acceptable levels of financial risks. The aim is to provide resources for developmental lending at the lowest and most stable funding cost to the borrowers, along with the most reasonable lending terms, while safeguarding ADB’s financial strength. ADB’s asset and liability management safeguards net worth from foreign exchange rate risks, protects net interest margin from fluctuations in interest rates, and provides sufficient liquidity to meet ADB’s operations. ADB also adheres to cost pass-through pricing policy for loans to sovereign borrowers, and allocates the most cost-efficient borrowings to fund the loans. In 2006, ADB clarified and formalized its asset and liability management objectives and practices through a comprehensive policy framework approved by the Board. The framework guides all financial policies related to asset and liability management, including liquidity, investments, equity management, and capital adequacy.
Internal Control over Financial Reporting
In line with global best practices in corporate governance, ADB’s Management has been assessing the effectiveness of its internal controls over financial reporting since 2008 using criteria set forth by the Committee of Sponsoring Organizations of the Treadway Commission in Internal Control – Integrated Framework. ADB applied a risk-based evaluation framework for the 2011 assertion and attestation of the effectiveness of Internal Control over Financial Reporting for OCR and Special Funds, except for the ADB Institute (ADBI). The scope included a review of 49 business processes over financial reporting and four domains for the information technology general computer controls. In 2010, ADB expanded the testing to include trust funds. ADB staff across several departments and offices is responsible for (i) identifying and testing key controls and (ii) assessing and evaluating the design and operating effectiveness of the business processes. Concurrently in 2011, the external auditor performed an independent test of selected key controls and concurred with Management that ADB maintained effective internal control over financial reporting for OCR and Special Funds (except for the ADBI).
Critical Accounting Policies and Estimates
Significant accounting policies are contained in Note B of the OCR financial statements. As disclosed in the financial statements, management estimates the fair value of financial instruments. Since the estimates are based on judgment and available information, actual results may differ and might have a material impact on the financial statements.
Fair value of financial instruments. Under statutory reporting, ADB carries its financial instruments and derivatives, as defined by ASC 815 and 825, on a fair value basis. These financial instruments include embedded derivatives that are valued and accounted for in the balance sheet as a whole. Fair values are usually based on quoted market prices. If market prices are not readily available, fair values are usually determined using market-based pricing models incorporating readily observable market data and require judgment and estimates. These are discussed in more detail in Note B of OCR’s financial statements.

Asian Development Bank Annual Report 2011
28
The pricing models used to determine the fair value of ADB’s financial instruments are based on discounted cash flow models. ADB reviews the pricing models to assess the appropriateness of assumptions to reflect the reasonable valuation of the financial instruments. In addition, the fair values derived from the models are subject to ongoing internal and external verification and review. The models use market-sourced inputs, such as interest rates, exchange rates, and option volatilities. The selection of these inputs may involve some judgment and may impact net income. ADB believes that the estimates of fair values are reasonable.
Provision for loan losses and loan loss reserves. In 2006, the Board approved the revision of the loan loss provisioning methodology for ADB’s nonsovereign operations to a risk-based model. Provision against loan losses for impaired loans reflects management’s judgment and estimate of the present value of expected future cash flows discounted at the loan’s effective interest rate. ADB considers a loan impaired when, based on current information and events, ADB will probably be unable to collect all the amounts due according to the loan’s contractual terms. The provisioning estimate is done quarterly. In 2010, ADB refined the provisioning methodology to include collective provisioning for the nonsovereign portfolio.
ADB uses an internal risk rating system to estimate expected loss for unimpaired loans. The probability of default is based on the historical default experience of sovereign borrowers to multilateral development institutions; for nonsovereign loans, it is based on Moody’s Investors Service default data. A loan loss reserve is established in the equity section for the expected losses as an allocation of net income subject to the approval of the Board of Governors.
Pension and other postretirement benefits. ADB provides staff retirement benefit and postretirement medical benefit plans for all staff members. Costs relating to net periodic benefit cost are allocated between OCR and the ADF based on the agreed cost sharing methodology. The underlying actuarial assumptions used to determine the projected benefit obligations, accumulated benefit obligations, and funded status associated with these plans are based on market interest rates, past experience, and management’s best estimate of future benefit changes and economic conditions. For further details, refer to Notes to Financial Statements—Note O—Staff Retirement Plan and Postretirement Medical Benefits.
SPECIAL FUNDS
ADB is authorized by its Charter to establish and administer Special Funds. These are the ADF, the TASF, the Japan Special Fund, the ADBI, the Asian Tsunami Fund (ATF), the Pakistan Earthquake Fund (PEF), the Regional Cooperation and Integration Fund, the Climate Change Fund, and the Asia Pacific Disaster Response Fund. Financial statements for each Special Fund are prepared in accordance with US GAAP except for the ADF’s, which are special purpose financial statements.
Asian Development Fund
The ADF is ADB’s concessional financing window for DMCs with per capita gross national income below the ADB operational cutoff and limited or low creditworthiness. It is the only multilateral source of concessional assistance dedicated exclusively to reducing poverty and improving the quality of life in Asia and the Pacific. The ADF has received contributions from 32 donors (regional and nonregional). Cofinancing with bilateral and multilateral development partners complements ADF resources.
In August 2008, the Board of Governors adopted the resolution providing for the ninth replenishment of the ADF (ADF X) and the fourth regularized replenishment of the TASF. This became effective on 16 June 2009. The resolution provides for a substantial replenishment of the ADF to finance ADB’s concessional program for 4 years from January 2009, and for a replenishment of the TASF in conjunction with the ADF replenishment to finance TA operations under the TASF. In June 2009, the Board of Directors approved the provision of an additional $400 million in assistance for ADF-only countries. In 2010, the Board approved the release of $162 million for the suspension of Afghanistan’s post-conflict phase out during 2011–2012. As of 31 December 2011, the total replenishment size of SDR7.6 billion ($12.0 billion) consisted

Management’s Discussion and Analysis
29
of SDR7.4 billion for ADF X and SDR0.2 billion for the TASF. About 35% of the replenishment will be financed from new donor contributions totaling SDR2.7 billion ($4.2 billion equivalent).
Currency management. ADB revised the currency management framework for the ADF in 2006. The previous practice of managing ADF resources in as many as 15 currencies was discontinued, and an approach based on an SDR basket of currencies (US dollar, euro, pound sterling, and yen) was introduced. ADF donor contributions and loan reflows received in currencies that are not part of the SDR basket are converted into one of the currencies in the basket to maintain the SDR-based liquidity portfolio. In addition, the borrower’s obligations for new ADF loans are determined in SDR. Starting in 2008, ADB extended the full-fledged SDR approach to ADF legacy loans by providing ADF borrowers the option to convert their existing liability (i.e., disbursed and outstanding loan balance) in various currencies into SDR, while the undisbursed portions were to be treated as new loans redenominated in SDR. As of 31 December 2011, 17 of 30 borrowing members have signified their agreement to the conversion. The outstanding balance of their SDR-converted loans amounted to $13.5 billion.
Framework for grants and hard-term facility. In September 2007, the Board of Directors approved the ADF grant framework, which limits grant eligibility to ADF-only countries and introduced a new hard-term ADF lending facility. The facility will have a fixed interest rate of 150 basis points below the weighted average of the 10-year fixed swap rates of the SDR basket of currencies plus the OCR lending spread, or the current ADF rate, whichever is higher. Other terms are similar to those of regular ADF loans. In general, blend countries with per capita income not exceeding the International Development Association (IDA) operational cutoff for more than 2 consecutive years and with an active OCR lending program are eligible to borrow from this new facility. The interest rate that is fixed for the life of hard-term loans approved during the year is reset every January. For hard-term ADF loans approved in 2011, the interest rate was set at 2.02% for the life of the loan (2010: 2.22%). Three loans were approved under this facility in 2011.
Liquidity management. In 2008, the ADF began managing its liquidity assets under two tranches to allow for the optimal use of financial resources. The main objective of the first tranche is to ensure adequate liquidity is available to meet the expected cash requirements. The second tranche comprises the prudential minimum liquidity the ADF should hold to meet unexpected demands and any usable liquidity for future commitments. This approach ensures that liquidity is managed transparently and efficiently.
Enhanced heavily indebted poor countries initiative. In response to ADF donors’ request, the ADB Board of Governors adopted a resolution on 7 April 2008 for ADB to participate in Heavily Indebted Poor Countries (HIPC) debt relief and to provide Afghanistan with debt relief. The estimated principal amount of Afghanistan’s ADF debt to be forgiven and charged against ADF income was $82.4 million.
Launched in 1996 by the IDA and the International Monetary Fund (IMF), the HIPC initiative provides partial debt relief to poor countries with levels of external debt that severely burden export earnings or public finance. In 1999, the initiative was enhanced to enable more countries to qualify for HIPC relief. The IDA and the IMF reported that several ADF borrowers met the income and indebtedness criteria of the HIPC initiative and were potentially eligible for HIPC debt relief.5 Of these, only Afghanistan became eligible and reached the decision point under the HIPC initiative on 9 July 2007. The decision point is where a HIPC country, having met certain conditions,6 becomes eligible to receive interim debt relief on a provisional basis following the ADB Board of Directors’ approval to provide debt relief under the HIPC initiative. Debt relief has been delivered by partial reduction of debt service payments as they come due.
On 26 January 2010, the executive boards of the IDA and the IMF agreed that Afghanistan had reached the completion point under the HIPC initiative. Thus, debt relief to Afghanistan under the initiative had become irrevocable. The amount of debt relief including principal and interest was revised to $106.0 million and was to be provided through a reduction of Afghanistan’s debt service from
5 These included Bhutan, Kyrgyz Republic, Lao People’s Democratic Republic (Lao PDR), Nepal, and Sri Lanka. Subsequently, Afghanistan was assessed to be potentially eligible for HIPC debt relief. At that time, the authorities of Bhutan, Lao PDR, and Sri Lanka had indicated to the IMF and World Bank staff that they did not wish to avail of the HIPC initiative. In the absence of data, no debt assessment could be made for Myanmar. The authorities of Myanmar also indicated that they could not provide the data needed for the assessment and that they did not want to benefit from debt relief under the HIPC initiative at that time.
6 The conditions are that an HIPC country has a track record of macroeconomic stability and an interim poverty reduction strategy in place and has been cleared of any outstanding arrears.

Asian Development Bank Annual Report 2011
30
July 2010 to February 2028. As of December 2011, the ADF had delivered $3.6 million under this arrangement, bringing the balance to $102.4 million.
Contributed resources. The total replenishment of SDR7.6 billion for ADF X comprise SDR4.6 billion financed from internal resources, SDR2.7 billion from new donor contributions, and SDR0.3 billion from net income transfers from OCR. This covers 2009–2012, which became effective in June 2009 after instruments of contribution deposited with ADB for unqualified contribution exceeded 50% of all pledged contributions. As of 31 December 2011, 29 donors had contributed a total of $3.7 billion, of which $3.1 billion (including the allocation to the TASF) had been received and made available for operational commitments. The remaining unpaid contributions under ADF VIII and ADF IX as of 31 December 2011 totaled $185.6 million.7 (For details of amounts released for operational commitment in 2011, see the column labeled “Addition” in Statistical Annex 23.)
The commitment authority available for future commitments comprises the resources available to the ADF for its future lending activities in the form of loans and grants. These resources are derived from donor contributions, reflow-based resources, and net income transfers from OCR. The balance of the commitment authority available for operations as of 31 December 2011 was $1.4 billion, compared with $1.1 billion as of 31 December 2010 (Table 18).
In May 2011, the Board of Governors approved the transfer of $120.0 million to the ADF as part of OCR’s net income allocation (2010: $120.0 million). In addition, $830.5 million from loan and grant savings and cancellations were included in the commitment authority. This resulted from Management’s continued assessment of opportunities to free committed resources through cancellations of unused loan and grant balances. During 2011, deposited installments under ADF X amounted to $1,140.9 million, ADF promissory notes encashed in 2011 totaled $718.8 million, of which $87.2 million was transferred to the TASF.
7 At US dollar equivalent at 31 December 2011 exchange rates.
Table 18: asian Development Fund commitment authoritya
31 December 2011 and 2010 ($ million)
item 2011 2010
Carryover of ADF IX Commitment Authorityb 121.6 122.0
ADF X Contributions 2,818.2c 1,802.1
ADF IX Contributions 135.1d 111.8
ADF VIII Contributions 8.2e 8.2
Reflow-based Resources 5,886.6f 4,520.8
OCR Net Income Transfer 360.0 240.0
Savings and Cancellations 830.5 650.0
Credits from Accelerated Note Encashment Program 0.9g –
Total ADF X Commitment Authority 10,161.2 7,454.8
Loans and Grants Committed 8,789.9 6,306.6
aDF commitment authority available for Future commitments 1,371.3 1,148.2
ADF = Asian Development Fund, OCR = ordinary capital resources.Note: Numbers may not sum precisely because of rounding.a The Asian Development Bank monitors the ADF commitment authority based on special drawing rights. All reported figures are based on US dollar to special drawing
rights as of 31 December 2011.b The US dollar equivalent of SDR79.2 million at the year-end exchange rate which reflects the cumulative commitment authority for ADF IX.c Following the partial payment of a qualified contributor, amounts from the installment payments of donors who exercised their pro rata rights have been withheld
for operational commitment.d Represents the (i) balance of the third installment and 27.59% of the fourth installment payment of the United States, (ii) corresponding release of amounts withheld due to
the pro rata exercise, and (iii) Italy’s full payment of the balance of its contribution.e Represents 99.16% of Austria’s fourth installment payment which was released and made available for operational commitment.f Includes the (i) liquidity drawdown of SDR1.1 billion, (ii) additional liquidity of SDR270 million released from the foreign exchange provision, and (iii) additional
assistance to Afghanistan of $162 million as a result of the suspension of the post-conflict phase out.g Represents the additional resources from the accelerated note encashment of the remaining balance of Italy’s ADF IX contribution.

Management’s Discussion and Analysis
31
Loan approvals, disbursements, and repayments. In 2011, 39 ADF loans totaling $2.0 billion were approved compared with 51 ADF loans totaling $2.2 billion in 2010. Disbursements during 2011 totaled $1.4 billion, a decrease of 11.8% from $1.6 billion in 2010. At the end of 2011, cumulative disbursements from ADF resources were $32.3 billion. Loan repayments during the year totaled $1.1 billion. At the end of 2011, outstanding ADF loans amounted to $29.5 billion.
Status of loans. At the end of 2011, 28 sovereign loans to Myanmar with total principal outstanding of $642.3 million were in non-accrual status. These represented about 2.2% of the total outstanding ADF loans.
Investment portfolio position. The ADF investment portfolio8 totaled $6.1 billion at the end of 2011 compared with $5.6 billion at the end of 2010. About 33% of the portfolio was invested in bank deposits, and 67% was invested in fixed-income securities. The annualized rate of return on ADF investments including unrealized gains and losses was 1.5% (2010: 1.6%).
Grants. In 2011, ADB approved 16 grants (2010: 34) totaling $596.8 million (2010: $967.2 million), while 34 grants (2010: 21) totaling $1,120.6 million (2010: $651.8 million) became effective, net of $3.6 million (2010: $6.0 million) in write-backs of undisbursed commitments for completed grant projects.
Official cofinancing for loans and grants. In 2011, $1,510.2 million (2010: $720.0 million) was mobilized in official loan and grant cofinancing for 20 ADF-financed projects (2010: 22) totaling $1,316.1 million (2010: $721.2 million).
Technical Assistance Special Fund
The TASF was established to provide TA on a grant basis to ADB’s DMCs and regional TA.In August 2008, as part of the ADF X replenishment, the donors agreed to contribute 3% of the
total replenishment as the fourth replenishment of the TASF in consideration of the demand estimate and the availability of funds from other sources. The replenishment covers 2009–2012.
Contributed resources. As of 31 December 2011, 29 donors had committed a total of $328.2 million to the TASF as part of the ADF X and the fourth regularized replenishment of the TASF. Of the total commitment, $217.4 million had been received.
During 2011, Pakistan made a direct voluntary contribution of $0.07 million. In addition, $40.0 million was allocated to the TASF as part of the OCR’s net income allocation and a total of $41.7 million for the third and fourth regularized replenishments of the TASF. At the end of 2011, TASF resources totaled $1,844.8 million, of which $1,619.7 million was committed, leaving an uncommitted balance of $225.1 million (Statistical Annex 24).
Operations. TA commitments (approved and effective) decreased from $134.7 million in 2010 to $111.9 million in 2011 for 172 TA projects that were made effective during the year, net of $19.0 million (2010: $11.8 million) in write-backs of undisbursed commitments for completed and cancelled TA projects. Undisbursed commitments for TA increased to $306.7 million as of
8 Includes securities purchased under resale arrangement.
Table 19: technical assistance special FundCumulative Resources ($ million)
item 2011 2010
Regularized Replenishment Contributions 762.8 721.1
Allocations from OCR Net Income 809.0 769.0
Direct Voluntary Contributions 89.9 89.9
Income from Investment and Other Sources 186.6 183.2
Transfers from the TASF to the ADF (3.5) (3.5)
total 1,844.8 1,759.7
( ) = negative, ADF = Asian Development Fund, OCR = ordinary capital resources, TASF = Technical Assistance Special Fund.
Asian Development Bank Annual Report 2011
32
31 December 2011 ($298.6 million as of 31 December 2010). The TASF financed 39.0% of all TA activities approved in 2011.
Investment position. As of 31 December 2011, total investment portfolio, including securities purchased under resale arrangement, amounted to $391.9 million, compared with $362.0 million as of the end of 2010. With the increase in the average volume of investments, revenue from investments was $3.34 million for 2011 (2010: $2.49 million).
Japan Special Fund
The Japan Special Fund was established in 1988 when ADB, acting as the administrator, entered into a financial arrangement with the Government of Japan, which agreed to make the initial contribution to help ADB’s DMCs restructure their economies and broaden the scope of opportunities for new investments, mainly through TA operations.
Contributed resources. As of 31 December 2011, Japan’s cumulative contribution to the fund since its inception in 1988 amounted to ¥112.9 billion ($973.7 million equivalent), comprising regular contributions of ¥94.8 billion ($822.9 million equivalent) and supplementary contributions of ¥18.1 billion ($150.8 million equivalent). The uncommitted balance, including approved TA that is not yet effective, was $57.4 million as of 31 December 2011.
Operations. There were no new TA projects approved, and one project amounting to $0.7 million was made effective in 2011 (2010: seven TA approvals for $11.7 million; 22 TA made effective for $23.3 million). The balance of undisbursed commitments as of 31 December 2011 was $38.4 million, compared with $72.5 million as of the end of 2010.
Investment position. As of 31 December 2011, total investment portfolio amounted to $93.9 million, lower than the balance of $121.4 million as of 31 December 2010. With the low interest rate environment, revenue from investments decreased from $0.4 million in 2010 to $0.2 million in 2011.
ADB Institute
The ADBI was established in 1996 as a subsidiary body of ADB. The ADBI’s objectives are to identify effective development strategies and capacity improvements for sound development management in DMCs.
Its operating costs are met by the ADBI, which ADB administers in accordance with the Statute of the Institute. In June 2011, the Government of Japan made its 17th contribution amounting to ¥675.1 million ($8.4 million equivalent), and the Government of Australia made its 2nd contribution for A$0.5 million ($0.5 million equivalent). In December 2011, Japan committed its 18th contribution for ¥675.1 million ($8.8 million equivalent), which was reported as due from contributors.
As of 31 December 2011, cumulative contributions committed to the ADBI amounted to ¥20.0 billion and A$1.0 million (about $183.7 million equivalent), excluding translation adjustments. Of the total contributions received, $174.0 million had been used by the end of 2011 mainly for research and capacity building activities, including (i) organizing symposia, forums, and training sessions; (ii) preparing research reports, publications, and websites; and (iii) associated administrative expenses. The balance of net current assets (excluding property, furniture, and equipment) available for future projects and programs was about $9.7 million.
Asian Tsunami Fund
The ATF was established on 11 February 2005 in response to the special circumstances surrounding the DMCs that were stricken by the tsunami on 26 December 2004. The ATF was terminated on 31 December 2010, and all projects were financially completed as of 31 December 2011.
Contributed resources. ADB contributed $600 million to the fund, of which $50 million unutilized funds were transferred back to OCR ($40 million in November 2005 and $10 million in June 2006) and to the Asia Pacific Disaster Response Fund ($40 million in May 2009). In addition, Australia contributed $3.8 million and Luxembourg $1.0 million. As of 31 December 2011, ATF resources

Management’s Discussion and Analysis
33
totaled $587.0 million, $580.1 million of which has been utilized, leaving an uncommitted balance of $6.9 million ($2.6 million as of 31 December 2010).
Operations. There were no undisbursed commitments as of 31 December 2011, compared with $16.5 million, inclusive of grant advances, as of the end of 2010. During the year, a total of $4.6 million was written back (2010: nil).
Investment position. As of 31 December 2011, total investment portfolio amounted to $6.6 million ($19.0 million as of 31 December 2010). With a smaller portfolio and lower yield on time deposits, the ATF generated income of $0.003 million in 2011 (2010: $0.1 million).
Pakistan Earthquake Fund
The PEF was established in November 2005 in response to the special needs of Pakistan following the earthquake on 8 October 2005. The dedicated fund is to deliver emergency grant financing for investment and TA projects to support immediate reconstruction, rehabilitation, and associated development activities. The PEF was terminated on 30 June 2011, but actions necessary to wind up its activities are continuing.
Contributed resources. ADB contributed $80.0 million to the fund. In addition, Australia contributed $15.0 million; Belgium, $14.3 million; Finland, $12.3 million; and Norway, $20.0 million. As of 31 December 2011, PEF resources totaled $146.4 million, of which $141.9 million had been utilized, leaving an uncommitted balance of $4.6 million ($3.9 million as of 31 December 2010).
Operations. No new TA or grants were approved or made effective in 2011 and 2010. The balance of undisbursed commitments inclusive of grant advances as of 31 December 2011 amounted to $16.8 million, compared with $26.9 million as of the end of 2010.
Investment position. As of 31 December 2011, total investment portfolio amounted to $20.8 million ($30.3 million as of 31 December 2010). Because of its smaller portfolio, revenues decreased to $1.0 million in 2011 (2010: $1.3 million).
Regional Cooperation and Integration Fund
The Regional Cooperation and Integration Fund was established in February 2007 in response to the increasing demand for regional cooperation and integration activities among ADB’s member countries in Asia and the Pacific. Its main objective is to improve regional cooperation and integration by facilitating the pooling and provision of additional financial and knowledge resources.
Contributed resources. ADB contributed $40.0 million to the fund as part of the 2006 OCR net income allocation. In May 2010, $10.0 million was transferred to the fund from OCR allocable net income. As of 31 December 2011, the fund’s resources totaled $53.1 million, of which $48.9 million had been utilized, leaving an uncommitted balance of $4.1 million ($10.4 million as of 31 December 2010).
Operations. In 2011, seven TA projects totaling $5.7 million became effective (2010: 13 TA and 1 supplementary approval for $12.0 million), net of $0.3 million (2010: $0.1 million) savings on financially completed TA projects. The balance of undisbursed commitments as of 31 December 2011 amounted to $24.0 million, compared with $29.4 million as of the end of 2010.
Investment position. As of 31 December 2011, total investment portfolio amounted to $26.1 million ($37.4 million as of 31 December 2010). Revenue from investments for 2011 was $0.06 million (2010: $0.1 million), reflecting the low interest rate environment.
Climate Change Fund
The Climate Change Fund was established in April 2008 to facilitate greater investments in DMCs to address the causes and consequences of climate change alongside ADB’s assistance in related sectors.
Contributed resources. ADB provided the initial contribution of $40.0 million in May 2008, as part of OCR’s 2007 net income allocation. In May 2010, $10.0 million was transferred to the fund from OCR allocable net income. As of 31 December 2011, the fund’s resources totaled $51.1 million,

Asian Development Bank Annual Report 2011
34
of which $36.9 million had been utilized, leaving an uncommitted balance of $14.2 million ($19.1 million as of 31 December 2010).
Operations. In 2011, net TA and/or grant expenses totaled $4.6 million, comprising two TAs, two grants, one supplementary TA approval totaling $5.1 million that became effective, and a $0.4 million write back for financially completed and/or cancelled projects (2010: six TA, three grants, and two supplementary TA approvals for a total of $17.2 million). The balance of undisbursed commitments inclusive of grant advances as of 31 December 2011 amounted to $23.7 million, compared with $24.4 million as of the end of 2010.
Investment position. As of 31 December 2011, total investment portfolio amounted to $37.7 million ($43.4 million as of 31 December 2010). With the lower yield from US dollar placements, revenue from investments decreased to $0.08 million in 2011 (2010: $0.1 million).
Asia Pacific Disaster Response Fund
The Asia Pacific Disaster Response Fund was established on 1 April 2009 to provide timely incremental grant resources to DMCs affected by natural disasters.
Contributed resources. In May 2009, $40.0 million was transferred from the ATF as the initial resources of the Asia Pacific Disaster Response Fund. With accumulated income from investment and other sources of $0.2 million, total resources of the fund as of 31 December 2011 amounted to $40.2 million, of which $27.8 million had been utilized, leaving an uncommitted balance of $12.4 million.
Operations. In 2011, five grants totaling $15.0 million became effective (2010: two grants totaling $5.5 million). The balance of undisbursed commitments inclusive of grant advances as of 31 December 2011 amounted to $3.1 million (2010: nil).
Investment position. As of 31 December 2011, total investment portfolio amounted to $11.2 million ($20.1 million as of 31 December 2010). Total revenue from investments for 2011 was $0.03 million (2010: $0.1 million).
GRANT COFINANCING
Trust funds and project-specific grants are key instruments to mobilize and channel financial resources from external sources to finance TA and components of investment projects. They play an important role in complementing ADB’s own resources. Multilateral, bilateral, and private sector partners have contributed more than $4.3 billion in grants to ADB operations (Table 20). In 2011, grant cofinancing for ADB approved projects totaled $1,182.9 million, comprising $211.4 million for 133 TA projects and $971.5 million for components of 27 investment projects.
By the end of 2011, ADB was administering 36 trust funds, comprising 29 stand-alone trust funds9 and 7 trust funds established under financing partnership facilities. Of these, 24 have balances totaling $382.0 million in grants. Additional grant resources from external partners totaled $253.6 million in 2011, comprising $82.6 million in new contributions and $171.0 million in replenishments to existing trust funds.
New contributions totaling $1.3 million were provided to the Fourth High Level Forum on Aid Effectiveness Trust Fund by the governments of Australia, Canada, Finland, France, Germany, Ireland, Luxembourg, the Netherlands, and Switzerland; and the African Development Bank, the Arab Fund, and the Global Fund to Fight Aids, Tuberculosis and Malaria. The Afghanistan Infrastructure Trust Fund received $56.3 million from the government of the United Kingdom and $20.0 million from the
9 Trust funds not related to financing partnership facilities and including the Japan Scholarship Program.

Management’s Discussion and Analysis
35
government of Japan. The government of Switzerland provided $5.0 million for the multi-donor trust fund under the Water Financing Partnership Facility. The following replenishments were also provided:
(i) $22.3 million from the Government of Australia for the multi-donor Clean Energy Fund under the Clean Energy Financing Partnership Facility and the multi-donor trust fund under the Water Financing Partnership Facility;
(ii) $4.0 million from the Government of Austria for the multi-donor trust fund under the Water Financing Partnership Facility and for technical support under the Carbon Market Initiative;
(iii) $76.9 million from the Government of Japan for the Asian Clean Energy Fund under the Clean Energy Financing Partnership Facility, Japan Fund for Poverty Reduction, and Japan Scholarship Program;
(iv) $6.0 million from the Government of the Republic of Korea for the e-Asia and Knowledge Partnership Fund;
(v) $2.1 million from the Government of Luxembourg for the Financial Sector Development Partnership Fund;
(vi) $8.3 million from the Government of Norway for the multi-donor Clean Energy Fund under the Clean Energy Financing Partnership Facility; and
(vii) $7.2 million from the Government of Sweden for the Urban Environmental Infrastructure Fund under the Urban Financing Partnership Facility.
Additional grants were also received from the Climate Investment Fund for $19.4 million and the Global Environment Fund for $24.8 million.
Japan Fund for Poverty Reduction
The Government of Japan established the Japan Fund for Poverty Reduction (JFPR) in May 2000 to provide grants for projects supporting poverty reduction and related social development activities that can add value to projects financed by ADB. In 2011, the JFPR expanded its scope of grant assistance to provide TA grants in addition to project grants. As of the end of 2011, JFPR funds made available totaled about $504.3 million. The Government of Japan had approved 148 JFPR grant projects (equivalent to $374.9 million) and 86 JFPR TA projects (equivalent to $89.8 million). ADB had approved 145 JFPR grant projects (equivalent to $370.5 million) and 74 JFPR TA projects (equivalent to $72.8 million).
Japan Scholarship Program
The Japan Scholarship Program (JSP) was established in 1988 to provide an opportunity for well-qualified citizens of DMCs to undertake postgraduate studies in economics, management, science and technology, and other development-related fields at selected educational institutions in Asia and the Pacific.
The JSP is funded by the Government of Japan and administered by ADB. In 2011, the JSP had 27 participating institutions in 10 countries. Between 1988 and 2011, Japan contributed $125.6 million, and 2,823 scholarships were awarded to recipients from 35 members. Of the total, 2,502 have completed their courses. Women have received 985 scholarships. An average of 150 new scholarships a year have been awarded in the past 10 years.

Asian Development Bank Annual Report 2011
36
Table 20: schedule of contributions and net assets grants from External sourcesAs of 31 December 2011 ($ million)
item contribution net assetsa
administered by aDBCountry
Australia 448.4 131.5 Austria 15.3 4.2 Belgium 49.2 44.7 Brunei Darussalam 5.9 5.6 Cambodia 0.1 0.1 Canada 132.2 11.8 People’s Republic of China 220.1 203.3 Denmark 24.9 3.2 European Community 273.8 22.6 Finland 79.1 41.4 France 35.9 2.7 Germany 0.1 0.1 India 1.0 (0.0)Indonesia 12.6 – Ireland 2.4 0.4 Italy 2.2 – Japanb 971.0 453.9 Republic of Korea 153.5 130.4 Lao People’s Democratic Republic 0.1 0.1 Luxembourg 22.0 17.1 Malaysia 12.6 12.7 Myanmar 0.1 0.1 Netherlands 356.6 40.8 New Zealand 31.7 0.9 Norway 138.2 35.9 Philippines 12.6 6.4 Portugal 12.7 12.0 Singapore 12.6 12.7 Spain 55.8 37.2 Sweden 191.2 61.0 Switzerland 50.1 22.8 Thailand 12.6 12.7 United Kingdom and Northern Ireland 503.6 113.3 United States 3.4 0.3 Viet Nam 1.1 1.1
Subtotal 3,844.7 1,442.8 Others
Cities Alliance 0.5 0.0 Clean Technology Fund 2.9 2.5 Fourth High Level Forum on Aid Effectiveness Trust Fund 0.2 0.2 Future Carbon Fund 35.0 33.8 Global Environment Facility 140.9 12.2 Special Climate Change Fund 0.1 0.0 International Fund for Agricultural Development 22.3 0.0 Islamic Financial Services Board 0.4 0.1 Kreditanstalt für Wiederaufbau (KfW) 0.4 (0.0)Nordic Development Fund 17.7 0.3 Private Sector and Foundations 4.6 0.3 Public Private Infrastructure Advisory Facility 0.6 0.0 Strategic Climate Fund 40.6 34.5 Trust Fund for Forest 16.3 0.5 United Nations Children’s Fund 0.2 – United Nations Development Programme 111.0 0.0
Subtotal 393.5 84.4
not administered by aDBCountry
Switzerland 19.0 – Kuwait 14.0 –
Subtotal 33.0 –
grand total 4,271.3 1,527.2
– = nil, ( ) = negative, ADB = Asian Development Bank.Notes: (i) Numbers may not sum precisely because of rounding. (ii) 0.0 = amount less than $0.05 million.a Excludes projects approved but not yet effective.b Includes Japan Fund for Poverty Reduction, Japan Scholarship Program, Japan Fund for Information and Communication Technology, and Japan Fund for Public Policy Training.

Management’s Discussion and Analysis
37
Appendix: condensed Management Reporting Balance sheets As of 31 December 2011 and 2010 ($ thousand)
2011 2010
item
statutory Reporting
Basis adjustmentsa
Management Reporting
Basis
Management Reporting
Basis
Due from banks 187,989 – 187,989 114,648
Investments and accrued income 21,625,785 – 21,625,785 18,370,852
Securities transferred under repurchase agreement 330,044 – 330,044 707,851
Securities purchased under resale arrangement 395,498 – 395,498 318,228
Loans outstanding and accrued interest 49,910,812 – 49,910,812 46,116,131
Allowance for loan losses and unamortized net loan origination costs 29,871 – 29,871 (10,936)
Equity investments 970,622 (76,907) 893,715 1,048,489
Receivable from swaps
Borrowings 31,373,104 (4,559,486) 26,813,618 26,318,850
Others 6,220,207 (128,900) 6,091,307 1,581,208
Other assets 2,266,123 578,991 2,845,114 2,507,447
tOtaL 113,310,055 (4,186,302) 109,123,753 97,094,640
Borrowings and accrued interest 58,834,767 (941,826) 57,892,941 52,623,262
Payable for swaps
Borrowings 27,465,365 (3,171,613) 24,293,752 22,786,794
Others 6,576,366 (279,230) 6,297,136 1,753,375
Payable for swap related collateral 1,942,954 – 1,942,954 1,588,350
Payable under securities repurchase agreement 330,820 – 330,820 714,490
Accounts payable and other liabilities 1,626,244 – 1,626,244 1,749,535
total Liabilities 96,776,516 (4,392,669) 92,383,847 81,215,806
Paid-in capital 4,657,781 578,991 5,236,772 4,255,678
Net notional maintenance of value receivable (595,806) – (595,806) (419,186)
Ordinary reserve 10,459,995 (887) 10,459,108 10,032,097
Special reserve 245,948 – 245,948 230,226
Loan loss reserve 200,100 – 200,100 246,000
Surplus 1,131,756 – 1,131,756 1,131,756
Cumulative revaluation adjustments account 261,300 (261,300) – –
Net incomeb 593,735 (22,882) 570,853 536,710
Accumulated other comprehensive loss (421,270) (87,555) (508,825) (134,447)
total Equity 16,533,539 206,367 16,739,906 15,878,834
tOtaL 113,310,055 (4,186,302) 109,123,753 97,094,640
– = nil, ( ) = negative.a Includes reversal of ASC 815 and 825 effects, ADB’s share in unrealized gains or losses from equity investments accounted under the equity method, and nonnegotiable, noninterest-bearing
demand obligations on account of subscribed capital.b Net income after appropriation of guarantee fees to the Special Reserve.

Financial Statements

Ordinary Capital Resources
39
Ordinary capital resOurces
MANAGEMENT’S REPORT ON INTERNAL CONTROL OVER FINANCIAL REPORTING
The management of Asian Development Bank (“ADB”) is responsible for establishing and maintaining adequate internal control over financial reporting. ADB’s internal control over financial reporting is a process designed to provide reasonable assurance regarding the reliability of financial reporting and the preparation of financial statements for external purposes in accordance with generally accepted accounting principles in the United States of America.
ADB’s internal control over financial reporting includes those policies and procedures that (i) pertain to the maintenance of records that, in reasonable detail, accurately and fairly reflect the transactions and dispositions of the assets of ADB; (ii) provide reasonable assurance that transactions are recorded as necessary to permit preparation of financial statements in accordance with generally accepted accounting principles in the United States of America, and that receipts and expenditures of ADB are being made only in accordance with authorizations of management and directors of ADB; and (iii) provide reasonable assurance regarding prevention or timely detection of unauthorized acquisition, use, or disposition of ADB’s assets that could have a material effect on the financial statements.
Because of its inherent limitations, internal control over financial reporting may not prevent or detect misstatements. Also, projections of any evaluation of effectiveness to future periods are subject to the risk that controls may become inadequate because of changes in conditions, or that the degree of compliance with the policies or procedures may deteriorate.
ADB’s management assessed the effectiveness of ADB’s internal control over financial reporting as of 31 December 2011. In making this assessment, ADB’s management used the criteria set forth by the Committee of Sponsoring Organizations of the Treadway Commission in Internal Control – Integrated Framework. Based on that assessment, management believes that as of 31 December 2011, ADB’s internal control over financial reporting is effective based upon the criteria established in Internal Control – Integrated Framework.
Haruhiko KurodaPresident
Thierry de LonguemarVice-President (Finance and Administration)
Hiroshi FukukawaOfficer-in-Charge, Controller’s Department
14 March 2012

Asian Development Bank Annual Report 2011
40
Deloitte Touche LLPCertified Public AccountantsUnique Entity No. T08LL0721A6 Shenton Way #32-00DBS Building Tower TwoSingapore 068809
Tel: +65 6224 8288Fax: +65 6538 6166www.deloitte.com/sg
INDEPENDENT AUDITORS’ REPORT
To the Board of Directors and the Board of Governors of Asian Development Bank
We have audited management’s assertion, included in the accompanying Management’s Report on Internal Control over Financial Reporting, that Asian Development Bank (“ADB”) maintained effective internal control over financial reporting as of December 31, 2011, based on the criteria established in Internal Control — Integrated Framework issued by the Committee of Sponsoring Organizations of the Treadway Commission. ADB’s management is responsible for maintaining effective internal control over financial reporting and for its assertion of the effectiveness of internal control over financial reporting, included in the accompanying Management’s Report on Internal Control over Financial Reporting. Our responsibility is to express an opinion on management’s assertion based on our audit.
We conducted our audit in accordance with attestation standards established by the American Institute of Certified Public Accountants. Those standards require that we plan and perform the audit to obtain reasonable assurance about whether effective internal control over financial reporting was maintained in all material respects. Our audit included obtaining an understanding of internal control over financial reporting, assessing the risk that a material weakness exists, and testing and evaluating the design and operating effectiveness of internal control based on the assessed risk. Our audit also included performing such other procedures as we considered necessary in the circumstances. We believe that our audit provides a reasonable basis for our opinion.
ADB’s internal control over financial reporting is a process designed to provide reasonable assurance regarding the reliability of financial reporting and the preparation of financial statements for external purposes in accordance with accounting principles generally accepted in the United States of America. ADB’s internal control over financial reporting includes those policies and procedures that (1) pertain to the maintenance of records that, in reasonable detail, accurately and fairly reflect the transactions and dispositions of the assets of ADB; (2) provide reasonable assurance that transactions are recorded as necessary to permit preparation of financial statements in accordance with accounting principles generally accepted in the United States of America, and that receipts and expenditures of ADB are being made only in accordance with authorizations of management and directors of ADB; and (3) provide reasonable assurance regarding prevention or timely detection of unauthorized acquisition, use, or disposition of ADB’s assets that could have a material effect on the financial statements.
Deloitte Touche LLP (Unique Entity No. T08LL0721A) is an accounting limited liability partnership registered in Singaporeunder the Limited Liability Partnerships Act (Chapter 163A).

Ordinary Capital Resources
41
Because of the inherent limitations of internal control over financial reporting, including the possibility of collusion or improper management override of controls, material misstatements due to error or fraud may not be prevented or detected and corrected on a timely basis. Also, projections of any evaluation of the effectiveness of the internal control over financial reporting to future periods are subject to the risk that the controls may become inadequate because of changes in conditions or that the degree of compliance with the policies or procedures may deteriorate.
In our opinion, management’s assertion that ADB maintained effective internal control over financial reporting as of December 31, 2011, is fairly stated, in all material respects, based on the criteria established in Internal Control — Integrated Framework issued by the Committee of Sponsoring Organizations of the Treadway Commission.
We have also audited, in accordance with auditing standards generally accepted in the United States of America, the accompanying balance sheet of Asian Development Bank (“ADB”) – Ordinary Capital Resources as of December 31, 2011 and 2010 and the related statements of income and expenses, comprehensive income, changes in capital and reserves and cash flows, for each of the years in the two-year period ended December 31, 2011 and our report dated March 14, 2012 expressed an unqualified opinion on those financial statements.
Public Accountants and Certified Public Accountants
SingaporeMarch 14, 2012

Asian Development Bank Annual Report 2011
42
Deloitte Touche LLPCertified Public AccountantsUnique Entity No. T08LL0721A6 Shenton Way #32-00DBS Building Tower TwoSingapore 068809
Tel: +65 6224 8288Fax: +65 6538 6166www.deloitte.com/sg
INDEPENDENT AUDITORS’ REPORT
To the Board of Directors and the Board of Governors of Asian Development Bank
We have audited the accompanying balance sheet of Asian Development Bank (“ADB”) – Ordinary Capital Resources as of December 31, 2011 and 2010 and the related statements of income and expenses, comprehensive income, changes in capital and reserves and cash flows, for each of the years in the two-year period ended December 31, 2011. These financial statements are the responsibility of ADB’s management. Our responsibility is to express an opinion on these financial statements based on our audits.
We conducted our audits in accordance with auditing standards generally accepted in the United States of America. Those standards require that we plan and perform the audit to obtain reasonable assurance about whether the financial statements are free of material misstatement. An audit includes examining, on a test basis, evidence supporting the amounts and disclosures in the financial statements, assessing the accounting principles used and significant estimates made by management, as well as evaluating the overall financial statement presentation. We believe that our audits provide a reasonable basis for our opinion.
In our opinion, such financial statements present fairly, in all material respects, the financial position of ADB – Ordinary Capital Resources as of December 31, 2011 and 2010, and the results of its operations and its cash flows for each of the years in the two-year period ended December 31, 2011 in conformity with accounting principles generally accepted in the United States of America.
Our audits were conducted for the purpose of forming an opinion on the basic 2011 and 2010 financial statements taken as a whole. The summary statement of loans and summary statement of borrowings as of December 31, 2011 and 2010, and statement of subscriptions to capital stock and voting power as of December 31, 2011, are presented for the purpose of additional analysis and are not a required part of the basic financial statements. These schedules are the responsibility of ADB’s management. Such 2011 and 2010 schedules have been subjected to the auditing procedures applied in our audit of the basic financial statements and, in our opinion are fairly stated in all material respects when considered in relation to the basic financial statements taken as a whole.
Deloitte Touche LLP (Unique Entity No. T08LL0721A) is an accounting limited liability partnership registered in Singaporeunder the Limited Liability Partnerships Act (Chapter 163A).

Ordinary Capital Resources
43
We have also audited, in accordance with attestation standards established by the American Institute of Certified Public Accountants, management’s assertion that ADB maintained effective internal control over financial reporting as of December 31, 2011, based on the criteria established in Internal Control — Integrated Framework issued by the Committee of Sponsoring Organizations of the Treadway Commission and our report dated March 14, 2012 expressed an unqualified opinion on management’s assertion that ADB maintained effective internal control over financial reporting.
Public Accountants and Certified Public Accountants
SingaporeMarch 14, 2012

Asian Development Bank Annual Report 2011
44
asian DEVELOpMEnt BanK—ORDinaRy capitaL REsOURcEs
BALANCE SHEET31 December 2011 and 2010 Expressed in thousands of United states Dollars
a s s E t s
2011 2010
DUE FROM BANKS (Note C) $ 187,989 $ 114,648
INVESTMENTS (Notes C, D, L, and P)
Government or government-guaranteed obligations $19,156,304 $13,842,500
Time deposits 1,151,963 2,285,773
Other securities 1,200,002 21,508,269 2,125,086 18,253,359
SECURITIES TRANSFERRED UNDER REPURCHASE AGREEMENT (Note P) 330,044 707,851
SECURITIES PURCHASED UNDER RESALE ARRANGEMENT (Note P) 395,498 318,228
LOANS OUTSTANDING (OCR-6) (Notes A, E, and P) (Including ASC 815 adjustment of nil – 2011 and $278 – 2010; net unamortized loan origination costs of $64,901 – 2011 and $53,441 – 2010)
Sovereign 47,052,649 43,634,265
Nonsovereign 2,741,641 2,352,051
49,794,290 45,986,316
Less—allowance for loan losses 35,030 49,759,260 42,505 45,943,811
EQUITY INVESTMENTS (Notes A, G, and P) 970,622 1,108,198
ACCRUED INTEREST RECEIVABLE
Investments 117,516 117,493
Loans 181,423 298,939 183,534 301,027
RECEIVABLE FROM SWAPS (Notes H and P)
Borrowings 31,373,104 29,475,685
Others 6,220,207 37,593,311 1,781,058 31,256,743
OTHER ASSETS
Property, furniture, and equipment (Note I) 161,451 161,177
Investment related receivables (Note D) 2,428 272,544
Swap related collateral (Note H) 1,942,954 1,588,350
Miscellaneous (Note N) 159,290 2,266,123 144,246 2,166,317
tOtaL $113,310,055 $100,170,182
The accompanying notes are an integral part of these financial statements (OCR-9).

OcR-1
cOntinUED
Ordinary Capital Resources
45
LiaBiLitiEs, capitaL, anD REsERVEs
2011 2010
BORROWINGS (OCR-7) (Notes H, J, and P)
At amortized cost $ 4,240,356 $ 3,771,063
At fair value 54,037,988 $ 58,278,344 48,075,055 $ 51,846,118
ACCRUED INTEREST ON BORROWINGS 556,423 540,366
PAYABLE FOR SWAPS (Notes H, J, and P)
Borrowings 27,465,365 25,775,013
Others 6,576,366 34,041,731 2,077,841 27,852,854
PAYABLE UNDER SECURITIES REPURCHASE AGREEMENT 330,820 714,490
ACCOUNTS PAYABLE AND OTHER LIABILITIES
Investment related payables (Note D) 2,321 411,988
Payable for swap related collateral (Note H) 1,942,954 1,588,350
Undisbursed technical assistance commitments (Note M) – 1,347
Accrued pension and postretirement medical benefit costs (Note O) 1,472,179 1,168,252
Miscellaneous (Notes F, I, and N) 151,744 3,569,198 167,948 3,337,885
TOTAL LIABILITIES 96,776,516 84,291,713
CAPITAL AND RESERVES (OCR-4)
Capital stock (OCR-8) (Note K)
Authorized
(SDR106,389,330,000 – 2011 and 2010)
Subscribed
(SDR105,835,800,000 – 2011; SDR93,472,010,000 – 2010) 162,486,521 143,949,700
Less—“callable” shares subscribed 154,335,557 136,535,071
“Paid-in” shares subscribed 8,150,964 7,414,629
Less—subscription installments not due 2,828,710 3,084,711
Subscription installments matured 5,322,254 4,329,918
Less—capital transferred to the Asian Development Fund and discount 85,482 74,240
5,236,772 4,255,678
Nonnegotiable, noninterest-bearing demand obligations on account of subscribed capital (Note K) (578,991) (341,130)
4,657,781 3,914,548
Net notional amounts required to maintain value of currency holdings (Note K) (595,806) (419,186)
Ordinary reserve (Note L) 10,459,995 10,030,460
Special reserve (Note L) 245,948 230,226
Loan loss reserve (Note L) 200,100 246,000
Surplus (Note L) 1,131,756 1,131,756
Cumulative revaluation adjustments account (Note L) 261,300 183,521
Net income after appropriation (OCR-4) (Note L) 593,735 614,489
Accumulated other comprehensive loss (Note L) (421,270) 16,533,539 (53,345) 15,878,469
tOtaL $113,310,055 $100,170,182

Asian Development Bank Annual Report 2011
46
OcR-2
asian DEVELOpMEnt BanK—ORDinaRy capitaL REsOURcEs
STATEMENT OF INCOME AND EXPENSESFor the Years Ended 31 December 2011 and 2010 Expressed in thousands of United states Dollars
2011 2010
REVENUE (Note M)
From loans (Note E)
Interest $664,313 $688,006
Commitment charge 50,814 58,151
Other (65,528) $649,599 (65,678) $680,479
From investments (Note D)
Interest 365,263 367,499
From guarantees (Note F) 15,722 11,322
From equity investments 44,030 58,425
From other sources—net (Notes E and Q) 20,439 24,160
TOTAL REVENUE $1,095,053 $1,141,885
EXPENSES (Note M)
Borrowings and related expenses (Note J) (Including amortization of derivative transition adjustments reclassified from other comprehensive income of nil – 2011 and $1,620 – 2010) 367,916 386,048
Administrative expenses (Note M) (Including amortization of estimated actuarial losses and prior service costs reclassified from other comprehensive income of $46,092 – 2011 and $15,823 – 2010) 315,945 294,251
Write back (Note E) (7,395) (44,713)
Other expenses 4,938 3,544
TOTAL EXPENSES 681,404 639,130
NET REALIZED GAINS (LOSSES)
From investments (Note D) (Including gains reclassified from other comprehensive income of $59,935 – 2011 and $20,237 – 2010) 84,306 33,805
From equity investments (Note M) (Including gains reclassified from other comprehensive income of $110,845 – 2011 and $7,493 – 2010) 120,614 48,080
From borrowings 5,497 1,444
Others (Note D) (Including gains reclassified from other comprehensive income of $935 – 2011 and nil – 2010) (20,292) (3,011)
NET REALIZED GAINS 190,125 80,318
NET UNREALIZED GAINS (Note M) 5,683 42,738
nEt incOME $ 609,457 $ 625,811
The accompanying notes are an integral part of these financial statements (OCR-9).

Ordinary Capital Resources
47
OcR-3
asian DEVELOpMEnt BanK—ORDinaRy capitaL REsOURcEs
STATEMENT OF COMPREHENSIVE INCOMEFor the Years Ended 31 December 2011 and 2010 Expressed in thousands of United states Dollars
2011 2010
NET INCOME (OCR-2) $ 609,457 $ 625,811
Other comprehensive loss (Note M)
Reclassification to net income:
Amortization of derivatives transition adjustment – 1,620
Defined benefit plans
Net actuarial loss during the period (307,697) (290,714)
Amortization of net actuarial losses 45,127 20,390
Amortization of prior service cost 965 (4,567)
Currency translation adjustments 18,358 118,980
Unrealized investment holding (losses) gains
Unrealized investment holding gains during the period 47,037 86,426
Less: Reclassification adjustments for gains included in net income (171,715) (27,797)
Total other comprehensive loss (367,925) (95,662)
cOMpREhEnsiVE incOME $241,532 $530,149
The accompanying notes are an integral part of these financial statements (OCR-9).

Asian Development Bank Annual Report 2011
48
asian DEVELOpMEnt BanK—ORDinaRy capitaL REsOURcEs
STATEMENT OF CHANGES IN CAPITAL AND RESERVES For the Years Ended 31 December 2011 and 2010 Expressed in thousands of United states Dollars (note K)
capital stock
nonnegotiable, noninterest-
bearing Demand Obligations
net notionalMaintenance
of ValueOrdinary Reserve
special Reserve
Loan Loss Reserve surplus
cumulative Revaluation adjustments
account
net income after
appropriations
accumulatedOther
comprehensiveLoss total
Balance, 1 January 2010 $3,818,297 $(142,181) $(523,220) $ 9,789,807 $218,903 $493,162 $ 884,594 $631,129 $ (36,725) $ 42,317 $15,176,083
Comprehensive income (loss) for the year 2010 (OCR-3) (Note L) 625,811 (95,662) 530,149
Appropriation of guarantee fees to Special Reserve (Note L) 11,322 (11,322) –
Change in SDR value of paid-in shares subscribed 51,871 51,871
Change in subscription installments not due (2,248,259) (2,248,259)
Additional paid-in shares subscribed during the year 2,632,723 2,632,723
Change in SDR value of capital transferred to Asian Development Fund 1,046 1,046
Change in notional maintenance of value (Note K) 104,034 104,034
Demand obligations on account of subscription received during the year (189,276) (189,276)
Encashment of demand obligations during the year 14,235 14,235
Change in US Dollar value of demand obligations (23,908) (23,908)
Allocation of prior year income to ordinary reserve, loan loss reserve, surplus and transfer from cumulative revaluation account (Note L) 230,882 (247,162) 247,162 (447,607) 216,725 –
Allocation of prior year income to ADF, TASF, RCIF, and CCF (Note L) (180,000) (180,000)
Charge to ordinary reserve for change in SDR value of capital stock (Note L) 9,771 9,771
Balance, 31 December 2010 $4,255,678 $(341,130) $(419,186) $10,030,460 $230,226 $246,000 $1,131,756 $183,521 $614,489 $(53,345) $15,878,469
Note: Numbers may not sum precisely because of rounding.The accompanying notes are an integral part of these financial statements (OCR-9).

OcR-4
cOntinUED
Ordinary Capital Resources
49
capital stock
nonnegotiable, noninterest-
bearing Demand Obligations
net notionalMaintenance
of ValueOrdinary Reserve
special Reserve
Loan Loss Reserve surplus
cumulative Revaluation adjustments
account
net income after
appropriations
accumulatedOther
comprehensiveLoss total
Balance, 31 December 2010 $4,255,678 $(341,130) $(419,186) $10,030,460 $230,226 $246,000 $1,131,756 $183,521 $614,489 $ (53,345) $15,878,469
Comprehensive income (loss) for the year 2011 (OCR-3) (Note L) 609,457 (367,925) 241,532
Appropriation of guarantee fees to Special Reserve (Note L) 15,722 (15,722) –
Change in SDR value of paid-in shares subscribed 202,085 202,085
Change in subscription installments not due 193,663 193,663
Additional paid-in shares subscribed during the year 585,119 585,119
Change in SDR value of capital transferred to Asian Development Fund 227 227
Change in notional maintenance of value (Note K) (176,620) (176,620)
Demand obligations on account of subscription received during the year (263,627) (263,627)
Encashment of demand obligations during the year 18,171 18,171
Change in US Dollar value of demand obligations 7,595 7,595
Allocation of prior year income to ordinary reserve, loan loss reserve, surplus and transfer from cumulative revaluation account (Note L) 422,610 (45,900) – 77,779 (454,489) –
Allocation of prior year income to ADF and TASF (Note L) (160,000) (160,000)
Charge to ordinary reserve for change in SDR value of capital stock (Note L) 6,925 6,925
Balance, 31 December 2011 $5,236,772 $(578,991) $(595,806) $10,459,995 $245,948 $200,100 $1,131,756 $261,300 $593,735 $(421,270) $16,533,539

OcR-5
asian DEVELOpMEnt BanK—ORDinaRy capitaL REsOURcEs
STATEMENT OF CASH FLOWSFor the Years Ended 31 December 2011 and 2010 Expressed in thousands of United states Dollars
Asian Development Bank Annual Report 2011
50
2011 2010
CASH FLOWS FROM OPERATING ACTIVITIESInterest and other charges on loans received $ 563,092 $ 669,427 Interest on investments received 400,085 387,861 Interest paid for securities purchased under resale/repurchase arrangement (1,342) (2,293)Interest and other financial expenses paid (326,928) (299,183)Administrative expenses paid (260,447) (258,601)Others—net 42,431 24,561
Net Cash Provided by Operating Activities 416,891 521,772
CASH FLOWS FROM INVESTING ACTIVITIESSales of investments 4,941,371 5,202,164 Maturities of investments 164,772,539 100,204,828 Purchases of investments (173,155,127) (109,885,121)Net payments on future contracts (556) (398)Net (payments for) receipts from securities purchased under resale arrangement (75,511) 7,692 Principal collected on loans 2,779,465 2,305,080 Loans disbursed (6,285,444) (5,892,748)Receipts from swaps 89,928 323,017 Payments for swaps (238,033) (554,862)Property, furniture, and equipment acquired (19,217) (19,791)Change in swap related collateral 354,568 853,300 Purchases of equity investments (76,664) (183,039)Sales of equity investments 207,424 109,970
Net Cash Used in Investing Activities (6,705,257) (7,529,908)
CASH FLOWS FROM FINANCING ACTIVITIESProceeds from new borrowings 13,908,636 14,465,398 Borrowings redeemed (8,247,534) (7,489,554)Matured capital subscriptions collected1 496,027 222,385 Issuance expenses paid (31,800) (37,871)Demand obligations of members encashed 18,171 14,235 Receipts from swaps 382,937 95,557 Payments for swaps – (106,570)Resources transferred to ADF (120,000) (120,000)Resources transferred to TASF (40,000) (40,000)Resources transferred to RCIF – (10,000)Resources transferred to CCF – (10,000)
Net Cash Provided by Financing Activities 6,366,437 6,983,580 Effect of Exchange Rate Changes on Due from Banks (4,730) 9,361 Net Increase (Decrease) in Due from Banks 73,341 (15,195)Due from Banks at Beginning of Year 114,648 129,843 Due from Banks at End of Year $ 187,989 $ 114,648
RECONCILIATION OF NET INCOME TO NET CASH PROVIDED BY OPERATING ACTIVITIES:Net Income (OCR-2) $ 609,457 $ 625,811 Adjustments to reconcile net income to net cash provided by operating activities:2
Depreciation and amortization 90,655 135,878 Write back—net (7,395) (44,713)Net realized gains from investments, equity investments, and other borrowings (212,527) (90,919)Proportionate share in earnings on equity investments (28,989) (39,868)Net unrealized gains (5,683) (55,105)Change in accrued revenue from loans, investments, and other swaps (84,538) (12,368)Change in receivable from ADF – allocation of administrative expenses (12,798) 14,534 Change in accrued interest on borrowings and swaps, and other expenses 307,446 274,511 Change in pension and postretirement benefit liability (261,605) (274,891)Others—net 22,868 (11,098)
Net Cash Provided by Operating Activities $ 416,891 $ 521,772
Supplementary disclosure of noncash financing activities:1 Nonnegotiable, noninterest-bearing demand promissory notes amounting to $261,336 ($191,509 – 2010) were received from members.2 Includes securities received from restructuring (nil – 2011; $47,483 – 2010).The accompanying notes are an integral part of these financial statements (OCR-9).
50

OcR-6
asian DEVELOpMEnt BanK—ORDinaRy capitaL REsOURcEs
SUMMARY STATEMENT OF LOANS31 December 2011 and 2010 Expressed in thousands of United states Dollars
Ordinary Capital Resources
5151
Borrowers/guarantorsLoans
Outstanding1
Undisbursed Balances of Effective Loans2
Loans not yet Effective3
totalLoans
percent oftotal Loans
Afghanistan $ 42,941 $ – $ – $ 42,941 0.05 Armenia 69,204 185,796 20,000 275,000 0.35 Azerbaijan 242,288 323,191 500,000 1,065,479 1.36 Bangladesh 1,455,030 716,630 1,019,000 3,190,660 4.09 Bhutan 44,177 6,823 – 51,000 0.06 Cambodia 4,025 – – 4,025 0.01 People’s Republic of China 12,147,533 4,590,346 1,622,137 18,360,016 23.51 Cook Islands 15,604 3,026 4,700 23,330 0.03 Fiji 124,209 48,583 – 172,792 0.22 Georgia 150,178 – 160,000 310,178 0.40 India 10,516,894 4,444,264 2,540,540 17,501,698 22.42 Indonesia 10,011,508 507,383 480,000 10,998,891 14.09 Kazakhstan 1,005,030 440,389 378,000 1,823,419 2.34 Republic of Korea 32,356 – – 32,356 0.04 Lao People’s Democratic Republic 61,240 – 448,200 509,440 0.65 Malaysia 131,168 – – 131,168 0.17 Maldives 6,137 – – 6,137 0.01 Marshall Islands 2,060 – – 2,060 0.00 Federated States of Micronesia 2,246 2,546 – 4,792 0.01 Mongolia 4,611 – – 4,611 0.01 Nauru 558 – – 558 0.00 Nepal 1,100 – – 1,100 0.00 Pakistan 5,491,202 1,909,536 377,040 7,777,778 9.96 Palau 6,400 6,200 – 12,600 0.02 Papua New Guinea 165,077 93,618 165,900 424,595 0.54 Philippines 4,928,453 529,688 362,000 5,820,141 7.45 Sri Lanka 723,031 765,850 85,000 1,573,881 2.02 Thailand 337,469 420,026 – 757,495 0.97 Turkmenistan – 125,000 – 125,000 0.16 Uzbekistan 569,744 756,988 680,000 2,006,732 2.57 Viet Nam 1,399,260 2,588,099 1,031,390 5,018,749 6.43
49,690,733 18,463,982 9,873,907 78,028,622 99.94 Regional 38,657 12,000 – 50,657 0.06
TOTAL – 31 December 2011 49,729,390 18,475,982 9,873,907 78,079,279 100.00 Allowance for loan losses (35,030) – – (35,030)Unamortized loan origination cost—net 64,900 – – 64,900
nEt BaLancE – 31 December 2011 $49,759,260 $18,475,982 $ 9,873,907 $78,109,149 Made up of:
Sovereign Loans $ 47,052,649 $ 18,059,010 $ 7,729,810 $ 72,841,469 Nonsovereign Loans
Private Sector 2,485,257 386,972 1,509,797 4,382,026 Public Sector 221,354 30,000 634,300 885,654
Net Balance – 31 December 2011 $ 49,759,260 $ 18,475,982 $ 9,873,907 $ 78,109,149
TOTAL – 31 December 2010 $ 45,932,875 $15,827,624 $ 8,749,419 $ 70,509,918 Allowance for loan losses (42,505) – – (42,505)Unamortized loan origination cost—net 53,441 – – 53,441
nEt BaLancE – 31 December 2010 $45,943,811 $15,827,624 $8,749,419 $70,520,854 Made up of:
Sovereign Loans $ 43,634,265 $ 15,260,098 $ 7,642,108 $ 66,536,471 Nonsovereign Loans
Private Sector 2,141,113 452,956 973,011 3,567,080 Public Sector 168,433 114,570 134,300 417,303
Net Balance – 31 December 2010 $ 45,943,811 $ 15,827,624 $ 8,749,419 $ 70,520,854
1 Amounts outstanding on the multicurrency fixed lending rate loans totaled $11,488 ($18,378 – 2010), on pool-based loans totaled $7,108,319 ($8,249,314 – 2010) and on LIBOR-based loans and market-based loans totaled $42,609,582 ($37,665,183 – 2010). The average yield on loans was 1.34% (1.61% – 2010).
2 Refer to the unwithdrawn portions of effective loans as of 31 December 2011. Of the undisbursed balances, ADB has made irrevocable commitments to disburse various amounts totaling $546,656 ($331,488 – 2010).
3 Refer to approved loans that have not become effective as of 31 December 2011, pending borrowers’ compliance with effectiveness conditions specified in the loan regulations and the loan agreements.

Asian Development Bank Annual Report 2011
52
MatURity OF EFFEctiVE LOans
twelve Months Ending
31 December amount
Five years Ending
31 December amount
2012 $3,293,234 2021 17,670,512
2013 4,736,726 2026 13,733,449
2014 4,612,439 2031 10,953,335
2015 3,624,451 2036 5,026,281
2016 3,954,839 over 2036 600,106
total $68,205,3724
sUMMaRy OF cURREnciEs REcEiVaBLE On LOans OUtstanDing
currency 2011 2010 currency 2011 2010
Chinese yuan $ 266,350 $ 245,576 Pakistan rupee 177 186
Euro 41,469 – Philippine peso 67,254 85,719
Japanese yen 4,512,468 4,933,225 Swiss franc 1,697 2,429
Indian rupee 171,552 229,696 Thailand baht 181,924 31,692
Indonesian rupiah 37,466 37,862 United States dollar 44,291,447 40,350,211
Kazakhstan tenge 157,586 16,279
total $49,729,390 $45,932,875
OcR-6
cOntinUED
4 Includes undisbursed commitment relating to Revolving Credit Facility of Trade Finance Facilitation Program amounting to $12,000.The accompanying notes are an integral part of these financial statements (OCR-9).

OcR-7
asian DEVELOpMEnt BanK—ORDinaRy capitaL REsOURcEs
SUMMARY STATEMENT OF BORROWINGS31 December 2011 and 2010 Expressed in thousands of United states Dollars
Ordinary Capital Resources
53
Borrowings swap arrangements2
weightedaverage cost (%)
after swaps
principal Outstanding1 payable (Receivable)3 net currency Obligation3
2011 2010 2011 2010 2011 2010
Australian dollar $ 9,824,319 $ 7,924,666 $ (9,978,489) $ (7,989,734) $ (154,170) $ (65,068)Brazilian real 1,206,052 1,014,970 (1,190,701) (1,021,235) 15,351 (6,265)Canadian dollar 1,725,049 1,655,931 (1,801,090) (1,702,408) (76,041) (46,477)Chinese yuan 520,666 433,424 65,715 112,825 514,725 469,094
(71,656) (77,155)Euro – 13,358 – (13,420) – (62)Hong Kong dollar 193,501 200,488 (195,056) (201,745) (1,555) (1,257)Indian rupee 89,792 106,264 17,844 24,895 95,882 112,344
(11,754) (18,815)Japanese yen 3,725,949 3,781,235 3,592,462 4,110,480 3,928,177 4,535,568
(3,390,234) (3,356,147)Kazakhstan tenge 8,081 16,279 – – 8,081 16,279 Malaysian ringgit 174,927 336,301 (178,895) (337,699) (3,968) (1,398)Mexican peso 42,066 125,842 (42,427) (126,934) (361) (1,092)New Zealand dollar 374,780 259,503 (378,702) (263,485) (3,922) (3,982)Norwegian krone 259,744 – (262,664) – (2,920) – Philippine peso 115,210 119,604 – – (569) 4
(115,779) (119,600)Pound sterling 1,016,034 388,590 (1,012,810) (402,544) 3,224 (13,954)Singapore dollar 193,539 437,883 (195,995) (441,952) (2,456) (4,069)South African rand 2,683,858 3,136,651 (2,701,508) (3,169,932) (17,650) (33,281)Swiss franc 960,481 912,517 (565,826) (521,672) 394,655 390,845 Thai baht 36,663 225,418 (36,861) (228,396) (198) (2,978)Turkish lira 1,743,444 2,496,494 (1,759,092) (2,525,698) (15,648) (29,204)United States dollar 33,363,106 28,236,450 23,789,344 21,526,813 49,668,885 42,806,149 (7,483,565) (6,957,114)
Subtotal 58,257,261 51,821,868 $(3,907,739) $(3,700,672) $54,349,522 $48,121,196 0.69
Unamortized discounts/ premiums and transition adjustments 21,083 24,250 Accumulated translation adjustments 0.49 ASC 815 Adjustments (0.05)
total $58,278,3444 $51,846,118 1.13
1 Reported at Fair Value upon adoption of ASC 820/825 effective 1 January 2008, except for unswapped borrowings which are reported at net of principal amount and unamortized discount/premium of zero coupon bonds. The aggregate face amounts and discounted values of zero coupon and deep discount borrowings (in United States dollar equivalents) are:
aggregate Face amount Discounted Value
currency 2011 2010 2011 2010
Australian dollar $1,793,937 $1,555,452 $1,591,483 $1,366,146 Brazilian real 214,941 75,000 174,646 49,330 Canadian dollar 783,392 800,000 745,089 730,938 South African rand 1,308,981 1,276,835 1,061,010 980,939 Swiss franc 521,544 522,883 422,665 402,584 Turkish lira 1,241,471 1,998,714 967,142 1,563,670 United States dollar 4,079,042 2,887,736 2,947,003 2,273,842
2 Include currency and interest rate swaps. At 31 December 2011, the remaining maturity of swap agreements ranged from less than one year to 25 years. Approximately 79.16% of the swap receivables and 82.28% of the payables are due before 1 January 2017.
3 Adjusted by the cumulative effect of the adoption of ASC 815 effective 1 January 2001. 4 Excludes accrued interest and commission.

Asian Development Bank Annual Report 2011
54
MatURity stRUctURE OF BORROwings OUtstanDing5
twelve Months Ending
31 December amount
Five yearsEnding
31 December amount
2012 $10,626,473 2021 8,123,926
2013 8,597,904 2026 305,619
2014 11,135,267 2031 2,864,090
2015 8,024,622 2036 46,646
2016 8,553,797 over 2036 –
total $58,278,344
intEREst RatE swap aRRangEMEnts
average Rate (%)
notionalamount Receive
pay Maturingthrough7Floating6
Receive Fixed swaps:
Australian dollar8 $ 65,020 2.64 (0.03) 2027–2032
Chinese yuan 308,016 3.34 4.47 2015–2020
Indian rupee 94,153 5.40 7.83 2014
United States dollar 27,524,960 2.58 0.50 2012–2041
United States dollar9 65,020 2.14 (0.06) 2016–2027
Receive Floating swaps:
Japanese yen 65,020 3.22 (0.06) 2016–2032
United States dollar 771,000 0.87 0.60 2012–2020
total $28,893,189
5 Bonds with put and call options were considered maturing on the first put or call date. 6 Represents average current floating rates, net of spread. 7 Swaps with early termination date were considered maturing on the first termination date. 8 Consists of dual currency swaps with interest receivable in Australian dollar and interest payable in Japanese yen.9 Consists of dual currency swaps with interest receivable in United States dollar and interest payable in Japanese yen.The accompanying notes are an integral part of these financial statements (OCR-9).
OcR-7
cOntinUED

OcR-8
asian DEVELOpMEnt BanK—ORDinaRy capitaL REsOURcEs
STATEMENT OF SUBSCRIPTIONS TO CAPITAL STOCK AND VOTING POWER31 December 2011 Expressed in thousands of United states Dollars
Ordinary Capital Resources
55
sUBscRiBED capitaL VOting pOwER
number of shares
percentof total
par Value of shares number of Votes
percentof totalMEMBERs total callable paid-in
REgiOnaL Afghanistan 3,585 0.03 $ 55,039 $ 47,701 $ 7,339 43,075 0.33 Armenia 31,671 0.30 486,235 461,871 24,365 71,161 0.54 Australia 614,220 5.80 9,429,935 8,958,347 471,589 653,710 4.94 Azerbaijan 47,208 0.45 724,770 688,446 36,324 86,698 0.66 Bangladesh 108,384 1.02 1,663,987 1,580,775 83,212 147,874 1.12 Bhutan 660 0.01 10,133 9,503 629 40,150 0.30 Brunei Darussalam 37,386 0.35 573,976 545,220 28,756 76,876 0.58 Cambodia 5,250 0.05 80,602 73,877 6,724 44,740 0.34 People’s Republic of China 684,000 6.46 10,501,247 9,976,016 525,231 723,490 5.47 Cook Islands 282 0.003 4,329 4,115 215 39,772 0.30 Fiji 7,218 0.07 110,816 105,273 5,542 46,708 0.35 Georgia 36,243 0.34 556,428 528,563 27,865 75,733 0.57 Hong Kong, China 57,810 0.55 887,540 843,140 44,400 97,300 0.74 India 672,030 6.35 10,317,475 9,801,501 515,974 711,520 5.38 Indonesia 547,268 5.17 8,402,041 7,977,129 424,912 586,758 4.44 Japan 1,656,630 15.65 25,433,743 24,161,788 1,271,956 1,696,120 12.82 Kazakhstan 85,608 0.81 1,314,314 1,248,574 65,740 125,098 0.95 Kiribati 426 0.004 6,540 6,218 322 39,916 0.30 Republic of Korea 534,738 5.05 8,209,672 7,799,126 410,547 574,228 4.34 Kyrgyz Republic 31,746 0.30 487,387 463,007 24,380 71,236 0.54 Lao People’s Democratic Republic 1,476 0.01 22,661 21,248 1,412 40,966 0.31 Malaysia 289,050 2.73 4,437,698 4,215,759 221,939 328,540 2.48 Maldives 426 0.004 6,540 6,218 322 39,916 0.30 Marshall Islands 282 0.003 4,329 4,115 215 39,772 0.30 Federated States of Micronesia 426 0.004 6,540 6,218 322 39,916 0.30 Mongolia 1,596 0.02 24,503 23,275 1,228 41,086 0.31 Myanmar 57,810 0.55 887,540 843,140 44,400 97,300 0.74 Nauru 426 0.004 6,540 6,218 322 39,916 0.30 Nepal 15,606 0.15 239,594 227,604 11,990 55,096 0.42 New Zealand 163,020 1.54 2,502,797 2,377,642 125,155 202,510 1.53 Pakistan 231,240 2.19 3,550,158 3,372,620 177,539 270,730 2.05 Palau 342 0.003 5,251 4,990 261 39,832 0.30 Papua New Guinea 9,960 0.09 152,913 145,283 7,630 49,450 0.37 Philippines 252,912 2.39 3,882,882 3,688,716 194,166 292,402 2.21 Samoa 348 0.003 5,343 5,020 322 39,838 0.30 Singapore 36,120 0.34 554,540 526,813 27,727 75,610 0.57 Solomon Islands 708 0.01 10,870 10,332 537 40,198 0.30 Sri Lanka 61,560 0.58 945,112 897,841 47,271 101,050 0.76 Taipei,China 115,620 1.09 1,775,079 1,686,325 88,754 155,110 1.17 Tajikistan 30,402 0.29 466,753 443,355 23,398 69,892 0.53 Thailand 144,522 1.37 2,218,803 2,107,834 110,969 184,012 1.39 Timor-Leste 1,050 0.01 16,120 15,307 814 40,540 0.31 Tonga 426 0.004 6,540 6,218 322 39,916 0.30 Turkmenistan 26,874 0.25 412,588 391,908 20,680 66,364 0.50 Tuvalu 150 0.001 2,303 2,180 123 39,640 0.30 Uzbekistan 71,502 0.68 1,097,749 1,042,848 54,901 110,992 0.84 Vanuatu 708 0.01 10,870 10,332 537 40,198 0.30 Viet Nam 36,228 0.34 556,198 520,103 36,094 75,718 0.57
total Regional (Forward) 6,713,153 63.43 103,065,024 97,889,649 5,175,376 8,608,673 65.07

Asian Development Bank Annual Report 2011
56
sUBscRiBED capitaL VOting pOwER
number of shares
percentof total
par Value of sharesnumber of Votes
percentof totalMEMBERs total callable paid-in
total Regional (Forward) 6,713,153 63.43 103,065,024 97,889,649 5,175,376 8,608,673 65.07
nOnREgiOnaL Austria 36,120 0.34 554,540 526,813 27,727 75,610 0.57 Belgium 36,120 0.34 554,540 526,813 27,727 75,610 0.57 Canada 555,258 5.25 8,524,709 8,098,396 426,314 594,748 4.50 Denmark 36,120 0.34 554,540 526,813 27,727 75,610 0.57 Finland 36,120 0.34 554,540 526,813 27,727 75,610 0.57 France 247,068 2.33 3,793,161 3,603,463 189,698 286,558 2.17 Germany 459,204 4.34 7,050,021 6,697,446 352,575 498,694 3.77 Ireland 36,120 0.34 554,540 526,751 27,788 75,610 0.57 Italy 191,850 1.81 2,945,415 2,798,106 147,309 231,340 1.75 Luxembourg 36,120 0.34 554,540 526,751 27,788 75,610 0.57 Netherlands 108,882 1.03 1,671,633 1,588,037 83,595 148,372 1.12 Norway 36,120 0.34 554,540 526,813 27,727 75,610 0.57 Portugal 12,040 0.11 184,847 171,843 13,004 51,530 0.39 Spain 36,120 0.34 554,540 526,813 27,727 75,610 0.57 Sweden 36,120 0.34 554,540 526,813 27,727 75,610 0.57 Switzerland 61,950 0.59 951,100 903,522 47,578 101,440 0.77 Turkey 36,120 0.34 554,540 526,813 27,727 75,610 0.57 United Kingdom 216,786 2.05 3,328,250 3,161,812 166,439 256,276 1.94 United States 1,656,189 15.65 25,426,966 24,155,281 1,271,685 1,695,679 12.82
total nonregional 3,870,427 36.57 59,421,498 56,445,909 2,975,589 4,620,737 34.93
tOtaL 10,583,580 100.00 $162,486,521 $154,335,557 $8,150,964 13,229,410 100.00
Note: Numbers may not sum precisely because of rounding. 1 The authorized capital stock of the ADB has a par value of $10,000 in terms of US dollars of the weight and fineness in effect on 31 January 1966. Pending ADB’s selection of the appropriate successor to the 1966 dollar, the par value of each share is SDR10,000 for financial reporting purposes. Exchange rate at 31 December 2011 was $1.53527. (Notes B and K)The accompanying notes are an integral part of these financial statements (OCR-9).
OcR-8
cOntinUED

Ordinary Capital Resources
57
asian DEVELOpMEnt BanK—ORDinaRy capitaL REsOURcEs
NOTES TO FINANCIAL STATEMENTS31 December 2011 and 2010
OcR-9
NOTE A— NATURE OF OPERATIONS AND LIMITATIONS ON LOANS, GUARANTEES, AND EQUITY INVESTMENTS
Nature of Operations
The Asian Development Bank (ADB), a multilateral development financial institution, was established in 1966 with its headquarters in Manila, Philippines. ADB and its operations are governed by the Agreement Establishing the Asian Development Bank (the Charter). Its purpose is to foster economic development and co-operation in Asia and the Pacific region and to contribute to the acceleration of the process of economic development of the developing member countries (DMCs) in the region, collectively and individually. Since 1999, ADB’s corporate vision and mission has been to help DMCs reduce poverty in the region. This was reaffirmed under the long-term strategic framework for 2008–2020 (Strategy 2020). Under Strategy 2020, ADB’s corporate vision continues to be “An Asia and Pacific Free of Poverty” and its mission has been to help its DMCs reduce poverty and improve living conditions and quality of life. ADB has been pursuing its mission and vision by focusing on three complementary strategic agendas: inclusive growth, environmentally sustainable growth, and regional integration.
ADB conducts its operations through the ordinary capital resources (OCR) and Special Funds (see Note Q). Mobilizing financial resources, including cofinancing, is another integral part of ADB’s operational activities, where ADB, alone or jointly, administers on behalf of donors funds provided for specific uses.
ADB’s OCR operations comprise loans, equity investments, and guarantees. ADB finances its ordinary operations through borrowings, paid-in capital, and reserves.
ADB is immune from taxation pursuant to Chapter VIII, Article 56, Exemption from Taxation, of the Charter.
Limitations on Loans, Guarantees, and Equity Investments
Article 12, paragraph 1 of the Charter provides that the total amount outstanding of loans, equity investments, and guarantees made by ADB shall not exceed the total of ADB’s unimpaired subscribed capital, reserves, and surplus, exclusive of the special reserve. ADB’s policy on lending limitations limits the total amount of disbursed loans, approved equity investments, and the maximum amount that could be demanded from ADB under its guarantee portfolio, to the total amount of ADB’s unimpaired subscribed capital, reserves, and surplus. At 31 December 2011 and 2010, the total of such loans, equity investments, and guarantees aggregated approximately 29.2% and 30.2%, respectively, of the total subscribed capital, reserves, and surplus.
Article 12, paragraph 3 of the Charter provides that equity investments shall not exceed 10% of the unimpaired paid-in capital together with reserves and surplus, exclusive of the special reserve. At 31 December 2011, such equity investments represented approximately 7.9% (7.9% – 2010) of the paid-in capital, reserves, and surplus, as defined.

asian DEVELOpMEnt BanK—ORDinaRy capitaL REsOURcEs
NOTES TO FINANCIAL STATEMENTS31 December 2011 and 2010
Asian Development Bank Annual Report 2011
58
NOTE B—SUMMARY OF SIGNIFICANT ACCOUNTING POLICIES
Presentation of the Financial Statements
The financial statements of the OCR are prepared in accordance with accounting principles generally accepted in the United States of America.
Functional Currencies and Reporting Currency
The currencies of members are all functional currencies of ADB as these are the currencies of the primary economic environment in which OCR generates and expends cash. The reporting currency is the United States dollar (USD).
Translation of Currencies
ADB adopts the use of daily exchange rates for accounting and financial reporting purposes. This allows transactions in currencies other than USD to be translated to the reporting currency using exchange rates applicable at the time of transactions. At the end of each accounting month, translations of assets, liabilities, capital, and reserves denominated in non-USD are adjusted using the applicable rates of exchange at the end of the reporting period. These translation adjustments, other than those relating to the non-functional currencies (Note M) and to the maintenance of Special Drawing Right (SDR) capital values (Notes K and L), are charged or credited to “Accumulated translation adjustments” and reported in “CAPITAL AND RESERVES” as part of “Accumulated other comprehensive income.”
Valuation of Capital Stock
The authorized capital stock of ADB is defined in Article 4, paragraph 1 of the Charter “in terms of United States dollars of the weight and fineness in effect on 31 January 1966” (the 1966 dollar) and the value of each share is defined as 10,000 1966 dollars. The capital stock had historically been translated into the current United States dollar (ADB’s unit of account) on the basis of its par value in terms of gold. From 1973 until 31 March 1978, the rate arrived at on this basis was $1.20635 per 1966 dollar. Since 1 April 1978, at which time the Second Amendment to the Articles of Agreement of the International Monetary Fund (IMF) came into effect, currencies no longer have par values in terms of gold. Pending ADB’s selection of the appropriate successor to the 1966 dollar, the capital stock has been valued for purposes of these financial statements in terms of the SDR at the value in current United States dollars as determined by the IMF, with each share valued at SDR10,000.
As of 31 December 2011, the value of the SDR in terms of the current United States dollar was $1.53527 ($1.54003 – 2010) giving a value for each share of ADB’s capital equivalent to $15,352.70 ($15,400.30 – 2010).
Derivative Financial Instruments
ADB reports all derivative transactions in accordance with Accounting Standards Codification (ASC) 815, “Derivatives and Hedging.” ASC 815 requires that derivative instruments be recorded in the Balance Sheet as either assets or liabilities measured at fair value.

OcR-9
cOntinUED
Ordinary Capital Resources
59
In applying ASC 815, ADB has elected not to define any qualifying hedging relationships. Rather, all derivative instruments, as defined by ASC 815, have been marked to fair value, and all changes in fair value have been recognized in net income. ADB has elected not to define any qualifying hedging relationships, not because economic hedges do not exist, but rather because the application of ASC 815 hedging criteria does not make fully evident ADB’s risk management strategies.
Investments
All investment securities and negotiable certificates of deposit held by ADB other than derivative instruments are considered by management to be “Available for Sale” and are reported at fair value. Time deposits are reported at cost, which is a reasonable estimate of their fair value. Unrealized gains and losses are reported in “CAPITAL AND RESERVES” as part of “Accumulated other comprehensive income.” Realized gains and losses are included in revenue from investments and are measured by the difference between amortized cost and the net proceeds of sales. With respect to exchange traded futures, realized gains or losses are reported in the Statement of Income and Expenses under “NET REALIZED GAINS (LOSSES) From investments.”
Interest income on investment securities and time deposits is recognized as earned and reported, net of amortization of premiums and discounts.
Unrealized losses on investment securities are assessed to determine whether the impairment is deemed to be other than temporary. If the impairment is deemed to be other than temporary, the investment is written down to the impaired value, which becomes the new cost basis of the investment. Impairment losses are not reversed for subsequent recoveries in the value of the investment, until it is sold.
Securities Transferred Under Repurchase Agreement and Securities Purchased Under Resale Arrangement
ADB accounts for transfers of financial assets in accordance with ASC 860, “Transfers and Servicing.” In general, transfers are accounted for as sales when control over the transferred assets has been relinquished. Otherwise the transfers are accounted for as repurchase/resale agreements and collateralized financing arrangements. Under repurchase agreements, securities transferred are recorded as assets and reported at estimated fair value and cash collateral received are recorded as liabilities and restricted cash. ADB monitors the fair value of the securities transferred under repurchase agreements and the collateral. Under resale arrangements, securities purchased are recorded as assets and are not re-pledged.
Loans
ADB’s loans are made to or guaranteed by members, with the exception of nonsovereign loans, and have loan terms ranging between 5 and 32 years. Loan interest income and loan commitment fees are recognized on an accrual basis. In line with ADB’s principle of cost pass-through pricing, the funding cost margin is passed to LIBOR-based loan borrowers as a surcharge or rebate.
It is the policy of ADB to place loans in non-accrual status for which principal, interest, or other charges are overdue by six months. Interest and other charges on non-accruing loans are included in income only to the extent that payments have been received by ADB. Accordingly, loans are reinstated

asian DEVELOpMEnt BanK—ORDinaRy capitaL REsOURcEs
NOTES TO FINANCIAL STATEMENTS31 December 2011 and 2010
Asian Development Bank Annual Report 2011
60
to accrual status when all the principal, interest and other charges due on the loan have been paid. ADB maintains a position of not taking part in debt rescheduling agreements with respect to sovereign loans. In the case of nonsovereign loans, ADB may agree to debt rescheduling only after alternative courses of action have been exhausted.
ADB’s periodic evaluation of the adequacy of the allowance for loan losses is based on its past loan loss experience, known and inherent risks in existing loans, and adverse situations that may affect a borrower’s ability to repay.
For sovereign loans, ADB determines that a loan is impaired and therefore subject to provisioning when principal or interest is in arrears for more than one year. Specific provision for sovereign loan losses is written-back when the borrower’s arrears have been fully settled and the borrower has re-established regular loan service payments. The nonsovereign loans are individually reviewed and subject to provisioning when the loan is considered impaired. The impairment is determined based on the difference between the loan carrying value and present value of expected future cash flows discounted at the loan’s effective interest rate. Starting 2010, ADB has expanded the provisioning policy for nonsovereign loans to include collective provisions based on the credit risk ratings and probability of default and assumed loss given default.
ADB establishes loss reserve for both sovereign and nonsovereign credit exposures to be used as a basis for capital adequacy against expected losses in loans and guarantees. The amount of expected loss pertaining to credit exposures that are not impaired or subject to collective provision is recorded as loss reserve in the equity section of the balance sheet. Any adjustment to loan loss reserve following this methodology is subject to the approval of the Board of Governors.
From 2000 to 2003, ADB levied front-end fees on all new sovereign loans. These fees are deferred and amortized over the life of the loans after offsetting deferred direct loan origination costs. Front-end fees were waived on sovereign loans approved from 2004 and were eliminated for sovereign loans negotiated on and after 1 October 2007. Since 1988, ADB has charged front-end fees for nonsovereign loans.
ADB levies a commitment charge on the undisbursed balance of effective loans. Unless otherwise provided by the loan agreement, the charges take effect commencing on the 60th day after the loan signing date and are credited to loan income.
Guarantees
ADB provides guarantees under its sovereign and nonsovereign operations. Guarantees are regarded as outstanding when the underlying financial obligation of the borrower is incurred. ADB would be required to perform under its guarantees if the payments guaranteed were not made by the debtor, and the guaranteed party called the guarantee by demanding payments from ADB in accordance with the term of the guarantee.
For guarantees issued and modified on or after 1 January 2003, ADB recognizes at the inception of a guarantee, a liability for the stand-by obligation to perform on guarantees. Front-end fee income on guarantees received is deferred and amortized over the term of the guarantee contract. ADB records a contingent liability for the probable losses related to guarantees outstanding. This provision, as well as the unamortized balance of the deferred guarantee fee income, and the unamortized balance of the obligation to stand ready, are included in “Miscellaneous liabilities” on the Balance Sheet.

OcR-9
cOntinUED
Ordinary Capital Resources
61
Collateral
ADB requires collateral from individual swap counterparties in the form of approved liquid securities or cash to mitigate its credit exposure to these counterparties. It is the policy of ADB to restrict the collateral received from swap counterparties for fulfilling its obligations under the collateral agreement. ADB records the restricted cash in “OTHER ASSETS” with a corresponding obligation to return the cash in “ACCOUNTS PAYABLE AND OTHER LIABILITIES.” Collateral received in the form of liquid securities is disclosed in Note H and not recorded on OCR’s Balance Sheet.
Equity Investments
Investments in equity securities with readily determinable market price are considered “Available for Sale” and are reported at fair value, with unrealized gains and losses reported in “CAPITAL AND RESERVES” as part of “Accumulated other comprehensive income.”
ADB applies the equity method of accounting to investments where it has the ability to exercise influence such as in limited liability partnerships (LLPs) and certain limited liability companies (LLCs) that maintain a specific ownership account for each investor in accordance with ASC 323-30 “Partnerships, Joint Ventures, and Limited Liability Entities” and direct equity investment that fall under purview of ASC 323 “Investments—Equity Method and Joint Ventures.” The net asset value of equity investments under the equity method is considered an estimate of its fair value.
Investments in equity securities without readily determinable fair values are reported at cost or at written down value. These investments are assessed each quarter to reflect the amount that can be realized using valuation techniques appropriate to the market and industry of each investment. When impairment is identified and is deemed to be other than temporary, the equity investment is written down to the impaired value, which becomes the new cost basis of the equity investments. Impairment losses are not reversed for subsequent recoveries in the value of the equity investments. ADB determined that it is not practicable to estimate the fair value of equity investments reported at cost or written down value and the reported amount is considered an estimate of its fair value.
Variable Interest Entities
ADB complies with ASC 810, “Consolidated Financial Statements.” ASC 810 requires an entity to consolidate and provide disclosures for any Variable Interest Entity (VIE) for which it is the primary beneficiary. On 1 January 2010, ASC 810 was amended to define the primary beneficiary to the entity that both has the (i) power to direct the activities that most significantly impact the economic performance of the VIE and the (ii) obligation to absorb losses or the right to receive benefits that could potentially be significant to the VIE. Prior to this amendment, the standard required the entity that would absorb the majority of VIE’s expected losses or receive a majority of expected residual returns to be deemed as the primary beneficiary of the VIE. Variable interests can arise from equity investments, loans, and guarantees. ADB is required to disclose information about its involvement in VIE where ADB holds variable interest (see Note R).

asian DEVELOpMEnt BanK—ORDinaRy capitaL REsOURcEs
NOTES TO FINANCIAL STATEMENTS31 December 2011 and 2010
Asian Development Bank Annual Report 2011
62
Property, Furniture, and Equipment
Property, furniture, and equipment are stated at cost and, except for land, depreciated over estimated useful lives on a straight-line basis. Maintenance, repairs, and minor betterments are charged to expense. Land is stated at cost and is not amortized.
Borrowings
Borrowings are used as one source to provide funds for ADB’s operations. ADB diversifies its funding sources across markets, instruments, and maturities. ADB simultaneously enters into currency and/or interest rate swaps for asset/liability management.
ADB reports all borrowings that have associated derivative instruments at fair value (FV), including ADB’s credit risk (as a credit spread) by currency. Changes in FV are reported in net income. Legacy borrowings that do not have associated swaps continue to be reported at amortized cost. Amortization of discounts and premiums and issuance costs associated with new borrowings are deferred and amortized over the period during which the borrowing is outstanding.
Accounting Estimates
The preparation of the financial statements in conformity with accounting principles generally accepted in the United States of America requires management to make reasonable estimates and assumptions that affect the reported amounts of assets and liabilities and disclosure of contingent liabilities at the end of the year and the reported amounts of revenues and expenses during the year. The actual results could differ from those estimates. Judgments have been used in the valuation of certain financial instruments, the determination of the adequacy of the accumulated provisions for losses on loans and other exposures (irrevocable commitments and guarantees), the determination of net periodic cost from pension and other postretirement benefits plans, and the present value of benefit obligations.
Accounting and Reporting Developments
The Financial Accounting Standards Board (FASB) issued Accounting Standards Update (ASU) 2011-02, “Receivables (Topic 310) – A Creditor’s Determination of Whether Restructuring Is a Troubled Debt Restructuring” in April 2011. This update is effective for the first interim or annual period beginning on or after 15 June 2011 and is to be applied retrospectively to modifications occurring on or after the beginning of the annual period of adoption. This update did not have a material impact on OCR’s 31 December 2011 financial statements.
ASU 2010-06, “Fair Value Measurements and Disclosures (Topic 820) – Improving Disclosures about Fair Value Measurements” with respect to the separate disclosures about gross purchases, sales, issuances, and settlements relating to Level 3 measurements, is effective for fiscal years beginning after 15 December 2010 and for interim periods within those fiscal years. See Note P for the required disclosures.
In April 2011, the FASB issued ASU 2011-03, “Transfers and Servicing (Topic 860) – Reconsideration of Effective Control for Repurchase Agreements.” The update removes from the assessment of effective control the criterion requiring the transferor to have the ability to repurchase or redeem the financial assets on substantially the agreed terms, even in the event of default by the

OcR-9
cOntinUED
Ordinary Capital Resources
63
transferee. It does not change the other criteria used in the assessment of effective control. The revised guidance is applicable prospectively to new transactions and transactions that are modified on or after the first interim or annual period beginning 15 December 2011. This update did not have an impact on OCR’s 31 December 2011 financial statements.
In May 2011, the FASB issued ASU 2011-04, “Fair Value Measurement (Topic 820) – Amendments to Achieve Common Fair Value Measurement and Disclosure Requirements in US GAAP and IFRSs,” which amends US GAAP and International Financial Reporting Standards (IFRSs) and results in common disclosure and FV measure requirements. The ASU does not require additional FV measurements and is not intended to establish valuation standards or affect valuation practices outside of financial reporting. The new guidance will require prospective application and are effective for interim and annual periods beginning on or after 15 December 2011. ADB is currently assessing the impact of this update on OCR’s financial statements.
In June 2011, the FASB issued ASU 2011-05, “Comprehensive Income (Topic 220) – Presentation of Comprehensive Income,” which requires entities to present details of items that are reclassified from other comprehensive income to net income in the statement of comprehensive income. Subsequently, FASB issued ASU 2011-12 in December 2011 to effectively defer only those changes in ASU 2011-05 that relate to the presentation of reclassification adjustments out of accumulated other comprehensive income. ADB elected to adopt the provisions in ASU 2011-05 and presented in OCR-2 and OCR-3 on OCR’s 31 December 2011 and 2010 financial statements the reclassification adjustments.
In December 2011, the FASB issued ASU 2011-11, “Balance Sheet (Topic 210) – Disclosures about Offsetting Assets and Liabilities,” to provide enhanced disclosures that will enable users of its financial statements to evaluate the effect or potential effect of netting arrangements on an entity’s financial position. An entity is required to apply the amendments for annual reporting periods beginning on or after 1 January 2013, and interim periods within those annual periods. ADB is currently assessing the impact of this update on OCR’s financial statements.
Statement of Cash Flows
For the purposes of the Statement of Cash Flows, ADB considers that its cash and cash equivalents are limited to “DUE FROM BANKS,” which consist of cash on hand and current accounts in banks used for (i) operational disbursements, (ii) receipt of funds from encashment of member countries’ promissory notes, and (iii) clearing accounts.
NOTE C—RESTRICTIONS ON USE OF CURRENCIES OF MEMBERS
In accordance with Article 24, paragraph 2(i) of the Charter, the use by ADB or by any recipient from ADB of certain currencies may be restricted by members to payments for goods or services produced and intended for use in their territories. With respect to the currencies of 42 DMCs for 2011 (42 – 2010), cash in banks (due from banks) totaling $95,206,000 ($75,203,000 – 2010) may be, but are not currently so restricted.
In accordance with Article 24, paragraphs 2(i) and (ii) of the Charter, one member (one – 2010) has restricted the use by ADB or by any recipient from ADB of its currency to payments for goods or services produced in its territory. As such, cash in banks (due from banks) and investment totaling $43,000 and $3,282,000 ($198,000 and $3,088,000 – 2010), respectively, have been restricted.
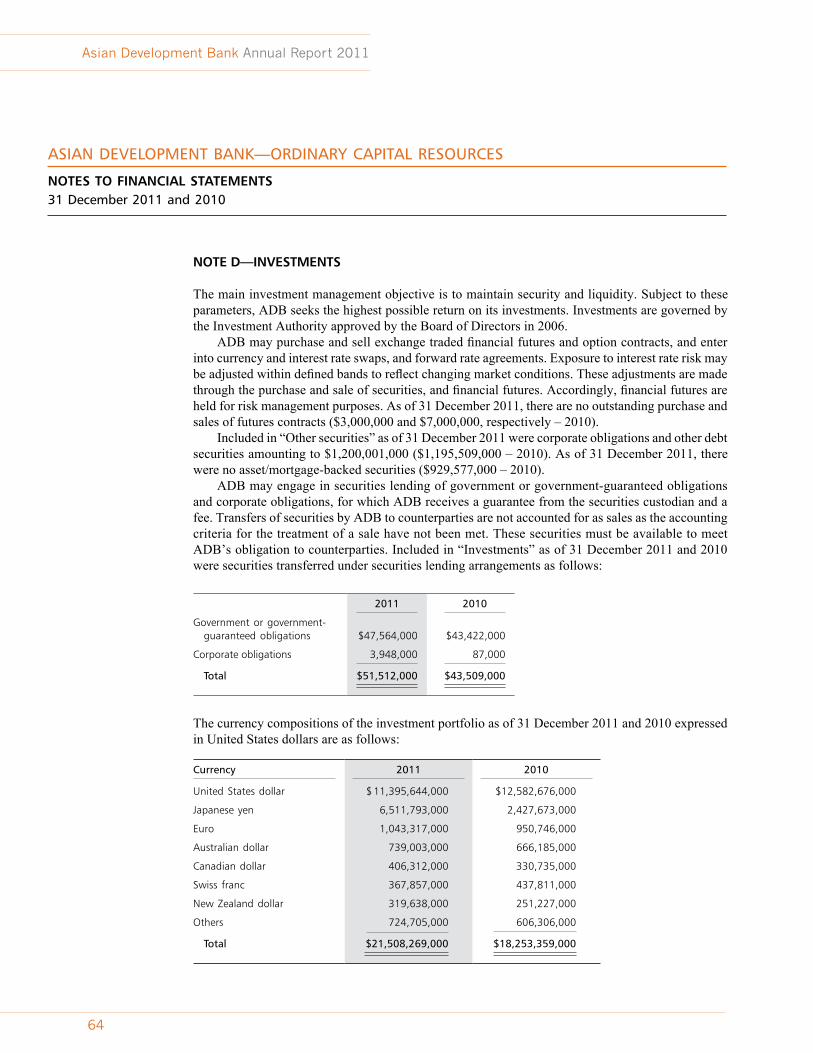
asian DEVELOpMEnt BanK—ORDinaRy capitaL REsOURcEs
NOTES TO FINANCIAL STATEMENTS31 December 2011 and 2010
Asian Development Bank Annual Report 2011
64
NOTE D—INVESTMENTS
The main investment management objective is to maintain security and liquidity. Subject to these parameters, ADB seeks the highest possible return on its investments. Investments are governed by the Investment Authority approved by the Board of Directors in 2006.
ADB may purchase and sell exchange traded financial futures and option contracts, and enter into currency and interest rate swaps, and forward rate agreements. Exposure to interest rate risk may be adjusted within defined bands to reflect changing market conditions. These adjustments are made through the purchase and sale of securities, and financial futures. Accordingly, financial futures are held for risk management purposes. As of 31 December 2011, there are no outstanding purchase and sales of futures contracts ($3,000,000 and $7,000,000, respectively – 2010).
Included in “Other securities” as of 31 December 2011 were corporate obligations and other debt securities amounting to $1,200,001,000 ($1,195,509,000 – 2010). As of 31 December 2011, there were no asset/mortgage-backed securities ($929,577,000 – 2010).
ADB may engage in securities lending of government or government-guaranteed obligations and corporate obligations, for which ADB receives a guarantee from the securities custodian and a fee. Transfers of securities by ADB to counterparties are not accounted for as sales as the accounting criteria for the treatment of a sale have not been met. These securities must be available to meet ADB’s obligation to counterparties. Included in “Investments” as of 31 December 2011 and 2010 were securities transferred under securities lending arrangements as follows:
2011 2010
Government or government- guaranteed obligations $47,564,000 $43,422,000
Corporate obligations 3,948,000 87,000
total $51,512,000 $43,509,000
The currency compositions of the investment portfolio as of 31 December 2011 and 2010 expressed in United States dollars are as follows:
currency 2011 2010
United States dollar $ 11,395,644,000 $12,582,676,000
Japanese yen 6,511,793,000 2,427,673,000
Euro 1,043,317,000 950,746,000
Australian dollar 739,003,000 666,185,000
Canadian dollar 406,312,000 330,735,000
Swiss franc 367,857,000 437,811,000
New Zealand dollar 319,638,000 251,227,000
Others 724,705,000 606,306,000
total $21,508,269,000 $18,253,359,000

OcR-9
cOntinUED
Ordinary Capital Resources
65
The estimated fair value and amortized cost of the investments by contractual maturity at 31 December 2011 and 2010 are as follows:
2011 2010
Estimated Fair Value amortized cost Estimated Fair Value amortized cost
Due in one year or less $ 8,093,610,000 $ 8,081,907,000 $ 6,366,579,000 $ 6,349,386,000
Due after one year through five years 11,895,876,000 11,605,916,000 9,833,354,000 9,584,033,000
Due after five years through ten years 1,415,163,000 1,345,745,000 2,028,176,000 1,971,706,000
Due after ten years through fifteen years 103,620,000 100,729,000 25,250,000 24,484,000
total $21,508,269,000 $21,134,297,000 $18,253,359,000 $17,929,609,000
Additional information relating to investments in government or government-guaranteed obligations and other securities classified as available for sale are as follows:
2011 2010
as of 31 December
Amortized cost $19,982,334,000 $15,643,835,000
Estimated fair value 20,356,306,000 15,967,586,000
Gross unrealized gains 410,314,000 354,897,000
Gross unrealized losses (36,342,000) (31,148,000)
For the years ended 31 December:
Change in net unrealized gains from prior year 50,223,000 (6,714,000)
Proceeds from sales 4,943,974,000 5,202,162,000
Gross gain on sales 99,070,000 58,185,000
Gross loss on sales (7,746,000) (31,288,000)

asian DEVELOpMEnt BanK—ORDinaRy capitaL REsOURcEs
NOTES TO FINANCIAL STATEMENTS31 December 2011 and 2010
Asian Development Bank Annual Report 2011
66
The table below provides a listing of investments that sustained unrealized losses as of 31 December 2011. Five government or government-guaranteed obligations (three – 2010), two corporate obligations (nil – 2010), one debt security (nil – 2010), and no asset/mortgage-backed security (one – 2010) sustained unrealized losses for over one year, representing 2.71% (0.31% – 2010) of the total investments. Comparative details for 2011 and 2010 are as follows:
One year or less Over one year total
For the year 2011Fair
ValueUnrealized
LossesFair
ValueUnrealized
LossesFair
ValueUnrealized
Losses
Government or government- guaranteed obligations $ 6,636,536,000 $ 25,247,000 $ 279,106,000 $4,850,000 $6,915,642,000 $30,097,000
Corporate bonds 242,784,000 2,243,000 297,627,000 2,373,000 540,411,000 4,616,000
Asset/Mortgage- backed securities – – – – – –
Others – – 5,730,000 1,629,000 5,730,000 1,629,000
total $6,879,320,000 $27,490,000 $582,463,000 $8,852,000 $7,461,783,000 $36,342,000
One year or less Over one year total
For the year 2010Fair
ValueUnrealized
LossesFair
ValueUnrealized
LossesFair
ValueUnrealized
Losses
Government or government- guaranteed obligations $ 3,521,005,000 $ 23,028,000 $59,698,000 $456,000 $3,580,703,000 $23,484,000
Corporate bonds 351,855,000 3,366,000 – – 351,855,000 3,366,000
Asset/Mortgage- backed securities 139,631,000 3,852,000 204,000 26,000 139,835,000 3,878,000
Others 6,939,000 420,000 – – 6,939,000 420,000
total $4,019,430,000 $30,666,000 $59,902,000 $482,000 $4,079,332,000 $31,148,000

OcR-9
cOntinUED
Ordinary Capital Resources
67
NOTE E—LOANS
Loans
The carrying amount and estimated fair value of loans outstanding at 31 December 2011 and 2010 are as follows:
2011 2010
carrying Value
Estimated Fair Value
carrying Value
Estimated Fair Value
Fixed rate multicurrency loans $ 11,488,000 $ $12,674,000 $ 15,863,000 $ 18,134,000
Pool-based single currency (¥) loans 1,970,499,000 2,185,311,000 2,391,854,000 2,694,778,000
Pool-based single currency (US$) loans 5,137,483,000 6,200,680,000 5,856,886,000 6,828,121,000
LIBOR-based loans 41,772,348,000 42,091,798,000 37,049,539,000 37,240,879,000
Fixed rate loans – – 2,479,000 2,603,000
Local currency loans 867,394,000 888,174,000 627,120,000 634,309,000
Loan arising from guarantee call 48,000 48,000 70,000 70,000
total $49,759,260,000 $51,378,685,000 $45,943,811,000 $47,418,894,000
ADB does not sell its sovereign loans, nor does it believe there is a market for its sovereign loans. The estimated fair value of all loans is based on the estimated cash flows from principal repayments and interest discounted at the applicable market yield curves for ADB’s borrowing cost plus lending spread.
Prior to 1 July 1986, the lending rate of ADB was based on a multicurrency fixed lending rate system under which loans carried interest rates fixed at the time of loan approval for the entire life of the loans. Effective 1 July 1986, ADB adopted a multicurrency pool-based variable lending rate system. In July 1992, ADB introduced a United States dollar pool-based variable lending rate system, and in November 1994, a market-based lending rate system was made available to sovereign and nonsovereign borrowers. The outstanding balances of pool-based multicurrency loans were subsequently transformed into pool-based single currency loans in Japanese yen, effective 1 January 2004.
Commencing 1 July 2001, ADB introduced LIBOR-based loans (LBLs) in the following currencies – euro, Japanese yen, and United States dollar. The LBL lending facility offers borrowers (i) choice of currency and interest rate basis; (ii) flexibility to change the original loan terms (currency and interest rate basis) at any time during the life of the loan; and (iii) options to cap or collar the floating lending rate at any time during the life of the loan. With the introduction of LBLs, prior loan windows are no longer offered to borrowers. ADB enhanced the LBL lending facility to sovereign LBLs negotiated after 1 January 2007, offering additional major currencies that ADB can efficiently intermediate, and additional repayment options including (i) annuity method with various discount factors, (ii) straight-line repayment, (iii) bullet repayment, and (iv) custom-tailored repayment.

asian DEVELOpMEnt BanK—ORDinaRy capitaL REsOURcEs
NOTES TO FINANCIAL STATEMENTS31 December 2011 and 2010
Asian Development Bank Annual Report 2011
68
In November 2002, ADB started to offer local currency loan (LCL) to nonsovereign borrowers and extended the LCL to sovereign borrowers in 2005.
In June 2009, ADB established a Countercyclical Support Facility (CSF) in response to the global economic crisis that spread to Asia and the Pacific. Loans approved under the CSF carry a lending spread of 2.0% that are charged above ADB’s average funding cost and have a maturity of 5 years, including a 3-year grace period. As of 31 December 2011, five sovereign loans totaling $2,500,000,000 were outstanding.
During 2011, ADB received prepayments for seven loans (four loans – 2010) amounting to $104,677,000 ($33,483,000 – 2010) and collected prepayment premiums of $334,000 ($6,000 – 2010). 57% and 33% of the prepaid amounts in 2011 were LIBOR-based loans and pool-based single currency loan in US dollars, respectively, compared to 83% for LIBOR-based loans in 2010.
Loan Charges
In April 2010, the Board of Directors approved for all LIBOR-based loans to sovereign borrowers or with sovereign guarantees and local currency loans with sovereign guarantees (i) that are negoti-ated from 1 July 2010 to and including 30 June 2011, that the credit of 0.4% be reduced to 0.3% for the duration of the loan, to result to an effective contractual spread of 30 basis points over the base lending rate; and (ii) that are negotiated from 1 July 2011, that the credit of 0.4% be reduced to 0.2% for the duration of the loan, to result to an effective contractual spread of 40 basis points over the base lending rate.
For loans negotiated before 1 July 2010 and on after 1 October 2007, the credit of 0.4% for the duration of the loan, resulting to an effective contractual spread of 0.2% continues to apply. In December 2010, with respect to all loans negotiated before 1 October 2007, the Board approved for borrowers or guarantors under ADB’s sovereign operations that do not have any OCR loans in arrears with ADB, the continuation of waiver of 0.2% of the lending spread on outstanding loans that carry a lending spread of 0.6% to be applicable to all interest periods up to 31 December 2012. This extends the previous waivers that have been provided since July 2004.
For loans negotiated before 1 January 2007, a flat commitment fee of 0.75% was charged for sovereign program loans and a progressive commitment fee of 0.75% was maintained for sovereign project loans. In October 2006, the Board approved a change in the commitment charge policy for sovereign project loans negotiated after 1 January 2007, from 0.75% on a progressive structure of undisbursed loan balances to a flat commitment fee of 0.35% on the full amount of undisbursed balances. Further to this, the Board also approved in April 2007, the waiver of 0.1% of the commitment charge on the undisbursed balances of sovereign project loans negotiated after 1 January 2007 and 0.5% of the commitment charge on the undisbursed balances of sovereign program loans. ADB has extended to provide waivers on commitment charges up to 31 December 2012. In December 2007, the Board approved the reduction of the commitment charge from 0.75% for sovereign program loans and 0.35% for sovereign project loans to a flat commitment fee of 0.15% for both sovereign program and project loans negotiated on or after 1 October 2007, and eliminated the waiver mechanism for such loans.

OcR-9
cOntinUED
Ordinary Capital Resources
69
Loans in Non-Accrual Status
ADB places loans overdue in non-accrual status when they are past due by six months. One nonsovereign loan was in non-accrual status as of 31 December 2011 (two – 2010).
The principal outstanding was $22,826,000 ($31,861,000 – 2010) of which $22,826,000 ($30,028,000 – 2010) was overdue. Loans in non-accrual status resulted in $1,000 not being recognized as income from nonsovereign loans for the year ended 31 December 2011 (net recovery of $285,000 – 2010).
There were no sovereign loans in non-accrual status in 2011 and 2010. An analysis of the age of the recorded loans outstanding including receivable arising from
guarantee call, that are past due as of 31 December 2011 and 2010 are as follows:
Overdue Loan service payments
1–90 Days > 90 Days total current total Loans
2011
Sovereign Loans $ – $ – $ – $46,972,115,000 $ 46,972,115,000
Nonsovereign Loans – 23,003,000 23,003,000 2,734,272,000 2,757,275,000
Total $ – $23,003,000 $23,003,000 $49,706,387,000 49,729,390,000
Allowance for loan losses (35,030,000)
Unamortized direct loan
origination fees—net 64,900,000
Loans Outstanding $ 49,759,260,000
2010
Sovereign Loans $ 1,980,000 $ – $ 1,980,000 $43,565,048,000 $ 43,567,028,000
Nonsovereign Loans 9,396,000 20,817,000 30,213,000 2,335,634,000 2,365,847,000
Total $11,376,000 $20,817,000 $32,193,000 $45,900,682,000 45,932,875,000
Allowance for loan losses (42,505,000)
Unamortized direct loan
origination fees—net 53,441,000
Loans Outstanding $45,943,811,000
As of 31 December 2011 and 2010, there were no loans 90 days or greater past due still accruing interest.

asian DEVELOpMEnt BanK—ORDinaRy capitaL REsOURcEs
NOTES TO FINANCIAL STATEMENTS31 December 2011 and 2010
Asian Development Bank Annual Report 2011
70
Undisbursed loan commitments and an analysis of loans by borrowers as of 31 December 2011 are shown in OCR-6. The carrying amounts of loans outstanding by loan product at 31 December 2011 and 2010 are as follows:
2011 2010
Sovereign Loans
Fixed rate multicurrency loans $ 11,488,000 $ 15,863,000
Pool-based single currency (¥) loans 1,970,499,000 2,391,854,000
Pool-based single currency (US$) loans 5,137,821,000 5,857,460,000
LIBOR-based loans 39,702,802,000 35,301,851,000
Local currency loans 149,505,000 –
46,972,115,000 43,567,028,000
Allowance for loan losses – –
Unamortized direct loan origination cost—net 80,534,000 67,237,000
80,534,000 67,237,000
Subtotal 47,052,649,000 43,634,265,000
Nonsovereign Loans
Fixed rate loans – 2,515,000
LIBOR-based loans 2,024,470,000 1,716,322,000
Local currency loans 732,628,000 646,824,000
Others 177,000 186,000
2,757,275,000 2,365,847,000
Allowance for loan losses (35,030,000) (42,505,000)
Unamortized front-end fee—net (15,634,000) (13,796,000)
(50,664,000) (56,301,000)
Subtotal 2,706,611,000 2,309,546,000
total $49,759,260,000 $45,943,811,000

OcR-9
cOntinUED
Ordinary Capital Resources
71
Allowance for Loan Losses
ADB has not suffered any losses of principal on sovereign loans to date. During the year, no loan loss provision has been made against outstanding sovereign loans (write-back of $2,723,000 on one loan – 2010). No accumulated loan loss provision for sovereign loans as of 31 December 2011 (nil – 2010).
A total of $7,475,000 in loss provision for nonsovereign loans was written back ($58,014,000 – 2010) consisting of $5,657,000 provision ($40,390,000 – 2010), $13,052,000 write back ($98,850,000 write back/off – 2010), and $80,000 negative translation adjustment ($446,000 – 2010).
The changes in the allowance for loan losses during 2011 and 2010 as well as information pertaining to loans which were subject to specific allowance for loan losses are as follows:
2011 2010
sovereign Loans
nonsovereign Loans total
sovereign Loans
nonsovereign Loans total
allowance for credit Losses:
Beginning balance $ – $ 42,505,000 $ 42,505,000 $ 2,723,000 $ 100,519,000 $ 103,242,000
Provision during the year – 5,657,000 5,657,000 – 40,390,000 40,390,000
Written back/off – (13,052,000) (13,052,000) (2,723,000) (98,850,000) (101,573,000)
Translation adjustment – (80,000) (80,000) – 446,000 446,000
Ending Balance $ – $ 35,030,000 $ 35,030,000 $ – $ 42,505,000 $ 42,505,000
Ending balance individually evaluated for impairment $ – $ 9,609,000 $ 9,609,000 $ – $ 9,152,000 $ 9,152,000
Ending balance collectively evaluated for impairment $ – $ 25,421,000 $ 25,421,000 $ – $ 33,353,000 $ 33,353,000
Loans:
Ending Balance $46,972,115,000 $2,757,275,000 $49,729,390,000 $43,567,028,000 $2,365,847,000 $45,932,875,000
Ending balance individually evaluated for impairment $ – $ 24,103,000 $ 24,103,000 $ – $ 32,046,000 $ 32,046,000
Ending balance collectively evaluated for impairment $ – $2,733,172,000 $ 2,733,172,000 $ – $ 2,333,801,000 $ 2,333,801,000

asian DEVELOpMEnt BanK—ORDinaRy capitaL REsOURcEs
NOTES TO FINANCIAL STATEMENTS31 December 2011 and 2010
Asian Development Bank Annual Report 2011
72
Allowance is recorded for all impaired loans. The recorded loan receivable in the impaired loans with related allowance for loan losses during 2011 and 2010 are as follows:
2011 2010
Recorded Loan Receivable
Unpaid principal balance
Related allowance
Recorded Loan Receivable
Unpaid principal balance
Related allowance
Sovereign Loans $ – $ – $ – $ – $ – $ –
Nonsovereign Loans 24,103,000 23,003,000 9,609,000 32,046,000 30,213,000 9,152,000
No loans were modified or restructured for the year ended 31 December 2011.
Credit Risks and Quality of Loans
ADB is exposed to credit risks in the loan portfolio if a borrower defaults or if its creditworthiness deteriorates. Credit risk represents the potential loss due to possible nonperformance by obligors and counterparties under the terms of the contract. ADB manages country risk for lending operations through continuous monitoring of creditworthiness of the borrowers and rigorous capital adequacy framework.
ADB monitors credit quality of the loans by assigning a risk rating to each loan on an internal scale from 1 to 14 with 1 denoting the lowest expectation of credit risk and 14 denoting that the borrower has defaulted. The rating scale corresponds directly to the rating scales used by international rating agencies. For sovereign loans, ADB generally uses the average sovereign ratings assigned by external rating agencies which are mapped to ADB’s internal scale. For nonsovereign loans, each transaction is reviewed and assigned a rating based on a methodology that is broadly aligned with the rating approach of international rating agencies. The risk ratings are used to monitor the credit risk in the portfolio, derive the expected losses in the loan portfolio, and monitor the capital adequacy.
The following table summarizes the credit quality of sovereign and nonsovereign loans. High credit risk includes $24,103,000 in nonsovereign loans that were considered impaired ($32,046,000 nonsovereign loans – 2010).
sovereign Loans nonsovereign Loans
Risk class Risk Rating 2011 2010 2011 2010
Low credit risk 1–5 (AAA to BBB–) $ 23,006,067,000 $ 20,100,832,000 $ 773,600,000 $ 705,631,000
Medium credit risk 6–11 (BB+ to B–) 23,938,700,000 23,444,532,000 1,910,494,000 1,378,401,000
High credit risk 12–14 (CCC+ to D) 27,348,000 21,664,000 73,181,000 281,815,000
total $46,972,115,000 $43,567,028,000 $2,757,275,000 $2,365,847,000
As of 31 December 2011, ADB had a significant concentration of credit risk to Asia and the Pacific region associated with loan products. The credit exposure determined based on fair value of loans and including the outstanding guarantees amounted to $53,373,873,000 ($49,388,003,000 – 2010).

OcR-9
cOntinUED
Ordinary Capital Resources
73
Cofinancing
ADB functions as lead lender in cofinancing arrangements with other participating financial institutions who also provide funds to ADB’s sovereign and nonsovereign borrowers. In such capacity, ADB provides loan administration services, which include loan disbursements and loan collections. The participating financial institutions have no recourse to ADB for their outstanding loan balances. These loans are not recorded as part of OCR’s Balance Sheet.
Loans administered by ADB on behalf of participating institutions during the year ending 31 December 2011 and 2010 are as follows:
2011 2010
amountno. of Loans amount
no. of Loans
Sovereign loans $1,192,845,000 42 $1,055,810,000 40
Nonsovereign loans 356,687,000 8 356,701,000 10
total $1,549,532,000 50 $1,412,511,000 50
During the year ended 31 December 2011, a total of $65,000 ($105,000 – 2010) was received as compensation for arranging and administering such loans. This amount has been included in “Revenue from other sources.”
NOTE F—GUARANTEES
ADB provides guarantees under its sovereign and nonsovereign operations. Such guarantees include (i) partial credit guarantees where certain principal and/or interest payments are covered; and (ii) political risk guarantees, which provide coverage against well-defined sovereign risks. While counterguarantees from the host government are required for all public sector guarantees, guarantees for nonsovereign projects may be provided with or without a host government counterguarantee. ADB also seeks risk-sharing arrangements that set ADB’s net exposure under a guarantee at the lowest level required to mobilize the necessary financing while maintaining a participation that is meaningful to its financing partners. A counterguarantee takes the form of a counter-guarantors’ agreement to indemnify ADB for any payments it makes under the guarantee. In the event that a guarantee is called, ADB has the contractual right to require payment from the counter-guarantor, on demand, or as ADB may otherwise direct.
The maturity of the underlying instruments for which ADB provided the partial credit guarantees is generally 10 or more years. ADB’s political risk guarantee is callable when a guaranteed event has occurred and such an event has resulted in debt service default to the guaranteed lender.
As of 31 December 2011, total loan arising from guarantee call was $177,000 ($186,000 – 2010) with corresponding allowance for losses of $129,000 ($116,000 – 2010). None of the outstanding amounts as of 31 December 2011 and 2010 were subject for call.

asian DEVELOpMEnt BanK—ORDinaRy capitaL REsOURcEs
NOTES TO FINANCIAL STATEMENTS31 December 2011 and 2010
Asian Development Bank Annual Report 2011
74
The committed and outstanding amounts of these guarantee obligations as of 31 December 2011 and 2010 covered:
2011 2010
committed amount
Outstanding amount
committed amount
Outstanding amount
Partial Credit Guarantees
with counterguarantee $ 1,550,995,000 $1,533,445,000 $ 1,353,617,000 $1,270,701,000
without counterguarantee 759,913,000 355,470,000 797,232,000 565,179,000
2,310,908,000 1,888,915,000 2,150,849,000 1,835,880,000
Political Risk Guarantees
with counterguarantee 139,967,000 92,093,000 143,317,000 112,870,000
without counterguarantee 29,535,000 14,180,000 36,555,000 19,409,000
169,502,000 106,273,000 179,872,000 132,279,000
Others – – 950,000 950,000
total $2,480,410,000 $1,995,188,000 $2,331,671,000 $1,969,109,000
The committed amount represents the maximum potential amount of undiscounted future payment that ADB could be required to make, inclusive of standby portion for which ADB is committed but not currently at risk. The outstanding amount represents the guaranteed amount utilized under the related loans, which have been disbursed as of the end of the year, exclusive of the standby portion.
As of 31 December 2011, a total liability of $13,857,000 ($17,604,000 – 2010) relating to standby ready obligation for two partial credit risk guarantees (three – 2010) and two political risk guarantees (three – 2010) has been included in “ACCOUNTS PAYABLE AND OTHER LIABILITIES” – “Miscellaneous” on the Balance Sheet for all guarantees issued after 31 December 2002.
As of 31 December 2011, no (one – 2010) partial credit guarantee with nonsovereign counter-guarantee had collateral from a counterguarantee.
NOTE G—EQUITY INVESTMENTS
ADB’s equity investments may be in the form of direct equity investments (e.g., common, preferred, or other capital stock) or through investment funds (e.g., private equity funds). They are classified and accounted into: (i) investments classified as available for sale; (ii) investments accounted under equity method; and (iii) investments in other non-controlled entities without readily available fair values are reported at cost or written down value.

OcR-9
cOntinUED
Ordinary Capital Resources
75
The carrying value of equity investments as of 31 December 2011 and 2010 are as follows:
2011 2010
Equity method $460,708,000 $434,805,000
Available for sale 297,741,000 491,637,000
Cost method 212,173,000 181,756,000
total $970,622,000 $1,108,198,000
As of 31 December 2011, there were five (eight – 2010) equity investments which were classified as available for sale totaling $297,741,000 ($491,637,000 – 2010). There was one investment that sustained unrealized losses in 2011 (nil – 2010).
Additional information relating to equity investments classified as available for sale is as follows:
2011 2010
as of 31 December
Amortized cost $ 76,040,000 $118,762,000
Estimated fair value 297,741,000 491,637,000
Gross unrealized gains 221,718,000 372,875,000
Gross unrealized losses (17,000) –
For the years ended 31 December:
Change in net unrealized (losses) gains from prior year (151,175,000) 30,673,000
Proceeds from sales 150,136,000 10,288,000
Gross gain on sales 110,838,000 7,493,000
Gross loss on sales (320,000) –
Approved equity investment facility that has not been disbursed was $611,500,000 at 31 December 2011 ($471,456,000 – 2010).
NOTE H—DERIVATIVE INSTRUMENTS
ADB uses derivative instruments for asset and liability management of individual positions and portfolios. The fair value of outstanding currency and interest rate swap agreements is determined at the estimated amount that ADB would receive or pay to terminate the agreements using market-based valuation models. The basis of valuation is the present value of expected cash flows based on market data.

asian DEVELOpMEnt BanK—ORDinaRy capitaL REsOURcEs
NOTES TO FINANCIAL STATEMENTS31 December 2011 and 2010
Asian Development Bank Annual Report 2011
76
Interest rate swaps: Under a typical interest rate swap agreement, one party agrees to make periodic payments based on a notional principal amount and an interest rate that is fixed at the outset of the agreement. The counterparty agrees to make floating rate payments based on the same notional principal amount. The terms of ADB’s interest rate swap agreements usually match the terms of particular borrowings.
Currency swaps: Under a typical currency swap agreement, one party agrees to make periodic payments in one currency while the counterparty agrees to make periodic payments in another currency. The payments may be fixed at the outset of the agreement or vary based on interest rates. A receivable is created for the currency swapped out, and a payable is created for the currency swapped in. The terms of ADB’s currency swap agreements usually match the terms of particular borrowings.
FX swaps: Under a typical foreign exchange swap, ADB agrees to make payment in one currency while the counterparty agrees to make payment in another currency, on the basis of agreed spot and forward rates. The terms of ADB’s FX swaps agreement usually match the terms of particular investments.
Exchange Traded Futures: Futures are contracts for delayed delivery of securities or money market instruments in which the seller agrees to make delivery at a specified future date of a specified instrument at a specified price or yield. Initial margin requirements are met with cash or securities, and changes in the market prices are generally settled daily in cash. ADB generally closes out open positions prior to maturity. Therefore, cash receipts or payments are limited to the change in market value of the future contracts. As of 31 December 2011, net payments on future contracts amounted to $556,000 ($398,000 – 2010).
Included in Receivable/Payable from Swaps - Others are interest rate and currency swaps that ADB has entered into for the purpose of hedging specific investments and loans. The loan related swaps were executed to better align the composition of certain outstanding loans with funding sources.

OcR-9
cOntinUED
Ordinary Capital Resources
77
Fair Value of Derivative Instruments
The table below provides information on the fair value amounts and the location of ADB’s derivative instruments on the Balance Sheet as of 31 December 2011 and 2010:
Derivative assets Derivative Liabilities
Balance sheet Location
Fair ValueBalance sheet
Location
Fair Value
2011 2010 2011 2010
Borrowings related swaps
Receivable from Swaps - Borrowings
Payable for Swaps - Borrowings
Currency swaps $26,014,414,000 $25,187,815,000 $23,742,774,000 $22,464,043,000
Interest rate swaps 5,139,633,000 4,287,870,000 3,505,734,000 3,310,970,000
FX swaps 219,057,000 – 216,857,000 –
Total 31,373,104,000 29,475,685,000 27,465,365,000 25,775,013,000
Investment related swaps
Receivable from Swaps - Others
Payable for Swaps - Others
Currency swaps 1,877,873,000 543,871,000 2,104,936,000 703,710,000
Interest rate swaps 55,943,000 98,572,000 116,731,000 140,782,000
FX swaps 3,615,024,000 724,951,000 3,632,380,000 741,597,000
Total 5,548,840,000 1,367,394,000 5,854,047,000 1,586,089,000
Loans related swaps Receivable from Swaps - Others
Payable for Swaps - Others
Currency swaps 620,385,000 320,421,000 608,110,000 318,178,000
Interest rate swaps 50,982,000 93,243,000 114,209,000 173,574,000
Total 671,367,000 413,664,000 722,319,000 491,752,000
total derivatives not designated as hedging instruments $37,593,311,000 $31,256,743,000 $34,041,731,000 $27,852,854,000

asian DEVELOpMEnt BanK—ORDinaRy capitaL REsOURcEs
NOTES TO FINANCIAL STATEMENTS31 December 2011 and 2010
Asian Development Bank Annual Report 2011
78
Effect of Derivative Instruments on the Statement of Income and Expenses
ADB reports changes in the fair value of its derivative instruments as part of net unrealized gains and losses in its Statement of Income and Expenses while all interest income, expenses, and related amortization of discounts, premiums, and fees are reported as part of revenue and expenses. These are summarized below:
amount of gain (Loss) recognized in income on Derivatives
Location of gain (Loss) recognized in income on Derivatives 2011 2010
Futures Net Realized Gains (Losses) $ (556,000) $ (398,000)
Investment related swaps Currency swaps Net Unrealized Gains (1,883,000) 3,703,000
Revenue from Investments (5,536,000) (7,124,000)
Net Realized Gains from Investments – 7,128,000
Interest rate swaps Net Unrealized Gains (18,920,000) (4,576,000)
Revenue from Investments (5,362,000) (5,801,000)
Net Realized Gains from Investments (6,990,000) 177,000
FX swaps Net Unrealized Gains 3,894,000 975,000
Revenue from Investments 9,325,000 6,335,000
FX forward Net Realized Gains (Losses) 63,000 –
(25,409,000) 817,000
Loans related swaps Currency swaps Net Unrealized Gains (21,707,000) 14,292,000
Revenue from Loans (17,641,000) (15,863,000)
Interest rate swaps Net Unrealized Gains 13,102,000 7,050,000
Revenue from Loans (44,525,000) (49,422,000)
(70,771,000) (43,943,000)
Borrowings related swaps Currency swaps Net Unrealized Gains 716,606,000 167,899,000
Borrowings and related expenses 1,302,275,000 1,286,229,000
Interest rate swaps Net Unrealized Gains 648,521,000 301,275,000
Borrowings and related expenses 622,724,000 593,365,000
FX forward Net Unrealized Gains (2,000) (1,000)
Borrowings and related expenses 632,000 29,000
3,290,756,000 2,348,796,000
total $3,194,020,000 $2,305,272,000

OcR-9
cOntinUED
Ordinary Capital Resources
79
Counterparty Credit Risks
ADB undertakes derivative transactions with its eligible counterparties and transacts in various finan-cial instruments as part of liquidity and asset/liability management purposes that may involve credit risks. For all investment securities and their derivatives, ADB manages credit risks by following the policies set forth in the Investment Authority and other risk management guidelines (Note D). ADB has a potential risk of loss if the swap counterparty fails to perform its obligations. In order to reduce such credit risk, ADB only transacts with counterparties eligible under ADB’s swap guidelines which include a requirement that the counterparties have a credit rating of A– or higher and generally requires entering into master swap agreements which contain legally enforceable close-out netting provisions for all counterparties with outstanding swap transactions. The reduction in exposure as a result of these netting provisions can vary as additional transactions are entered into under these agreements. The extent of the reduction in exposure may therefore change substantially within a short period of time following the balance sheet date.
ADB has entered into several agreements with its derivative counterparties under the Master Agreement of the International Swaps and Derivatives Association (ISDA) and the Master Agreement of the National Association of Financial Market Institutional Investors (NAFMII). The agreements provide for the right of a party to terminate if any of the various events of default and termination events specified occur. Events of default include failure to pay and cross default. Termination events include the situation where the long term unsecured and unsubordinated indebtedness of ADB or the counterparty ceases to be rated at least Baa3 by Moody’s Investor Service, Inc. or BBB– by Standard and Poor’s Ratings Group, or such indebtedness ceases to be rated by Moody’s or S&P. If ADB’s counterparties are entitled under the agreements to terminate their derivative transactions with ADB, ADB will be required to pay an amount equal to its net liability position with each counterparty (in the case of counterparties who have entered into the ISDA Master Agreement) and an amount equal to its gross liability position with each counterparty (in the case of counterparties who have entered into the NAFMII Master Agreement). The aggregate fair value of all derivative instruments that ADB has under ISDA Master Agreement that are in a net liability (negative marked-to-market) position as of 31 December 2011 is $456,030,000 ($520,347,000 – 2010). There is no gross liability position in the aggregate fair value of all derivative instruments that ADB has under the NAFMII Master Agreement as of 31 December 2011 (gross liability position of $3,106,000 – 2010).
Counterparty credit risk is also mitigated by requiring counterparties to post collateral based on specified credit rating-driven thresholds. As of 31 December 2011, ADB had received collateral of $3,319,857,000 ($2,890,208,000 – 2010) in connection with the swap agreements. Of this amount, $1,942,954,000 ($1,588,350,000 – 2010) was recorded as swap related collateral (restricted cash).
NOTE I—PROPERTY, FURNITURE, AND EQUIPMENT
In 1991, under the terms of an agreement with the Philippines (Government), ADB returned the former headquarters premises, which had been provided by the Government. In accordance with the agreement as supplemented by a memorandum of understanding, ADB was compensated $22,657,000 for the return of these premises. The compensation is in lieu of being provided premises under the agreement and accordingly, is deferred and amortized over the estimated life of the new headquarters building as a reduction of occupancy expense. The amortization for the year ended

asian DEVELOpMEnt BanK—ORDinaRy capitaL REsOURcEs
NOTES TO FINANCIAL STATEMENTS31 December 2011 and 2010
Asian Development Bank Annual Report 2011
80
31 December 2011 amounted to $396,000 ($388,000 – 2010) reducing depreciation expense for the new headquarters building from $4,342,000 ($4,342,000 – 2010) to $3,946,000 ($3,954,000 – 2010). At 31 December 2011, the unamortized deferred compensation balance (included in “ACCOUNTS PAYABLE AND OTHER LIABILITIES – Miscellaneous”) was $7,527,000 ($7,931,000 – 2010). At 31 December 2011, accumulated depreciation for property, furniture, and equipment was $201,868,000 ($185,292,000 – 2010).
The changes in the property, equipment, and intangible assets during 2011 and 2010, as well as information pertaining to accumulated depreciation, are as follows:
property, Furniture, and Equipment
LandBuildings and Improvements
Office Furniture and Equipment Work in Progress grand total
cost:
Balance, 1 January 2011 $10,178,000 $ 201,607,000 $117,224,000 $17,460,000 $ 346,469,000
Additions during the year – 7,654,000 16,878,000 (5,009,000) 19,523,000
Disposals during the year – (2,673,000) – (2,673,000)
Balance, 31 December 2011 10,178,000 209,261,000 131,429,000 12,451,000 363,319,000
accumulated Depreciation:
Balance, 1 January 2011 – (96,205,000) (89,087,000) – (185,292,000)
Depreciation during the year – (5,998,000) (13,051,000) – (19,049,000)
Disposals during the year – – 2,473,000 – 2,473,000
Balance, 31 December 2011 – (102,203,000) (99,665,000) – (201,868,000)
net Book Value, 31 December 2011 $10,178,000 $107,058,000 $ 31,764,000 $12,451,000 $161,451,000
property, Furniture, and Equipment
LandBuildings and Improvements
Office Furniture and Equipment Work in Progress grand total
cost:
Balance, 1 January 2010 $10,178,000 $ 197,064,000 $106,437,000 $14,854,000 $328,533,000
Additions during the year – 4,543,000 12,650,000 2,606,000 19,799,000
Disposals during the year – – (1,863,000) – (1,863,000)
Balance, 31 December 2010 10,178,000 201,607,000 117,224,000 17,460,000 346,469,000
accumulated Depreciation:
Balance, 1 January 2010 – (91,009,000) (78,812,000) – (169,821,000)
Depreciation during the year – (5,196,000) (12,095,000) – (17,291,000)
Disposals during the year – – 1,820,000 – 1,820,000
Balance, 31 December 2010 – (96,205,000) (89,087,000) – (185,292,000)
net Book Value, 31 December 2010 $10,178,000 $105,402,000 $ 28,137,000 $17,460,000 $161,177,000

OcR-9
cOntinUED
Ordinary Capital Resources
81
NOTE J—BORROWINGS
The key objective of ADB’s borrowing strategy is to raise funds at the most stable and lowest possible cost for the benefit of its borrowers. ADB uses financial derivative instruments in connection with its borrowing activities to increase cost efficiency, while achieving risk management objectives. Currency and interest rate swaps enable ADB to raise operationally needed currencies in a cost-efficient way and to maintain its borrowing presence in the major capital markets. Interest rate swaps are used to reduce interest rate mismatches arising from lending and liquidity operations.
Refer to OCR-7 for Summary Statement of Borrowings.
NOTE K— CAPITAL STOCK, CAPITAL TRANSFERRED TO ASIAN DEVELOPMENT FUND, MAINTENANCE OF VALUE OF CURRENCY HOLDINGS, AND MEMBERSHIP
Capital Stock
On 29 April 2009, the Board of Governors of ADB adopted Resolution No. 336 increasing ADB’s authorized capital stock by 7,092,622 shares (200%), and the corresponding subscriptions for such increase by its members. Each member is entitled to subscribe for that number of additional shares equivalent to 200% of its allocated shares immediately prior to the effective date of the Resolution. Each member may subscribe for the additional shares at any time up to 31 December 2010. On 26 January 2011, the Board of Directors approved the extension of the subscription deadline for the Fifth General Capital Increase (GCI V) to 30 June 2011. A further extension of the GCI V subscription period until 30 September 2011 was approved by the Board of Directors on 1 August 2011.
The authorized capital stock of ADB as of 31 December 2011 consists of 10,638,933 shares (10,638,933 – 2010), of which 10,583,580 shares (9,347,201 – 2010) have been subscribed by members. Of the subscribed shares, 10,052,666 (8,865,741 – 2010) are “callable” and 530,914 (481,460 – 2010) are “paid-in”. The “callable” share capital is subject to call by ADB only as and when required to meet ADB’s obligations incurred on borrowings of funds for inclusion in its OCR or on guarantees chargeable to such resources. The “paid-in” share capital has been paid or is payable in installments, partly in convertible currencies and partly in the currency of the subscribing member which may be convertible. In accordance with Article 6, paragraph 3 of the Charter, ADB accepts nonnegotiable, noninterest-bearing demand obligations in satisfaction of the portion payable in the currency of the member, provided such currency is not required by ADB for the conduct of its operations. Nonnegotiable, noninterest-bearing demand obligations received on demand amounted to $282,001,000 ($217,396,000 – 2010), while those notes received with fixed encashment schedules totaled $296,990,000 ($123,734,000 – 2010).

asian DEVELOpMEnt BanK—ORDinaRy capitaL REsOURcEs
NOTES TO FINANCIAL STATEMENTS31 December 2011 and 2010
Asian Development Bank Annual Report 2011
82
As of 31 December 2011, all matured installments amounting to $5,322,254,000 ($4,329,825,000 – 2010) were received. Installments not due aggregating $2,828,710,000 ($3,084,711,000 – 2010) are as follows:
For the year ending 31 December:
2012 $ 748,779,000
2013 845,700,000
2014 845,700,000
2015 388,497,000
2016 34,000
$2,828,710,000
Capital Transferred to Asian Development Fund
Pursuant to the provisions of Article 19, paragraph 1(i) of the Charter, the Board of Governors has authorized the setting aside of 10% of the unimpaired “paid-in” capital paid by members pursuant to Article 6, paragraph 2(a) of the Charter and of the convertible currency portion paid by members pursuant to Article 6, paragraph 2(b) of the Charter as of 28 April 1973 to be used as a part of the Special Funds of ADB. The resources so set aside amounting to $73,094,000 as of 31 December 2011 ($73,320,000 – 2010) expressed in terms of the SDR on the basis of $1.53527 ($1.54003 – 2010) per SDR ($57,434,000 in terms of $1.20635 per 1966 dollar—Note B), were allocated and transferred to the Asian Development Fund.
Maintenance of Value of Currency Holdings
Prior to 1 April 1978, the effective date of the Second Amendment to the IMF Articles, ADB implemented maintenance of value (MOV) in respect of holdings of member currencies in terms of 1966 dollars, in accordance with the provisions of Article 25 of the Charter and relevant resolutions of the Board of Directors. Since then, settlement of MOV has been put in abeyance.
In as much as the valuation of ADB’s capital stock and the basis of determining possible MOV obligations are still under consideration, notional amounts have been calculated provisionally in terms of the SDR as receivable from or payable to members in order to maintain the value of members’ currency holdings. The notional MOV amounts of receivables and payables are offset against one another and shown as net notional amounts required to maintain value of currency holdings in the “CAPITAL AND RESERVES” portion of the Balance Sheet. The carrying book value for such receivables and payables approximates its fair value.
The net notional amounts as of 31 December 2011 consisted of (i) the increase of $1,044,331,000 ($835,309,000 – 2010) in amounts required to maintain the value of currency holdings to the extent of matured and paid-in capital subscriptions due to the increase in the value of the SDR in relation to the United States dollar during the period from 1 April 1978 to 31 December 2011 and (ii) the net

OcR-9
cOntinUED
Ordinary Capital Resources
83
decrease of $448,525,000 ($416,123,000 – 2010) in the value of such currency holdings in relation to the United States dollar during the same period. In terms of receivable from and payable to members, they are as follows:
2011 2010
Notional MOV Receivables $1,132,513,000 $ 906,821,000
Notional MOV Payables 536,707,000 487,635,000
total $ 595,806,000 $419,186,000
Membership
As of 31 December 2011 and 2010, ADB’s shareholders consist of 67 member countries, 48 countries from the region and 19 countries from outside the region (OCR-8).
NOTE L—RESERVES
Ordinary Reserve and Net Income
Under the provisions of Article 40 of the Charter, the Board of Governors shall determine annually what part of the net income shall be allocated, after making provision for reserves, to surplus and what part, if any, shall be distributed to the members.
In May 2011, the Board of Governors approved the allocation of 2010 net income of $614,489,000, after appropriation of guarantee fees to special reserve, as follows: (i) $45,900,000 be transferred from Loan Loss Reserve; (ii) $77,779,000 representing the ASC 815/825 adjustments and the unrealized portion of net income from equity investments accounted under equity method, to Cumulative Revaluation Adjustments account; (iii) $422,610,000 to Ordinary Reserve; (iv) $120,000,000 to Asian Development Fund (ADF); and (v) $40,000,000 to Technical Assistance Special Fund (TASF).
In May 2010, $447,607,000 and $247,162,000 were transferred from Cumulative Revaluation Adjustments Account and Loan Loss Reserve, respectively, and added to the net loss of OCR for 2009 of $36,725,000 and were allocated as follows: (i) $230,882,000 to Ordinary Reserve; (ii) $247,162,000 to Surplus; (iii) $120,000,000 to Asian Development Fund; (iv) $40,000,000 to Technical Assistance Special Fund; and (v) $10,000,000 each to Regional Cooperation and Integration Fund and Climate Change Fund.
The restatement of the capital stock for purposes of these financial statements on the basis of the SDR instead of the 1966 dollar (Note B) resulted in a net credit of $6,925,000 to the Ordinary Reserve during the year ended 31 December 2011 (net credit of $9,771,000 – 2010). That credit is the decrease in the value of the matured and paid-in capital subscriptions caused by the change during the year in the value of the SDR in relation to the United States dollar not allocated to members as notional maintenance of value adjustments in accordance with resolutions of the Board of Directors.

asian DEVELOpMEnt BanK—ORDinaRy capitaL REsOURcEs
NOTES TO FINANCIAL STATEMENTS31 December 2011 and 2010
Asian Development Bank Annual Report 2011
84
Cumulative Revaluation Adjustments Account
In May 2002, the Board of Governors approved the allocation of net income representing the cumulative net unrealized gains (losses) on derivatives, as required by ASC 815 to a separate category of Reserves – “Cumulative Revaluation Adjustments Account.” Beginning 2008, the unrealized portion of net income from equity investments accounted under equity method is also transferred to this account. During 2011, the 2010 net unrealized gains on derivatives of $42,738,000 (net unrealized losses on derivatives of $466,215,000 – 2010) and net gains from equity investments accounted under equity method of $35,041,000 ($18,608,000 – 2010) resulted in the credit balance of the Cumulative Revaluation Adjustments account at 31 December 2011 to $261,300,000 ($183,521,000 – 2010).
Special Reserve
The Special Reserve includes commissions on loans and guarantee fees received, which are required to be set aside pursuant to Article 17 of the Charter to meet liabilities on guarantees. For the year ended 31 December 2011, guarantee fees amounting to $15,722,000 ($11,322,000 – 2010) were appropriated to Special Reserve.
Loan Loss Reserve
In 2004, the Board of Directors approved the setting aside of Loan Loss Reserve as part of Capital and Reserves to be used as a basis for capital adequacy against the estimated expected loss in ADB’s sovereign loans and guarantees portfolio. In 2006, the Board of Directors extended this policy to nonsovereign loans and guarantees.
In 2011, the estimated loan loss reserve requirement was $200,100,000 resulting from a decrease in expected loss of $45,900,000. The estimated expected loss is determined using ADB’s credit risk model net of allowance for loan losses recorded in the balance sheet.
Surplus
Surplus represents funds for future use to be determined by the Board of Governors. In 2011, there was no additional allocation to surplus.
Comprehensive Income
Comprehensive income has two major components: net income and other comprehensive income comprising gains and losses affecting equity that, under accounting principles generally accepted in the United States of America, are excluded from net income. Other comprehensive income includes items such as the effects of the implementation of ASC 815, unrealized gains and losses on financial instruments classified as available for sale, translation adjustments, and pension and postretirement liability adjustment.

OcR-9
cOntinUED
Ordinary Capital Resources
85
The changes in Accumulated Other Comprehensive Loss balances for the years ended 31 December 2011 and 2010 expressed in thousands of US dollars are as follow:
asc 815adjustments
and amortizations
accumulated translation
adjustments
Unrealized investment holding
gains (Losses)
pension/postretirement Liability adjustment-
asc 715 & 958
accumulated Other comprehensive (Loss) income
2011 2010 2011 2010 2011 2010 2011 2010 2011 2010
Balance, 1 January $ – $(1,620) $125,727 $ 6,747 $742,256 $683,627 $(921,328) $(646,437) $ (53,345) $ 42,317
Changes from period activity – 1,620 18,358 118,980 (124,678) 58,629 (261,605) (274,891) (367,925) (95,662)
Balance, 31 December $ – $ – $144,085 $125,727 $617,578 $742,256 $(1,182,933) $(921,328) $(421,270) $(53,345)
NOTE M—INCOME AND EXPENSES
Total income from loans for the year ended 31 December 2011 was $649,599,000 ($680,479,000 – 2010). The average yield on the loan portfolio during the year was 1.34% (1.61% – 2010), excluding premium received on prepayment and other loan income. Premium on prepaid loans during 2011 amounted to $334,000 ($6,000 – 2010).
Total income from investments including net realized gains on sales, net unrealized losses on derivatives, and interest earned for securities transferred under repurchase agreements and resale arrangements for the year ended 31 December 2011 was $432,663,000 ($401,406,000 – 2010). The annualized rate of return on the average investments held during the year, based on the portfolio held at the beginning and end of each month, was 2.04% (2.17% – 2010) excluding unrealized gains and losses on investments and 2.20% (2.20% – 2010) including unrealized gains and losses on investments.
Including net realized gains, equity investment operations resulted in a net income of $164,644,000 ($106,505,000 – 2010) for the year ended 31 December 2011, excluding equity investments related expenses. This included a total of $28,989,000 share in the net gains of investee companies accounted under equity method; and dividend income, gains on disposals, and other income of $14,081,000, $122,723,000, and $961,000, respectively, offset by $2,109,000 impairment losses mostly associated with restructured accounts.
Income from other sources primarily included income received as executing agency amounting to $9,189,000 ($13,888,000 – 2010), interest income earned on bank accounts, staff accounts, and various securities from troubled debt restructuring totaled $6,621,000 ($4,800,000 – 2010), and reversals of expenses charged to prior years of $4,437,000 ($4,502,000 – 2010). These were offset by the impairment losses on debt securities amounting to $19,798,000 ($2,959,000 – 2010).
Total borrowing expense of $362,419,000 ($384,603,000 – 2010) consisted of interest expense of $352,800,000 ($369,592,000- 2010), amortization of borrowings’ issuance costs and other expenses

asian DEVELOpMEnt BanK—ORDinaRy capitaL REsOURcEs
NOTES TO FINANCIAL STATEMENTS31 December 2011 and 2010
Asian Development Bank Annual Report 2011
86
of $15,116,000 ($16,456,000 – 2010), and net realized gains on redemption of bonds of $5,497,000 ($1,444,000 – 2010).
Total depreciation expense incurred for the year ended 31 December 2011 amounted to $18,653,000 ($16,904,000 – 2010).
ADB leases office spaces and other assets. Rental expenses under operating leases for the years ended 31 December 2011 and 2010 were $9,485,000 and $8,321,000, respectively. The minimum rental payments required under operating leases that have initial or noncancelable lease terms in excess of one year as of 31 December 2011 are as follows:
year ending 31 December Minimum future rentals
2012 $5,778,000
2013 5,005,000
2014 3,428,000
2015 1,844,000
Later years 1,433,000
Administrative expenses (other than those pertaining directly to ordinary operations and special operations) for the year ended 31 December 2011 were apportioned between OCR and ADF in proportion to the relative volume of operational activities. Of the total administrative expenses of $589,811,000 ($494,209,000 – 2010), $254,829,000 ($225,911,000 – 2010) was charged to ADF. The balance of administrative expenses after allocation charged to OCR was reduced by the deferral of direct loan origination costs of $19,037,000 ($12,800,000 – 2010) related to new loans made effective for the year ended 31 December 2011 (Note B).
For the year ended 31 December 2011, write back of $7,395,000 ($44,713,000 – 2010) consisted of $5,657,000 additional loan loss provision ($40,390,000 – 2010) and $13,052,000 ($85,103,000 – 2010) write backs.
Net unrealized gains incorporated $1,316,000 net gains (net losses of $5,414,000 – 2010) from the translation adjustments of financial instruments denominated in non-functional currencies (Brazilian real, Mexican peso, and South African rand) and net unrealized gains on derivatives of $4,367,000 ($48,152,000 unrealized gains – 2010), which were made up of:
2011 2010
Unrealized gains (losses) on:
Borrowings and related swaps $30,161,000 $28,416,000
Investments related swaps (20,803,000) (873,000)
Loan related swaps (8,605,000) 21,342,000
FX forward – (1,000)
FX swaps 3,892,000 975,000
Amortization of the ASC 815 transition adjustment (278,000) (1,707,000)
total $ 4,367,000 $48,152,000

OcR-9
cOntinUED
Ordinary Capital Resources
87
NOTE N—RELATED PARTY TRANSACTIONS
At 31 December 2011 and 2010, ADB had the following receivables from/payables to special funds and externally funded trust funds under ADB administration (Agency Trust Funds) resulting from administrative arrangements and operating activities which are included in “Miscellaneous” under “OTHER ASSETS” and “ACCOUNTS PAYABLE AND OTHER LIABILITIES”:
2011 2010
amounts receivable from:
Asian Development Fund (Note M) $41,432,000 $28,628,000
Technical Assistance Special Fund 2,000 95,000
Japan Special Fund 12,000 134,000
Asian Development Bank Institute 174,000 267,000
Asian Tsunami Fund 7,000 225,000
Pakistan Earthquake Fund 50,000 54,000
Regional Cooperation and Integration Fund 76,000 44,000
Climate Change Fund 8,000 53,000
Asia Pacific Disaster Response Fund 7,000 56,000
Agency Trust Funds—net 4,421,000 1,651,000
Staff Retirement Plan – 343,000
total $46,189,000 $31,550,000
amounts payable to:
Staff Retirement Plan $ 7,566,000 $ –
NOTE O—STAFF RETIREMENT PLAN AND POSTRETIREMENT MEDICAL BENEFITS
Staff Retirement Plan
ADB has a contributory defined benefit Staff Retirement Plan (the Plan). Every employee, as defined under the Plan, shall, as a condition of service, become a participant from the first day of service, provided that at such a date, the employee has not reached the normal retirement age of 60. The Plan applies also to members of the Board of Directors who elect to join the Plan. Retirement benefits are based on length of service and highest average two years’ remuneration during eligible service. The Plan assets are segregated and are not included in the accompanying Balance Sheet. The costs of administering the Plan are absorbed by ADB, except for fees paid to the investment managers and related charges, including custodian fees, which are borne by the Plan.
Participants hired on or before 30 September 2006 are required to contribute 9 1/3% of their salary to the Plan while those hired after that date are not required to contribute to the plan. Participants may also make discretionary contributions. ADB’s contribution is determined at a rate sufficient to cover that part of the costs of the Plan not covered by the participants’ contributions.

asian DEVELOpMEnt BanK—ORDinaRy capitaL REsOURcEs
NOTES TO FINANCIAL STATEMENTS31 December 2011 and 2010
Asian Development Bank Annual Report 2011
88
Expected Contributions
ADB’s contribution to the SRP varies from year to year, as determined by the Pension Committee, which bases its judgment on the results of annual actuarial valuations of the assets and liabilities of the SRP. The expected amount of contributions to the Plan for 2012 amounts to $88,111,000 representing ADB’s contributions of $43,903,000, based on budgeted contribution of 21%, participants’ mandatory contribution of $11,808,000 and discretionary contributions of $32,400,000.
Investment Strategy
Contributions in excess of current benefits payments are invested in international financial markets and in a variety of investment vehicles. The Plan employs eight external asset managers and one global custodian who function within the guidelines established by the Plan’s Investment Committee. The investment of these assets, over the long term, is expected to produce higher returns than short-term investments. The investment policy incorporates the Plan’s package of desired investment return and tolerance for risk, taking into account the nature and duration of the Plan’s liabilities. The Plan’s assets are diversified among different markets and different asset classes. The use of derivatives for speculation, leverage or taking risks is prohibited. Selected derivatives are used for hedging and transactional efficiency purposes.
The Plan’s investment policy is periodically reviewed and revised to reflect the best interest of the Plan’s participants and beneficiaries. The current policy, adopted in January 2011, specifies an asset-mix structure of 70% of assets in equities and 30% in fixed income securities. At present, investments of the Plan’s assets are divided into three categories: US equity, Non-US equity, and Global fixed income.
All investments excluding time deposits are valued using market prices. Time deposits are reported at cost which is a reasonable estimate of fair value. Fixed income securities include US government and non-US government or government-guaranteed obligations, corporate bonds and time deposits. Other assets include forward exchange contracts in various foreign currencies transacted to hedge currency exposure in the investment portfolio, which are reported at fair value. The Plan’s long-term target asset-mix is 40% US equity, 30% non-US equity and 30% global fixed income.
For the year ended 31 December 2011 the net return on the Plan assets was negative 0.9% (11.4% – 2010). ADB expects the long-term rate of return on the assets to be 7.5% (8.0% – 2010).
Assumptions
The assumed overall rate of return takes into account long-term return expectations of the underlying asset classes within the investment portfolio mix, and the expected duration of the Plan’s liabilities. Return expectations are forward looking and, in general, not much weight is given to short-term experience. Unless there is a drastic change in investment policy or market environment, as well as in the liability/benefit policy side, the assumed investment return of 7.5% on the Plan’s assets is expected to remain broadly the same, year to year.
Actuarial assumptions based on the 2005–2009 experience was used as the basis for the actuarial valuation as of 31 December 2011 and 2010. These include rates of withdrawal, incapacity retirement rates, mortality rates, percent of international staff who commute, currency reserve, and pattern of discretionary benefits withdrawal.

OcR-9
cOntinUED
Ordinary Capital Resources
89
Postretirement Medical Benefits Plan
In 1993, ADB adopted a cost-sharing plan for retirees’ medical insurance premiums. Under the plan, ADB is obligated to pay 75% of the Group Medical Insurance Plan premiums for retirees, including retired members of the Board of Directors, and their eligible dependents who elected to participate. The cost-sharing plan is currently unfunded.
Generally accepted accounting principles require an actuarially determined assessment of the periodic cost of postretirement medical benefits.
The following table sets forth the pension and postretirement medical benefits at 31 December 2011 and 2010:
pension Benefits postretirement Medical Benefits
2011 2010 2011 2010
Change in projected benefit obligation:
Projected benefit obligation at beginning of year $ 2,219,073,000 $1,823,287,000 $ 273,085,000 $ 193,718,000
Service cost 62,795,000 50,306,000 14,466,000 7,616,000
Interest cost 124,079,000 107,867,000 15,661,000 11,950,000
Plan participants’ contributions 53,516,000 41,479,000 – –
Actuarial loss 157,104,000 262,420,000 22,318,000 62,402,000
Benefits paid (89,093,000) (66,286,000) (2,899,000) (2,601,000)
Projected benefit obligation at end of year $ 2,527,474,000 $2,219,073,000 $ 322,631,000 $ 273,085,000
Change in plan assets:
Fair value of plan assets at beginning of year $ 1,323,904,000 $1,113,539,000 $ – $ –
Actual return on plan assets (11,442,000) 135,535,000 – –
Employer’s contribution 101,041,000 99,637,000 2,899,000 2,601,000
Plan participants’ contributions 53,516,000 41,479,000 – –
Benefits paid (89,093,000) (66,286,000) (2,899,000) (2,601,000)
Fair value of plan assets at end of year $1,377,926,000 $1,323,904,000 $ – $ –
Funded status $(1,149,548,000) $ (895,169,000) $(322,631,000) $(273,085,000)
continued on next page

asian DEVELOpMEnt BanK—ORDinaRy capitaL REsOURcEs
NOTES TO FINANCIAL STATEMENTS31 December 2011 and 2010
Asian Development Bank Annual Report 2011
90
pension Benefits postretirement Medical Benefits
2011 2010 2011 2010
Amounts recognized in the
Balance sheet consist of:
Current liabilities – – (6,418,000) (5,620,000)
Noncurrent liabilities (1,149,548,000) (895,169,000) (316,213,000) (267,465,000)
Net amount recognized $(1,149,548,000) $(895,169,000) $(322,631,000) $(273,085,000)
Amounts recognized in the
Accumulated other comprehensive
income consist of:
Net actuarial loss $ 1,090,554,000 $ 846,791,000 $ 92,376,000 $ 73,571,000
Prior service cost (credit) – 3,675,000 – (2,710,000)
Total amount recognized $ 1,090,554,000 $ 850,466,000 $ 92,376,000 $ 70,861,000
Weighted-average assumptions
as of 31 December
Discount rate 5.05% 5.50% 5.05% 5.50%
Expected return on plan assets 7.50% 8.00% N/A N/A
Rate of compensation increase
varies with age and averages 4.00% 5.25% 4.00% 5.25%
For measurement purposes, a 7.0% annual rate of increase in the per capita cost of covered health care benefits was assumed for the valuation as of 31 December 2011. The rate was assumed to decrease gradually to 5.0% for 2016 and remain at that level thereafter.
pension Benefits postretirement Medical Benefits
2011 2010 2011 2010
Components of net periodic benefit cost:
Service cost $ 62,795,000 $ 50,306,000 $14,466,000 $ 7,616,000
Interest cost 124,079,000 107,867,000 15,661,000 11,950,000
Expected return on plan assets (116,831,000) (101,449,000) – –
Amortization of prior service cost 3,675,000 4,079,000 (2,710,000) (8,646,000)
Recognized actuarial loss 41,614,000 20,390,000 3,513,000 –
net periodic benefit cost $115,332,000 $ 81,193,000 $30,930,000 $10,920,000
table continued

OcR-9
cOntinUED
Ordinary Capital Resources
91
The accumulated benefit obligation of the pension plan as of 31 December 2011 was $2,361,800,000 ($2,032,169,000 – 2010).
The estimated net loss for the defined benefit pension plans that will be amortized from accumulated other comprehensive income into net periodic benefit cost over the next fiscal year amounted to $57,980,000. The estimated net loss for the other postretirement benefits plan that will be amortized from accumulated other comprehensive income into net periodic benefit cost over the next fiscal year is $4,544,000.
A one-percentage-point change in assumed health care trend rates would have the following effects:
1-percentage- point increase
1-percentage- point Decrease
Effect on total service and interest cost components $ 7,989,000 $ (5,998,000)
Effect on postretirement benefit obligation 68,433,000 (53,222,000)
Estimated Future Benefits Payments
The following table shows the benefit payments expected to be paid in each of the next five years and subsequent five years. The expected benefit payments are based on the same assumptions used to measure the benefit obligation at 31 December 2011:
pension Benefitspostretirement
Medical Benefits
2012 $100,235,000 $ 6,418,000
2013 103,190,000 7,268,000
2014 107,241,000 8,103,000
2015 113,954,000 8,996,000
2016 120,592,000 9,923,000
2017–2021 743,726,000 65,194,000
Fair Value Hierarchy
ASC 820 establishes a fair value hierarchy that gives the highest priority to quoted prices in active markets for identical assets or liabilities (Level 1), next priority to observable market inputs or market corroborated data (Level 2), and the lowest priority to unobservable inputs without market corrobo-rated data (Level 3). ASC 820 requires the fair value measurement to maximize the use of market observable inputs.

asian DEVELOpMEnt BanK—ORDinaRy capitaL REsOURcEs
NOTES TO FINANCIAL STATEMENTS31 December 2011 and 2010
Asian Development Bank Annual Report 2011
92
The fair value of the plan assets measured at fair value on a recurring basis of ADB’s pension plan as of 31 December 2011 and 2010 were reported based on the following:
Fair Value Measurements
Quoted prices in active Markets
for identical assets
significant Market Observable
inputs
significant Unobservable
inputs31 December 2011 (Level 1) (Level 2) (Level 3)
assets
Corporate equity securities $ 902,957,000 $ 902,945,000 $ – $ 12,000
Government or government- guaranteed securities 190,652,000 180,808,000 4,723,000 5,121,000
Corporate debt securities 157,809,000 128,546,000 23,029,000 6,234,000
Asset/mortgage-backed securities 63,435,000 42,446,000 13,983,000 7,006,000
Temporary investments and time deposits 35,021,000 27,291,000 7,730,000 –
Interest rate swaps—net 123,000 – – 123,000
Futures—net 127,000 127,000 – –
Foreign exchange contracts—net 4,424,000 – 4,424,000 –
total assets at fair value $1,354,548,000 $1,282,163,000 $ 53,889,000 $18,496,000
Liabilities
Foreign exchange contracts—net $ – $ – $ – $ –
Fair Value Measurements
Quoted prices in active Markets
for identical assets
significant Market Observable
inputs
significant Unobservable
inputs31 December 2010 (Level 1) (Level 2) (Level 3)
assets
Corporate equity securities $ 903,609,000 $ 903,609,000 $ – $ –
Government or government- guaranteed securities 139,222,000 119,215,000 20,007,000 –
Corporate debt securities 107,114,000 803,000 106,311,000 –
Asset/mortgage-backed securities 185,698,000 – 185,698,000 –
Temporary investments and time deposits 40,853,000 – 40,853,000 –
total assets at fair value $1,376,496,000 $1,023,627,000 $352,869,000 $ –
Liabilities
Foreign exchange contracts—net $ 29,000 $ – $ 29,000 $ –

OcR-9
cOntinUED
Ordinary Capital Resources
93
The table below provides the details of all inter-level transfers for the year ended 31 December 2011:
Level 1 Level 2
Investments
Government or government-guaranteed obligations
Transfers into (out of) $11,957,000 $(11,957,000)
Corporate debt securities
Transfers into (out of) 38,458,000 (38,458,000)
Asset/mortgage-backed securities
Transfers into (out of) 12,336,000 (12,336,000)
$62,751,000 $(62,751,000)
Government or government-guaranteed obligations, corporate debt securities, and asset/mortgage-backed securities totaling $62,751,000 were transferred from Level 2 to 1.
Assets measured at fair value on a recurring basis using significant unobservable inputs (Level 3):
investments
corporate equity
securities
government or government- guaranteed obligations
corporate debt
securities
asset/ Mortgage-
backed securities
interest rate swaps
Balance, 31 December 2010 $ – $ – $ – $ – $ –
Total realized/unrealized (losses)/gains in:
Net increase in net assets available for benefits (56,000) 384,000 (267,000) 107,000 123,000
Purchases 68,000 900,000 6,501,000 3,818,000 –
Sales/Maturities – – – – –
Settlement and others – – – – –
Transfers into Level 3 – 3,837,000 – 3,081,000 –
Balance, 31 December 2011 $ 12,000 $5,121,000 $6,234,000 $7,006,000 $123,000
Total unrealized (losses)/gains included in income related to financial assets and liabilities still held at the reporting date $(56,000) $ 384,000 $ (267,000) $ 107,000 $ 123,000
During 2011, ADB enhanced the approach for determining the fair value hierarchy of liquidity portfolio investments by introducing additional pricing sources and strengthening the internal analytics. The enhanced methodology provided more robust support for market observable inputs in pricing. Transfers into Level 3 in 2011 are primarily the result of refining ADB’s valuation approach.

asian DEVELOpMEnt BanK—ORDinaRy capitaL REsOURcEs
NOTES TO FINANCIAL STATEMENTS31 December 2011 and 2010
Asian Development Bank Annual Report 2011
94
NOTE P—FAIR VALUE OF FINANCIAL INSTRUMENTS
The carrying amounts and estimated fair values of ADB’s financial instruments as of 31 December 2011 and 2010 are summarized below:
2011 2010
carrying amounta
Estimated Fair Value
carrying amounta
Estimated Fair Value
On-balance sheet financial instruments:
ASSETS:
Due from banks $ 187,989,000 $ 187,989,000 $ 114,648,000 $ 114,648,000
Investments (Note D) 21,508,269,000 21,508,269,000 18,253,359,000 18,253,359,000
Securities transferred under repurchase agreement 330,044,000 330,044,000 707,851,000 707,851,000
Securities purchased under resale arrangement 395,498,000 395,498,000 318,228,000 318,228,000
Loans outstanding (Note E) 49,759,260,000 51,378,685,000 45,943,811,000 47,418,894,000
Equity investments (Note G) 970,622,000 970,622,000 1,108,198,000 1,108,198,000
Receivable from swaps - borrowings (Note H) 31,373,104,000 31,373,104,000 29,475,685,000 29,475,685,000
Receivable from swaps - others (Note H) 6,220,207,000 6,220,207,000 1,781,058,000 1,781,058,000
Other assets
Swap related collateral 1,942,954,000 1,942,954,000 1,588,350,000 1,588,350,000
Future guarantee receivable 13,857,000 13,857,000 17,604,000 17,604,000
LIABILITIES:
Borrowings (Note J) 58,834,767,000 59,994,911,000 52,386,484,000 53,176,587,000
Payable for swaps -
borrowings (Note H) 27,465,365,000 27,465,365,000 25,775,013,000 25,775,013,000
Payable for swaps -
others (Note H) 6,576,366,000 6,576,366,000 2,077,841,000 2,077,841,000
Other liabilities
Payable for swap
related collateral 1,942,954,000 1,942,954,000 1,588,350,000 1,588,350,000
Guarantee liability 13,857,000 13,857,000 17,604,000 17,604,000
a The carrying amount for borrowings and swaps are inclusive of accrued interest.

OcR-9
cOntinUED
Ordinary Capital Resources
95
Estimated Fair Value
2011 2010
Off-balance sheet financial instruments:
ASSETS:
Future guarantee receivable $19,031,000 $20,153,000
LIABILITIES:
Guarantee liability 19,031,000 20,153,000
The Fair Value Option
Effective 1 January 2008, ADB elected the Fair Value Option on all borrowings with associated derivative instruments. This election allows ADB to apply a consistent accounting treatment between borrowings and their related swaps. ADB continues to report its loans and borrowings that are not swapped at amortized cost and reports most of its investments (except time deposits that are recorded at cost) at fair value.
Fair Value Hierarchy
ASC 820 establishes a fair value hierarchy that gives the highest priority to quoted prices in active markets for identical assets or liabilities (Level 1), next priority to observable market inputs or market corroborated data (Level 2), and the lowest priority to unobservable inputs without market corroborated data (Level 3). ASC 820 requires the fair value measurement to maximize the use of market observable inputs. Inter-level transfers from one year to another may occur due to changes in market activities affecting the availability of quoted market prices or observable market data.
Fair Value Measurement
ASC 820 defines fair value as the price that would be received to sell an asset or paid to transfer a liability at measurement date (exit price) in an orderly transaction among willing participants with an assumption that the transaction takes place in the entity’s principal market, the most advantageous market for the asset or liability. The most advantageous market is the market where the sale of the asset or transfer of liability would maximize the amount received for the asset or minimize the amount paid to transfer the liability. The fair value measurement is not adjusted for transaction cost.
ADB determines fair values using inputs based on quoted or observable market prices and discounted cash flow models. Inputs for the models are based on observable market data such as yield curves, interest rates, volatilities, credit curves, and foreign exchange rates. Parameters and models used for valuation are subject to internal review and periodic external validation.
Following guidelines are applied in determining the fair values of financial instruments:
Borrowings and associated derivative instruments. Structured borrowings issued by ADB are valued through the use of market data inputs and financial models that discount future cash flows and simulated expected cash flows for embedded options. These involve the use of pay-off profiles

asian DEVELOpMEnt BanK—ORDinaRy capitaL REsOURcEs
NOTES TO FINANCIAL STATEMENTS31 December 2011 and 2010
Asian Development Bank Annual Report 2011
96
within the realm of accepted market valuation models such as Hull-White and Black and Scholes, as applicable. Non-structured swapped borrowings, forward foreign exchange, interest rate, and cross currency swap contracts are fair valued with observable market inputs using discounted cash flow models. Market observable inputs, such as yield curves, foreign exchange rates, basis spreads, credit spreads, cross currency rates, and volatilities are applied to the models to determine fair value of borrowings. Classified under Level 2 are swapped borrowings and the related derivatives for which ADB can obtain observable market inputs in the form of primary broker quotes for similar debt instruments. Included in Level 3 category are swapped borrowings fair valued using significant unobservable inputs, including derived credit spreads for currencies that have no available quotes in the market.
Investments, asset swaps, repurchase agreements, and resale arrangements. Readily marketable investments fair values using active market quotes in Level 1 category. Level 2 category includes investments and repurchase agreements fair valued with market observable inputs. Included in Level 3 category are investments fair valued using unobservable inputs including prices provided by third parties such as independent pricing services, custodians, and asset managers. Forward foreign exchange, interest rate, and cross currency swap contracts are fair valued with observable market inputs using discounted cash flow models. Market observable inputs, such as yield curves, foreign exchange rates, basis spreads, cross currency rates, and volatilities are applied to the models to determine fair value of investments.
Equity investments. Readily marketable equity investments are fair valued using quoted prices in active markets (Level 1).
The fair values of the following financial assets and liabilities measured at fair value on a recurring basis were reported based on the following as of 31 December 2011 and 2010:
Fair Value Measurements
Quoted prices in active Markets
for identical assets
significant Market Observable
inputs
significant Unobservable
inputs31 December 2011 (Level 1) (Level 2) (Level 3)
assets
Investments
Government or government- guaranteed obligations $ 19,156,304,000 $ 15,454,300,000 $ 3,499,267,000 $ 202,737,000
Time deposits and other obligations of banks 1,151,963,000 – 1,151,963,000 –
Corporate obligations 1,186,472,000 670,280,000 511,588,000 4,604,000
Asset-backed/mortgage-backed securities – – – –
Others 13,530,000 5,730,000 7,194,000 606,000
Securities transferred under repurchase agreement 330,044,000 330,044,000 – –
Securities purchased under resale arrangement 395,498,000 – 395,498,000 –
Borrowings related swaps 31,373,104,000 – 25,422,716,000 5,950,388,000
Investments related swaps 5,548,840,000 – 5,548,840,000 –
continued on next page

OcR-9
cOntinUED
Ordinary Capital Resources
97
Fair Value Measurements
Quoted prices in active Markets
for identical assets
significant Market Observable
inputs
significant Unobservable
inputs31 December 2011 (Level 1) (Level 2) (Level 3)
Loans related swaps 671,367,000 – 648,866,000 22,501,000
Equity investments 297,741,000 297,741,000 – –
total assets at fair value $60,124,863,000 $16,758,095,000 $37,185,932,000 $ 6,180,836,000
Liabilities
Borrowings $54,037,988,000 $ – $47,609,798,000 $6,428,190,000
Borrowings related swaps 27,465,365,000 – 27,381,806,000 83,559,000
Investments related swaps 5,854,047,000 – 5,854,047,000 –
Loans related swaps 722,319,000 – 112,353,000 609,966,000
total liabilities at fair value $88,079,719,000 $ – $80,958,004,000 $ 7,121,715,000
Fair Value Measurements
Quoted prices in active Markets
for identical assets
significant Market Observable
inputs
significant Unobservable
inputs31 December 2010 (Level 1) (Level 2) (Level 3)
assets
Investments
Government or government- guaranteed obligations $ 13,842,500,000 $9,507,917,000 $ 774,666,000 $ 3,559,917,000
Time deposits and other obligations of banks 2,285,773,000 – 2,285,773,000 –
Corporate obligations 1,158,235,000 275,494,000 563,772,000 318,969,000
Asset-backed/mortgage-backed securities 929,577,000 – 927,083,000 2,494,000
Others 37,274,000 6,939,000 29,486,000 849,000
Securities transferred under repurchase agreement 707,851,000 707,851,000 – –
Securities purchased under resale arrangement 318,228,000 – 318,228,000 –
Borrowings related swaps 29,475,685,000 – 21,964,275,000 7,511,410,000
Investments related swaps 1,367,394,000 – 1,367,394,000 –
Loans related swaps 413,664,000 – 381,150,000 32,514,000
Equity investments 491,637,000 490,011,000 1,345,000 281,000
total assets at fair value $51,027,818,000 $10,988,212,000 $28,613,172,000 $11,426,434,000
Liabilities
Borrowings $ 48,075,055,000 $ – $ 40,197,183,000 $7,877,872,000
Borrowings related swaps 25,775,013,000 – 25,637,293,000 137,720,000
Investments related swaps 1,586,089,000 – 1,586,089,000 –
Loans related swaps 491,752,000 – 137,294,000 354,458,000
total liabilities at fair value $75,927,909,000 $ – $67,557,859,000 $ 8,370,050,000
table continued

asian DEVELOpMEnt BanK—ORDinaRy capitaL REsOURcEs
NOTES TO FINANCIAL STATEMENTS31 December 2011 and 2010
Asian Development Bank Annual Report 2011
98
The table below provides the details of all inter-level transfers for the year ended 31 December 2011 and 2010:
2011 2010
Level 1 Level 2 Level 1 Level 2
Investments
Government or government-guaranteed obligations
Transfers into (out of) $ 9,997,000 $ (9,997,000) $ 14,751,000 $(14,751,000)
Transfers (out of) into (462,234,000) 462,234,000 (73,459,000) 73,459,000
Corporate obligations
Transfers into (out of) 29,209,000 (29,209,000) – –
Transfers (out of) into (116,520,000) 116,520,000 (15,475,000) 15,475,000
$(539,548,000) $539,548,000 $(74,183,000) $ 74,183,000
Government or government-guaranteed obligations and corporate obligations totaling $578,754,000 were transferred from Level 1 to 2 ($88,934,000 – 2010) and government or government-guaranteed obligations and corporate obligations totaling $39,206,000 ($14,751,000 – 2010) were transferred from Level 2 to 1.
Assets (liabilities) measured at fair value on a recurring basis using significant unobservable inputs (Level 3):
investments
government or government-guaranteed obligations
corporate obligations
asset-backed/mortgage-backed
securities Others
Balance, 1 January 2011 $ 3,559,917,000 $318,969,000 $2,494,000 $849,000
Total gains (losses) - (realized/unrealized)
Included in earnings 216,000 (18,000) 0 –
Included in other comprehensive income (5,015,000) 120,000 0 –
Purchases 93,999,000 – – –
Sales/Maturities (1,326,221,000) – (2,356,000) –
Settlement and others – – (138,000) (243,000)
Transfers into Level 3 107,404,000 4,502,000
Transfers out of Level 3 (2,227,563,000) (318,969,000) – –
Balance, 31 December 2011 $ 202,737,000 $ 4,604,000 $ – $606,000
The amount of total gains (losses) for the period recognized in other comprehensive income attributable to the change in net unrealized gains or losses relating to assets/liabilities still held at the reporting date $ 120,000 $ 120,000 $ – $ –
0 = Less than $500.

OcR-9
cOntinUED
Ordinary Capital Resources
99
investments
government or government-guaranteed obligations
corporate obligations
asset-backed/mortgage-backed
securities Others
Balance, 1 January 2010 $ – $ – $ – $ –
Total gains (losses) - (realized/unrealized)
Included in earnings 2,636,000 (74,000) – –
Included in other comprehensive income (6,965,000) (2,143,000) – –
Purchases 1,471,283,000 300,000,000 2,494,000 849,000
Sales/Maturities – – – –
Settlement and others – – – –
Transfers into Level 3 2,092,963,000 21,186,000 – –
Balance, 31 December 2010 $3,559,917,000 $318,969,000 $2,494,000 $849,000
The amount of total gains (losses) for the period recognized in other comprehensive income attributable to the change in net unrealized gains or losses relating to assets/liabilities still held at the reporting date $ (14,028,000) $ (2,143,000) $ – $ –
Borrowings related swaps Loans related swaps
swaps receivable
swaps payable
swaps receivable
swaps payable
Balance, 1 January 2011 $7,511,410,000 $ (137,720,000) $32,514,000 $(354,458,000)
Total gains (losses) - (realized/unrealized)
Included in earnings (543,520,000) 55,456,000 (7,577,000) (12,644,000)
Included in other comprehensive income (380,073,000) (1,295,000) (2,436,000) 33,103,000
Issuances 1,079,175,000 – – (306,961,000)a
Maturities/Redemptions (1,716,604,000) – – 30,994,000
Balance, 31 December 2011 $5,950,388,000 $ (83,559,000) $22,501,000 $(609,966,000)
The amount of total gains (losses) for the period included in earnings attributable to the change in net unrealized gains or losses relating to assets/liabilities still held at the reporting date $ (104,257,000) $ 56,794,000 $ (7,776,000) $ (10,859,000)
a Includes accretion of $156,867,000.
continued on next page

asian DEVELOpMEnt BanK—ORDinaRy capitaL REsOURcEs
NOTES TO FINANCIAL STATEMENTS31 December 2011 and 2010
Asian Development Bank Annual Report 2011
100
Borrowings related swaps Loans related swaps
swaps receivable
swaps payable
swaps receivable
swaps payable
Balance, 1 January 2010 $7,306,317,000 $ (79,030,000) $28,273,000 $ (296,239,000)
Total gains (losses) - (realized/unrealized)
Included in earnings 435,107,000 (55,538,000) 3,225,000 (8,715,000)
Included in other comprehensive income 47,968,000 (3,152,000) 1,016,000 (14,964,000)
Issuances 1,877,314,000 – – (54,836,000)a
Maturities/Redemptions (2,155,296,000) – – 20,296,000
Balance, 31 December 2010 $7,511,410,000 $ (137,720,000) $32,514,000 $ (354,458,000)
The amount of total gains (losses) for the period included in earnings attributable to the change in net unrealized gains or losses relating to assets/liabilities still held at the reporting date $ (59,453,000) $ (54,646,000) $ 2,898,000 $ (8,603,000)
a Includes accretion of $4,636,000.
2011 2010
Equity investments Borrowings Equity investments Borrowings
Beginning of the period $ 281,000 $(7,877,872,000) $ – $(7,403,678,000)
Total gains (losses) - (realized/unrealized)
Included in earnings (281,000) 427,826,000 – (551,622,000)
Included in other comprehensive income – 373,524,000 – (71,865,000)
Paydowns – – 281,000 –
Issuances – (1,069,661,000) – (2,058,244,000)
Maturities/Redemptions – 1,717,993,000 – 2,207,537,000
End of the period $ – $(6,428,190,000) $ 281,000 $(7,877,872,000)
The amount of total gains (losses) for the period included in earnings attributable to the change in net unrealized gains or losses relating to assets/liabilities still held at the reporting date $ – $ 28,282,000 $ – $ (15,009,000)
During 2011, ADB enhanced the approach for determining the fair value hierarchy of liquidity portfolio investments by introducing additional pricing sources and strengthening the internal analytics. The enhanced methodology provided more robust support for market observable inputs in pricing. Transfers out of Level 3 in 2011 are primarily the result of refining ADB’s valuation approach.
All investment securities, including those under Level 3, are of high credit quality. The government or government-guaranteed obligations are largely floating rate notes and callable bonds with a credit quality rating from Standard and Poor’s of AAA to AA–. The corporate obligations are also floating rate notes with a credit quality rating from Standard and Poor’s of AAA. These valuations are provided by an independent pricing source.
table continued

OcR-9
cOntinUED
Ordinary Capital Resources
101
NOTE Q—SPECIAL AND TRUST FUNDS
ADB’s operations include special operations, which are financed from special funds resources. The OCR and special funds resources are at all times used, committed, and invested entirely separate from each other. The Board of Governors may approve allocation of the net income of OCR to special funds, based on the funding and operational requirements for the funds. The administrative and operational expenses pertaining to the OCR and special funds are charged to the respective special funds. The administrative expenses of ADB are allocated amongst OCR and special funds and are settled regularly between the OCR and the special funds.
In addition, ADB, alone or jointly with donors, administers on behalf of the donors, including members of ADB, their agencies and other development institutions, projects/programs supplementing ADB’s operations. Such projects/programs are funded with external funds administered by ADB and with external funds not under ADB’s administration. ADB charges administrative fees for external funds administered by ADB. The funds are restricted for specific uses including technical assistance to borrowers and technical assistance for regional programs. The responsibilities of ADB under these arrangements range from project processing to project implementation including the facilitation of procurement of goods and services. These funds are held in trust with ADB, and are held in a separate investment portfolio. The assets of these funds are not commingled with ADB’s resources, nor are they included in the assets of ADB.
Special funds and funds administered by ADB on behalf of the donors are not included in the assets of OCR. The breakdown of the total of such funds together with the funds of the special operations as of 31 December 2011 and 2010 is as follows:
2011 2010
total net assets
no. of Funds
total net assets
no. of Funds
special Funds
Asian Development Fund $33,054,725,000 1 $32,650,891,000 1
Technical Assistance Special Fund 225,111,000 1 248,085,000 1
Japan Special Fund 94,133,000 1 89,338,000 1
Asian Development Bank Institute 9,836,000 1 8,916,000 1
Asian Tsunami Fund 6,861,000 1 2,630,000 1
Pakistan Earthquake Fund 4,553,000 1 3,938,000 1
Regional Cooperation and Integration Fund 4,143,000 1 10,412,000 1
Climate Change Fund 14,242,000 1 19,171,000 1
Asia Pacific Disaster Response Fund 12,360,000 1 27,481,000 1
Subtotal 33,425,964,000 9 33,060,862,000 9
trust Funds
Funds administered by ADB 1,527,241,000 91 1,392,366,000 86
total $34,953,205,000 100 $34,453,228,000 95
During the year ended 31 December 2011, a total of $9,088,000 ($13,697,000 – 2010) was recorded as compensation for administering projects/programs under Trust Funds. The amount has been included in “REVENUE From other sources—net.”

asian DEVELOpMEnt BanK—ORDinaRy capitaL REsOURcEs
NOTES TO FINANCIAL STATEMENTS31 December 2011 and 2010
Asian Development Bank Annual Report 2011
102
NOTE R—VARIABLE INTEREST ENTITIES
An entity is subject to the ASC 810 VIE Subsections and is considered a variable interest entity (VIE) if it (i) lacks equity that is sufficient to permit the entity to finance its activities without additional subordinated financial support from other parties; or (ii) if holders of the equity investment at risk lack decision-making rights about the entity’s activities that most significantly impact the entity’s economic performance; or do not have the obligation to absorb the expected losses or the right to receive the expected residual returns of the entity.
A VIE is consolidated by the primary beneficiary, which is the party that has the power to direct the VIE’s activities that most significantly impact its economic performance and the obligation to absorb losses of or the right to receive benefits from the VIE that could potentially be significant to the VIE.
As of 31 December 2011, ADB did not identify any VIE in which ADB is the primary beneficiary, requiring consolidation in OCR financial statements. ADB may hold variable interests in VIE, which requires disclosures.
The review of ADB’s loan, equity investments, and guarantee portfolio has identified two (two – 2010) investments in VIEs in which ADB is not the primary beneficiary, where ADB’s investment is significant and 11 VIEs (seven – 2010) where ADB’s investment is not significant. These non-consolidated VIEs are operating entities where the total equity invested is considered insufficient to finance its activities without additional subordinated financial support. These VIEs are in the finance, telecommunication, and energy sectors.
ADB’s involvement with these non-consolidated VIEs includes loans, guarantees and equity investments. Based on the most recent available data from these VIEs at 31 December 2011, the assets of these non-consolidated VIEs where ADB’s investments are significant and insignificant totaled $484,507,000 and $1,310,632,000, respectively ($492,167,000 and $1,027,110,000, respectively – 2010).
The table below shows the carrying value of ADB interests in the non-consolidated VIEs and the maximum exposure to loss of these interests. For guarantees, the maximum exposure is the notional amount of such guarantee.
significant non-significant
2011 2010 2011 2010
carrying Value of aDB’s Variable interests
Assets $56,590,000 $90,660,000 $340,575,000 $208,774,000
Liabilities – 10,000 8,125,000 9,860,000
Maximum Exposure to Loss in non-consolidated ViEs
Loans $56,384,000 $90,444,000 $248,081,000 $161,887,000
Equity Investments 206,000 206,000 84,369,000 37,026,000
Guarantees – 1,565,000 157,945,000 184,638,000
total $56,590,000 $92,215,000 $490,395,000 $383,551,000

OcR-9
cOntinUED
Ordinary Capital Resources
103
NOTE S—SEGMENT REPORTING
Based on an evaluation of OCR’s operations, management has determined that OCR has only one reportable segment since OCR does not manage its operations by allocating resources based on a determination of the contribution to net income from individual borrowers.
The following table presents OCR’s loan, guarantee, and equity investments outstanding balances and associated revenue, by geographic region, as of and for the years ended 31 December 2011 and 2010:
2011 2010
countryOutstanding
Balance RevenueOutstanding
Balance Revenue
People’s Republic of China $12,543,421,000 $215,674,000 $11,340,632,000 $187,788,000
Indonesia 10,044,028,000 168,538,000 10,358,102,000 186,224,000
India 10,721,780,000 82,133,000 9,606,121,000 104,772,000
Philippines 6,150,159,000 67,901,000 6,079,481,000 74,913,000
Pakistan 5,672,813,000 49,111,000 5,394,121,000 46,625,000
Others 7,592,869,000 125,994,000 6,241,711,000 149,904,000
total $52,725,070,000 $709,351,000 $49,020,168,000 $750,226,000
Revenue comprises income from loan charges, earnings from equity investments, and guarantee fees.
For the year ended 31 December 2011, sovereign loans to two countries (two – 2010) generated in excess of 10 percent of revenue; this amounted to $162,394,000 and $158,802,000 ($181,194,000 and $167,372,000 – 2010).
NOTE T—SUBSEQUENT EVENTS
ADB has evaluated subsequent events after 31 December 2011 through 14 March 2012, the date these Financial Statements are available for issuance. During this period, ADB has raised additional borrowings of approximately $5.9 billion in various currencies.

Asian Development Bank Annual Report 2011
104
asian deVelOpMent Fund
MANAGEMENT’S REPORT ON INTERNAL CONTROL OVER FINANCIAL REPORTING
The management of Asian Development Bank (“ADB”) is responsible for establishing and maintaining adequate internal control over financial reporting. ADB’s internal control over financial reporting is a process designed to provide reasonable assurance regarding the reliability of financial reporting and the preparation of special purpose financial statements in accordance with accounting policies as described in Note B of the special purpose financial statements.
ADB’s internal control over financial reporting includes those policies and procedures that (i) pertain to the maintenance of records that, in reasonable detail, accurately and fairly reflect the transactions and dispositions of the assets of ADB; (ii) provide reasonable assurance that transactions are recorded as necessary to permit preparation of financial statements in accordance with accounting policies as described in Note B of the special purpose financial statements, and that receipts and expenditures of ADB are being made only in accordance with authorizations of management and directors of ADB; and (iii) provide reasonable assurance regarding prevention or timely detection of unauthorized acquisition, use, or disposition of ADB’s assets that could have a material effect on the financial statements.
Because of its inherent limitations, internal control over financial reporting may not prevent or detect misstatements. Also, projections of any evaluation of effectiveness to future periods are subject to the risk that controls may become inadequate because of changes in conditions, or that the degree of compliance with the policies or procedures may deteriorate.
ADB’s management assessed the effectiveness of ADB’s internal control over financial reporting as of 31 December 2011. In making this assessment, ADB’s management used the criteria set forth by the Committee of Sponsoring Organizations of the Treadway Commission in Internal Control – Integrated Framework. Based on that assessment, management believes that as of 31 December 2011, ADB’s internal control over financial reporting is effective based upon the criteria established in Internal Control – Integrated Framework.
Haruhiko KurodaPresident
Thierry de LonguemarVice-President (Finance and Administration)
Hiroshi FukukawaOfficer-in-Charge, Controller’s Department
14 March 2012

Asian Development Fund
105
Deloitte Touche LLPCertified Public AccountantsUnique Entity No. T08LL0721A6 Shenton Way #32-00DBS Building Tower TwoSingapore 068809
Tel: +65 6224 8288Fax: +65 6538 6166www.deloitte.com/sg
INDEPENDENT AUDITORS’ REPORT
To the Board of Directors and the Board of Governors of Asian Development Bank
We have audited management’s assertion, included in the accompanying Management’s Report on Internal Control over Financial Reporting, that Asian Development Bank (“ADB”) maintained effective internal control over financial reporting as of December 31, 2011, based on the criteria established in Internal Control — Integrated Framework issued by the Committee of Sponsoring Organizations of the Treadway Commission. ADB’s management is responsible for maintaining effective internal control over financial reporting and for its assertion of the effectiveness of internal control over financial reporting, included in the accompanying Management’s Report on Internal Control over Financial Reporting. Our responsibility is to express an opinion on management’s assertion based on our audit.
We conducted our audit in accordance with attestation standards established by the American Institute of Certified Public Accountants. Those standards require that we plan and perform the audit to obtain reasonable assurance about whether effective internal control over financial reporting was maintained in all material respects. Our audit included obtaining an understanding of internal control over financial reporting, assessing the risk that a material weakness exists, and testing and evaluating the design and operating effectiveness of internal control based on the assessed risk. Our audit also included performing such other procedures as we considered necessary in the circumstances. We believe that our audit provides a reasonable basis for our opinion.
ADB’s internal control over financial reporting is a process designed to provide reasonable assurance regarding the reliability of financial reporting and the preparation of special purpose financial statements in accordance with accounting policies as described in Note B of the special purpose financial statements. ADB’s internal control over financial reporting includes those policies and procedures that (1) pertain to the maintenance of records that, in reasonable detail, accurately and fairly reflect the transactions and dispositions of the assets of ADB; (2) provide reasonable assurance that transactions are recorded as necessary to permit preparation of financial statements in accordance with accounting policies as described in Note B of the special purpose financial statements, and that receipts and expenditures of ADB are being made only in accordance with authorizations of management and directors of ADB; and (3) provide reasonable assurance regarding prevention or timely detection of unauthorized acquisition, use, or disposition of ADB’s assets that could have a material effect on the financial statements.
Deloitte Touche LLP (Unique Entity No. T08LL0721A) is an accounting limited liability partnership registered in Singaporeunder the Limited Liability Partnerships Act (Chapter 163A).

Asian Development Bank Annual Report 2011
106
Because of the inherent limitations of internal control over financial reporting, including the possibility of collusion or improper management override of controls, material misstatements due to error or fraud may not be prevented or detected and corrected on a timely basis. Also, projections of any evaluation of the effectiveness of the internal control over financial reporting to future periods are subject to the risk that the controls may become inadequate because of changes in conditions or that the degree of compliance with the policies or procedures may deteriorate.
In our opinion, management’s assertion that ADB maintained effective internal control over financial reporting as of December 31, 2011, is fairly stated, in all material respects, based on the criteria established in Internal Control — Integrated Framework issued by the Committee of Sponsoring Organizations of the Treadway Commission.
We have also audited, in accordance with auditing standards generally accepted in the United States of America, the accompanying special purpose statement of assets, liabilities, and fund balances of Asian Development Bank (“ADB”) – Asian Development Fund as of December 31, 2011 and 2010, and the related special purpose statements of revenue and expenses, comprehensive loss, changes in fund balances and cash flows for each of the years in the two-year period ended December 31, 2011 and our report dated March 14, 2012 expressed an unqualified opinion on those special purpose financial statements.
Public Accountants and Certified Public Accountants
SingaporeMarch 14, 2012

Asian Development Fund
107
Deloitte Touche LLPCertified Public AccountantsUnique Entity No. T08LL0721A6 Shenton Way #32-00DBS Building Tower TwoSingapore 068809
Tel: +65 6224 8288Fax: +65 6538 6166www.deloitte.com/sg
INDEPENDENT AUDITORS’ REPORT
To the Board of Directors and the Board of Governors of Asian Development Bank
We have audited the accompanying special purpose statement of assets, liabilities, and fund balances of Asian Development Bank (“ADB”) – Asian Development Fund as of December 31, 2011 and 2010, and the related special purpose statements of revenue and expenses, comprehensive loss, changes in fund balances and cash flows for each of the years in the two-year period ended December 31, 2011. These special purpose financial statements are the responsibility of ADB’s management. Our responsibility is to express an opinion on these financial statements based on our audits.
We conducted our audits in accordance with auditing standards generally accepted in the United States of America. Those standards require that we plan and perform the audit to obtain reasonable assurance about whether the special purpose financial statements are free of material misstatement. An audit includes examining, on a test basis, evidence supporting the amounts and disclosures in the special purpose financial statements, assessing the accounting principles used and significant estimates made by management, as well as evaluating the overall financial statement presentation. We believe that our audits provide a reasonable basis for our opinion.
The accompanying special purpose financial statements were prepared in accordance with accounting policies as described in Note B of the special purpose financial statements and are not intended to be a presentation in conformity with accounting principles generally accepted in the United States of America.
In our opinion, such special purpose financial statements present fairly, in all material respects, the assets, liabilities, and fund balances of ADB – Asian Development Fund as of December 31, 2011 and 2010, and its revenues and expenses and cash flows for each of the years in the two-year period ended December 31, 2011, in conformity with accounting policies as described in Note B of the special purpose financial statements.
Deloitte Touche LLP (Unique Entity No. T08LL0721A) is an accounting limited liability partnership registered in Singaporeunder the Limited Liability Partnerships Act (Chapter 163A).

Asian Development Bank Annual Report 2011
108
Our audits were conducted for the purpose of forming an opinion on the 2011 and 2010 special purpose financial statements taken as a whole. The special purpose summary statement of loans as of December 31, 2011 and 2010 and special purpose statement of resources as of December 31, 2011, are presented for the purpose of additional analysis and are not a required part of the special purpose financial statements. These schedules are the responsibility of ADB’s management. Such 2011 and 2010 schedules have been subjected to the auditing procedures applied in our audit of the special purpose financial statements and, in our opinion are fairly stated in all material respects when considered in relation to the special purpose financial statements taken as a whole.
We have also audited, in accordance with attestation standards established by the American Institute of Certified Public Accountants, management’s assertion that ADB maintained effective internal control over financial reporting as of December 31, 2011, based on the criteria established in Internal Control — Integrated Framework issued by the Committee of Sponsoring Organizations of the Treadway Commission and our report dated March 14, 2012 expressed an unqualified opinion on management’s assertion that ADB maintained effective internal control over financial reporting.
This report is intended solely for the information and use of the Board of Governors, Board of Directors, management, and members of the ADB and is not intended to be used and should not be used other than by these specified parties.
Public Accountants and Certified Public Accountants
SingaporeMarch 14, 2012

Asian Development Fund
109
2011 2010
assEts
DUE FROM BANKS $ 2,559 $ 2,580
INVESTMENTS (Notes C and K)Government or government-guaranteed obligations $ 4,124,683 $ 3,431,376 Time deposits 1,672,716 5,797,399 1,837,433 5,268,809
SECURITIES PURCHASED UNDER RESALE ARRANGEMENT (Note K) 335,818 340,811
LOANS OUTSTANDING (ADF-5) (Notes D and K)Sovereign 29,514,607 28,976,937 Less—allowance for HIPC Debt Relief 78,927 29,435,680 79,918 28,897,019
ACCRUED REVENUEOn investments 44,453 45,880 On loans 66,481 110,934 72,391 118,271
OTHER ASSETS (Notes E and F) 257,765 209,012
tOtaL $35,940,155 $34,836,502
LiaBiLitiEs anD FUnD BaLancEs
PAYABLE TO RELATED FUNDS (Notes E and G) $ 41,432 $ 28,628
ADVANCE PAYMENTS ON CONTRIBUTIONS (Note F) 220,848 179,884
UNDISBURSED COMMITMENTS (Notes J and K) 2,623,150 1,975,557
DEFERRED CREDITS – 1,543
TOTAL LIABILITIES 2,885,430 2,185,612
FUND BALANCES (ADF-4) Contributions received (ADF-7)
Contributed resources (Note F) $36,515,272 $34,456,844Unamortized discount (64,691) (73,285)
36,450,581 34,383,559
Set-aside resources (Note H) 73,094 73,320 Transfers from Ordinary Capital Resources and
Technical Assistance Special Fund 1,103,556 983,636
37,627,231 35,440,515
Nonnegotiable, noninterest-bearing demand obligations on account of contribution (Note F) (2,402,167) (2,298,983)
Accumulated surplus 1,642,581 2,619,361 Accumulated other comprehensive loss (Note I) (3,812,920) 33,054,725 (3,110,003) 32,650,890
tOtaL $35,940,155 $34,836,502
The accompanying notes are an integral part of these special purpose financial statements (ADF-8).
aDF-1
asian DEVELOpMEnt BanK—asian DEVELOpMEnt FUnD
SPECIAL PURPOSE STATEMENT OF ASSETS, LIABILITIES, AND FUND BALANCES31 December 2011 and 2010 Expressed in thousands of United states Dollars

Asian Development Bank Annual Report 2011
110
2011 2010
REVENUE
From loans (Note D) $ 316,186 $ 290,518
From investments (Note C) 96,914 107,773
From other sources 142 $ 413,242 51 $ 398,342
EXPENSES
Grants (Note J) 1,120,579 651,756
Administrative expenses (Note G) 254,829 225,911
Amortization of discounts on contributions 13,362 10,547
Provision for HIPC Debt Relief (Note D) – (859)
Financial expenses 18 1,388,788 19 887,374
NET REALIZED GAINS (LOSSES)
From investments
(Including gains reclassified from other comprehensive income of $9,094 – 2011 and $811 – 2010) 9,094 854
From loans – 9,094 (169,308) (168,454)
NET UNREALIZED LOSSES (10,328) (18,999)
REVEnUE LEss than ExpEnsEs $ (976,780) $ (676,485)
The accompanying notes are an integral part of these special purpose financial statements (ADF-8).
aDF-2
asian DEVELOpMEnt BanK—asian DEVELOpMEnt FUnD
SPECIAL PURPOSE STATEMENT OF REVENUE AND EXPENSESFor the Years Ended 31 December 2011 and 2010 Expressed in thousands of United states Dollars

Asian Development Fund
111
2011 2010
REVENUE LESS THAN EXPENSES (ADF-2) $ (976,780) $ (676,485)
Other comprehensive loss (Note H)
Currency translation adjustments (687,552) (363,808)
Unrealized investment holding losses
Unrealized investment holding gains during the period (6,271) (15,848)
Less: Reclassification adjustments for gains included in net income (9,094) (811)
Total other comprehensive loss (702,917) (380,467)
cOMpREhEnsiVE LOss $(1,679,697) $(1,056,952)
The accompanying notes are an integral part of these special purpose financial statements (ADF-8).
aDF-3
asian DEVELOpMEnt BanK—asian DEVELOpMEnt FUnD
SPECIAL PURPOSE STATEMENT OF COMPREHENSIVE LOSSFor the Years Ended 31 December 2011 and 2010 Expressed in thousands of United states Dollars

Asian Development Bank Annual Report 2011
112
aDF-4
asian DEVELOpMEnt BanK—asian DEVELOpMEnt FUnD
SPECIAL PURPOSE STATEMENT OF CHANGES IN FUND BALANCESFor the Years Ended 31 December 2011 and 2010 Expressed in thousands of United states Dollars
contributed Resources
nonnegotiable, noninterest-
bearing Demand
Obligationsset-aside Resources
transfers from OcR and tasF
accumulated surplus
accumulated Other
comprehensive Loss total
Balance, 1 January 2010 $32,654,449 $(2,185,624) $74,366 $ 863,892 $3,295,846 $(2,729,536) $31,973,393
Comprehensive loss for the year 2010 (Note I) (676,485) (380,467) (1,056,952)
Change in amounts available for operational commitments
Contributed Resources 1,716,597 1,716,597 Unamortized Discount 12,513 12,513
Change in nonnegotiable, noninterest-bearing demand obligations (113,359) (113,359)
Transfer from ordinary capital resources 120,000 120,000
Change in SDR value of set-aside resources (1,046) (1,046)
Change in value of transfers from Technical Assistance Special Fund (256) (256)
Balance, 31 December 2010 $34,383,559 $(2,298,983) $73,320 $ 983,636 $2,619,361 $(3,110,003) $32,650,890
Comprehensive loss for the year 2011 (Note I) (976,780) (702,917) (1,679,697)
Change in amounts available for operational commitments
Contributed Resources 2,058,428 2,058,428 Unamortized Discount 8,594 8,594
Change in nonnegotiable, noninterest-bearing demand obligations (103,184) (103,184)
Transfer from ordinary capital resources 120,000 120,000
Change in SDR value of set-aside resources (226) (226)
Change in value of transfers from Technical Assistance Special Fund (80) (80)
Balance, 31 December 2011 $36,450,581 $(2,402,167) $73,094 $1,103,556 $1,642,581 $(3,812,920) $33,054,725
The accompanying notes are an integral part of these special purpose financial statements (ADF-8).

Asian Development Fund
113
2011 2010
CASH FLOWS FROM OPERATING ACTIVITIESInterest charges on loans received $ 299,238 $ 260,929 Interest on investments received 108,027 126,780 Interest received for securities purchased under resale arrangement 182 204 Cash received from other sources 142 51 Administrative expenses paid (242,025) (240,588)Grants disbursed (510,923) (359,341)Financial expenses paid (18) (19)
Net Cash Used in Operating Activities (345,377) (211,984)
CASH FLOWS FROM INVESTING ACTIVITIESSales of investments 197,793 127,659 Maturities of investments 143,575,619 81,364,405 Purchases of investments (144,354,526) (81,435,209)Net receipts from (payments for) securities purchased under resale arrangement 19,565 (141,261)Principal collected on loans 1,066,602 906,012 Loans disbursed (1,361,689) (1,545,875)
Net Cash Used in Investing Activities (856,636) (724,269)
CASH FLOWS FROM FINANCING ACTIVITIESContributions received and encashed1 1,082,821 813,193 Cash received from Ordinary Capital Resources 120,000 120,000
Net Cash Provided by Financing Activities 1,202,821 933,193
Effect of Exchange Rate Changes on Due from Banks (829) 2,618
Net Decrease in Due from Banks (21) (442)
Due from Banks at Beginning of Year 2,580 3,022
Due from Banks at End of Year $ 2,559 $ 2,580
RECONCILIATION OF REVENUE LESS THAN EXPENSES TO NET CASH USED IN OPERATING ACTIVITIES:
Revenue less than expenses (ADF-2) $ (976,780) $ (676,485)Adjustments to reconcile revenue less than expenses
to net cash used in operating activities:Amortization of discounts/premiums on investments 9,772 11,095 Amortization of discount under accelerated note encashment 13,362 10,547 Grants approved and effective 1,120,579 651,756 Capitalized charges on loans (23,540) (25,329)Net gain on sales of investments (9,094) (854)Provision for possible losses charged – (859)Change in disbursed grants (473,343) (352,941)Change in advances under technical assistance grants (36,901) (4,907)Change in accrued revenue on investments and loans 8,114 3,856 Change in accrued expenses 12,805 (15,658)Change in other assets (679) (512)Exchange losses—net 10,328 188,307
Net Cash Used in Operating Activities $ (345,377) $ (211,984)
Supplementary disclosure on noncash financing activities:1 Nonnegotiable, noninterest-bearing demand promissory notes amounting to $1,023,942 ($873,329 – 2010) were received from contributing members.The accompanying notes are an integral part of these special purpose financial statements (ADF-8).
aDF-5
asian DEVELOpMEnt BanK—asian DEVELOpMEnt FUnD
SPECIAL PURPOSE STATEMENT OF CASH FLOWSFor the Years Ended 31 December 2011 and 2010 Expressed in thousands of United states Dollars

Asian Development Bank Annual Report 2011
114
Borrowers/guarantors1
Loans Outstanding
Undisbursed Balances of
Effective Loans2, 3
Loans not yet
Effective4
total Loans
percent of total Loans
Afghanistan $ 638,114 $ 129,705 $ – $ 767,819 2.11
Armenia 165,285 103,241 – 268,526 0.74
Azerbaijan 46,369 7,880 – 54,249 0.15
Bangladesh 5,974,595 1,431,344 146,055 7,551,994 20.72
Bhutan 167,832 28,831 19,539 216,202 0.59
Cambodia 937,842 161,988 65,370 1,165,200 3.20
Cook Islands 28,015 2,897 – 30,912 0.08
Georgia 261,382 279,864 – 541,246 1.49
Indonesia 1,312,829 150,249 – 1,463,078 4.01
Kazakhstan 7,741 – – 7,741 0.02
Kiribati 14,035 10,956 7,216 32,207 0.09
Kyrgyz Republic 589,779 97,352 53,797 740,928 2.03
Lao People’s Democratic Republic 1,190,456 4,500 35,629 1,230,585 3.38
Maldives 98,761 25,933 – 124,694 0.34
Marshall Islands 76,416 – – 76,416 0.21
Federated States of Micronesia 50,554 8,911 – 59,465 0.16
Mongolia 611,898 86,420 62,871 761,189 2.09
Myanmar 642,287 – – 642,287 1.76
Nepal 1,588,004 396,070 149,700 2,133,774 5.86
Pakistan 6,994,680 192,456 264,707 7,451,843 20.45
Palau 3,424 – – 3,424 0.01
Papua New Guinea 278,316 248,959 86,971 614,246 1.69
Philippines 775,123 – – 775,123 2.13
Samoa 113,681 17,125 10,537 141,343 0.39
Solomon Islands 52,721 – – 52,721 0.14
Sri Lanka 2,659,314 374,533 – 3,033,847 8.33
Tajikistan 341,709 16,604 – 358,313 0.98
Tonga 39,137 – – 39,137 0.11
Tuvalu 6,920 – – 6,920 0.02
Uzbekistan 139,467 341,646 56,544 537,657 1.48
Vanuatu 55,154 – 15,172 70,326 0.19
Viet Nam 3,651,183 1,537,619 296,305 5,485,107 15.05
Regional 1,584 – – 1,584 0.00
TOTAL – 31 December 2011 $29,514,607 $ 5,655,083 $1,270,413 $36,440,103 100.00
Allowance for HIPC Debt Relief (78,927) – – (78,927)
nEt BaLancE – 31 December 2011 $29,435,680 $5,655,083 $1,270,413 $36,361,176
nEt BaLancE – 31 December 2010 $28,897,019 $5,104,341 $1,469,618 $35,470,978
1 Loans other than those made directly to a member or to its central bank have been guaranteed by the member.2 Loans negotiated before 1 January 1983 were denominated in current United States dollars. Loans negotiated after that date are denominated in Special Drawing Rights (SDR)
for the purpose of commitment. The undisbursed portions of such SDR loans are translated into United States dollars at the applicable exchange rates as of the end of a reporting period. Of the undisbursed balances, ADB has entered into irrevocable commitments to disburse various amounts totaling $43,474 ($14,357 – 2010).
3 Refer to the unwithdrawn portions of effective loans as of 31 December 2011.4 Refer to approved loans that have not become effective as of 31 December 2011, pending borrowers’ compliance with effectiveness conditions specified in the loan regulations
and the loan agreements.
asian DEVELOpMEnt BanK—asian DEVELOpMEnt FUnD
SPECIAL PURPOSE SUMMARY STATEMENT OF LOANS 31 December 2011 and 2010Expressed in thousands of United states Dollars

Asian Development Fund
115
aDF-6
cOntinUED
MatURity OF EFFEctiVE LOans
twelve Months Ending
31 December amount
Five years Ending
31 December amount
2012 $1,575,166 2021 8,538,518
2013 1,231,293 2026 7,892,777
2014 1,290,752 2031 6,034,678
2015 1,365,799 2036 3,712,870
2016 1,467,487 2041 1,625,301
2046 397,169
2051 37,880
total $35,169,690
sUMMaRy OF cURREnciEs REcEiVaBLE On LOans OUtstanDing
currency 2011 2010 currency 2011 2010
Australian dollar $ 77,064 $ 79,946 Norwegian krone 116,944 123,362
Canadian dollar 279,083 297,760 Pound sterling 232,739 224,873
Danish krone 28,796 30,706 Singapore dollar 88 91
Euro 2,075,806 2,130,493 Swedish krona 94,539 99,757
Japanese yen 6,073,053 5,962,893 Swiss franc 120,328 125,129
Korean won 23,798 25,144 Thai baht 873 947
Malaysian ringgit 891 940 United States dollar 2,122,491 2,139,439
New Zealand dollar 1,560 1,622 Special Drawing Rights5 18,266,554 17,733,835
total $29,514,607 $28,976,937
5 Basket of currencies defined by the International Monetary Fund consisting of the euro, Japanese yen, pound sterling, and US dollar.The accompanying notes are an integral part of these special purpose financial statements (ADF-8).

Asian Development Bank Annual Report 2011
116
aDF-7
asian DEVELOpMEnt BanK—asian DEVELOpMEnt FUnD
SPECIAL PURPOSE STATEMENT OF RESOURCES31 December 2011 Expressed in thousands of United states Dollars
Effective amounts
committed1
contributions Received
CONTRIBUTED RESOURCESAustralia $ 1,803,702 $ 1,570,304
Austria 235,570 273,336
Belgium 212,239 233,934
Brunei Darussalam 14,637 13,175
Canada 1,768,399 1,759,790
People’s Republic of China 60,188 52,142
Denmark 230,999 278,641
Finland 163,220 154,897
France 1,243,671 1,319,510
Germany 1,683,470 1,878,261
Hong Kong, China 78,598 72,563
Indonesia 14,960 14,960
Ireland 69,686 55,339
Italy 941,270 869,872
Japan 10,084,526 20,091,724
Republic of Korea 414,967 316,295
Luxembourg 42,563 46,879
Malaysia 20,209 16,969
Nauru 303 303
Netherlands 686,458 801,348
New Zealand 144,028 127,954
Norway 241,483 213,786
Portugal 91,723 97,713
Singapore 12,816 13,050
Spain 413,956 424,820
Sweden 397,012 321,891
Switzerland 332,714 484,775
Taipei,China 85,116 76,208
Thailand 12,795 11,815
Turkey 116,431 110,513
United Kingdom 1,266,785 1,064,054
United States 4,191,160 3,683,760
Total 27,075,654 36,450,581
SET-ASIDE RESOURCES 73,094
TRANSFERS FROM ORDINARY CAPITAL RESOURCES 1,100,000
TRANSFERS FROM TECHNICAL ASSISTANCE SPECIAL FUND2 3,556
tOtaL $27,075,654 $37,627,231
1 At exchange rates per Resolutions.2 Includes translation adjustments of $84 as of 31 December 2011.The accompanying notes are an integral part of these special purpose financial statements (ADF-8).

asian DEVELOpMEnt BanK—asian DEVELOpMEnt FUnD
NOTES TO SPECIAL PURPOSE FINANCIAL STATEMENTS31 December 2011 and 2010
Asian Development Fund
117
aDF-8
NOTE A—NATURE OF OPERATIONS
The Asian Development Bank (ADB), a multilateral development financial institution, was established in 1966 with its headquarters in Manila, Philippines. ADB and its operations are governed by the Agreement Establishing the Asian Development Bank (the Charter). Its purpose is to foster economic development and co-operation in Asia and the Pacific region and to contribute to the acceleration of the process of economic development of the developing member countries (DMCs) in the region, collectively and individually. Since 1999, ADB’s corporate vision and mission has been to help DMCs reduce poverty in the region. This was reaffirmed under the long-term strategic framework for 2008–2020 (Strategy 2020). Under Strategy 2020, ADB’s corporate vision continues to be “An Asia and Pacific Free of Poverty” and its mission has been to help its DMCs reduce poverty and improve living conditions and quality of life. ADB has been pursuing its mission and vision by focusing on three complementary strategic agendas: inclusive growth, environmentally sustainable growth, and regional integration. ADB provides financial and technical assistance for projects and programs, which will contribute to achieving this purpose. These are financed through ordinary capital resources (OCR) and Special Funds.1
The Asian Development Fund (ADF) was established in 1974 to more effectively carry out the special operations of ADB by providing resources on concessional terms for economic and social development of the less developed member countries.
The resources of ADF have been subsequently augmented by nine replenishments, the most recent (ADF X and the fourth regularized replenishment of the Technical Assistance Special Fund [TASF]) of which was approved by the Board of Governors in August 2008 and became effective on 16 June 2009 for the four-year period from January 2009. The new replenishment provides substantial resources to the ADF to finance ADB’s concessional program, and to the TASF to finance technical assistance operations. Total replenishment size is SDR7,592,407,000, of which SDR2,665,765,000 will come from new donor contributions. The donors agreed to allocate 3% of the total replenishment size (equivalent to 8% of total donor contributions) to TASF. As of 31 December 2011, ADB has received instruments of contributions from 29 donors with a total amount equivalent to SDR2,578,687,000, including qualified contributions amounting to SDR502,451,000.
ADB is immune from taxation pursuant to Chapter VIII, Article 56, Exemption from Taxation, of the Charter.
NOTE B—SUMMARY OF SIGNIFICANT ACCOUNTING POLICIES
In May 2001, the Board of Directors approved the adoption of the special purpose financial state-ments for ADF. The financial statements have been prepared for the specific purpose of reflecting the sources and applications of member contributions and are presented in US dollar equivalents at the reporting dates. With the adoption of the special purpose financial statements, loan loss provisioning, other than those for the debt relief loan write-off resulting from the implementation
1 Asian Development Fund (ADF), Technical Assistance Special Fund (TASF), Japan Special Fund (JSF), ADB Institute (ADBI), Asian Tsunami Fund (ATF), Pakistan Earthquake Fund (PEF), Regional Cooperation and Integration Fund (RCIF), Climate Change Fund (CCF), and Asia Pacific Disaster Response Fund (APDRF).

asian DEVELOpMEnt BanK—asian DEVELOpMEnt FUnD
NOTES TO SPECIAL PURPOSE FINANCIAL STATEMENTS31 December 2011 and 2010
Asian Development Bank Annual Report 2011
118
of the Heavily Indebted Poor Countries (HIPC) initiatives discussed in Note D, has been eliminated. With the exceptions of the aforementioned, the ADF financial statements are prepared in accordance with accounting principles generally accepted in the United States of America (US GAAP).
In November 2005, the Board of Governors accepted a resolution to adopt a special drawing rights (SDR) currency management framework to facilitate resource administration and operational planning for the benefit of borrowers. The currency management framework was implemented on 1 January 2006 whereby ADB is authorized to convert ADF resources held in various currencies into one of the SDR basket of currencies (currently US dollar, euro, pound sterling, and yen), to value disbursements, repayments and loan charges in terms of SDR, and to determine the value of contributors’ paid-in contributions and all other resources of the Fund in terms of SDR, in case of withdrawal of a Contributor or termination of ADF.
In July 2007, ADB offered ADF borrowers the option to convert their existing liability (i.e., disbursed and outstanding loan balance) in various currencies into SDR, while the undisbursed portions will be treated as new loans. The conversion was made available beginning 1 January 2008, and as of 31 December 2011, 17 out of 30 ADF borrowing countries have opted to convert their loans, which were carried out on the nearest loan service payment dates at least one month from their concurrence. There were no loan conversions for the year ended 31 December 2011.
Functional Currencies and Reporting Currency
The United States dollar (USD) is the reporting currency of the ADF for the purpose of presenting the financial position and the result of its operations.
With the implementation of the SDR currency management framework, ADF conducts its opera-tions in SDRs and the SDR basket of currencies, which currently are US dollar, euro, pound sterling, and yen. The SDR and the SDR basket of currencies comprise the functional currencies of ADF.
Translation of Currencies
ADB adopts the use of daily exchange rates for accounting and financial reporting purposes. This allows transactions in currencies other than USD to be translated to the reporting currency using exchange rates applicable at the time of transactions. Assets and liabilities are translated using the applicable exchange rates at the end of each reporting period, except for Contributed Resources received in non-functional currencies. Translation adjustments relating to set-aside resources (Note H) are recorded as notional amounts receivable from or payable to OCR. Translation adjustments relating to revaluation of assets, liabilities, and fund balances denominated in ADF’s functional currencies and all investments classified as available for sale are reported as “Accumulated Translation Adjustments” in “FUND BALANCES” as part of “Accumulated other comprehensive loss.” Translation adjustments relating to other non-functional currencies are reported as “NET UNREALIZED GAINS (LOSSES)” in the Special Purpose Statement of Revenue and Expenses.
Investments
Investment securities and negotiable certificates of deposit are classified as available for sale and are reported at fair value. Unrealized gains and losses are reported in “FUND BALANCES” as part of “Accumulated other comprehensive loss.” Realized gains and losses are measured by the difference

aDF-8
cOntinUED
Asian Development Fund
119
between amortized cost and the net proceeds of sales. Time deposits are reported at cost which is a reasonable estimate of fair value.
Interest income on investment securities and time deposits is recognized as realized and reported, net of amortizations of premiums and discounts.
Securities Purchased Under Resale Arrangement
ADF accounts for transfers of financial assets in accordance with the Financial Accounting Standards Board (FASB) Accounting Standards Codification (ASC) 860, “Transfers and Servicing.” In general, transfers are accounted for as sales when control over the transferred assets has been relinquished. Otherwise the transfers are accounted for as resale agreements and collateralized financing arrange-ments. Under resale arrangements, securities purchased are recorded as assets and are not re-pledged.
Loans
Loan interest income is recognized on accrual basis. It is the policy of ADF to place in non-accrual status loans made to eligible borrowing member countries if the principal or interest with respect to any such loans is overdue by six months. Interest on non-accruing loans is included in revenue only to the extent that payments have actually been received by ADF. ADB maintains a position of not taking part in debt rescheduling agreements with respect to sovereign loans. When ADB decides that a particular loan is no longer collectible, the entire amount is expensed during the period.
Contributed Resources
Contributions by donors are included in the special purpose financial statements as amounts committed and are reported in “Contributed Resources” as part of “FUND BALANCES” from the date Instruments of Contribution are deposited and related formalities are completed and made available for operational commitments.
Contributions are generally received in the currency of the contributor either in cash or notes.Under ADF IX and ADF X, contributors have the option to pay their contributions under the
accelerated note encashment program and receive a discount. ADF invests the cash generated from this program and the investment income is used to finance operations. The related contributions are recorded at the full undiscounted amount, and the discount is amortized over the standard encashment period of 10 years and 9 years for ADF IX and ADF X, respectively.
Advanced Payments on Contributions
Payments received in advance or as qualified contributions that cannot be made available for operational commitment are recorded as advance payments and included under “LIABILITIES.”
Grants and Undisbursed Commitments
Grants are recognized in the special purpose financial statements when the grant is approved and becomes effective. Upon completion of a project or cancellation of a grant, any undisbursed amount is written back as a reduction in the grants for the year and the corresponding undisbursed commitment is eliminated accordingly.

asian DEVELOpMEnt BanK—asian DEVELOpMEnt FUnD
NOTES TO SPECIAL PURPOSE FINANCIAL STATEMENTS31 December 2011 and 2010
Asian Development Bank Annual Report 2011
120
Accounting Estimates
The preparation of special purpose financial statements in conformity with generally accepted accounting principles, with the exception of loan loss provisioning, requires management to make reasonable estimates and assumptions that affect the reported amounts of assets, liabilities, and fund balances as of the end of the year and the reported amounts of revenue and expenses during the year. The actual results could differ from those estimates. Judgments have been used in the valuation of certain financial instruments.
Accounting and Reporting Developments
The FASB issued Accounting Standard Update (ASU) 2011-02, “Receivable (Topic 310) – A Creditor’s Determination of Whether Restructuring Is a Troubled Debt Restructuring” in April 2011. This update is effective for the first interim or annual period beginning on or after 15 June 2011 and is to be applied retrospectively to modifications occurring on or after the beginning of the annual period of adoption. This update did not have a material impact on ADF’s 31 December 2011 special purpose financial statements.
ASU 2010-06, “Fair Value Measurements and Disclosures (Topic 820) – Improving Disclosures about Fair Value Measurements” with respect to the separate disclosures about gross purchases, sales, issuances, and settlements relating to Level 3 measurements is effective for fiscal years beginning after 15 December 2010 and for interim periods within those fiscal years. Note K provides the required disclosures in compliance with this update.
In April 2011, the FASB issued ASU 2011-03, “Transfers and Servicing (Topic 860) – Reconsideration of Effective Control for Repurchase Agreements.” The update removes from the assessment of effective control the criterion requiring the transferor to have the ability to repurchase or redeem the financial assets on substantially the agreed terms, even in the event of default by the transferee. It does not change the other criteria used in the assessment of effective control. This update is applicable prospectively to new transactions and transactions that are modified on or after the first interim or annual period beginning 15 December 2011. This update did not have an impact on ADF’s 31 December 2011 financial statements.
In May 2011, the FASB issued ASU 2011-04, “Fair Value Measurement (Topic 820) – Amendments to Achieve Common Fair Value Measurement and Disclosure Requirements in US GAAP and IFRSs,” which provides the consistency between US GAAP and International Financial Reporting Standards (IFRSs) on the definition of fair value (FV) and the guidance on how to measure FV and related disclosure requirements. The ASU does not require additional FV measurements and are not intended to establish valuation standards or affect valuation practices outside of financial reporting. The new guidance will require prospective application and are effective for interim and annual periods beginning on or after 15 December 2011. ADB is currently assessing the impact of this update on ADF’s special purpose financial statements.
In June 2011, the FASB issued ASU 2011-05, “Comprehensive Income (Topic 220) – Presentation of Comprehensive Income,” which requires entities to present details of items that are reclassified from other comprehensive income to net income in the statement of comprehensive income. Subsequently, the FASB issued ASU 2011-12 in December 2011 to effectively defer only those changes in ASU 2011-05 that relate to the presentation of reclassification adjustments out of

aDF-8
cOntinUED
Asian Development Fund
121
accumulated other comprehensive income. ADB has decided to adopt the provisions in ASU 2011-05 and presented in ADF-2 and ADF-3 on ADF’s 31 December 2011 special purpose financial statements the reclassification adjustments.
In December 2011, the FASB issued ASU 2011-11, “Balance Sheet (Topic 210) – Disclosures about Offsetting Assets and Liabilities,” to provide enhanced disclosures that will enable users of its financial statements to evaluate the effect or potential effect of netting arrangements on an entity’s financial position. An entity is required to apply the amendments for annual reporting periods beginning on or after 1 January 2013, and interim periods within those annual periods. ADB is currently assessing the impact of this update on ADF’s special purpose financial statements.
Special Purpose Statement of Cash Flows
For the purposes of the Special Purpose Statement of Cash Flows, ADF considers that its cash and cash equivalents are limited to “DUE FROM BANKS,” which consists of cash on hand and current accounts in banks used for (i) operational disbursements, (ii) receipt of funds from encashment of donor countries’ promissory notes, and (iii) clearing accounts.
NOTE C—INVESTMENTS
The main investment management objective is to maintain security and liquidity. Subject to these parameters, ADB seeks the highest possible return on its investments. Investments are governed by the Investment Authority approved by the Board of Directors in 2006.
ADB may engage in securities lending of government or government-guaranteed obligations for which ADB receives guarantee from the securities custodian and a fee. Transfers of securities by ADB to counterparties are not accounted for as sales as the accounting criteria for the treatment of a sale have not been met. These securities must be available to meet ADB’s obligation to counterparties. Included in “Investments” as of 31 December 2011 were government or government-guaranteed obligations transferred under securities lending arrangements amounting to $11,700,000 ($19,038,000 – 2010).
The net unrealized gains on the outstanding accelerated note encashment portfolio amounted to $12,448,000 ($13,876,000 – 2010).
The currency composition of the investment portfolio as of 31 December 2011 and 2010 expressed in United States dollars are as follows:
currency 2011 2010
United States dollar $2,711,240,000 $2,495,315,000
Euro 2,099,184,000 1,894,269,000
Pound sterling 645,255,000 605,923,000
Japanese yen 341,595,000 271,948,000
Brunei dollar 125,000 250,000
New Zealand dollar – 1,104,000
Total $5,797,399,000 $5,268,809,000

asian DEVELOpMEnt BanK—asian DEVELOpMEnt FUnD
NOTES TO SPECIAL PURPOSE FINANCIAL STATEMENTS31 December 2011 and 2010
Asian Development Bank Annual Report 2011
122
The estimated fair value and amortized cost of the investments as of 31 December 2011 and 2010 are as follows:
2011 2010
Estimated Fair Value
amortized cost
Estimated Fair Value
amortized cost
Due in one year or less $3,408,919,000 $3,399,129,000 $3,058,961,000 $3,053,835,000
Due after one year through five years 2,371,229,000 2,296,573,000 2,160,119,000 2,064,614,000
Due after five years through ten years 17,251,000 15,663,000 49,729,000 48,961,000
Total $5,797,399,000 $5,711,365,000 $5,268,809,000 $5,167,410,000
Additional information relating to investments in government or government-guaranteed obligations classified as available for sale is as follows:
2011 2010
as of 31 December:
Amortized cost $4,038,649,000 $3,329,977,000Estimated fair value 4,124,683,000 3,431,376,000 Gross unrealized gains 86,607,000 101,605,000 Gross unrealized losses (573,000) (206,000)
For the years ended 31 December:
Change in net unrealized gains (losses) from prior year (15,365,000) (16,660,000)
Proceeds from sales 197,793,000 127,659,000 Gross gain on sales 9,094,000 1,034,000 Gross loss on sales – (180,000)
The rate of return on the average investments held during the year, including securities purchased under resale arrangement, based on the portfolio held at the beginning and end of each month, was 1.71% (1.89% – 2010) excluding unrealized gains and losses on investment securities, and 1.46% (1.60% – 2010) including unrealized gains and losses on investments.

aDF-8
cOntinUED
Asian Development Fund
123
As of 31 December 2011, gross unrealized losses resulting from market movements amounted to $573,000 ($206,000 – 2010) for government or government-guaranteed obligations. There was one security in 2011 (nil – 2010) that sustained unrealized losses for over one year. Comparative details for 2011 and 2010 are as follows:
For the year 2011
One year or less Over one year total
Fair Value
Unrealized Losses
Fair Value
Unrealized Losses
Fair Value
Unrealized Losses
Government or government-guaranteed obligations $370,738,000 $541,000 $220,049,000 $32,000 $590,787,000 $573,000
For the year 2010
One year or less Over one year total
Fair Value
Unrealized Losses
Fair Value
Unrealized Losses
Fair Value
Unrealized Losses
Government or government-guaranteed obligations $428,243,000 $206,000 $ – $ – $428,243,000 $206,000
NOTE D—LOANS AND HIPC DEBT RELIEF
Prior to 1 January 1999, loans of ADF were extended to eligible borrowing member countries, which bore a service charge of 1% and required repayment over periods ranging from 35 to 40 years. On 14 December 1998, the Board of Directors approved an amendment to ADF loan terms, as follows: (i) for loans to finance specific projects, the maturity was shortened to 32 years including an 8-year grace period; (ii) for program loans to support sector development, the maturity was shortened to 24 years including an 8-year grace period; and (iii) all new loans bear a 1% interest charge during the grace period, and 1.5% during the amortization period, with equal amortization. The revised ADF lending terms took effect on 1 January 1999 for loans for which formal loan negotiations were completed on or after 1 January 1999. ADF requires borrowers to absorb exchange risks attributable to fluctuations in the value of the currencies disbursed.
In September 2007, the Board of Directors approved a new hard-term ADF lending facility. The facility will have a fixed interest rate of 150 basis points below the weighted average of the ten-year fixed swap rates of the special drawing rights component currencies plus the OCR lending spread, or the current ADF rate, whichever is higher. Other terms are similar to those of regular ADF loans. The interest rate will be reset every January and will apply to all hard-term loans approved that year and will be fixed for the life of the loan. For hard-term ADF loans approved in 2011, the interest rate was set at 2.02% (2.22% – 2010). Three loans were approved under this facility in 2011 (two – 2010).
In April 2008, the Board of Governors adopted the resolution on Providing Heavily Indebted Poor Countries (HIPC) Relief from Asian Development Fund Debt, which allowed ADB to participate in

asian DEVELOpMEnt BanK—asian DEVELOpMEnt FUnD
NOTES TO SPECIAL PURPOSE FINANCIAL STATEMENTS31 December 2011 and 2010
Asian Development Bank Annual Report 2011
124
the HIPC debt relief initiative. Subsequently, the Board of Directors approved the provision of debt relief under HIPC to Afghanistan.
ADB believes that because there is no comparable market for ADF loans and because they do not intend to sell these loans, using market data to calculate the fair value of the loans is not meaningful. As such, the fair value of loans is determined based on the terms at which a similar loan would currently be made by ADB to a similar borrower. For such loans, fair value approximates the carrying amount. The estimated fair value of loans is not affected by credit risks because the amount of any such adjustment is considered not to have a material effect based on ADB’s experience with its borrowers.
Undisbursed loan commitments and an analysis of loans by country as of 31 December 2011 are shown in ADF-6.
As of 31 December 2011 and 2010, loans to borrowers were as follows:
2011 2010
Pakistan $ 6,994,680,000 $ 7,054,459,000
Bangladesh 5,974,595,000 5,936,625,000
Viet Nam 3,651,183,000 3,324,517,000
Sri Lanka 2,659,314,000 2,679,933,000
Nepal 1,588,004,000 1,588,078,000
Others (individually less than 5% of total loans) 8,646,831,000 8,393,325,000
Total Outstanding Loans 29,514,607,000 28,976,937,000
Allowance for HIPC Debt Relief (78,927,000) (79,918,000)
net Outstanding Loans $29,435,680,000 $28,897,019,000
As of 31 December 2011, there were 28 loans to Myanmar in non-accrual status representing 2.2% of the total outstanding loans (28 loans to Myanmar – 2010). The total principal amount outstanding of such loans was $642,287,000 ($614,788,000 – 2010) of which $398,911,000 ($349,616,000 – 2010) was overdue. Loans in non-accrual status resulted in $6,280,000 ($5,800,000 – 2010) not being recognized as income from loans for the year ended 31 December 2011. The accumulated interest on these loans that was not recognized as income as of 31 December 2011 totaled $91,644,000 ($81,574,000 – 2010).
Credit Quality of Loans
ADF loans are provided for economic and social development of the less developed member countries, which generally have lower credit quality than OCR borrowers. ADB uses a performance based allocation (PBA) system to allocate ADF resources among the many competing needs in the region and to direct the funds to where they will be used most effectively. ADB regularly reviews the borrowers’ debt sustaining capacity in determining the proportion of grant and loan that would be provided to each borrower.

aDF-8
cOntinUED
Asian Development Fund
125
The credit quality of ADF loans have been classified by mapping the external sovereign ratings of the borrowers to ADB’s internal risk rating scale used for OCR loans.
The credit quality of ADF loans are detailed as follows:
Risk class Risk Rating 2011 2010
Low credit risk 1–5 (AAA to BBB–) $ 54,109,000 $ 7,632,000
Medium credit risk 6–11 (BB+ to B–) 24,238,827,000 23,847,756,000
High credit risk 12–14 (CCC+ to D) 5,221,671,000 5,121,549,000
total $29,514,607,000 $28,976,937,000
Provision for HIPC Debt Relief amounting to $82,350,000 relating to the Afghanistan debt relief under the HIPC initiative was recognized and charged to income in 2008. Of this amount, a total of $3,423,000 was written-off as the loan service payments of affected loans fell due. This brought the balance of Allowance for HIPC debt relief as of 31 December 2011 to $78,927,000.
NOTE E—RELATED PARTY TRANSACTIONS
The OCR and special funds resources are at all times used, committed, and invested entirely separate from each other. The administrative and operational expenses pertaining to the OCR and ADF are allocated based on operational activities and are settled regularly. Under ADF X and the fourth regularized replenishment of TASF, a specific portion of the total contributions is to be allocated to TASF. ADF receives contributions from members and subsequently transfers the specified portion to TASF.
As of 31 December 2011, ADF’s outstanding payable to related funds pertains to payable to OCR of $41,432,000 ($28,628,000 – 2010), representing administration and operational expenses. There were no outstanding payables to TASF (nil – 2010) and to trust funds (nil – 2010).
NOTE F—CONTRIBUTED RESOURCES AND ADVANCED CONTRIBUTIONS
In May 2011, the Board of Governors approved the allocation of $120,000,000 from OCR’s 2010 net income to ADF.
ADF receives cash or nonnegotiable, noninterest-bearing demand obligations as payment for the contributions. These are nonnegotiable, noninterest-bearing, and subject to certain restrictions imposed by applicable Board of Governors’ resolutions, demand obligations are encashable by ADB at par upon demand. These are recorded as a reduction in the Fund Balances. ADB currently expects that the notes outstanding as of 31 December 2011 will be encashed in varying amounts over the standard encashment period ending 31 December 2014 for ADF IX and 31 December 2017 for ADF X.

asian DEVELOpMEnt BanK—asian DEVELOpMEnt FUnD
NOTES TO SPECIAL PURPOSE FINANCIAL STATEMENTS31 December 2011 and 2010
Asian Development Bank Annual Report 2011
126
Included in other assets as of 31 December 2011 are advance contributions received from donors totaling $163,605,000 ($150,631,000 – 2010).
In July 2011, ADB received a confirmation from the Government of Italy that the remaining balance of €342,000 ($494,000 equivalent) of Italy’s promissory note received under ADF VI will no longer be used to fund any specific projects or trust funds. Consequently, the promissory note and corresponding amount recorded in “Deferred Credits” were considered exhausted.
As of 31 December 2011, contributions from 29 donors totaling $4,139,089,000 (27 donors totaling $3,571,381,000 – 2010) were committed for ADF X. Of these, $2,849,194,000 ($1,774,564,000 – 2010), including amortized discount of $6,788,000 ($3,032,000 – 2010) were received and recorded in “Contributed Resources.”
NOTE G—ADMINISTRATIVE EXPENSES
Administrative expenses represent administration charge from OCR, which is an apportionment of all administrative expenses of ADB (other than those pertaining directly to ordinary operations and special operations), in the proportion of the relative volume of operational activities of each fund.
NOTE H—SET-ASIDE RESOURCES
Pursuant to the provisions of Article 19, paragraph 1(i) of the Charter, the Board of Governors has authorized the setting aside of 10% of the unimpaired “paid-in” capital paid by member countries pursuant to Article 6, paragraph 2(a) of the Charter and of the convertible currency portion paid by member countries pursuant to Article 6, paragraph 2(b) of the Charter as of 28 April 1973, to be used as a part of the Special Funds of ADB. The capital so set aside was allocated and transferred from the OCR to ADF as Set-Aside Resources.
The capital stock of ADB is defined in Article 4, paragraph 1 of the Charter, “in terms of United States dollars of the weight and fineness in effect on 31 January 1966” (the 1966 dollar). Therefore, Set-Aside Resources had historically been translated into the current United States dollar (ADB’s unit of account), on the basis of its par value in terms of gold. From 1973 until 31 March 1978, the rate arrived at on this basis was $1.20635 per 1966 dollar. Since 1 April 1978, at which time the Second Amendment to the Articles of Agreement of the International Monetary Fund (IMF) came into effect, currencies no longer had par values in terms of gold.
Pending ADB’s selection of the appropriate successor to the 1966 dollar, the Set-Aside Resources have been valued for purposes of the accompanying financial statements in terms of the SDR, at the value in current United States dollars as denominated by the IMF. As of 31 December 2011, the value of the SDR in terms of the current United States dollar was $1.53527 ($1.54003 – 2010). On this basis, Set-Aside Resources amounted to $73,094,000 ($73,320,000 – 2010). If the capital stock of ADB as of 31 December 2011 had been valued in terms of $12,063.50 per share, Set-Aside Resources would have been $57,434,000.

aDF-8
cOntinUED
Asian Development Fund
127
NOTE I—COMPREHENSIVE INCOME
Comprehensive Income has two major components: revenue less than expenses (ADF-2) and other comprehensive (loss) income (ADF-3). Other Comprehensive (Loss) Income includes unrealized gains and losses on “Available for Sale” securities and translation adjustments of assets and liabilities not recognized in the Special Purpose Statement of Revenue and Expenses.
The changes in Accumulated Other Comprehensive Loss balances for the years ended 31 December 2011 and 2010 expressed in thousands of US dollars are as follows:
accumulated translation adjustments
Unrealized investment holding gains
accumulated Other comprehensive Loss
2011 2010 2011 2010 2011 2010
Balance, 1 January $ (3,211,402) $(2,847,594) $101,399 $118,058 $ (3,110,003) $ (2,729,536)
Changes from period activity (687,552) (363,808) (15,365) (16,659) (702,917) (380,467)
Balance, 31 December $(3,898,954) $(3,211,402) $ 86,034 $101,399 $(3,812,920) $(3,110,003)
NOTE J—GRANTS AND UNDISBURSED COMMITMENTS
The ADF IX introduced financing in the form of grants for the first time. During 2011, 16 grants (34 – 2010) totaling $596,760,000 ($967,190,000 – 2010) were approved, while $1,120,579,000 ($651,756,000 – 2010), net of $3,611,000 ($5,954,000 – 2010) write back of undisbursed commitments for completed grants, became effective.
The fair value of undisbursed commitments approximates the amount outstanding, because ADB expects that disbursements will substantially be made for all the projects/programs covered by the commitments.
NOTE K—FAIR VALUE MEASUREMENTS
ASC 820 defines fair value as the price that would be received to sell an asset or paid to transfer a liability at measurement date (exit price) in an orderly transaction among willing participants with an assumption that the transaction takes place in the entity’s principal market, the most advantageous market for the asset or liability. The most advantageous market is where the sale of the asset or transfer of liability would maximize the amount received for the asset or minimize the amount paid to transfer the liability. The fair value measurement is not adjusted for transaction cost.
ASC 820 also establishes a fair value hierarchy that gives the highest priority to quoted prices in active markets for identical assets or liabilities (Level 1), next priority to observable market inputs or market corroborated data (Level 2), and the lowest priority to unobservable inputs without market corroborated data (Level 3). ASC 820 requires the fair value measurement to maximize the use of market observable inputs.

asian DEVELOpMEnt BanK—asian DEVELOpMEnt FUnD
NOTES TO SPECIAL PURPOSE FINANCIAL STATEMENTS31 December 2011 and 2010
Asian Development Bank Annual Report 2011
128
The following guidelines are applied in determining the fair values of financial instruments:
Investments, securities purchased under resale arrangements, and forward contracts
Readily marketable investments are fair valued using active market quotes in Level 1 category. Level 2 category includes investments, securities purchased under resale arrangements, and forward contracts which are fair valued with significant market observable inputs. Included in Level 3 category are investments fair valued using unobservable inputs including prices provided by third parties such as independent pricing services, custodians, and asset managers. Forward foreign exchange contracts are fair valued using discounted cash flow models. Market observable inputs, such as yield curves, foreign exchange rates, cross currency rates, and volatilities are applied to the models to determine fair value of investments. Inter-level transfers from one year to another may occur due to changes in market activities affecting the availability of quoted market prices or observable market data.
The fair values of the following financial assets of ADF as of 31 December 2011 and 2010 were reported based on the following:
Fair Value Measurements
31 December 2011
Quoted prices in active Markets
for identical assets (Level 1)
significant Market Observable
inputs (Level 2)
significant Unobservable
inputs (Level 3)
assets
Investments
Government or government-guaranteed obligations $ 4,124,683,000 $ 3,365,358,000 $ 759,325,000 $ –
Time deposits 1,672,716,000 – 1,672,716,000 –
Securities purchased under resale arrangement 335,818,000 – 335,818,000 –
total assets at fair value $6,133,217,000 $3,365,358,000 $2,767,859,000 $ –
Fair Value Measurements
31 December 2010
Quoted prices in active Markets
for identical assets (Level 1)
significant Market Observable
inputs (Level 2)
significant Unobservable
inputs (Level 3)
assets
Investments
Government or government-guaranteed obligations $ 3,431,376,000 $ 2,963,333,000 $ – $ 468,043,000
Time deposits 1,837,433,000 – 1,837,433,000 –
Securities purchased under resale arrangement 340,811,000 – 340,811,000 –
total assets at fair value $5,609,620,000 $2,963,333,000 $2,178,244,000 $468,043,000

aDF-8
cOntinUED
Asian Development Fund
129
The table below provides the details of transfers between Level 1 and Level 2 for the year ended 31 December 2011:
Level 1 Level 2
Investments
Government or government-guaranteed obligations Transfers (out of) into $(98,317,000) $98,317,000
Government or government-guaranteed obligations totaling $98,317,000 were transferred from Level 1 to Level 2.
Assets measured at fair value on a recurring basis using significant unobservable inputs (Level 3) as of 31 December 2011 and 2010 are as follows:
government or government- guaranteed obligations
2011 2010
Balance, 1 January $ 468,043,000 $ –
Total gains (losses) realized/unrealized
Included in earnings (or changes in net assets) 130,000 18,000
Included in other comprehensive income 6,896,000 (6,577,000)
Purchases – 141,854,000
Maturities (212,311,000) –
Transfers into Level 3 – 332,748,000
Transfers out of Level 3 (262,758,000) –
Balance, 31 December $ – $468,043,000
The amount of total losses for the period recognized in other comprehensive income attributable to the change in net unrealized gains or losses relating to assets still held at the reporting date. $ – $ (2,270,000)
During 2011, ADB enhanced the approach for determining the fair value hierarchy of liquidity portfolio investments by introducing additional pricing sources and strengthening the internal analytics. The enhanced methodology provided more robust support for market observable inputs in pricing. Transfers out of Level 3 in 2011 are primarily the result of refining ADB’s valuation approach.
All investment securities, including those under Level 3, are of high credit quality. The government or government-guaranteed obligations are largely floating rate notes and callable bonds with a credit quality rating from Standard and Poor’s of AAA to AA–. The corporate obligations are also floating rate notes.

asian DEVELOpMEnt BanK—asian DEVELOpMEnt FUnD
NOTES TO SPECIAL PURPOSE FINANCIAL STATEMENTS31 December 2011 and 2010
Asian Development Bank Annual Report 2011
130
See Notes C, D, and J for discussions relating to investments, loans, and undisbursed commitments, respectively. In all other cases, the carrying amounts of ADF’s assets, liabilities, and fund balances are considered to approximate fair values for all significant financial instruments.
NOTE L—SUBSEQUENT EVENTS
ADB has evaluated subsequent events after 31 December 2011 through 14 March 2012, the date these Special Purpose Financial Statements are available for issuance. As a result of this evaluation, there are no subsequent events, as defined, that require recognition or disclosure in the ADF’s Special Purpose Financial Statements as of 31 December 2011.

Technical Assistance Special Fund
131
tecHnical assistance special Fund
MANAGEMENT’S REPORT ON INTERNAL CONTROL OVER FINANCIAL REPORTING
The management of Asian Development Bank (“ADB”) is responsible for establishing and maintaining adequate internal control over financial reporting. ADB’s internal control over financial reporting is a process designed to provide reasonable assurance regarding the reliability of financial reporting and the preparation of financial statements for external purposes in accordance with generally accepted accounting principles in the United States of America.
ADB’s internal control over financial reporting includes those policies and procedures that (i) pertain to the maintenance of records that, in reasonable detail, accurately and fairly reflect the transactions and dispositions of the assets of ADB; (ii) provide reasonable assurance that transactions are recorded as necessary to permit preparation of financial statements in accordance with generally accepted accounting principles in the United States of America, and that receipts and expenditures of ADB are being made only in accordance with authorizations of management and directors of ADB; and (iii) provide reasonable assurance regarding prevention or timely detection of unauthorized acquisition, use, or disposition of ADB’s assets that could have a material effect on the financial statements.
Because of its inherent limitations, internal control over financial reporting may not prevent or detect misstatements. Also, projections of any evaluation of effectiveness to future periods are subject to the risk that controls may become inadequate because of changes in conditions, or that the degree of compliance with the policies or procedures may deteriorate.
ADB’s management assessed the effectiveness of ADB’s internal control over financial reporting as of 31 December 2011. In making this assessment, ADB’s management used the criteria set forth by the Committee of Sponsoring Organizations of the Treadway Commission in Internal Control – Integrated Framework. Based on that assessment, management believes that as of 31 December 2011, ADB’s internal control over financial reporting is effective based upon the criteria established in Internal Control – Integrated Framework.
Haruhiko KurodaPresident
Thierry de LonguemarVice-President (Finance and Administration)
Hiroshi FukukawaOfficer-in-Charge, Controller’s Department
14 March 2012

Asian Development Bank Annual Report 2011
132
Deloitte Touche LLPCertified Public AccountantsUnique Entity No. T08LL0721A6 Shenton Way #32-00DBS Building Tower TwoSingapore 068809
Tel: +65 6224 8288Fax: +65 6538 6166www.deloitte.com/sg
INDEPENDENT AUDITORS’ REPORT
To the Board of Directors and the Board of Governors of Asian Development Bank
We have audited management’s assertion, included in the accompanying Management’s Report on Internal Control over Financial Reporting, that Asian Development Bank (“ADB”) maintained effective internal control over financial reporting as of December 31, 2011, based on the criteria established in Internal Control — Integrated Framework issued by the Committee of Sponsoring Organizations of the Treadway Commission. ADB’s management is responsible for maintaining effective internal control over financial reporting and for its assertion of the effectiveness of internal control over financial reporting, included in the accompanying Management’s Report on Internal Control over Financial Reporting. Our responsibility is to express an opinion on management’s assertion based on our audit.
We conducted our audit in accordance with attestation standards established by the American Institute of Certified Public Accountants. Those standards require that we plan and perform the audit to obtain reasonable assurance about whether effective internal control over financial reporting was maintained in all material respects. Our audit included obtaining an understanding of internal control over financial reporting, assessing the risk that a material weakness exists, and testing and evaluating the design and operating effectiveness of internal control based on the assessed risk. Our audit also included performing such other procedures as we considered necessary in the circumstances. We believe that our audit provides a reasonable basis for our opinion.
ADB’s internal control over financial reporting is a process designed to provide reasonable assurance regarding the reliability of financial reporting and the preparation of financial statements for external purposes in accordance with accounting principles generally accepted in the United States of America. ADB’s internal control over financial reporting includes those policies and procedures that (1) pertain to the maintenance of records that, in reasonable detail, accurately and fairly reflect the transactions and dispositions of the assets of ADB; (2) provide reasonable assurance that transactions are recorded as necessary to permit preparation of financial statements in accordance with accounting principles generally accepted in the United States of America, and that receipts and expenditures of ADB are being made only in accordance with authorizations of management and directors of ADB; and (3) provide reasonable assurance regarding prevention or timely detection of unauthorized acquisition, use, or disposition of ADB’s assets that could have a material effect on the financial statements.
Deloitte Touche LLP (Unique Entity No. T08LL0721A) is an accounting limited liability partnership registered in Singaporeunder the Limited Liability Partnerships Act (Chapter 163A).

Technical Assistance Special Fund
133
Because of the inherent limitations of internal control over financial reporting, including the possibility of collusion or improper management override of controls, material misstatements due to error or fraud may not be prevented or detected and corrected on a timely basis. Also, projections of any evaluation of the effectiveness of the internal control over financial reporting to future periods are subject to the risk that the controls may become inadequate because of changes in conditions or that the degree of compliance with the policies or procedures may deteriorate.
In our opinion, management’s assertion that ADB maintained effective internal control over financial reporting as of December 31, 2011, is fairly stated, in all material respects, based on the criteria established in Internal Control — Integrated Framework issued by the Committee of Sponsoring Organizations of the Treadway Commission.
We have also audited, in accordance with auditing standards generally accepted in the United States of America, the accompanying statement of financial position of Asian Development Bank (“ADB”) – Technical Assistance Special Fund as of December 31, 2011 and 2010 and the related statements of activities and changes in net assets, and cash flows, for each of the years in the two-year period ended December 31, 2011 and our report dated March 14, 2012 expressed an unqualified opinion on those financial statements.
Public Accountants and Certified Public Accountants
SingaporeMarch 14, 2012

Asian Development Bank Annual Report 2011
134
Deloitte Touche LLPCertified Public AccountantsUnique Entity No. T08LL0721A6 Shenton Way #32-00DBS Building Tower TwoSingapore 068809
Tel: +65 6224 8288Fax: +65 6538 6166www.deloitte.com/sg
INDEPENDENT AUDITORS’ REPORT
To the Board of Directors and the Board of Governors of Asian Development Bank
We have audited the accompanying statement of financial position of Asian Development Bank (“ADB”) – Technical Assistance Special Fund as of December 31, 2011 and 2010 and the related statements of activities and changes in net assets, and cash flows, for each of the years in the two-year period ended December 31, 2011. These financial statements are the responsibility of ADB’s management. Our responsibility is to express an opinion on these financial statements based on our audits.
We conducted our audits in accordance with auditing standards generally accepted in the United States of America. Those standards require that we plan and perform the audit to obtain reasonable assurance about whether the financial statements are free of material misstatement. An audit includes examining, on a test basis, evidence supporting the amounts and disclosures in the financial statements, assessing the accounting principles used and significant estimates made by management, as well as evaluating the overall financial statement presentation. We believe that our audits provide a reasonable basis for our opinion.
In our opinion, such financial statements present fairly, in all material respects, the financial position of ADB – Technical Assistance Special Fund as of December 31, 2011 and 2010, and the results of its operations and its cash flows for each of the years in the two-year period ended December 31, 2011 in conformity with accounting principles generally accepted in the United States of America.
Our audits were conducted for the purpose of forming an opinion on the basic 2011 and 2010 financial statements taken as a whole. The statement of resources as of December 31, 2011 and summary statement of technical assistance approved and effective for the year then ended, are presented for the purpose of additional analysis and are not a required part of the basic financial statements. These schedules are the responsibility of ADB’s management. Such 2011 schedules have been subjected to the auditing procedures applied in our audit of the basic financial statements and, in our opinion are fairly stated in all material respects when considered in relation to the basic financial statements taken as a whole.
Deloitte Touche LLP (Unique Entity No. T08LL0721A) is an accounting limited liability partnership registered in Singaporeunder the Limited Liability Partnerships Act (Chapter 163A).

Technical Assistance Special Fund
135
We have also audited, in accordance with attestation standards established by the American Institute of Certified Public Accountants, management’s assertion that ADB maintained effective internal control over financial reporting as of December 31, 2011, based on the criteria established in Internal Control — Integrated Framework issued by the Committee of Sponsoring Organizations of the Treadway Commission and our report dated March 14, 2012 expressed an unqualified opinion on management’s assertion that ADB maintained effective internal control over financial reporting.
Public Accountants and Certified Public Accountants
SingaporeMarch 14, 2012

Asian Development Bank Annual Report 2011
136
2011 2010
assEts
DUE FROM BANKS $ 1,494 $ 1,640
INVESTMENTS (Notes C and G)Time deposits 380,995 357,140
SECURITIES PURCHASED UNDER RESALE ARRANGEMENT (Note G) 10,923 4,906
ACCRUED REVENUE 21 109
DUE FROM CONTRIBUTORS (Note F) 129,083 172,187
ADVANCES FOR GRANTS AND OTHER ASSETS (Note D) 9,464 10,824
tOtaL $531,980 $546,806
LiaBiLitiEs anD UncOMMittED BaLancEs
ACCOUNTS PAYABLE AND OTHER LIABILITIES (Note D) $ 188 $ 125
UNDISBURSED COMMITMENTS (Notes E and G) 306,681 298,595
TOTAL LIABILITIES 306,869 298,720
UNCOMMITTED BALANCES (TASF-2 and TASF-4) (Note F), represented by:Unrestricted net assets 225,111 248,086
tOtaL $531,980 $546,806
The accompanying notes are an integral part of these financial statements (TASF-6).
tasF-1
asian DEVELOpMEnt BanK—tEchnicaL assistancE spEciaL FUnD
STATEMENT OF FINANCIAL POSITION31 December 2011 and 2010 Expressed in thousands of United states Dollars

Technical Assistance Special Fund
137
2011 2010
changEs in UnREstRictED nEt assEts
CONTRIBUTIONS (TASF-4) (Note F) $ 81,733 $ 40,952
REVENUEFrom investments (Note C) 3,340 2,495 From other sources—net 14 12
Total 85,087 43,459
EXPENSESTechnical assistance—net (TASF-5) (Note E) 111,938 134,658 Financial expenses 21 16
Total 111,959 134,674
CONTRIBUTIONS AND REVENUE LESS THAN EXPENSES (26,872) (91,215)
EXCHANGE GAINS—net 3,897 16,593
DECREASE IN NET ASSETS (22,975) (74,622)
NET ASSETS AT BEGINNING OF YEAR 248,086 322,708
nEt assEts at EnD OF yEaR $225,111 $248,086
The accompanying notes are an integral part of these financial statements (TASF-6).
tasF-2
asian DEVELOpMEnt BanK—tEchnicaL assistancE spEciaL FUnD
STATEMENT OF ACTIVITIES AND CHANGES IN NET ASSETSFor the Years Ended 31 December 2011 and 2010 Expressed in thousands of United states Dollars
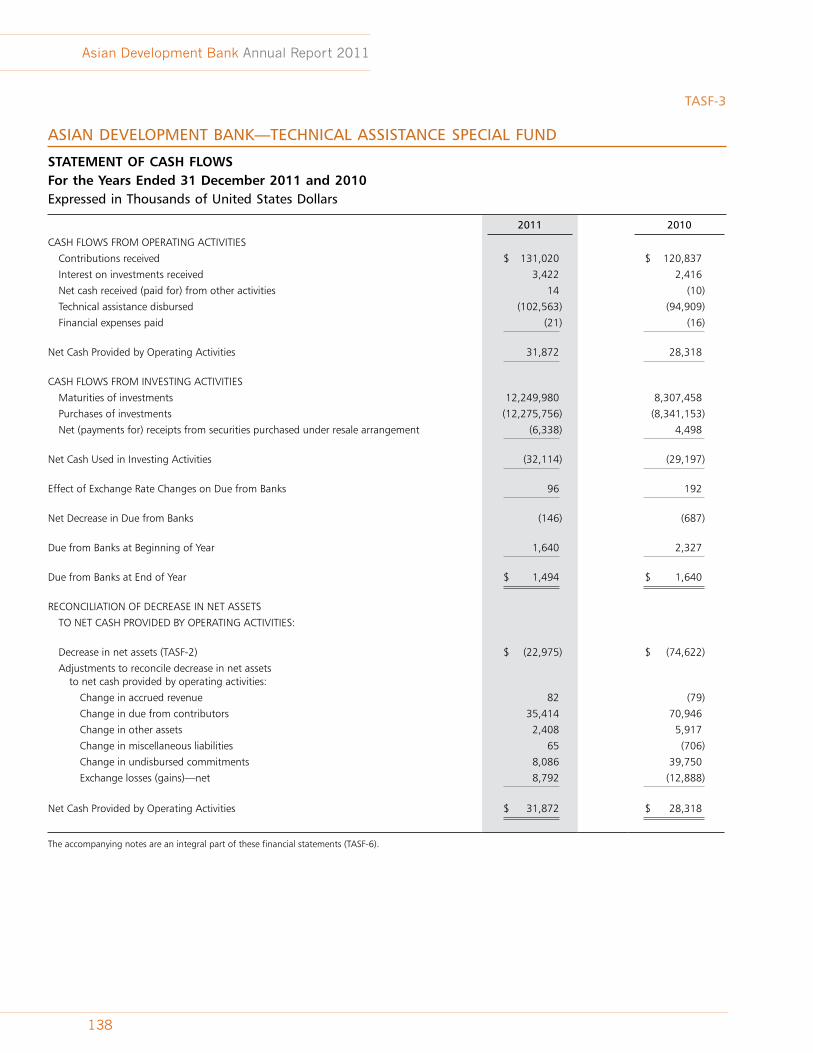
Asian Development Bank Annual Report 2011
138
2011 2010
CASH FLOWS FROM OPERATING ACTIVITIES
Contributions received $ 131,020 $ 120,837
Interest on investments received 3,422 2,416
Net cash received (paid for) from other activities 14 (10)
Technical assistance disbursed (102,563) (94,909)
Financial expenses paid (21) (16)
Net Cash Provided by Operating Activities 31,872 28,318 CASH FLOWS FROM INVESTING ACTIVITIES
Maturities of investments 12,249,980 8,307,458
Purchases of investments (12,275,756) (8,341,153)
Net (payments for) receipts from securities purchased under resale arrangement (6,338) 4,498
Net Cash Used in Investing Activities (32,114) (29,197)
Effect of Exchange Rate Changes on Due from Banks 96 192
Net Decrease in Due from Banks (146) (687)
Due from Banks at Beginning of Year 1,640 2,327 Due from Banks at End of Year $ 1,494 $ 1,640
RECONCILIATION OF DECREASE IN NET ASSETS
TO NET CASH PROVIDED BY OPERATING ACTIVITIES:
Decrease in net assets (TASF-2) $ (22,975) $ (74,622)
Adjustments to reconcile decrease in net assets to net cash provided by operating activities:
Change in accrued revenue 82 (79)
Change in due from contributors 35,414 70,946
Change in other assets 2,408 5,917
Change in miscellaneous liabilities 65 (706)
Change in undisbursed commitments 8,086 39,750
Exchange losses (gains)—net 8,792 (12,888)
Net Cash Provided by Operating Activities $ 31,872 $ 28,318
The accompanying notes are an integral part of these financial statements (TASF-6).
tasF-3
asian DEVELOpMEnt BanK—tEchnicaL assistancE spEciaL FUnD
STATEMENT OF CASH FLOWSFor the Years Ended 31 December 2011 and 2010 Expressed in thousands of United states Dollars

Technical Assistance Special Fund
139
contributor
contributions committed
During 2011
Direct Voluntary
contributionsRegularized
Replenishment1
total contributions
Australia $ – $ 2,484 $ 53,414 $ 55,898 Austria – 159 7,177 7,336
Bangladesh – 47 – 47 Belgium – 1,394 5,875 7,269 Brunei Darussalam – – 450 450 Canada – 3,346 43,311 46,657 People’s Republic of China – 1,600 4,812 6,412 Denmark – 1,963 5,750 7,713 Finland 16 237 4,744 4,981 France – 1,697 33,862 35,559 Germany – 3,315 44,509 47,824 Hong Kong, China – 100 3,509 3,609 India – 3,948 – 3,948 Indonesia – 250 40 290 Ireland – – 3,643 3,643 Italy 1,964 774 18,284 19,058 Japan – 47,710 287,286 334,996 Republic of Korea – 1,900 20,516 22,416
Luxembourg – – 609 609 Malaysia – 909 818 1,727
Nauru – – 67 67 Netherlands – 1,338 20,484 21,822 New Zealand 2,594 1,096 4,828 5,924
Norway – 3,279 7,896 11,175 Pakistan 70 1,876 – 1,876 Portugal – – 3,595 3,595 Singapore – 1,100 711 1,811 Spain – 190 16,564 16,754 Sri Lanka – 6 – 6 Sweden – 862 11,931 12,793 Switzerland – 1,035 9,314 10,349 Taipei,China – 200 3,455 3,655 Thailand – – 493 493 Turkey – – 3,237 3,237 United Kingdom – 5,617 39,447 45,064 United States 37,090 1,500 102,120 103,620
Total $ 41,733 $ 89,932 $ 762,751 $ 852,683
Transfer to Asian Development Fund (3,472)
Allocation from OCR Net Income 40,000 809,000
Other Resources2 186,588
tOtaL $81,733 $ 1,844,799
Note: Numbers may not sum precisely because of rounding.1 Represents TASF portion of contributions to the replenishment of the Asian Development Fund and the Technical Assistance Special Fund authorized by
Governors’ Resolution Nos. 182, 214, 300, and 333 at historical values.2 Represents income, repayments, and reimbursements accruing to TASF since 1980.The accompanying notes are an integral part of these financial statements (TASF-6).
tasF-4
asian DEVELOpMEnt BanK—tEchnicaL assistancE spEciaL FUnD
STATEMENT OF RESOURCES31 December 2011 Expressed in thousands of United states Dollars

Asian Development Bank Annual Report 2011
140
tasF-5
asian DEVELOpMEnt BanK—tEchnicaL assistancE spEciaL FUnD
SUMMARY STATEMENT OF TECHNICAL ASSISTANCE APPROVED AND EFFECTIVE For the Year Ended 31 December 2011 Expressed in thousands of United states Dollars
Recipientproject
preparation advisoryResearch and Development
policy and advisory
capacity Development total
Afghanistan $ – $ – $ – $ (325) $ – $ (325)
Bangladesh 1,695 (2,476) – 1,200 1,650 2,068
Bhutan 600 (42) – – 1,600 2,158
Cambodia 3,000 – – 446 2,425 5,871
People’s Republic of China 6,050 (604) – 8,269 2,326 16,040
Georgia (35) – – (145) – (180)
India 174 (647) – (298) 6,886 6,114
Indonesia (177) (105) – – 725 442
Kazakhstan 512 – – – 650 1,162
Kyrgyz Republic 1,000 (39) – 225 225 1,411
Lao People’s Democratic Republic – (50) – – 2,445 2,395
Maldives – (29) – – 225 196
Marshall Islands (9) – – 300 – 291
Federated States of Micronesia – (50) – – – (50)
Mongolia (1) (125) – (33) 600 441
Nauru – (126) – – 200 74
Nepal 64 (1,098) – 1,500 251 717
Pakistan (782) (1,882) – (803) 4,000 534
Papua New Guinea 1,073 – – 800 – 1,873
Philippines 546 (571) – (100) 1,725 1,600
Samoa (80) – – – – (80)
Solomon Islands (65) – – – 675 610
Sri Lanka 1,618 (237) – 300 1,056 2,737
Tajikistan – (750) – 600 – (150)
Thailand (22) – – 450 – 428
Timor-Leste – – – – 250 250
Turkmenistan (74) – – – – (74)
Uzbekistan 1,785 (43) – 750 – 2,492
Viet Nam 4,475 (436) – – 3,125 7,163
Regional 2,364 – 20,231 8,006 21,430 52,031
Total $23,710 $(9,312) $20,231 $21,141 $52,469 108,238
Regional Activities 3,700
tOtaL $111,938
Notes: (i) Numbers may not sum precisely because of rounding. (ii) Negative amounts represent net undisbursed commitments written back to balances available for future commitments (Notes B and E).The accompanying notes are an integral part of these financial statements (TASF-6).

asian DEVELOpMEnt BanK—tEchnicaL assistancE spEciaL FUnD
NOTES TO FINANCIAL STATEMENTS31 December 2011 and 2010
Technical Assistance Special Fund
141
tasF-6
NOTE A—NATURE OF OPERATIONS
The Asian Development Bank (ADB), a multilateral development financial institution, was established in 1966 with its headquarters in Manila, Philippines. ADB and its operations are governed by the Agreement Establishing the Asian Development Bank (the Charter). Its purpose is to foster economic development and co-operation in Asia and the Pacific region and to contribute to the acceleration of the process of economic development of the developing member countries (DMCs) in the region, collectively and individually. Since 1999, ADB’s corporate vision and mission has been to help DMCs reduce poverty in the region. This was reaffirmed under the long-term strategic framework for 2008–2020 (Strategy 2020). Under Strategy 2020, ADB’s corporate vision continues to be “An Asia and Pacific Free of Poverty” and its mission has been to help its DMCs reduce poverty and improve living conditions and quality of life. ADB has been pursuing its mission and vision by focusing on three complementary strategic agendas: inclusive growth, environmentally sustainable growth, and regional integration. ADB provides financial and technical assistance for projects and programs, which will contribute to achieving this purpose. These are financed through ordinary capital resources (OCR) and Special Funds.1
The TASF was established to provide technical assistance on a grant basis to DMCs of ADB and for regional technical assistance. TASF resources consist of regularized replenishments and direct voluntary contributions by members, allocations from the net income of OCR, and revenue from investments and other sources.
In August 2008, the Board of Governors adopted the resolution providing for the ninth replenishment of the Asian Development Fund (ADF X) and the fourth regularized replenishment of the TASF. In conjunction with the ADF replenishment, the resolution provides for a replenishment of the TASF to finance technical assistance operations under the fund. Total replenishment size is SDR7,490,301,000, of which SDR2,665,765,000 will come from new donor contributions. Donors agreed to allocate 3% of the total replenishment size (equivalent to 8% of total donor contributions) to TASF. The replenishment became effective on 16 June 2009. As of 31 December 2011, ADB received instruments of contributions from 29 donors with a total amount equivalent to SDR2,578,687,000, including qualified contribution amounting to about SDR502,451,000.
ADB is immune from taxation pursuant to Chapter VIII, Article 56, Exemption from Taxation, of the Charter.
NOTE B—SUMMARY OF SIGNIFICANT ACCOUNTING POLICIES
Presentation of the Financial Statements
The financial statements of the TASF are prepared in accordance with accounting principles generally accepted in the United States of America (US GAAP), and are presented on the basis of those for not-for-profit organizations.
TASF reports donors’ contributions of cash and other assets as unrestricted assets as these are made available to TASF without conditions other than for the purpose of pursuing its objectives.
1 Asian Development Fund (ADF), Technical Assistance Special Fund (TASF), Japan Special Fund (JSF), ADB Institute (ADBI), Asian Tsunami Fund (ATF), Pakistan Earthquake Fund (PEF), Regional Cooperation and Integration Fund (RCIF), Climate Change Fund (CCF), and Asia Pacific Disaster Response Fund (APDRF).

asian DEVELOpMEnt BanK—tEchnicaL assistancE spEciaL FUnD
NOTES TO FINANCIAL STATEMENTS31 December 2011 and 2010
Asian Development Bank Annual Report 2011
142
Functional and Reporting Currency
The United States dollar is the functional and reporting currency, representing the currency of the primary economic operating environment of TASF.
Translation of Currencies
ADB adopts the use of daily exchange rates for accounting and financial reporting purposes. This allows transactions denominated in non-US dollar to be translated to the reporting currency using exchange rates applicable at the time of transactions. Contributions included in the financial statements during the year are recognized at applicable exchange rates as of the respective dates of commitment. At the end of each accounting month, translations of assets, liabilities, and uncommitted balances which are denominated in non-US dollar are adjusted using the applicable rates of exchange at the end of the reporting period. These translation adjustments are accounted for as exchange gains or losses and are credited or charged to operations.
Investments
All investment securities held by TASF are reported at fair value. Realized and unrealized gains and losses are included in “Revenue from investments.” Time deposits are reported at cost which is a reasonable estimate of fair value.
Interest income on time deposits are recognized as realized and reported in revenue from investments.
Securities Purchased under Resale Arrangement
TASF accounts for the transfer of financial assets in accordance with Financial Accounting Standards Board (FASB) Accounting Standards Codification (ASC) 860, “Transfers and Servicing.” In general, transfers are accounted for as sales under ASC 860 when control over the transferred assets has been relinquished. Otherwise, the transfers are accounted for as resale arrangements and collateralized financing arrangements. Securities purchased under resale arrangement are recorded as assets and are not re-pledged.
Contributions
The contributions from donors and the allocations from OCR net income are included in the financial statements from the date of effectivity of the contribution agreement, and the Board of Governors’ approval, respectively.
Technical Assistance and Undisbursed Commitments
Technical assistance (TA) and grants are recognized in the financial statements when the project is approved and becomes effective. Upon completion or cancellation of a TA project, any undisbursed amount is written back as a reduction in technical assistance for the year and the corresponding undisbursed commitment is eliminated accordingly.

tasF-6
cOntinUED
Technical Assistance Special Fund
143
Advances are provided from TA and grants to the executing agency or co-operating institution, for the purpose of making payments for eligible expenses. The advances are subject to liquidation and charged against undisbursed commitment. Any unutilized portion is required to be returned to the fund. These are included in “ADVANCES FOR GRANTS AND OTHER ASSETS.”
Accounting Estimates
The preparation of financial statements in conformity with generally accepted accounting principles requires management to make reasonable estimates and assumptions that affect the reported amounts of assets and liabilities and uncommitted balances as of the end of the year and the reported amounts of revenue and expenses during the year. The actual results could differ from those estimates.
Accounting and Reporting Developments
Accounting Standards Update (ASU) 2010-06, “Fair Value Measurements and Disclosures (Topic 820) – Improving Disclosures about Fair Value Measurements” with respect to the separate disclosures about gross purchases, sales, issuances, and settlements relating to Level 3 measurements is effective for fiscal years beginning after 15 December 2010 and for interim periods within those fiscal years. This update did not have a material impact on TASF’s financial statements.
In April 2011, the FASB issued ASU 2011-03, “Transfers and Servicing (Topic 860) – Reconsideration of Effective Control for Repurchase Agreements.” The update removes from the assessment of effective control the criterion requiring the transferor to have the ability to repurchase or redeem the financial assets on substantially the agreed terms, even in the event of default by the transferee. It does not change the other criteria used in the assessment of effective control. This update is applicable prospectively to new transactions and transactions that are modified on or after the first interim or annual period beginning 15 December 2011. This update did not have an impact on TASF’s 31 December 2011 financial statements.
In May 2011, the FASB issued ASU 2011-04, “Fair Value Measurement (Topic 820) – Amendments to Achieve Common Fair Value Measurement and Disclosure Requirements in US GAAP and IFRSs,” which provides the consistency between US GAAP and International Financial Reporting Standards (IFRSs) on the definition of fair value (FV) and on the guidance on how to measure FV and on what to disclose about FV measurements. The amendments to the update do not require additional FV measurements and are not intended to establish valuation standards or affect valuation practices outside of financial reporting. The new guidance will require prospective application and are effective for interim and annual periods beginning on or after 15 December 2011. ADB is currently assessing the impact of this update on TASF’s financial statements.
Statement of Cash Flows
For the purposes of the Statement of Cash Flows, the TASF considers that its cash and cash equivalents are limited to “DUE FROM BANKS,” which consists of cash on hand and current accounts in banks used for (i) operational disbursements, (ii) receipt of funds from encashment of donor countries’ promissory notes, and (iii) clearing accounts.
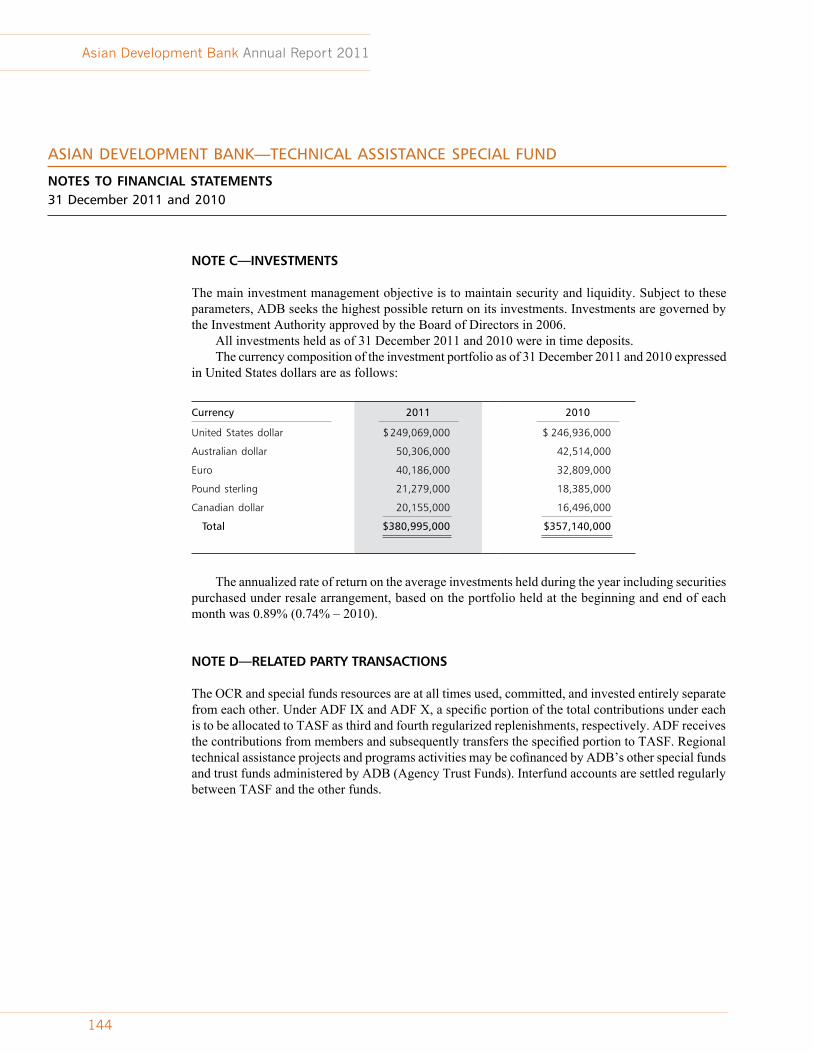
asian DEVELOpMEnt BanK—tEchnicaL assistancE spEciaL FUnD
NOTES TO FINANCIAL STATEMENTS31 December 2011 and 2010
Asian Development Bank Annual Report 2011
144
NOTE C—INVESTMENTS
The main investment management objective is to maintain security and liquidity. Subject to these parameters, ADB seeks the highest possible return on its investments. Investments are governed by the Investment Authority approved by the Board of Directors in 2006.
All investments held as of 31 December 2011 and 2010 were in time deposits. The currency composition of the investment portfolio as of 31 December 2011 and 2010 expressed
in United States dollars are as follows:
currency 2011 2010
United States dollar $ 249,069,000 $ 246,936,000
Australian dollar 50,306,000 42,514,000
Euro 40,186,000 32,809,000
Pound sterling 21,279,000 18,385,000
Canadian dollar 20,155,000 16,496,000
total $380,995,000 $357,140,000
The annualized rate of return on the average investments held during the year including securities purchased under resale arrangement, based on the portfolio held at the beginning and end of each month was 0.89% (0.74% – 2010).
NOTE D—RELATED PARTY TRANSACTIONS
The OCR and special funds resources are at all times used, committed, and invested entirely separate from each other. Under ADF IX and ADF X, a specific portion of the total contributions under each is to be allocated to TASF as third and fourth regularized replenishments, respectively. ADF receives the contributions from members and subsequently transfers the specified portion to TASF. Regional technical assistance projects and programs activities may be cofinanced by ADB’s other special funds and trust funds administered by ADB (Agency Trust Funds). Interfund accounts are settled regularly between TASF and the other funds.

tasF-6
cOntinUED
Technical Assistance Special Fund
145
The interfund account balances included in “ADVANCES FOR GRANTS AND OTHER ASSETS” and “ACCOUNTS PAYABLE AND OTHER LIABILITIES” are as follows:
2011 2010
Receivable from:
Japan Special Fund $11,000 $ 9,000
Regional Cooperation and Integration Fund – 5,000
Agency Trust Funds—net – 247,000
Total $11,000 $261,000
payable to:
Ordinary capital resources $ 2,000 $ 95,000
Regional Cooperation and Integration Fund 48,000 –
Climate Change Fund 11,000 –
Agency Trust Funds—net 37,000 –
Total $98,000 $ 95,000
NOTE E—UNDISBURSED COMMITMENTS
Undisbursed commitments are denominated in United States dollars and represent effective ongoing grant-financed TA projects/programs, which are not yet disbursed and unliquidated as of the end of the year. During 2011, $18,982,000 ($11,752,000 – 2010) representing completed and cancelled TA projects was written back as a reduction in technical assistance of the period and the corresponding undisbursed commitment was eliminated. The fair value of undisbursed commitments approximates the amounts undisbursed, because ADB expects that disbursements will be made for all projects/programs covered by the commitments.
NOTE F—CONTRIBUTIONS AND UNCOMMITTED BALANCES
Since inception in 1967, direct contributions have been made by 29 member countries. In 2011, Pakistan made a direct and voluntary contribution amounting to $70,000.
In 1986, 1992, 2005, and 2009, the Board of Governors of ADB, in authorizing replenishments of the ADF, provided for allocations to the TASF in aggregate amounts equivalent to $72,000,000, $141,000,000, $220,000,000, and $288,000,000, respectively, to be used for technical assistance to ADF-borrowing DMCs and for regional technical assistance. During the year, the fund received $1,964,000 and $75,112,000 under ADF IX and ADF X replenishments, respectively, leaving a total of $129,083,000 as “DUE FROM CONTRIBUTORS.”
In 2011, $40,000,000 was allocated from OCR net income to TASF, bringing the accumulated allocation from OCR net income to $809,000,000.

asian DEVELOpMEnt BanK—tEchnicaL assistancE spEciaL FUnD
NOTES TO FINANCIAL STATEMENTS31 December 2011 and 2010
Asian Development Bank Annual Report 2011
146
Some of the direct contributions received can be subject to restricted procurement sources, while some are given on condition that the technical assistance be made on a reimbursable basis. The total contributions received for the years ended 31 December 2011 and 2010 were without any restrictions.
Uncommitted balances comprise amounts which have not been committed by ADB as of 31 December 2011 and 2010. These balances include approved TA projects/programs that are not yet effective.
NOTE G—FAIR VALUE MEASUREMENTS
ASC 820 defines fair value as the price that would be received to sell an asset or paid to transfer a liability at measurement date (exit price) in an orderly transaction among willing participants with an assumption that the transaction takes place in the entity’s principal market, the most advantageous market for the asset or liability. The most advantageous market is where the sale of the asset or transfer of liability would maximize the amount received for the asset or minimize the amount paid to transfer the liability. The fair value measurement is not adjusted for transaction cost.
ASC 820 also establishes a fair value hierarchy that gives the highest priority to quoted prices in active markets for identical assets or liabilities (Level 1), next priority to observable market inputs or market corroborated data (Level 2), and the lowest priority to unobservable inputs without market corroborated data (Level 3). ASC 820 requires the fair value measurement to maximize the use of market observable inputs.
The following guidelines are applied in determining the fair values of financial instruments:
Investments and Securities Purchased under Resale Arrangements
Readily marketable investments are fair valued using active market quotes in Level 1 category. Level 2 category includes investments and securities purchased under resale arrangements which are fair valued with significant market observable inputs.

tasF-6
cOntinUED
Technical Assistance Special Fund
147
The fair value of the following financial assets of TASF as of 31 December 2011 and 2010 were reported based on the following:
Fair Value Measurements
Quoted prices in active Markets
for identical assets
significant Market Observable
inputs
significant Unobservable
inputs31 December 2011 (Level 1) (Level 2) (Level 3)
assets
Investments Time deposits $ 380,995,000 $ – $ 380,995,000 $ –
Securities purchased under resale arrangement 10,923,000 – 10,923,000 –
total assets at fair value $391,918,000 $ – $391,918,000 $ –
Fair Value Measurements
Quoted prices in active Markets
for identical assets
significant Market Observable
inputs
significant Unobservable
inputs31 December 2010 (Level 1) (Level 2) (Level 3)
assets
Investments Time deposits $ 357,140,000 $ – $ 357,140,000 $ –
Securities purchased under resale arrangement 4,906,000 – 4,906,000 –
total assets at fair value $362,046,000 $ – $362,046,000 $ –
See Notes C and E for discussions relating to investments and undisbursed commitments, respectively. In all other cases, the carrying amounts of TASF’s assets, liabilities, and uncommitted balances are considered to approximate fair values for all significant financial instruments.
nOtE h—sUBsEQUEnt EVEnts
ADB has evaluated subsequent events after 31 December 2011 through 14 March 2012, the date these Financial Statements are available for issuance. As a result of this evaluation, there are no subsequent events, as defined, that require recognition or disclosure in the TASF’s Financial Statements as of 31 December 2011.

Asian Development Bank Annual Report 2011
148
Japan special Fund
MANAGEMENT’S REPORT ON INTERNAL CONTROL OVER FINANCIAL REPORTING
The management of Asian Development Bank (“ADB”) is responsible for establishing and maintaining adequate internal control over financial reporting. ADB’s internal control over financial reporting is a process designed to provide reasonable assurance regarding the reliability of financial reporting and the preparation of financial statements for external purposes in accordance with generally accepted accounting principles in the United States of America.
ADB’s internal control over financial reporting includes those policies and procedures that (i) pertain to the maintenance of records that, in reasonable detail, accurately and fairly reflect the transactions and dispositions of the assets of ADB; (ii) provide reasonable assurance that transactions are recorded as necessary to permit preparation of financial statements in accordance with generally accepted accounting principles in the United States of America, and that receipts and expenditures of ADB are being made only in accordance with authorizations of management and directors of ADB; and (iii) provide reasonable assurance regarding prevention or timely detection of unauthorized acquisition, use, or disposition of ADB’s assets that could have a material effect on the financial statements.
Because of its inherent limitations, internal control over financial reporting may not prevent or detect misstatements. Also, projections of any evaluation of effectiveness to future periods are subject to the risk that controls may become inadequate because of changes in conditions, or that the degree of compliance with the policies or procedures may deteriorate.
ADB’s management assessed the effectiveness of ADB’s internal control over financial reporting as of 31 December 2011. In making this assessment, ADB’s management used the criteria set forth by the Committee of Sponsoring Organizations of the Treadway Commission in Internal Control – Integrated Framework. Based on that assessment, management believes that as of 31 December 2011, ADB’s internal control over financial reporting is effective based upon the criteria established in Internal Control – Integrated Framework.
Haruhiko KurodaPresident
Thierry de LonguemarVice-President (Finance and Administration)
Hiroshi FukukawaOfficer-in-Charge, Controller’s Department
14 March 2012

Japan Special Fund
149
Deloitte Touche LLPCertified Public AccountantsUnique Entity No. T08LL0721A6 Shenton Way #32-00DBS Building Tower TwoSingapore 068809
Tel: +65 6224 8288Fax: +65 6538 6166www.deloitte.com/sg
INDEPENDENT AUDITORS’ REPORT
To the Board of Directors and the Board of Governors of Asian Development Bank
We have audited management’s assertion, included in the accompanying Management’s Report on Internal Control over Financial Reporting, that Asian Development Bank (“ADB”) maintained effective internal control over financial reporting as of December 31, 2011, based on the criteria established in Internal Control — Integrated Framework issued by the Committee of Sponsoring Organizations of the Treadway Commission. ADB’s management is responsible for maintaining effective internal control over financial reporting and for its assertion of the effectiveness of internal control over financial reporting, included in the accompanying Management’s Report on Internal Control over Financial Reporting. Our responsibility is to express an opinion on management’s assertion based on our audit.
We conducted our audit in accordance with attestation standards established by the American Institute of Certified Public Accountants. Those standards require that we plan and perform the audit to obtain reasonable assurance about whether effective internal control over financial reporting was maintained in all material respects. Our audit included obtaining an understanding of internal control over financial reporting, assessing the risk that a material weakness exists, and testing and evaluating the design and operating effectiveness of internal control based on the assessed risk. Our audit also included performing such other procedures as we considered necessary in the circumstances. We believe that our audit provides a reasonable basis for our opinion.
ADB’s internal control over financial reporting is a process designed to provide reasonable assurance regarding the reliability of financial reporting and the preparation of financial statements for external purposes in accordance with accounting principles generally accepted in the United States of America. ADB’s internal control over financial reporting includes those policies and procedures that (1) pertain to the maintenance of records that, in reasonable detail, accurately and fairly reflect the transactions and dispositions of the assets of ADB; (2) provide reasonable assurance that transactions are recorded as necessary to permit preparation of financial statements in accordance with accounting principles generally accepted in the United States of America, and that receipts and expenditures of ADB are being made only in accordance with authorizations of management and directors of ADB; and (3) provide reasonable assurance regarding prevention or timely detection of unauthorized acquisition, use, or disposition of ADB’s assets that could have a material effect on the financial statements.
Deloitte Touche LLP (Unique Entity No. T08LL0721A) is an accounting limited liability partnership registered in Singaporeunder the Limited Liability Partnerships Act (Chapter 163A).

Asian Development Bank Annual Report 2011
150
Because of the inherent limitations of internal control over financial reporting, including the possibility of collusion or improper management override of controls, material misstatements due to error or fraud may not be prevented or detected and corrected on a timely basis. Also, projections of any evaluation of the effectiveness of the internal control over financial reporting to future periods are subject to the risk that the controls may become inadequate because of changes in conditions or that the degree of compliance with the policies or procedures may deteriorate.
In our opinion, management’s assertion that ADB maintained effective internal control over financial reporting as of December 31, 2011, is fairly stated, in all material respects, based on the criteria established in Internal Control — Integrated Framework issued by the Committee of Sponsoring Organizations of the Treadway Commission.
We have also audited, in accordance with auditing standards generally accepted in the United States of America, the accompanying statement of financial position of Asian Development Bank (“ADB”) – Japan Special Fund as of December 31, 2011 and 2010 and the related statements of activities and changes in net assets, and cash flows, for each of the years in the two-year period ended December 31, 2011 and our report dated March 14, 2012 expressed an unqualified opinion on those financial statements.
Public Accountants and Certified Public Accountants
SingaporeMarch 14, 2012

Japan Special Fund
151
Deloitte Touche LLPCertified Public AccountantsUnique Entity No. T08LL0721A6 Shenton Way #32-00DBS Building Tower TwoSingapore 068809
Tel: +65 6224 8288Fax: +65 6538 6166www.deloitte.com/sg
INDEPENDENT AUDITORS’ REPORT
To the Board of Directors and the Board of Governors of Asian Development Bank
We have audited the accompanying statement of financial position of Asian Development Bank (“ADB”) – Japan Special Fund as of December 31, 2011 and 2010 and the related statements of activities and changes in net assets, and cash flows, for each of the years in the two-year period ended December 31, 2011. These financial statements are the responsibility of ADB’s management. Our responsibility is to express an opinion on these financial statements based on our audits. We conducted our audits in accordance with auditing standards generally accepted in the United States of America. Those standards require that we plan and perform the audit to obtain reasonable assurance about whether the financial statements are free of material misstatement. An audit includes examining, on a test basis, evidence supporting the amounts and disclosures in the financial statements, assessing the accounting principles used and significant estimates made by management, as well as evaluating the overall financial statement presentation. We believe that our audits provide a reasonable basis for our opinion.
In our opinion, such financial statements present fairly, in all material respects, the financial position of ADB – Japan Special Fund as of December 31, 2011 and 2010, and the results of its operations and its cash flows for each of the years in the two-year period ended December 31, 2011 in conformity with accounting principles generally accepted in the United States of America.
We have also audited, in accordance with attestation standards established by the American Institute of Certified Public Accountants, management’s assertion that ADB maintained effective internal control over financial reporting as of December 31, 2011, based on the criteria established in Internal Control — Integrated Framework issued by the Committee of Sponsoring Organizations of the Treadway Commission and our report dated March 14, 2012 expressed an unqualified opinion on management’s assertion that ADB maintained effective internal control over financial reporting.
Public Accountants and Certified Public Accountants
SingaporeMarch 14, 2012
Deloitte Touche LLP (Unique Entity No. T08LL0721A) is an accounting limited liability partnership registered in Singaporeunder the Limited Liability Partnerships Act (Chapter 163A).

Asian Development Bank Annual Report 2011
152
JsF-1
asian DEVELOpMEnt BanK—Japan spEciaL FUnD
STATEMENT OF FINANCIAL POSITION31 December 2011 and 2010 Expressed in thousands of United states Dollars
2011 2010
accsF
JsF Regular and
supplementary total accsF
JsF Regular and
supplementary total
assEts
DUE FROM BANKS $ 172 $ 216 $ 388 $ 70 $ 285 $ 355
INVESTMENTS (Notes C and G)
Government or government-guaranteed obligations 2,991 – 2,991 – – – Time deposits 33,546 93,890 127,436 36,582 121,364 157,946
36,537 93,890 130,427 36,582 121,364 157,946
ACCRUED REVENUE 2 4 6 3 12 15
ADVANCES FOR TECHNICAL ASSISTANCE AND OTHER ASSETS (Note D)1 – 1,807 1,806 – 3,974 3,973
tOtaL1 $36,711 $95,917 $132,627 $36,655 $125,635 $162,289
LiaBiLitiEs anD nEt assEts
ACCOUNTS PAYABLE AND OTHER LIABILITIES (Note D)1 $ 1 $ 62 $ 62 $ 1 $ 313 $ 313
UNDISBURSED COMMITMENTS (Notes E and G)
Technical assistance – 38,432 38,432 – 72,512 72,512
TOTAL LIABILITIES1 1 38,494 38,494 1 72,825 72,825
NET ASSETS (JSF-2), represented by:
Uncommitted balances (Note F)Unrestricted – 57,423 57,423 – 52,810 52,810 Temporarily restricted 28,199 – 28,199 28,199 – 28,199
28,199 57,423 85,622 28,199 52,810 81,009
Net accumulated investment income (Note F) Temporarily restricted 8,511 – 8,511 8,455 – 8,455
36,710 57,423 94,133 36,654 52,810 89,464
tOtaL1 $36,711 $95,917 $132,627 $36,655 $125,635 $162,289
1 Numbers may not sum precisely due to elimination of interfund account of $1,000 ($1,000 – 2010).The accompanying notes are an integral part of these financial statements (JSF-4).

Japan Special Fund
153
2011 2010
accsF
JsF Regular and
supplementary total accsF
JsF Regular and
supplementary total
changEs in UnREstRictED nEt assEts
REVENUE FROM INVESTMENTS (Note C) $ – $ 217 $ 217 $ – $ 375 $ 375
REVENUE FROM OTHER SOURCES – 14 14 0 18 18
NET ASSETS REVERTED FROM TEMPORARILY RESTRICTED ASSETS 1 – 1 1 – 1
Total 1 231 232 1 393 394
EXPENSES
Technical assistance—net (Note E) – (4,691) (4,691) – 14,687 14,687 Administrative and financial expenses 1 304 305 1 732 733
Total 1 (4,387) (4,386) 1 15,419 15,420
REVENUE IN EXCESS OF (LESS THAN) EXPENSES – 4,618 4,618 0 (15,026) (15,026)
EXCHANGE LOSSES – (5) (5) – (5) (5)
INCREASE (DECREASE) IN UNRESTRICTED NET ASSETS – 4,613 4,613 0 (15,031) (15,031)
changEs in tEMpORaRiLy REstRictED nEt assEts
REVENUE FROM INVESTMENTS AND OTHER SOURCES 57 – 57 92 – 92
NET ASSETS REVERTED TO TEMPORARILY RESTRICTED ASSETS (1) – (1) (1) – (1)
INCREASE IN TEMPORARILY RESTRICTED NET ASSETS 56 – 56 91 – 91
INCREASE (DECREASE) IN NET ASSETS 56 4,613 4,669 91 (15,031) (14,940)
NET ASSETS AT BEGINNING OF YEAR 36,654 52,810 89,464 36,563 67,841 104,404
nEt assEts at EnD OF yEaR $36,710 $57,423 $94,133 $36,654 $52,810 $89,464
0 = Less than $500.The accompanying notes are an integral part of these financial statements (JSF-4).
JsF-2
asian DEVELOpMEnt BanK—Japan spEciaL FUnD
STATEMENT OF ACTIVITIES AND CHANGES IN NET ASSETSFor the Years Ended 31 December 2011 and 2010 Expressed in thousands of United states Dollars

Asian Development Bank Annual Report 2011
154
JsF-3
asian DEVELOpMEnt BanK—Japan spEciaL FUnD
STATEMENT OF CASH FLOWSFor the Years Ended 31 December 2011 and 2010 Expressed in thousands of United states Dollars
2011 2010
accsF
JsF Regular and
supplementary total accsF
JsF Regular and
supplementary total
CASH FLOWS FROM OPERATING ACTIVITIES
Interest on investments received $ 65 $ 226 $ 291 $ 90 $ 372 $ 462Technical assistance disbursed 0 (27,341) (27,341) (6) (36,769) (36,775)Administrative and financial expenses paid (1) (438) (439) (1) (769) (770)Net cash received from other sources 0 10 10 0 12 12
Net Cash Provided by (Used in) Operating Activities 64 (27,543) (27,479) 83 (37,154) (37,071)
CASH FLOWS FROM INVESTING ACTIVITIES
Maturities of investments 2,015,297 5,085,747 7,101,044 1,802,229 3,712,223 5,514,452 Purchases of investments (2,015,259) (5,058,273) (7,073,532) (1,802,319) (3,675,099) (5,477,418)
Net Cash Provided by (Used in) Investing Activities 38 27,474 27,512 (90) 37,124 37,034
Effect of Exchange Rate Changes on Due from Banks – 0 0 – 0 0
Net Increase (Decrease) in Due from Banks 102 (69) 33 (7) (30) (37)
Due from Banks at Beginning of Year 70 285 355 77 315 392
Due from Banks at End of Year $ 172 $ 216 $ 388 $ 70 $ 285 $ 355
RECONCILIATION OF INCREASE (DECREASE) IN NET ASSETS TO NET CASH PROVIDED BY (USED IN) OPERATING ACTIVITIES:
Increase (decrease) in net assets (JSF-2) $ 56 $ 4,613 $ 4,669 $ 91 $ (15,031) $ (14,940)Adjustments to reconcile increase (decrease)
in net assets to net cash provided by (used in) operating activities:
Amortization of discounts on investments (0) – (0) – – – Unrealized investment gains 8 – 8 – – – Change in undisbursed commitments – (34,080) (34,080) – (21,569) (21,569)Others—net 0 1,923 1,923 (8) (553) (561)Exchange losses (gains)—net – 1 1 – (1) (1)
Net Cash Provided by (Used in) Operating Activities $ 64 $ (27,543) $ (27,479) $ 83 $ (37,154) $ (37,071)
0 = Less than $500.The accompanying notes are an integral part of these financial statements (JSF-4).

asian DEVELOpMEnt BanK—Japan spEciaL FUnD
NOTES TO FINANCIAL STATEMENTS31 December 2011 and 2010
Japan Special Fund
155
JsF-4
NOTE A—NATURE OF OPERATIONS
The Asian Development Bank (ADB), a multilateral development financial institution, was established in 1966 with its headquarters in Manila, Philippines. ADB and its operations are governed by the Agreement Establishing the Asian Development Bank (the Charter). Its purpose is to foster economic development and co-operation in Asia and the Pacific region and to contribute to the acceleration of the process of economic development of the developing member countries (DMCs) in the region, collectively and individually. Since 1999, ADB’s corporate vision and mission has been to help DMCs reduce poverty in the region. This was reaffirmed under the long-term strategic framework for 2008–2020 (Strategy 2020). Under Strategy 2020, ADB’s corporate vision continues to be “An Asia and Pacific Free of Poverty” and its mission has been to help its DMCs reduce poverty and improve living conditions and quality of life. ADB has been pursuing its mission and vision by focusing on three complementary strategic agendas: inclusive growth, environmentally sustainable growth, and regional integration. ADB provides financial and technical assistance for projects and programs, which will contribute to achieving this purpose. These are financed through ordinary capital resources (OCR) and Special Funds.1
The JSF was established in March 1988 when the Government of Japan and ADB entered into a financial arrangement whereby the Government of Japan agreed to make an initial contribution and ADB became the administrator. The purpose of JSF is to help DMCs of ADB restructure their economies and broaden the scope of opportunities for new investments, thereby assisting the recycling of funds to DMCs of ADB. While JSF resources are used mainly to finance technical assistance (TA) operations, these resources may also be used for equity investment operations in ADB’s DMCs. Under the agreement between ADB and Japan, ADB may invest the proceeds of JSF pending disbursement.
In March 1999, the Board approved the acceptance and administration by ADB of the Asian Currency Crisis Support Facility (ACCSF) to assist Asian currency crisis-affected member countries (CAMCs). Funded by the Government of Japan, ACCSF was established within JSF to assist in the economic recovery of CAMCs through interest payment assistance (IPA) grants, TA grants, and guarantees. With the general fulfillment of the purpose of the facility, the Government of Japan and ADB agreed to terminate the ACCSF on 22 March 2002 and all projects were financially completed as of 31 December 2011. Subject to the Government of Japan’s instruction, the remaining funds will be retained in ACCSF until the completion of administrative matters.
ADB is immune from taxation pursuant to Chapter VIII, Article 56, Exemption from Taxation, of the Charter.
NOTE B—SUMMARY OF SIGNIFICANT ACCOUNTING POLICIES
Presentation of the Financial Statements
The financial statements of JSF are prepared in accordance with accounting principles generally accepted in the United States of America (US GAAP), and are presented on the basis of those for not-for-profit organizations and as unrestricted and temporarily restricted net assets. ACCSF funds are separately reported in the financial statements.
1 Asian Development Fund (ADF), Technical Assistance Special Fund (TASF), Japan Special Fund (JSF), ADB Institute (ADBI), Asian Tsunami Fund (ATF), Pakistan Earthquake Fund (PEF), Regional Cooperation and Integration Fund (RCIF), Climate Change Fund (CCF), and Asia Pacific Disaster Response Fund (APDRF).

asian DEVELOpMEnt BanK—Japan spEciaL FUnD
NOTES TO FINANCIAL STATEMENTS31 December 2011 and 2010
Asian Development Bank Annual Report 2011
156156
JSF reports the contributions of cash and other assets as restricted support if they are received with donor stipulations that limit the use of the donated assets. When the donor restriction expires, that is, when a stipulated time or purpose restriction is accomplished, temporarily restricted net assets are reclassified to unrestricted net assets and reported in the Statement of Activities and Changes in Net Assets as “NET ASSETS REVERTED TO TEMPORARILY RESTRICTED ASSETS.”
Functional and Reporting Currency
The United States dollar is the functional and reporting currency, representing the currency of the primary economic operating environment of JSF.
Translation of Currencies
ADB adopts the use of daily exchange rates for accounting and financial reporting purposes. This allows transactions denominated in non-US dollar to be translated to the reporting currency using exchange rates applicable at the time of transactions. Contributions included in the financial statements during the year are recognized at applicable exchange rates as of the respective dates of commitment. At the end of each accounting month, translations of assets, liabilities, and uncommitted balances which are denominated in non-US dollar are adjusted using the applicable rates of exchange at the end of the reporting period. These translation adjustments are accounted for as exchange gains or losses and are credited or charged to operations.
Investments
All investment securities held by JSF are reported at fair value. Realized and unrealized gains and losses are included in revenue. Time deposits are reported at cost which is a reasonable estimate of fair value.
Interest income on investment securities and time deposits are recognized as realized and reported, net of amortizations of premiums and discounts, as “REVENUE FROM INVESTMENTS.”
Contributions
Contributions by Japan are included in the financial statements from the date indicated by Japan that funds are expected to be made available. Contributions, which are restricted by the donor for specific TA projects/programs or for IPA grants, are classified as temporarily restricted contributions. Those without any stipulation as to specific use are accounted for and reported as unrestricted contributions.
Technical Assistance and Undisbursed Commitments
Technical assistance is recognized in the financial statements when the project is approved and becomes effective. Upon completion of a TA project or cancellation of a grant, any undisbursed amount is written back as a reduction in the TA for the year and the corresponding undisbursed commitment is eliminated accordingly.

JsF-4
cOntinUED
Japan Special Fund
157
Advances are provided from technical assistance grant funds to the executing agency or co-operating institution, for the purpose of making payments for eligible expenses. The advances are subject to liquidation and charged against undisbursed commitment. Any unutilized portion is required to be returned to the fund. These are included in “ADVANCES FOR TECHNICAL ASSISTANCE AND OTHER ASSETS.”
Accounting Estimates
The preparation of financial statements in conformity with generally accepted accounting principles requires management to make reasonable estimates and assumptions that affect the reported amounts of assets and liabilities as of the end of the year and the reported amounts of income and expenses during the year. The actual results could differ from those estimates.
Accounting and Reporting Developments
Accounting Standards Update (ASU) 2010-06, “Fair Value Measurements and Disclosures (Topic 820) – Improving Disclosures about Fair Value Measurements” with respect to the separate disclosures about gross purchases, sales, issuances, and settlements relating to Level 3 measurements is effective for fiscal years beginning after 15 December 2010 and for interim periods within those fiscal years. This update did not have a material impact on JSF’s financial statements as of 31 December 2011.
In May 2011, the Financial Accounting Standards Board (FASB) issued ASU 2011-04, “Fair Value Measurement (Topic 820) – Amendments to Achieve Common Fair Value Measurement and Disclosure Requirements in US GAAP and IFRSs,” which provides the consistency between US GAAP and International Financial Reporting Standards (IFRSs) on the definition of fair value (FV) and on the guidance on how to measure FV and on what to disclose about FV measurements. The amendments to the update do not require additional FV measurements and are not intended to establish valuation standards or affect valuation practices outside of financial reporting. The new guidance will require prospective application and are effective for interim and annual periods beginning on or after 15 December 2011. ADB is currently assessing the impact of this update on JSF’s financial statements.
Statement of Cash Flows
For the purposes of the Statement of Cash Flows, the JSF considers that its cash and cash equivalents are limited to “DUE FROM BANKS,” which consists of cash on hand and current accounts in banks used for operational disbursements.
NOTE C—INVESTMENTS
The main investment management objective is to maintain security and liquidity. Subject to these parameters, ADB seeks the highest possible return on its investments. Investments are governed by the Investment Authority approved by the Board of Directors in 2006.

asian DEVELOpMEnt BanK—Japan spEciaL FUnD
NOTES TO FINANCIAL STATEMENTS31 December 2011 and 2010
Asian Development Bank Annual Report 2011
158
The annualized rates of return on the average investments held under ACCSF and JSF during the year, based on the portfolio held at the beginning and end of each month were 0.16% and 0.21%, respectively (0.25% and 0.27%, respectively – 2010).
NOTE D—RELATED PARTY TRANSACTIONS
The OCR and special funds resources are at all times used, committed, and invested entirely separate from each other. The administrative and operational expenses pertaining to JSF are settled regularly with OCR and other funds. Regional technical assistance projects and programs may be combined activities financed by special and trust funds.
The interfund balances between other funds, which are included in “ADVANCES FOR TECHNICAL ASSISTANCE AND OTHER ASSETS” and “ACCOUNTS PAYABLE AND OTHER LIABILITIES” are as follows:
2011 2010
Amounts Receivable by:
JSF from: ACCSF $ 1,000 $ 1,000
Amounts Payable by:
JSF to: OCR $12,000 $134,000
TASF 11,000 9,000
RCIF – 94,000
Agency Trust Funds—net 6,000 15,000
Total $29,000 $252,000
ACCSF to: JSF $ 1,000 $ 1,000
NOTE E—UNDISBURSED COMMITMENTS
Undisbursed commitments are denominated in United States dollars and represent effective TA projects/programs not yet disbursed and unliquidated. Completed but partially cancelled TA projects amounting to $5,391,000 were written back as a reduction in technical assistance during 2011 ($8,770,000 – 2010), and the corresponding undisbursed commitments was eliminated. None of this amount corresponds to ACCSF (nil – 2010). The fair value of undisbursed commitments approximates the amounts outstanding, because ADB expects that disbursements will substantially be made for all the projects/programs covered by the commitments.

JsF-4
cOntinUED
Japan Special Fund
159
NOTE F—CONTRIBUTIONS AND UNCOMMITTED BALANCES
No contributions were received during 2011 and 2010.Effective 31 December 2002, all remaining temporarily restricted net assets under JSF were
transferred and integrated into the unrestricted regular net assets, as concurred by Japan, in order to optimize the use of JSF. Similarly, Japan lifted the restriction over the use of net accumulated investment income, which under the original terms of agreement between ADB and Japan, may only be used for defraying JSF’s administrative expenses. Japan agreed to use the net accumulated investment income as additional resources for funding future JSF operations.
Uncommitted balances comprise amounts, which have not been committed by ADB as of 31 December 2011 and 2010. These balances include approved TA projects/programs that are not yet effective.
As of 31 December 2011 and 2010 these balances are as follows:
2011 2010
accsF
JsF Regular and
supplementary total accsF
JsF Regular and
supplementary total
Uncommitted balances $28,199,000 $57,423,000 $85,622,000 $28,199,000 $ 52,810,000 $ 81,009,000
TA projects/programs approved by Japan and ADB but not yet effective – – – – (700,000) (700,000)
TA projects/programs approved by Japan and not yet effective – (1,320,000) (1,320,000) – (3,640,000) (3,640,000)
Uncommitted balances available for new commitments $28,199,000 $56,103,000 $84,302,000 $28,199,000 $ 48,470,000 $ 76,669,000
The temporarily restricted uncommitted balance remaining available as of 31 December 2011 corresponds to funds under ACCSF of $28,199,000 ($28,199,000 – 2010) and the amount of net accumulated investment income of $8,511,000 ($8,455,000 – 2010) for settlement of all administrative expenses.
Net assets reverted to temporarily restricted assets under ACCSF relate to savings on financially completed technical assistance net of amount from accumulated investment income, released from restrictions to defray the administrative expenses of ACCSF.

asian DEVELOpMEnt BanK—Japan spEciaL FUnD
NOTES TO FINANCIAL STATEMENTS31 December 2011 and 2010
Asian Development Bank Annual Report 2011
160
NOTE G—FAIR VALUE MEASUREMENTS
ASC 820 defines fair value as the price that would be received to sell an asset or paid to transfer a liability at measurement date (exit price) in an orderly transaction among willing participants with an assumption that the transaction takes place in the entity’s principal market, the most advantageous market for the asset or liability. The most advantageous market is the market where the sale of the asset or transfer of liability would maximize the amount received for the asset or minimize the amount paid to transfer the liability. The fair value measurement is not adjusted for transaction cost.
ASC 820 also establishes a fair value hierarchy that gives the highest priority to quoted prices in active markets for identical assets or liabilities (Level 1), next priority to observable market inputs or market corroborated data (Level 2), and the lowest priority to unobservable inputs without market corroborated data (Level 3). ASC 820 requires the fair value measurement to maximize the use of market observable inputs.
The following guidelines are applied in determining the fair values of financial instruments:
Investments
Readily marketable investments are fair valued using active market quotes in Level 1 category. Level 2 category includes investments which are fair valued with significant market observable inputs.
The fair values of the following financial assets of JSF as of 31 December 2011 and 2010 were reported based on the following:
Fair Value Measurements
31 December 2011
Quoted prices in active Markets
for identical assets (Level 1)
significant Market Observable
inputs (Level 2)
significant Unobservable
inputs (Level 3)
assets
InvestmentsGovernment or government-
guaranteed obligations $ 2,991,000 $2,991,000 $ – $ –
Time deposits 127,436,000 – 127,436,000 –
total assets at fair value $130,427,000 $2,991,000 $127,436,000 $ –
Fair Value Measurements
31 December 2010
Quoted prices in active Markets
for identical assets (Level 1)
significant Market Observable
inputs (Level 2)
significant Unobservable
inputs (Level 3)
assets
InvestmentsTime deposits $157,946,000 $ – $ 157,946,000 $ –

JsF-4
cOntinUED
Japan Special Fund
161
See Notes C and E for discussions relating to investments and undisbursed commitments, respectively. In all other cases, the carrying amounts of JSF’s assets, liabilities, and uncommitted balances are considered to approximate fair values for all significant financial instruments.
NOTE H—SUBSEQUENT EVENTS
ADB has evaluated subsequent events after 31 December 2011 through 14 March 2012, the date these Financial Statements are available for issuance. As a result of this evaluation, there are no subsequent events, as defined, that require recognition or disclosure in the JSF’s Financial Statements as of 31 December 2011.

Asian Development Bank Annual Report 2011
162
Deloitte Touche Tohmatsu LLCMS Shibaura Building4-13-23, ShibauraMinato-ku, Tokyo 108-8530Japan
Tel: +81 (3) 3457 7321Fax: +81 (3) 3457 1694www.deloitte.com/jp
INDEPENDENT AUDITORS’ REPORT
To the Board of Directors of Asian Development Bank:
We have audited the accompanying statement of financial position of Asian Development Bank (“ADB”)—Asian Development Bank Institute as of December 31, 2011 and 2010, and the related statements of activities and changes in net assets, and cash flows for each of the years in the two-year period ended December 31, 2011. These financial statements are the responsibility of Asian Development Bank Institute’s (the “Institute”) management. Our responsibility is to express an opinion on these financial statements based on our audits.
We conducted our audits in accordance with auditing standards generally accepted in the United States of America. Those standards require that we plan and perform the audit to obtain reasonable assurance about whether the financial statements are free of material misstatement. An audit includes consideration of internal control over financial reporting as a basis for designing audit procedures that are appropriate in the circumstances, but not for the purpose of expressing an opinion on the effectiveness of the Institute’s internal control over financial reporting. Accordingly, we express no such opinion. An audit also includes examining, on a test basis, evidence supporting the amounts and disclosures in the financial statements, assessing the accounting principles used and significant estimates made by management, as well as evaluating the overall financial statement presentation. We believe that our audits provide a reasonable basis for our opinion.
In our opinion, such financial statements present fairly, in all material respects, the financial position of ADB—Asian Development Bank Institute as of December 31, 2011 and 2010, and the results of its operations and its cash flows for each of the years in the two-year period ended December 31, 2011 in conformity with accounting principles generally accepted in the United States of America.
March 14, 2012
Member ofDeloitte Touche Tohmatsu Limited

Asian Development Bank Institute
163
2011 2010
assEts
DUE FROM BANKS $ 1,473 $ 819 SECURITIES PURCHASED UNDER RESALE
ARRANGEMENT (Notes C and D) 5,982 4,293
PROPERTY, FURNITURE, AND EQUIPMENT (Note E)
Property, Furniture, and Equipment $ 4,344 $ 4,097
Less—allowance for depreciation 4,189 155 3,990 107
DUE FROM CONTRIBUTORS (Note H) 8,779 8,616
LONG-TERM GUARANTEE DEPOSITS (Note F) 2,081 2,384
OTHER ASSETS 654 530
tOtaL $19,124 $16,749
LiaBiLitiEs anD UncOMMittED BaLancEs ACCOUNTS PAYABLE AND OTHER LIABILITIES
Accrued pension and postretirement medical benefits (Note L) $ 6,553 $ 5,368
Asset reinstatement obligations (Note G) 1,406 1,327
Others (Note K) 1,329 $ 9,288 1,138 $ 7,833
UNCOMMITTED BALANCES (ADBI-2)
Unrestricted net assets 9,836 8,916
tOtaL $19,124 $16,749
The accompanying notes are an integral part of these financial statements (ADBI-4).
aDBi-1
asian DEVELOpMEnt BanK—asian DEVELOpMEnt BanK institUtE
STATEMENT OF FINANCIAL POSITION31 December 2011 and 2010 Expressed in thousands of United states Dollars

Asian Development Bank Annual Report 2011
164
2011 2010
changEs in UnREstRictED nEt assEts
CONTRIBUTIONS (Note H) $ 17,663 $ 16,984
REVENUE
From rental (Note I) 496 493 From investments (Note C) 5 4 From other sources—net 74 24
Total 18,238 17,505
EXPENSES
Administrative expenses (Note J) 11,149 10,781 Program expenses 6,278 4,717
Total 17,427 15,498
CONTRIBUTIONS AND REVENUE IN EXCESS OF EXPENSES 811 2,007
EXCHANGE GAINS—net 186 321
TRANSLATION ADJUSTMENTS 495 754
PENSION/POSTRETIREMENT LIABILITY ADJUSTMENT – ASC 715 AND 958 (Note L) (572) (1,428)
INCREASE IN UNRESTRICTED NET ASSETS 920 1,654
NET ASSETS AT BEGINNING OF YEAR 8,916 7,262
nEt assEts at EnD OF yEaR $ 9,836 $ 8,916
The accompanying notes are an integral part of these financial statements (ADBI-4).
aDBi-2
asian DEVELOpMEnt BanK—asian DEVELOpMEnt BanK institUtE
STATEMENT OF ACTIVITIES AND CHANGES IN NET ASSETSFor the Years Ended 31 December 2011 and 2010 Expressed in thousands of United states Dollars

Asian Development Bank Institute
165
2011 2010
CASH FLOWS FROM OPERATING ACTIVITIESContributions received $ 17,337 $ 16,323Interest on investments received 5 4 Expenses paid (16,298) (15,382)Others—net 755 838
Net Cash Provided by Operating Activities 1,799 1,783
CASH FLOWS FROM INVESTING ACTIVITIES
Maturities of investments 900 –
Purchases of investments (900) –
Net payments for securities purchased under resale arrangement (976) (1,214)
Acquisition of equipment (111) –
Net Cash Used in Investing Activities (1,087) (1,214)
Effect of Exchange Rate Changes on Due from Banks (58) (203)
Net Increase in Due from Banks 654 366
Due from Banks at Beginning of Year 819 453
Due from Banks at End of Year $ 1,473 $ 819
RECONCILIATION OF INCREASE IN UNRESTRICTED NET ASSETS TO NET CASH PROVIDED BY OPERATING ACTIVITIES:
Increase in unrestricted net assets (ADBI-2) $ 920 $ 1,654
Adjustments to reconcile increase in unrestricted net assets to net cash provided by operating activities:
Depreciation 66 86
Change in due from contributors (326) (660)
Change in long-term guarantee deposits 303 (281)
Change in other assets (123) (173)
Change in accrued pension retirement cost 1,185 1,696
Change in asset reinstatement obligations 80 156
Change in other liabilities 189 59
Translation adjustments (495) (754)
Others—net 0 0
Net Cash Provided by Operating Activities $ 1,799 $ 1,783
0 = Less than $500.The accompanying notes are an integral part of these financial statements (ADBI-4).
aDBi-3
asian DEVELOpMEnt BanK—asian DEVELOpMEnt BanK institUtE
STATEMENT OF CASH FLOWSFor the Years Ended 31 December 2011 and 2010 Expressed in thousands of United states Dollars

asian DEVELOpMEnt BanK—asian DEVELOpMEnt BanK institUtE
NOTES TO FINANCIAL STATEMENTS31 December 2011 and 2010
Asian Development Bank Annual Report 2011
166
NOTE A—NATURE OF OPERATIONS
The Asian Development Bank (ADB), a multilateral development financial institution, was established in 1966 with its headquarters in Manila, Philippines. ADB and its operations are governed by the Agreement Establishing the Asian Development Bank (the Charter). Its purpose is to foster economic development and co-operation in Asia and the Pacific region and to contribute to the acceleration of the process of economic development of the developing member countries (DMCs) in the region, collectively and individually. Since 1999, ADB’s corporate vision and mission has been to help DMCs reduce poverty in the region. This was reaffirmed under the long-term strategic framework for 2008–2020 (Strategy 2020). Under Strategy 2020, ADB’s corporate vision continues to be “An Asia and Pacific Free of Poverty” and its mission has been to help its DMCs reduce poverty and improve living conditions and quality of life. ADB has been pursuing its mission and vision by focusing on three complementary strategic agendas: inclusive growth, environmentally sustainable growth, and regional integration. ADB provides financial and technical assistance for projects and programs, which will contribute to achieving this purpose. These are financed through ordinary capital resources (OCR) and Special Funds.1
In 1996, ADB approved the establishment of the Asian Development Bank Institute (the Institute) in Tokyo, Japan, as a subsidiary body of ADB. The Institute commenced its operations upon the receipt of the first funds from Japan on 24 March 1997, and it was inaugurated on 10 December 1997. The Institute’s funds may consist of voluntary contributions, donations, and grants from ADB member countries, nongovernment organizations, and foundations. The objectives of the Institute, as defined under its Statute, are the identification of effective development strategies and capacity improvement for sound development management in DMCs.
ADB is immune from taxation pursuant to Chapter VIII, Article 56, Exemption from Taxation, of the Charter.
NOTE B—SUMMARY OF SIGNIFICANT ACCOUNTING POLICIES
Presentation of the Financial Statements
The financial statements of the Institute are prepared in accordance with accounting principles generally accepted in the United States of America (US GAAP), and are presented on the basis of those for not-for-profit organizations.
The Institute reports donor’s contributed cash and other assets as unrestricted support as these are made available to the Institute without conditions other than for the purposes of pursuing the objectives of the Institute.
1 Asian Development Fund (ADF), Technical Assistance Special Fund (TASF), Japan Special Fund (JSF), ADB Institute (ADBI), Asian Tsunami Fund (ATF), Pakistan Earthquake Fund (PEF), Regional Cooperation and Integration Fund (RCIF), Climate Change Fund (CCF), and Asia Pacific Disaster Response Fund (APDRF).

aDBi-4
cOntinUED
Asian Development Bank Institute
167
Functional Currency and Reporting Currency
The functional currency of the Institute is Japanese yen. The reporting currency is the United States dollar.
Translation of Currencies
Assets, liabilities, and uncommitted balances are translated from the functional currency to the reporting currency at the applicable rates of exchange at the end of a reporting period. Commitments included in the financial statements during the year are recognized at the applicable exchange rates as of the respective dates of commitment. Revenue and expense amounts are translated for each semi-monthly period generally at the applicable rates of exchange at the beginning of each period; such practice approximates the application of average rates in effect during the period. Translation adjustments are recorded as translation adjustments account and included in changes in unrestricted net assets.
Monetary assets and liabilities denominated in currency other than Japanese yen are translated into Japanese yen at year-end exchange rates. Exchange gains and losses are recorded as exchange gains—net account and included in the changes in unrestricted net assets.
Securities Purchased Under Resale Arrangement
The Institute accounts for transfer of financial assets in accordance with Financial Accounting Standards Board (FASB) Accounting Standards Codification (ASC) 860, “Transfers and Servicing.” In general, transfers are accounted for as sales under ASC 860 when control over the transferred assets has been relinquished. Otherwise, the transfers are accounted for as resale arrangements and collateralized financing arrangements. Securities purchased under resale arrangement are recorded as assets and are not re-pledged.
Interest income on investment securities are recognized as realized and reported net of amortizations of premiums and discounts in “Revenue from investments.”
Property, Furniture, and Equipment
Property, furniture, and equipment are stated at cost and depreciated over their estimated useful lives using the straight-line method. Maintenance, repairs, and minor betterments are charged to expense.
Expenditures amounting to more than $30,000 for a single asset or a combination of assets forming an integral part of a separate asset are capitalized.
Contributions
Contributions from donors are included in the financial statements from the date committed.
Accounting Estimates
The preparation of the financial statements in conformity with generally accepted accounting principles requires management to make estimates and assumptions that affect the reported amounts of assets and liabilities as of the end of the year and the reported amounts of revenue and expenses during the year. Actual results could differ from those estimates.

asian DEVELOpMEnt BanK—asian DEVELOpMEnt BanK institUtE
NOTES TO FINANCIAL STATEMENTS31 December 2011 and 2010
Asian Development Bank Annual Report 2011
168
Accounting and Reporting Developments
Accounting Standards Update (ASU) 2010-06, “Fair Value Measurements and Disclosures (Topic 820) – Improving Disclosures about Fair Value Measurements” with respect to the separate disclosures about gross purchases, sales, issuances, and settlements relating to Level 3 measurements is effective for fiscal years beginning after 15 December 2010 and for interim periods within those fiscal years. Note D provides the required disclosures in compliance with this update.
In April 2011, the FASB issued ASU 2011-03, “Transfers and Servicing (Topic 860) – Reconsideration of Effective Control for Repurchase Agreements.” The update removes from the assessment of effective control the criterion requiring the transferor to have the ability to repurchase or redeem the financial assets on substantially the agreed terms, even in the event of default by the transferee. It does not change the other criteria used in the assessment of effective control. This update is applicable prospectively to new transactions and transactions that are modified on or after the first interim or annual period beginning 15 December 2011. This update did not have an impact on ADBI’s 31 December 2011 financial statements.
In May 2011, the FASB issued ASU 2011-04, “Fair Value Measurement (Topic 820) – Amendments to Achieve Common Fair Value Measurement and Disclosure Requirements in US GAAP and IFRSs,” which provides the consistency between US GAAP and International Financial Reporting Standards (IFRSs) on the definition of fair value (FV) and on the guidance on how to measure FV and on what to disclose about FV measurements. The amendments to the update do not require additional FV measurements and are not intended to establish valuation standards or affect valuation practices outside of financial reporting. The new guidance will require prospective application and are effective for interim and annual periods beginning on or after 15 December 2011. The Institute is currently assessing the impact of this update on ADBI’s financial statements.
Statement of Cash Flows
For the purposes of the Statement of Cash Flows, the Institute considers that its cash and cash equivalents are limited to “DUE FROM BANKS,” which consists of cash on hand and current accounts in banks used for operational disbursements.
Reclassification
Certain non-material reclassifications of prior year’s amounts and information have been made to conform to the current year’s presentation.
NOTE C—SECURITIES PURCHASED UNDER RESALE ARRANGEMENT
The annualized rate of return on the average investments held during the year including receivable for securities purchased under resale arrangement, based on the portfolio held at the beginning and end of each month was 0.05% (0.06% – 2010).

aDBi-4
cOntinUED
Asian Development Bank Institute
169
NOTE D—FAIR VALUE MEASUREMENTS
ASC 820 defines fair value as the price that would be received to sell an asset or paid to transfer a liability at measurement date (exit price) in an orderly transaction among willing participants with an assumption that the transaction takes place in the entity’s principal market, the most advantageous market for the asset or liability. The most advantageous market is the market where the sale of the asset or transfer of liability would maximize the amount received for the asset or minimize the amount paid to transfer the liability. The fair value measurement is not adjusted for transaction cost.
ASC 820 also establishes a fair value hierarchy that gives the highest priority to quoted prices in active markets for identical assets or liabilities (Level 1), next priority to observable market inputs or market corroborated data (Level 2), and the lowest priority to unobservable inputs without market corroborated data (Level 3). ASC 820 requires the fair value measurement to maximize the use of market observable inputs.
The following guidelines are applied in determining the fair values of financial instruments:
Securities purchased under resale arrangement
Readily marketable investments are fair valued using active market quotes in Level 1 category. Level 2 category includes securities purchased under resale arrangement, which are fair valued with significant market observable inputs.
The fair value of the following financial assets of the Institute as of 31 December 2011 and 2010 were reported based on the following:
Fair Value Measurements
Quoted prices in active Markets
for identical assets
significant Market Observable
inputs
significant Unobservable
inputs31 December 2011 (Level 1) (Level 2) (Level 3)
assets
Securities purchased under resale arrangement $ 5,982,000 $ – $ 5,982,000 $ –
Fair Value Measurements
Quoted prices in active Markets
for identical assets
significant Market Observable
inputs
significant Unobservable
inputs31 December 2010 (Level 1) (Level 2) (Level 3)
assets
Securities purchased under resale arrangement $ 4,293,000 $ – $ 4,293,000 $ –

asian DEVELOpMEnt BanK—asian DEVELOpMEnt BanK institUtE
NOTES TO FINANCIAL STATEMENTS31 December 2011 and 2010
Asian Development Bank Annual Report 2011
170
See Note B for discussions relating to securities purchased under resale arrangement. In all other cases, the carrying amounts of the Institute’s assets, liabilities, and uncommitted balances are considered to approximate fair values for all significant financial instruments.
NOTE E—PROPERTY, FURNITURE, AND EQUIPMENT
Property, furniture, and equipment consist of one-time establishment cost (comprising office furniture, fixtures and equipment purchased at inception for use in the operations of the Institute) and equipment.
The changes in the property, furniture, and equipment during 2011 and 2010, as well as informa-tion pertaining to accumulated depreciation, are as follows:
property, Furniture, and Equipment
One-time Establishment
cost Furniture EquipmentLeased
property grand total
cost:
Balance, 1 January 2011 $ 3,598,000 $ 74,000 $ 156,000 $ 269,000 $ 4,097,000
Additions during the year – – 111,000 – 111,000
Disposals during the year (110,000) – – – (110,000)
Translation adjustments 216,000 4,000 9,000 17,000 246,000
Balance, 31 December 2011 3,704,000 78,000 276,000 286,000 4,344,000
accumulated Depreciation:
Balance, 1 January 2011 3,598,000 74,000 49,000 269,000 3,990,000
Depreciation during the year – – 66,000 – 66,000
Disposals during the year (110,000) – – – (110,000)
Translation adjustments 216,000 4,000 6,000 17,000 243,000
Balance, 31 December 2011 3,704,000 78,000 121,000 286,000 4,189,000
net Book Value, 31 December 2011 $ – $ – $ 155,000 $ – $ 155,000

aDBi-4
cOntinUED
Asian Development Bank Institute
171
property, Furniture, and Equipment
One-time Establishment
cost Furniture EquipmentLeased
property grand total
cost:
Balance, 1 January 2010 $ 3,176,000 $ 65,000 $ 137,000 $ 238,000 $ 3,616,000
Additions during the year – – – – –
Disposals during the year (3,000) – – – (3,000)
Translation adjustments 425,000 9,000 19,000 31,000 484,000
Balance, 31 December 2010 3,598,000 74,000 156,000 269,000 4,097,000
accumulated Depreciation:
Balance, 1 January 2010 3,176,000 65,000 9,000 190,000 3,440,000
Depreciation during the year – – 36,000 50,000 86,000
Disposals during the year (3,000) – – – (3,000)
Translation adjustments 425,000 9,000 4,000 29,000 467,000
Balance, 31 December 2010 3,598,000 74,000 49,000 269,000 3,990,000
net Book Value, 31 December 2010 $ – $ – $ 107,000 $ – $ 107,000
Total depreciation expense incurred for the year ended 31 December 2011 amounted to $66,000 ($86,000 – 2010).
NOTE F—LONG-TERM GUARANTEE DEPOSITS
The Institute leases office space and deposits the equivalent of six months of office rent to the lessor, as stipulated in the contract of lease signed in 1997. The amount is updated every contract renewal. The last renewal date was 1 April 2011.
NOTE G—ASSET REINSTATEMENT OBLIGATIONS
The Institute has recorded the estimated asset reinstatement obligations related to leased office space.
NOTE H—CONTRIBUTIONS
In June 2010, the Governments of Japan and Australia committed its 15th and 1st contributions to the Institute, amounting to ¥702,462,000 ($7,927,000 equivalent) and A$500,000 ($439,000 equivalent), respectively.

asian DEVELOpMEnt BanK—asian DEVELOpMEnt BanK institUtE
NOTES TO FINANCIAL STATEMENTS31 December 2011 and 2010
Asian Development Bank Annual Report 2011
172
In December 2010, the Government of Japan committed its 16th contribution to the Institute amounting to ¥702,462,000 ($8,616,000 equivalent), which was transferred to the Fund on 7 January 2011. At 31 December 2010, the amount committed was reported in the Statement of Financial Position as “DUE FROM CONTRIBUTORS.”
In June 2011, the governments of Japan and Australia committed its 17th and 2nd contributions to the Institute, amounting to ¥675,081,000 ($8,357,000 equivalent) and A$500,000 ($527,000 equivalent), respectively.
In December 2011, the Government of Japan committed its 18th contribution to the Institute amounting to ¥675,081,000 ($8,779,000 equivalent), which was transferred to the Fund on 12 January 2012. At 31 December 2011, the amount committed was reported in the Statement of Financial Position as “DUE FROM CONTRIBUTORS.”
NOTE I—REVENUE FROM RENTAL
Revenue from rental in 2011 consists of sublease rental income of $496,000 ($493,000 – 2010), received according to a space sharing agreement with the Japanese Representative Office of ADB. The transactions with ADB were made in the ordinary course of business and were negotiated at arm’s length.
NOTE J—LEASES
ADBI leases office space and other assets. Rental expenses under operating leases for the years ended 31 December 2011 and 2010 were $4,179,000 and $4,324,000, respectively. As of 31 December 2011, the Institute has the following operating lease commitments, which includes non-cancellable period through 31 March 2012 and cancellable period from 1 April 2012 through 31 March 2014:
year ending 31 December Minimum future rentals
2012 $ 4,163,000
2013 4,163,000
2014 1,041,000
NOTE K—DUE TO OCR
Accounts payable and other liabilities include amounts due to OCR of $174,000 and $267,000 at 31 December 2011 and 2010, respectively. The payable results from transactions in the normal course of business.

aDBi-4
cOntinUED
Asian Development Bank Institute
173
NOTE L—STAFF RETIREMENT PLAN AND POSTRETIREMENT MEDICAL BENEFITS
Staff Retirement Plan
Eligible employees of the Institute are participants of the ADB Staff Retirement Plan (the Plan), a defined benefit plan. An eligible employee, as defined under the Plan, shall, as a condition of service, become a participant from the first day of service, provided that at such a date, the employee has not reached the normal retirement age of 60. Retirement benefits are based on length of service and highest average remuneration during two years of eligible service. The Plan assets are segregated and are not included in the accompanying Statement of Financial Position. The costs of administering the Plan are absorbed by ADB, except for fees paid to the investment managers and related charges, including custodian fees, which are borne by the Plan.
Participants hired on or before 30 September 2006 are required to contribute 9 1/3% of their salary to the Plan while those hired after that date are not required to contribute to the Plan. Participants may also make additional voluntary contributions. The Institute’s contribution is determined at a rate sufficient to cover that part of the costs of the Plan not covered by the participants’ contributions.
Expected Contributions
The expected amount of contributions to the Plan for 2012, based on the Institute’s contribution rate for the coming year of 21%, and the participants’ mandatory contribution are $333,000 and $37,000, respectively (2011 – $289,000 and $37,000).
Investment Strategy
Contributions in excess of current benefits payments are invested in international financial markets and in a variety of investment vehicles. The Plan employs eight external asset managers and one global custodian who function within the guidelines established by the Plan’s Investment Committee. The investment of these assets, over the long term, is expected to produce higher returns than short-term investments. The investment policy incorporates the Plan’s package of desired investment return, and tolerance for risk, taking into account the nature and duration of the Plan’s liabilities. The Plan’s assets are diversified among different markets and different asset classes. The use of derivatives for speculation, leverage, or taking risks is prohibited. Selected derivatives are used for hedging and transactional efficiency purposes.
The Plan’s investment policy is periodically reviewed and revised to reflect the best interest of the Plan’s participants and beneficiaries. The current policy, adopted in January 2011, specifies an asset-mix structure of 70% of assets in equities and 30% in fixed income securities. At present, investments of the Plan’s assets are divided into three categories: US equity, Non-US equity, and Global fixed income.
All investments, excluding time deposits, are valued using market prices. Time deposits are reported at cost which is deemed a reasonable estimate of fair value. Fixed income securities include US government and non-US government or government-guaranteed obligations, corporate bonds, and time deposits. Other assets include forward exchange contracts in various foreign currencies transacted to hedge currency exposure in the investment portfolio, which are reported at fair value. The Plan’s long-term asset-mix is 40% US equity, 30% non-US equity, and 30% global fixed income.

asian DEVELOpMEnt BanK—asian DEVELOpMEnt BanK institUtE
NOTES TO FINANCIAL STATEMENTS31 December 2011 and 2010
Asian Development Bank Annual Report 2011
174
For the year ended 31 December 2011, the net return on the Plan assets was negative 0.9% (11.4% – 2010). ADB expects the long-term rate of return on the assets to be 7.5% (8.0% – 2010).
Assumptions
The assumed overall rate of return takes into account long-term return expectations of the underlying asset classes within the investment portfolio mix, and the expected duration of the Plan’s liabilities. Return expectations are forward looking and, in general, not much weight is given to short-term experience. Unless there is a drastic change in investment policy or market environment, the assumed investment return of 7.5% on the Plan’s assets is expected to remain broadly the same, year to year.
Postretirement Medical Benefits Plan
The Institute participates in the cost-sharing plan of ADB for retirees’ medical insurance premiums. Under the plan, the Institute is obligated to pay 75% of the Group Medical Insurance Plan premiums for retirees and their eligible dependents who elected to participate. The cost-sharing plan is currently unfunded.
Generally accepted accounting principles require an actuarially determined assessment of the periodic cost of postretirement medical benefits.
The following table sets forth the pension and postretirement medical benefits at 31 December 2011 and 2010:
pension Benefits postretirement Medical Benefits
2011 2010 2011 2010
Change in benefit obligation:
Projected benefit obligation at beginning of year $ 8,434,000 $ 6,473,000 $ 413,000 $ 148,000
Service cost 256,000 200,000 119,000 33,000
Interest cost 470,000 388,000 29,000 11,000
Plan participants’ contributions 109,000 108,000 – –
Actuarial (gain) loss 692,000 1,493,000 (77,000) 250,000
Benefits paid (325,000) (228,000) (26,000) (29,000)
Projected benefit obligation at end of year $ 9,636,000 $ 8,434,000 $ 458,000 $ 413,000
Change in plan assets:
Fair value of plan assets at beginning of year $ 3,480,000 $ 2,949,000 $ – $ –
Actual return on plan assets (30,000) 358,000 – –
Employer’s contribution 306,000 293,000 26,000 29,000
Plan participants’ contributions 109,000 108,000 – –
Benefits paid (325,000) (228,000) (26,000) (29,000)
Fair value of plan assets at end of year $ 3,540,000 $ 3,480,000 $ – $ –
Funded Status $(6,096,000) $(4,954,000) $(458,000) $(413,000)
Amounts recognized in the Balance sheet consist of:
Current liabilities $ – $ – $ (5,000) $ –
Noncurrent liabilities (6,096,000) (4,954,000) (453,000) (413,000)
Net amount recognized $(6,096,000) $(4,954,000) $(458,000) $(413,000)

aDBi-4
cOntinUED
Asian Development Bank Institute
175
For measurement purposes, a 7.0% annual rate of increase in the per capita cost of covered health care benefits was assumed for the valuation as of 31 December 2011. The rate was assumed to decrease gradually to 5.0% for 2016 and remain at that level thereafter.
pension Benefits postretirement Medical Benefits
2011 2010 2011 2010
Components of net periodic benefit cost:
Service cost $ 256,000 $ 200,000 $ 119,000 $ 33,000
Interest cost 470,000 388,000 29,000 11,000
Expected return on plan assets (264,000) (212,000) – –
Amortization of prior service cost 0 5,000 – –
Recognized actuarial loss 336,000 192,000 – (27,000)
Net periodic benefit cost $ 798,000 $ 573,000 $ 148,000 $ 17,000
0 = Less than $500.
The accumulated benefit obligation of the pension plan as of 31 December 2011 was $9,451,000 ($8,163,000 – 2010).
A one-percentage-point change in assumed health care cost trend rates would have the following effects:
1-percentage-point increase
1-percentage- point Decrease
Effect on total service and interest cost components $35,000 $(26,000)
Effect on postretirement benefit obligation 99,000 (80,000)
pension Benefits postretirement Medical Benefits
2011 2010 2011 2010
Amounts recognized in the Unrestricted net assets consist of:
Net actuarial loss (gain) $ 3,722,000 $ 3,072,000 $(100,000) $ (23,000)
Prior service cost (credit) – – – –
Net amount recognized $ 3,722,000 $ 3,072,000 $(100,000) $ (23,000)
Weighted-average assumptions as of 31 December
Discount rate 5.05% 5.50% 5.05% 5.50%
Expected return on plan assets 7.50% 8.00% N/A N/A
Rate of compensation increase varies with age and averages 3.25% 4.50% 3.25% 4.50%

asian DEVELOpMEnt BanK—asian DEVELOpMEnt BanK institUtE
NOTES TO FINANCIAL STATEMENTS31 December 2011 and 2010
Asian Development Bank Annual Report 2011
176
Estimated Future Benefits Payments
The following table shows the benefits payments expected to be paid in each of the next five years and subsequent five years. The expected benefits payments are based on the same assumptions used to measure the benefit obligation at 31 December 2011:
pension Benefits
postretirement Medical Benefits
2012 $ 463,000 $ 5,000
2013 349,000 6,000
2014 384,000 7,000
2015 405,000 7,000
2016 463,000 8,000
2017–2021 2,885,000 151,000
Fair Value Hierarchy
ASC 820 establishes a fair value hierarchy that gives the highest priority to quoted prices in active markets for identical assets or liabilities (Level 1), next priority to observable market inputs or market corroborated data (Level 2), and the lowest priority to unobservable inputs without market corrobo-rated data (Level 3). ASC 820 requires the fair value measurement to maximize the use of market observable inputs.
The fair value of the plan assets measured at fair value on a recurring basis of the pension plan as of 31 December 2011 and 2010 were reported based on the following:
Fair Value Measurements
Quoted prices in active Markets
for identical assets
significant Market Observable
inputs
significant Unobservable
inputs31 December 2011 (Level 1) (Level 2) (Level 3)
assets
Corporate equity securities $ 2,320,000 $ 2,320,000 $ – $ 0
Government or government-guaranteed securities 490,000 465,000 12,000 13,000
Corporate debt securities 405,000 330,000 59,000 16,000
Asset/Mortgage-backed securities 163,000 109,000 36,000 18,000
Temporary investments and time deposits 90,000 70,000 20,000 –
Interest rate swaps 0 – – 0
Futures—net 0 0 – –
Foreign exchange contracts—net 11,000 – 11,000 –
total assets at fair value $ 3,479,000 $ 3,294,000 $ 138,000 $ 47,000
0 = Less than $500.

aDBi-4
cOntinUED
Asian Development Bank Institute
177
The table below provides the details of all inter-level transfers for the year ended 31 December 2011:
Level 1 Level 2
Investments
Government or government-guaranteed obligations Transfers into (out of) $ 31,000 $ (31,000)
Corporate obligations Transfers into (out of) 99,000 (99,000)
Asset/Mortgage-backed securities Transfers into (out of) 32,000 (32,000)
$162,000 $(162,000)
Government or government-guaranteed obligations, corporate debt securities, and asset/mortgage-backed securities totaling $162,000 were transferred from Level 2 to 1.
Fair Value Measurements
Quoted prices in active Markets
for identical assets
significant Market Observable
inputs
significant Unobservable
inputs31 December 2010 (Level 1) (Level 2) (Level 3)
assets
Corporate equity securities $ 2,375,000 $ 2,375,000 $ – $ –
Government or government-guaranteed securities 366,000 313,000 53,000 –
Corporate debt securities 282,000 2,000 280,000 –
Asset/Mortgage-backed securities 488,000 – 488,000 –
Temporary investments and time deposits 107,000 – 107,000 –
total assets at fair value $ 3,618,000 $ 2,690,000 $ 928,000 $ –
Liabilities
Foreign exchange contracts—net $ 0 $ – $ 0 $ –
0 = Less than $500.

asian DEVELOpMEnt BanK—asian DEVELOpMEnt BanK institUtE
NOTES TO FINANCIAL STATEMENTS31 December 2011 and 2010
Asian Development Bank Annual Report 2011
178
Assets measured at fair value on a recurring basis using significant unobservable inputs (Level 3):
corporate equity securities
government or government-guaranteed obligations
corporate debt securities
asset/ Mortgage-
backed securitiesinterest rate
swap
Balance, 31 December 2010 $ – $ – $ – $ – $ –
Total realized/unrealized (losses)/gains in:
Net increase in net assets available for benefits 0 1,000 (1,000) 0 0
Purchases 0 2,000 17,000 10,000 –
Sales/Maturities – – – – –
Settlement and others – – – – –
Transfers into (out of) Level 3, net – 10,000 – 8,000 –
Balance, 31 December 2011 $ 0 $13,000 $16,000 $18,000 $ 0
Total unrealized (losses)/gains included in income related to financial assets and liabilities still held at the reporting date $ 0 $ 1,000 $ (1,000) $ 0 $ 0
0 = Less than $500.
During 2011, ADB enhanced the approach for determining the fair value hierarchy of liquidity portfolio investments by introducing additional pricing sources and strengthening the internal analytics. The enhanced methodology provided more robust support for market observable inputs in pricing. Transfers out of Level 3 in 2011 are primarily the result of refining ADB’s valuation approach.
NOTE M—SUBSEQUENT EVENTS
The Institute has evaluated subsequent events after 31 December 2011 through 14 March 2012, the date these Financial Statements are available for issuance. In January 2012, the Government of the Republic of Korea, acting through the Republic of Korea e-Asia and Knowledge Partnership Fund, committed its 1st contribution to the Institute amounting to $1.5 million. This was received on 7 February 2012.

Asian Tsunami Fund
179
asian tsunaMi Fund
MANAGEMENT’S REPORT ON INTERNAL CONTROL OVER FINANCIAL REPORTING
The management of Asian Development Bank (“ADB”) is responsible for establishing and maintaining adequate internal control over financial reporting. ADB’s internal control over financial reporting is a process designed to provide reasonable assurance regarding the reliability of financial reporting and the preparation of financial statements for external purposes in accordance with generally accepted accounting principles in the United States of America.
ADB’s internal control over financial reporting includes those policies and procedures that (i) pertain to the maintenance of records that, in reasonable detail, accurately and fairly reflect the transactions and dispositions of the assets of ADB; (ii) provide reasonable assurance that transactions are recorded as necessary to permit preparation of financial statements in accordance with generally accepted accounting principles in the United States of America, and that receipts and expenditures of ADB are being made only in accordance with authorizations of management and directors of ADB; and (iii) provide reasonable assurance regarding prevention or timely detection of unauthorized acquisition, use, or disposition of ADB’s assets that could have a material effect on the financial statements.
Because of its inherent limitations, internal control over financial reporting may not prevent or detect misstatements. Also, projections of any evaluation of effectiveness to future periods are subject to the risk that controls may become inadequate because of changes in conditions, or that the degree of compliance with the policies or procedures may deteriorate.
ADB’s management assessed the effectiveness of ADB’s internal control over financial reporting as of 31 December 2011. In making this assessment, ADB’s management used the criteria set forth by the Committee of Sponsoring Organizations of the Treadway Commission in Internal Control – Integrated Framework. Based on that assessment, management believes that as of 31 December 2011, ADB’s internal control over financial reporting is effective based upon the criteria established in Internal Control – Integrated Framework.
Haruhiko KurodaPresident
Thierry de LonguemarVice-President (Finance and Administration)
Hiroshi FukukawaOfficer-in-Charge, Controller’s Department
14 March 2012

Asian Development Bank Annual Report 2011
180
Deloitte Touche LLPCertified Public AccountantsUnique Entity No. T08LL0721A6 Shenton Way #32-00DBS Building Tower TwoSingapore 068809
Tel: +65 6224 8288Fax: +65 6538 6166www.deloitte.com/sg
INDEPENDENT AUDITORS’ REPORT
To the Board of Directors and the Board of Governors of Asian Development Bank
We have audited management’s assertion, included in the accompanying Management’s Report on Internal Control over Financial Reporting, that Asian Development Bank (“ADB”) maintained effective internal control over financial reporting as of December 31, 2011, based on the criteria established in Internal Control — Integrated Framework issued by the Committee of Sponsoring Organizations of the Treadway Commission. ADB’s management is responsible for maintaining effective internal control over financial reporting and for its assertion of the effectiveness of internal control over financial reporting, included in the accompanying Management’s Report on Internal Control over Financial Reporting. Our responsibility is to express an opinion on management’s assertion based on our audit.
We conducted our audit in accordance with attestation standards established by the American Institute of Certified Public Accountants. Those standards require that we plan and perform the audit to obtain reasonable assurance about whether effective internal control over financial reporting was maintained in all material respects. Our audit included obtaining an understanding of internal control over financial reporting, assessing the risk that a material weakness exists, and testing and evaluating the design and operating effectiveness of internal control based on the assessed risk. Our audit also included performing such other procedures as we considered necessary in the circumstances. We believe that our audit provides a reasonable basis for our opinion.
ADB’s internal control over financial reporting is a process designed to provide reasonable assurance regarding the reliability of financial reporting and the preparation of financial statements for external purposes in accordance with accounting principles generally accepted in the United States of America. ADB’s internal control over financial reporting includes those policies and procedures that (1) pertain to the maintenance of records that, in reasonable detail, accurately and fairly reflect the transactions and dispositions of the assets of ADB; (2) provide reasonable assurance that transactions are recorded as necessary to permit preparation of financial statements in accordance with accounting principles generally accepted in the United States of America, and that receipts and expenditures of ADB are being made only in accordance with authorizations of management and directors of ADB; and (3) provide reasonable assurance regarding prevention or timely detection of unauthorized acquisition, use, or disposition of ADB’s assets that could have a material effect on the financial statements.
Deloitte Touche LLP (Unique Entity No. T08LL0721A) is an accounting limited liability partnership registered in Singaporeunder the Limited Liability Partnerships Act (Chapter 163A).

Asian Tsunami Fund
181
Because of the inherent limitations of internal control over financial reporting, including the possibility of collusion or improper management override of controls, material misstatements due to error or fraud may not be prevented or detected and corrected on a timely basis. Also, projections of any evaluation of the effectiveness of the internal control over financial reporting to future periods are subject to the risk that the controls may become inadequate because of changes in conditions or that the degree of compliance with the policies or procedures may deteriorate.
In our opinion, management’s assertion that ADB maintained effective internal control over financial reporting as of December 31, 2011, is fairly stated, in all material respects, based on the criteria established in Internal Control — Integrated Framework issued by the Committee of Sponsoring Organizations of the Treadway Commission.
We have also audited, in accordance with auditing standards generally accepted in the United States of America, the accompanying statement of financial position of ADB – Asian Tsunami Fund as of December 31, 2011 and 2010 and the related statements of activities and changes in net assets, and cash flows, for each of the years in the two-year period ended December 31, 2011 and our report dated March 14, 2012 expressed an unqualified opinion on those financial statements.
Public Accountants and Certified Public Accountants
SingaporeMarch 14, 2012

Asian Development Bank Annual Report 2011
182
Deloitte Touche LLPCertified Public AccountantsUnique Entity No. T08LL0721A6 Shenton Way #32-00DBS Building Tower TwoSingapore 068809
Tel: +65 6224 8288Fax: +65 6538 6166www.deloitte.com/sg
INDEPENDENT AUDITORS’ REPORT
To the Board of Directors and the Board of Governors of Asian Development Bank
We have audited the accompanying statement of financial position of Asian Development Bank (“ADB”) – Asian Tsunami Fund as of December 31, 2011 and 2010 and the related statements of activities and changes in net assets, and cash flows, for each of the years in the two-year period ended December 31, 2011. These financial statements are the responsibility of ADB’s management. Our responsibility is to express an opinion on these financial statements based on our audits.
We conducted our audits in accordance with auditing standards generally accepted in the United States of America. Those standards require that we plan and perform the audit to obtain reasonable assurance about whether the financial statements are free of material misstatement. An audit includes examining, on a test basis, evidence supporting the amounts and disclosures in the financial state-ments, assessing the accounting principles used and significant estimates made by management, as well as evaluating the overall financial statement presentation. We believe that our audits provide a reasonable basis for our opinion.
In our opinion, such financial statements present fairly, in all material respects, the financial position of ADB – Asian Tsunami Fund as of December 31, 2011 and 2010, and the results of its operations and its cash flows for each of the years in the two-year period ended December 31, 2011 in conformity with accounting principles generally accepted in the United States of America.
As discussed in Note A, ADB – Asian Tsunami Fund was terminated on December 31, 2010 and all its projects were financially completed as of December 31, 2011.
We have also audited, in accordance with attestation standards established by the American Institute of Certified Public Accountants, management’s assertion that ADB maintained effective internal control over financial reporting as of December 31, 2011, based on the criteria established in Internal Control — Integrated Framework issued by the Committee of Sponsoring Organizations of the Treadway Commission and our report dated March 14, 2012 expressed an unqualified opinion on management’s assertion that ADB maintained effective internal control over financial reporting.
Public Accountants and Certified Public Accountants
SingaporeMarch 14, 2012
Deloitte Touche LLP (Unique Entity No. T08LL0721A) is an accounting limited liability partnership registered in Singaporeunder the Limited Liability Partnerships Act (Chapter 163A).

Asian Tsunami Fund
183
2011 2010
assEts DUE FROM BANKS $ 275 $ 295 INVESTMENTS (Notes C and G)
Time deposits 6,600 19,042 ADVANCES FOR GRANTS – 5,546
tOtaL $6,875 $24,883
LiaBiLitiEs anD UncOMMittED BaLancEs ACCOUNTS PAYABLE AND OTHER LIABILITIES (Note D) $ 14 $ 232 UNDISBURSED COMMITMENTS (Notes E and G) – 22,021 TOTAL LIABILITIES 14 22,253 UNCOMMITTED BALANCES (ATF-2) (Note F), represented by:
Unrestricted net assets 6,861 2,630
tOtaL $6,875 $24,883
The accompanying notes are an integral part of these financial statements (ATF-4).
atF-1
asian DEVELOpMEnt BanK—asian tsUnaMi FUnD
STATEMENT OF FINANCIAL POSITION31 December 2011 and 2010 Expressed in thousands of United states Dollars

Asian Development Bank Annual Report 2011
184
2011 2010
changEs in UnREstRictED nEt assEts
REVENUEFrom investments (Note C) $ 3 $ 144 From other sources 2 4
Total 5 148
EXPENSES
Grants (Note E) (4,644) –
Administrative expenses (Note D) 362 1,909
Financial expenses 0 1
Total (4,282) 1,910
REVENUE LESS THAN EXPENSES 4,287 (1,762)
EXCHANGE LOSSES—net (56) (139)
INCREASE (DECREASE) IN NET ASSETS 4,231 (1,901)
NET ASSETS AT BEGINNING OF YEAR 2,630 4,531
nEt assEts at EnD OF yEaR $6,861 $2,630
0 = Less than $500.The accompanying notes are an integral part of these financial statements (ATF-4).
atF-2
asian DEVELOpMEnt BanK—asian tsUnaMi FUnD
STATEMENT OF ACTIVITIES AND CHANGES IN NET ASSETSFor the Years Ended 31 December 2011 and 2010 Expressed in thousands of United states Dollars

Asian Tsunami Fund
185
2011 2010
CASH FLOWS FROM OPERATING ACTIVITIESInterest on investments received $ 3 $ 146 Grants disbursed (11,886) (76,948)Administrative and financial expenses paid (581) (2,211)Net cash received from other sources 2 4
Net Cash Used in Operating Activities (12,462) (79,009)
CASH FLOWS FROM INVESTING ACTIVITIESMaturities of investments 164,817 9,635,673 Purchases of investments (152,375) (9,556,818)
Net Cash Provided by Investing Activities 12,442 78,855
Net Decrease in Due from Banks (20) (154)
Due from Banks at Beginning of Year 295 449
Due from Banks at End of Year $ 275 $ 295
RECONCILIATION OF INCREASE (DECREASE) IN NET ASSETS TO NET CASH USED IN OPERATING ACTIVITIES:
Increase (Decrease) in net assets (ATF-2) $ 4,231 $ (1,901)
Adjustments to reconcile increase (decrease) in net assets to net cash used in operating activities:
Change in accrued revenue 0 2 Change in advances for grants 5,546 18,019 Change in accounts payable and other liabilities (218) (365)Change in undisbursed commitments (22,021) (94,763)Exchange gains—net – (1)
Net Cash Used in Operating Activities $ (12,462) $ (79,009)
0 = Less than $500.The accompanying notes are an integral part of these financial statements (ATF-4).
atF-3
asian DEVELOpMEnt BanK—asian tsUnaMi FUnD
STATEMENT OF CASH FLOWSFor the Years Ended 31 December 2011 and 2010 Expressed in thousands of United states Dollars

asian DEVELOpMEnt BanK—asian tsUnaMi FUnD
NOTES TO FINANCIAL STATEMENTS31 December 2011 and 2010
Asian Development Bank Annual Report 2011
186
NOTE A—NATURE OF OPERATIONS
The Asian Development Bank (ADB), a multilateral development financial institution, was established in 1966 with its headquarters in Manila, Philippines. ADB and its operations are governed by the Agreement Establishing the Asian Development Bank (the Charter). Its purpose is to foster economic development and co-operation in Asia and the Pacific region and to contribute to the acceleration of the process of economic development of the developing member countries (DMCs) in the region, collectively and individually. Since 1999, ADB’s corporate vision and mission has been to help DMCs reduce poverty in the region. This was reaffirmed under the long-term strategic framework for 2008–2020 (Strategy 2020). Under Strategy 2020, ADB’s corporate vision continues to be “An Asia and Pacific Free of Poverty” and its mission has been to help its DMCs reduce poverty and improve living conditions and quality of life. ADB has been pursuing its mission and vision by focusing on three complementary strategic agendas: inclusive growth, environmentally sustainable growth, and regional integration. ADB provides financial and technical assistance for projects and programs, which will contribute to achieving this purpose. These are financed through ordinary capital resources (OCR) and Special Funds.1
The ATF was established on 11 February 2005 in response to the special circumstances surrounding the DMCs that were stricken by the effects of the tsunami on 26 December 2004. The purpose of ATF is to provide emergency grant financing promptly and effectively to affected DMCs in the form of technical assistance (TA) and investment projects to support reconstruction, rehabilitation, and associated development activities following the tsunami disaster.
ATF will serve as a dedicated source of grant financing to support priority rehabilitation and reconstruction needs on a multi-sector basis. Resources from the Fund will be available to central governments and other suitable entities including non-governmental organizations.
ATF’s resources may consist of allocations from the net income of OCR and contributions from bilateral, multilateral, and individual sources.
Unless otherwise agreed by the contributors and ADB, ATF will terminate on the earlier of (i) the date five years from the Board approval of the ATF, or (ii) such date as the ATF funds have been fully disbursed by ADB. The ATF was terminated on 31 December 2010 and all projects were financially completed as of 31 December 2011.
ADB is immune from taxation pursuant to Chapter VIII, Article 56, Exemption from Taxation, of the Charter.
1 Asian Development Fund (ADF), Technical Assistance Special Fund (TASF), Japan Special Fund (JSF), ADB Institute (ADBI), Asian Tsunami Fund (ATF), Pakistan Earthquake Fund (PEF), Regional Cooperation and Integration Fund (RCIF), Climate Change Fund (CCF), and Asia Pacific Disaster Response Fund (APDRF).

atF-4
cOntinUED
Asian Tsunami Fund
187
NOTE B—SUMMARY OF SIGNIFICANT ACCOUNTING POLICIES
Presentation of the Financial Statements
The financial statements of the ATF are prepared in accordance with accounting principles generally accepted in the United States of America (US GAAP), and are presented on the basis of those for not-for-profit organizations.
ATF reports donors’ contributions of cash and other assets as unrestricted assets as these are made available to ATF without conditions other than for the purpose of pursuing its objectives.
Functional and Reporting Currency
The United States dollar is the functional and reporting currency, representing the currency of the primary economic operating environment of ATF.
Translation of Currencies
ADB adopts the use of daily exchange rates for accounting and financial reporting purposes. This allows transactions denominated in non-US dollar to be translated to the reporting currency using exchange rates applicable at the time of transactions. Contributions included in the financial statements during the year are recognized at applicable exchange rates as of the respective dates of commitment. At the end of each accounting month, translations of assets, liabilities, and uncommitted balances which are denominated in non-US dollar are adjusted using the applicable rates of exchange at the end of the reporting period. These translation adjustments are accounted for as exchange gains or losses and are credited or charged to operations.
Investments
All investment securities held by ATF are reported at fair value. Realized and unrealized gains and losses are included in revenue. Time deposits are reported at cost which is a reasonable estimate of fair value.
Interest income on time deposits are recognized as realized and reported in revenue from investments.
Grants and Undisbursed Commitments
Grants are recognized in the financial statements when the project is approved and becomes effective. Upon completion or cancellation of a grant, any undisbursed amount is written back as a reduction in grants for the year and the corresponding undisbursed commitment is eliminated accordingly.
Advances are provided from grants to the executing agency or co-operating institution, for the purpose of making payments for eligible expenses. The advances are subject to liquidation and charged against undisbursed commitment. Any unutilized portion is required to be returned to the fund. These are included in “ADVANCES FOR GRANTS.”

asian DEVELOpMEnt BanK—asian tsUnaMi FUnD
NOTES TO FINANCIAL STATEMENTS31 December 2011 and 2010
Asian Development Bank Annual Report 2011
188
Accounting Estimates
The preparation of financial statements in conformity with generally accepted accounting principles requires management to make reasonable estimates and assumptions that affect the reported amounts of assets and liabilities and uncommitted balances as of the end of the year and the reported amounts of revenue and expenses during the year. The actual results could differ from those estimates.
Accounting and Reporting Developments
Accounting Standards Update (ASU) 2010-06, “Fair Value Measurements and Disclosures (Topic 820) – Improving Disclosures about Fair Value Measurements” with respect to the separate disclosures about gross purchases, sales, issuances, and settlements relating to Level 3 measurements is effective for fiscal years beginning after 15 December 2010 and for interim periods within those fiscal years. This update did not have a material impact on ATF’s financial statements.
In May 2011, the Financial Accounting Standards Board issued ASU 2011-04, “Fair Value Measurement (Topic 820) – Amendments to Achieve Common Fair Value Measurement and Disclosure Requirements in US GAAP and IFRSs,” which provides the consistency between US GAAP and International Financial Reporting Standards (IFRSs) on the definition of fair value (FV) and on the guidance on how to measure FV and on what to disclose about FV measurements. The amendments to the update do not require additional FV measurements and are not intended to establish valuation standards or affect valuation practices outside of financial reporting. The new guidance will require prospective application and are effective for interim and annual periods beginning on or after 15 December 2011. ADB is currently assessing the impact of this update on ATF’s financial statements.
Statement of Cash Flows
For the purposes of the Statement of Cash Flows, ATF considers that its cash and cash equivalents are limited to “DUE FROM BANKS,” which consists of cash on hand and current accounts in banks used for operational disbursements.
NOTE C—INVESTMENTS
The main investment management objective is to maintain security and liquidity. Subject to these parameters, ADB seeks the highest possible return on its investments. Investments are governed by the Investment Authority approved by the Board of Directors in 2006.
All investments held as of 31 December 2011 and 2010 were in time deposits. The annualized rate of return on the average investments held during the year, based on the
portfolio held at the beginning and end of each month, was 0.18% (0.24% – 2010).
NOTE D—RELATED PARTY TRANSACTIONS
The OCR and special funds resources are at all times used, committed, and invested entirely separate from each other. The administrative and operational expenses pertaining to ATF are settled regularly

atF-4
cOntinUED
Asian Tsunami Fund
189
with OCR and the other funds. Grants programs may be combined activities financed by special and trust funds. ADB charges a service fee to cover ADB’s cost for the administration, management, supervision, and operation of the ATF. The service fee is currently 2% of the amount disbursed for grants and investment projects. As of 31 December 2011, $7,000 ($225,000 – 2010) was payable to OCR, which is included in “ACCOUNTS PAYABLE AND OTHER LIABILITIES.”
NOTE E—UNDISBURSED COMMITMENTS
Undisbursed commitments are denominated in United States dollars and represent effective grants not yet disbursed and unliquidated. During 2011, $4,644,000 (nil – 2010) representing completed and cancelled grant projects was written back as a reduction in grants of the period and the corresponding undisbursed commitment was eliminated. The fair value of undisbursed commitments approximates the amounts outstanding, because ADB expects that disbursements will substantially be made for all the projects/programs covered by the commitments.
NOTE F—CONTRIBUTIONS AND UNCOMMITTED BALANCES
In April and May 2005, ADB contributed $600,000,000 from OCR surplus to ATF. Contributions were also received from Australia and Luxembourg amounting to $3,796,000 and $1,000,000, respectively. In November 2005, following the establishment of Pakistan Earthquake Fund (PEF) in response to the special circumstances surrounding the 8 October 2005 earthquake in Pakistan, unutilized ATF fund of $40,000,000 was transferred back to OCR, which was subsequently transferred to PEF. Another $10,000,000 was returned to OCR in June 2006 and was committed as ADB’s contribution to the Java Reconstruction Fund in November 2008, to support post-disaster management, rehabilitation, immediate construction, and urgent vital development activities in Yogyakarta and Central Java in Indonesia. In May 2009, $40,000,000 was transferred to Asia Pacific Disaster Response Fund (APDRF). APDRF was established to provide incremental grant resources to DMCs affected by natural disasters.
No contributions were received in 2011 and 2010.As of 31 December 2011, no further commitments were made.
NOTE G—FAIR VALUE MEASUREMENTS
ASC 820 defines fair value as the price that would be received to sell an asset or paid to transfer a liability at measurement date (exit price) in an orderly transaction among willing participants with an assumption that the transaction takes place in the entity’s principal market, the most advantageous market for the asset or liability. The most advantageous market is where the sale of the asset or transfer of liability would maximize the amount received for the asset or minimize the amount paid to transfer the liability. The fair value measurement is not adjusted for transaction cost.
ASC 820 also establishes a fair value hierarchy that gives the highest priority to quoted prices in active markets for identical assets or liabilities (Level 1), next priority to observable market inputs or market corroborated data (Level 2), and the lowest priority to unobservable inputs without market

asian DEVELOpMEnt BanK—asian tsUnaMi FUnD
NOTES TO FINANCIAL STATEMENTS31 December 2011 and 2010
Asian Development Bank Annual Report 2011
190
corroborated data (Level 3). ASC 820 requires the fair value measurement to maximize the use of market observable inputs.
The following guidelines are applied in determining the fair values of financial instruments:
Investments
Readily marketable investments are fair valued using active market quotes in Level 1 category. Level 2 category includes investments which are fair valued with significant market observable inputs.
The fair value of the following financial assets of ATF as of 31 December 2011 and 2010 were reported based on the following:
Fair Value Measurements
Quoted prices in active Markets
for identical assets
significant Market Observable
inputs
significant Unobservable
inputs31 December 2011 (Level 1) (Level 2) (Level 3)
assets
Investments Time deposits $ 6,600,000 $ – $ 6,600,000 $ –
Fair Value Measurements
Quoted prices in active Markets
for identical assets
significant Market Observable
inputs
significant Unobservable
inputs31 December 2010 (Level 1) (Level 2) (Level 3)
assets
Investments Time deposits $19,042,000 $ – $19,042,000 $ –
See Notes C and E for discussions relating to investments and undisbursed commitments, respec-tively. In all other cases, the carrying amounts of the ATF’s assets, liabilities, and uncommitted balances are considered to approximate fair values for all significant financial instruments.
NOTE H—SUBSEQUENT EVENTS
ADB has evaluated subsequent events after 31 December 2011 through 14 March 2012, the date these Financial Statements are available for issuance. As a result of this evaluation, there are no subsequent events, as defined, that require recognition or disclosure in the ATF’s Financial Statements as of 31 December 2011.

Pakistan Earthquake Fund
191
paKistan eartHQuaKe Fund
MANAGEMENT’S REPORT ON INTERNAL CONTROL OVER FINANCIAL REPORTING
The management of Asian Development Bank (“ADB”) is responsible for establishing and maintaining adequate internal control over financial reporting. ADB’s internal control over financial reporting is a process designed to provide reasonable assurance regarding the reliability of financial reporting and the preparation of financial statements for external purposes in accordance with generally accepted accounting principles in the United States of America.
ADB’s internal control over financial reporting includes those policies and procedures that (i) pertain to the maintenance of records that, in reasonable detail, accurately and fairly reflect the transactions and dispositions of the assets of ADB; (ii) provide reasonable assurance that transactions are recorded as necessary to permit preparation of financial statements in accordance with generally accepted accounting principles in the United States of America, and that receipts and expenditures of ADB are being made only in accordance with authorizations of management and directors of ADB; and (iii) provide reasonable assurance regarding prevention or timely detection of unauthorized acquisition, use, or disposition of ADB’s assets that could have a material effect on the financial statements.
Because of its inherent limitations, internal control over financial reporting may not prevent or detect misstatements. Also, projections of any evaluation of effectiveness to future periods are subject to the risk that controls may become inadequate because of changes in conditions, or that the degree of compliance with the policies or procedures may deteriorate.
ADB’s management assessed the effectiveness of ADB’s internal control over financial reporting as of 31 December 2011. In making this assessment, ADB’s management used the criteria set forth by the Committee of Sponsoring Organizations of the Treadway Commission in Internal Control – Integrated Framework. Based on that assessment, management believes that as of 31 December 2011, ADB’s internal control over financial reporting is effective based upon the criteria established in Internal Control – Integrated Framework.
Haruhiko KurodaPresident
Thierry de LonguemarVice-President (Finance and Administration)
Hiroshi FukukawaOfficer-in-Charge, Controller’s Department
14 March 2012

Asian Development Bank Annual Report 2011
192
Deloitte Touche LLPCertified Public AccountantsUnique Entity No. T08LL0721A6 Shenton Way #32-00DBS Building Tower TwoSingapore 068809
Tel: +65 6224 8288Fax: +65 6538 6166www.deloitte.com/sg
INDEPENDENT AUDITORS’ REPORT
To the Board of Directors and the Board of Governors of Asian Development Bank
We have audited management’s assertion, included in the accompanying Management’s Report on Internal Control over Financial Reporting, that Asian Development Bank (“ADB”) maintained effective internal control over financial reporting as of December 31, 2011, based on the criteria established in Internal Control — Integrated Framework issued by the Committee of Sponsoring Organizations of the Treadway Commission. ADB’s management is responsible for maintaining effective internal control over financial reporting and for its assertion of the effectiveness of internal control over financial reporting, included in the accompanying Management’s Report on Internal Control over Financial Reporting. Our responsibility is to express an opinion on management’s assertion based on our audit.
We conducted our audit in accordance with attestation standards established by the American Institute of Certified Public Accountants. Those standards require that we plan and perform the audit to obtain reasonable assurance about whether effective internal control over financial reporting was maintained in all material respects. Our audit included obtaining an understanding of internal control over financial reporting, assessing the risk that a material weakness exists, and testing and evaluating the design and operating effectiveness of internal control based on the assessed risk. Our audit also included performing such other procedures as we considered necessary in the circumstances. We believe that our audit provides a reasonable basis for our opinion.
ADB’s internal control over financial reporting is a process designed to provide reasonable assurance regarding the reliability of financial reporting and the preparation of financial statements for external purposes in accordance with accounting principles generally accepted in the United States of America. ADB’s internal control over financial reporting includes those policies and procedures that (1) pertain to the maintenance of records that, in reasonable detail, accurately and fairly reflect the transactions and dispositions of the assets of ADB; (2) provide reasonable assurance that transactions are recorded as necessary to permit preparation of financial statements in accordance with accounting principles generally accepted in the United States of America, and that receipts and expenditures of ADB are being made only in accordance with authorizations of management and directors of ADB; and (3) provide reasonable assurance regarding prevention or timely detection of unauthorized acquisition, use, or disposition of ADB’s assets that could have a material effect on the financial statements.
Deloitte Touche LLP (Unique Entity No. T08LL0721A) is an accounting limited liability partnership registered in Singaporeunder the Limited Liability Partnerships Act (Chapter 163A).

Pakistan Earthquake Fund
193
Because of the inherent limitations of internal control over financial reporting, including the possibility of collusion or improper management override of controls, material misstatements due to error or fraud may not be prevented or detected and corrected on a timely basis. Also, projections of any evaluation of the effectiveness of the internal control over financial reporting to future periods are subject to the risk that the controls may become inadequate because of changes in conditions or that the degree of compliance with the policies or procedures may deteriorate.
In our opinion, management’s assertion that ADB maintained effective internal control over financial reporting as of December 31, 2011, is fairly stated, in all material respects, based on the criteria established in Internal Control — Integrated Framework issued by the Committee of Sponsoring Organizations of the Treadway Commission.
We have also audited, in accordance with auditing standards generally accepted in the United States of America, the accompanying statement of financial position of Asian Development Bank (“ADB”) – Pakistan Earthquake Fund as of December 31, 2011 and 2010 and the related statements of activities and changes in net assets, and cash flows, for each of the years in the two-year period ended December 31, 2011 and our report dated March 14, 2012 expressed an unqualified opinion on those financial statements.
Public Accountants and Certified Public Accountants
SingaporeMarch 14, 2012

Asian Development Bank Annual Report 2011
194
Deloitte Touche LLPCertified Public AccountantsUnique Entity No. T08LL0721A6 Shenton Way #32-00DBS Building Tower TwoSingapore 068809
Tel: +65 6224 8288Fax: +65 6538 6166www.deloitte.com/sg
INDEPENDENT AUDITORS’ REPORT
To the Board of Directors and the Board of Governors of Asian Development Bank
We have audited the accompanying statement of financial position of Asian Development Bank (“ADB”) – Pakistan Earthquake Fund as of December 31, 2011 and 2010 and the related statements of activities and changes in net assets, and cash flows, for each of the years in the two-year period ended December 31, 2011. These financial statements are the responsibility of ADB’s management. Our responsibility is to express an opinion on these financial statements based on our audits.
We conducted our audits in accordance with auditing standards generally accepted in the United States of America. Those standards require that we plan and perform the audit to obtain reasonable assurance about whether the financial statements are free of material misstatement. An audit includes examining, on a test basis, evidence supporting the amounts and disclosures in the financial statements, assessing the accounting principles used and significant estimates made by management, as well as evaluating the overall financial statement presentation. We believe that our audits provide a reasonable basis for our opinion.
In our opinion, such financial statements present fairly, in all material respects, the financial position of ADB – Pakistan Earthquake Fund as of December 31, 2011 and 2010, and the results of its operations and its cash flows for each of the years in the two-year period ended December 31, 2011 in conformity with accounting principles generally accepted in the United States of America.
We have also audited, in accordance with attestation standards established by the American Institute of Certified Public Accountants, management’s assertion that ADB maintained effective internal control over financial reporting as of December 31, 2011, based on the criteria established in Internal Control — Integrated Framework issued by the Committee of Sponsoring Organizations of the Treadway Commission and our report dated March 14, 2012 expressed an unqualified opinion on management’s assertion that ADB maintained effective internal control over financial reporting.
Public Accountants and Certified Public Accountants
SingaporeMarch 14, 2012
Deloitte Touche LLP (Unique Entity No. T08LL0721A) is an accounting limited liability partnership registered in Singaporeunder the Limited Liability Partnerships Act (Chapter 163A).

Pakistan Earthquake Fund
195
2011 2010
assEts
DUE FROM BANKS $ 575 $ 470
INVESTMENTS (Notes C and G)Time deposits 20,791 30,322
ACCRUED REVENUE 4 57
ADVANCES FOR GRANTS 2,964 7,130
tOtaL $24,334 $37,979
LiaBiLitiEs anD UncOMMittED BaLancEs
ACCOUNTS PAYABLE AND OTHER LIABILITIES (Note D) $ 57 $ 61
UNDISBURSED COMMITMENTS (Notes E and G) 19,724 33,980
TOTAL LIABILITIES 19,781 34,041
UNCOMMITTED BALANCES (PEF-2) (Note F), represented by:Unrestricted net assets 4,553 3,938
tOtaL $24,334 $37,979
The accompanying notes are an integral part of these financial statements (PEF-4).
pEF-1
asian DEVELOpMEnt BanK—paKistan EaRthQUaKE FUnD
STATEMENT OF FINANCIAL POSITION31 December 2011 and 2010 Expressed in thousands of United states Dollars

Asian Development Bank Annual Report 2011
196
2011 2010
changEs in UnREstRictED nEt assEts
REVENUE From investments (Note C) $1,029 $1,254 From other sources 142 132
Total 1,171 1,386
EXPENSESTechnical assistance (Note E) (220) – Administrative expenses (Note D) 295 323
Total 75 323
REVENUE IN EXCESS OF EXPENSES 1,096 1,063
EXCHANGE LOSSES—net (481) (439)
INCREASE IN NET ASSETS 615 624
NET ASSETS AT BEGINNING OF YEAR 3,938 3,314
nEt assEts at EnD OF yEaR $4,553 $3,938
The accompanying notes are an integral part of these financial statements (PEF-4).
pEF-2
asian DEVELOpMEnt BanK—paKistan EaRthQUaKE FUnD
STATEMENT OF ACTIVITIES AND CHANGES IN NET ASSETSFor the Years Ended 31 December 2011 and 2010 Expressed in thousands of United states Dollars

Pakistan Earthquake Fund
197
2011 2010
CASH FLOWS FROM OPERATING ACTIVITIESInterest on investments received $ 1,081 $ 1,254 Net cash received from other sources 142 132 Grants and technical assistance disbursed (9,870) (19,589)Administrative and financial expenses paid (299) (314)
Net Cash Used in Operating Activities (8,946) (18,517)
CASH FLOWS FROM INVESTING ACTIVITIESMaturities of investments 678,596 981,089 Purchases of investments (669,435) (962,608)
Net Cash Provided by Investing Activities 9,161 18,481
Effect of Exchange Rate Changes on Due from Banks (110) (45)
Net Increase (Decrease) in Due from Banks 105 (81)
Due from Banks at Beginning of Year 470 551
Due from Banks at End of Year $ 575 $ 470
RECONCILIATION OF INCREASE IN NET ASSETS TO NET CASH USED IN OPERATING ACTIVITIES:
Increase in net assets (PEF-2) $ 615 $ 624 Adjustments to reconcile increase in net assets to net cash used in operating activities:
Change in accrued revenue 51 (0)Change in advances for grants 4,166 (4,123)Change in miscellaneous liabilities (3) 9 Change in undisbursed commitments (14,256) (15,466)Exchange losses—net 481 439
Net Cash Used in Operating Activities $ (8,946) $ (18,517)
0 = Less than $500.The accompanying notes are an integral part of these financial statements (PEF-4).
pEF-3
asian DEVELOpMEnt BanK—paKistan EaRthQUaKE FUnD
STATEMENT OF CASH FLOWSFor the Years Ended 31 December 2011 and 2010 Expressed in thousands of United states Dollars

asian DEVELOpMEnt BanK—paKistan EaRthQUaKE FUnD
NOTES TO FINANCIAL STATEMENTS31 December 2011 and 2010
Asian Development Bank Annual Report 2011
198
NOTE A—NATURE OF OPERATIONS
The Asian Development Bank (ADB), a multilateral development financial institution, was established in 1966 with its headquarters in Manila, Philippines. ADB and its operations are governed by the Agreement Establishing the Asian Development Bank (the Charter). Its purpose is to foster economic development and co-operation in Asia and the Pacific region and to contribute to the acceleration of the process of economic development of the developing member countries (DMCs) in the region, collectively and individually. Since 1999, ADB’s corporate vision and mission has been to help DMCs reduce poverty in the region. This was reaffirmed under the long-term strategic framework for 2008–2020 (Strategy 2020). Under Strategy 2020, ADB’s corporate vision continues to be “An Asia and Pacific Free of Poverty” and its mission has been to help its DMCs reduce poverty and improve living conditions and quality of life. ADB has been pursuing its mission and vision by focusing on three complementary strategic agendas: inclusive growth, environmentally sustainable growth, and regional integration. ADB provides financial and technical assistance for projects and programs, which will contribute to achieving this purpose. These are financed through ordinary capital resources (OCR) and Special Funds.1
The PEF was established on 14 November 2005 in response to the special circumstances confronted by Pakistan resulting from the effects of an earthquake on 8 October 2005. The objective of the PEF is to deliver emergency grant financing promptly and effectively to Pakistan in the form of technical assistance and investment projects to support reconstruction, rehabilitation, and associated development activities.
PEF resources will be available to the Government of Pakistan and other suitable entities acceptable to the Government of Pakistan and ADB, including, where appropriate, nongovernment organizations.
PEF’s resources may consist of allocations from the net income of OCR and contributions from bilateral, multilateral, and individual sources.
Unless otherwise agreed by the contributors and ADB, PEF will terminate on the earlier of (i) the date three to four years from the Board approval of the PEF, or (ii) such date as the PEF funds have been fully disbursed by ADB. The PEF was terminated on 30 June 2011, but actions necessary to wind up its activities will continue after its termination.
ADB is immune from taxation pursuant to Chapter VIII, Article 56, Exemption from Taxation, of the Charter.
NOTE B—SUMMARY OF SIGNIFICANT ACCOUNTING POLICIES
Presentation of the Financial Statements
The financial statements of the PEF are prepared in accordance with accounting principles generally accepted in the United States of America, and are presented on the basis of those for not-for-profit organizations.
1 Asian Development Fund (ADF), Technical Assistance Special Fund (TASF), Japan Special Fund (JSF), ADB Institute (ADBI), Asian Tsunami Fund (ATF), Pakistan Earthquake Fund (PEF), Regional Cooperation and Integration Fund (RCIF), Climate Change Fund (CCF), and Asia Pacific Disaster Response Fund (APDRF).

pEF-4
cOntinUED
Pakistan Earthquake Fund
199
PEF reports donors’ contributions of cash and other assets as unrestricted assets as these are made available to PEF without conditions other than for the purpose of pursuing its objectives.
Functional and Reporting Currency
The United States dollar is the functional and reporting currency, representing the currency of the primary economic operating environment of PEF.
Translation of Currencies
ADB adopts the use of daily exchange rates for accounting and financial reporting purposes. This allows transactions denominated in non-US dollar to be translated to the reporting currency using exchange rates applicable at the time of transactions. Contributions included in the financial statements during the year are recognized at applicable exchange rates as of the respective dates of commitment. At the end of each accounting month, translations of assets, liabilities, and uncommitted balances which are denominated in non-US dollar are adjusted using the applicable rates of exchange at the end of the reporting period. These translation adjustments are accounted for as exchange gains or losses and are credited or charged to operations.
Investments
All investment securities held by PEF are reported at fair value. Realized and unrealized gains and losses are included in revenue. Time deposits are reported at cost which is a reasonable estimate of fair value.
Interest income on investment securities and time deposits are recognized as realized and reported, net of amortizations of premiums and discounts.
Contributions
The contributions from donors and the allocations from OCR net income are included in the financial statements, from the date of effectivity of the contribution agreement, and the Board of Governors’ approval, respectively.
Technical Assistance, Grants, and Undisbursed Commitments
Technical assistance (TA) and grants are recognized in the financial statements when the project is approved and becomes effective. Upon completion of a TA project or cancellation of a grant, any undisbursed amount is written back as a reduction in technical assistance or grants for the year and the corresponding undisbursed commitment is eliminated accordingly.
Advances are provided from TA and grants to the executing agency or co-operating institution, for the purpose of making payments for eligible expenses. The advances are subject to liquidation and charged against undisbursed commitment. Any unutilized portion is required to be returned to the fund.

asian DEVELOpMEnt BanK—paKistan EaRthQUaKE FUnD
NOTES TO FINANCIAL STATEMENTS31 December 2011 and 2010
Asian Development Bank Annual Report 2011
200
Accounting Estimates
The preparation of financial statements in conformity with generally accepted accounting principles requires management to make reasonable estimates and assumptions that affect the reported amounts of assets and liabilities and uncommitted balances as of the end of the year and the reported amounts of revenue and expenses during the year. The actual results could differ from those estimates.
Accounting and Reporting Developments
Accounting Standards Update (ASU) 2010-06, “Fair Value Measurements and Disclosures (Topic 820) – Improving Disclosures about Fair Value Measurements” with respect to the separate disclosures about gross purchases, sales, issuances, and settlements relating to Level 3 measurements is effective for fiscal years beginning after 15 December 2010 and for interim periods within those fiscal years. This update did not have a material impact on PEF’s financial statements as of 31 December 2011.
In May 2011, the Financial Accounting Standards Board issued ASU 2011-04, “Fair Value Measurement (Topic 820) – Amendments to Achieve Common Fair Value Measurement and Disclosure Requirements in US GAAP and IFRSs,” which provides the consistency between US GAAP and International Financial Reporting Standards (IFRSs) on the definition of fair value (FV) and on the guidance on how to measure FV and on what to disclose about FV measurements. The amendments to the update do not require additional FV measurements and are not intended to establish valuation standards or affect valuation practices outside of financial reporting. The new guidance will require prospective application and are effective for interim and annual periods beginning on or after 15 December 2011. ADB is currently assessing the impact of this update on PEF’s financial statements.
Statement of Cash Flows
For the purposes of the Statement of Cash Flows, PEF considers that its cash and cash equivalents are limited to “DUE FROM BANKS,” which consists of cash on hand and current accounts in banks used for operational disbursements.
NOTE C—INVESTMENTS
The main investment management objective is to maintain security and liquidity. Subject to these parameters, ADB seeks the highest possible return on its investments. Investments are governed by the Investment Authority approved by the Board of Directors in 2006.
All investments held as of 31 December 2011 and 2010 were in time deposits.

pEF-4
cOntinUED
Pakistan Earthquake Fund
201
The currency compositions of the investment portfolio as of 31 December 2011 and 2010 expressed in United States dollars are as follows:
currency 2011 2010
Pakistan rupee $ 7,225,000 $ 14,573,000
United States dollar 13,566,000 15,749,000
total $20,791,000 $30,322,000
The annualized rate of return on the average investments held during the year, based on the portfolio held at the beginning and end of each month, was 5.08% (4.03% – 2010).
NOTE D—RELATED PARTY TRANSACTIONS
The OCR and special funds resources are at all times used, committed, and invested entirely separate from each other. The administrative and operational expenses pertaining to PEF are settled regularly with OCR and the other funds. Regional technical assistance projects and programs may be combined activities financed by special and trust funds. ADB charges a service fee to cover ADB’s cost for the administration, management, supervision, and operation of the PEF. The service fee is currently 2% of the amount disbursed for technical assistance and investment projects. As of 31 December 2011, $50,000 was payable to OCR ($54,000 – 2010) which is included in “ACCOUNTS PAYABLE AND OTHER LIABILITIES.”
NOTE E—UNDISBURSED COMMITMENTS
Undisbursed commitments are denominated in United States dollars and represent effective grants not yet disbursed and unliquidated. During 2011, $220,000 (nil – 2010) representing completed and cancelled TA project was written back as a reduction in technical assistance of the period and the corresponding undisbursed commitment was eliminated. The fair value of undisbursed commitments approximates the amounts outstanding, because ADB expects that disbursements will substantially be made for all the projects/programs covered by the commitments.
NOTE F—UNCOMMITTED BALANCES
Uncommitted balances comprise amounts which have not been committed by ADB as of 31 December 2011 and 2010.

asian DEVELOpMEnt BanK—paKistan EaRthQUaKE FUnD
NOTES TO FINANCIAL STATEMENTS31 December 2011 and 2010
Asian Development Bank Annual Report 2011
202
NOTE G—FAIR VALUE MEASUREMENTS
ASC 820 defines fair value as the price that would be received to sell an asset or paid to transfer a liability at measurement date (exit price) in an orderly transaction among willing participants with an assumption that the transaction takes place in the entity’s principal market, the most advantageous market for the asset or liability. The most advantageous market is where the sale of the asset or transfer of liability would maximize the amount received for the asset or minimize the amount paid to transfer the liability. The fair value measurement is not adjusted for transaction cost.
ASC 820 also establishes a fair value hierarchy that gives the highest priority to quoted prices in active markets for identical assets or liabilities (Level 1), next priority to observable market inputs or market corroborated data (Level 2), and the lowest priority to unobservable inputs without market corroborated data (Level 3). ASC 820 requires the fair value measurement to maximize the use of market observable inputs.
The following guidelines are applied in determining the fair values of financial instruments:
Investments
Readily marketable investments are fair valued using active market quotes in Level 1 category. Level 2 category includes investments which are fair valued with significant market observable inputs.
The fair value of the following financial assets of PEF as of 31 December 2011 and 2010 were reported based on the following:
Fair Value Measurements
Quoted prices in active Markets
for identical assets
significant Market Observable
inputs
significant Unobservable
inputs31 December 2011 (Level 1) (Level 2) (Level 3)
assets
Investments Time deposits $20,791,000 $ – $20,791,000 $ –
Fair Value Measurements
Quoted prices in active Markets
for identical assets
significant Market Observable
inputs
significant Unobservable
inputs31 December 2010 (Level 1) (Level 2) (Level 3)
assets
Investments Time deposits $30,322,000 $ – $30,322,000 $ –

pEF-4
cOntinUED
Pakistan Earthquake Fund
203
See Notes C and E for discussions relating to investments and undisbursed commitments, respectively. In all other cases, the carrying amount of PEF’s assets, liabilities, and uncommitted balances are considered to approximate fair values for all significant financial instruments.
NOTE H—SUBSEQUENT EVENTS
ADB has evaluated subsequent events after 31 December 2011 through 14 March 2012, the date these Financial Statements are available for issuance. As a result of this evaluation, there are no subsequent events, as defined, that require recognition or disclosure in the PEF’s Financial Statements as of 31 December 2011.

Asian Development Bank Annual Report 2011
204
reGiOnal cOOperatiOn and inteGratiOn Fund
MANAGEMENT’S REPORT ON INTERNAL CONTROL OVER FINANCIAL REPORTING
The management of Asian Development Bank (“ADB”) is responsible for establishing and maintaining adequate internal control over financial reporting. ADB’s internal control over financial reporting is a process designed to provide reasonable assurance regarding the reliability of financial reporting and the preparation of financial statements for external purposes in accordance with generally accepted accounting principles in the United States of America.
ADB’s internal control over financial reporting includes those policies and procedures that (i) pertain to the maintenance of records that, in reasonable detail, accurately and fairly reflect the transactions and dispositions of the assets of ADB; (ii) provide reasonable assurance that transactions are recorded as necessary to permit preparation of financial statements in accordance with generally accepted accounting principles in the United States of America, and that receipts and expenditures of ADB are being made only in accordance with authorizations of management and directors of ADB; and (iii) provide reasonable assurance regarding prevention or timely detection of unauthorized acquisition, use, or disposition of ADB’s assets that could have a material effect on the financial statements.
Because of its inherent limitations, internal control over financial reporting may not prevent or detect misstatements. Also, projections of any evaluation of effectiveness to future periods are subject to the risk that controls may become inadequate because of changes in conditions, or that the degree of compliance with the policies or procedures may deteriorate.
ADB’s management assessed the effectiveness of ADB’s internal control over financial reporting as of 31 December 2011. In making this assessment, ADB’s management used the criteria set forth by the Committee of Sponsoring Organizations of the Treadway Commission in Internal Control – Integrated Framework. Based on that assessment, management believes that as of 31 December 2011, ADB’s internal control over financial reporting is effective based upon the criteria established in Internal Control – Integrated Framework.
Haruhiko KurodaPresident
Thierry de LonguemarVice-President (Finance and Administration)
Hiroshi FukukawaOfficer-in-Charge, Controller’s Department
14 March 2012

Regional Cooperation and Integration Fund
205
Deloitte Touche LLPCertified Public AccountantsUnique Entity No. T08LL0721A6 Shenton Way #32-00DBS Building Tower TwoSingapore 068809
Tel: +65 6224 8288Fax: +65 6538 6166www.deloitte.com/sg
INDEPENDENT AUDITORS’ REPORT
To the Board of Directors and the Board of Governors of Asian Development Bank
We have audited management’s assertion, included in the accompanying Management’s Report on Internal Control over Financial Reporting, that Asian Development Bank (“ADB”) maintained effective internal control over financial reporting as of December 31, 2011, based on the criteria established in Internal Control — Integrated Framework issued by the Committee of Sponsoring Organizations of the Treadway Commission. ADB’s management is responsible for maintaining effective internal control over financial reporting and for its assertion of the effectiveness of internal control over financial reporting, included in the accompanying Management’s Report on Internal Control over Financial Reporting. Our responsibility is to express an opinion on management’s assertion based on our audit.
We conducted our audit in accordance with attestation standards established by the American Institute of Certified Public Accountants. Those standards require that we plan and perform the audit to obtain reasonable assurance about whether effective internal control over financial reporting was maintained in all material respects. Our audit included obtaining an understanding of internal control over financial reporting, assessing the risk that a material weakness exists, and testing and evaluating the design and operating effectiveness of internal control based on the assessed risk. Our audit also included performing such other procedures as we considered necessary in the circumstances. We believe that our audit provides a reasonable basis for our opinion.
ADB’s internal control over financial reporting is a process designed to provide reasonable assurance regarding the reliability of financial reporting and the preparation of financial statements for external purposes in accordance with accounting principles generally accepted in the United States of America. ADB’s internal control over financial reporting includes those policies and procedures that (1) pertain to the maintenance of records that, in reasonable detail, accurately and fairly reflect the transactions and dispositions of the assets of ADB; (2) provide reasonable assurance that transactions are recorded as necessary to permit preparation of financial statements in accordance with accounting principles generally accepted in the United States of America, and that receipts and expenditures of ADB are being made only in accordance with authorizations of management and directors of ADB; and (3) provide reasonable assurance regarding prevention or timely detection of unauthorized acquisition, use, or disposition of ADB’s assets that could have a material effect on the financial statements.
Deloitte Touche LLP (Unique Entity No. T08LL0721A) is an accounting limited liability partnership registered in Singaporeunder the Limited Liability Partnerships Act (Chapter 163A).

Asian Development Bank Annual Report 2011
206
Because of the inherent limitations of internal control over financial reporting, including the possibility of collusion or improper management override of controls, material misstatements due to error or fraud may not be prevented or detected and corrected on a timely basis. Also, projections of any evaluation of the effectiveness of the internal control over financial reporting to future periods are subject to the risk that the controls may become inadequate because of changes in conditions or that the degree of compliance with the policies or procedures may deteriorate.
In our opinion, management’s assertion that ADB maintained effective internal control over financial reporting as of December 31, 2011, is fairly stated, in all material respects, based on the criteria established in Internal Control — Integrated Framework issued by the Committee of Sponsoring Organizations of the Treadway Commission.
We have also audited, in accordance with auditing standards generally accepted in the United States of America, the accompanying statement of financial position of Asian Development Bank (“ADB”) – Regional Cooperation and Integration Fund as of December 31, 2011 and 2010 and the related statements of activities and changes in net assets, and cash flows, for each of the years in the two-year period ended December 31, 2011 and our report dated March 14, 2012 expressed an unqualified opinion on those financial statements.
Public Accountants and Certified Public Accountants
SingaporeMarch 14, 2012

Regional Cooperation and Integration Fund
207
Deloitte Touche LLPCertified Public AccountantsUnique Entity No. T08LL0721A6 Shenton Way #32-00DBS Building Tower TwoSingapore 068809
Tel: +65 6224 8288Fax: +65 6538 6166www.deloitte.com/sg
INDEPENDENT AUDITORS’ REPORT
To the Board of Directors and the Board of Governors of Asian Development Bank
We have audited the accompanying statement of financial position of Asian Development Bank (“ADB”) – Regional Cooperation and Integration Fund as of December 31, 2011 and 2010 and the related statements of activities and changes in net assets, and cash flows, for each of the years in the two-year period ended December 31, 2011. These financial statements are the responsibility of ADB’s management. Our responsibility is to express an opinion on these financial statements based on our audits.
We conducted our audits in accordance with auditing standards generally accepted in the United States of America. Those standards require that we plan and perform the audit to obtain reasonable assurance about whether the financial statements are free of material misstatement. An audit includes examining, on a test basis, evidence supporting the amounts and disclosures in the financial statements, assessing the accounting principles used and significant estimates made by management, as well as evaluating the overall financial statement presentation. We believe that our audits provide a reasonable basis for our opinion.
In our opinion, such financial statements present fairly, in all material respects, the financial position of ADB – Regional Cooperation and Integration Fund as of December 31, 2011 and 2010, and the results of its operations and its cash flows for each of the years in the two-year period ended December 31, 2011 in conformity with accounting principles generally accepted in the United States of America.
We have also audited, in accordance with attestation standards established by the American Institute of Certified Public Accountants, management’s assertion that ADB maintained effective internal control over financial reporting as of December 31, 2011, based on the criteria established in Internal Control — Integrated Framework issued by the Committee of Sponsoring Organizations of the Treadway Commission and our report dated March 14, 2012 expressed an unqualified opinion on management’s assertion that ADB maintained effective internal control over financial reporting.
Public Accountants and Certified Public Accountants
SingaporeMarch 14, 2012
Deloitte Touche LLP (Unique Entity No. T08LL0721A) is an accounting limited liability partnership registered in Singaporeunder the Limited Liability Partnerships Act (Chapter 163A).

Asian Development Bank Annual Report 2011
208
2011 2010
assEts
DUE FROM BANKS $ 179 $ 137
INVESTMENTS (Notes C and G)
Time deposits 26,083 37,421
ACCRUED REVENUE 1 3
ADVANCES FOR GRANTS AND OTHER ASSETS (Note D) 1,946 2,268
tOtaL $28,209 $39,829
LiaBiLitiEs anD UncOMMittED BaLancEs
ACCOUNTS PAYABLE AND OTHER LIABILITIES (Note D) $ 84 $ 55
UNDISBURSED COMMITMENTS (Notes E and G) 23,982 29,392
TOTAL LIABILITIES 24,066 29,447
UNCOMMITTED BALANCES (RCIF-2) (Note F), represented by:
Unrestricted net assets 4,143 10,382
tOtaL $28,209 $39,829
The accompanying notes are an integral part of these financial statements (RCIF-4).
RciF-1
asian DEVELOpMEnt BanK—REgiOnaL cOOpERatiOn anD intEgRatiOn FUnD
STATEMENT OF FINANCIAL POSITION31 December 2011 and 2010 Expressed in thousands of United states Dollars

Regional Cooperation and Integration Fund
209
RciF-2
asian DEVELOpMEnt BanK—REgiOnaL cOOpERatiOn anD intEgRatiOn FUnD
STATEMENT OF ACTIVITIES AND CHANGES IN NET ASSETSFor the Years Ended 31 December 2011 and 2010 Expressed in thousands of United states Dollars
2011 2010
changEs in UnREstRictED nEt assEts
CONTRIBUTIONS (Note F) $ – $10,000
REVENUE
From investments (Note C) 60 129
From other sources—net 0 1
Total 60 10,130
EXPENSES
Technical assistance (Note E) 5,725 11,991
Administrative expenses (Note D) 571 301
Total 6,296 12,292
CONTRIBUTIONS AND REVENUE LESS THAN EXPENSES (6,236) (2,162)
EXCHANGE (LOSSES) GAINS—net (3) 7
DECREASE IN NET ASSETS (6,239) (2,155)
NET ASSETS AT BEGINNING OF YEAR 10,382 12,537
nEt assEts at EnD OF yEaR $ 4,143 $10,382
0 = Less than $500.The accompanying notes are an integral part of these financial statements (RCIF-4).

Asian Development Bank Annual Report 2011
210
2011 2010
CASH FLOWS FROM OPERATING ACTIVITIESContributions received $ – $ 10,000 Interest on investments received 63 166 Technical assistance disbursed (10,811) (7,401)Administrative and financial expenses paid (548) (305)Net cash received from other sources 0 1
Net Cash (Used in) Provided by Operating Activities (11,296) 2,461
CASH FLOWS FROM INVESTING ACTIVITIESMaturities of investments 936,673 527,595 Purchases of investments (925,335) (530,189)
Net Cash Provided by (Used in) Investing Activities 11,338 (2,594)
Net Increase (Decrease) in Due From Banks 42 (133)
Due from Banks at Beginning of Year 137 270
Due from Banks at End of Year $ 179 $ 137
RECONCILIATION OF DECREASE IN NET ASSETS TO NET CASH (USED IN) PROVIDED BY OPERATING ACTIVITIES:
Decrease in net assets (RCIF-2) $ (6,239) $ (2,155)Adjustments to reconcile decrease in net assets to net cash (used in) provided by operating activities:
Change in accrued revenue 2 8 Change in accrued expenses 0 – Change in interfund receivables 44 (47)Change in interfund payables 29 (4)Change in advances for grants 275 (1,607)Change in undisbursed commitments (5,410) 6,244 Change in unrealized investment holding gains – 29 Exchange losses (gains)—net 3 (7)
Net Cash (Used in) Provided by Operating Activities $ (11,296) $ 2,461
0 = Less than $500.The accompanying notes are an integral part of these financial statements (RCIF-4).
RciF-3
asian DEVELOpMEnt BanK—REgiOnaL cOOpERatiOn anD intEgRatiOn FUnD
STATEMENT OF CASH FLOWSFor the Years Ended 31 December 2011 and 2010 Expressed in thousands of United states Dollars

asian DEVELOpMEnt BanK—REgiOnaL cOOpERatiOn anD intEgRatiOn FUnD
NOTES TO FINANCIAL STATEMENTS31 December 2011 and 2010
Regional Cooperation and Integration Fund
211
RciF-4
NOTE A—NATURE OF OPERATIONS
The Asian Development Bank (ADB), a multilateral development financial institution, was established in 1966 with its headquarters in Manila, Philippines. ADB and its operations are governed by the Agreement Establishing the Asian Development Bank (the Charter). Its purpose is to foster economic development and co-operation in Asia and the Pacific region and to contribute to the acceleration of the process of economic development of the developing member countries (DMCs) in the region, collectively and individually. Since 1999, ADB’s corporate vision and mission has been to help DMCs reduce poverty in the region. This was reaffirmed under the long-term strategic framework for 2008–2020 (Strategy 2020). Under Strategy 2020, ADB’s corporate vision continues to be “An Asia and Pacific Free of Poverty” and its mission has been to help its DMCs reduce poverty and improve living conditions and quality of life. ADB has been pursuing its mission and vision by focusing on three complementary strategic agendas: inclusive growth, environmentally sustainable growth, and regional integration. ADB provides financial and technical assistance for projects and programs, which will contribute to achieving this purpose. These are financed through ordinary capital resources (OCR) and Special Funds.1
The RCIF, together with the Regional Cooperation and Integration (RCI) Trust Funds, was established on 26 February 2007 under the “umbrella” of Regional Cooperation and Integration Financing Partnership Facility (RCIFPF), in response to the increasing demand for regional cooperation and integration activities among ADB’s member countries in Asia and the Pacific. Its main objective is to enhance regional cooperation and integration in Asia and the Pacific by facilitating the pooling and provision of additional financial and knowledge resources to support RCI activities.
Financial assistance will be provided in the form of untied grants for technical assistance (TA), including advisory, project preparatory, and regional TA.
RCIF’s resources may consist of contributions from ADB and other bilateral, multilateral, and individual sources, including companies and foundations.
ADB is immune from taxation pursuant to Chapter VIII, Article 56, Exemption from Taxation, of the Charter.
NOTE B—SUMMARY OF SIGNIFICANT ACCOUNTING POLICIES
Presentation of the Financial Statements
The financial statements of the RCIF are prepared in accordance with accounting principles generally accepted in the United States of America (US GAAP), and are presented on the basis of those for not-for-profit organizations.
RCIF reports donors’ contributions of cash and other assets as unrestricted assets as these are made available to RCIF without conditions other than for the purpose of pursuing its objectives.
1 Asian Development Fund (ADF), Technical Assistance Special Fund (TASF), Japan Special Fund (JSF), ADB Institute (ADBI), Asian Tsunami Fund (ATF), Pakistan Earthquake Fund (PEF), Regional Cooperation and Integration Fund (RCIF), Climate Change Fund (CCF), and Asia Pacific Disaster Response Fund (APDRF).

asian DEVELOpMEnt BanK—REgiOnaL cOOpERatiOn anD intEgRatiOn FUnD
NOTES TO FINANCIAL STATEMENTS31 December 2011 and 2010
Asian Development Bank Annual Report 2011
212
Functional and Reporting Currency
The United States dollar is the functional and reporting currency, representing the currency of the primary economic operating environment of RCIF.
Translation of Currencies
ADB adopts the use of daily exchange rates for accounting and financial reporting purposes. This allows transactions denominated in non-US dollar to be translated to the reporting currency using exchange rates applicable at the time of transactions. Contributions included in the financial statements during the year are recognized at applicable exchange rates as of the respective dates of commitment. At the end of each accounting month, translations of assets, liabilities, and uncommitted balances which are denominated in non-US dollar are adjusted using the applicable rates of exchange at the end of the reporting period. These translation adjustments are accounted for as exchange gains or losses and are credited or charged to operations.
Investments
All investment securities held by RCIF are reported at fair value. Realized and unrealized gains and losses are included in revenue. Time deposits are reported at cost which is a reasonable estimate of fair value.
Interest income on time deposits are recognized as realized and reported in revenue from investments.
Technical Assistance, Grants, and Undisbursed Commitments
Technical assistance (TA) and grants are recognized in the financial statements when the project is approved and becomes effective. Upon completion of the TA project or cancellation of a grant, any undisbursed amount is written back as a reduction in TA or grants for the year and the corresponding undisbursed commitment is eliminated accordingly.
Advances are provided from TA and grants to the executing agency or co-operating institution, for the purpose of making payments for eligible expenses. The advances are subject to liquidation and charged against undisbursed commitment. Any unutilized portion is required to be returned to the fund. These are included in “ADVANCES FOR GRANTS AND OTHER ASSETS.”
Accounting Estimates
The preparation of financial statements in conformity with generally accepted accounting principles requires management to make reasonable estimates and assumptions that affect the reported amounts of assets and liabilities and uncommitted balances as of the end of the year and the reported amounts of revenue and expenses during the year. The actual results could differ from those estimates.

RciF-4
cOntinUED
Regional Cooperation and Integration Fund
213
Accounting and Reporting Developments
Accounting Standards Update (ASU) 2010-06, “Fair Value Measurements and Disclosures (Topic 820) – Improving Disclosures about Fair Value Measurements” with respect to the separate disclosures about gross purchases, sales, issuances, and settlements relating to Level 3 measurements is effective for fiscal years beginning after 15 December 2010 and for interim periods within those fiscal years. This update did not have a material impact on RCIF’s financial statements.
In May 2011, the Financial Accounting Standards Board (FASB) issued ASU 2011-04, “Fair Value Measurement (Topic 820) – Amendments to Achieve Common Fair Value Measurement and Disclosure Requirements in US GAAP and IFRSs,” which provides the consistency between US GAAP and International Financial Reporting Standards (IFRSs) on the definition of fair value (FV) and on the guidance on how to measure FV and on what to disclose about FV measurements. The amendments to the update do not require additional FV measurements and are not intended to establish valuation standards or affect valuation practices outside of financial reporting. The new guidance will require prospective application and are effective for interim and annual periods beginning on or after 15 December 2011. ADB is currently assessing the impact of this update on RCIF’s financial statements.
Statement of Cash Flows
For the purposes of the Statement of Cash Flows, RCIF considers that its cash and cash equivalents are limited to “DUE FROM BANKS,” which consists of cash on hand and current accounts in banks used for operational disbursements.
NOTE C—INVESTMENTS
The main investment management objective is to maintain security and liquidity. Subject to these parameters, ADB seeks the highest possible return on its investments. Investments are governed by the Investment Authority approved by the Board of Directors in 2006.
All investments held as of 31 December 2011 and 2010 were in time deposits. The annualized rate of return on the average investments held during the period ended
31 December 2011, based on the portfolio held at the beginning and end of each month, was 0.20% (0.36% – 2010).
NOTE D—RELATED PARTY TRANSACTIONS
The OCR and special funds resources are at all times used, committed, and invested entirely separate from each other. The administrative and operational expenses pertaining to RCIF are settled regularly with OCR and the other funds. Regional technical assistance projects and programs may be combined activities financed by special and trust funds. ADB charges a service fee to cover ADB’s incremental cost for the administration, management, supervision, and operation of the RCIF and RCI Trust Fund, a trust fund administered by ADB. The service fee is currently 5% of the amount disbursed for technical assistance and 2% of the amount disbursed for grant components of investment projects.

asian DEVELOpMEnt BanK—REgiOnaL cOOpERatiOn anD intEgRatiOn FUnD
NOTES TO FINANCIAL STATEMENTS31 December 2011 and 2010
Asian Development Bank Annual Report 2011
214
The interfund account balances included in “ADVANCES FOR GRANTS AND OTHER ASSETS” and “ACCOUNTS PAYABLE AND OTHER LIABILITIES” are as follows:
2011 2010
Receivable from:
Technical Assistance Special Fund $48,000 $ –
Japan Special Fund – 94,000
Total $48,000 $94,000
payable to:
Ordinary capital resources $76,000 $44,000
Technical Assistance Special Fund – 5,000
Total $76,000 $49,000
NOTE E—UNDISBURSED COMMITMENTS
Undisbursed commitments are denominated in United States dollars and represent effective technical assistance and grants not yet disbursed and unliquidated. During 2011, $275,000 ($59,000 – 2010) representing completed and cancelled TA projects was written back as a reduction in technical assistance of the period and the corresponding undisbursed commitment was eliminated. The fair value of undisbursed commitments approximates the amounts outstanding, because ADB expects that disbursements will substantially be made for all the projects/programs covered by the commitments.
NOTE F—CONTRIBUTIONS AND UNCOMMITTED BALANCES
In May 2010, the Board of Governors approved the transfer of $10,000,000 to the RCIF from the 2009 OCR allocable net income.
Uncommitted balances comprise amounts which have not been committed by ADB as of 31 December 2011 and 2010.
NOTE G—FAIR VALUE MEASUREMENTS
ASC 820 defines fair value as the price that would be received to sell an asset or paid to transfer a liability at measurement date (exit price) in an orderly transaction among willing participants with an assumption that the transaction takes place in the entity’s principal market, the most advantageous market for the asset or liability. The most advantageous market is where the sale of the asset or transfer of liability would maximize the amount received for the asset or minimize the amount paid to transfer the liability. The fair value measurement is not adjusted for transaction cost.

RciF-4
cOntinUED
Regional Cooperation and Integration Fund
215
ASC 820 also establishes a fair value hierarchy that gives the highest priority to quoted prices in active markets for identical assets or liabilities (Level 1), next priority to observable market inputs or market corroborated data (Level 2), and the lowest priority to unobservable inputs without market corroborated data (Level 3). ASC 820 requires the fair value measurement to maximize the use of market observable inputs.
The following guidelines are applied in determining the fair values of financial instruments:
Investments
Readily marketable investments are fair valued using active market quotes in Level 1 category. Level 2 category includes investments which are fair valued with significant market observable inputs.
The fair values of the following financial assets of RCIF as of 31 December 2011 and 2010 were reported based on the following:
Fair Value Measurements
Quoted prices in active Markets
for identical assets
significant Market Observable
inputs
significant Unobservable
inputs31 December 2011 (Level 1) (Level 2) (Level 3)
assets
Investments Time deposits $26,083,000 $ – $26,083,000 $ –
Fair Value Measurements
Quoted prices in active Markets
for identical assets
significant Market Observable
inputs
significant Unobservable
inputs31 December 2010 (Level 1) (Level 2) (Level 3)
assets
Investments Time deposits $37,421,000 $ – $37,421,000 $ –
See Notes C and E for discussions relating to investments and undisbursed commitments, respectively. In all other cases, the carrying amount of RCIF’s assets, liabilities, and uncommitted balances are considered to approximate fair values for all significant financial instruments.
NOTE H—SUBSEQUENT EVENTS
ADB has evaluated subsequent events after 31 December 2011 through 14 March 2012, the date these Financial Statements are available for issuance. As a result of this evaluation, there are no subsequent events, as defined, that require recognition or disclosure in the RCIF’s Financial Statements as of 31 December 2011.

Asian Development Bank Annual Report 2011
216
cliMate cHanGe Fund
MANAGEMENT’S REPORT ON INTERNAL CONTROL OVER FINANCIAL REPORTING
The management of Asian Development Bank (“ADB”) is responsible for establishing and maintaining adequate internal control over financial reporting. ADB’s internal control over financial reporting is a process designed to provide reasonable assurance regarding the reliability of financial reporting and the preparation of financial statements for external purposes in accordance with generally accepted accounting principles in the United States of America.
ADB’s internal control over financial reporting includes those policies and procedures that (i) pertain to the maintenance of records that, in reasonable detail, accurately and fairly reflect the transactions and dispositions of the assets of ADB; (ii) provide reasonable assurance that transactions are recorded as necessary to permit preparation of financial statements in accordance with generally accepted accounting principles in the United States of America, and that receipts and expenditures of ADB are being made only in accordance with authorizations of management and directors of ADB; and (iii) provide reasonable assurance regarding prevention or timely detection of unauthorized acquisition, use, or disposition of ADB’s assets that could have a material effect on the financial statements.
Because of its inherent limitations, internal control over financial reporting may not prevent or detect misstatements. Also, projections of any evaluation of effectiveness to future periods are subject to the risk that controls may become inadequate because of changes in conditions, or that the degree of compliance with the policies or procedures may deteriorate.
ADB’s management assessed the effectiveness of ADB’s internal control over financial reporting as of 31 December 2011. In making this assessment, ADB’s management used the criteria set forth by the Committee of Sponsoring Organizations of the Treadway Commission in Internal Control – Integrated Framework. Based on that assessment, management believes that as of 31 December 2011, ADB’s internal control over financial reporting is effective based upon the criteria established in Internal Control – Integrated Framework.
Haruhiko KurodaPresident
Thierry de LonguemarVice-President (Finance and Administration)
Hiroshi FukukawaOfficer-in-Charge, Controller’s Department
14 March 2012

Climate Change Fund
217
Deloitte Touche LLPCertified Public AccountantsUnique Entity No. T08LL0721A6 Shenton Way #32-00DBS Building Tower TwoSingapore 068809
Tel: +65 6224 8288Fax: +65 6538 6166www.deloitte.com/sg
INDEPENDENT AUDITORS’ REPORT
To the Board of Directors and the Board of Governors of Asian Development Bank
We have audited management’s assertion, included in the accompanying Management’s Report on Internal Control over Financial Reporting, that Asian Development Bank (“ADB”) maintained effective internal control over financial reporting as of December 31, 2011, based on the criteria established in Internal Control — Integrated Framework issued by the Committee of Sponsoring Organizations of the Treadway Commission. ADB’s management is responsible for maintaining effective internal control over financial reporting and for its assertion of the effectiveness of internal control over financial reporting, included in the accompanying Management’s Report on Internal Control over Financial Reporting. Our responsibility is to express an opinion on management’s assertion based on our audit.
We conducted our audit in accordance with attestation standards established by the American Institute of Certified Public Accountants. Those standards require that we plan and perform the audit to obtain reasonable assurance about whether effective internal control over financial reporting was maintained in all material respects. Our audit included obtaining an understanding of internal control over financial reporting, assessing the risk that a material weakness exists, and testing and evaluating the design and operating effectiveness of internal control based on the assessed risk. Our audit also included performing such other procedures as we considered necessary in the circumstances. We believe that our audit provides a reasonable basis for our opinion.
ADB’s internal control over financial reporting is a process designed to provide reasonable assurance regarding the reliability of financial reporting and the preparation of financial statements for external purposes in accordance with accounting principles generally accepted in the United States of America. ADB’s internal control over financial reporting includes those policies and procedures that (1) pertain to the maintenance of records that, in reasonable detail, accurately and fairly reflect the transactions and dispositions of the assets of ADB; (2) provide reasonable assurance that transactions are recorded as necessary to permit preparation of financial statements in accordance with accounting principles generally accepted in the United States of America, and that receipts and expenditures of ADB are being made only in accordance with authorizations of management and directors of ADB; and (3) provide reasonable assurance regarding prevention or timely detection of unauthorized acquisition, use, or disposition of ADB’s assets that could have a material effect on the financial statements.
Deloitte Touche LLP (Unique Entity No. T08LL0721A) is an accounting limited liability partnership registered in Singaporeunder the Limited Liability Partnerships Act (Chapter 163A).

Asian Development Bank Annual Report 2011
218
Because of the inherent limitations of internal control over financial reporting, including the possibility of collusion or improper management override of controls, material misstatements due to error or fraud may not be prevented or detected and corrected on a timely basis. Also, projections of any evaluation of the effectiveness of the internal control over financial reporting to future periods are subject to the risk that the controls may become inadequate because of changes in conditions or that the degree of compliance with the policies or procedures may deteriorate.
In our opinion, management’s assertion that ADB maintained effective internal control over financial reporting as of December 31, 2011, is fairly stated, in all material respects, based on the criteria established in Internal Control — Integrated Framework issued by the Committee of Sponsoring Organizations of the Treadway Commission.
We have also audited, in accordance with auditing standards generally accepted in the United States of America, the accompanying statement of financial position of Asian Development Bank (“ADB”) – Climate Change Fund as of December 31, 2011 and 2010 and the related statements of activities and changes in net assets, and cash flows, for each of the years in the two-year period ended December 31, 2011 and our report dated March 14, 2012 expressed an unqualified opinion on those financial statements.
Public Accountants and Certified Public Accountants
SingaporeMarch 14, 2012

Climate Change Fund
219
Deloitte Touche LLPCertified Public AccountantsUnique Entity No. T08LL0721A6 Shenton Way #32-00DBS Building Tower TwoSingapore 068809
Tel: +65 6224 8288Fax: +65 6538 6166www.deloitte.com/sg
INDEPENDENT AUDITORS’ REPORT
To the Board of Directors and the Board of Governors of Asian Development Bank
We have audited the accompanying statement of financial position of Asian Development Bank (“ADB”) – Climate Change Fund as of December 31, 2011 and 2010 and the related statements of activities and changes in net assets, and cash flows, for each of the years in the two-year period ended December 31, 2011. These financial statements are the responsibility of ADB’s management. Our responsibility is to express an opinion on these financial statements based on our audits.
We conducted our audits in accordance with auditing standards generally accepted in the United States of America. Those standards require that we plan and perform the audit to obtain reasonable assurance about whether the financial statements are free of material misstatement. An audit includes examining, on a test basis, evidence supporting the amounts and disclosures in the financial statements, assessing the accounting principles used and significant estimates made by management, as well as evaluating the overall financial statement presentation. We believe that our audits provide a reasonable basis for our opinion.
In our opinion, such financial statements present fairly, in all material respects, the financial position of ADB – Climate Change Fund as of December 31, 2011 and 2010, and the results of its operations and its cash flows for each of the years in the two-year period ended December 31, 2011 in conformity with accounting principles generally accepted in the United States of America.
We have also audited, in accordance with attestation standards established by the American Institute of Certified Public Accountants, management’s assertion that ADB maintained effective internal control over financial reporting as of December 31, 2011, based on the criteria established in Internal Control — Integrated Framework issued by the Committee of Sponsoring Organizations of the Treadway Commission and our report dated March 14, 2012 expressed an unqualified opinion on management’s assertion that ADB maintained effective internal control over financial reporting.
Public Accountants and Certified Public Accountants
SingaporeMarch 14, 2012
Deloitte Touche LLP (Unique Entity No. T08LL0721A) is an accounting limited liability partnership registered in Singaporeunder the Limited Liability Partnerships Act (Chapter 163A).
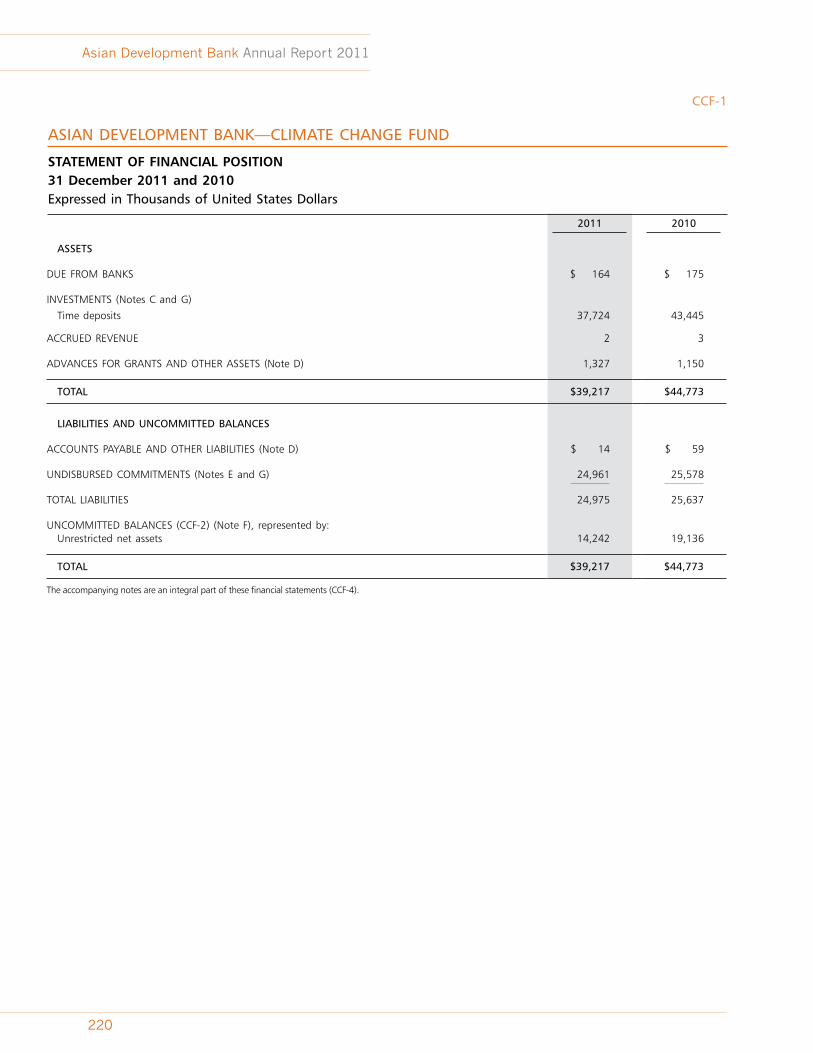
Asian Development Bank Annual Report 2011
220
2011 2010
assEts
DUE FROM BANKS $ 164 $ 175
INVESTMENTS (Notes C and G)
Time deposits 37,724 43,445
ACCRUED REVENUE 2 3
ADVANCES FOR GRANTS AND OTHER ASSETS (Note D) 1,327 1,150
tOtaL $39,217 $44,773
LiaBiLitiEs anD UncOMMittED BaLancEs
ACCOUNTS PAYABLE AND OTHER LIABILITIES (Note D) $ 14 $ 59
UNDISBURSED COMMITMENTS (Notes E and G) 24,961 25,578
TOTAL LIABILITIES 24,975 25,637
UNCOMMITTED BALANCES (CCF-2) (Note F), represented by: Unrestricted net assets 14,242 19,136
tOtaL $39,217 $44,773
The accompanying notes are an integral part of these financial statements (CCF-4).
ccF-1
asian DEVELOpMEnt BanK—cLiMatE changE FUnD
STATEMENT OF FINANCIAL POSITION31 December 2011 and 2010 Expressed in thousands of United states Dollars

Climate Change Fund
221
ccF-2
asian DEVELOpMEnt BanK—cLiMatE changE FUnD
STATEMENT OF ACTIVITIES AND CHANGES IN NET ASSETSFor the Years Ended 31 December 2011 and 2010 Expressed in thousands of United states Dollars
2011 2010
changEs in UnREstRictED nEt assEts
CONTRIBUTIONS (Note F) $ – $10,000
REVENUE
From investments (Note C) 77 149 From other sources 0 1
Total 77 10,150
EXPENSES
Technical assistance (Note E) 4,603 17,200 Administrative and financial expenses (Note D) 367 515
Total 4,970 17,715
CONTRIBUTIONS AND REVENUE LESS THAN EXPENSES (4,893) (7,565)
EXCHANGE LOSSES—net (1) (1)
DECREASE IN NET ASSETS (4,894) (7,566)
NET ASSETS AT BEGINNING OF YEAR 19,136 26,702
nEt assEts at EnD OF yEaR $14,242 $19,136
0 = Less than $500.The accompanying notes are an integral part of these financial statements (CCF-4).

Asian Development Bank Annual Report 2011
222
ccF-3
asian DEVELOpMEnt BanK—cLiMatE changE FUnD
STATEMENT OF CASH FLOWSFor the Years Ended 31 December 2011 and 2010 Expressed in thousands of United states Dollars
2011 2010
CASH FLOWS FROM OPERATING ACTIVITIESContributions received $ – $ 10,000 Interest on investments received 79 194 Technical assistance disbursed (5,400) (5,422)Administrative and financial expenses paid (412) (558)Cash received from other sources 0 0
Net Cash (Used in) Provided by Operating Activities (5,733) 4,214
CASH FLOWS FROM INVESTING ACTIVITIESMaturities of investments 1,205,923 745,204 Purchases of investments (1,200,201) (749,452)
Net Cash Provided by (Used in) Investing Activities 5,722 (4,248)
Net Decrease in Due From Banks (11) (34)
Due from Banks at Beginning of Year 175 209
Due from Banks at End of Year $ 164 $ 175
RECONCILIATION OF DECREASE IN NET ASSETS TO NET CASH (USED IN) PROVIDED BY OPERATING ACTIVITIES:
Decrease in net assets (CCF-2) $ (4,894) $ (7,566)Adjustments to reconcile decrease in net assets to net cash (used in) provided by operating activities:
Change in accrued revenue 1 9 Change in miscellaneous assets (23) 0 Change in miscellaneous liabilities (45) (43)Change in advances for technical assistance/grants (156) (810)Change in undisbursed commitments (617) 12,589 Change in unrealized investment holding losses – 35 Exchange losses (gains)—net 1 (0)
Net Cash (Used in) Provided by Operating Activities $ (5,733) $ 4,214
0 = Less than $500.The accompanying notes are an integral part of these financial statements (CCF-4).

Climate Change Fund
223
NOTE A—NATURE OF OPERATIONS
The Asian Development Bank (ADB), a multilateral development financial institution, was established in 1966 with its headquarters in Manila, Philippines. ADB and its operations are governed by the Agreement Establishing the Asian Development Bank (the Charter). Its purpose is to foster economic development and co-operation in Asia and the Pacific region and to contribute to the acceleration of the process of economic development of the developing member countries (DMCs) in the region, collectively and individually. Since 1999, ADB’s corporate vision and mission has been to help DMCs reduce poverty in the region. This was reaffirmed under the long-term strategic framework for 2008–2020 (Strategy 2020). Under Strategy 2020, ADB’s corporate vision continues to be “An Asia and Pacific Free of Poverty” and its mission has been to help its DMCs reduce poverty and improve living conditions and quality of life. ADB has been pursuing its mission and vision by focusing on three complementary strategic agendas: inclusive growth, environmentally sustainable growth, and regional integration. ADB provides financial and technical assistance for projects and programs, which will contribute to achieving this purpose. These are financed through ordinary capital resources (OCR) and Special Funds.1
The CCF was established on 7 April 2008 to facilitate greater investments in DMCs to address the causes and consequences of climate change alongside ADB’s own assistance in various related sectors. The CCF will be a key mechanism to pool resources within ADB to address climate change through (i) technical assistance (TA), (ii) investment components for both private and public sector projects, and (iii) any other form of cooperation that partners and ADB may agree upon for a defined program of activities.
Financial assistance will be provided in the form of untied grants for components of investment projects, for advisory, project preparatory, and regional TA; as well as for any other activities that may be agreed between external contributors and ADB.
CCF’s resources may consist of contributions from ADB and other bilateral, multilateral, and individual sources, including companies and foundations.
ADB is immune from taxation pursuant to Chapter VIII, Article 56, Exemption from Taxation, of the Charter.
NOTE B—SUMMARY OF SIGNIFICANT ACCOUNTING POLICIES
Presentation of the Financial Statements
The financial statements of the CCF are prepared in accordance with accounting principles generally accepted in the United States of America (US GAAP), and are presented on the basis of those for not-for-profit organizations.
CCF reports donors’ contributions of cash and other assets as unrestricted assets as these are made available to CCF without conditions other than for the purpose of pursuing its objectives.
1 Asian Development Fund (ADF), Technical Assistance Special Fund (TASF), Japan Special Fund (JSF), ADB Institute (ADBI), Asian Tsunami Fund (ATF), Pakistan Earthquake Fund (PEF), Regional Cooperation and Integration Fund (RCIF), Climate Change Fund (CCF), and Asia Pacific Disaster Response Fund (APDRF).
ccF-4
asian DEVELOpMEnt BanK—cLiMatE changE FUnD
NOTES TO FINANCIAL STATEMENTS31 December 2011 and 2010

asian DEVELOpMEnt BanK—cLiMatE changE FUnD
NOTES TO FINANCIAL STATEMENTS31 December 2011 and 2010
Asian Development Bank Annual Report 2011
224
Functional and Reporting Currency
The United States dollar is the functional and reporting currency, representing the currency of the primary economic operating environment of CCF.
Translation of Currencies
ADB adopts the use of daily exchange rates for accounting and financial reporting purposes. This allows transactions denominated in non-US dollar to be translated to the reporting currency using exchange rates applicable at the time of transactions. Contributions included in the financial statements during the year are recognized at applicable exchange rates as of the respective dates of commitment. At the end of each accounting month, translations of assets, liabilities, and uncommitted balances which are denominated in non-US dollar are adjusted using the applicable rates of exchange at the end of the reporting period. These translation adjustments are accounted for as exchange gains or losses and are credited or charged to operations.
Investments
All investment securities held by CCF are reported at fair value. Realized and unrealized gains and losses are included in revenue. Time deposits are reported at cost which is a reasonable estimate of fair value.
Interest income on investment securities and time deposits are recognized as realized and reported, net of amortizations of premiums and discounts.
Contributions
The contributions from donors and the allocations from net income of OCR are included in the financial statements, from the date of effectivity of the contributions agreement, and the Board of Governors’ approval, respectively.
Technical Assistance, Grants, and Undisbursed Commitments
Technical assistance and grants are recognized in the financial statements when the project is approved and becomes effective. Upon completion of the TA project or cancellation of a grant, any undisbursed amount is written back as a reduction in TA or grants for the year and the corresponding undisbursed commitment is eliminated accordingly.
Advances are provided from TA and grants to the executing agency or co-operating institution, for the purpose of making payments for eligible expenses. The advances are subject to liquidation and charged against undisbursed commitment. Any unutilized portion is required to be returned to the fund.
Accounting Estimates
The preparation of financial statements in conformity with generally accepted accounting principles requires management to make reasonable estimates and assumptions that affect the reported amounts

ccF-4
cOntinUED
Climate Change Fund
225
of assets and liabilities and uncommitted balances as of the end of the year and the reported amounts of revenue and expenses during the year. The actual results could differ from those estimates.
Accounting and Reporting Developments
Accounting Standards Update (ASU) 2010-06, “Fair Value Measurements and Disclosures (Topic 820) – Improving Disclosures about Fair Value Measurements” with respect to the separate disclosures about gross purchases, sales, issuances, and settlements relating to Level 3 measurements is effective for fiscal years beginning after 15 December 2010 and for interim periods within those fiscal years. This update did not have a material impact on CCF’s financial statements.
In May 2011, the Financial Accounting Standards Board issued ASU 2011-04, “Fair Value Measurement (Topic 820) – Amendments to Achieve Common Fair Value Measurement and Disclosure Requirements in US GAAP and IFRSs,” which provides the consistency between US GAAP and International Financial Reporting Standards (IFRSs) on the definition of fair value (FV) and on the guidance on how to measure FV and on what to disclose about FV measurements. The amendments to the update do not require additional FV measurements and are not intended to establish valuation standards or affect valuation practices outside of financial reporting. The new guidance will require prospective application and are effective for interim and annual periods beginning on or after 15 December 2011. ADB is currently assessing the impact of this update on CCF’s financial statements.
Statement of Cash Flows
For the purposes of the Statement of Cash Flows, CCF considers that its cash and cash equivalents are limited to “DUE FROM BANKS,” which consists of cash on hand and current accounts in banks used for operational disbursements.
NOTE C—INVESTMENTS
The main investment management objective is to maintain security and liquidity. Subject to these parameters, ADB seeks the highest possible return on its investments. Investments are governed by the Investment Authority approved by the Board of Directors in 2006.
All investments held as of 31 December 2011 and 2010 were in time deposits. The annualized rate of return on the average investments held during the period ended 31 December
2011, based on the portfolio held at the beginning and end of each month, was 0.20% (0.36% – 2010).
NOTE D—RELATED PARTY TRANSACTIONS
The OCR and special funds resources are at all times used, committed, and invested entirely separate from each other. The administrative and operational expenses pertaining to CCF are settled regularly with OCR and the other funds. Regional technical assistance projects and programs may be combined activities financed by special and trust funds. ADB charges a service fee to cover ADB’s incremental cost for the administration, management, supervision and operation of the CCF. The service fee is currently 5% of the amount disbursed for technical assistance and 2% of the amount disbursed for grant components of investment projects.

asian DEVELOpMEnt BanK—cLiMatE changE FUnD
NOTES TO FINANCIAL STATEMENTS31 December 2011 and 2010
Asian Development Bank Annual Report 2011
226
The interfund account balances included in “ADVANCES FOR GRANTS AND OTHER ASSETS” and “ACCOUNTS PAYABLE AND OTHER LIABILITIES” are as follows:
2011 2010
Receivable from:
Technical Assistance Special Fund $11,000 $ –
Japan Special Fund 13,000 –
Total $24,000 $ –
payable to:
Ordinary capital resources $ 8,000 $53,000
NOTE E—UNDISBURSED COMMITMENTS
Undisbursed commitments are denominated in United States dollars and represent TA not yet disbursed and unliquidated. During 2011, $447,000 (nil – 2010) representing completed and cancelled TA projects were written back as a reduction in technical assistance of the period and the corresponding undisbursed commitment was eliminated. The fair value of undisbursed commitments approximates the amounts outstanding, because ADB expects that disbursements will substantially be made for all the projects/programs covered by the commitments.
NOTE F—CONTRIBUTIONS AND UNCOMMITTED BALANCES
In May 2010, the Board of Governors approved the transfer of $10,000,000 to the CCF from the 2009 OCR allocable net income.
Uncommitted balances comprise amounts which have not been committed by ADB as of 31 December 2011 and 2010.
NOTE G—FAIR VALUE MEASUREMENTS
ASC 820 defines fair value as the price that would be received to sell an asset or paid to transfer a liability at measurement date (exit price) in an orderly transaction among willing participants with an assumption that the transaction takes place in the entity’s principal market, the most advantageous market for the asset or liability. The most advantageous market is where the sale of the asset or transfer of liability would maximize the amount received for the asset or minimize the amount paid to transfer the liability. The fair value measurement is not adjusted for transaction cost.
ASC 820 also establishes a fair value hierarchy that gives the highest priority to quoted prices in active markets for identical assets or liabilities (Level 1), next priority to observable market inputs

ccF-4
cOntinUED
Climate Change Fund
227
or market corroborated data (Level 2), and the lowest priority to unobservable inputs without market corroborated data (Level 3). ASC 820 requires the fair value measurement to maximize the use of market observable inputs.
The following guidelines are applied in determining the fair values of financial instruments:
Investments
Readily marketable investments are fair valued using active market quotes in Level 1 category. Level 2 category includes investments which are fair valued with significant market observable inputs.
The fair value of the following financial assets of CCF as of 31 December 2011 and 2010 were reported based on the following:
Fair Value Measurements
31 December 2011
Quoted prices in active Markets
for identical assets (Level 1)
significant Market Observable
inputs (Level 2)
significant Unobservable
inputs (Level 3)
assets
Investments Time deposits $37,724,000 $ – $37,724,000 $ –
Fair Value Measurements
31 December 2010
Quoted prices in active Markets
for identical assets (Level 1)
significant Market Observable
inputs (Level 2)
significant Unobservable
inputs (Level 3)
assets
Investments Time deposits $43,445,000 $ – $43,445,000 $ –
See Notes C and E for discussions relating to investments and undisbursed commitments, respectively. In all other cases, the carrying amount of CCF’s assets, liabilities, and uncommitted balances are considered to approximate fair values for all significant financial instruments.
NOTE H—SUBSEQUENT EVENTS
ADB has evaluated subsequent events after 31 December 2011 through 14 March 2012, the date these Financial Statements are available for issuance. As a result of this evaluation, there are no subsequent events, as defined, that require recognition or disclosure in the CCF’s Financial Statements as of 31 December 2011.
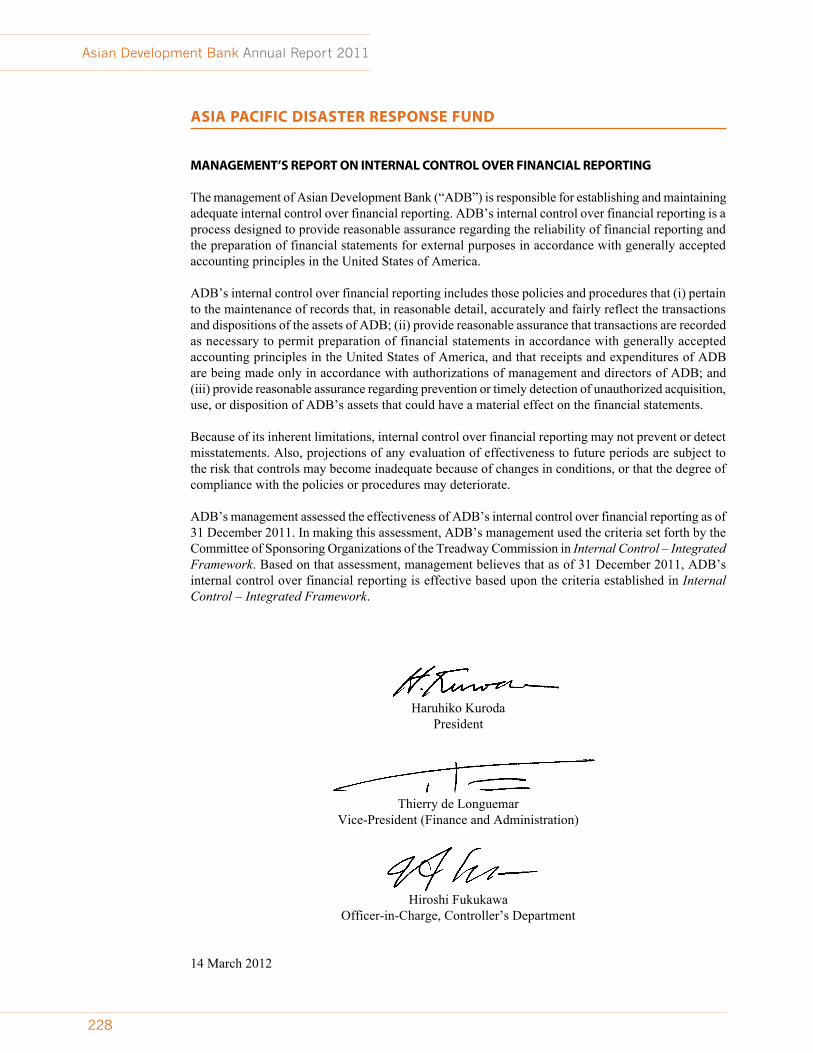
Asian Development Bank Annual Report 2011
228
asia paciFic disaster respOnse Fund
MANAGEMENT’S REPORT ON INTERNAL CONTROL OVER FINANCIAL REPORTING
The management of Asian Development Bank (“ADB”) is responsible for establishing and maintaining adequate internal control over financial reporting. ADB’s internal control over financial reporting is a process designed to provide reasonable assurance regarding the reliability of financial reporting and the preparation of financial statements for external purposes in accordance with generally accepted accounting principles in the United States of America.
ADB’s internal control over financial reporting includes those policies and procedures that (i) pertain to the maintenance of records that, in reasonable detail, accurately and fairly reflect the transactions and dispositions of the assets of ADB; (ii) provide reasonable assurance that transactions are recorded as necessary to permit preparation of financial statements in accordance with generally accepted accounting principles in the United States of America, and that receipts and expenditures of ADB are being made only in accordance with authorizations of management and directors of ADB; and (iii) provide reasonable assurance regarding prevention or timely detection of unauthorized acquisition, use, or disposition of ADB’s assets that could have a material effect on the financial statements.
Because of its inherent limitations, internal control over financial reporting may not prevent or detect misstatements. Also, projections of any evaluation of effectiveness to future periods are subject to the risk that controls may become inadequate because of changes in conditions, or that the degree of compliance with the policies or procedures may deteriorate.
ADB’s management assessed the effectiveness of ADB’s internal control over financial reporting as of 31 December 2011. In making this assessment, ADB’s management used the criteria set forth by the Committee of Sponsoring Organizations of the Treadway Commission in Internal Control – Integrated Framework. Based on that assessment, management believes that as of 31 December 2011, ADB’s internal control over financial reporting is effective based upon the criteria established in Internal Control – Integrated Framework.
Haruhiko KurodaPresident
Thierry de LonguemarVice-President (Finance and Administration)
Hiroshi FukukawaOfficer-in-Charge, Controller’s Department
14 March 2012

Asia Pacific Disaster Response Fund
229
Deloitte Touche LLPCertified Public AccountantsUnique Entity No. T08LL0721A6 Shenton Way #32-00DBS Building Tower TwoSingapore 068809
Tel: +65 6224 8288Fax: +65 6538 6166www.deloitte.com/sg
INDEPENDENT AUDITORS’ REPORT
To the Board of Directors and the Board of Governors of Asian Development Bank
We have audited management’s assertion, included in the accompanying Management’s Report on Internal Control over Financial Reporting, that Asian Development Bank (“ADB”) maintained effective internal control over financial reporting as of December 31, 2011, based on the criteria established in Internal Control — Integrated Framework issued by the Committee of Sponsoring Organizations of the Treadway Commission. ADB’s management is responsible for maintaining effective internal control over financial reporting and for its assertion of the effectiveness of internal control over financial reporting, included in the accompanying Management’s Report on Internal Control over Financial Reporting. Our responsibility is to express an opinion on management’s assertion based on our audit.
We conducted our audit in accordance with attestation standards established by the American Institute of Certified Public Accountants. Those standards require that we plan and perform the audit to obtain reasonable assurance about whether effective internal control over financial reporting was maintained in all material respects. Our audit included obtaining an understanding of internal control over financial reporting, assessing the risk that a material weakness exists, and testing and evaluating the design and operating effectiveness of internal control based on the assessed risk. Our audit also included performing such other procedures as we considered necessary in the circumstances. We believe that our audit provides a reasonable basis for our opinion.
ADB’s internal control over financial reporting is a process designed to provide reasonable assurance regarding the reliability of financial reporting and the preparation of financial statements for external purposes in accordance with accounting principles generally accepted in the United States of America. ADB’s internal control over financial reporting includes those policies and procedures that (1) pertain to the maintenance of records that, in reasonable detail, accurately and fairly reflect the transactions and dispositions of the assets of ADB; (2) provide reasonable assurance that transactions are recorded as necessary to permit preparation of financial statements in accordance with accounting principles generally accepted in the United States of America, and that receipts and expenditures of ADB are being made only in accordance with authorizations of management and directors of ADB; and (3) provide reasonable assurance regarding prevention or timely detection of unauthorized acquisition, use, or disposition of ADB’s assets that could have a material effect on the financial statements.
Deloitte Touche LLP (Unique Entity No. T08LL0721A) is an accounting limited liability partnership registered in Singaporeunder the Limited Liability Partnerships Act (Chapter 163A).

Asian Development Bank Annual Report 2011
230
Because of the inherent limitations of internal control over financial reporting, including the possibility of collusion or improper management override of controls, material misstatements due to error or fraud may not be prevented or detected and corrected on a timely basis. Also, projections of any evaluation of the effectiveness of the internal control over financial reporting to future periods are subject to the risk that the controls may become inadequate because of changes in conditions or that the degree of compliance with the policies or procedures may deteriorate.
In our opinion, management’s assertion that ADB maintained effective internal control over financial reporting as of December 31, 2011, is fairly stated, in all material respects, based on the criteria established in Internal Control — Integrated Framework issued by the Committee of Sponsoring Organizations of the Treadway Commission.
We have also audited, in accordance with auditing standards generally accepted in the United States of America, the accompanying statement of financial position of Asian Development Bank (“ADB”) – Asia Pacific Disaster Response Fund as of December 31, 2011 and 2010 and the related statements of activities and changes in net assets, and cash flows, for each of the years in the two-year period ended December 31, 2011 and our report dated March 14, 2012 expressed an unqualified opinion on those financial statements.
Public Accountants and Certified Public Accountants
SingaporeMarch 14, 2012

Asia Pacific Disaster Response Fund
231
Deloitte Touche LLPCertified Public AccountantsUnique Entity No. T08LL0721A6 Shenton Way #32-00DBS Building Tower TwoSingapore 068809
Tel: +65 6224 8288Fax: +65 6538 6166www.deloitte.com/sg
INDEPENDENT AUDITORS’ REPORT
To the Board of Directors and the Board of Governors of Asian Development Bank
We have audited the accompanying statement of financial position of Asian Development Bank (“ADB”) – Asia Pacific Disaster Response Fund as of December 31, 2011 and 2010 and the related statements of activities and changes in net assets, and cash flows, for each of the years in the two-year period ended December 31, 2011. These financial statements are the responsibility of ADB’s management. Our responsibility is to express an opinion on these financial statements based on our audits.
We conducted our audits in accordance with auditing standards generally accepted in the United States of America. Those standards require that we plan and perform the audit to obtain reasonable assurance about whether the financial statements are free of material misstatement. An audit includes examining, on a test basis, evidence supporting the amounts and disclosures in the financial statements, assessing the accounting principles used and significant estimates made by management, as well as evaluating the overall financial statement presentation. We believe that our audits provide a reasonable basis for our opinion.
In our opinion, such financial statements present fairly, in all material respects, the financial position of ADB – Asia Pacific Disaster Response Fund as of December 31, 2011 and 2010, and the results of its operations and its cash flows for each of the years in the two-year period ended December 31, 2011 in conformity with accounting principles generally accepted in the United States of America.
We have also audited, in accordance with attestation standards established by the American Institute of Certified Public Accountants, management’s assertion that ADB maintained effective internal control over financial reporting as of December 31, 2011, based on the criteria established in Internal Control — Integrated Framework issued by the Committee of Sponsoring Organizations of the Treadway Commission and our report dated March 14, 2012 expressed an unqualified opinion on management’s assertion that ADB maintained effective internal control over financial reporting.
Public Accountants and Certified Public Accountants
SingaporeMarch 14, 2012
Deloitte Touche LLP (Unique Entity No. T08LL0721A) is an accounting limited liability partnership registered in Singaporeunder the Limited Liability Partnerships Act (Chapter 163A).

Asian Development Bank Annual Report 2011
232
2011 2010
assEts
DUE FROM BANKS $ 4,349 $ 7,411
INVESTMENTS (Notes C and G)
Time deposits 11,162 20,128
ACCRUED REVENUE 0 2
ADVANCES FOR GRANTS 17,862 6,002
tOtaL $33,373 $33,543
LiaBiLitiEs anD UncOMMittED BaLancEs
ACCOUNTS PAYABLE AND OTHER LIABILITIES (Note D) $ 13 $ 63
UNDISBURSED COMMITMENTS (Notes E and G) 21,000 6,000
TOTAL LIABILITIES 21,013 6,063
UNCOMMITTED BALANCES (APDRF-2) (Note F), represented by: Unrestricted net assets 12,360 27,480
tOtaL $33,373 $33,543
0 = Less than $500.The accompanying notes are an integral part of these financial statements (APDRF-4).
apDRF-1
asian DEVELOpMEnt BanK—asia paciFic DisastER REspOnsE FUnD
STATEMENT OF FINANCIAL POSITION31 December 2011 and 2010 Expressed in thousands of United states Dollars

Asia Pacific Disaster Response Fund
233
2011 2010
changEs in UnREstRictED nEt assEts
REVENUE
From investments (Note C) $ 33 $ 66 From other sources 1 2
Total 34 68
EXPENSES
Grants (Note E) 15,000 5,499 Administrative expenses (Note D) 13 143 Financial expenses 0 0
Total 15,013 5,642
REVENUE LESS THAN EXPENSES (14,979) (5,574)
EXCHANGE (LOSSES) GAINS—net (141) 2
DECREASE IN NET ASSETS (15,120) (5,572)
NET ASSETS AT BEGINNING OF YEAR 27,480 33,052
nEt assEts at EnD OF yEaR $ 12,360 $27,480
0 = Less than $500.The accompanying notes are an integral part of these financial statements (APDRF-4).
apDRF-2
asian DEVELOpMEnt BanK—asia paciFic DisastER REspOnsE FUnD
STATEMENT OF ACTIVITIES AND CHANGES IN NET ASSETSFor the Years Ended 31 December 2011 and 2010 Expressed in thousands of United states Dollars

Asian Development Bank Annual Report 2011
234
2011 2010
CASH FLOWS FROM OPERATING ACTIVITIESInterest on investments received $ 34 $ 65 Cash received from other sources 1 2 Grants disbursed (12,000) (5,499)Administrative and financial expenses paid (63) (93)
Net Cash Used in Operating Activities (12,028) (5,525)
CASH FLOWS FROM INVESTING ACTIVITIESMaturities of investments 1,393,039 1,526,446 Purchases of investments (1,384,073) (1,517,011)
Net Cash Provided by Investing Activities 8,966 9,435
Net (Decrease) Increase in Due From Banks (3,062) 3,910
Due from Banks at Beginning of Year 7,411 3,501
Due from Banks at End of Year $ 4,349 $ 7,411
RECONCILIATION OF DECREASE IN NET ASSETS TO NET CASH USED IN OPERATING ACTIVITIES:
Decrease in net assets (APDRF-2) $ (15,120) $ (5,572)Adjustments to reconcile decrease in net assets to net cash used in operating activities:
Change in accrued revenue 1 (1)Change in advances for grants (12,000) 1,003 Change in miscellaneous liabilities (50) 56 Change in accrued expenses 0 (6)Change in undisbursed commitments 15,000 (1,000)Exchange losses (gains)—net 141 (5)
Net Cash Used in Operating Activities $ (12,028) $ (5,525)
0 = Less than $500.The accompanying notes are an integral part of these financial statements (APDRF-4).
apDRF-3
asian DEVELOpMEnt BanK—asia paciFic DisastER REspOnsE FUnD
STATEMENT OF CASH FLOWSFor the Years Ended 31 December 2011 and 2010 Expressed in thousands of United states Dollars

asian DEVELOpMEnt BanK—asia paciFic DisastER REspOnsE FUnD
NOTES TO FINANCIAL STATEMENTS31 December 2011 and 2010
Asia Pacific Disaster Response Fund
235
apDRF-4
NOTE A—NATURE OF OPERATIONS
The Asian Development Bank (ADB), a multilateral development financial institution, was established in 1966 with its headquarters in Manila, Philippines. ADB and its operations are governed by the Agreement Establishing the Asian Development Bank (the Charter). Its purpose is to foster economic development and co-operation in Asia and the Pacific region and to contribute to the acceleration of the process of economic development of the developing member countries (DMCs) in the region, collectively and individually. Since 1999, ADB’s corporate vision and mission has been to help DMCs reduce poverty in the region. This was reaffirmed under the long-term strategic framework for 2008–2020 (Strategy 2020). Under Strategy 2020, ADB’s corporate vision continues to be “An Asia and Pacific Free of Poverty” and its mission has been to help its DMCs reduce poverty and improve living conditions and quality of life. ADB has been pursuing its mission and vision by focusing on three complementary strategic agendas: inclusive growth, environmentally sustainable growth, and regional integration. ADB provides financial and technical assistance for projects and programs, which will contribute to achieving this purpose. These are financed through ordinary capital resources (OCR) and Special Funds.1
The APDRF was established on 1 April 2009, to provide, in a timely fashion, incremental grant resources to DMCs affected by a natural disaster. The APDRF will help bridge the gap between existing ADB arrangements that assist DMCs to reduce disaster risk through hazard mitigation loans and grants, and longer-term post-disaster reconstruction lending. The APDRF will provide quick-disbursing grants to assist DMCs in meeting immediate expenses to restore life-saving services to affected populations following a declared disaster and in augmenting aid provided by other donors in times of national crisis.
Financial assistance will be provided in the form of grants in an amount totaling up to $3,000,000 per event.
APDRF’s resources may consist of contributions from ADB and other bilateral, multilateral, and individual sources, including companies and foundations.
ADB is immune from taxation pursuant to Chapter VIII, Article 56, Exemption from Taxation, of the Charter.
NOTE B—SUMMARY OF SIGNIFICANT ACCOUNTING POLICIES
Presentation of the Financial Statements
The financial statements of the APDRF are prepared in accordance with accounting principles generally accepted in the United States of America (US GAAP), and are presented on the basis of those for not-for-profit organizations.
APDRF reports donors’ contributions of cash and other assets as unrestricted assets as these are made available to APDRF without conditions other than for the purpose of pursuing its objectives.
1 Asian Development Fund (ADF), Technical Assistance Special Fund (TASF), Japan Special Fund (JSF), ADB Institute (ADBI), Asian Tsunami Fund (ATF), Pakistan Earthquake Fund (PEF), Regional Cooperation and Integration Fund (RCIF), Climate Change Fund (CCF), and Asia Pacific Disaster Response Fund (APDRF).

asian DEVELOpMEnt BanK—asia paciFic DisastER REspOnsE FUnD
NOTES TO FINANCIAL STATEMENTS31 December 2011 and 2010
Asian Development Bank Annual Report 2011
236
Functional and Reporting Currency
The United States dollar is the functional and reporting currency, representing the currency of the primary economic operating environment of APDRF.
Translation of Currencies
ADB adopts the use of daily exchange rates for accounting and financial reporting purposes. This allows transactions denominated in non-US dollar to be translated to the reporting currency using exchange rates applicable at the time of transactions. Contributions included in the financial statements during the year are recognized at applicable exchange rates as of the respective dates of commitment. At the end of each accounting month, translations of assets, liabilities, and uncommitted balances which are denominated in non-US dollar are adjusted using the applicable rates of exchange at the end of the reporting period. These translation adjustments are accounted for as exchange gains or losses and are credited or charged to operations.
Investments
All investment securities held by APDRF are reported at fair value. Realized and unrealized gains and losses are included in revenue. Time deposits are reported at cost which is a reasonable estimate of fair value.
Interest income on investment securities and time deposits are recognized as realized and reported, net of amortizations of premiums and discounts.
Contributions
The contributions from donors and the allocations from net income of OCR are included in the financial statements, from the date of effectivity of the contributions agreement, and the Board of Governors’ approval, respectively.
Technical Assistance, Grants, and Undisbursed Commitments
Technical assistance (TA) and grants are recognized in the financial statements when the project is approved and becomes effective. Upon completion of the TA project or cancellation of a grant, any undisbursed amount is written back as a reduction in TA or grants for the year and the corresponding undisbursed commitment is eliminated accordingly.
Advances are provided from TA and grants to the executing agency or co-operating institution, for the purpose of making payments for eligible expenses. The advances are subject to liquidation and charged against undisbursed commitment. Any unutilized portion is required to be returned to the fund.
Accounting Estimates
The preparation of financial statements in conformity with generally accepted accounting principles requires management to make reasonable estimates and assumptions that affect the reported amounts

apDRF-4
cOntinUED
Asia Pacific Disaster Response Fund
237
of assets and liabilities and uncommitted balances as of the end of the year and the reported amounts of revenue and expenses during the year. The actual results could differ from those estimates.
Accounting and Reporting Developments
Accounting Standards Update (ASU) 2010-06, “Fair Value Measurements and Disclosures (Topic 820) – Improving Disclosures about Fair Value Measurements” with respect to the separate disclosures about gross purchases, sales, issuances, and settlements relating to Level 3 measurements is effective for fiscal years beginning after 15 December 2010 and for interim periods within those fiscal years. This update did not have a material impact on APDRF’s financial statements.
In May 2011, the Financial Accounting Standards Board issued ASU 2011-04, “Fair Value Measurement (Topic 820) – Amendments to Achieve Common Fair Value Measurement and Disclosure Requirements in US GAAP and IFRSs,” which provides the consistency between US GAAP and International Financial Reporting Standards (IFRSs) on the definition of fair value (FV) and on the guidance on how to measure FV and on what to disclose about FV measurements. The amendments to the update do not require additional FV measurements and are not intended to establish valuation standards or affect valuation practices outside of financial reporting. The new guidance will require prospective application and are effective for interim and annual periods beginning on or after 15 December 2011. ADB is currently assessing the impact of this update on APDRF’s financial statements.
Statement of Cash Flows
For the purposes of the Statement of Cash Flows, APDRF considers that its cash and cash equivalents are limited to “DUE FROM BANKS,” which consists of cash on hand and current accounts in banks used for operational disbursements.
NOTE C—INVESTMENTS
The main investment management objective is to maintain security and liquidity. Subject to these parameters, ADB seeks the highest possible return on its investments. Investments are governed by the Investment Authority approved by the Board of Directors in 2006.
All investments held as of 31 December 2011 and 2010 were in time deposits.The annualized rate of return on the average investments held during the period ended
31 December 2011, based on the portfolio held at the beginning and end of each month, was 0.18% (0.26% – 2010).
NOTE D—RELATED PARTY TRANSACTIONS
The OCR and special funds resources are at all times used, committed, and invested entirely separate from each other. The administrative and operational expenses pertaining to APDRF are settled regularly with OCR and the other funds. Regional technical assistance projects and programs may

asian DEVELOpMEnt BanK—asia paciFic DisastER REspOnsE FUnD
NOTES TO FINANCIAL STATEMENTS31 December 2011 and 2010
Asian Development Bank Annual Report 2011
238
be combined activities financed by special and trust funds. ADB charges a service fee to cover ADB’s cost for the administration, management, supervision and operation of the APDRF. The service fee is currently 2% of the amount disbursed for investment projects. As of 31 December 2011, $7,000 ($56,000 – 2010) was payable to OCR which is included in “ACCOUNTS PAYABLE AND OTHER LIABILITIES.”
NOTE E—UNDISBURSED COMMITMENTS
Undisbursed commitments are denominated in United States dollars and represent grants not yet disbursed and unliquidated. The fair value of undisbursed commitments approximates the amounts outstanding, because ADB expects that disbursements will substantially be made for all the projects/programs covered by the commitments.
NOTE F—CONTRIBUTIONS AND UNCOMMITTED BALANCES
No contributions were received during 2011 and 2010.Uncommitted balances comprise amounts which have not been committed by ADB as of
31 December 2011 and 2010.
NOTE G—FAIR VALUE MEASUREMENTS
ASC 820 defines fair value as the price that would be received to sell an asset or paid to transfer a liability at measurement date (exit price) in an orderly transaction among willing participants with an assumption that the transaction takes place in the entity’s principal market, the most advantageous market for the asset or liability. The most advantageous market is where the sale of the asset or transfer of liability would maximize the amount received for the asset or minimize the amount paid to transfer the liability. The fair value measurement is not adjusted for transaction cost.
ASC 820 also establishes a fair value hierarchy that gives the highest priority to quoted prices in active markets for identical assets or liabilities (Level 1), next priority to observable market inputs or market corroborated data (Level 2), and the lowest priority to unobservable inputs without market corroborated data (Level 3). ASC 820 requires the fair value measurement to maximize the use of market observable inputs.
The following guidelines are applied in determining the fair values of financial instruments:
Investments
Readily marketable investments are fair valued using active market quotes in Level 1 category. Level 2 category includes investments which are fair valued with significant market observable inputs.

apDRF-4
cOntinUED
Asia Pacific Disaster Response Fund
239
The fair value of the following financial assets of APDRF as of 31 December 2011 and 2010 were reported based on the following:
Fair Value Measurements
31 December 2011
Quoted prices in active Markets
for identical assets (Level 1)
significant Market Observable
inputs (Level 2)
significant Unobservable
inputs (Level 3)
assets
Investments
Time deposits $11,162,000 $ – $11,162,000 $ –
Fair Value Measurements
31 December 2010
Quoted prices in active Markets
for identical assets (Level 1)
significant Market Observable
inputs (Level 2)
significant Unobservable
inputs (Level 3)
assets
Investments
Time deposits $20,128,000 $ – $20,128,000 $ –
See Notes C and E for discussions relating to investments and undisbursed commitments, respectively. In all other cases, the carrying amount of APDRF’s assets, liabilities and uncommitted balances are considered to approximate fair values for all significant financial instruments.
NOTE H—SUBSEQUENT EVENTS
ADB has evaluated subsequent events after 31 December 2011 through 14 March 2012, the date these Financial Statements are available for issuance. As a result of this evaluation, there are no subsequent events, as defined, that require recognition or disclosure in the APDRF’s Financial Statements as of 31 December 2011.

Statistical Annexes
1 approvals by country 2 Loan approvals by sector 3a sectoral Distribution of Loans 3b sectoral Distribution of grants 4a projects involving Official cofinancing 4b projects involving commercial cofinancing 5a Loan Disbursements 5b grant Disbursements 6a policy-Based Loan Disbursements 6b policy-Based grant Disbursements 6c trends in policy-Based Lending and aDF grant 7 nonsovereign approvals and total project costs
by country 8 nonsovereign approvals and total project costs
by sector 9 nonsovereign approvals by year 10 nonsovereign approvals by country 11 number of Loans/grants Under administration,
and closed in 2011 12 amount of Loans Made Effective,
contracts awarded, and Disbursements 13 amount of grants Made Effective,
contracts awarded, and Disbursements 14 number of projects Under administration,
projects at Risk, completed, and pcRs/xaRRs/ppERs circulated
15 technical assistance grant approvals by country and Regional activities
16 technical assistance grant approvals 17 technical assistance grants by sector 18 net transfer of Resources (Ordinary capital
Resources, asian Development Fund, and Other special Funds grants) 2009–2011
19 net transfer of Resources (Ordinary capital Resources, asian Development Fund, and Other special Funds grants)
20 asian Development Fund Resources and commitment authority
21 technical assistance special Fund 22 Japan special Fund—Regular and supplementary
contributions 23 Japan special Fund—asian currency crisis
support Facility 24 projects with aDB-administered grant cofinancing 25a contracts awarded by country of Origin,
project Loans—Ordinary capital Resources 25b contracts awarded by nationality of contractor,
project Loans—Ordinary capital Resources 26a contracts awarded by country of Origin,
project Loans—asian Development Fund 26b contracts awarded by nationality of contractor,
project Loans—asian Development Fund 27a contracts awarded by country of Origin,
project Loans—Ordinary capital Resources and asian Development Fund combined
27b contracts awarded by nationality of contractor, project Loans—Ordinary capital Resources and asian Development Fund combined
28a Estimates of payment to supplying countries for Foreign procurement Under program Lending (by country of Origin)
28b Estimates of payment to supplying countries for Foreign procurement Under program Lending (by nationality of contractor)
29 cumulative contracts awarded/by country of Origin (technical assistance Operations)
30 contracts awarded by nationality of consultant, 2009–2011 (technical assistance Operations)
31 contracts awarded by nationality of consultant, 2009–2011 (grant Operations—aDB-administered consulting services)
32 contracts awarded by nationality of contractors, 2009–2011 (grant Operations—Executing agency-administered goods, works, and consulting services)

Statistical Annex 1 APPROVALS BY COUNTRY,a 2011
($ million)
aDB special Funds
OcR aDFOther
special Funds cofinancing
country Loans guaranteesEquity
investments Loans grants tasF grants ta grants project ta total
central and west asia 2,897.24 266.61 – 601.64 397.00 11.51 3.00 – 1,976.95 5.08 6,159.02Afghanistan – – – – 232.00 1.50 – – 65.40 1.50 300.40Armenia 65.00 – – 48.64 – 0.70 – – – – 114.34Azerbaijan 500.00 – – – – – – – 143.58 – 643.58Georgia 140.00 – – 120.00 – – – – – 0.60 260.60Kazakhstan 207.00 – – – – 0.57 – – – – 207.57Kyrgyz Republic – – – 55.00 – 0.45 – – – – 55.45Pakistan 940.24 66.61 – 320.00 – 4.00 3.00 – 1,552.20 – 2,886.05Tajikistan – – – – 165.00 1.05 – – – 1.25 167.30Turkmenistan 125.00 – – – – – – – – – 125.00Uzbekistan 920.00 200.00 – 58.00 – 3.25 – – 215.77 1.73 1,398.74
south asia 3,552.24 150.00 20.00 706.17 116.00 19.92 4.30 0.10 1,862.07 29.63 6,460.44Bangladesh 480.00 – – 450.00 – 5.75 1.30 – 1,351.82 3.61 2,292.48Bhutan – – – 19.87 – 1.20 – – 5.00 1.50 27.57India 2,872.94 150.00 20.00 – – 6.45 – 0.10 65.00 12.25 3,126.73Maldives – – – – – 1.13 – – – – 1.13Nepal – – – 154.00 116.00 3.16 – – 337.29 10.43 620.88Sri Lanka 199.30 – – 82.30 – 2.24 3.00 – 102.96 1.85 391.65
East asia 1,439.84 – 25.00 65.00 – 18.78 – 1.35 130.49 8.00 1,688.46China, People’s Republic of 1,439.84 – 25.00 – – 18.76 – 1.35 105.10 2.80 1,592.85Mongolia – – – 65.00 – 0.01 – – 25.39 5.20 95.60
pacific 169.70 – 9.00 108.32 43.76 7.68 0.80 – 133.53 5.73 478.51Cook Islands 4.70 – – – – 0.50 0.80 – – – 6.00Fiji – – – – – – – – – – – Kiribati – – – 7.56 – 0.80 – – 13.95 1.63 23.94Marshall Islands – – – – – 0.30 – – – – 0.30Micronesia, Federated States of – – – – – – – – – 0.70 0.70Nauru – – – – – 0.20 – – – – 0.20Palau – – – – – – – – – – – Papua New Guinea 165.00 – 9.00 74.12 – 2.00 – – 49.00 1.40 300.52Samoa – – – 10.82 – – – – – – 10.82Solomon Islands – – – – 5.00 1.28 – – 4.04 – 10.32Timor-Leste – – – – 23.00 1.43 – – – – 24.43Tonga – – – – 15.76 0.68 – – 22.94 0.50 39.88Tuvalu – – – – – – – – – – – Vanuatu – – – 15.82 – 0.50 – – 43.60 1.50 61.42
southeast asia 2,591.59 – – 473.72 40.00 22.88 9.00 – 3,375.19 74.73 6,587.10Brunei Darussalam – – – – – – – – – – – Cambodia – – – 67.00 – 4.38 3.00 – 18.90 9.10 102.38Indonesia 580.00 – – – – 0.23 – – 219.79 9.33 809.34Lao People’s Democratic Republic 448.20 – – 41.92 40.00 2.26 – – – 5.30 537.68Malaysia – – – – – 1.00 – – – – 1.00Myanmar – – – – – – – – – – – Philippines 362.00 – – – – 4.88 3.00 – 56.70 14.70 441.28Thailand 170.00 – – – – 1.55 3.00 – 914.77 1.50 1,090.82Viet Nam 1,031.39 – – 364.80 – 8.60 – – 2,165.03 34.80 3,604.62
Regional – – 185.00 – – 59.52 – 6.30 5.00 88.20 344.02
tOtaL 10,650.61 416.61 239.00 1,954.85 596.76 140.28 17.10 7.75 7,483.23 211.36 21,717.55
– = nil, ADF = Asian Development Fund, OCR = ordinary capital resources, TA = technical assistance, TASF = Technical Assistance Special Fund.a Including cofinancing.
Statistical Annexes
241

Statistical Annex 2 LOAN APPROVALS BY SECTOR, 2011
$ Million Date approvedOcR aDF total
agRicULtURE anD natURaL REsOURcEs
BAN Second Chittagong Hill Tracts Rural Development – 55.0 55.0 14 Jul
IND Agribusiness Infrastructure Development Investment Program – Tranche 2 24.3 – 24.3 19 Dec
LAO Nam Ngum River Basin Development Sector (Additional Financing) – 5.0 5.0 26 Sep
LAO Smallholder Development (Additional Financing) – 5.0 5.0 22 Nov
NEP Decentralized Rural Infrastructure and Livelihood (Additional Financing) – 18.0 18.0 31 Oct
PAK Punjab Irrigated Agriculture Investment Program – Tranche 2 – 270.0 270.0 22 Dec
PRC Qinghai Rural Water Resources Management 60.0 – 60.0 17 Mar
PRC Forestry and Ecological Restoration in Three Northwest Provinces 100.0 – 100.0 29 Mar
PRC Hai River Estuary Area Pollution Control and Ecosystem Rehabilitation 100.0 – 100.0 13 Dec
PRC Jiangsu Yancheng Wetlands Protection 36.9 – 36.9 16 Dec
VIE Phuoc Hoa Water Resources (Supplementary) – 60.0 60.0 31 Mar
VIE Development of the Northern Chu and Southern Ma Rivers Irrigation System – 110.0 110.0 12 Dec
Subtotal 321.2 523.0 844.2
EDUcatiOn
BAN Third Primary Education Development – 320.0 320.0 5 Jul
LAO Secondary Education Sector Development Program – 10.0 10.0 20 Sep
MON Higher Education Reform – 20.0 20.0 28 Jul
VIE University of Science and Technology of Hanoi Development (New Model University) 170.0 20.0 190.0 25 Apr
Subtotal 170.0 370.0 540.0
EnERgy
BAN Power System Efficiency Improvement 300.0 – 300.0 11 Aug
BAN Industrial Energy Efficiency Program (Bangladesh Energy Efficiency Facility) 30.0 – 30.0 14 Dec
IND Madhya Pradesh Energy Efficiency Improvement Investment Program – Tranche 1 200.0 – 200.0 15 Jul
IND Gujarat Solar Power Transmission 100.0 – 100.0 12 Sep
IND National Grid Improvement 750.0 – 750.0 30 Sep
IND Himachal Pradesh Clean Energy Transmission Investment Program – Tranche 1 113.0 – 113.0 18 Oct
IND Dahanu Solar Power 48.0 – 48.0 2 Nov
IND Assam Power Sector Enhancement Investment Program – Tranche 3 50.0 – 50.0 4 Nov
IND National Power Grid Development Investment Program – Tranche 3 76.0 – 76.0 7 Dec
IND Madhya Pradesh Energy Efficiency Improvement Investment Program – Tranche 2 200.0 – 200.0 14 Dec
LAO Greater Mekong Subregion Nam Ngum 3 Hydropower 98.2 16.9 115.1 3 Nov
LAO Nam Ngum 3 Hydropower 350.0 – 350.0 3 Nov
NEP Electricity Transmission Expansion and Supply Improvement – 56.0 56.0 15 Nov
PAK Patrind Hydropower 97.0 – 97.0 11 Oct
PAK Power Transmission Enhancement Investment Program – Tranche 3 243.2 – 243.2 22 Dec
– = nil, ADF = Asian Development Fund, BAN = Bangladesh, IND = India, LAO = Lao People’s Democratic Republic, MON = Mongolia, NEP = Nepal, OCR = ordinary capital resources, PAK = Pakistan, PRC = People’s Republic of China, VIE = Viet Nam.
Asian Development Bank Annual Report 2011
242

$ Million Date approvedOcR aDF total
PRC Shandong Energy Efficiency and Emission Reduction 100.0 – 100.0 18 Aug
PRC Guangdong Energy Efficiency and Environment Improvement Investment Program – Tranche 3 42.9 – 42.9 5 Sep
PRC Hebei Energy Efficiency Improvement and Emission Reduction 100.0 – 100.0 14 Dec
SRI Sustainable Power Sector Support 110.0 10.0 120.0 27 Jan
THA Nong Saeng Natural Gas Power 170.0 – 170.0 7 Jul
UZB Kandym Gas Field Development 100.0 – 100.0 1 Sep
UZB Advanced Electricity Metering 150.0 – 150.0 19 Sep
VIE O Mon IV Combined Cycle Power Plant 309.9 – 309.9 24 Nov
VIE Power Transmission Investment Program – Tranche 1 120.5 – 120.5 29 Dec
Subtotal 3,858.8 82.9 3,941.7
FinancE
ARM Small and Medium-Sized Enterprise Finance Program (ACBA Credit Agricole Bank) 20.0 – 20.0 22 Nov
ARM Small and Medium-Sized Enterprise Finance Program (Ameriabank) 20.0 – 20.0 22 Nov
ARM Small and Medium-Sized Enterprise Finance Program (Ardshininvestbank) 15.0 – 15.0 22 Nov
ARM Small and Medium-Sized Enterprise Finance Program (Inecobank) 10.0 – 10.0 22 Nov
CAM Third Financial Sector Program – Subprogram 1 – 15.0 15.0 29 Nov
INO Indonesia Eximbank 100.0 – 100.0 25 Mar
Subtotal 165.0 15 0 180.0
hEaLth anD sOciaL pROtEctiOn
PNG Rural Primary Health Services Delivery – 20.0 20.0 30 Sep
Subtotal – 20.0 20.0
pUBLic sEctOR ManagEMEnt
INO Second Local Government Finance and Governance Reform Program – Subprogram 2 200.0 – 200.0 4 Oct
LAO Second Private Sector and Small and Medium-Sized Enterprises Development Program – Subprogram 1 – 5.0 5.0 4 Oct
PHI Governance in Justice Sector Reform Program – Subprogram 2 300.0 – 300.0 16 Dec
VIE Support for the Implementation of the Poverty Reduction Program V – Subprogram 3 – 24.8 24.8 9 Dec
Subtotal 500.0 29.8 529.8
tRanspORt anD ict
ARM Sustainable Urban Development Investment Program – Tranche 1 – 48.6 48.6 9 May
AZE Road Network Development Program – Tranche 3 200.0 – 200.0 14 Dec
BAN Railway Sector Investment Program – Tranche 2 150.0 – 150.0 22 Dec
CAM Provincial Roads Improvement – 52.0 52.0 16 Dec
COO Avatiu Port Development (Supplementary) 4.7 – 4.7 24 Mar
GEO Road Corridor Investment Program – Tranche 3 (Additional Financing) 140.0 – 140.0 22 Dec
CONTINUED
– = nil, ADF = Asian Development Fund, ARM = Armenia, AZE = Azerbaijan, BAN = Bangladesh, CAM = Cambodia, COO = Cook Islands, GEO = Georgia, ICT = information and communication technology, INO = Indonesia, LAO = Lao People’s Democratic Republic, OCR = ordinary capital resources, PHI = Philippines, PNG = Papua New Guinea, PRC = People’s Republic of China, SRI = Sri Lanka, THA = Thailand, UZB = Uzbekistan, VIE = Viet Nam.
Statistical Annexes
243

$ Million Date approvedOcR aDF total
IND Madhya Pradesh State Roads III 300.0 – 300.0 10 Mar
IND Bangalore Metro Rail Transit System 250.0 – 250.0 31 Mar
IND North Eastern State Roads Investment Program – Tranche 1 74.8 – 74.8 22 Aug
IND Railway Sector Investment Program – Tranche 1 150.0 – 150.0 18 Oct
INO Regional Roads Development 180.0 – 180.0 24 Nov
KAZ CAREC Transport Corridor I (Zhambyl Oblast Section) [Western Europe–Western People’s Republic of China International Transit Corridor] Investment Program – Tranche 4 112.0 – 112.0 21 Feb
KAZ CAREC Corridor 1 (Taraz Bypass) 95.0 – 95.0 7 Dec
KGZ CAREC Corridor 1 (Bishkek–Torugart Road) Project 3 – 55.0 55.0 7 Jun
MON Western Regional Road Corridor Investment Program – Tranche 1 – 45.0 45.0 22 Dec
PHI Road Improvement and Institutional Development 62.0 – 62.0 15 Dec
PNG Bemobile Expansion 40.0 – 40.0 25 Mar
PNG Bridge Replacement for Improved Rural Access Sector 40.0 50.0 90.0 28 Sep
PNG Lae Port Development (Additional Financing) 85.0 4.1 89.1 10 Nov
PRC Railway Energy Efficiency and Safety Enhancement Investment Program – Tranche 3 250.0 – 250.0 20 Jul
PRC Xi’an Urban Road Network Improvement 150.0 – 150.0 8 Nov
SRI National Highways Sector (Additional Financing) 85.0 – 85.0 5 Aug
TKM North–South Railway 125.0 – 125.0 15 Mar
UZB CAREC Corridor 2 Road Investment Program – Tranche 2 240.0 – 240.0 31 Mar
UZB Second CAREC Corridor 2 Road Investment Program – Tranche 1 130.0 – 130.0 2 Sep
UZB CAREC Corridor 6 (Marakand–Karshi) Railway Electrification 100.0 – 100.0 28 Sep
VAN Interisland Shipping Support – 10.8 10.8 30 Nov
VIE Ha Noi Metro Rail System (Line 3: Nhon–Ha Noi Station Section) 293.0 – 293.0 29 Mar
VIE Transport Connections in Northern Mountainous Provinces – 80.0 80.0 30 Sep
Subtotal 3,256.5 345.6 3,602.1
watER sUppLy anD OthER MUnicipaL inFRastRUctURE anD sERVicEs
AZE Water Supply and Sanitation Investment Program – Tranche 2 300.0 – 300.0 22 Dec
BAN Khulna Water Supply – 75.0 75.0 14 Jun
GEO Urban Services Improvement Investment Program – Tranche 1 – 80.0 80.0 12 Apr
GEO Urban Services Improvement Investment Program – Tranche 2 – 40.0 40.0 23 Nov
IND Uttarakhand Urban Sector Development Investment Program – Tranche 2 100.0 – 100.0 3 Nov
IND Infrastructure Development Investment Program for Tourism – Tranche 2 43.8 – 43.8 15 Dec
IND North Eastern Region Capital Cities Development Investment Program – Tranche 2 72.0 – 72.0 16 Dec
KIR South Tarawa Sanitation Improvement Sector – 7.6 7.6 17 Oct
NEP Kathmandu Valley Water Supply Improvement – 80.0 80.0 16 Sep
PRC Municipal Water Distribution Infrastructure Development 100.0 – 100.0 25 Apr
– = nil, ADF = Asian Development Fund, AZE = Azerbaijan, BAN = Bangladesh, CAREC = Central Asia Regional Economic Cooperation, GEO = Georgia, IND = India, INO = Indonesia, KAZ = Kazakhstan, KGZ = Kyrgyz Republic, KIR = Kiribati, MON = Mongolia, NEP = Nepal, OCR = ordinary capital resources, PHI = Philippines, PNG = Papua New Guinea, PRC = People’s Republic of China, SRI = Sri Lanka, TKM = Turkmenistan, UZB = Uzbekistan, VAN = Vanuatu, VIE = Viet Nam.
CONTINUED
Asian Development Bank Annual Report 2011
244
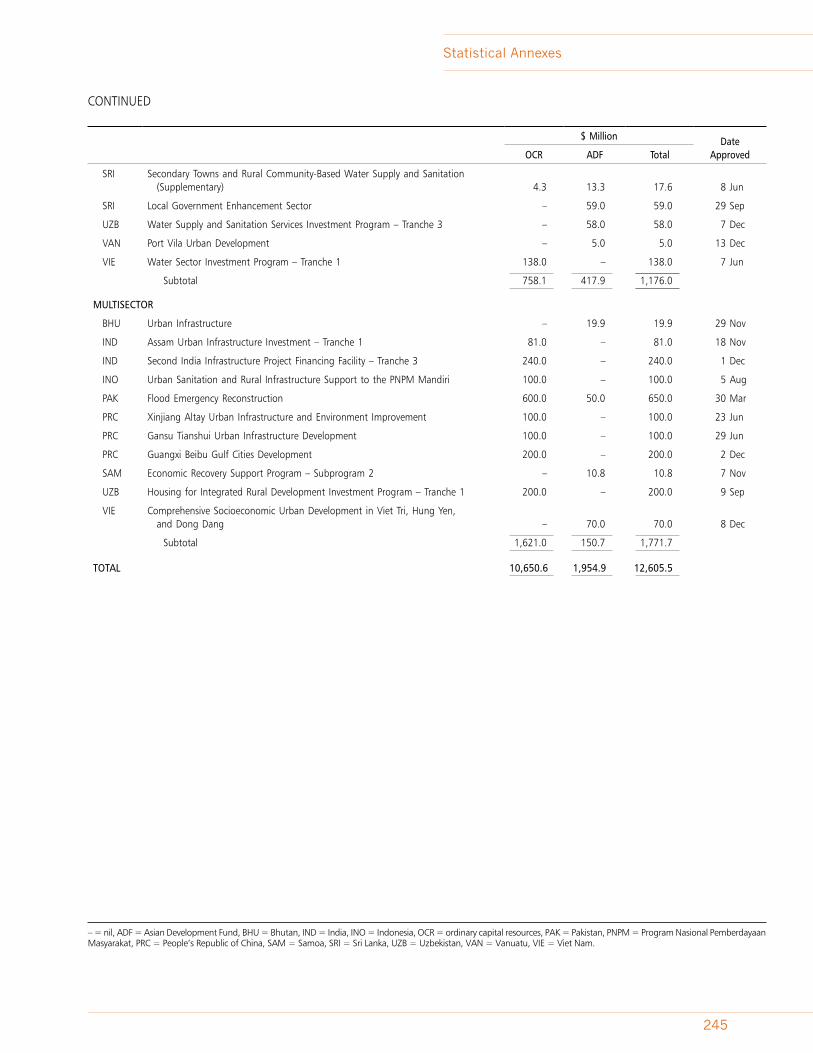
– = nil, ADF = Asian Development Fund, BHU = Bhutan, IND = India, INO = Indonesia, OCR = ordinary capital resources, PAK = Pakistan, PNPM = Program Nasional Pemberdayaan Masyarakat, PRC = People’s Republic of China, SAM = Samoa, SRI = Sri Lanka, UZB = Uzbekistan, VAN = Vanuatu, VIE = Viet Nam.
$ Million Date approvedOcR aDF total
SRI Secondary Towns and Rural Community-Based Water Supply and Sanitation (Supplementary) 4.3 13.3 17.6 8 Jun
SRI Local Government Enhancement Sector – 59.0 59.0 29 Sep
UZB Water Supply and Sanitation Services Investment Program – Tranche 3 – 58.0 58.0 7 Dec
VAN Port Vila Urban Development – 5.0 5.0 13 Dec
VIE Water Sector Investment Program – Tranche 1 138.0 – 138.0 7 Jun
Subtotal 758.1 417.9 1,176.0
MULtisEctOR
BHU Urban Infrastructure – 19.9 19.9 29 Nov
IND Assam Urban Infrastructure Investment – Tranche 1 81.0 – 81.0 18 Nov
IND Second India Infrastructure Project Financing Facility – Tranche 3 240.0 – 240.0 1 Dec
INO Urban Sanitation and Rural Infrastructure Support to the PNPM Mandiri 100.0 – 100.0 5 Aug
PAK Flood Emergency Reconstruction 600.0 50.0 650.0 30 Mar
PRC Xinjiang Altay Urban Infrastructure and Environment Improvement 100.0 – 100.0 23 Jun
PRC Gansu Tianshui Urban Infrastructure Development 100.0 – 100.0 29 Jun
PRC Guangxi Beibu Gulf Cities Development 200.0 – 200.0 2 Dec
SAM Economic Recovery Support Program – Subprogram 2 – 10.8 10.8 7 Nov
UZB Housing for Integrated Rural Development Investment Program – Tranche 1 200.0 – 200.0 9 Sep
VIE Comprehensive Socioeconomic Urban Development in Viet Tri, Hung Yen, and Dong Dang – 70.0 70.0 8 Dec
Subtotal 1,621.0 150.7 1,771.7
tOtaL 10,650.6 1,954.9 12,605.5
CONTINUED
Statistical Annexes
245

Statistical Annex 3a SECTORAL DISTRIBUTION OF LOANS,a 2011, 1967–2011
2011 Loans
OcR aDF total cumulative as of 2011
sectorno. of Loans $ Million
no. of Loans $ Million
no. of projectsb $ Million
no. of projectsb $ Million %
Agriculture and Natural Resources 5 321.2 7 523.0 12 844.2 531 20,468.4 11Education 1 170.0 4 370.0 4 540.0 150 6,718.8 4Energy 24 3,858.8 3 82.9 24 3,941.7 381 36,899.1 21Finance 5 165.0 1 15.0 3 180.0 271 20,517.7 11Health and Social Protection – – 1 20.0 1 20.0 69 3,852.9 2Industry and Trade – – – – – – 107 4,588.0 3Public Sector Management 2 500.0 2 29.8 4 529.8 88 14,510.1 8Transport and ICT 23 3,256.5 8 345.6 29 3,602.1 440 44,725.3 25Water Supply and Other Municipal
Infrastructure and Services 7 758.1 9 417.9 15 1,176.0 259 15,236.8 8Multisector 8 1,621.0 4 150.7 12 1,771.7 127 12,186.5 7
tOtaLc 75 10,650.6 39 1,954.9 104 12,605.5 2,423 179,703.7 100
– = nil, ADF = Asian Development Fund, ICT = information and communication technology, OCR = ordinary capital resources.a Includes nonsovereign loans. Excludes cofinancing.b A project with multiple loans is counted as one project.c Totals may not add up due to rounding.
Statistical Annex 3b SECTORAL DISTRIBUTION OF GRANTS,a 2011, 1967–2011
2011 grants
aDFOther
special Funds Other
sources total cumulative as of 2011
sectorno. of grants $ Million
no. of grants $ Million
no. of grants $ Million
no. of projectsb $ Million
no. of projectsb $ Million %
Agriculture and Natural Resources 2 27.0 2 6.0 2 7.1 6 40.1 100 966.2 14Education 3 107.0 – – – – 3 107.0 46 939.1 13Energy 2 62.0 1 1.3 5 62.4 7 125.7 40 776.3 11Finance – 5.0 – – 1 2.0 2 7.0 22 125.5 2Health and Social Protection – – 1 3.0 3 42.2 4 45.2 58 390.2 6Industry and Trade – – – – 1 1.9 1 1.9 9 35.0 0.5Public Sector Management 3 60.0 – – – – 3 60.0 24 379.1 5Transport and ICT 3 318.7 1 0.8 4 56.6 8 376.1 57 1,921.7 27Water Supply and Other Municipal
Infrastructure and Services 2 17.1 – – 5 53.4 7 70.5 38 359.6 5Multisector – – 2 6.0 2 4.7 4 10.7 49 1,194.5 17
tOtaLc 16 596.8 7 17.1 23 230.3 45 844.1 443 7,087.1 100
– = nil, ADF = Asian Development Fund, ICT = information and communication technology.a Refers to grant-financed projects, and includes contractual cofinancing. Excludes cofinancing not administered by ADB.b A project with multiple grants is counted as one project.c Totals may not add due to rounding.
Asian Development Bank Annual Report 2011
246

Statistical Annex 4a PROJECTS INVOLVING OFFICIAL COFINANCING,a 2011 ($ million)
project name aDB
Official cofinancing
source of cofinancinggrants Loans
cEntRaL anD wEst asia 232.00 65.40 –DVA cofinancingb 65.40 –
Non-DVA cofinancingc – –
afghanistanEnergy Sector Development Investment Program –
Tranche 3 43.00 12.40 Denmark20.00 United Kingdom
Transport Network Development Investment Program – Tranche 1 189.00 33.00 Afghanistan Infrastructure Trust Fund
East asia 100.00 5.10 –DVA cofinancing 5.10 –
Non-DVA cofinancing – –
china, people’s Republic of Forestry and Ecological Restoration in Three
Northwest Provinces 100.00 5.10 Global Environment Facility
paciFic 59.14 126.73 9.00DVA cofinancing 124.53 9.00
Non-DVA cofinancing 2.20 –
KiribatiSouth Tarawa Sanitation Improvement Sector 7.56 13.95 Australia
papua new guineaRural Primary Health Services Delivery 20.00 40.00 Australia
1.20c Japan International Cooperation Agency (JICA)9.00 OPEC Fund for International Development (OFID)
1.00c World Health Organization
solomon islandsSecond Road Improvement (Sector) (Supplementary) 4.04 Australia
tongaNuku’alofa Urban Sector Development 6.06 6.44 AustraliaTonga–Fiji Submarine Cable 9.70 16.50 World Bank
VanuatuInterisland Shipping Support 10.82 12.60 New ZealandPort Vila Urban Development 5.00 31.00 Australia
sOUth asia 1,131.30 762.77 712.00DVA cofinancing 762.77 712.00
Non-DVA cofinancing – –
BangladeshCity Region Developmentd 120.00 14.86 GermanyInstitutional Support for Migrant Workers’ Remittance 2.00 Japan Fund for Poverty Reduction (JFPR)Khulna Water Supply 75.00 184.00 JICAThird Primary Education Development 320.00 35.00 Australia
65.00 Canada70.00 European Union30.00 JICA45.00 Sweden
190.00 United Kingdom0.50 United Nations Children’s Fund (UNICEF)
300.00 World Bank
– = nil, DVA = direct value-added, OPEC = Organization of the Petroleum Exporting Countries.a List excludes technical assistance projects. See Statistical Annex 24 for technical assistance projects with cofinancing.b DVA cofinancing: cofinancing with contractual or collaborative arrangements between ADB and financing partners.c Non-DVA cofinancing: cofinancing does not involve direct ADB support or collaborative arrangements. It is recorded for overall statistical purposes only.d Anchor project was approved in prior year(s) with cofinancing arranged this year.
Statistical Annexes
247

project name aDB
Official cofinancing
source of cofinancinggrants Loans
Power System Efficiency Improvement 300.00 200.00 Islamic Development Bank (IsDB)Public–Private Infrastructure Development Facilityd 1.30 2.00 Asian Clean Energy Fund under the Clean Energy
Financing Partnership Facility
BhutanAdvancing Economic Opportunities of Women
and Girls 1.95 JFPR
nepalDecentralized Rural Infrastructure
and Livelihood 25.00 20.00 OFID(Additional Financing) 7.06 SwitzerlandElectricity Transmission Expansion and
Supply Improvement 75.00 25.00 NorwayEstablishing Women and Children Service Centers
(Supplementary) 0.20 United KingdomReducing Child Malnutrition through Social Protection 2.00 JFPRSchool Sector Program 65.00 15.60 Australia
17.90 Denmark47.90 European Union70.00 Fast Track Initiative13.20 Finland22.40 Norway
4.00 United Kingdom1.00 UNICEF
72.50 World BankSupport for Targeted and Sustainable Development
Programs for Highly Marginalized Groups 2.70 JFPR
sri LankaImproving Community-Based Rural Water Supply
and Sanitation in Post-Conflict Areas of Jaffna and Kilinochchi 2.00 JFPR
National Highways Sectord 150.00 8.00 OFID
RegionalImproving Gender-Inclusive Access to Clean and
Renewable Energy in Bhutan, Nepal, and Sri Lanka 3.00 JFPR
sOUthEast asia 2,009.74 13.68 1,586.52DVA cofinancing 13.68 1,586.52
Non-DVA cofinancing – –
cambodiaImproving Market Access for the Poor
in Central Cambodia 1.90 JFPRProvincial Roads Improvement 52.00 7.00 10.00 Pilot Program for Climate Resilience
under the Strategic Climate Fund
indonesiaRegional Roads Development 180.00 65.00 IsDB
philippinesRoad Improvement and Institutional Development 62.00 30.00 OFID
Viet namComprehensive Socioeconomic Urban Development
in Viet Tri, Hung Yen, and Dong Dang 70.00
13.52 The Export–Import Bank of Korea (KEXIM), Republic of Korea
CONTINUED
– = nil, DVA = direct value-added.a List excludes technical assistance projects. See Statistical Annex 24 for technical assistance projects with cofinancing.b DVA cofinancing: cofinancing with contractual or collaborative arrangements between ADB and financing partners.c Non-DVA cofinancing: cofinancing does not involve direct ADB support or collaborative arrangements. It is recorded for overall statistical purposes only.d Anchor project was approved in prior year(s) with cofinancing arranged this year.
Asian Development Bank Annual Report 2011
248

CONTINUED
project name aDB
Official cofinancing
source of cofinancinggrants Loans
Ha Noi Metro Rail System Project (Line 3: Nhon–Ha Noi Station Section) 293.00 143.00 Agence Française de Développement (AFD), France
325.00 Direction Générale du Trésor, France95.00 European Investment Bank
Mong Duong 1 Thermal Power – Tranche 2d 902.85 510.00 KEXIMO Mon IV Combined Cycle Power Plant 309.89 370.00 GermanyPhuoc Hoa Water Resources (Supplementary) 60.00 25.00 AFDTransport Connections in Northern
Mountainous Provinces 80.00 2.78 Nordic Development Fund
RegionalDeveloping Sustainable Alternative Livelihoods
in Coastal Fishing Communities in the Coral Triangle 2.00 JFPR
tOtaL 973.68 2,307.52DVa cofinancing 971.48 2,307.52non-DVa cofinancing 2.20 –
– = nil, DVA = direct value-added.a List excludes technical assistance projects. See Statistical Annex 24 for technical assistance projects with cofinancing.b DVA cofinancing: cofinancing with contractual or collaborative arrangements between ADB and financing partners.c Non-DVA cofinancing: cofinancing does not involve direct ADB support or collaborative arrangements. It is recorded for overall statistical purposes only.d Anchor project was approved in prior year(s) with cofinancing arranged this year.
Statistical Annexes
249

Statistical Annex 4b PROJECTS INVOLVING COMMERCIAL COFINANCING, 2011 ($ million)
project name aDBcommercial cofinancing source of cofinancing
cEntRaL anD wEst asia 1,255.29 1,940.26 DVA cofinancinga 1,911.55
Non-DVA cofinancingb 28.72
azerbaijanGaradagh Cement Expansion and Energy Efficiency
Improvement Project 27.00 143.58 European Bank for Reconstruction and Development, Deutsche Investitions-und Entwicklungsgesellschaft (DEG), and OPEC Fund for International Development
Garadagh Cement Expansion and Energy Efficiency Improvement Project 28.72 Holcim Auslandsbeteiligung GmBH
pakistanPatrind Hydropower Project 97.00 230.00 Export–Import Bank of Korea, Islamic
Development Bank, International Finance Corporation (IFC)
Uch II Power Project 100.00 99.98 IFCZorlu Enerji Power Project 36.80 70.05 IFC, ECO Trade and Development Bank,
Habib Bank LimitedTransactions under ADB’s Trade Finance Program 659.57 1,152.17 Various international banks and
financial institutions
UzbekistanKandym Gas Field Development Project 300.00 100.00 Islamic Development BankTransactions under ADB’s Trade Finance Program 34.92 115.77 Various international banks and
financial institutions
East asia 602.19 487.60 DVA cofinancing 125.39
Non-DVA cofinancing 362.21
MongoliaTransactions under ADB’s Trade Finance Program 12.19 25.39 Various international banks and
financial institutions
china, people’s Republic of Municipal Water Distribution Infrastructure
Development Project 100.00 100.00 Commercial lenders under B loanJilin Wind Power Project 240.00 60.00 IFCXi’an Urban Road Network Improvement Project 150.00 234.01 China Construction BankGansu Tianshui Urban Infrastructure 100.00 68.20 China Development Bank
paciFic 49.00 40.00 DVA cofinancing –
Non-DVA cofinancing 40.00
papua new guinea and solomon islandsBemobile Expansion Project 49.00 40.00 Bank of South Pacific Limited
sOUth asia 258.90 390.30 DVA cofinancing 390.30
Non-DVA cofinancing –
BangladeshTransactions under ADB’s Trade Finance Program 120.13 213.46 Various international banks and
financial institutions
– = nil, DVA = direct value-added, OPEC = Organization of the Petroleum Exporting Countries.a In 2011, ADB clarified the definition of direct value-added (DVA) commercial cofinancing by providing detailed criteria for qualification of DVA cofinancing. Apart from B loans, DVA
cofinancing now includes (i) a revised calculation for parallel loans, the debt portion of project costs financed by third parties provided that ADB’s presence has been instrumental in mobilizing the third-party debt evidenced by a common terms agreement, common security arrangement, or a memorandum of understanding or other framework agreement; (ii) cofinancing for TFP transactions, including the amount of risk assumed by partner banks and risk distribution partners; (iii) third-party debt (net of guarantees) provided by ADB, unfunded risk participation by banks rated A and AA, and amounts reinsured with entities rated A and AA; (iv) parallel guarantees, third-party debt guaranteed by a co-guarantor of ADB, provided that ADB’s presence has been instrumental in mobilizing additional capacity by other guarantors; and (v) parallel equity investments in funds where ADB acts as a general partner in the fund.
b Recorded for statistical purposes only.
Asian Development Bank Annual Report 2011
250

– = nil, DVA = direct value-added.
project name aDBcommercial cofinancing source of cofinancing
BhutanTransactions under ADB’s Trade Finance Program 2.01 3.05 Various international banks and
financial institutions
indiaDahanu Solar Power Project 48.00 65.00 Export–Import Bank of the United States
nepalTransactions under ADB’s Trade Finance Program 12.93 15.83 Various international banks and
financial institutions
sri LankaTransactions under ADB’s Trade Finance Program 75.82 92.96 Various international banks and
financial institutions
sOUthEast asia 490.94 1,776.99 DVA cofinancing 1,776.99
Non-DVA cofinancing –
indonesiaIndonesia Eximbank 100.00 100.00 ANZ, Bank of Nova Scotia, Sumitomo Mitsui
Banking Corporation, Wells Fargo BankTransactions under ADB’s Trade Finance Program 60.79 54.79 Various international banks and
financial institutions
philippinesTransactions under ADB’s Trade Finance Program 26.70 26.70 Various international banks and
financial institutions
thailandNong Saeng Natural Gas Power Project 170.00 914.77 Japan Bank for International Cooperation,
Mizuho Corporate Bank, Siam Commercial Bank, and Karsikorn Public Company Limited (Onshore)
Viet namTransactions under ADB’s Trade Finance Program 133.45 680.73 Various international banks and
financial institutions
tOtaL 2,656.32 4,635.16DVa cofinancing 4,204.23non-DVa cofinancing 430.93
CONTINUED
Statistical Annexes
251

Statistical Annex 5a LOAN DISBURSEMENTS, 2010 and 2011 (amounts in $ million)
2 0 1 0
OcR
% of total OcR aDF
% of total aDF total
% of total
Disbursements
Projecta
Nondevelopment Finance Institution 2,793 47 969 62 3,762 50Development Finance Institution 246 4 11 1 256 3
Total Project Loans 3,038 51 980 62 4,018 53
Policy-Based Lendingb 1,410 24 455 29 1,865 25Sectorc 823 14 136 9 959 13Nonsovereignd 673 11 – – 673 9
tOtaLe 5,944 100 1,571 100 7,516 100
2 0 1 1% change
(2011/2010)% of total OcR
% of total aDF
% of total
DisbursementsOcR aDF total OcR aDF total
Projecta
Nondevelopment Finance Institution 3,616 57 1,014 73 4,630 60 29 5 23 Development Finance Institution 434 7 55 4 490 6 77 415 91
Total Project Loans 4,051 64 1,069 77 5,120 66 33 9 27
Policy-Based Lendingb 966 15 245 18 1,211 16 (31) (46) (35)Sectorc 604 10 71 5 676 9 (27) (48) (30)Nonsovereignd 715 11 – – 715 9 6 NA 6
tOtaLe 6,337 100 1,385 100 7,722 100 7 (12) 3
– = nil, ( ) = negative, NA = not applicable, ADF = Asian Development Fund, OCR = ordinary capital resources.a A project loan is a loan provided to finance specific projects. ADB uses development finance institutions in its developing member countries (DMCs) as vehicles to finance small to
medium-sized projects in the private sector.b Policy-based lending formerly named program loan is a loan provided to support DMCs’ efforts to improve the policy, institutional, and investment environment of sector
development. It helps meet short-term costs that policy adjustments entail. c A sector loan is provided to develop a specific sector or subsector. It finances a large number of subprojects in a single sector or subsector.d Includes nonsovereign public sector loans and excludes equity investments.e Numbers may not add up because of rounding.
Asian Development Bank Annual Report 2011
252

Statistical Annex 5b GRANT DISBURSEMENTS, 2010 and 2011 (amounts in $ million)
2 0 1 0
aDF
% of total aDF
Other special Fundsa
% of total Other
special Fundsa total
% of total
Disbursements
Project 342.7 95.8 101.8 100.0 444.5 96.7
Policy-Basedb 15.0 4.2 – – 15.0 3.3
tOtaL 357.7 100.0 101.8 100.0 459.5 100.0
2 0 1 1 % change (2011/2010)
aDF
% of total aDF
Other special Fundsa
% of total Other
special Fundsa total
% of total
Disbursements aDF
Other special Fundsa total
Project 375.6 73.7 34.3 100.0 409.8 75.3 9.6 (66.4) (7.8)
Policy-Basedb 134.3 26.3 – – 134.3 24.7 795.3 NA 795.3
tOtaL 509.9 100.0 34.3 100.0 544.1 100.0 42.5 (66.4) 18.4
– = nil, ( ) = negative, ADF = Asian Development Fund, NA = not applicable.a Includes grants funded by Asian Tsunami Fund (ATF), Pakistan Earthquake Fund (PEF), Climate Change Fund (CCF), and Asia Pacific Disaster Response Fund (APDRF).b Formerly named program grants.
Statistical Annex 6a POLICY-BASED LOAN DISBURSEMENTS,a 2011 (amounts in $ million)
country OcR aDF total
Afghanistan – 2.80 2.80 Bangladesh – 44.73 44.73 Bhutan – – –Cambodia – 41.45 41.45 Cook Islands – – –Georgia – – –India 60.00 – 60.00 Indonesia 400.00 – 400.00 Lao People’s Democratic Republic – 8.00 8.00 Maldives – – –Marshall Islands – – –Nepal – 25.35 25.35 Pakistan 200.00 – 200.00 Palau 6.40 3.47 9.87 Philippines 200.00 – 200.00 Thailand 100.00 – 100.00 Samoa – – –Sri Lanka – – –Viet Nam – 118.75 118.75
tOtaL 966.40 244.55 1,210.95
– = nil, ADF = Asian Development Fund, OCR = ordinary capital resources.a Refers to formerly named program loans.
Statistical Annexes
253

Statistical Annex 6b POLICY-BASED GRANT DISBURSEMENTS,a 2011 (amounts in $ million)
country aDF Other special Fundsb total
Afghanistan – – – Bangladesh – – – Bhutan 2.0 – 2.0 Cambodia 24.0 – 24.0 China, People’s Republic of – – – India – – – Indonesia – – – Kyrgyz Republic – – – Lao People’s Democratic Republic 10.0 – 10.0 Maldives – – – Mongolia – – – Nepal 66.3 – 66.3 Pakistan – – – Papua New Guinea – – – Philippines – – – Samoa – – – Solomon Islands 5.0 – 5.0 Sri Lanka – – – Tajikistan 20.0 – 20.0 Timor-Leste – – – Tonga 5.0 – 5.0 Tuvalu 2.0 – 2.0 Viet Nam – – –
tOtaL 134.3 – 134.3
– = nil, ADF = Asian Development Fund.a Refers to formerly named program grants.b Includes grants funded by Asian Tsunami Fund (ATF), Pakistan Earthquake Fund (PEF), Climate Change Fund (CCF), and Asia Pacific Disaster Response Fund (APDRF).
Statistical Annex 6c TRENDS IN POLICY-BASED LENDING AND ADF GRANT, 1999–2011
policy-Based Lending and aDF grant project Loan and aDF grant total
year $ Million % $ Million % $ Million
1999 1,694.00 34 3,239.57 66 4,933.57 2000 1,102.00 20 4,480.59 80 5,582.59 2001 1,583.00 30 3,755.69 70 5,338.69 2002 1,702.18 30 3,955.75 70 5,657.93 2003 1,139.50 19 4,900.31 81 6,039.81 2004 1,121.40 22 3,917.64 78 5,039.04 2005 1,148.50 19 4,858.75 81 6,007.25 2006 3,204.58 43 4,331.62 57 7,536.20 2007 2,521.00 25 7,513.94 75 10,034.94 2008 2,631.05 25 7,975.23 75 10,606.28 2009 6,098.85 43 8,028.35 57 14,127.20 2010 1,580.90 13 10,830.56 87 12,411.46 2011 690.62 5 12,511.60 95 13,202.22
ADF = Asian Development Fund.
Asian Development Bank Annual Report 2011
254

Statistical Annex 7 NONSOVEREIGN APPROVALS AND TOTAL PROJECT COSTS BY COUNTRY,a 2011 ($ million)
LoanEquity
investment
total aDB
Funds
complementary Loan
(B Loan)
partial credit
guarantee
political Risk
guarantee
total aDB
approvals
project cost/
Fund size
armeniaSmall and Medium-Sized Enterprise Finance Program 65.00 – 65.00 – – – 65.00 65.00
BangladeshIndustrial Energy Efficiency Finance Program 30.00 – 30.00 – – – 30.00 30.00
china, people’s Republic ofMunicipal Water Distribution
Infrastructure Development 100.00 – 100.00 100.00 – – 200.00 394.54 Sino-Green Climate Investment Fund – 25.00 25.00 – – – 25.00 200.00
indiaBangalore Metro Rail Transit System 250.00 – 250.00 – – – 250.00 2,665.00 Solar Power Generation – – – – 150.00 – 150.00 429.00 National Grid Improvement Project 250.00 – 250.00 – – – 250.00 2,250.10 Dahanu Solar Power Project 48.00 – 48.00 – – – 48.00 147.50 Climatech Venture Capital Funds – VenturEast Life
Fund IIIb – 20.00 20.00 – – – 20.00 200.00
indonesiaIndonesia Eximbank 100.00 – 100.00 100.00 – – 200.00 200.00
Lao people’s Democratic RepublicNam Ngum 3 Hydropower Project 350.00 – 350.00 – – – 350.00 1,125.00
pakistanPatrind Hydropower Project 97.00 – 97.00 – – – 97.00 436.00 Foundation Wind Energy I and II Projects – – – – 66.61 – 66.61 266.41
thailandNong Saeng Natural Gas Power Project 170.00 – 170.00 – – – 170.00 1,567.00
UzbekistanKandym Gas Field Development Project 100.00 – 100.00 – – 200.00 300.00 447.00
RegionalBemobile Expansion Projectb 40.00 9.00 49.00 – – – 49.00 90.00 Climatech Venture Capital Funds – Aloe Environment
Fund IIIc – 20.00 20.00 – – – 20.00 146.21 Aureos South East Asia Fund IId – 15.00 15.00 – – – 15.00 180.00
tOtaL 1,600.00 89.00 1,689.00 200.00 216.61 200.00 2,305.61 10,838.76
– = nil.a Includes projects processed by the Private Sector Operations Department and various regional operations departments of ADB.b The project covers Papua New Guinea and Solomon Islands.c Counted as one project.d The fund will invest in a diversified and balanced portfolio of small and medium-sized enterprises in various developing member countries.
Statistical Annexes
255

Statistical Annex 8 NONSOVEREIGN APPROVALS AND TOTAL PROJECT COSTS BY SECTOR,a 2011
($ million)
sector LoanEquity
investment
total aDB
Funds
complementary Loan
(B Loan)
partial credit
guarantee
political Risk
guarantee
total aDB
approvals
total project cost
Energy 1,045.00 – 1,045.00 – 216.61 200.00 1,461.61 6,698.01 Finance 165.00 15.00 180.00 100.00 – – 280.00 445.00 Multisector – 65.00 65.00 – 65.00 546.21 Transport and ICT 290.00 9.00 299.00 – – – 299.00 2,755.00 Water and Other Municipal Infrastructure
and Services 100.00 – 100.00 100.00 – – 200.00 394.54
tOtaL 1,600.00 89.00 1,689.00 200.00 216.61 200.00 2,305.61 10,838.76
ICT = information and communication technology.a Includes projects processed by the Private Sector Operations Department and various regional operations departments of ADB.
Statistical Annex 9 NONSOVEREIGN APPROVALS BY YEAR,a, b 1983–2011 (amounts in $ million)
yearno. of
projectsc LoanEquity
investmentd
total aDB
Funds
complementary Loan
(B Loan)
partial credit
guarantee
political Risk
guarantee tFp grant
total aDB
approvals
total project cost
1983 2 – 2.96 2.96 – – – – 2.96 36.001984 1 – 0.42 0.42 – – – – 0.42 2.801985 3 – 3.40 3.40 – – – – 3.40 26.501986 4 6.46 6.01 12.47 – – – – 12.47 20.321987 7 20.50 27.61 48.11 5.00 – – – 53.11 519.241988 12 58.00 35.67 93.67 – – – – 93.67 502.321989 16 95.70 67.59 163.29 51.10 – – – 214.39 1,038.661990 17 78.85 35.94 114.79 24.00 – – – 138.79 2,026.131991 10 156.80 20.52 177.32 – – – – 177.32 1,325.181992 4 50.00 5.42 55.42 81.50 – – – 136.92 402.291993 8 182.10 20.70 202.80 19.30 – – – 222.10 1,505.701994 10 – 48.70 48.70 – – – – 48.70 919.201995 7 68.00 99.41 167.41 5.83 – – – 173.24 1,050.321996 7 98.50 80.15 178.65 91.50 – – – 270.15 1,788.771997 6 45.00 49.50 94.50 – – – – 94.50 1,239.691998 6 136.12 39.44 175.56 151.08 – – – 326.64 1,152.701999 3 101.50 7.40 108.90 61.50 – – – 170.40 847.702000 9 152.00 77.65 229.65 45.00 – – – 274.65 1,629.842001 6 37.50 30.36 67.86 – – – – 67.86 648.002002 6 110.00 25.53 135.53 – – 60.00 – 195.53 1,136.602003 7 122.00 35.65 157.65 170.00 65.00 – 150.00 542.65 2,300.002004 14 92.50 164.37 256.87 – – 10.00 – 266.87 2,227.702005 13 513.02 175.50 688.52 – 18.40 – – 706.92 8,676.422006 18 450.00 230.50 680.50 330.00 109.80 15.00 – 1,135.30 7,678.342007 21 650.27 79.75 730.02 200.00 251.00 – – 1,181.02 3,494.542008 12 1,296.58 103.08 1,399.66 425.00 – – 1,824.66 9,667.492009 11 437.87 220.00 657.87 276.20 – 850.00 1,784.07 4,333.522010 19 1,034.70 235.00 1,269.70 320.00 500.00 – – 2.00 2,091.70 5,942.422011 17 1,600.00 89.00 1,689.00 200.00 216.61 200.00 – – 2,305.61 10,838.76
tOtaL 266 7,593.97 2,017.23 9,611.20 2,457.01 1,160.81 285.00 1,000.00 2.00 14,516.02 72,977.15
– = data not applicable, TFP = Trade Finance Program.a Includes nonsovereign projects processed by the Private Sector Operations Department and various regional operations departments of ADB. Regional operations departments
started nonsovereign operations in 2007. b Net of facilities cancelled in full before signing.c Supplementary approvals are not included in the cumulative count of projects.d Includes equity investments, lines of equity, and equity underwriting.
Asian Development Bank Annual Report 2011
256

Statistical Annex 10 NONSOVEREIGN APPROVALS BY COUNTRY,a, b 1983–2011 (amounts in $ million)
countryno. of
projectsc LoanEquity
investmentd
total aDB
Funds
complementary Loan
(B Loan)
partial credit
guarantee
political Risk
guarantee tFp grant
total aDB
approvals
total project cost
Afghanistan 6 135.00 8.10 143.10 30.00 – 25.00 – 198.10 650.70 Armenia 2 105.00 105.00 105.00 238.00 Azerbaijan 5 93.00 – 93.00 – – – – 93.00 553.00 Bangladesh 9 167.20 14.98 182.18 20.00 – – – 202.18 920.36 Bhutan 1 – 0.53 0.53 – – – – 0.53 0.79 Cambodia 1 8.00 – 8.00 – – – – 8.00 32.00 China, People’s
Republic of 29 1,120.77 429.30 1,550.07 1,342.70 107.00 – – 2,999.77 10,277.96 Georgia 3 95.00 – 95.00 – – – – 95.00 195.00 India 39 1,944.97 297.30 2,242.27 230.00 400.00 – – 2,872.27 20,975.30 Indonesia 17 957.00 63.85 1,020.85 388.50 9.80 – – 1,419.15 8,172.02 Kazakhstan 4 175.00 – 175.00 – 200.00 – – 375.00 925.00 Korea, Republic of 3 – 8.96 8.96 – – – – 8.96 288.00 Lao People’s
Democratic Republic 2 400.00 – 400.00 – – – – 400.00 2,575.00 Malaysia 2 10.00 2.00 12.00 – – – – 12.00 29.24 Maldives 2 12.00 4.50 16.50 – – – – 16.50 37.50 Mongolia 2 14.50 1.60 16.10 – – – – 16.10 50.00 Nepal 4 49.55 3.26 52.81 5.83 – – – 58.64 218.03 Pakistan 28 662.90 53.38 716.28 129.90 175.61 – – 1,021.79 4,339.52 Papua New Guinea 1 25.00 – 25.00 – – – – 25.00 85.30 Philippines 26 595.32 39.85 635.17 113.58 18.40 – – 767.15 4,284.72 Samoa 1 – 0.40 0.40 – – – – 0.40 1.60 Sri Lanka 12 99.50 13.58 113.08 – – – – 113.08 543.48 Thailand 12 445.76 77.07 522.83 170.00 – – – 2.00 694.83 5,032.68 Uzbekistan 1 100.00 – 100.00 – – 200.00 – 300.00 447.00 Viet Nam 7 193.50 – 193.50 26.50 – 60.00 – 280.00 1,495.00 Regional 47 185.00 998.57 1,183.57 – 250.00 – 1,000.00 2,433.57 10,609.95
tOtaL 266 7,593.97 2,017.23 9,611.20 2,457.01 1,160.81 285.00 1,000.00 2.00 14,516.02 72,977.15
– = data not applicable, TFP = Trade Finance Program.a Includes nonsovereign projects processed by the Private Sector Operations Department and various regional operations departments of ADB. Regional operations departments
started nonsovereign operations in 2007.b Net of facilities cancelled in full before signing.c Supplementary approvals are not included in the cumulative count of projects.d Includes equity investments, lines of equity, and equity underwriting.
Statistical Annexes
257

Statistical Annex 11 NUMBER OF LOANS/GRANTS UNDER ADMINISTRATION, AND CLOSED IN 2011 (as of 31 December 2011)
country
cumulative no. of
Effective Loansa
cumulative no. of
Effective grantsb
no. of Loans under
administrationa, c
no. of grants under
administrationb, c
no. of Loans closed
in 2011d
no. of grants closed
in 2011b country
Afghanistan 22 17 12 15 – 1 AfghanistanArmenia 12 – 9 – 2 – ArmeniaAzerbaijan 15 – 13 – 1 – AzerbaijanBangladesh 211 2 55 2 5 – BangladeshBhutan 25 6 7 6 – – BhutanCambodia 56 22 16 15 7 5 CambodiaChina, People’s Republic of 183 3 88 3 4 – China, People’s Republic ofCook Islands 16 – 3 1 – – Cook IslandsFiji 19 – 4 – – – FijiGeorgia 13 – 9 – 1 – GeorgiaHong Kong, China 5 – – – – – Hong Kong, ChinaIndia 156 1 91 – 4 – IndiaIndonesia 310 4 28 – 9 2 IndonesiaKazakhstan 21 – 8 – – – KazakhstanKiribati 7 – 2 – – – KiribatiKorea, Republic of 81 – – – – – Korea, Republic ofKyrgyz Republic 31 13 7 11 – – Kyrgyz RepublicLao People’s Democratic Republic 69 22 12 21 4 – Lao People’s Democratic RepublicMalaysia 77 – – – – – MalaysiaMaldives 20 1 7 – – 1 MaldivesMarshall Islands 13 – – – 1 – Marshall IslandsMicronesia, Federated States of 8 – 2 – – – Micronesia, Federated States ofMongolia 44 13 9 13 2 – MongoliaMyanmar 32 – – – – – MyanmarNauru 1 – – – – – NauruNepal 124 25 17 26 3 2 NepalPakistan 290 4 29 3 11 – PakistanPalau 2 – 2 – – – PalauPapua New Guinea 69 1 20 1 – – Papua New GuineaPhilippines 211 2 13 2 1 – PhilippinesSamoa 33 4 3 2 2 1 SamoaSingapore 14 – – – – – SingaporeSolomon Islands 16 7 – 5 – 2 Solomon IslandsSri Lanka 160 6 40 5 5 1 Sri LankaTaipei,China 12 – – – – – Taipei,ChinaTajikistan 22 10 5 8 2 – TajikistanThailand 89 1 6 1 – – ThailandTimor-Leste – 3 – 4 – – Timor-LesteTonga 14 3 – 3 – 1 TongaTurkmenistan 1 – 1 – – – TurkmenistanTuvalu 3 1 – – 2 1 TuvaluUzbekistan 35 – 24 – 3 – UzbekistanVanuatu 9 – 2 – – – VanuatuViet Nam 121 4 63 3 6 1 Viet NamRegional 8 2 3 1 – 1 Regional
tOtaL 2,680 177 610 151 75 19 tOtaL
– = nil.a Data include nonsovereign loans.b Includes only ADF and other ADB Special Funds.c Covers loans/grants that have been approved but still awaiting effectivity; excludes projects exclusively financed from other sources.d Covers sovereign lending.
Asian Development Bank Annual Report 2011
258

Statistical Annex 11 NUMBER OF LOANS/GRANTS UNDER ADMINISTRATION, AND CLOSED IN 2011 (as of 31 December 2011)
country
cumulative no. of
Effective Loansa
cumulative no. of
Effective grantsb
no. of Loans under
administrationa, c
no. of grants under
administrationb, c
no. of Loans closed
in 2011d
no. of grants closed
in 2011b country
Afghanistan 22 17 12 15 – 1 AfghanistanArmenia 12 – 9 – 2 – ArmeniaAzerbaijan 15 – 13 – 1 – AzerbaijanBangladesh 211 2 55 2 5 – BangladeshBhutan 25 6 7 6 – – BhutanCambodia 56 22 16 15 7 5 CambodiaChina, People’s Republic of 183 3 88 3 4 – China, People’s Republic ofCook Islands 16 – 3 1 – – Cook IslandsFiji 19 – 4 – – – FijiGeorgia 13 – 9 – 1 – GeorgiaHong Kong, China 5 – – – – – Hong Kong, ChinaIndia 156 1 91 – 4 – IndiaIndonesia 310 4 28 – 9 2 IndonesiaKazakhstan 21 – 8 – – – KazakhstanKiribati 7 – 2 – – – KiribatiKorea, Republic of 81 – – – – – Korea, Republic ofKyrgyz Republic 31 13 7 11 – – Kyrgyz RepublicLao People’s Democratic Republic 69 22 12 21 4 – Lao People’s Democratic RepublicMalaysia 77 – – – – – MalaysiaMaldives 20 1 7 – – 1 MaldivesMarshall Islands 13 – – – 1 – Marshall IslandsMicronesia, Federated States of 8 – 2 – – – Micronesia, Federated States ofMongolia 44 13 9 13 2 – MongoliaMyanmar 32 – – – – – MyanmarNauru 1 – – – – – NauruNepal 124 25 17 26 3 2 NepalPakistan 290 4 29 3 11 – PakistanPalau 2 – 2 – – – PalauPapua New Guinea 69 1 20 1 – – Papua New GuineaPhilippines 211 2 13 2 1 – PhilippinesSamoa 33 4 3 2 2 1 SamoaSingapore 14 – – – – – SingaporeSolomon Islands 16 7 – 5 – 2 Solomon IslandsSri Lanka 160 6 40 5 5 1 Sri LankaTaipei,China 12 – – – – – Taipei,ChinaTajikistan 22 10 5 8 2 – TajikistanThailand 89 1 6 1 – – ThailandTimor-Leste – 3 – 4 – – Timor-LesteTonga 14 3 – 3 – 1 TongaTurkmenistan 1 – 1 – – – TurkmenistanTuvalu 3 1 – – 2 1 TuvaluUzbekistan 35 – 24 – 3 – UzbekistanVanuatu 9 – 2 – – – VanuatuViet Nam 121 4 63 3 6 1 Viet NamRegional 8 2 3 1 – 1 Regional
tOtaL 2,680 177 610 151 75 19 tOtaL
– = nil.a Data include nonsovereign loans.b Includes only ADF and other ADB Special Funds.c Covers loans/grants that have been approved but still awaiting effectivity; excludes projects exclusively financed from other sources.d Covers sovereign lending.
Statistical Annexes
259

Statistical Annex 12 AMOUNT OF LOANS MADE EFFECTIVE, CONTRACTS AWARDED, AND DISBURSEMENTS (amounts in $ million; as of 31 December 2011)
countrycumulative net
Effective Loansa, b
contracts awarded in 2011b, c, d
cumulative contracts
awardedb, c, d
% of cumulative contracts awarded to cumulative net
Effective Loansc
Disbursements in 2011e
cumulative Disbursementsf
% of cumulative Disbursements
to cumulative net Effective Loans country
Afghanistan 908.99 7.43 418.16 83.91 42.97 779.29 85.73 AfghanistanArmenia 527.18 4.24 87.58 24.27 63.92 238.14 45.17 ArmeniaAzerbaijan 661.21 61.15 478.17 44.07 136.75 330.14 49.93 AzerbaijanBangladesh 10,942.84 558.74 7,484.12 73.83 412.76 8,805.92 80.47 BangladeshBhutan 253.76 8.15 208.08 83.90 28.98 218.12 85.95 BhutanCambodia 1,141.29 41.46 784.92 84.17 75.31 979.30 85.81 CambodiaChina, People’s Republic of 22,654.13 1,293.04 19,004.76 82.20 1,697.72 18,063.78 79.74 China, People’s Republic ofCook Islands 53.28 – 38.25 88.63 9.15 47.36 88.89 Cook IslandsFiji 284.45 18.81 235.32 88.98 21.38 235.87 82.92 FijiGeorgia 716.93 36.72 224.60 37.30 67.54 437.07 60.96 GeorgiaHong Kong, China 94.50 – 94.50 100.00 – 94.50 100.00 Hong Kong, ChinaIndia 21,404.10 1,357.79 15,305.55 80.96 1,544.52 16,959.83 79.24 IndiaIndonesia 21,580.24 153.14 12,044.48 94.53 701.89 20,922.61 96.95 IndonesiaKazakhstan 1,985.74 123.81 877.17 58.85 293.53 1,545.35 77.82 KazakhstanKiribati 25.42 2.29 16.00 49.01 0.76 14.46 56.90 KiribatiKorea, Republic of 5,560.33 – 1,860.33 100.00 – 5,560.32 100.00 Korea, Republic of Kyrgyz Republic 720.62 40.06 443.95 77.19 39.28 623.27 86.49 Kyrgyz RepublicLao People’s Democratic Republic 1,213.51 3.11 1,001.47 88.52 14.32 1,209.01 99.63 Lao People’s Democratic RepublicMalaysia 1,413.98 – 1,403.98 100.00 – 1,413.98 100.00 MalaysiaMaldives 143.18 3.85 94.78 93.60 6.99 117.24 81.89 MaldivesMarshall Islands 74.13 – 40.47 100.00 – 74.13 100.00 Marshall IslandsMicronesia, Federated States of 65.99 8.24 37.20 83.12 6.32 54.54 82.64 Micronesia, Federated States ofMongolia 753.76 8.36 449.46 77.82 14.12 667.34 88.54 MongoliaMyanmar 411.83 – 387.64 100.00 – 411.83 100.00 MyanmarNauru 2.30 – – – – 2.30 100.00 NauruNepal 2,326.34 59.98 1,619.57 79.23 76.21 1,933.54 83.12 NepalPakistan 18,914.44 478.61 9,560.33 83.31 594.76 16,812.65 88.89 PakistanPalau 16.07 – – – 9.87 9.87 61.42 PalauPapua New Guinea 1,137.04 26.25 661.94 55.05 20.55 794.46 69.87 Papua New GuineaPhilippines 10,634.45 60.50 4,905.82 89.20 283.76 10,104.77 95.02 PhilippinesSamoa 167.09 5.39 118.44 92.47 9.76 149.96 89.75 SamoaSingapore 144.44 – 144.44 100.00 – 144.44 100.00 SingaporeSolomon Islands 65.82 – 50.15 100.00 – 65.82 100.00 Solomon IslandsSri Lanka 5,134.36 283.69 3,775.32 81.94 271.84 3,994.98 77.81 Sri LankaTaipei,China 91.14 – 91.14 100.00 – 91.14 100.00 Taipei,ChinaTajikistan 363.80 4.32 316.81 96.14 19.19 347.20 95.44 TajikistanThailand 4,946.92 – 3,186.19 97.64 287.15 4,526.89 91.51 ThailandTimor-Leste – – – – – – – Timor-LesteTonga 52.26 – 41.17 100.00 – 52.26 100.00 TongaTurkmenistan 125.00 2.58 2.58 2.07 – – – TurkmenistanTuvalu 7.92 0.00 3.95 100.00 (0.00) 7.92 100.00 TuvaluUzbekistan 1,953.76 256.07 1,096.40 43.50 113.40 855.13 43.77 UzbekistanVanuatu 48.99 – 29.04 65.69 – 48.99 100.00 VanuatuViet Nam 9,077.16 1,226.14 5,013.58 57.11 792.73 4,951.45 54.55 Viet NamRegionalg 270.48 – 1.60 100.00 64.47 258.48 95.56 Regional
tOtaLh 149,071.19 6,133.92 93,639.37 80.01 7,721.93 124,955.66 83.82 tOtaL
– = nil or data not applicable, ( ) = negative, 0.00 = amount less than $50,000.a Net refers to effective loan amounts less cancellations.b The US dollar equivalent is in accordance with the exchange rate prevailing in ADB on 31 December 2011.c Data exclude nonsovereign loans and policy-based lending.d Contracts awarded for financial intermediation loans are based on the amount of subloan disbursements. e Data include sovereign and nonsovereign loans.f The cumulative disbursements may exceed the cumulative contracts awarded due to disbursements without contracts, e.g., interest during constructions, contingencies,
and nonsovereign loans, which do not require procurement.g Includes the Revolving Credit Facility of Trade Finance Program of $127 million as of 31 December 2011.h Totals may not add up because of rounding.
Asian Development Bank Annual Report 2011
260

Statistical Annex 12 AMOUNT OF LOANS MADE EFFECTIVE, CONTRACTS AWARDED, AND DISBURSEMENTS (amounts in $ million; as of 31 December 2011)
countrycumulative net
Effective Loansa, b
contracts awarded in 2011b, c, d
cumulative contracts
awardedb, c, d
% of cumulative contracts awarded to cumulative net
Effective Loansc
Disbursements in 2011e
cumulative Disbursementsf
% of cumulative Disbursements
to cumulative net Effective Loans country
Afghanistan 908.99 7.43 418.16 83.91 42.97 779.29 85.73 AfghanistanArmenia 527.18 4.24 87.58 24.27 63.92 238.14 45.17 ArmeniaAzerbaijan 661.21 61.15 478.17 44.07 136.75 330.14 49.93 AzerbaijanBangladesh 10,942.84 558.74 7,484.12 73.83 412.76 8,805.92 80.47 BangladeshBhutan 253.76 8.15 208.08 83.90 28.98 218.12 85.95 BhutanCambodia 1,141.29 41.46 784.92 84.17 75.31 979.30 85.81 CambodiaChina, People’s Republic of 22,654.13 1,293.04 19,004.76 82.20 1,697.72 18,063.78 79.74 China, People’s Republic ofCook Islands 53.28 – 38.25 88.63 9.15 47.36 88.89 Cook IslandsFiji 284.45 18.81 235.32 88.98 21.38 235.87 82.92 FijiGeorgia 716.93 36.72 224.60 37.30 67.54 437.07 60.96 GeorgiaHong Kong, China 94.50 – 94.50 100.00 – 94.50 100.00 Hong Kong, ChinaIndia 21,404.10 1,357.79 15,305.55 80.96 1,544.52 16,959.83 79.24 IndiaIndonesia 21,580.24 153.14 12,044.48 94.53 701.89 20,922.61 96.95 IndonesiaKazakhstan 1,985.74 123.81 877.17 58.85 293.53 1,545.35 77.82 KazakhstanKiribati 25.42 2.29 16.00 49.01 0.76 14.46 56.90 KiribatiKorea, Republic of 5,560.33 – 1,860.33 100.00 – 5,560.32 100.00 Korea, Republic of Kyrgyz Republic 720.62 40.06 443.95 77.19 39.28 623.27 86.49 Kyrgyz RepublicLao People’s Democratic Republic 1,213.51 3.11 1,001.47 88.52 14.32 1,209.01 99.63 Lao People’s Democratic RepublicMalaysia 1,413.98 – 1,403.98 100.00 – 1,413.98 100.00 MalaysiaMaldives 143.18 3.85 94.78 93.60 6.99 117.24 81.89 MaldivesMarshall Islands 74.13 – 40.47 100.00 – 74.13 100.00 Marshall IslandsMicronesia, Federated States of 65.99 8.24 37.20 83.12 6.32 54.54 82.64 Micronesia, Federated States ofMongolia 753.76 8.36 449.46 77.82 14.12 667.34 88.54 MongoliaMyanmar 411.83 – 387.64 100.00 – 411.83 100.00 MyanmarNauru 2.30 – – – – 2.30 100.00 NauruNepal 2,326.34 59.98 1,619.57 79.23 76.21 1,933.54 83.12 NepalPakistan 18,914.44 478.61 9,560.33 83.31 594.76 16,812.65 88.89 PakistanPalau 16.07 – – – 9.87 9.87 61.42 PalauPapua New Guinea 1,137.04 26.25 661.94 55.05 20.55 794.46 69.87 Papua New GuineaPhilippines 10,634.45 60.50 4,905.82 89.20 283.76 10,104.77 95.02 PhilippinesSamoa 167.09 5.39 118.44 92.47 9.76 149.96 89.75 SamoaSingapore 144.44 – 144.44 100.00 – 144.44 100.00 SingaporeSolomon Islands 65.82 – 50.15 100.00 – 65.82 100.00 Solomon IslandsSri Lanka 5,134.36 283.69 3,775.32 81.94 271.84 3,994.98 77.81 Sri LankaTaipei,China 91.14 – 91.14 100.00 – 91.14 100.00 Taipei,ChinaTajikistan 363.80 4.32 316.81 96.14 19.19 347.20 95.44 TajikistanThailand 4,946.92 – 3,186.19 97.64 287.15 4,526.89 91.51 ThailandTimor-Leste – – – – – – – Timor-LesteTonga 52.26 – 41.17 100.00 – 52.26 100.00 TongaTurkmenistan 125.00 2.58 2.58 2.07 – – – TurkmenistanTuvalu 7.92 0.00 3.95 100.00 (0.00) 7.92 100.00 TuvaluUzbekistan 1,953.76 256.07 1,096.40 43.50 113.40 855.13 43.77 UzbekistanVanuatu 48.99 – 29.04 65.69 – 48.99 100.00 VanuatuViet Nam 9,077.16 1,226.14 5,013.58 57.11 792.73 4,951.45 54.55 Viet NamRegionalg 270.48 – 1.60 100.00 64.47 258.48 95.56 Regional
tOtaLh 149,071.19 6,133.92 93,639.37 80.01 7,721.93 124,955.66 83.82 tOtaL
– = nil or data not applicable, ( ) = negative, 0.00 = amount less than $50,000.a Net refers to effective loan amounts less cancellations.b The US dollar equivalent is in accordance with the exchange rate prevailing in ADB on 31 December 2011.c Data exclude nonsovereign loans and policy-based lending.d Contracts awarded for financial intermediation loans are based on the amount of subloan disbursements. e Data include sovereign and nonsovereign loans.f The cumulative disbursements may exceed the cumulative contracts awarded due to disbursements without contracts, e.g., interest during constructions, contingencies,
and nonsovereign loans, which do not require procurement.g Includes the Revolving Credit Facility of Trade Finance Program of $127 million as of 31 December 2011.h Totals may not add up because of rounding.
Statistical Annexes
261

Statistical Annex 13 AMOUNT OF GRANTS MADE EFFECTIVE, CONTRACTS AWARDED, AND DISBURSEMENTSa (amounts in $ million; as of 31 December 2011)
countrycumulative net Effective grants
contracts awarded in 2011b
cumulative contracts awardedb
% of cumulative contracts awarded to cumulative net Effective grantsb
Disbursements in 2011
cumulative Disbursements
% of cumulative Disbursements
to cumulative net Effective grants country
Afghanistan 1,499.08 352.83 665.32 46.10 77.88 342.03 22.82 Afghanistan Armenia – – – – – – – ArmeniaAzerbaijan – – – – – – – AzerbaijanBangladesh 11.30 0.07 9.43 83.48 0.71 6.63 58.71 Bangladesh Bhutan 105.33 45.72 74.39 74.89 12.95 37.98 36.06 Bhutan Cambodia 258.37 21.68 105.80 46.47 49.96 131.63 50.95 Cambodia China, People’s Republic of 7.20 0.37 0.98 13.63 0.67 0.87 12.05 China, People’s Republic ofCook Islands – – – – – – – Cook IslandsFiji – – – – – – – FijiGeorgia – – – – – – – GeorgiaHong Kong, China – – – – – – – Hong Kong, ChinaIndia 100.00 – 100.00 100.00 – 100.00 100.00 India Indonesia 303.85 – 303.85 100.00 5.32 303.85 100.00 Indonesia Kazakhstan – – – – – – – KazakhstanKiribati – – – – – – – KiribatiKorea, Republic of – – – – – – – Korea, Republic ofKyrgyz Republic 241.65 65.91 154.79 67.55 64.13 132.08 54.66 Kyrgyz Republic Lao People’s Democratic Republic 348.76 30.10 139.81 45.28 56.88 142.50 40.86 Lao People’s Democratic Republic Malaysia – – – – – – – MalaysiaMaldives 17.17 – 17.17 100.00 0.07 17.17 100.00 Maldives Marshall Islands – – – – – – – Marshall IslandsMicronesia, Federated States of – – – – – – – Micronesia, Federated States ofMongolia 174.72 55.73 88.19 59.26 15.57 53.35 30.54 Mongolia Myanmar – – – – – – – MyanmarNauru – – – – – – – NauruNepal 628.18 76.30 180.84 45.91 132.59 361.59 57.56 Nepal Pakistan 146.00 3.60 135.95 94.74 12.74 129.24 88.52 Pakistan Papua New Guinea 15.00 1.13 14.38 95.88 2.89 13.24 88.24 Papua New Guinea Philippines 6.00 – – – 3.00 6.00 100.00 Philippines Samoa 24.51 2.49 14.63 59.68 3.62 10.57 43.13 Samoa Singapore – – – – – – – SingaporeSolomon Islands 56.12 18.04 36.84 79.89 14.51 26.23 46.75 Solomon Islands Sri Lanka 207.75 5.91 171.58 82.59 13.45 171.81 82.70 Sri Lanka Taipei,China – – – – – – – Taipei,ChinaTajikistan 429.56 142.48 182.01 52.82 55.31 114.27 26.60 Tajikistan Thailand 3.00 – – – – – – Thailand Timor-Leste 61.89 8.89 26.83 43.35 2.99 14.49 23.42 Timor-Leste Tonga 31.00 0.03 7.47 35.59 7.08 14.28 46.05 Tonga Turkmenistan – – – – – – – TurkmenistanTuvalu 3.24 – – – 2.00 3.24 100.00 Tuvalu Uzbekistan – – – – – – – UzbekistanVanuatu – – – – – – – VanuatuViet Nam 45.57 2.04 39.93 87.63 4.79 38.99 85.58 Viet Nam Regional 32.04 0.01 31.58 98.55 5.01 30.99 96.71 Regional
tOtaL 4,757.29 833.34 2,501.78 58.99 544.14 2,203.04 46.31 tOtaL
– = nil.Note: Totals may not add up because of rounding.a Includes only Asian Development Fund and other ADB Special Funds.b Excludes policy-based grants.
Asian Development Bank Annual Report 2011
262

Statistical Annex 13 AMOUNT OF GRANTS MADE EFFECTIVE, CONTRACTS AWARDED, AND DISBURSEMENTSa (amounts in $ million; as of 31 December 2011)
countrycumulative net Effective grants
contracts awarded in 2011b
cumulative contracts awardedb
% of cumulative contracts awarded to cumulative net Effective grantsb
Disbursements in 2011
cumulative Disbursements
% of cumulative Disbursements
to cumulative net Effective grants country
Afghanistan 1,499.08 352.83 665.32 46.10 77.88 342.03 22.82 Afghanistan Armenia – – – – – – – ArmeniaAzerbaijan – – – – – – – AzerbaijanBangladesh 11.30 0.07 9.43 83.48 0.71 6.63 58.71 Bangladesh Bhutan 105.33 45.72 74.39 74.89 12.95 37.98 36.06 Bhutan Cambodia 258.37 21.68 105.80 46.47 49.96 131.63 50.95 Cambodia China, People’s Republic of 7.20 0.37 0.98 13.63 0.67 0.87 12.05 China, People’s Republic ofCook Islands – – – – – – – Cook IslandsFiji – – – – – – – FijiGeorgia – – – – – – – GeorgiaHong Kong, China – – – – – – – Hong Kong, ChinaIndia 100.00 – 100.00 100.00 – 100.00 100.00 India Indonesia 303.85 – 303.85 100.00 5.32 303.85 100.00 Indonesia Kazakhstan – – – – – – – KazakhstanKiribati – – – – – – – KiribatiKorea, Republic of – – – – – – – Korea, Republic ofKyrgyz Republic 241.65 65.91 154.79 67.55 64.13 132.08 54.66 Kyrgyz Republic Lao People’s Democratic Republic 348.76 30.10 139.81 45.28 56.88 142.50 40.86 Lao People’s Democratic Republic Malaysia – – – – – – – MalaysiaMaldives 17.17 – 17.17 100.00 0.07 17.17 100.00 Maldives Marshall Islands – – – – – – – Marshall IslandsMicronesia, Federated States of – – – – – – – Micronesia, Federated States ofMongolia 174.72 55.73 88.19 59.26 15.57 53.35 30.54 Mongolia Myanmar – – – – – – – MyanmarNauru – – – – – – – NauruNepal 628.18 76.30 180.84 45.91 132.59 361.59 57.56 Nepal Pakistan 146.00 3.60 135.95 94.74 12.74 129.24 88.52 Pakistan Papua New Guinea 15.00 1.13 14.38 95.88 2.89 13.24 88.24 Papua New Guinea Philippines 6.00 – – – 3.00 6.00 100.00 Philippines Samoa 24.51 2.49 14.63 59.68 3.62 10.57 43.13 Samoa Singapore – – – – – – – SingaporeSolomon Islands 56.12 18.04 36.84 79.89 14.51 26.23 46.75 Solomon Islands Sri Lanka 207.75 5.91 171.58 82.59 13.45 171.81 82.70 Sri Lanka Taipei,China – – – – – – – Taipei,ChinaTajikistan 429.56 142.48 182.01 52.82 55.31 114.27 26.60 Tajikistan Thailand 3.00 – – – – – – Thailand Timor-Leste 61.89 8.89 26.83 43.35 2.99 14.49 23.42 Timor-Leste Tonga 31.00 0.03 7.47 35.59 7.08 14.28 46.05 Tonga Turkmenistan – – – – – – – TurkmenistanTuvalu 3.24 – – – 2.00 3.24 100.00 Tuvalu Uzbekistan – – – – – – – UzbekistanVanuatu – – – – – – – VanuatuViet Nam 45.57 2.04 39.93 87.63 4.79 38.99 85.58 Viet Nam Regional 32.04 0.01 31.58 98.55 5.01 30.99 96.71 Regional
tOtaL 4,757.29 833.34 2,501.78 58.99 544.14 2,203.04 46.31 tOtaL
– = nil.Note: Totals may not add up because of rounding.a Includes only Asian Development Fund and other ADB Special Funds.b Excludes policy-based grants.
Statistical Annexes
263

Statistical Annex 14 NUMBER OF PROJECTS UNDER ADMINISTRATION, PROJECTS AT RISK, COMPLETED, AND PROJECT COMPLETION REPORTS (PCRs)/ EXTENDED ANNUAL REVIEW REPORTS (XARRs)/PROJECT/PROGRAM PERFORMANCE EVALUATION REPORTS (PPERs) CIRCULATED (as of 31 December 2011)
country
no. of projectsa, b
under administration
no. ofEffectiveprojects at Riskc
no. ofprojectsb, d, e completed
in 2011
cumulative no. of
pcRs/xaRRs circulatedf
no. of pcRs/xaRRs circulated in 2011f
no. ofppERs
circulatedin 2011f country
Afghanistan 27 2 1 6 4 – AfghanistanArmenia 9 2 – 2 1 – ArmeniaAzerbaijan 11 1 1 6 4 2 AzerbaijanBangladesh 53 4 5 133 5 – BangladeshBhutan 12 – – 17 – – BhutanCambodia 27 3 1 26 7 – CambodiaChina, People’s Republic of 90 – 4 98 7 – China, People’s Republic ofCook Islands 2 – – 13 – – Cook IslandsFiji 3 1 – 11 – 1 FijiGeorgia 8 1 – 3 1 – GeorgiaHong Kong, China – – – 5 – – Hong Kong, ChinaIndia 92 4 4 60 5 1 IndiaIndonesia 33 2 1 213 6 1 IndonesiaKazakhstan 8 – – 13 3 – KazakhstanKiribati 2 1 – 5 – – KiribatiKorea, Republic of – – – 61 – – Korea, Republic ofKyrgyz Republic 12 3 – 22 3 – Kyrgyz RepublicLao People’s Democratic Republic 29 2 2 52 5 – Lao People’s Democratic RepublicMalaysia – – – 56 – – MalaysiaMaldives 6 1 2 11 3 – MaldivesMarshall Islands 2 1 – 10 – – Marshall IslandsMicronesia, Federated States of 2 – – 5 – – Micronesia, Federated States ofMongolia 30 – 1 23 – – MongoliaMyanmar – – – 26 – – MyanmarNauru – – – 1 – – NauruNepal 42 3 1 90 6 – NepalPakistan 29 2 2 158 7 – PakistanPalau 1 – – – – – PalauPapua New Guinea 14 2 – 39 1 – Papua New GuineaPhilippines 18 1 1 144 4 3 PhilippinesSamoa 4 – – 22 – 2 SamoaSingapore – – – 7 – – SingaporeSolomon Islands 5 – 1 15 1 – Solomon IslandsSri Lanka 41 3 5 91 5 1 Sri LankaTaipei,China – – – 1 – – Taipei,ChinaTajikistan 10 – 1 12 – – TajikistanThailand 7 1 – 59 – 1 ThailandTimor-Leste 5 1 – 6 – – Timor-LesteTonga 3 – – 16 – 1 TongaTurkmenistan 1 – – – – – TurkmenistanTuvalu – – – 2 1 – TuvaluUzbekistan 21 3 3 16 4 – UzbekistanVanuatu 2 – – 8 – – VanuatuViet Nam 65 6 6 44 4 – Viet NamRegional 16 1 – 9 4 – Regional
tOtaL 742 51 42 1,617 91 13 tOtaL
– = nil.a Includes policy-based lending/grants and nonsovereign loans, which have been approved but are still awaiting effectivity; excludes projects/loans exclusively financed from other sources.b Supplementary loans/grants are not counted as separate projects.c The portfolio performance rating system is applicable only to sovereign investment projects.d Covers sovereign lending.e Projects which were physically completed in 2011.f Regional projects with loans/grants to multiple countries are reported separately.
Asian Development Bank Annual Report 2011
264

Statistical Annex 14 NUMBER OF PROJECTS UNDER ADMINISTRATION, PROJECTS AT RISK, COMPLETED, AND PROJECT COMPLETION REPORTS (PCRs)/ EXTENDED ANNUAL REVIEW REPORTS (XARRs)/PROJECT/PROGRAM PERFORMANCE EVALUATION REPORTS (PPERs) CIRCULATED (as of 31 December 2011)
country
no. of projectsa, b
under administration
no. ofEffectiveprojects at Riskc
no. ofprojectsb, d, e completed
in 2011
cumulative no. of
pcRs/xaRRs circulatedf
no. of pcRs/xaRRs circulated in 2011f
no. ofppERs
circulatedin 2011f country
Afghanistan 27 2 1 6 4 – AfghanistanArmenia 9 2 – 2 1 – ArmeniaAzerbaijan 11 1 1 6 4 2 AzerbaijanBangladesh 53 4 5 133 5 – BangladeshBhutan 12 – – 17 – – BhutanCambodia 27 3 1 26 7 – CambodiaChina, People’s Republic of 90 – 4 98 7 – China, People’s Republic ofCook Islands 2 – – 13 – – Cook IslandsFiji 3 1 – 11 – 1 FijiGeorgia 8 1 – 3 1 – GeorgiaHong Kong, China – – – 5 – – Hong Kong, ChinaIndia 92 4 4 60 5 1 IndiaIndonesia 33 2 1 213 6 1 IndonesiaKazakhstan 8 – – 13 3 – KazakhstanKiribati 2 1 – 5 – – KiribatiKorea, Republic of – – – 61 – – Korea, Republic ofKyrgyz Republic 12 3 – 22 3 – Kyrgyz RepublicLao People’s Democratic Republic 29 2 2 52 5 – Lao People’s Democratic RepublicMalaysia – – – 56 – – MalaysiaMaldives 6 1 2 11 3 – MaldivesMarshall Islands 2 1 – 10 – – Marshall IslandsMicronesia, Federated States of 2 – – 5 – – Micronesia, Federated States ofMongolia 30 – 1 23 – – MongoliaMyanmar – – – 26 – – MyanmarNauru – – – 1 – – NauruNepal 42 3 1 90 6 – NepalPakistan 29 2 2 158 7 – PakistanPalau 1 – – – – – PalauPapua New Guinea 14 2 – 39 1 – Papua New GuineaPhilippines 18 1 1 144 4 3 PhilippinesSamoa 4 – – 22 – 2 SamoaSingapore – – – 7 – – SingaporeSolomon Islands 5 – 1 15 1 – Solomon IslandsSri Lanka 41 3 5 91 5 1 Sri LankaTaipei,China – – – 1 – – Taipei,ChinaTajikistan 10 – 1 12 – – TajikistanThailand 7 1 – 59 – 1 ThailandTimor-Leste 5 1 – 6 – – Timor-LesteTonga 3 – – 16 – 1 TongaTurkmenistan 1 – – – – – TurkmenistanTuvalu – – – 2 1 – TuvaluUzbekistan 21 3 3 16 4 – UzbekistanVanuatu 2 – – 8 – – VanuatuViet Nam 65 6 6 44 4 – Viet NamRegional 16 1 – 9 4 – Regional
tOtaL 742 51 42 1,617 91 13 tOtaL
– = nil.a Includes policy-based lending/grants and nonsovereign loans, which have been approved but are still awaiting effectivity; excludes projects/loans exclusively financed from other sources.b Supplementary loans/grants are not counted as separate projects.c The portfolio performance rating system is applicable only to sovereign investment projects.d Covers sovereign lending.e Projects which were physically completed in 2011.f Regional projects with loans/grants to multiple countries are reported separately.
Statistical Annexes
265

Statistical Annex 15 TECHNICAL ASSISTANCE GRANT APPROVALS BY COUNTRY AND REGIONAL ACTIVITIES,a, b 1967–2011, 2010, 2011 (amounts in $ thousand)
1967–2011 2010 2011
country no. amount % no.tasF
FinancingJsF
FinancingRciF
FinancingccF
FinancingJFpR
FinancingOther
sources total % no.tasF
FinancingRciF
FinancingccF
FinancingJFpR
FinancingOther
sources total % country
Afghanistan 65 72,497.70 1.61 3 925.00 – – – 1,500.00 – 2,425.00 0.75 2 1,500.00 – – – 1,500.00 3,000.00 0.83 AfghanistanArmenia 8 4,575.00 0.10 – – – – – – – – – 1 700.00 – – – – 700.00 0.19 ArmeniaAzerbaijan 23 13,122.00 0.29 – – – – – – – – – – – – – – – – – AzerbaijanBangladesh 379 212,086.17 4.72 15 5,350.00 – – – 500.00 1,725.00 7,575.00 2.34 16 5,750.00 – – 2,400.00 1,210.00 9,360.00 2.60 Bangladesh
Bhutan 117 49,643.15 1.11 4 2,500.00 – – – – – 2,500.00 0.77 5 1,200.00 – – 1,000.00 500.00 2,700.00 0.75 BhutanBrunei Darussalam 1 600.00c 0.01 – – – – – – – – – – – – – – – – – Brunei DarussalamCambodia 172 126,334.60 2.81 8 5,500.00 – – – – 100.00 5,600.00 1.73 9 4,375.00 – – – 9,100.00 13,475.00 3.75 CambodiaChina, People’s Republic of 663 380,033.31 8.46 40 19,280.00 – – – – 2,892.00 22,172.00 6.84 34 18,764.20 – 1,350.00 – 2,800.00 22,914.20 6.38 China, People’s Republic of
Cook Islands 32 11,395.00 0.25 1 – – – – 300.00 – 300.00 0.09 1 500.00 – – – – 500.00 0.14 Cook IslandsFiji 80 27,349.80 0.61 – – – – – – – – – – – – – – – – – FijiGeorgia 7 6,056.00 0.13 4 1,706.00 – – – – 1,650.00 3,356.00 1.03 1 – – – – 600.00 600.00 0.17 Georgia
India 318 235,223.86 5.24 29 10,550.00 – – – 3,000.00 5,690.00 19,240.00 5.93 25 6,449.00 – 100.00 4,400.00 7,845.00 18,794.00 5.23 IndiaIndonesia 521 351,334.17 7.82 9 1,000.00 – – 2,550.00 2,000.00 53,325.00 58,875.00 18.15 12 225.00 – – 6,500.00 2,825.00 9,550.00 2.66 IndonesiaKazakhstan 62 28,217.00 0.63 1 650.00 – – – – – 650.00 0.20 1 565.00 – – – – 565.00 0.16 KazakhstanKiribati 38 16,315.70 0.36 1 – – – – – 200.00 200.00 0.06 3 800.00 – – – 1,625.00 2,425.00 0.67 Kiribati
Korea, Republic of 33 5,010.15 0.11 – – – – – – – – – – – – – – – – – Korea, Republic ofKyrgyz Republic 77 43,651.40 0.97 1 1,000.00 – – – – – 1,000.00 0.31 2 450.00 – – – – 450.00 0.13 Kyrgyz RepublicLao People’s Democratic Republic 255 139,632.08 3.11 10 3,715.00 – – – 2,680.00 3,050.00 9,445.00 2.91 7 2,255.00 – – 1,700.00 3,600.00 7,555.00 2.10 Lao People’s Democratic Republic
Malaysia 94 26,352.30 0.59 – – – – – – – – – 1 1,000.00 – – – – 1,000.00 0.28 MalaysiaMaldives 60 24,300.00 0.54 1 650.00 – – – – – 650.00 0.20 3 1,125.00 – – – – 1,125.00 0.31 MaldivesMarshall Islands 48 19,882.00 0.44 1 600.00 – – – – – 600.00 0.18 1 300.00 – – – – 300.00 0.08 Marshall Islands
Micronesia, Federated States of 43 25,128.00 0.56 – – – – – – – – – 1 – – – 700.00 – 700.00 0.19 Micronesia, Federated States ofMongolia 157 89,156.65 1.99 10 3,375.00 1,500.00 – – 2,000.00 500.00 7,375.00 2.27 5 11.00 – – 4,200.00 1,000.00 5,211.00 1.45 MongoliaMyanmar 38 10,716.00 0.24 – – – – – – – – – – – – – – – – – Myanmar
Nauru 8 2,146.81 0.05 – – – – – – – – – 1 200.00 – – – – 200.00 0.06 NauruNepal 314 161,893.70 3.61 18 4,460.00 – – 400.00 3,900.00 1,658.00 10,418.00 3.21 14 3,160.00 – – 1,800.00 8,628.00 13,588.00 3.78 NepalPakistan 333 195,951.13 4.36 4 2,170.00 – – – – – 2,170.00 0.67 1 4,000.00 – – – – 4,000.00 1.11 PakistanPalau 5 3,300.00 0.07 – – – – – – – – – – – – – – – – – Palau
Papua New Guinea 148 62,766.12 1.40 3 1,100.00 – – – – 90.00 1,190.00 0.37 4 2,000.00 – – 1,400.00 – 3,400.00 0.95 Papua New GuineaPhilippines 364 192,365.25 4.28 9 1,175.00 700.00 – – 2,700.00 3,430.00 8,005.00 2.47 11 4,875.00 – – 4,500.00 10,200.00 19,575.00 5.45 PhilippinesSamoa 87 28,681.50 0.64 – – – – – – – – – – – – – – – – – Samoa
Singapore 2 577.42 0.01 – – – – – – – – – – – – – – – – – SingaporeSolomon Islands 65 21,170.24 0.47 2 – – – – 800.00 200.00 1,000.00 0.31 3 1,275.00 – – – – 1,275.00 0.35 Solomon IslandsSri Lanka 249 114,788.10 2.56 7 1,400.00 2,000.00 – – 2,500.00 – 5,900.00 1.82 4 2,240.00 – – – 1,850.00 4,090.00 1.14 Sri Lanka
Taipei,China 1 100.00 0.002 – – – – – – – – – – – – – – – – – Taipei,ChinaTajikistan 63 37,661.06 0.84 1 – – – – – 750.00 750.00 0.23 2 1,050.00 – – – 1,250.00 2,300.00 0.64 TajikistanThailand 170 67,469.60 1.50 3 2,300.00 – – – – 500.00 2,800.00 0.86 5 1,550.00 – – 1,500.00 – 3,050.00 0.85 Thailand
Timor-Leste 37 32,310.90 0.72 4 950.00 – – – 825.00 – 1,775.00 0.55 2 1,425.00 – – – – 1,425.00 0.40 Timor-LesteTonga 61 18,741.50 0.42 2 515.00 – – – – – 515.00 0.16 2 675.00 – – 500.00 – 1,175.00 0.33 TongaTurkmenistan 5 1,065.00 0.02 1 350.00 – – – – – 350.00 0.11 – – – – – – – – TurkmenistanTuvalu 20 5,914.75 0.13 – – – – – – – – – – – – – – – – – Tuvalu
Uzbekistan 83 48,150.00 1.07 3 2,350.00 – – – – – 2,350.00 0.72 7 3,245.00 – – 1,500.00 225.00 4,970.00 1.38 UzbekistanVanuatu 59 20,714.76 0.46 1 – – – – 500.00 – 500.00 0.15 2 500.00 – – – 1,500.00 2,000.00 0.56 VanuatuViet Nam 270 242,322.16 5.40 18 8,283.00 – – – 1,000.00 1,800.00 11,083.00 3.42 19 8,595.00 – – 4,300.00 30,500.00 43,395.00 12.07 Viet Nam
All DMCs 5,635 3,176,702.04 70.75 214 81,854.00 4,200.00 – 2,950.00 24,205.00 77,560.00 190,769.00 58.82 207 80,759.20 – 1,450.00 36,400.00 86,758.00 205,367.20 57.14 All DMCsRegional 1,784 1,313,516.43 29.25 117 64,288.15 7,500.00 13,700.00 – 1,181.00 46,899.25 133,568.40 41.18 120 59,523.00 4,350.00 1,950.00 11,011.50 77,187.96 154,022.46 42.86 Regional
tOtaL 7,419 4,490,218.47 100.00 331 146,142.15 11,700.00 13,700.00 2,950.00 25,386.00 124,459.25 324,337.40 100.00 327 140,282.20 4,350.00 3,400.00 47,411.50 163,945.96 359,389.66 100.00 tOtaL
– = nil or data not applicable, CCF = Climate Change Fund, DMC = developing member country, JFPR = Japan Fund for Poverty Reduction, JSF = Japan Special Fund, RCIF = Regional Cooperation and Integration Fund, TASF = Technical Assistance Special Fund.a Excludes technical assistance financed under loans that are included in ADB’s loan data.b Data are adjusted to exclude technical assistance projects withdrawn by governments.c Reimbursable technical assistance.
Asian Development Bank Annual Report 2011
266

Statistical Annex 15 TECHNICAL ASSISTANCE GRANT APPROVALS BY COUNTRY AND REGIONAL ACTIVITIES,a, b 1967–2011, 2010, 2011 (amounts in $ thousand)
1967–2011 2010 2011
country no. amount % no.tasF
FinancingJsF
FinancingRciF
FinancingccF
FinancingJFpR
FinancingOther
sources total % no.tasF
FinancingRciF
FinancingccF
FinancingJFpR
FinancingOther
sources total % country
Afghanistan 65 72,497.70 1.61 3 925.00 – – – 1,500.00 – 2,425.00 0.75 2 1,500.00 – – – 1,500.00 3,000.00 0.83 AfghanistanArmenia 8 4,575.00 0.10 – – – – – – – – – 1 700.00 – – – – 700.00 0.19 ArmeniaAzerbaijan 23 13,122.00 0.29 – – – – – – – – – – – – – – – – – AzerbaijanBangladesh 379 212,086.17 4.72 15 5,350.00 – – – 500.00 1,725.00 7,575.00 2.34 16 5,750.00 – – 2,400.00 1,210.00 9,360.00 2.60 Bangladesh
Bhutan 117 49,643.15 1.11 4 2,500.00 – – – – – 2,500.00 0.77 5 1,200.00 – – 1,000.00 500.00 2,700.00 0.75 BhutanBrunei Darussalam 1 600.00c 0.01 – – – – – – – – – – – – – – – – – Brunei DarussalamCambodia 172 126,334.60 2.81 8 5,500.00 – – – – 100.00 5,600.00 1.73 9 4,375.00 – – – 9,100.00 13,475.00 3.75 CambodiaChina, People’s Republic of 663 380,033.31 8.46 40 19,280.00 – – – – 2,892.00 22,172.00 6.84 34 18,764.20 – 1,350.00 – 2,800.00 22,914.20 6.38 China, People’s Republic of
Cook Islands 32 11,395.00 0.25 1 – – – – 300.00 – 300.00 0.09 1 500.00 – – – – 500.00 0.14 Cook IslandsFiji 80 27,349.80 0.61 – – – – – – – – – – – – – – – – – FijiGeorgia 7 6,056.00 0.13 4 1,706.00 – – – – 1,650.00 3,356.00 1.03 1 – – – – 600.00 600.00 0.17 Georgia
India 318 235,223.86 5.24 29 10,550.00 – – – 3,000.00 5,690.00 19,240.00 5.93 25 6,449.00 – 100.00 4,400.00 7,845.00 18,794.00 5.23 IndiaIndonesia 521 351,334.17 7.82 9 1,000.00 – – 2,550.00 2,000.00 53,325.00 58,875.00 18.15 12 225.00 – – 6,500.00 2,825.00 9,550.00 2.66 IndonesiaKazakhstan 62 28,217.00 0.63 1 650.00 – – – – – 650.00 0.20 1 565.00 – – – – 565.00 0.16 KazakhstanKiribati 38 16,315.70 0.36 1 – – – – – 200.00 200.00 0.06 3 800.00 – – – 1,625.00 2,425.00 0.67 Kiribati
Korea, Republic of 33 5,010.15 0.11 – – – – – – – – – – – – – – – – – Korea, Republic ofKyrgyz Republic 77 43,651.40 0.97 1 1,000.00 – – – – – 1,000.00 0.31 2 450.00 – – – – 450.00 0.13 Kyrgyz RepublicLao People’s Democratic Republic 255 139,632.08 3.11 10 3,715.00 – – – 2,680.00 3,050.00 9,445.00 2.91 7 2,255.00 – – 1,700.00 3,600.00 7,555.00 2.10 Lao People’s Democratic Republic
Malaysia 94 26,352.30 0.59 – – – – – – – – – 1 1,000.00 – – – – 1,000.00 0.28 MalaysiaMaldives 60 24,300.00 0.54 1 650.00 – – – – – 650.00 0.20 3 1,125.00 – – – – 1,125.00 0.31 MaldivesMarshall Islands 48 19,882.00 0.44 1 600.00 – – – – – 600.00 0.18 1 300.00 – – – – 300.00 0.08 Marshall Islands
Micronesia, Federated States of 43 25,128.00 0.56 – – – – – – – – – 1 – – – 700.00 – 700.00 0.19 Micronesia, Federated States ofMongolia 157 89,156.65 1.99 10 3,375.00 1,500.00 – – 2,000.00 500.00 7,375.00 2.27 5 11.00 – – 4,200.00 1,000.00 5,211.00 1.45 MongoliaMyanmar 38 10,716.00 0.24 – – – – – – – – – – – – – – – – – Myanmar
Nauru 8 2,146.81 0.05 – – – – – – – – – 1 200.00 – – – – 200.00 0.06 NauruNepal 314 161,893.70 3.61 18 4,460.00 – – 400.00 3,900.00 1,658.00 10,418.00 3.21 14 3,160.00 – – 1,800.00 8,628.00 13,588.00 3.78 NepalPakistan 333 195,951.13 4.36 4 2,170.00 – – – – – 2,170.00 0.67 1 4,000.00 – – – – 4,000.00 1.11 PakistanPalau 5 3,300.00 0.07 – – – – – – – – – – – – – – – – – Palau
Papua New Guinea 148 62,766.12 1.40 3 1,100.00 – – – – 90.00 1,190.00 0.37 4 2,000.00 – – 1,400.00 – 3,400.00 0.95 Papua New GuineaPhilippines 364 192,365.25 4.28 9 1,175.00 700.00 – – 2,700.00 3,430.00 8,005.00 2.47 11 4,875.00 – – 4,500.00 10,200.00 19,575.00 5.45 PhilippinesSamoa 87 28,681.50 0.64 – – – – – – – – – – – – – – – – – Samoa
Singapore 2 577.42 0.01 – – – – – – – – – – – – – – – – – SingaporeSolomon Islands 65 21,170.24 0.47 2 – – – – 800.00 200.00 1,000.00 0.31 3 1,275.00 – – – – 1,275.00 0.35 Solomon IslandsSri Lanka 249 114,788.10 2.56 7 1,400.00 2,000.00 – – 2,500.00 – 5,900.00 1.82 4 2,240.00 – – – 1,850.00 4,090.00 1.14 Sri Lanka
Taipei,China 1 100.00 0.002 – – – – – – – – – – – – – – – – – Taipei,ChinaTajikistan 63 37,661.06 0.84 1 – – – – – 750.00 750.00 0.23 2 1,050.00 – – – 1,250.00 2,300.00 0.64 TajikistanThailand 170 67,469.60 1.50 3 2,300.00 – – – – 500.00 2,800.00 0.86 5 1,550.00 – – 1,500.00 – 3,050.00 0.85 Thailand
Timor-Leste 37 32,310.90 0.72 4 950.00 – – – 825.00 – 1,775.00 0.55 2 1,425.00 – – – – 1,425.00 0.40 Timor-LesteTonga 61 18,741.50 0.42 2 515.00 – – – – – 515.00 0.16 2 675.00 – – 500.00 – 1,175.00 0.33 TongaTurkmenistan 5 1,065.00 0.02 1 350.00 – – – – – 350.00 0.11 – – – – – – – – TurkmenistanTuvalu 20 5,914.75 0.13 – – – – – – – – – – – – – – – – – Tuvalu
Uzbekistan 83 48,150.00 1.07 3 2,350.00 – – – – – 2,350.00 0.72 7 3,245.00 – – 1,500.00 225.00 4,970.00 1.38 UzbekistanVanuatu 59 20,714.76 0.46 1 – – – – 500.00 – 500.00 0.15 2 500.00 – – – 1,500.00 2,000.00 0.56 VanuatuViet Nam 270 242,322.16 5.40 18 8,283.00 – – – 1,000.00 1,800.00 11,083.00 3.42 19 8,595.00 – – 4,300.00 30,500.00 43,395.00 12.07 Viet Nam
All DMCs 5,635 3,176,702.04 70.75 214 81,854.00 4,200.00 – 2,950.00 24,205.00 77,560.00 190,769.00 58.82 207 80,759.20 – 1,450.00 36,400.00 86,758.00 205,367.20 57.14 All DMCsRegional 1,784 1,313,516.43 29.25 117 64,288.15 7,500.00 13,700.00 – 1,181.00 46,899.25 133,568.40 41.18 120 59,523.00 4,350.00 1,950.00 11,011.50 77,187.96 154,022.46 42.86 Regional
tOtaL 7,419 4,490,218.47 100.00 331 146,142.15 11,700.00 13,700.00 2,950.00 25,386.00 124,459.25 324,337.40 100.00 327 140,282.20 4,350.00 3,400.00 47,411.50 163,945.96 359,389.66 100.00 tOtaL
– = nil or data not applicable, CCF = Climate Change Fund, DMC = developing member country, JFPR = Japan Fund for Poverty Reduction, JSF = Japan Special Fund, RCIF = Regional Cooperation and Integration Fund, TASF = Technical Assistance Special Fund.a Excludes technical assistance financed under loans that are included in ADB’s loan data.b Data are adjusted to exclude technical assistance projects withdrawn by governments.c Reimbursable technical assistance.
Statistical Annexes
267

Statistical Annex 16 TECHNICAL ASSISTANCE GRANT APPROVALS, 2011 (amounts in $ thousand)
ta type sector tasF RciF ccF JFpR Others source total
afghanistanRural Finance Expansion CD FIN 1,500.00 – – – – 1,500.00Supporting Natural Resources Operations CD ANR – – – – 1,500.00 NET–WFPF 1,500.00
Subtotal 1,500.00 – – – 1,500.00 3,000.00
armeniaSolid Waste Management Improvement Investment Program PP WMS 700.00 – – – – 700.00
Subtotal 700.00 – – – – 700.00
BangladeshCapital Market Development Program II PP FIN 600.00 – – – – 600.00Supporting the Khulna Water Supply Project CD WMS 700.00 – – – – 700.00Support for Climate Change Mitigation and
Renewable Energy Development CD ENE 500.00 – – – – 500.00Road Safety Improvement Programs PA TAI 600.00 – – – – 600.00Capacity Development for Bangladesh Bank CD FIN 500.00 – – – – 500.00Climate Change Capacity Building and Knowledge Management CD MUL – – – – 500.00 SCF-PPCR 500.00Power System Efficiency Improvement II PP ENE 700.00 – – – – 700.00Strengthening the Resilience of the Urban Water Supply,
Drainage, and Sanitation to Climate Change in Coastal Towns CD WMS – – – 700.00 – 700.00Climate Resilient Infrastructure Improvement in Coastal Zone PP ANR – – – – 600.00 SCF-PPCR 600.00Governance and Capacity Development CD PSM 200.00 – – – – 200.00Public Private Partnership in Higher Education CD EDU 225.00 – – – – 225.00Strategic Master Plan for Chittagong Port PA TAI – – – 1,000.00 – 1,000.00Skills for Employment PP EDU – – – 700.00 – 700.00Industrial Energy Efficiency Finance Program PP ENE 1,500.00 – – – – 1,500.00Consolidation of Knowledge on Governance Initiatives CD PSM 225.00 – – – – 225.00Capacity Building of the Anti Corruption Commission CD PSM – – – – 110.00 Denmark 110.00
Subtotal 5,750.00 – – 2,400.00 1,210.00 9,360.00
BhutanRoad Network II (Additional Financing) PP TAI 600.00 – – – – 600.00Developing a Revenue Administration Management
Information System CD PSM – – – – 500.00 EAKPF 500.00Green Power Development II PP ENE – – – 1,000.00 – 1,000.00Third Bhutan Living Standards Survey CD PSM 300.00 – – – – 300.00Strengthening Air Transport Regulatory and
Operational Performance CD TAI 300.00 – – – – 300.00
Subtotal 1,200.00 – – 1,000.00 500.00 2,700.00
cambodiaSupporting Policy and Institutional Reforms and Capacity
Development in the Water Sector (Supplementary) CD ANR – – – – 8,300.00 NDF/Australia
8,300.00
Enhance Project Readiness and Effectiveness CD MUL 225.00 – – – – 225.00Promoting Economic Diversification Subprogram 3 PP PSM 700.00 – – – – 700.00Climate Resilient Rice Commercialization Sector
Development Program PP ANR 1,000.00 – – – 500.00 SCF-PPCR 1,500.00Implementing Subprogram 2 of the Third Financial
Sector Program CD FIN 800.00 – – – 300.00 RTFSI 1,100.00Strengthening Knowledge Solutions for the
Cambodia–ADB Partnership PA PSM 225.00 – – – – 225.00Integrated Urban Environmental Management in the
Tonle Sap Basin PP WMS 700.00 – – – – 700.00
– = nil or data not applicable, ANR = agriculture and natural resources, CCF = Climate Change Fund, CD = capacity and development, EAKPF = Korea e-Asia and Knowledge Partnership Fund, EDU = education, ENE = energy, FIN = finance, JFPR = Japan Fund for Poverty Reduction, MUL = multisector, NDF = Nordic Development Fund, NET–WFPF = Netherlands Trust Fund for the Water Financing Partnership Facility, PA = policy and advisory, PP = project preparatory, PSM = public sector management, RCIF = Regional Cooperation and Integration Fund, RTFSI = Cooperation Fund for Regional Trade and Financial Security Initiative, SCF-PPCR = Strategic Climate Fund-Pilot Program for Climate Resilience, TA = technical assistance, TAI = transport and ICT (information and communication technology), TASF = Technical Assistance Special Fund, WMS = water supply and other municipal infrastructure and services.
Asian Development Bank Annual Report 2011
268

ta type sector tasF RciF ccF JFpR Others source total
Supporting Strengthening and Institutional Reform for the Department of Land Transport of the Ministry of Public Works and Transport CD TAI 500.00 – – – – 500.00
Support for Public–Private Partnerships in Cambodia PA PSM 225.00 – – – – 225.00
Subtotal 4,375.00 – – – 9,100.00 13,475.00
people’s Republic of chinaStrengthening the Capacity of the Judiciary to Implement
Economic Laws (Supplementary) CD PSM 14.20 – – – – 14.20Chongqing–Guiyang Railway Development (Supplementary) PP TAI 320.00 – – – – 320.00Policy Study on Government Public Expenditure in Agricultural
Production (Supplementary) PA ANR 200.00 – – – – 200.00Hebei Energy Efficiency Improvement and Emission Reduction PP ENE 700.00 – – – – 700.00Development of Energy Manager Program for Energy
Conservation in Shandong CD ENE – – – – 1,000.00 CEF 1,000.00Developing a Legal System for the Credit Market PA FIN 450.00 – – – – 450.00Urban Stormwater Management and Waterlogging
Disaster Prevention PA WMS 400.00 – – – – 400.00Gansu Jiuquan Integrated Urban Environment Improvement PP MUL 650.00 – – – – 650.00Management System and Legislative Mechanism for
Nonprofit Organizations PA PSM 400.00 – – – – 400.00Chongqing Urban and Rural Infrastructure Development II PP MUL 700.00 – – – – 700.00Managing the Water Resources of Boyang Lake PA ANR 200.00 – 800.00 – – 1,000.00Strengthening Institutional Reform and Capacity Building PA PSM 500.00 – – – – 500.00Yunnan Chuxiong Urban Environment Improvement PP MUL 700.00 – – – – 700.00Public Finance and Financial Management Reforms PA PSM 1,200.00 – – – – 1,200.00Strategies for Green Jobs Creation and Promotion PA PSM 400.00 – – – – 400.00Xinjiang Integrated Urban Development PP MUL 700.00 – – – – 700.00Innovations in Administrative Functions of Environmental
Protection and Human Resources Development PA ANR 450.00 – – – – 450.00Improving Energy Efficiency and Reducing Emissions through
Intelligent Railway Station Buildings PA TAI 400.00 – – – – 400.00Developing Multimodal Passenger Transport Hubs PA TAI 500.00 – – – – 500.00Sustainable Provincial Development Strategy for Guangdong
Province Focused on Environmental Improvement in Rural Areas and Small Cities PA ANR 400.00 – – – – 400.00
Promoting Market Innovation in Developing Social Infrastructure: Old Age Caring PP HSP 900.00 – – – – 900.00
Nonpoint Source Pollution Control in Catchment Areas PA ANR 480.00 – – – – 480.00Developing Tianjin Emission Trading System CD ENE 200.00 – 550.00 – – 750.00Yunnan Sustainable Road Maintenance PP TAI 800.00 – – – – 800.00Enhancing the Energy Regulation System for
Low-Carbon Development PA ENE 400.00 – – – – 400.00Jiangxi Ji’an Sustainable Urban Transport PP TAI 700.00 – – – – 700.00Promoting Partnerships for South–South Cooperation PA MUL 750.00 – – – – 750.00Yuxi–Mohan Subregional Railway Link PP TAI 800.00 – – – – 800.00Beijing Sustainable Urban Transport PA TAI 450.00 – – – – 450.00Technical and Vocational Education and Training Demonstration PP EDU 1,100.00 – – – – 1,100.00Capacity Development for Green Growth Demonstration CD ANR 1,000.00 – – – – 1,000.00Anhui Intermodal Sustainable Transport Development PP TAI 1,000.00 – – – – 1,000.00Study on Carbon Capture and Storage in Natural Gas-Based
Power Plants CD ENE – – – – 1,800.00 CCS 1,800.00Hubei–Yichang Sustainable Urban Transport PP TAI 900.00 – – – – 900.00
Subtotal 18,764.20 – 1,350.00 – 2,800.00 22,914.20
– = nil or data not applicable, ANR = agriculture and natural resources, CCF = Climate Change Fund, CCS = Carbon Capture and Storage Fund, CD = capacity development, CEF = Clean Energy Fund, EDU = education, ENE = energy, FIN = finance, HSP = health and social protection, JFPR = Japan Fund for Poverty Reduction, MUL = multisector, PA = policy and advisory, PP = project preparatory, PSM = public sector management, RCIF = Regional Cooperation and Integration Fund, TA = technical assistance, TAI = transport and ICT (information and communication technology), TASF = Technical Assistance Special Fund, WMS = water supply and other municipal infrastructure and services.
CONTINUED
Statistical Annexes
269

ta type sector tasF RciF ccF JFpR Others source total
cook islandsImplementing Public Sector Reforms CD PSM 500.00 – – – – 500.00
Subtotal 500.00 – – – – 500.00
georgiaDeveloping a Geospatial Urban Water Supply and Sanitation
Utility Management System (Supplementary) CD WMS – – – – 600.00 SPCF 600.00
Subtotal – – – – 600.00 600.00
indiaAdvanced Project Preparedness for Poverty Reduction –
Water Users Association Empowerment for Improved Irrigation Management in Chhattisgarh (Subproject 5) (Supplementary) CD ANR – – – – 100.00 United
Kingdom100.00
Developing the Power System Master Plan for Bihar (Supplementary) CD ENE 24.00 – – – – 24.00
Capacity Development to Enhance Project Readiness and Results Monitoring for Transport Projects (Supplementary) CD TAI 600.00 – – – – 600.00
Himachal Pradesh Clean Energy Transmission Investment Program PP ENE – – – 500.00 – 500.00Capacity Building for Road Safety and Public–Private Participation
(PPP) Support CD TAI 1,000.00 – – – – 1,000.00Capacity Building for Commercial Bank Lending for
Solar Energy Projects CD ENE 500.00 – – – 750.00 ACEF 1,250.00Advanced Project Preparedness for Poverty Reduction –
Rajasthan Solar Park Capacity Development (Subproject 13) CD ENE – – – – 500.00 United Kingdom
500.00
Advanced Project Preparedness for Poverty Reduction – Gujarat Solar Vocational Training and Livelihoods (Subproject 14) CD ENE – – – – 400.00 United
Kingdom400.00
Development of International Center for Application of Solar Energy Technologies CD ENE – – – 2,000.00 – 2,000.00
Enhancing Readiness of the Railway Sector Investment Program as a Clean Development Mechanism Project CD TAI 300.00 – – – – 300.00
Enhancing Energy-Based Livelihoods for Women Micro-Entrepreneurs CD ENE 1,000.00 – – – – 1,000.00
Capacity Building for North Eastern State Roads Sector CD TAI – – – 1,200.00 – 1,200.00Advanced Project Preparedness for Poverty Reduction – Capacity
Building and Institutional Strengthening for the Assam Urban Infrastructure Investment Program (Subproject 15) CD WMS – – – – 600.00 United
Kingdom600.00
Himachal Pradesh Power Sector Capacity Development and Implementation Support CD ENE 600.00 – – – – 600.00
Advanced Project Preparedness for Poverty Reduction – Capacity Building for Bihar Urban Infrastructure Development (Subproject 16) CD WMS – – – – 600.00 United
Kingdom600.00
Advanced Project Preparedness for Poverty Reduction – Supporting Clean Village Environments for MDGs (Subproject 17) CD HSP – – – – 600.00 United
Kingdom600.00
Support to Jawaharlal Nehru National Solar Mission CD ENE 225.00 – – – – 225.00Introducing Best Practices for Septage Management CD WMS – – – 700.00 – 700.00Karnataka Integrated and Sustainable Water Resources
Management Investment Program PP ANR 1,100.00 – 100.00 – – 1,200.00Advanced Project Preparedness for Poverty Reduction –
West Bengal North South Road Corridor (Subproject 18) PP TAI – – – – 1,100.00 United Kingdom
1,100.00
CONTINUED
– = nil or data not applicable, ACEF = Asian Clean Energy Fund, ANR = agriculture and natural resources, CCF = Climate Change Fund, CD = capacity development, ENE = energy, HSP = health and social protection, JFPR = Japan Fund for Poverty Reduction, MDG = millennium development goal, PP = project preparatory, PSM = public sector management, RCIF = Regional Cooperation and Integration Fund, SPCF = Spanish Cooperation Fund for Technical Assistance, TA = technical assistance, TAI = transport and ICT (information and communication technology), TASF = Technical Assistance Special Fund, WMS = water supply and other municipal infrastructure and services.
Asian Development Bank Annual Report 2011
270

ta type sector tasF RciF ccF JFpR Others source total
Advanced Project Preparedness for Poverty Reduction – Designing and Capacity Building for Strengthening State Finances and Service Delivery in West Bengal (Subproject 21) PP PSM – – – – 220.00 United
Kingdom220.00
Skills Development for Inclusive Growth CD EDU 1,100.00 – – – – 1,100.00Advanced Project Preparedness for Poverty Reduction –
State Roads (Subproject 20) PP TAI – – – – 2,000.00 United Kingdom
2,000.00
Advanced Project Preparedness for Poverty Reduction – Rajasthan Renewable Energy Transmission Program (Subproject 19) PP ENE – – – – 225.00 United
Kingdom225.00
Advanced Project Preparedness for Poverty Reduction – Rajasthan Urban Development Program (Subproject 22) PP WMS – – – – 750.00 United
Kingdom750.00
Subtotal 6,449.00 – 100.00 4,400.00 7,845.00 18,794.00
indonesiaGeothermal Power Development (Supplementary) PP ENE – – – – 225.00 Australia 225.00Strengthening National Public Procurement Processes
(Supplementary) CD PSM 225.00 – – – – 225.00Supporting Water Operators’ Partnerships (Supplementary) CD WMS – – – – 425.00 Australia 425.00Preparation of the Forest Investment Strategy CD ANR – – – – 225.00 SCF-FIP 225.00Institutional Capacity Building of Indonesia Eximbank CD FIN – – – – 1,450.00 ACEF/FSDP 1,450.00Strengthening Sanitation Planning and Efficiency Improvement CD MUL – – – 1,000.00 – 1,000.00Water Resources and River Basin Management CD ANR – – – 1,800.00 – 1,800.00Integrated Citarum Water Resources Management Investment
Program Periodic Financing Request 2 PP ANR – – – 1,500.00 – 1,500.00Implementing Effective Climate Change Adaptation Policy CD MUL – – – 700.00 – 700.00Water Supply and Sanitation Sector Development CD WMS – – – – 500.00 EAKPF 500.00Improving Domestic Connectivity PA TAI – – – 500.00 – 500.00Metropolitan Sanitation Management and Health II PP WMS – – – 1,000.00 – 1,000.00
Subtotal 225.00 – – 6,500.00 2,825.00 9,550.00
KazakhstanAstana Light Rail Transit PP TAI 565.00 – – – – 565.00
Subtotal 565.00 – – – – 565.00
KiribatiEconomic Management and Public Sector Reform
(Supplementary) CD PSM – – – – 1,500.00 Australia 1,500.00Tarawa Sanitation Improvement (Supplementary) PP WMS – – – – 125.00 Australia 125.00Strengthened Public Financial Management CD PSM 800.00 – – – – 800.00
Subtotal 800.00 – – – 1,625.00 2,425.00
Kyrgyz RepublicEnabling Identification of Public–Private Partnership Projects and
Capacity Building in the Kyrgyz Republic CD MUL 225.00 – – – – 225.00Support for Strategic Assessment of the Kyrgyz Economy to
Promote Inclusive Growth PA PSM 225.00 – – – – 225.00
Subtotal 450.00 – – – – 450.00
Lao people’s Democratic RepublicNational Integrated Water Resources Management Support CD ANR 300.00 – – – 3,600.00 Australia/
SPCF3,900.00
Strengthening the Capacity of the State Audit Organization CD PSM 750.00 – – – – 750.00Renewable Energy Development in Remote Communities PP ENE – – – 1,000.00 – 1,000.00
CONTINUED
– = nil or data not applicable, ACEF = Asian Clean Energy Fund, ANR = agriculture and natural resources, CCF = Climate Change Fund, CD = capacity development, EAKPF = Republic of Korea e-Asia and Knowledge Partnership Fund, EDU = education, ENE = energy, FIN = finance, FSDP = Financial Sector Development Partnership Fund, JFPR = Japan Fund for Poverty Reduction, MUL = multisector, PA = policy and advisory, PP = project preparatory, PSM = public sector management, RCIF = Regional Cooperation and Integration Fund, SCF-FIP = Strategic Climate Fund-Forest Investment Program, SPCF = Spanish Cooperation Fund for Technical Assistance, TA = technical assistance, TAI = transport and ICT (information and communication technology), TASF = Technical Assistance Special Fund, WMS = water supply and other municipal infrastructure and services.
Statistical Annexes
271

ta type sector tasF RciF ccF JFpR Others source total
Strengthening Biodiversity Protection and Management in the Nam Ngum 3 Hydropower Project CD ENE 500.00 – – – – 500.00
Strengthening Urban Water Supply Regulation CD WMS 500.00 – – – – 500.00Vientiane Sustainable Urban Transport PP TAI – – – 700.00 – 700.00Strengthening Capacity for Enhanced Operational Effectiveness CD PSM 205.00 – – – – 205.00
Subtotal 2,255.00 – – 1,700.00 3,600.00 7,555.00
MalaysiaSupporting the Tenth Malaysia Plan, 2011–2015 CD MUL 1,000.00 – – – – 1,000.00
Subtotal 1,000.00 – – – – 1,000.00
MaldivesInstitutional Strengthening for Economic Management
(Supplementary) CD PSM 225.00 – – – – 225.00Developing the Revenue Administration Management
Information System CD PSM 500.00 – – – – 500.00Capacity Development of the Maldives Energy Authority CD ENE 400.00 – – – – 400.00
Subtotal 1,125.00 – – – – 1,125.00
Marshall islandsSupporting the Public Sector Program (Supplementary) PA PSM 300.00 – – – – 300.00
Subtotal 300.00 – – – – 300.00
Micronesia, Federated states ofStrengthening Infrastructure Planning and Implementation CD MUL – – – 700.00 – 700.00
Subtotal – – – 700.00 – 700.00
MongoliaStrengthening Higher and Vocational Education (Supplementary) PP EDU 11.00 – – – – 11.00Road Sector Capacity Development CD TAI – – – 2,000.00 – 2,000.00Fifth Health Sector Development PP HSP – – – 700.00 – 700.00Ulaanbaatar Urban Services and Ger Areas Development
Investment Program PP WMS – – – 1,500.00 – 1,500.00Government Bond Market Development PA FIN – – – – 1,000.00 EAKPF/FSDP 1,000.00
Subtotal 11.00 – – 4,200.00 1,000.00 5,211.00
nauruRegulatory and Governance Reform for Improving Water and
Electricity Supply in Nauru CD WMS 200.00 – – – – 200.00
Subtotal 200.00 – – – – 200.00
nepalStrengthening the Town Development Fund Capacity for
Public–Private Partnership (Supplementary) CD PSM 60.00 – – – – 60.00Support for the Implementation of School Sector Reform
Program (Supplementary) CD EDU – – – – 190.00 Denmark 190.00Improving Access to Finance Sector Development Program PP FIN – – – 600.00 – 600.00Scaling Up Small Hydro Power Projects PA ENE – – – – 160.00 SCF-SREP 160.00Scaling Up Micro and Mini Renewable Energy Initiatives PA ENE – – – – 215.00 SCF-SREP 215.00Building Climate Resilience of Watersheds in Mountain
Eco-Regions PP ANR – – – – 900.00 SCF-PPCR 900.00Gender-Focused Capacity Development in Clean Energy CD ENE 250.00 – – – – 250.00Capacity Development for School Sector Program
Implementation CD EDU 500.00 – – – – 500.00Kathmandu Valley Urban Environment Improvement PP WMS – – – 700.00 – 700.00
CONTINUED
– = nil or data not applicable, ANR = agriculture and natural resources, CCF = Climate Change Fund, CD = capacity development, EAKPF = Republic of Korea e-Asia and Knowledge Partnership Fund, EDU = education, ENE = energy, FIN = finance, FSDP = Financial Sector Development Partnership Fund, HSP = health and social protection, JFPR = Japan Fund for Poverty Reduction, MUL = multisector, PA = policy and advisory, PP = project preparatory, PSM = public sector management, RCIF = Regional Cooperation and Integration Fund, SCF-PPCR = Strategic Climate Fund-Pilot Program for Climate Resilience, SCF-SREP = Strategic Climate Fund-Scaling Up Renewable Energy Program in Low Income Countries, TA = technical assistance, TAI = transport and ICT (information and communication technology), TASF = Technical Assistance Special Fund, WMS = water supply and other municipal infrastructure and services.
Asian Development Bank Annual Report 2011
272

ta type sector tasF RciF ccF JFpR Others source total
Urban Transport Planning and Management CD TAI 800.00 – – – – 800.00Skills Development PP EDU – – – 500.00 – 500.00Strengthening Higher Engineering Education CD EDU 550.00 – – – – 550.00Strengthening Municipalities for Urban Service Delivery CD WMS 1,000.00 – – – – 1,000.00Mainstreaming Climate Change Risk Management
in Development CD MUL – – – – 7,163.00 SCF-PPCR 7,163.00
Subtotal 3,160.00 – – 1,800.00 8,628.00 13,588.00
pakistanCapacity Building for the Flood Emergency Reconstruction Project CD MUL 4,000.00 – – – – 4,000.00
Subtotal 4,000.00 – – – – 4,000.00
papua new guineaFacilitating Public–Private Partnerships CD PSM – – – 800.00 – 800.00Port Moresby Power Grid Development PP ENE 1,200.00 – – – – 1,200.00Maritime and Waterways Safety PP TAI – – – 600.00 – 600.00Major Bridges Study PA TAI 800.00 – – – – 800.00
Subtotal 2,000.00 – – 1,400.00 – 3,400.00
philippinesRural Community-Based Renewable Energy Development in
Mindanao PA ENE – – – – 2,000.00 ACEF 2,000.00Strengthening Public–Private Partnerships in the Philippines CD PSM 1,500.00 – – – 8,200.00 Canada/
Australia9,700.00
Results-Oriented Strategic Planning and Development Management for Inclusive Growth CD PSM – – – 1,000.00 – 1,000.00
Support to Local Government Revenue Generation and Land Administration Reforms CD PSM – – – 1,500.00 – 1,500.00
Strengthening Institutions for an Improved Investment Climate PA IAT – – – 1,000.00 – 1,000.00Strategic Policy Actions for Successful Structural Transformation
and Inclusive Growth PA IAT 225.00 – – – – 225.00Education Improvement Sector Development Program PP EDU 1,500.00 – – – – 1,500.00Single Well Engineered Electrical Turbine System (SWEETS)
Geothermal Power PP ENE 425.00 – – – – 425.00Capacity Development for the Judiciary and
Justice Sector Agencies CD PSM 1,000.00 – – – – 1,000.00Capacity Development of Financial Regulators CD FIN – – – 1,000.00 – 1,000.00Developing a Public–Private Earthquake Pool in the Philippines CD FIN 225.00 – – – – 225.00
Subtotal 4,875.00 – – 4,500.00 10,200.00 19,575.00
solomon islandsState-Owned Enterprise Reform CD PSM 225.00 – – – – 225.00Supporting the Implementation of the National
Development Strategy CD PSM 600.00 – – – – 600.00Renewable Energy for Telecom Networks CD TAI 450.00 – – – – 450.00
Subtotal 1,275.00 – – – – 1,275.00
sri LankaImplementation of Energy Efficiency Policy Initiatives CD ENE – – – – 1,850.00 ACEF 1,850.00Clean Energy and Network Efficiency Improvement PP ENE 1,000.00 – – – – 1,000.00Colombo Water Supply Service Improvement PP WMS 700.00 – – – – 700.00Local Government Service Enhancement CD WMS 540.00 – – – – 540.00
Subtotal 2,240.00 – – – 1,850.00 4,090.00
CONTINUED
– = nil or data not applicable, ACEF = Asian Clean Energy Fund, CCF = Climate Change Fund, CD = capacity development, EDU = education, ENE = energy, FIN = finance, IAT = industry and trade, JFPR = Japan Fund for Poverty Reduction, MUL = multisector, PA = policy and advisory, PP = project preparatory, PSM = public sector management, RCIF = Regional Cooperation and Integration Fund, SCF-PPCR = Strategic Climate Fund-Pilot Program for Climate Resilience, TA = technical assistance, TAI = transport and ICT (information and communication technology), TASF = Technical Assistance Special Fund, WMS = water supply and other municipal infrastructure and services.
Statistical Annexes
273

ta type sector tasF RciF ccF JFpR Others source total
tajikistanStrengthening Public Resource Management Program PA PSM 600.00 – – – 500.00 EAKPF 1,100.00Building Climate Resilience in the Pyanj River Basin PP ANR 450.00 – – – 750.00 SCF-PPCR 1,200.00
Subtotal 1,050.00 – – – 1,250.00 2,300.00
thailandWaste to Energy PP ENE 500.00 – – – – 500.00Enhancing Strategic Alignment in the Thailand–ADB Partnership PA MUL 225.00 – – – – 225.00Southern Thailand Water Supply System PP WMS 600.00 – – – – 600.00Support for Thailand’s Flood Management Knowledge Forum PA MUL 225.00 – – – – 225.00Development of a Strategic Framework for Financial Inclusion PA FIN – – – 1,500.00 – 1,500.00
Subtotal 1,550.00 – – 1,500.00 – 3,050.00
timor-LesteDistrict Capital Power Distribution PP ENE 225.00 – – – – 225.00Strengthening Water Sector Management and Service Delivery CD WMS 1,200.00 – – – – 1,200.00
Subtotal 1,425.00 – – – – 1,425.00
tongaOuter Island Renewable Energy PP ENE – – – 500.00 – 500.00Implementing Strategic Economic Management CD PSM 675.00 – – – – 675.00
Subtotal 675.00 – – 500.00 – 1,175.00
UzbekistanCASAREM–Talimarjan Power Generation and Transmission
(Supplementary) PP ENE 600.00 – – – – 600.00CAREC Corridor 2 Road Investment Program II PP TAI 220.00 – – – – 220.00Railway Electrification Investment Program PP TAI 225.00 – – – – 225.00Design and Strengthening of the Solar Energy Institute CD ENE – – – – 225.00 SPCF 225.00Amu Bukhara Irrigation System Rehabilitation PP ANR – – – 1,500.00 – 1,500.00Solid Waste Management Investment Program PP WMS 700.00 – – – – 700.00Solar Energy Development PA ENE 1,500.00 – – – – 1,500.00
Subtotal 3,245.00 – – 1,500.00 225.00 4,970.00
VanuatuPort Vila Urban Development (Supplementary) PP WMS – – – – 500.00 Australia 500.00Establishment of the Maritime Safety Administration CD TAI 500.00 – – – 1,000.00 New Zealand 1,500.00
Subtotal 500.00 – – – 1,500.00 2,000.00
Viet namSupport for Public–Private Development of the O Mon Thermal
Power Complex (Supplementary) PP ENE 200.00 – – – – 200.00Da Nang Water Supply (Supplementary) PP WMS 750.00 – – – – 750.00Capacity Building for River Basin Water Resources Planning
(Supplementary) CD ANR 420.00 – – – – 420.00Support for the National Target Program on Climate Change
with a Focus on Energy and Transport PA ENE – – – – 2,500.00 NDF 2,500.00Central Mekong Delta Region Connectivity CD TAI – – – – 26,000.00 Australia 26,000.00Secondary Cities Development PP WMS 1,000.00 – – – – 1,000.00Implementation and Monitoring of Song Bung 4 Hydropower
Project Resettlement and Ethnic Minority Development Plan CD ENE 225.00 – – – – 225.00Support to Central and Local Governments to Implement Urban
Environmental Improvement Programs CD WMS – – – 2,000.00 – 2,000.00
CONTINUED
– = nil or data not applicable, ANR = agriculture and natural resources, CAREC = Central Asia Regional Economic Cooperation, CASAREM = Central Asia–South Asia Regional Electricity Market, CCF = Climate Change Fund, CD = capacity development, EAKPF = Korea e-Asia and Knowledge Partnership Fund, ENE = energy, FIN = finance, JFPR = Japan Fund for Poverty Reduction, MUL = multisector, NDF = Nordic Development Fund, PA = policy and advisory, PP = project preparatory, PSM = public sector management, RCIF = Regional Cooperation and Integration Fund, SCF-PPCR = Strategic Climate Fund-Pilot Program for Climate Resilience, SPCF = Spanish Cooperation Fund for Technical Assistance, TA = technical assistance, TAI = transport and ICT (information and communication technology), TASF = Technical Assistance Special Fund, WMS = water supply and other municipal infrastructure and services.
Asian Development Bank Annual Report 2011
274

ta type sector tasF RciF ccF JFpR Others source total
Sustainable Urban Transport for Ho Chi Minh City MRT Line 2 PP TAI – – – – 1,000.00 CTF 1,000.00Strengthening Sustainable Urban Transport for Ha Noi
Metro Line 3 PP TAI – – – – 1,000.00 CTF 1,000.00Financial Sector Deepening Program – Subprogram 1 PP FIN 600.00 – – – – 600.00Improvement of Road Safety and Climate Resilience on
National Highways PP TAI – – – 1,500.00 – 1,500.00Second Greater Mekong Subregion Southern Coastal Corridor
(Additional Financing) PP TAI 1,000.00 – – – – 1,000.00Water Resources Development in the Mid- and Northeast Red
River Delta PP ANR – – – 800.00 – 800.00Energy Efficiency in the Industry PP ENE 800.00 – – – – 800.00Productive Rural Infrastructure Development
in the Central Highlands PP ANR 1,000.00 – – – – 1,000.00Second Health Care in the Central Highlands PP HSP 600.00 – – – – 600.00Strengthening Support for State-Owned Enterprise Reform and
Corporate Governance Facilitation Program CD PSM 1,200.00 – – – – 1,200.00Support to Improve Portfolio Performance and Aid Effectiveness CD PSM 800.00 – – – – 800.00
Subtotal 8,595.00 – – 4,300.00 30,500.00 43,395.00
all DMcs 80,759.20 – 1,450.00 36,400.00 86,758.00 205,367.20
RegionalPromoting Gender Equality and Women’s Empowerment
(Supplementary) CD PSM 1,000.00 – – – – 1,000.00Core Environment Program and Biodiversity Conservation
Corridors Initiative in the Greater Mekong Subregion (Supplementary) RD ANR – – 1,000.00 – 1,086.08 Sweden 2,086.08
Managing the Cities in Asia (Supplementary) RD WMS – – – – 2,330.00 Sweden 2,330.00Private Sector Development Initiative (Supplementary) PA PSM – – – – 79.35 Australia 79.35Energy Sector Strategy and Development 2007 (Supplementary) CD ENE 1,000.00 – – – – 1,000.00Strengthening Central Asia Regional Economic Cooperation,
2007–2012 (Supplementary) PA PSM 1,750.00 – – – – 1,750.00Supporting Strategic Knowledge Products and Research
Networking (Supplementary) PA PSM 1,000.00 – – – – 1,000.00Supporting the Achievement of the Millennium Development
Goals in the Asia and Pacific Region, Phase III (Supplementary) RD PSM 1,000.00 – – – – 1,000.00South Asia Subregional Economic Cooperation Transport
Logistics and Trade Facilitation Project (Supplementary) PP TAI 220.00 – – – – 220.00Integrated Trade Facilitation Support for Central Asia Regional
Economic Cooperation (Supplementary) CD IAT 700.00 500.00 – – – 1,200.00Implementation of the Technical Support Facility under the
Carbon Market Initiative (Supplementary) PP ENE – – – – 550.00 Austria 550.00Support for Implementation of the Second Governance and
Anticorruption Action Plan (Supplementary) PA PSM – – – – 391.00 GCF 391.00Knowledge and Innovation Support for ADB’s Water Financing
Program (Supplementary) CD ANR – – – – 6,500.00 MDTF-WFPF/ NET-WFPF
6,500.00
Establishment of the Pacific Infrastructure Advisory Center (Supplementary) PA MUL – – – – 2,678.00 Australia 2,678.00
Trade Finance Capacity Development (Supplementary) CD FIN 2,500.00 – – – – 2,500.00Greater Mekong Subregion Phnom Penh Plan for Development
Management IV (Supplementary) CD PSM – – – – 500.00 EAKPF 500.00Asia Pacific Procurement Partnership Initiative (Supplementary) CD PSM 300.00 – – – – 300.00
CONTINUED
– = nil or data not applicable, ANR = agriculture and natural resources, CCF = Climate Change Fund, CD = capacity development, CTF = Clean Technology Fund, DMC = developing member country, EAKPF = Korea e-Asia and Knowledge Partnership Fund, ENE = energy, FIN = finance, GCF = Governance Cooperation Fund, HSP = health and social protection, IAT = industry and trade, JFPR = Japan Fund for Poverty Reduction, MDTF-WFPF = Multi-Donor Trust Fund under the Water Financing Partnership Facility, MRT = mass rapid transit, MUL = multisector, NET-WFPF = Netherlands Trust Fund for the Water Financing Partnership Facility, PA = policy and advisory, PP = project preparatory, PSM = public sector management, RCIF = Regional Cooperation and Integration Fund, RD = research and development, TA = technical assistance, TAI = transport and ICT (information and communication technology), TASF = Technical Assistance Special Fund, WMS = water supply and other municipal infrastructure and services.
Statistical Annexes
275

ta type sector tasF RciF ccF JFpR Others source total
Support for South Asia Regional Economic Cooperation (Supplementary) CD MUL 225.00 – – – – 225.00
Fourth High-Level Forum on Aid Effectiveness (Supplementary) PA PSM 400.00 – – – 1,129.62 HLF4/ Canada
1,529.62
2011 International Comparison Program for Asia and the Pacific (Supplementary) RD MUL 1,700.00 – – – 161.00 World Bank 1,861.00
Empowering the Poor through Increasing Access to Energy (Supplementary) PP ENE – – – – 2,883.00 Switzerland/
Austria2,883.00
Strengthening the Coordination of the GMS Program (Supplementary) PA MUL 500.00 – – – – 500.00
Strengthening and Use of Country Safeguard Systems (Supplementary) CD PSM 3,000.00 – – – – 3,000.00
Determining the Potential for Carbon Capture and Storage in Southeast Asia (Supplementary) CD ENE – – – – 350.00 CCS 350.00
Enabling Climate Change Responses in Asia and the Pacific – Capacity Development to Address Climate Change (Subproject 3) (Supplementary) CD MUL – – – – 100.00 Sweden 100.00
Greater Mekong Subregion: Corridor Towns Development (Supplementary) PP WMS – – – – 900.00 SCF-PPCR/
UEIF900.00
Asia–Pacific Community of Practice on Managing for Development Results – From Concept to Practice (Supplementary) CD PSM – – – 711.50 820.00 MfDRCF/
EAKPF1,531.50
Strengthening Coastal and Marine Resources Management in the Coral Triangle of the Pacific (Phase 2) (Supplementary) PA ANR – – – – 18.18 GEF 18.18
Turkmenistan–Afghanistan–Pakistan–India Natural Gas Pipeline (Phase 2) (Supplementary) RD ENE 300.00 – – – – 300.00
Central Asia Regional Economic Cooperation – Transport and Trade Facilitation: Border Crossing Point Improvement and Single Window Development PP MUL – 2,000.00 – – – 2,000.00
Supporting Development Partnerships in East Asia PA PSM 1,175.00 – – – – 1,175.00Employment, Trade, and Inclusive Growth in Asia RD MUL 500.00 – – – – 500.00Pacific Regional Information and Communications Technology
Connectivity (Phase 2) PP TAI – 900.00 – – – 900.00Capacity Building for Implementing Private Sector-Led Integration
in South Asia CD IAT – – – – 680.00 ICFF 680.00Key Indicators for Asia and the Pacific 2011 RD PSM 800.00 – – – – 800.00Implementing the Pacific Regional Audit Initiative CD PSM – – – 1,300.00 – 1,300.00Building Capacity for Statistics in the Pacific CD PSM – – – 1,000.00 – 1,000.00Promoting Energy Efficiency in the Pacific (Phase 2) CD ENE 1,000.00 – – – 7,754.55 GEF/
Australia/ ACEF
8,754.55
Implementing the Urban Operational Plan: Financing Investments in Environmental Infrastructure RD ENE 605.00 – – – – 605.00
Strengthening Support for the Asia–Pacific Economic Cooperation Financial Regulators Training Initiative CD FIN – 450.00 – – 500.00 EAKPF 950.00
Coastal and Marine Resources Management in the Coral Triangle – Southeast Asia PA ANR 1,000.00 – – – 11,218.18 GEF 12,218.18
Supporting and Enhancing Regional Surveillance for ASEAN+3 and the Chiang Mai Initiative Multilateralization CD PSM – – – – 1,140.00 ICFF 1,140.00
Developing a Disaster Risk Financing Capability PA FIN – – – 2,000.00 – 2,000.00Promotion of Good Practices in Information and
Communication Technology (ICT) for Education in Central and West Asia Region PA EDU 225.00 – – – – 225.00
Establishing the Asian International Economists Network CD IAT 1,100.00 – – – – 1,100.00
CONTINUED
– = nil or data not applicable; ACEF = Asian Clean Energy Fund; ANR = agriculture and natural resources; ASEAN+3 = Association of Southeast Asian Nations, plus the People’s Republic of China, Japan, and the Republic of Korea; CCF = Climate Change Fund; CCS = Carbon Capture and Storage Fund; CD = capacity development; EAKPF = Korea e-Asia and Knowledge Partnership Fund; EDU = education; ENE = energy; FIN = finance; GEF = Global Environment Facility; GMS = Greater Mekong Subregion; HLF4 = Fourth High Level Forum on Aid Effectiveness Trust Fund; IAT = industry and trade; ICFF = Investment Climate Facilitation Fund; JFPR = Japan Fund for Poverty Reduction; MfDRCF = Cooperation Fund in Support of Managing for Development Results; MUL = multisector; PA = policy and advisory; PP = project preparatory; PSM = public sector management; RCIF = Regional Cooperation and Integration Fund; RD = research and development; SCF-PPCR = Strategic Climate Fund-Pilot Program for Climate Resilience; TA = technical assistance; TAI = transport and ICT (information and communication technology); TASF = Technical Assistance Special Fund; UEIF = Urban Environmental Infrastructure Fund; WMS = water supply and other municipal infrastructure and services.
Asian Development Bank Annual Report 2011
276

CONTINUED
ta type sector tasF RciF ccF JFpR Others source total
2011 CWRD Client Survey CD PSM 225.00 – – – – 225.00Enhancing Government Capacity for Effective Project Design
and Implementation CD PSM 1,300.00 – – – – 1,300.00Enhancing Gender Equality Results in South Asia Developing
Member Countries (Phase 2) (Subproject 2) CD WMS 500.00 – – – – 500.00Strengthening Climate Risk and Resilience Capacity of Pacific
Developing Member Countries, Phase 1 CD MUL – – – – 750.00 SCF-PPCR 750.00Capacity Building for the Efficient Utilization of Biomass for
Bioenergy and Food Security in the Greater Mekong Subregion CD MUL – – – – 4,000.00 NDF 4,000.00Policy Support for Regional and Global Economic Cooperation RD MUL 225.00 – – – – 225.00Pacific Financial Technical Assistance Centre 2011–2014 CD PSM 1,000.00 – – – – 1,000.00Assessment and Implications of Rationalizing and Phasing Out
Fossil-Fuel Subsidies RD ENE 1,000.00 – – – – 1,000.00Enhancing Knowledge on Climate Technology and
Financing Mechanisms CD MUL – – – – 1,500.00 ACEF 1,500.00Regional Program for Research and Capacity Development on
Water Security RD ANR – – – – 500.00 PRC RPRF 500.00Support for Implementing the Action Plan for Transport
and Trade Facilitation in the Greater Mekong Subregion (Subproject 1) PA IAT – – – – 2,000.00 Australia 2,000.00
Nineteenth Tax Conference CD PSM – – – 200.00 – 200.00Afghanistan and Turkmenistan: Regional Power Interconnection PP ENE 1,300.00 – – – – 1,300.00Learning from e-learning: Testing Intelligent Learning Systems in
South Asian Countries RD EDU 225.00 – – – – 225.00Asian Development Outlook 2012 RD PSM 1,000.00 – – – – 1,000.00Financial Regulatory Reforms in Asia RD FIN – – – – 800.00 EAKPF/FSDP 800.00Korea–ADB Conference on Knowledge Sharing and Development
Effectiveness in the Asia and Pacific Region CD TAI – – – – 124.00 EAKPF 124.00Policies to Meet Global Economic Challenges - Asia’s Perspective RD PSM 1,245.00 – – – – 1,245.00Asian Bonds Online Website, Phase IV RD FIN 1,500.00 – – – – 1,500.00Education and Skills for Inclusive Growth and Green Jobs RD EDU 950.00 – – – – 950.00Disbursement, Loan Accounting/Servicing Training and Seminars
for DMCs CD PSM 225.00 – – – – 225.00Selected Evaluation Studies for 2011 RD MUL 1,300.00 – – – – 1,300.00Support to Achieve the ASEAN Economic Community and
Accelerate the Narrowing of Development Gaps by 2015 PA MUL 225.00 – – – – 225.00Collaborative Research and Advisory Services on Public Sector
Management CD PSM 500.00 – – – – 500.00Developing the Services Sector as an Engine for Inclusive Growth RD MUL – – – – 500.00 EAKPF 500.00Enhancing Knowledge Sharing and South–South Cooperation
between Asia and Latin America RD MUL 1,000.00 – – – – 1,000.00Strengthening Regulatory Capacity for Information and
Communication Technology Development in the Pacific CD TAI 750.00 – – – – 750.00Regional Forum on Public Sector Accounting CD PSM – – – – 500.00 EAKPF 500.00Strengthening Economic Assessment Capacity for Asia and the
Pacific Region RD MUL 650.00 – – – – 650.00Assessment of Power Sector Reform in Asia and the Pacific RD ENE 714.00 – – – – 714.00Drivers of Poverty Reduction in Asia and the Pacific RD PSM 225.00 – – – – 225.00Broadening the Scope of Asian Bond Market Initiative
under ASEAN+3 RD FIN – – – – 145.00 EAKPF 145.00Solid Waste Management in the Pacific RD WMS 450.00 – – – – 450.00Harnessing Climate Change Mitigation Initiatives
to Benefit Women CD MUL – – – – 2,700.00 NDF 2,700.00Asia Regional Integration Center, Phase IV RD MUL 1,480.00 – – – – 1,480.00Support to Urban Infrastructure Development and Financing CD MUL – – – – 1,700.00 UEIF 1,700.00Supporting Water Operators’ Partnerships in Asia and the Pacific CD WMS – – – 2,000.00 – 2,000.00
– = nil or data not applicable; ACEF = Asian Clean Energy Fund; ANR = agriculture and natural resources; ASEAN = Association of Southeast Asian Nations; ASEAN+3 = Association of Southeast Asian Nations, plus the People’s Republic of China, Japan, and the Republic of Korea; CCF = Climate Change Fund; CD = capacity development; CWRD = Central and West Asia Department; DMC = developing member country; EAKPF = Korea e-Asia and Knowledge Partnership Fund; EDU = education; ENE = energy; FIN = finance; FSDP = Financial Sector Development Partnership Fund; IAT = industry and trade; JFPR = Japan Fund for Poverty Reduction; MUL = multisector; NDF = Nordic Development Fund; PA = policy and advisory; PP = project preparatory; PRC RPRF = People’s Republic of China Regional Cooperation and Poverty Reduction Fund; PSM = public sector management; RCIF = Regional Cooperation and Integration Fund; RD = research and development; SCF-PPCR = Strategic Climate Fund-Pilot Program for Climate Resilience; TA = technical assistance; TAI = transport and ICT (information and communication technology); TASF = Technical Assistance Special Fund; UEIF = Urban Environmental Infrastructure Fund; WMS = water supply and other municipal infrastructure and services.
Statistical Annexes
277

CONTINUED
ta type sector tasF RciF ccF JFpR Others source total
Asian Development Review 2012–2013 RD MUL 500.00 – – – – 500.00Sovereign Debt Crises in the US and the Eurozone: Potential
Regional Impacts on Asia PA PSM 225.00 – – – – 225.00Preparing a Water Supply and Sanitation Handbook for
Southeast Asia RD WMS – – – – 225.00 MDTF-WFPF 225.00Addressing Disaster Risk through Improved Indicators and Land
Use Management RD PSM 700.00 – – – – 700.00Promotion of Capital Market Instruments for Infrastructure
Financing in the ASEAN CD FIN 150.00 – – – – 150.00Smart Grid Capacity Development CD ENE – – – 1,400.00 – 1,400.00Support for ASEAN Leaders Forum on Human Resource
Development Towards an Integrated ASEAN Community PA EDU 225.00 – – – – 225.00Improving Employment Outcomes RD EDU 800.00 – – – – 800.00Innovations for More Food with Less Water RD ANR – – – 1,400.00 – 1,400.00Establishing Global Research Alliances (Phase 2) RD MUL 1,000.00 – – – – 1,000.00Quantum Leap in Wind Power Development in
Asia and the Pacific CD ENE – – – – 2,000.00 ACEF 2,000.00Enabling Climate Change Responses in Asia and the Pacific –
Disaster Risk Finance for Total Climate Risk (Subproject 6) PA FIN – – – 1,000.00 – 1,000.00Core Environment Program and Biodiversity Conservation
Corridors Initiative in the Greater Mekong Subregion, Phase 2 CD ANR 800.00 – – – 14,000.00 Finland 14,800.00Support for Pan-Beibu Gulf Economic Cooperation PA MUL 400.00 – – – 500.00 PRC RPRF 900.00Improving Agricultural and Rural Statistics for Food Security PA ANR 500.00 – – – – 500.00Strengthening Capacity of Developing Member Countries
in Resource Mobilization and Implementation of Cofinanced Projects CD MUL 500.00 – – – – 500.00
Lessons from DMC Project Processing Practices PA PSM 200.00 – – – – 200.00Strengthening Knowledge-Driven Development in South Asia CD MUL 1,500.00 – – – – 1,500.00Support for the Bay of Bengal Initiative for Multi-Sectoral
Technical and Economic Cooperation II (BIMSTEC - II) CD MUL 750.00 – – – – 750.00South Asia Road Safety Programs (Phase 1: Kingdom of Bhutan
and Nepal) CD TAI 700.00 – – – – 700.00Innovative Financing for Agriculture and Food Value Chains RD ANR 1,500.00 – – – – 1,500.00Master Plan on ASEAN Connectivity Implementation CD MUL – – – – 975.00 JAIF 975.00Support for Regional Multisector Investment Framework for
Greater Mekong Subregion Development (Phase 1) PA MUL 1,000.00 500.00 – – – 1,500.00Provision of Environment Technical Services CD MUL 97.00 – – – – 97.00Strengthening Evaluation of Poverty Reduction Innovations CD MUL 950.00 – – – – 950.00Support Capacity Building of Local Issuing Banks and Trade
Finance Market Development CD IAT 200.00 – – – – 200.00Asia–Pacific Trade Facilitation Forum 2012 CD IAT 225.00 – – – – 225.00Implementation of Sustainable Transport in Asia and the Pacific –
Better Transport Data for Sustainable Transport Policies and Investment Planning (Subproject 1) CD TAI 1,000.00 – – – – 1,000.00
Establishing a Pilot Center to Facilitate Climate Technology Investments in Asia and the Pacific – Promotion of Investment in Climate Technology Products through Venture Capital Funds (Subproject 1) PA MUL 842.00 – 950.00 – 1,500.00 ACEF 3,292.00
Asia Life Sciences Fund PP HSP 1,500.00 – – – – 1,500.00SASEC Subregional Energy Efficiency Initiative CD ENE 225.00 – – – – 225.00Developing Water Resources Sector Strategies in
Central and West Asia PA ANR 1,000.00 – – – 500.00 MDTF-WFPF 1,500.00
– = nil or data not applicable, ACEF = Asian Clean Energy Fund, ANR = agriculture and natural resources, ASEAN = Association of Southeast Asian Nations, CCF = Climate Change Fund, CD = capacity development, DMC = developing member country, EDU = education, ENE = energy, FIN = finance, HSP = health and social protection, IAT = industry and trade, JAIF = Japan–ASEAN Integration Fund, JFPR = Japan Fund for Poverty Reduction, MDTF-WFPF = Multi-Donor Trust Fund under the Water Financing Partnership Facility, MUL = multisector, PA = policy and advisory, PP = project preparatory, PRC RPRF = People’s Republic of China Regional Cooperation and Poverty Reduction Fund, PSM = public sector management, RCIF = Regional Cooperation and Integration Fund, RD = research and development, SASEC = South Asia Subregional Economic Cooperation, TA = technical assistance, TAI = transport and ICT (information and communication technology), TASF = Technical Assistance Special Fund, US = United States, WMS = water supply and other municipal infrastructure and services.
Asian Development Bank Annual Report 2011
278

CONTINUED
ta type sector tasF RciF ccF JFpR Others source total
Impact Evaluation of Selected Projects in South Asia (Phase 2) CD MUL 225.00 – – – – 225.00Promoting Financially Sustainable Regulatory Framework for
Water Tariff in South Asia CD WMS 1,000.00 – – – – 1,000.00Strengthening South Asian Developing Member Countries’
Capacity and Coordination for Mainstreaming Green Growth and Climate Change Resilience CD MUL 225.00 – – – – 225.00
Supporting Evaluation Capacity Development and Networking in Selected Developing Member Countries CD PSM 400.00 – – – – 400.00
Supporting Public Management through e-Government Capacity Development CD PSM – – – – 500.00 EAKPF 500.00
Support for the Preparation of Harmonized Regional Cross-Sector and Thematic Assessments, Strategies, and Roadmaps for a Regional Cooperation Strategy for Southeast Asia, 2013–2015 PA MUL 195.00 – – – – 195.00
all Regional 59,523.00 4,350.00 1,950.00 11,011.50 77,187.96 154,022.46
tOtaL 140,282.20 4,350.00 3,400.00 47,411.50 163,945.96 359,389.66
Statistical Annex 17 TECHNICAL ASSISTANCE GRANTS BY SECTOR,a, b 1967–2011, 2010, 2011 (amounts in $ thousand)
1967–2011 2010 2011
no. $ thousand % no. $ thousand % no. $ thousand %
Agriculture and Natural Resources 1,550 981,463.01 21.86 38 45,878.00 14.15 32 70,997.45 19.76Education 366 229,020.82 5.10 11 55,275.00 17.04 15 8,801.00 2.45Energy 740 447,232.53 9.96 46 37,865.00 11.67 54 52,655.55 14.65Finance 715 348,715.96 7.77 26 18,640.00 5.75 20 19,570.00 5.45Health and Social Protection 270 178,596.42 3.98 9 3,740.00 1.15 5 4,300.00 1.20Industry and Trade 383 182,702.55 4.07 8 7,781.25 2.40 8 6,630.00 1.84Public Sector Management 1,739 983,019.03 21.89 63 48,482.15 14.95 67 55,050.67 15.32Transport and ICT 868 509,619.12 11.35 37 24,713.00 7.62 42 57,624.00 16.03Water Supply and Other Municipal
Infrastructure and Services 533 324,206.67 7.22 25 20,910.00 6.45 35 27,795.00 7.73Multisector 255 305,642.37 6.81 68 61,053.00 18.82 49 55,966.00 15.57
tOtaL 7,419 4,490,218.47 100.00 331 324,337.40 100.00 327 359,389.66 100.00
ICT = information and communication technology.a Excludes technical assistance financed under loans that are included in ADB’s loan data and regional activities.b Data are adjusted to exclude technical assistance projects withdrawn by governments.
– = nil or data not applicable, CCF = Climate Change Fund, CD = capacity development, EAKPF = Korea e-Asia and Knowledge Partnership Fund, JFPR = Japan Fund for Poverty Reduction, MUL = multisector, PA = policy and advisory, PSM = public sector management, RCIF = Regional Cooperation and Integration Fund, TA = technical assistance, TASF = Technical Assistance Special Fund, WMS = water supply and other municipal infrastructure and services.
Statistical Annexes
279

Statistical Annex 18 NET TRANSFER OF RESOURCES (ORDINARY CAPITAL RESOURCES, ASIAN DEVELOPMENT FUND, AND OTHER SPECIAL FUNDS GRANTS), 2009–2011 ($ million)
countryOcRa aDFb grantsc
2009 2010 2011 2009 2010 2011 2009 2010 2011
Afghanistan 4.95 (21.00) (29.94) 69.22 59.60 35.95 45.12 170.07 77.88 Armenia – 23.62 42.05 119.05 20.97 17.78 – – – Azerbaijan 34.58 34.84 109.77 14.73 4.65 (0.84) – – – Bangladesh 667.08 133.03 19.18 93.15 15.29 (10.17) 1.24 2.31 0.71
Bhutan 8.02 20.91 14.93 18.00 14.71 7.31 4.63 17.59 12.95 Cambodia (0.63) (0.43) (3.09) 38.61 25.57 39.12 21.58 17.87 49.96 China, People’s Republic of 903.19 929.14 1,015.11 – – – – 0.20 0.67
Cook Islands – 9.98 5.53 (1.24) (0.41) 2.39 – – – Fiji (1.58) 9.94 13.92 – – – – – – Georgia (9.65) 107.41 22.85 110.83 36.20 39.74 – – – Hong Kong, China – – – – – – – – –
India 1,164.77 1,398.51 1,054.59 – – – 16.65 2.73 – Indonesia (409.30) (75.42) (570.45) 77.70 53.01 23.10 59.27 51.50 5.32 Kazakhstan 512.07 18.18 264.16 (0.27) (0.27) (0.29) – – –
Kiribati – – – (0.50) (0.50) 0.22 – – – Korea, Republic of (30.40) (34.81) (22.88) – – – – – – Kyrgyz Republic – – – 5.70 (14.85) 14.19 21.18 20.36 64.13
Lao People’s Democratic Republic (2.27) (1.22) (4.00) (3.66) (23.49) (42.98) 33.02 35.28 56.88 Malaysia (53.20) (27.81) (24.97) – – – – – – Maldives 6.01 1.75 (1.77) 2.99 22.54 3.23 0.36 (0.77) 0.07
Marshall Islands (0.68) (0.43) (0.44) (3.28) 6.88 (3.04) – – – Micronesia, Federated States of – (0.00) 2.04 (0.63) (0.85) 2.22 – – – Mongolia (4.32) (2.76) (2.63) 37.55 (5.95) (9.01) 19.09 18.31 15.57
Myanmar – – – – – – – – – Nauru (0.13) (0.26) (0.40) – – – – – – Nepal (5.91) (6.79) (4.04) (1.00) (0.43) (12.69) 126.04 31.26 132.59
Pakistan 338.97 184.45 85.46 152.46 17.52 (304.47) 15.87 22.34 12.74 Palau – – 6.40 – – 3.47 – – – Papua New Guinea 22.38 7.57 (1.52) (12.17) (8.43) (10.00) 2.56 3.61 2.89 Philippines 967.70 (280.93) (157.27) (48.03) (49.18) (60.03) 3.00 – 3.00
Samoa – – – 1.61 20.39 4.07 3.90 2.47 3.62 Singapore – – – – – – – – – Solomon Islands – – – (3.45) (3.33) (3.61) 0.95 10.38 14.51
Sri Lanka 72.95 169.80 135.52 34.53 (9.89) (44.46) 41.43 26.26 13.45 Taipei,China – – – – – – – – – Tajikistan – – – 59.86 29.42 7.60 44.18 12.22 55.31
Thailand (10.43) 11.14 255.97 (46.67) – – – – – Timor-Leste – – – – – – 3.30 1.51 2.99 Tonga – – – (1.59) (1.96) (2.66) 1.02 5.65 7.08
Turkmenistan – – – – – – – – – Tuvalu – – – 0.07 0.01 (0.43) 1.24 – 2.00 Uzbekistan 69.34 12.15 17.00 18.40 35.81 59.41 – – –
Vanuatu – – – (1.98) (2.17) (2.40) – – – Viet Nam 652.43 137.82 379.30 364.23 138.12 243.18 10.19 6.81 4.79 Regional (1.88) 138.60 65.92 0.43 0.14 (0.02) 5.98 1.59 5.01
tOtaLc 4,894.05 2,896.97 2,686.31 1,094.67 379.10 (4.15) 481.80 459.53 544.14
– = nil, ( ) = negative, 0.00 = amount is less than $0.01 million, ADF = Asian Development Fund, OCR = ordinary capital resources.a Net transfer of resources for OCR defined as loan disbursements less principal repayments/prepayments and interest/charges received. Includes nonsovereign loans and
net equity investments.b Net transfer of resources for ADF defined as loan disbursements less principal repayments and interest/charges received.c Net transfer of resources for grants defined as disbursements funded by Asian Development Fund (ADF), Asian Tsunami Fund (ATF), Pakistan Earthquake Fund (PEF),
Climate Change Fund (CCF), and Asia Pacific Disaster Response Fund (APDRF).d Totals may not add up because of rounding.
Asian Development Bank Annual Report 2011
280

Statistical Annex 19 NET TRANSFER OF RESOURCES (ORDINARY CAPITAL RESOURCES, ASIAN DEVELOPMENT FUND, AND OTHER SPECIAL FUNDS GRANTS),a 2002–2011 ($ million)
country2002–2006
average 2007 2008 2009 2010 2011
Afghanistan 62.83 129.82 63.14 119.29 208.67 83.90 Armenia – – 8.03 119.05 44.58 59.83 Azerbaijan 1.69 55.33 11.49 49.31 39.49 108.93 Bangladesh 69.70 99.26 326.55 761.48 150.63 9.73
Bhutan 6.42 6.43 3.67 30.65 53.21 35.19 Cambodia 68.25 52.81 127.38 59.56 43.01 85.99 China, People’s Republic of (232.38) 607.60 703.60 903.19 929.34 1,015.78
Cook Islands 0.20 (0.72) 0.40 (1.24) 9.57 7.92 Fiji 2.59 1.89 1.69 (1.58) 9.94 13.92 Georgia – 24.75 68.10 101.18 143.61 62.59 Hong Kong, China – – – – – –
India (323.17) 1,194.88 1,268.09 1,181.42 1,401.25 1,054.59 Indonesia (50.57) 313.35 1.28 (272.33) 29.08 (542.03)Kazakhstan (33.72) (14.17) (47.30) 511.80 17.91 263.87
Kiribati 1.31 (0.25) (0.29) (0.50) (0.50) 0.22 Korea, Republic of (820.34) (20.47) (26.23) (30.40) (34.81) (22.88)Kyrgyz Republic 31.61 25.00 33.45 26.89 5.51 78.32
Lao People’s Democratic Republic 49.04 66.46 25.34 27.08 10.57 9.90 Malaysia (59.56) (37.11) (51.10) (53.20) (27.81) (24.97)Maldives 5.51 8.70 4.56 9.36 23.52 1.52
Marshall Islands 2.24 (2.85) (1.71) (3.96) 6.45 (3.48)Micronesia, Federated States of 1.46 2.83 2.27 (0.63) (0.86) 4.26 Mongolia 25.93 11.34 16.52 52.32 9.61 3.93
Myanmar (0.29) – – – – –Nauru – – (2.32) (0.13) (0.26) (0.40)Nepal 2.91 43.32 51.92 119.13 24.04 115.86
Pakistan (7.28) 576.10 1,423.88 507.30 224.31 (206.27)Palau – – – – – 9.87 Papua New Guinea (18.64) (34.65) (11.91) 12.76 2.74 (8.62)Philippines (67.60) 45.88 195.01 922.66 (330.12) (214.29)
Samoa (0.91) (2.47) (1.23) 5.52 22.85 7.69 Singapore – – – – – –Solomon Islands (0.04) 1.72 (1.86) (2.50) 7.04 10.90
Sri Lanka 125.97 64.02 162.31 148.92 186.16 104.50 Taipei,China – – – – – –Tajikistan 21.26 36.90 49.33 104.05 41.64 62.92
Thailand (461.32) (55.06) (18.19) (57.10) 11.14 255.97 Timor-Leste 0.20 0.45 5.25 3.30 1.51 2.99 Tonga 1.02 (1.55) (1.11) (0.57) 3.69 4.42
Turkmenistan – – – – – –Tuvalu 0.25 1.07 0.28 1.31 0.01 1.57 Uzbekistan 43.29 12.78 9.52 87.74 47.95 76.40
Vanuatu (0.80) (1.28) (1.74) (1.98) (2.17) (2.40)Viet Nam 197.72 169.44 182.92 1,026.85 282.76 627.27 Regional (4.43) 9.60 26.76 4.53 140.32 70.91
tOtaLb (1,359.63) 3,391.11 4,607.70 6,470.52 3,735.59 3,226.30
– = nil, ( ) = negative.a Net transfer of resources defined as loan disbursements less principal repayments/prepayments and interest/charges received. Includes nonsovereign loans, net equity
investments, and grants under Asian Development Fund and other special funds.b Totals may not add up because of rounding.
Statistical Annexes
281

Statistical Annex 20 ASIAN DEVELOPMENT FUND RESOURCES AND COMMITMENT AUTHORITY
ADF-CONTRIBUTED RESOURCES ($ million; as of 31 December 2011)
country
Valued as of 31 December 2010
($ million)
change in 2011 Valued as of 31 December 2011
addition($ equivalent)
Exchange Rate adjustment
($ equivalent)net change($ million) ($ equivalent) (SDR equivalent)a
Australia 1,446.34 81.15 42.81 123.96 1,570.30 1,022.82 Austria 271.73 9.19 (7.59) 1.61 273.34 178.04 Belgium 233.27 6.79 (6.13) 0.67 233.93 152.37 Brunei Darussalam 11.85 1.32 – 1.32 13.17 8.58 Canada 1,709.31 49.72 0.77 50.48 1,759.79 1,146.24 China, People’s Republic of 42.49 9.66 – 9.66 52.14 33.96 Denmark 273.59 5.05 – 5.05 278.64 181.49 Finland 152.02 7.35 (4.47) 2.88 154.90 100.89 France 1,346.78 4.64 (31.91) (27.27) 1,319.51 859.46 Germany 1,920.97 5.27 (47.98) (42.71) 1,878.26 1,223.41 Hong Kong, China 66.53 6.03 – 6.03 72.56 47.26 Indonesia 14.96 – – – 14.96 9.74 Ireland 47.91 9.42 (1.99) 7.43 55.34 36.05 Italy 865.64 26.61 (22.37) 4.24 869.87 566.59 Japan 18,454.46 515.89 1,121.37 1,637.26 20,091.72 13,086.77 Korea, Republic of 273.69 33.15 9.46 42.60 316.30 206.02 Luxembourg 47.12 0.95 (1.18) (0.24) 46.88 30.53 Malaysia 15.18 1.51 0.27 1.78 16.97 11.05 Nauru 0.30 – – – 0.30 0.20 The Netherlands 799.42 22.87 (20.95) 1.93 801.35 521.96 New Zealand 100.76 24.39 2.80 27.19 127.95 83.34 Norway 202.05 10.84 0.89 11.73 213.79 139.25 Portugal 99.04 1.17 (2.50) (1.33) 97.71 63.65 Singapore 11.42 1.52 0.11 1.63 13.05 8.50 Spain 409.65 27.87 (12.70) 15.17 424.82 276.71 Sweden 305.29 15.18 1.42 16.60 321.89 209.66 Switzerland 467.00 15.98 1.79 17.77 484.77 315.76 Taipei,China 70.64 5.57 0.00 5.57 76.21 49.64 Thailand 10.69 0.93 0.19 1.12 11.81 7.70 Turkey 109.50 1.03 (0.01) 1.02 110.51 71.98 United Kingdom 1,016.75 40.54 6.77 47.31 1,064.05 693.07 United States 3,587.21 96.55 (0.00) 96.55 3,683.76 2,399.42
tOtaL 34,383.56 1,038.15 1,028.87 2,067.02 36,450.58 23,742.13
– = nil, SDR = special drawing right.Note: Totals may not add up because of rounding.a SDR equivalent of the US dollar amount valued at $1.53527 per SDR as of 31 December 2011.
ADF COMMITMENT AUTHORITYa
31 December 2011 and 2010 ($ million)
item 2011 2010
Carryover of ADF IX Commitment Authorityb 121.6 122.0 ADF X Contributions 2,818.2c 1,802.1 ADF IX Contributions 135.1d 111.8 ADF VIII Contributions 8.2e 8.2 Reflow-based Resources 5,886.6f 4,520.8 OCR Net Income Transfer 360.0 240.0 Savings and Cancellations 830.5 650.0 Credits from Accelerated Note Encashment Program 0.9g –Total ADF X Commitment Authority 10,161.2 7,454.8Loans and Grants Committed 8,789.9 6,306.6
ADF Commitment Authority Available for Future Commitments 1,371.3 1,148.2
ADF = Asian Development Fund, OCR = ordinary capital resources.Note: Totals may not add up because of rounding.a The Asian Development Bank monitors the ADF commitment authority based on special drawing rights. All reported figures are based on the US dollar to special drawing rights
as of 31 December 2011.b The US dollar equivalent of SDR79.2 million at the year-end exchange rate, which reflects the cumulative commitment authority for ADF IX.c Following the partial payment of a qualified contributor, amounts from the installment payments of donors who exercised their pro rata rights have been withheld for operational commitment.d Represents the (i) balance of the third installment and 27.59% of the fourth installment payment of the United States, (ii) corresponding release of amounts withheld due to the pro rata exercise,
and (iii) Italy’s full payment of the balance of its contribution.e Represents 99.16% of Austria’s fourth installment payment, which was released and made available for operational commitment.f Includes the (i) liquidity drawdown of SDR1.1 billion, (ii) additional liquidity of SDR270 million released from the foreign exchange provision, and (iii) additional assistance to Afghanistan of
$162 million as a result of the suspension of the post-conflict phaseout.g Represents the additional resources from the accelerated note encashment of the remaining balance of Italy’s ADF IX contribution.
Asian Development Bank Annual Report 2011
282

Statistical Annex 21 TECHNICAL ASSISTANCE SPECIAL FUND($ thousand; as of 31 December 2011)
total contributions amount Utilized
Direct Voluntary contributionsAustralia 2,484 2,484Austria 159 159Bangladesh 47 47
Belgium 1,394 1,394Canada 3,346 3,346China, People’s Republic of 1,600 1,600
Denmark 1,963 1,963Finland 237 237France 1,697 1,697
Germany 3,315 3,315Hong Kong, China 100 100India 3,948 3,948
Indonesia 250 250Italy 774 774Japan 47,710 47,710
Korea, Republic of 1,900 1,900Malaysia 909 909The Netherlands 1,338 1,338
New Zealand 1,096 1,096Norway 3,279 3,279Pakistan 1,876 1,876
Singapore 1,100 1,100Spain 190 190Sri Lanka 6 6
Sweden 862 862Switzerland 1,035 1,035Taipei,China 200 200
United Kingdom 5,617 5,617United States 1,500 1,500
Subtotal 89,932 89,932
Regularized Replenishment contributionsa 762,751 643,915
transfer to asian Development Fund (3,472) (3,472)
allocation from Ordinary capital Resources net incomeb 995,588 889,313
Subtotal 1,754,867 1,529,756
tOtaL 1,844,799 1,619,688
( ) = negative.a Represents Technical Assistance Special Fund (TASF) portion of contributions to the replenishment of the Asian Development Fund and the TASF authorized by Board of Governors’
Resolutions 182, 214, 300, and 333 at historical values.b Includes income, repayments, and reimbursements to the TASF since 1980.
Statistical Annexes
283

Statistical Annex 22 JAPAN SPECIAL FUND—Regular and Supplementary Contributions Statement of Activities and Change in Net Assets ($ million)
1988–2005a 2006 2007 2008 2009 2010 2011 total
Contributions Committed 904.1 24.5 27.7 17.4 – – – 973.7Revenue 143.7 10.7 12.0 6.6 1.2 0.4 0.2 174.8
Total 1,047.8 35.2 39.7 24.0 1.2 0.4 0.2 1,148.5
Transfer to Cooperation Fund for Regional Trade and Financial Security Initiative (1.0) – – – – – – (1.0)
Expenses 862.4 51.1 33.7 55.1 39.2 15.4 (4.4) 1,052.5 Exchange Gain (Loss) (25.1) (0.1) – 0.2 (0.1) (0.0) (0.0) (25.1)Translation Adjustments (12.5) – – – – – – (12.5)
Change in Net Assets 146.8 (16.0) 6.0 (30.9) (38.1) (15.0) 4.6 57.4
– = nil, ( ) = negative, 0.0 = less than $50,000.Note: Totals may not add up because of rounding.a Prior years’ amounts have been restated to conform with the 1995 presentation.
Statistical Annex 23 JAPAN SPECIAL FUND—Asian Currency Crisis Support Facility Statement of Activities and Change in Net Assets ($ million)
1999–2006 2007 2008 2009 2010 2011 total
Contributions Committed 241.0a – – – – – 241.0Revenue 6.1 1.8 1.1 0.2 0.1 0.1 9.3
Total 247.1 1.8 1.1 0.2 0.1 0.1 250.3
Transfer to Japan Fund for Poverty Reduction (90.0) – – – – – (90.0)Interest Payment Assistance Written Back 33.2 – – – – – 33.2Expenses 129.4 – (0.4) (0.2) 0.0 0.0 128.8Exchange Gain (Loss) (1.7) – – – – – (1.7)Translation Adjustments (26.3) – – – – – (26.3)
Change in Net Assets 32.9 1.8 1.5 0.4 0.1 0.1 36.7
– = nil, ( ) = negative, 0.0 = less than $50,000.a A guarantee facility is provided under the Asian Currency Crisis Support Facility for which the Government of Japan has made available noninterest-bearing,
nonnegotiable notes in the amount of 360 billion yen, encashable by ADB at any time to meet a call on any guarantee. In the absence of any concluded guarantee, the note was returned to the Government of Japan on 25 March 2002.
Asian Development Bank Annual Report 2011
284

Statistical Annex 24 PROJECTS WITH ADB-ADMINISTERED GRANT COFINANCING, 2011 ($ thousand)
amount
source of cofinancing project name
technical assistance
project component
BiLatERaLs,a project specific
australiaBAN Third Primary Education Development 35,000.00
CAM Supporting Policy and Institutional Reforms and Capacity Development in the Water Sector (2nd Supplementary) 4,550.00
INO Geothermal Power Development (Supplementary) 225.00INO Supporting Water Operators’ Partnerships (Supplementary) 425.00KIR Economic Management and Public Sector Reform (Supplementary) 1,500.00
KIR South Tarawa Sanitation Improvement Sector 13,950.00
LAO National Integrated Water Resources Management Support 3,000.00
NEP School Sector Program 15,600.00
PHI Strengthening Public–Private Partnerships in the Philippines 7,000.00PNG Rural Primary Health Services Delivery 40,000.00TON Nuku’alofa Urban Sector Development 6,440.00VAN Port Vila Urban Development 25,600.00VIE Central Mekong Delta Region Connectivity 26,000.00REG Establishment of the Pacific Infrastructure Advisory Center (Supplementary) 1,178.00REG Establishment of the Pacific Infrastructure Advisory Center (2nd Supplementary) 1,500.00
REG Support for Implementing the Action Plan for Transport and Trade Facilitation in the Greater Mekong Subregion (Subproject 1) 2,000.00
Subtotal 47,378.00 136,590.00
austriaREG Empowering the Poor through Increasing Access to Energy (2nd Supplementary) 2,750.00REG Implementation of the Technical Support Facility under the Carbon Market Initiative (Supplementary) 550.00
Subtotal 3,300.00
canadaBAN Third Primary Education Development 65,000.00PHI Strengthening Public–Private Partnerships in the Philippines 1,200.00REG Fourth High-Level Forum on Aid Effectiveness (4th Supplementary) 98.00
Subtotal 1,298.00 65,000.00
Denmark
AFG Energy Sector Development Investment Program – Tranche 3 12,400.00BAN Capacity Building of the Anti Corruption Commission 110.00NEP School Sector Program 17,900.00NEP Support for the Implementation of School Sector Reform Program (Supplementary) 190.00
Subtotal 300.00 30,300.00
FinlandNEP School Sector Program 13,200.00
REG Core Environment Program and Biodiversity Conservation Corridors Initiative in the Greater Mekong Subregion, Phase 2 14,000.00
Subtotal 14,000.00 13,200.00
AFG = Afghanistan, BAN = Bangladesh, CAM = Cambodia, INO = Indonesia, KIR = Kiribati, LAO = Lao People’s Democratic Republic, NEP = Nepal, PHI = Philippines, PNG = Papua New Guinea, REG = regional, TON = Tonga, VAN = Vanuatu, VIE = Viet Nam.a Includes project-specific bilateral cofinancing. b Includes cofinancing from bilateral trust funds.c Includes cofinancing from multi-donor trust funds and cooperation funds.d Includes project-specific cofinancing from multilateral organizations. e Includes project-specific cofinancing from global trust funds.
Statistical Annexes
285

amount
source of cofinancing project name
technical assistance
project component
germanyBAN City Region Development 14,860.00
Subtotal 14,860.00
JapanBAN Third Primary Education Development 30,000.00
Subtotal 30,000.00
new ZealandVAN Establishment of the Maritime Safety Administration 1,000.00VAN Interisland Shipping Support 12,600.00
Subtotal 1,000.00 12,600.00
norwayNEP Electricity Transmission Expansion and Supply Improvement 25,000.00 NEP School Sector Program 22,400.00
Subtotal 47,400.00
spain
GEO Developing a Geospatial Urban Water Supply and Sanitation Utility Management System (Supplementary) 600.00
LAO National Integrated Water Resources Management Support 600.00UZB Design and Strengthening of the Solar Energy Institute 225.00
Subtotal 1,425.00
swedenBAN Third Primary Education Development 45,000.00
REG Core Environment Program and Biodiversity Conservation Corridors Initiative in the Greater Mekong Subregion (Supplementary) 1,086.08
REG Enabling Climate Change Responses in Asia and the Pacific – Capacity Development to Address Climate Change (Subproject 3) (Supplementary) 100.00
REG Managing the Cities in Asia (Supplementary) 2,330.00Subtotal 3,516.08 45,000.00
switzerlandNEP Decentralized Rural Infrastructure and Livelihood (Additional Financing) 7,060.00REG Empowering the Poor through Increasing Access to Energy (Supplementary) 133.00
Subtotal 133.00 7,060.00
United Kingdom
AFG Energy Sector Development Investment Program – Tranche 3 20,000.00
BAN Third Primary Education Development 190,000.00
IND Advanced Project Preparedness for Poverty Reduction – Water Users Association Empowerment for Improved Irrigation Management in Chhattisgarh (Subproject 5) (Supplementary) 100.00
IND Advanced Project Preparedness for Poverty Reduction – Rajasthan Solar Park Capacity Development (Subproject 13) 500.00
IND Advanced Project Preparedness for Poverty Reduction – Gujarat Solar Vocational Training and Livelihoods (Subproject 14) 400.00
IND Advanced Project Preparedness for Poverty Reduction – Capacity Building and Institutional Strengthening for the Assam Urban Infrastructure Investment Program (Subproject 15) 600.00
CONTINUED
AFG = Afghanistan, BAN = Bangladesh, GEO = Georgia, IND = India, LAO = Lao People’s Democratic Republic, NEP = Nepal, REG = regional, UZB = Uzbekistan, VAN = Vanuatu.a Includes project-specific bilateral cofinancing. b Includes cofinancing from bilateral trust funds.c Includes cofinancing from multi-donor trust funds and cooperation funds.d Includes project-specific cofinancing from multilateral organizations. e Includes project-specific cofinancing from global trust funds.
Asian Development Bank Annual Report 2011
286

amount
source of cofinancing project name
technical assistance
project component
IND Advanced Project Preparedness for Poverty Reduction – Capacity Building for Bihar Urban Infrastructure Development (Subproject 16) 600.00
IND Advanced Project Preparedness for Poverty Reduction – Supporting Clean Village Environments for MDGs (Subproject 17) 600.00
IND Advanced Project Preparedness for Poverty Reduction – West Bengal North South Road Corridor (Subproject 18) 1,100.00
IND Advanced Project Preparedness for Poverty Reduction – Rajasthan Renewable Energy Transmission Program (Subproject 19) 225.00
IND Advanced Project Preparedness for Poverty Reduction – State Roads (Subproject 20) 2,000.00
IND Advanced Project Preparedness for Poverty Reduction – Designing and Capacity Building for Strengthening State Finances and Service Delivery in West Bengal (Subproject 21) 220.00
IND Advanced Project Preparedness for Poverty Reduction – Rajasthan Urban Development Program (Subproject 22) 750.00
NEP Establishing Women and Children Service Centers (Supplementary) 200.00
NEP School Sector Program 4,000.00
Subtotal 7,095.00 214,200.00
singLE DOnOR tRUst FUnDsb
australia–carbon capture storage Fund under the clean Energy Financing partnership FacilityPRC Study on Carbon Capture and Storage in Natural Gas-Based Power Plants 1,800.00REG Determining the Potential for Carbon Capture and Storage in Southeast Asia (Supplementary) 350.00
Subtotal 2,150.00
australia–pacific Region infrastructure FacilityKIR Tarawa Sanitation Improvement (Supplementary) 125.00SOL Second Road Improvement (Sector) (Supplementary) 4,040.00VAN Port Vila Urban Development 5,400.00REG Promoting Energy Efficiency in the Pacific (Phase 2) 1,000.00
Subtotal 1,125.00 9,440.00
australian technical assistance grantVAN Port Vila Urban Development (Supplementary) 500.00REG Private Sector Development Initiative (Supplementary) 79.35
Subtotal 579.35
people’s Republic of china Regional cooperation and poverty Reduction FundREG Regional Program for Research and Capacity Development on Water Security 500.00REG Support for Pan-Beibu Gulf Economic Cooperation 500.00
Subtotal 1,000.00
Japan asEan integration FundREG Master Plan on ASEAN Connectivity Implementation 975.00
Subtotal 975.00
Japan–asian clean Energy Fund under the clean Energy Financing partnership FacilityBAN Public–Private Infrastructure Development Facility 2,000.00IND Capacity Building for Commercial Bank Lending for Solar Energy Projects 750.00INO Institutional Capacity Building of Indonesia Eximbank 1,100.00PHI Rural Community-Based Renewable Energy Development in Mindanao 2,000.00
CONTINUED
ASEAN = Association of Southeast Asian Nations, BAN = Bangladesh, IND = India, INO = Indonesia, KIR = Kiribati, MDG = Millennium Development Goal, NEP = Nepal, PHI = Philippines, PRC = People’s Republic of China, REG = regional, SOL = Solomon Islands, VAN = Vanuatu.a Includes project-specific bilateral cofinancing. b Includes cofinancing from bilateral trust funds.c Includes cofinancing from multi-donor trust funds and cooperation funds.d Includes project-specific cofinancing from multilateral organizations. e Includes project-specific cofinancing from global trust funds.
Statistical Annexes
287

amount
source of cofinancing project name
technical assistance
project component
SRI Implementation of Energy Efficiency Policy Initiatives 1,850.00REG Enhancing Knowledge on Climate Technology and Financing Mechanisms 1,500.00
REG Establishing a Pilot Center to Facilitate Climate Technology Investments in Asia and the Pacific – Promotion of Investment in Climate Technology Products through Venture Capital Funds (Subproject 1) 1,500.00
REG Promoting Energy Efficiency in the Pacific (Phase 2) 1,500.00REG Quantum Leap in Wind Power Development in Asia and the Pacific 2,000.00
Subtotal 12,200.00 2,000.00
Japan Fund for poverty ReductionBAN Institutional Support for Migrant Workers’ Remittance 2,000.00 BAN Skills for Employment 700.00BAN Strategic Master Plan for Chittagong Port 1,000.00
BAN Strengthening the Resilience of the Urban Water Supply, Drainage, and Sanitation to Climate Change in Coastal Towns 700.00
BHU Advancing Economic Opportunities of Women and Girls 1,950.00 BHU Green Power Development II 1,000.00CAM Improving Market Access for the Poor in Central Cambodia 1,900.00 FSM Strengthening Infrastructure Planning and Implementation 700.00IND Capacity Building for North Eastern State Roads Sector 1,200.00IND Development of International Center for Application of Solar Energy Technologies 2,000.00IND Himachal Pradesh Clean Energy Transmission Investment Program 500.00IND Introducing Best Practices for Septage Management 700.00INO Implementing Effective Climate Change Adaptation Policy 700.00INO Improving Domestic Connectivity 500.00INO Integrated Citarum Water Resources Management Investment Program Periodic Financing Request 2 1,500.00INO Metropolitan Sanitation Management and Health II 1,000.00INO Strengthening Sanitation Planning and Efficiency Improvement 1,000.00INO Water Resources and River Basin Management 1,800.00LAO Renewable Energy Development in Remote Communities 1,000.00LAO Vientiane Sustainable Urban Transport 700.00MON Fifth Health Sector Development 700.00MON Road Sector Capacity Development 2,000.00MON Ulaanbaatar Urban Services and Ger Areas Development Investment Program 1,500.00NEP Improving Access to Finance Sector Development Program 600.00NEP Kathmandu Valley Urban Environment Improvement 700.00NEP Reducing Child Malnutrition through Social Protection 2,000.00 NEP Skills Development 500.00NEP Support for Targeted and Sustainable Development Programs for Highly Marginalized Groups 2,700.00 PHI Capacity Development of Financial Regulators 1,000.00PHI Results-Oriented Strategic Planning and Development Management for Inclusive Growth 1,000.00PHI Strengthening Institutions for an Improved Investment Climate 1,000.00PHI Support to Local Government Revenue Generation and Land Administration Reforms 1,500.00PNG Facilitating Public–Private Partnerships 800.00PNG Maritime and Waterways Safety 600.00
CONTINUED
BAN = Bangladesh, BHU = Bhutan, CAM = Cambodia, FSM = Federated States of Micronesia, IND = India, INO = Indonesia, LAO = Lao People’s Democratic Republic, MON = Mongolia, NEP = Nepal, PHI = Philippines, PNG = Papua New Guinea, REG = regional, SRI = Sri Lanka.a Includes project-specific bilateral cofinancing. b Includes cofinancing from bilateral trust funds.c Includes cofinancing from multi-donor trust funds and cooperation funds.d Includes project-specific cofinancing from multilateral organizations. e Includes project-specific cofinancing from global trust funds.
Asian Development Bank Annual Report 2011
288

amount
source of cofinancing project name
technical assistance
project component
SRI Improving Community-Based Rural Water Supply and Sanitation in Post-Conflict Areas of Jaffna and Kilinochchi 2,000.00
THA Development of a Strategic Framework for Financial Inclusion 1,500.00TON Outer Island Renewable Energy 500.00UZB Amu Bukhara Irrigation System Rehabilitation 1,500.00VIE Improvement of Road Safety and Climate Resilience on National Highways 1,500.00VIE Support to Central and Local Governments to Implement Urban Environmental
Improvement Programs 2,000.00VIE Water Resources Development in the Mid- and Northeast Red River Delta 800.00REG Asia–Pacific Community of Practice on Managing for Development Results –
From Concept to Practice (Supplementary) 711.50REG Building Capacity for Statistics in the Pacific 1,000.00REG Developing a Disaster Risk Financing Capability 2,000.00REG Developing Sustainable Alternative Livelihoods in Coastal Fishing Communities in the Coral Triangle 2,000.00 REG Enabling Climate Change Responses in Asia and the Pacific –
Disaster Risk Finance for Total Climate Risk (Subproject 6) 1,000.00REG Implementing the Pacific Regional Audit Initiative 1,300.00REG Improving Gender-Inclusive Access to Clean and Renewable Energy in Bhutan, Nepal, and Sri Lanka 3,000.00 REG Innovations for More Food with Less Water 1,400.00REG Nineteenth Tax Conference 200.00REG Smart Grid Capacity Development 1,400.00REG Supporting Water Operators’ Partnerships in Asia and the Pacific 2,000.00
Subtotal 47,411.50 17,550.00
Japan–investment climate Facilitation Fund under the Regional cooperation and integration Financing partnership FacilityREG Capacity Building for Implementing Private Sector-Led Integration in South Asia 680.00REG Supporting and Enhancing Regional Surveillance for ASEAN+3 and
the Chiang Mai Initiative Multilateralization 1,140.00Subtotal 1,820.00
Republic of Korea e-asia and Knowledge partnership FundBHU Developing a Revenue Administration Management Information System 500.00INO Water Supply and Sanitation Sector Development 500.00MON Government Bond Market Development 500.00TAJ Strengthening Public Resource Management Program 500.00REG Korea–ADB Conference on Knowledge Sharing and Development Effectiveness
in the Asia and Pacific Region 124.00REG Asia–Pacific Community of Practice on Managing for Development Results –
From Concept to Practice (2nd Supplementary) 500.00REG Broadening the Scope of Asian Bond Market Initiative Under ASEAN+3 145.00REG Developing the Services Sector as an Engine for Inclusive Growth 500.00REG Financial Regulatory Reforms in Asia 500.00REG Greater Mekong Subregion Phnom Penh Plan for Development Management IV (Supplementary) 500.00REG Regional Forum on Public Sector Accounting 500.00REG Strengthening Support for the Asia-Pacific Economic Cooperation
Financial Regulators Training Initiative 500.00REG Supporting Public Management through e-Government Capacity Development 500.00
Subtotal 5,769.00
CONTINUED
ASEAN+3 = Association of Southeast Asian Nations plus, the People’s Republic of China, Japan, and the Republic of Korea; BHU = Bhutan; INO = Indonesia; MON = Mongolia; REG = regional; SRI = Sri Lanka; TAJ = Tajikistan; THA = Thailand; TON = Tonga; UZB = Uzbekistan; VIE = Viet Nam.a Includes project-specific bilateral cofinancing. b Includes cofinancing from bilateral trust funds.c Includes cofinancing from multi-donor trust funds and cooperation funds.d Includes project-specific cofinancing from multilateral organizations. e Includes project-specific cofinancing from global trust funds.
Statistical Annexes
289

amount
source of cofinancing project name
technical assistance
project component
netherlands trust Fund under the water Financing partnership FacilityAFG Supporting Natural Resources Operations 1,500.00REG Knowledge and Innovation Support for ADB’s Water Financing Program (Supplementary) 5,000.00
Subtotal 6,500.00
MULti-DOnOR tRUst FUnDsc
afghanistan infrastructure trust FundAFG Transport Network Development Investment Program – Tranche 1 33,000.00
Subtotal 33,000.00
cooperation Fund for Regional trade and Financial security initiativeCAM Implementing Subprogram 2 of the Third Financial Sector Program 300.00
Subtotal 300.00
cooperation Fund in support of Managing for Development Results
REG Asia–Pacific Community of Practice on Managing for Development Results – From Concept to Practice (Supplementary) 320.00
Subtotal 320.00
Financial sector Development partnership FundINO Institutional Capacity Building of Indonesia Eximbank 350.00MON Government Bond Market Development 500.00REG Financial Regulatory Reforms in Asia 300.00
Subtotal 1,150.00
Fourth high Level ForumREG Fourth High-Level Forum on Aid Effectiveness (2nd Supplementary) 763.69REG Fourth High-Level Forum on Aid Effectiveness (3rd Supplementary) 208.96REG Fourth High-Level Forum on Aid Effectiveness (5th Supplementary) 58.97
Subtotal 1,031.62
governance cooperation Fund
REG Support for Implementation of the Second Governance and Anticorruption Action Plan (Supplementary) 391.00Subtotal 391.00
clean Energy Fund under the clean Energy Financing partnership FacilityPRC Development of Energy Manager Program for Energy Conservation in Shandong 1,000.00
Subtotal 1,000.00
Multi-Donor trust Fund under the water Financing partnership FacilityREG Developing Water Resources Sector Strategies in Central and West Asia 500.00REG Knowledge and Innovation Support for ADB’s Water Financing Program (Supplementary) 1,500.00REG Preparing a Water Supply and Sanitation Handbook for Southeast Asia 225.00
Subtotal 2,225.00
Urban Environmental infrastructure Fund under the Urban Financing partnership FacilityREG Greater Mekong Subregion: Corridor Towns Development (2nd Supplementary) 300.00REG Support to Urban Infrastructure Development and Financing 1,700.00
Subtotal 2,000.00
CONTINUED
AFG = Afghanistan, CAM = Cambodia, INO = Indonesia, MON = Mongolia, PRC = People’s Republic of China, REG = regional.a Includes project-specific bilateral cofinancing. b Includes cofinancing from bilateral trust funds.c Includes cofinancing from multi-donor trust funds and cooperation funds.d Includes project-specific cofinancing from multilateral organizations. e Includes project-specific cofinancing from global trust funds.
Asian Development Bank Annual Report 2011
290

amount
source of cofinancing project name
technical assistance
project component
MULtiLatERaLsd
European UnionBAN Third Primary Education Development 70,000.00NEP School Sector Program 47,900.00
Subtotal 117,900.00
nordic Development FundCAM Supporting Policy and Institutional Reforms and Capacity Development
in the Water Sector (Supplementary) 3,750.00VIE Support for the National Target Program on Climate Change with a Focus
on Energy and Transport 2,500.00VIE Transport Connections in Northern Mountainous Provinces 2,780.00REG Capacity Building for the Efficient Utilization of Biomass for Bioenergy and Food Security
in the Greater Mekong Subregion 4,000.00REG Harnessing Climate Change Mitigation Initiatives to Benefit Women 2,700.00
Subtotal 12,950.00 2,780.00
United nation’s children’s FundBAN Third Primary Education Development 500.00NEP School Sector Program 1,000.00
Subtotal 1,500.00
world BankNEP School Sector Program 72,500.00TON Tonga–Fiji Submarine Cable Project 16,500.00REG 2011 International Comparison Program for Asia and the Pacific (2nd Supplementary) 161.00
Subtotal 161.00 89,000.00
gLOBaL tRUst FUnDse
Fast track initiativeNEP School Sector Program 70,000.00
Subtotal 70,000.00
global Environment FacilityPRC Forestry and Ecological Restoration in Three Northwest Provinces 5,100.00REG Coastal and Marine Resources Management in the Coral Triangle –
Southeast Asia 11,218.18REG Promoting Energy Efficiency in the Pacific (Phase 2) 5,254.54REG Strengthening Coastal and Marine Resources Management in the Coral Triangle
of the Pacific (Phase 2) (Supplementary) 18.18Subtotal 16,490.90 5,100.00
clean technology Fund under the climate investment FundVIE Strengthening Sustainable Urban Transport for Ha Noi Metro Line 3 1,000.00VIE Sustainable Urban Transport for Ho Chi Minh City MRT Line 2 1,000.00
Subtotal 2,000.00
strategic climate Fund under the climate investment Fund Forest investment program
INO Preparation of the Forest Investment Strategy 225.00Subtotal 225.00
CONTINUED
BAN = Bangladesh, BHU = Bhutan, CAM = Cambodia, INO = Indonesia, MRT= Mass Rapid Transit, NEP = Nepal, PRC = People’s Republic of China, REG = regional, TON = Tonga, VIE = Viet Nam.a Includes project-specific bilateral cofinancing. b Includes cofinancing from bilateral trust funds.c Includes cofinancing from multi-donor trust funds and cooperation funds.d Includes project-specific cofinancing from multilateral organizations. e Includes project-specific cofinancing from global trust funds.
Statistical Annexes
291

CONTINUED
amount
source of cofinancing project name
technical assistance
project component
pilot program for climate ResilienceBAN Climate Change Capacity Building and Knowledge Management 500.00BAN Climate Resilient Infrastructure Improvement in Coastal Zone 600.00CAM Climate Resilient Rice Commercialization Sector Development Program 500.00CAM Provincial Roads Improvement Project 7,000.00NEP Building Climate Resilience of Watersheds in Mountain Eco-Regions 900.00NEP Mainstreaming Climate Change Risk Management in Development 7,163.00TAJ Building Climate Resilience in the Pyanj River Basin 750.00REG Greater Mekong Subregion: Corridor Towns Development (Supplementary) 600.00REG Strengthening Climate Risk and Resilience Capacity of Pacific Developing Member Countries, Phase 1 750.00
Subtotal 11,763.00 7,000.00
scaling Up Renewable Energy program in Low income countries NEP Scaling Up Micro and Mini Renewable Energy Initiatives 215.00NEP Scaling Up Small Hydro Power Projects 160.00
Subtotal 375.00
tOtaL 211,357.45 971,480.00
BAN = Bangladesh, CAM = Cambodia, NEP = Nepal, REG = regional, TAJ = Tajikistan.a Includes project-specific bilateral cofinancing. b Includes cofinancing from bilateral trust funds.c Includes cofinancing from multi-donor trust funds and cooperation funds.d Includes project-specific cofinancing from multilateral organizations. e Includes project-specific cofinancing from global trust funds.
Asian Development Bank Annual Report 2011
292

Statistical Annex 25a CONTRACTS AWARDED BY COUNTRY OF ORIGIN, 2011 PROJECT LOANS—ORDINARY CAPITAL RESOURCES (amounts in $ million)
Origin countrygoods
and works % Distribution consulting services % Distributiontotal contracts
awarded % Distribution
Afghanistan 0.00 0.00 0.00 0.00 0.00 0.00Armenia 0.00 0.00 0.00 0.00 0.00 0.00Australia 1.60 0.03 7.55 6.24 9.15 0.18 Austria 0.00 0.00 0.00 0.00 0.00 0.00Azerbaijan 21.45 0.44 1.69 1.40 23.14 0.46 Bangladesh 0.35 0.01 0.00 0.00 0.35 0.01 Belgium 0.65 0.01 0.00 0.00 0.65 0.01 Bhutan 0.00 0.00 0.00 0.00 0.00 0.00Brunei Darussalam 0.00 0.00 0.00 0.00 0.00 0.00Cambodia 0.00 0.00 0.00 0.00 0.00 0.00Canada 0.46 0.01 0.06 0.05 0.52 0.01 China, People’s Republic of 1,415.90 28.92 5.25 4.34 1,421.15 28.33 Cook Islands 0.00 0.00 0.00 0.00 0.00 0.00Denmark 0.07 0.00 0.01 0.01 0.08 0.00 Fiji 7.99 0.16 0.00 0.00 7.99 0.16 Finland 0.00 0.00 0.02 0.01 0.02 0.00 France 0.00 0.00 1.07 0.88 1.07 0.02 Georgia 0.00 0.00 0.00 0.00 0.00 0.00 Germany 53.93 1.10 0.15 0.12 54.08 1.08 Hong Kong, China 0.00 0.00 1.06 0.88 1.07 0.02 India 1,354.05 27.66 31.36 25.91 1,385.41 27.62 Indonesia 60.02 1.23 3.09 2.55 63.10 1.26 Ireland 0.00 0.00 0.00 0.00 0.00 0.00Italy 0.00 0.00 0.00 0.00 0.00 0.00Japan 12.20 0.25 3.58 2.95 15.77 0.31 Kazakhstan 17.19 0.35 0.00 0.00 17.19 0.34 Kiribati 0.00 0.00 0.00 0.00 0.00 0.00Korea, Republic of 1,017.14 20.78 8.03 6.64 1,025.17 20.44 Kyrgyz Republic 0.00 0.00 0.00 0.00 0.00 0.00 Lao People’s Democratic Republic 0.00 0.00 0.00 0.00 0.00 0.00Luxembourg 0.00 0.00 0.00 0.00 0.00 0.00Malaysia 0.00 0.00 2.60 2.15 2.60 0.05 Maldives 0.00 0.00 0.00 0.00 0.00 0.00Marshall Islands 0.14 0.00 0.00 0.00 0.14 0.00 Micronesia, Federated States of 0.00 0.00 0.00 0.00 0.00 0.00Mongolia 0.00 0.00 0.00 0.00 0.00 0.00Myanmar 0.00 0.00 0.00 0.00 0.00 0.00Nauru 0.00 0.00 0.00 0.00 0.00 0.00Nepal 0.00 0.00 0.00 0.00 0.00 0.00The Netherlands 0.00 0.00 4.61 3.81 4.61 0.09 New Zealand 4.82 0.10 1.60 1.32 6.42 0.13 Norway 0.00 0.00 0.00 0.00 0.00 0.00Pakistan 343.97 7.03 11.52 9.52 355.49 7.09 Palau 0.00 0.00 0.00 0.00 0.00 0.00Papua New Guinea 0.00 0.00 0.36 0.29 0.36 0.01 Philippines 55.47 1.13 4.66 3.85 60.13 1.20 Portugal 0.00 0.00 0.00 0.00 0.00 0.00Samoa 0.00 0.00 0.00 0.00 0.00 0.00Singapore 7.68 0.16 0.00 0.00 7.68 0.15 Solomon Islands 0.00 0.00 0.00 0.00 0.00 0.00Spain 62.20 1.27 0.00 0.00 62.20 1.24 Sri Lanka 171.14 3.50 2.17 1.79 173.31 3.46 Sweden 0.11 0.00 0.00 0.00 0.11 0.00 Switzerland 1.32 0.03 13.06 10.79 14.38 0.29 Taipei,China 0.00 0.00 3.49 2.88 3.49 0.07 Tajikistan 0.00 0.00 0.00 0.00 0.00 0.00Thailand 0.06 0.00 0.00 0.00 0.06 0.00 Timor-Leste 0.00 0.00 0.00 0.00 0.00 0.00Tonga 0.00 0.00 0.00 0.00 0.00 0.00Turkey 137.85 2.82 0.00 0.00 137.85 2.75 Turkmenistan 0.00 0.00 0.00 0.00 0.00 0.00Tuvalu 0.00 0.00 0.00 0.00 0.00 0.00United Kingdom 7.40 0.15 11.01 9.10 18.41 0.37 United States 10.85 0.22 2.98 2.46 13.83 0.28 Uzbekistan 3.60 0.07 0.04 0.04 3.65 0.07 Vanuatu 0.00 0.00 0.00 0.00 0.00 0.00Viet Nam 125.64 2.57 0.00 0.00 125.64 2.50
tOtaL 4,895.23 100.00 121.01 100.00 5,016.25 100.00
0.00 = amount or percentage is nil or less than 0.01.Note: Totals may not add up because of rounding.
Statistical Annexes
293

Statistical Annex 25b CONTRACTS AWARDED BY NATIONALITY OF CONTRACTOR, 2011 PROJECT LOANS—ORDINARY CAPITAL RESOURCES (amounts in $ million)
contractor countrygoods
and works % Distribution consulting services % Distributiontotal contracts
awarded % Distribution
Afghanistan 0.00 0.00 0.00 0.00 0.00 0.00Armenia 0.00 0.00 0.00 0.00 0.00 0.00Australia 1.60 0.03 7.15 5.91 8.75 0.17Austria 0.00 0.00 0.00 0.00 0.00 0.00Azerbaijan 59.36 1.21 1.69 1.40 61.05 1.22Bangladesh 0.35 0.01 0.00 0.00 0.35 0.01Belgium 0.65 0.01 0.00 0.00 0.65 0.01Bhutan 0.00 0.00 0.00 0.00 0.00 0.00Brunei Darussalam 0.00 0.00 0.00 0.00 0.00 0.00Cambodia 0.00 0.00 0.00 0.00 0.00 0.00Canada 0.46 0.01 0.00 0.00 0.46 0.01China, People’s Republic of 1,414.77 28.90 2.84 2.35 1,417.62 28.26Cook Islands 0.00 0.00 0.00 0.00 0.00 0.00Denmark 0.00 0.00 0.00 0.00 0.00 0.00Fiji 12.81 0.26 0.79 0.65 13.60 0.27Finland 0.00 0.00 0.00 0.00 0.00 0.00France 0.00 0.00 0.95 0.79 0.95 0.02Georgia 0.00 0.00 0.00 0.00 0.00 0.00Germany 52.83 1.08 0.12 0.10 52.95 1.06Hong Kong, China 7.28 0.15 3.50 2.89 10.78 0.21India 1,372.24 28.03 35.29 29.16 1,407.53 28.06Indonesia 60.16 1.23 3.09 2.55 63.25 1.26Ireland 0.00 0.00 0.00 0.00 0.00 0.00Italy 0.00 0.00 0.00 0.00 0.00 0.00Japan 13.38 0.27 3.58 2.96 16.95 0.34Kazakhstan 17.19 0.35 0.00 0.00 17.19 0.34Kiribati 0.00 0.00 0.00 0.00 0.00 0.00Korea, Republic of 1,018.27 20.80 8.79 7.26 1,027.06 20.47Kyrgyz Republic 0.00 0.00 0.00 0.00 0.00 0.00Lao People’s Democratic Republic 0.00 0.00 0.00 0.00 0.00 0.00Luxembourg 0.00 0.00 0.00 0.00 0.00 0.00Malaysia 0.00 0.00 2.60 2.15 2.60 0.05Maldives 0.00 0.00 0.00 0.00 0.00 0.00Marshall Islands 0.00 0.00 0.00 0.00 0.00 0.00Micronesia, Federated States of 0.00 0.00 0.00 0.00 0.00 0.00Mongolia 0.00 0.00 0.00 0.00 0.00 0.00Myanmar 0.00 0.00 0.00 0.00 0.00 0.00Nauru 0.00 0.00 0.00 0.00 0.00 0.00Nepal 0.00 0.00 0.00 0.00 0.00 0.00The Netherlands 0.00 0.00 0.69 0.57 0.69 0.01New Zealand 0.00 0.00 1.57 1.30 1.57 0.03Norway 0.00 0.00 0.00 0.00 0.00 0.00Pakistan 343.88 7.02 11.52 9.52 355.40 7.08Palau 0.00 0.00 0.00 0.00 0.00 0.00Papua New Guinea 0.00 0.00 0.36 0.30 0.36 0.01Philippines 55.84 1.14 4.66 3.85 60.50 1.21Portugal 0.00 0.00 0.00 0.00 0.00 0.00Samoa 0.00 0.00 0.00 0.00 0.00 0.00Singapore 6.24 0.13 0.00 0.00 6.24 0.12Solomon Islands 0.00 0.00 0.00 0.00 0.00 0.00Spain 62.20 1.27 0.00 0.00 62.20 1.24Sri Lanka 152.15 3.11 1.42 1.17 153.57 3.06Sweden 0.00 0.00 0.00 0.00 0.00 0.00Switzerland 1.27 0.03 13.06 10.79 14.33 0.29Taipei,China 0.00 0.00 3.49 2.88 3.49 0.07Tajikistan 0.00 0.00 0.00 0.00 0.00 0.00Thailand 0.00 0.00 0.00 0.00 0.00 0.00Timor-Leste 0.00 0.00 0.00 0.00 0.00 0.00Tonga 0.00 0.00 0.00 0.00 0.00 0.00Turkey 104.90 2.14 0.00 0.00 104.90 2.09Turkmenistan 0.00 0.00 0.00 0.00 0.00 0.00Tuvalu 0.00 0.00 0.00 0.00 0.00 0.00United Kingdom 2.12 0.04 2.35 1.94 4.47 0.09United States 1.97 0.04 2.86 2.36 4.83 0.10Uzbekistan 4.47 0.09 8.67 7.16 13.14 0.26Vanuatu 0.00 0.00 0.00 0.00 0.00 0.00Viet Nam 128.85 2.63 0.00 0.00 128.85 2.57
tOtaL 4,895.23 100.00 121.01 100.00 5,016.25 100.00
0.00 = amount or percentage is nil or less than 0.01.Note: Totals may not add up because of rounding.
Asian Development Bank Annual Report 2011
294

Statistical Annex 26a CONTRACTS AWARDED BY COUNTRY OF ORIGIN, 2011 PROJECT LOANS—ASIAN DEVELOPMENT FUND (amounts in $ million)
Origin countrygoods
and works % Distribution consulting services % Distributiontotal contracts
awarded % Distribution
Afghanistan 7.07 0.69 0.16 0.18 7.23 0.65Armenia 3.88 0.38 0.14 0.16 4.02 0.36Australia 4.45 0.43 5.84 6.53 10.29 0.92Austria 1.43 0.14 0.00 0.00 1.43 0.13Azerbaijan 0.00 0.00 0.09 0.10 0.09 0.01Bangladesh 167.44 16.28 1.94 2.17 169.38 15.15Belgium 1.84 0.18 0.00 0.00 1.84 0.16Bhutan 4.30 0.42 0.00 0.00 4.30 0.38Brunei Darussalam 0.00 0.00 0.00 0.00 0.00 0.00Cambodia 24.68 2.40 0.31 0.35 24.99 2.24Canada 0.49 0.05 0.20 0.22 0.68 0.06China, People’s Republic of 45.39 4.41 0.00 0.00 45.39 4.06Cook Islands 0.00 0.00 0.00 0.00 0.00 0.00Denmark 0.00 0.00 1.73 1.94 1.74 0.16Fiji 0.00 0.00 0.00 0.00 0.00 0.00Finland 0.02 0.00 0.10 0.11 0.12 0.01France 3.91 0.38 0.72 0.80 4.63 0.41Georgia 27.25 2.65 0.51 0.57 27.76 2.48Germany 44.14 4.29 9.08 10.15 53.22 4.76Hong Kong, China 0.00 0.00 1.00 1.12 1.00 0.09India 72.78 7.08 3.30 3.69 76.08 6.81Indonesia 70.36 6.84 12.63 14.12 82.99 7.43Ireland 0.00 0.00 0.00 0.00 0.00 0.00Italy 0.53 0.05 0.00 0.00 0.53 0.05Japan 1.51 0.15 4.48 5.01 6.00 0.54Kazakhstan 0.00 0.00 0.00 0.00 0.00 0.00Kiribati 0.00 0.00 0.00 0.00 0.00 0.00Korea, Republic of 27.66 2.69 8.82 9.86 36.48 3.26Kyrgyz Republic 18.59 1.81 1.52 1.70 20.11 1.80Lao People’s Democratic Republic 3.11 0.30 0.00 0.00 3.11 0.28Luxembourg 0.96 0.09 0.00 0.00 0.96 0.09Malaysia 10.21 0.99 0.29 0.32 10.50 0.94Maldives 1.64 0.16 0.00 0.00 1.64 0.15Marshall Islands 0.00 0.00 0.00 0.00 0.00 0.00Micronesia, Federated States of 0.00 0.00 0.00 0.00 0.00 0.00Mongolia 4.80 0.47 0.06 0.07 4.86 0.44Myanmar 0.00 0.00 0.00 0.00 0.00 0.00Nauru 0.00 0.00 0.00 0.00 0.00 0.00Nepal 40.79 3.97 7.95 8.89 48.74 4.36The Netherlands 0.00 0.00 0.00 0.00 0.00 0.00New Zealand 2.91 0.28 4.46 4.99 7.37 0.66Norway 0.00 0.00 0.00 0.00 0.00 0.00Pakistan 47.50 4.62 3.43 3.83 50.93 4.56Palau 0.00 0.00 0.00 0.00 0.00 0.00Papua New Guinea 7.38 0.72 1.17 1.30 8.54 0.76Philippines 0.04 0.00 0.02 0.02 0.05 0.00Portugal 0.00 0.00 0.00 0.00 0.00 0.00Samoa 2.23 0.22 0.00 0.00 2.23 0.20Singapore 0.03 0.00 0.00 0.00 0.03 0.00Solomon Islands 0.00 0.00 0.00 0.00 0.00 0.00Spain 6.37 0.62 0.00 0.00 6.37 0.57Sri Lanka 58.71 5.71 0.02 0.03 58.74 5.26Sweden 0.00 0.00 0.00 0.00 0.00 0.00Switzerland 0.45 0.04 0.00 0.00 0.45 0.04Taipei,China 0.14 0.01 0.00 0.00 0.14 0.01Tajikistan 3.96 0.39 0.04 0.04 4.00 0.36Thailand 0.01 0.00 0.00 0.00 0.01 0.00Timor-Leste 0.00 0.00 0.00 0.00 0.00 0.00Tonga 0.00 0.00 0.00 0.00 0.00 0.00Turkey 0.92 0.09 0.02 0.03 0.94 0.08Turkmenistan 0.00 0.00 0.00 0.00 0.00 0.00Tuvalu 0.00 0.00 0.00 0.00 0.00 0.00United Kingdom 1.70 0.17 4.87 5.44 6.57 0.59United States 2.08 0.20 8.21 9.18 10.30 0.92Uzbekistan 51.63 5.02 0.55 0.61 52.17 4.67Vanuatu 0.00 0.00 0.00 0.00 0.00 0.00Viet Nam 252.93 24.60 5.79 6.48 258.72 23.15
tOtaL 1,028.22 100.00 89.45 100.00 1,117.67 100.00
0.00 = amount or percentage is nil or less than 0.01.Note: Totals may not add up because of rounding.
Statistical Annexes
295

Statistical Annex 26b CONTRACTS AWARDED BY NATIONALITY OF CONTRACTOR, 2011 PROJECT LOANS—ASIAN DEVELOPMENT FUND (amounts in $ million)
contractor countrygoods
and works % Distribution consulting services % Distributiontotal contracts
awarded % Distribution
Afghanistan 7.13 0.69 0.16 0.18 7.29 0.65 Armenia 3.99 0.39 0.14 0.16 4.13 0.37 Australia 4.23 0.41 5.84 6.53 10.07 0.90 Austria 1.43 0.14 0.00 0.00 1.43 0.13 Azerbaijan 0.00 0.00 0.09 0.10 0.09 0.01 Bangladesh 188.79 18.36 1.94 2.17 190.73 17.06 Belgium 1.84 0.18 0.00 0.00 1.84 0.16 Bhutan 4.30 0.42 0.00 0.00 4.30 0.38 Brunei Darussalam 0.00 0.00 0.00 0.00 0.00 0.00Cambodia 24.68 2.40 0.31 0.35 24.99 2.24 Canada 0.48 0.05 0.20 0.22 0.68 0.06 China, People’s Republic of 27.34 2.66 0.00 0.00 27.34 2.45 Cook Islands 0.00 0.00 0.00 0.00 0.00 0.00Denmark 0.26 0.03 1.73 1.93 2.00 0.18 Fiji 0.00 0.00 0.00 0.00 0.00 0.00Finland 0.00 0.00 0.01 0.01 0.01 0.00 France 3.90 0.38 0.72 0.80 4.62 0.41 Georgia 27.65 2.69 0.51 0.57 28.17 2.52 Germany 86.95 8.46 8.90 9.95 95.85 8.58 Hong Kong, China 0.00 0.00 1.00 1.12 1.00 0.09 India 14.27 1.39 3.30 3.69 17.57 1.57 Indonesia 74.12 7.21 11.90 13.30 86.02 7.70 Ireland 0.00 0.00 0.00 0.00 0.00 0.00Italy 0.00 0.00 0.00 0.00 0.00 0.00Japan 2.02 0.20 4.48 5.01 6.50 0.58 Kazakhstan 0.00 0.00 0.00 0.00 0.00 0.00Kiribati 0.00 0.00 0.00 0.00 0.00 0.00Korea, Republic of 27.46 2.67 9.65 10.79 37.11 3.32 Kyrgyz Republic 18.59 1.81 1.52 1.70 20.11 1.80 Lao People’s Democratic Republic 3.11 0.30 0.00 0.00 3.11 0.28 Luxembourg 0.00 0.00 0.00 0.00 0.00 0.00Malaysia 9.72 0.95 0.29 0.32 10.01 0.90 Maldives 1.64 0.16 0.00 0.00 1.64 0.15 Marshall Islands 0.00 0.00 0.00 0.00 0.00 0.00Micronesia, Federated States of 0.00 0.00 0.00 0.00 0.00 0.00Mongolia 4.80 0.47 0.27 0.30 5.07 0.45 Myanmar 0.00 0.00 0.00 0.00 0.00 0.00Nauru 0.00 0.00 0.00 0.00 0.00 0.00Nepal 40.95 3.98 7.94 8.88 48.89 4.37 The Netherlands 0.96 0.09 0.00 0.00 0.96 0.09 New Zealand 3.12 0.30 4.46 4.99 7.59 0.68 Norway 0.00 0.00 0.00 0.00 0.00 0.00Pakistan 47.48 4.62 3.45 3.86 50.93 4.56 Palau 0.00 0.00 0.00 0.00 0.00 0.00Papua New Guinea 8.24 0.80 1.17 1.31 9.40 0.84 Philippines 0.04 0.00 0.02 0.02 0.05 0.00 Portugal 0.00 0.00 0.00 0.00 0.00 0.00Samoa 2.23 0.22 0.00 0.00 2.23 0.20 Singapore 1.51 0.15 0.00 0.00 1.51 0.14 Solomon Islands 0.00 0.00 0.00 0.00 0.00 0.00Spain 14.94 1.45 0.00 0.00 14.94 1.34 Sri Lanka 58.55 5.69 0.02 0.02 58.58 5.24 Sweden 0.00 0.00 0.00 0.00 0.00 0.00Switzerland 0.34 0.03 0.00 0.00 0.34 0.03 Taipei,China 0.00 0.00 0.00 0.00 0.00 0.00Tajikistan 4.11 0.40 0.04 0.04 4.15 0.37 Thailand 0.00 0.00 0.00 0.00 0.00 0.00Timor-Leste 0.00 0.00 0.00 0.00 0.00 0.00Tonga 0.00 0.00 0.00 0.00 0.00 0.00Turkey 0.51 0.05 0.00 0.00 0.51 0.05 Turkmenistan 0.00 0.00 0.00 0.00 0.00 0.00Tuvalu 0.00 0.00 0.00 0.00 0.00 0.00 United Kingdom 0.00 0.00 4.87 5.44 4.87 0.44 United States 0.82 0.08 1.45 1.62 2.26 0.20 Uzbekistan 51.63 5.02 0.55 0.61 52.17 4.67 Vanuatu 0.00 0.00 0.00 0.00 0.00 0.00Viet Nam 254.05 24.71 12.54 14.02 266.59 23.85
tOtaL 1,028.22 100.00 89.45 100.00 1,117.67 100.00
0.00 = amount or percentage is nil or less than 0.01.Note: Totals may not add up because of rounding.
Asian Development Bank Annual Report 2011
296

Statistical Annex 27a CONTRACTS AWARDED BY COUNTRY OF ORIGIN, 2011 PROJECT LOANS—ORDINARY CAPITAL RESOURCES AND ASIAN DEVELOPMENT FUND COMBINED (amounts in $ million)
Origin countrygoods
and works % Distribution consulting services % Distributiontotal contracts
awarded % Distribution
Afghanistan 7.07 0.12 0.16 0.08 7.23 0.12Armenia 3.88 0.07 0.14 0.07 4.02 0.07Australia 6.05 0.10 13.39 6.36 19.44 0.32Austria 1.43 0.02 0.00 0.00 1.43 0.02Azerbaijan 21.45 0.36 1.78 0.85 23.23 0.38Bangladesh 167.79 2.83 1.94 0.92 169.73 2.77Belgium 2.49 0.04 0.00 0.00 2.49 0.04Bhutan 4.30 0.07 0.00 0.00 4.30 0.07Brunei Darussalam 0.00 0.00 0.00 0.00 0.00 0.00Cambodia 24.68 0.42 0.31 0.15 24.99 0.41Canada 0.94 0.02 0.26 0.12 1.20 0.02China, People’s Republic of 1,461.28 24.67 5.25 2.49 1,466.53 23.91Cook Islands 0.00 0.00 0.00 0.00 0.00 0.00Denmark 0.08 0.00 1.75 0.83 1.82 0.03Fiji 7.99 0.13 0.00 0.00 7.99 0.13Finland 0.02 0.00 0.11 0.05 0.13 0.00France 3.91 0.07 1.78 0.85 5.69 0.09Georgia 27.25 0.46 0.51 0.24 27.76 0.45Germany 98.07 1.66 9.23 4.39 107.30 1.75Hong Kong, China 0.00 0.00 2.07 0.98 2.07 0.03India 1,426.83 24.09 34.66 16.47 1,461.49 23.83Indonesia 130.37 2.20 15.72 7.47 146.10 2.38Ireland 0.00 0.00 0.00 0.00 0.00 0.00Italy 0.53 0.01 0.00 0.00 0.53 0.01Japan 13.71 0.23 8.06 3.83 21.77 0.35Kazakhstan 17.19 0.29 0.00 0.00 17.19 0.28Kiribati 0.00 0.00 0.00 0.00 0.00 0.00Korea, Republic of 1,044.80 17.64 16.85 8.01 1,061.65 17.31Kyrgyz Republic 18.59 0.31 1.52 0.72 20.11 0.33Lao People’s Democratic Republic 3.11 0.05 0.00 0.00 3.11 0.05Luxembourg 0.96 0.02 0.00 0.00 0.96 0.02Malaysia 10.21 0.17 2.89 1.37 13.10 0.21Maldives 1.64 0.03 0.00 0.00 1.64 0.03Marshall Islands 0.14 0.00 0.00 0.00 0.14 0.00Micronesia, Federated States of 0.00 0.00 0.00 0.00 0.00 0.00Mongolia 4.80 0.08 0.06 0.03 4.86 0.08Myanmar 0.00 0.00 0.00 0.00 0.00 0.00Nauru 0.00 0.00 0.00 0.00 0.00 0.00Nepal 40.79 0.69 7.95 3.78 48.74 0.79The Netherlands 0.00 0.00 4.61 2.19 4.61 0.08New Zealand 7.73 0.13 6.06 2.88 13.79 0.22Norway 0.00 0.00 0.00 0.00 0.00 0.00Pakistan 391.47 6.61 14.95 7.10 406.42 6.63Palau 0.00 0.00 0.00 0.00 0.00 0.00Papua New Guinea 7.38 0.12 1.52 0.72 8.90 0.15Philippines 55.51 0.94 4.67 2.22 60.18 0.98Portugal 0.00 0.00 0.00 0.00 0.00 0.00Samoa 2.23 0.04 0.00 0.00 2.23 0.04Singapore 7.71 0.13 0.00 0.00 7.71 0.13Solomon Islands 0.00 0.00 0.00 0.00 0.00 0.00Spain 68.56 1.16 0.00 0.00 68.56 1.12Sri Lanka 229.86 3.88 2.19 1.04 232.05 3.78Sweden 0.11 0.00 0.00 0.00 0.11 0.00Switzerland 1.77 0.03 13.06 6.21 14.83 0.24Taipei,China 0.14 0.00 3.49 1.66 3.62 0.06Tajikistan 3.96 0.07 0.04 0.02 4.00 0.07Thailand 0.07 0.00 0.00 0.00 0.07 0.00Timor-Leste 0.00 0.00 0.00 0.00 0.00 0.00Tonga 0.00 0.00 0.00 0.00 0.00 0.00Turkey 138.77 2.34 0.02 0.01 138.79 2.26Turkmenistan 0.00 0.00 0.00 0.00 0.00 0.00Tuvalu 0.00 0.00 0.00 0.00 0.00 0.00United Kingdom 9.10 0.15 15.88 7.54 24.98 0.41United States 12.93 0.22 11.20 5.32 24.13 0.39Uzbekistan 55.23 0.93 0.59 0.28 55.82 0.91Vanuatu 0.00 0.00 0.00 0.00 0.00 0.00Viet Nam 378.56 6.39 5.79 2.75 384.36 6.27
tOtaL 5,923.45 100.00 210.46 100.00 6,133.92 100.00
0.00 = amount or percentage is nil or less than 0.01.Note: Totals may not add up because of rounding.
Statistical Annexes
297

Statistical Annex 27b CONTRACTS AWARDED BY NATIONALITY OF CONTRACTOR, 2011 PROJECT LOANS—ORDINARY CAPITAL RESOURCES AND ASIAN DEVELOPMENT FUND COMBINED (amounts in $ million)
Origin countrygoods
and works % Distribution consulting services % Distributiontotal contracts
awarded % Distribution
Afghanistan 7.13 0.12 0.16 0.08 7.29 0.12Armenia 3.99 0.07 0.14 0.07 4.13 0.07Australia 5.83 0.10 12.99 6.17 18.82 0.31Austria 1.43 0.02 0.00 0.00 1.43 0.02Azerbaijan 59.36 1.00 1.78 0.85 61.15 1.00Bangladesh 189.15 3.19 1.94 0.92 191.08 3.12Belgium 2.49 0.04 0.00 0.00 2.49 0.04Bhutan 4.30 0.07 0.00 0.00 4.30 0.07Brunei Darussalam 0.00 0.00 0.00 0.00 0.00 0.00Cambodia 24.68 0.42 0.31 0.15 24.99 0.41Canada 0.94 0.02 0.20 0.10 1.13 0.02China, People’s Republic of 1,442.12 24.35 2.84 1.35 1,444.96 23.56Cook Islands 0.00 0.00 0.00 0.00 0.00 0.00Denmark 0.26 0.00 1.73 0.82 2.00 0.03Fiji 12.81 0.22 0.79 0.38 13.60 0.22Finland 0.00 0.00 0.01 0.00 0.01 0.00France 3.90 0.07 1.66 0.79 5.56 0.09Georgia 27.65 0.47 0.51 0.24 28.17 0.46Germany 139.79 2.36 9.02 4.29 148.80 2.43Hong Kong, China 7.28 0.12 4.50 2.14 11.78 0.19India 1,386.51 23.41 38.59 18.34 1,425.10 23.24Indonesia 134.28 2.27 14.99 7.12 149.27 2.43Ireland 0.00 0.00 0.00 0.00 0.00 0.00Italy 0.00 0.00 0.00 0.00 0.00 0.00Japan 15.39 0.26 8.06 3.83 23.45 0.38Kazakhstan 17.19 0.29 0.00 0.00 17.19 0.28Kiribati 0.00 0.00 0.00 0.00 0.00 0.00Korea, Republic of 1,045.73 17.65 18.44 8.76 1,064.17 17.35Kyrgyz Republic 18.59 0.31 1.52 0.72 20.11 0.33Lao People’s Democratic Republic 3.11 0.05 0.00 0.00 3.11 0.05Luxembourg 0.00 0.00 0.00 0.00 0.00 0.00Malaysia 9.72 0.16 2.89 1.37 12.60 0.21Maldives 1.64 0.03 0.00 0.00 1.64 0.03Marshall Islands 0.00 0.00 0.00 0.00 0.00 0.00Micronesia, Federated States of 0.00 0.00 0.00 0.00 0.00 0.00Mongolia 4.80 0.08 0.27 0.13 5.07 0.08Myanmar 0.00 0.00 0.00 0.00 0.00 0.00Nauru 0.00 0.00 0.00 0.00 0.00 0.00Nepal 40.95 0.69 7.94 3.77 48.89 0.80The Netherlands 0.96 0.02 0.69 0.33 1.65 0.03New Zealand 3.12 0.05 6.03 2.87 9.15 0.15Norway 0.00 0.00 0.00 0.00 0.00 0.00Pakistan 391.36 6.61 14.97 7.11 406.33 6.63Palau 0.00 0.00 0.00 0.00 0.00 0.00Papua New Guinea 8.24 0.14 1.52 0.72 9.76 0.16Philippines 55.87 0.94 4.67 2.22 60.55 0.99Portugal 0.00 0.00 0.00 0.00 0.00 0.00Samoa 2.23 0.04 0.00 0.00 2.23 0.04Singapore 7.75 0.13 0.00 0.00 7.75 0.13Solomon Islands 0.00 0.00 0.00 0.00 0.00 0.00Spain 77.14 1.30 0.00 0.00 77.14 1.26Sri Lanka 210.71 3.56 1.44 0.68 212.15 3.46Sweden 0.00 0.00 0.00 0.00 0.00 0.00Switzerland 1.61 0.03 13.06 6.21 14.67 0.24Taipei,China 0.00 0.00 3.49 1.66 3.49 0.06Tajikistan 4.11 0.07 0.04 0.02 4.15 0.07Thailand 0.00 0.00 0.00 0.00 0.00 0.00Timor-Leste 0.00 0.00 0.00 0.00 0.00 0.00Tonga 0.00 0.00 0.00 0.00 0.00 0.00Turkey 105.41 1.78 0.00 0.00 105.41 1.72Turkmenistan 0.00 0.00 0.00 0.00 0.00 0.00Tuvalu 0.00 0.00 0.00 0.00 0.00 0.00United Kingdom 2.12 0.04 7.22 3.43 9.34 0.15United States 2.79 0.05 4.31 2.05 7.10 0.12Uzbekistan 56.09 0.95 9.22 4.38 65.31 1.06Vanuatu 0.00 0.00 0.00 0.00 0.00 0.00Viet Nam 382.89 6.46 12.54 5.96 395.43 6.45
tOtaL 5,923.45 100.00 210.46 100.00 6,133.92 100.00
0.00 = amount or percentage is nil or less than 0.01.Note: Totals may not add up because of rounding.
Asian Development Bank Annual Report 2011
298

Statistical Annex 28a ESTIMATES OF PAYMENT TO SUPPLYING COUNTRIES FOR FOREIGN PROCUREMENT UNDER PROGRAM LENDING, 2011By country of Origin
country
Ordinary capital Resources (OcR) asian Development Fund (aDF) combined OcR and aDF
$ Million % Distribution $ Million % Distribution $ Million % DistributionAfghanistan 2.26 0.23 0.00 0.00 2.27 0.19Armenia 0.00 0.00 0.00 0.00 0.00 0.00Australia 38.48 3.98 4.46 1.84 42.94 3.55Austria 3.64 0.38 0.36 0.15 4.01 0.33Azerbaijan 1.96 0.20 0.00 0.00 1.96 0.16Bangladesh 1.69 0.17 0.11 0.05 1.80 0.15Belgium 13.34 1.38 1.04 0.43 14.37 1.19Bhutan 0.05 0.01 0.05 0.02 0.10 0.01Brunei Darussalam 7.12 0.74 0.00 0.00 7.12 0.59Cambodia 0.05 0.01 0.33 0.14 0.38 0.03Canada 18.69 1.93 1.65 0.68 20.34 1.68China, People’s Republic of 247.80 25.64 55.67 23.03 303.46 25.12Cook Islands 2.49 0.26 0.43 0.18 2.92 0.24Denmark 0.00 0.00 0.00 0.00 0.00 0.00Fiji 0.00 0.00 0.00 0.00 0.00 0.00Finland 4.47 0.46 0.55 0.23 5.02 0.42France 21.03 2.18 2.67 1.10 23.70 1.96Georgia 0.00 0.00 0.00 0.00 0.00 0.00Germany 41.77 4.32 4.67 1.93 46.44 3.84Hong Kong, China 20.56 2.13 11.31 4.68 31.87 2.64India 14.49 1.50 25.94 10.73 40.43 3.35Indonesia 12.16 1.26 5.88 2.43 18.04 1.49Ireland 4.57 0.47 0.11 0.04 4.68 0.39Italy 7.45 0.77 2.09 0.86 9.54 0.79Japan 116.10 12.01 18.56 7.68 134.67 11.15Kazakhstan 0.20 0.02 0.01 0.00 0.21 0.02Kiribati 0.00 0.00 0.00 0.00 0.00 0.00Korea, Republic of 45.75 4.73 16.60 6.87 62.35 5.16Kyrgyz Republic 0.00 0.00 0.00 0.00 0.00 0.00Lao People’s Democratic Republic 0.44 0.05 0.40 0.17 0.84 0.07Luxembourg 0.13 0.01 0.02 0.01 0.14 0.01Malaysia 50.61 5.24 8.48 3.51 59.09 4.89Maldives 0.05 0.01 0.00 0.00 0.05 0.00Marshall Islands 0.00 0.00 0.00 0.00 0.00 0.00Micronesia, Federated States of 0.00 0.00 0.00 0.00 0.00 0.00Mongolia 0.00 0.00 0.00 0.00 0.00 0.00Myanmar 3.02 0.31 0.31 0.13 3.32 0.28Nauru 0.01 0.00 0.00 0.00 0.01 0.00Nepal 0.16 0.02 0.07 0.03 0.23 0.02The Netherlands 6.19 0.64 1.44 0.60 7.63 0.63New Zealand 4.83 0.50 0.61 0.25 5.44 0.45Norway 1.14 0.12 0.22 0.09 1.37 0.11Pakistan 0.68 0.07 1.00 0.41 1.67 0.14Palau 0.00 0.00 0.00 0.00 0.00 0.00Papua New Guinea 0.97 0.10 0.00 0.00 0.97 0.08Philippines 5.16 0.53 1.36 0.56 6.52 0.54Portugal 0.17 0.02 0.03 0.01 0.20 0.02Samoa 0.00 0.00 0.00 0.00 0.00 0.00Singapore 107.46 11.12 24.52 10.14 131.97 10.92Solomon Islands 0.16 0.02 0.00 0.00 0.16 0.01Spain 2.59 0.27 0.46 0.19 3.05 0.25Sri Lanka 0.50 0.05 0.08 0.03 0.59 0.05Sweden 5.30 0.55 0.64 0.26 5.94 0.49Switzerland 7.30 0.76 2.75 1.14 10.06 0.83Taipei,China 0.90 0.09 0.49 0.20 1.38 0.11Tajikistan 0.01 0.00 0.07 0.03 0.07 0.01Thailand 35.83 3.71 27.56 11.40 63.39 5.25Timor-Leste 0.00 0.00 0.00 0.00 0.00 0.00Tonga 0.00 0.00 0.00 0.00 0.00 0.00Turkey 3.31 0.34 0.46 0.19 3.77 0.31Turkmenistan 0.00 0.00 0.08 0.03 0.09 0.01Tuvalu 0.00 0.00 0.00 0.00 0.00 0.00United Kingdom 8.80 0.91 1.58 0.65 10.38 0.86United States 85.48 8.85 8.56 3.54 94.04 7.78Uzbekistan 0.02 0.00 1.02 0.42 1.04 0.09Vanuatu 0.21 0.02 0.00 0.00 0.21 0.02Viet Nam 8.84 0.91 7.04 2.91 15.88 1.31
tOtaL 966.40 100.00 241.75 100.00 1,208.15 100.00
0.00 = amount or percentage is nil or less than 0.01.Note: Totals may not add up because of rounding.
Statistical Annexes
299

Statistical Annex 28b ESTIMATES OF PAYMENT TO SUPPLYING COUNTRIES FOR FOREIGN PROCUREMENT UNDER PROGRAM LENDING, 2011By nationality of contractor
country
Ordinary capital Resources (OcR) asian Development Fund (aDF) combined OcR and aDF
$ Million % Distribution $ Million % Distribution $ Million % Distribution
Afghanistan – – – – – –Armenia – – – – – –Australia – – – – – –Austria – – – – – –Azerbaijan – – – – – –Bangladesh – – 24.79 10.26 24.79 2.05Belgium – – – – – –Bhutan – – – – – –Brunei Darussalam – – – – – –Cambodia – – 10.37 4.29 10.37 0.86Canada – – – – – –China, People’s Republic of – – 10.36 4.28 10.36 0.86Cook Islands – – – – – –Denmark – – – – – –Fiji – – – – – –Finland – – – – – –France – – – – – –Georgia – – – – – –Germany – – – – – –Hong Kong, China – – – – – –India 60.00 6.21 4.97 2.05 64.97 5.38Indonesia 200.00 20.70 – – 200.00 16.55Ireland – – – – – –Italy – – – – – –Japan – – – – – –Kazakhstan – – – – – –Kiribati – – – – – –Korea, Republic of – – 1.81 0.75 1.81 0.15Kyrgyz Republic – – – 0.00 – –Lao People’s Democratic Republic – – 8.00 3.31 8.00 0.66Luxembourg – – – – – –Malaysia – – – – – –Maldives – – – – – –Marshall Islands – – – – – –Micronesia, Federated States of – – – – – –Mongolia – – – – – –Myanmar – – – – – –Nauru – – – – – –Nepal – – 25.35 10.48 25.35 2.10The Netherlands – – – – – –New Zealand – – – – – –Norway – – – – – –Pakistan 200.00 20.70 – – 200.00 16.55Palau 6.40 0.66 3.47 1.44 9.87 0.82Papua New Guinea – – – – – –Philippines – – – – – –Portugal – – – – – –Samoa – – – – – –Singapore – – – – – –Solomon Islands – – – – – –Spain – – – – – –Sri Lanka – – – – – –Sweden – – – – – –Switzerland – – – – – –Taipei,China – – – – – –Tajikistan – – – – – –Thailand 100.00 10.35 2.79 1.15 102.79 8.51Timor-Leste – – – – – –Tonga – – – – – –Turkey – – – – – –Turkmenistan – – 0.01 0.01 0.01 –Tuvalu – – – – – –United Kingdom – – – – – –United States 400.00 41.39 134.03 55.44 534.03 44.20Uzbekistan – – – – – –Vanuatu – – – – – –Viet Nam – – 15.80 6.53 15.80 1.31
tOtaL 966.40 100.00 241.75 100.00 1,208.15 100.00
– = nil.Note: Totals may not add up because of rounding.
Asian Development Bank Annual Report 2011
300

Statistical Annex 29 CUMULATIVE CONTRACTS AWARDED BY COUNTRY OF ORIGINTECHNICAL ASSISTANCE OPERATIONS (amounts in $ million; as of 31 December 2011)
country
aDB’s Own
Resources%
Distribution
administered trust Funds
% Distribution
Japan special Fund
% Distribution
total contracts awarded
% Distribution
Afghanistan 1.59 0.09 1.78 0.23 0.20 0.02 3.58 0.10 Armenia – – – – – – – – Australia 199.17 11.98 88.88 11.47 134.70 13.73 422.75 12.37 Austria 1.52 0.09 0.12 0.01 0.92 0.09 2.56 0.07 Azerbaijan 0.59 0.03 0.29 0.03 0.02 0.00 0.89 0.02 Bangladesh 28.06 1.68 10.26 1.32 7.54 0.76 45.86 1.34 Belgium 7.14 0.43 1.38 0.17 2.26 0.23 10.78 0.31 Bhutan 0.86 0.05 0.42 0.05 0.15 0.01 1.43 0.04 Brunei Darussalam – – – – – – – – Cambodia 3.11 0.18 3.61 0.46 0.54 0.05 7.25 0.21 Canada 117.77 7.08 56.33 7.27 69.47 7.08 243.57 7.12 China, People’s Republic of 38.38 2.31 12.31 1.58 8.08 0.82 58.78 1.72 Cook Islands 0.10 0.00 0.27 0.03 – – 0.37 0.01 Denmark 13.67 0.82 10.55 1.36 19.04 1.94 43.26 1.26 Fiji 2.50 0.15 1.88 0.24 0.47 0.04 4.85 0.14 Finland 10.46 0.63 7.21 0.93 9.59 0.97 27.26 0.79 France 38.63 2.32 23.74 3.06 26.76 2.72 89.13 2.60 Georgia 0.41 0.02 0.03 0.00 – – 0.44 0.01 Germany 34.15 2.05 23.79 3.07 36.84 3.75 94.79 2.77 Hong Kong, China 38.18 2.29 14.81 1.91 22.02 2.24 75.01 2.19 India 83.54 5.02 40.68 5.24 38.85 3.96 163.06 4.77 Indonesia 22.07 1.32 20.65 2.66 12.42 1.26 55.14 1.61 Ireland 2.69 0.16 0.41 0.05 0.17 0.01 3.26 0.09 Italy 6.33 0.38 1.45 0.18 2.68 0.27 10.46 0.30 Japan 37.76 2.27 19.68 2.53 32.59 3.32 90.03 2.63 Kazakhstan 1.94 0.11 1.57 0.20 0.13 0.01 3.63 0.10 Kiribati 0.03 0.00 0.05 0.00 0.01 0.00 0.09 0.00Korea, Republic of 8.81 0.53 3.57 0.46 4.18 0.42 16.56 0.48 Kyrgyz Republic 2.52 0.15 0.95 0.12 0.22 0.02 3.69 0.10 Lao People’s Democratic Republic 3.77 0.22 2.73 0.35 1.16 0.11 7.66 0.22 Luxembourg – – 0.10 0.01 0.09 0.00 0.18 0.00Malaysia 15.20 0.91 2.69 0.34 4.57 0.46 22.47 0.65 Maldives 0.17 0.01 0.06 0.00 0.03 0.00 0.25 0.00Marshall Islands 0.32 0.01 0.19 0.02 0.01 0.00 0.52 0.01 Micronesia, Federated States of 0.01 0.00 – – 0.22 0.02 0.23 0.00Mongolia 2.71 0.16 1.68 0.21 0.84 0.08 5.23 0.15 Myanmar 0.99 0.05 0.70 0.09 0.01 0.00 1.70 0.05 Nauru 0.01 0.00 0.02 0.00 – – 0.04 0.00Nepal 14.50 0.87 8.10 1.04 3.68 0.37 26.28 0.76 The Netherlands 29.85 1.79 28.46 3.67 32.28 3.29 90.60 2.65 New Zealand 79.40 4.77 35.55 4.58 70.23 7.16 185.18 5.41 Norway 5.94 0.35 5.25 0.67 3.48 0.35 14.67 0.42 Pakistan 33.44 2.01 13.70 1.76 4.67 0.47 51.81 1.51 Palau 0.02 0.00 0.01 0.00 – – 0.02 0.00Papua New Guinea 1.47 0.08 0.71 0.09 1.78 0.18 3.95 0.11 Philippines 131.51 7.91 42.14 5.43 37.91 3.86 211.57 6.19 Portugal 0.45 0.02 0.07 0.01 0.10 0.01 0.62 0.01 Samoa 0.90 0.05 0.19 0.02 0.90 0.09 1.99 0.05 Singapore 24.21 1.45 7.28 0.94 10.85 1.10 42.35 1.23 Solomon Islands 0.66 0.04 0.24 0.03 0.22 0.02 1.11 0.03 Spain 11.71 0.70 6.23 0.80 1.01 0.10 18.95 0.55 Sri Lanka 16.85 1.01 6.82 0.88 3.97 0.40 27.64 0.80 Sweden 7.99 0.48 7.13 0.92 10.12 1.03 25.25 0.73 Switzerland 18.36 1.10 6.68 0.86 13.81 1.40 38.85 1.13 Taipei,China 1.15 0.06 0.07 0.00 2.71 0.27 3.93 0.11 Tajikistan 1.03 0.06 1.37 0.17 0.18 0.01 2.58 0.07 Thailand 16.56 0.99 16.11 2.08 12.31 1.25 44.98 1.31 Timor-Leste 1.49 0.08 0.48 0.05 0.15 0.01 2.12 0.06 Tonga 1.17 0.07 0.07 0.00 0.25 0.02 1.48 0.04 Turkey 0.46 0.02 0.27 0.03 0.05 0.00 0.78 0.02 Turkmenistan 0.18 0.01 0.05 0.00 – – 0.23 0.00Tuvalu 0.06 – 0.02 0.00 0.03 0.00 0.11 0.00United Kingdom 204.82 12.32 85.53 11.03 141.85 14.46 432.20 12.64 United States 294.73 17.73 127.19 16.41 177.98 18.14 599.90 17.55 Uzbekistan 3.17 0.19 0.78 0.10 0.81 0.08 4.75 0.13 Vanuatu 0.89 0.05 0.14 0.01 1.20 0.12 2.23 0.06 Viet Nam 6.33 0.38 6.14 0.79 3.42 0.34 15.89 0.46 International Organizations 23.21 1.39 4.07 0.52 4.90 0.50 32.17 0.94 Regional 3.31 0.19 9.20 1.18 3.12 0.31 15.63 0.45 Others 0.56 0.03 – – – – 0.56 0.01
tOtaL 1,661.52 100.00 774.85 100.00 980.74 100.00 3,417.11 100.00
– = nill, 0.00 = amount or percentage is less than 0.01.Note: Totals may not add up because of rounding.
Statistical Annexes
301

Statistical Annex 30 CONTRACTS AWARDED BY NATIONALITY OF CONSULTANT, 2009–2011 TECHNICAL ASSISTANCE OPERATIONS (amounts in $ million)
country
2009 2010 2011
amount % amount % amount %
Afghanistan 0.31 0.17 0.13 0.07 0.21 0.10 Armenia 0.07 0.04 0.24 0.13 0.32 0.15 Australia 28.66 15.63 18.30 9.88 20.12 9.37 Austria 0.18 0.10 0.07 0.04 0.13 0.06 Azerbaijan 0.01 0.00 0.03 0.02 0.02 0.01 Bangladesh 4.46 2.43 8.46 4.57 4.09 1.90 Belgium 0.63 0.35 0.37 0.20 1.44 0.67 Bhutan 0.15 0.08 0.34 0.19 0.14 0.07 Brunei Darussalam 0.00 0.00 0.02 0.01 0.00 0.00Cambodia 0.37 0.20 0.43 0.23 0.48 0.22 Canada 8.94 4.87 9.70 5.24 9.06 4.22 China, People’s Republic of 8.69 4.74 7.15 3.86 8.09 3.77 Cook Islands 0.13 0.07 0.01 0.01 0.00 0.00 Denmark 0.62 0.34 3.79 2.04 2.77 1.29 Fiji 0.77 0.42 0.17 0.09 1.10 0.51 Finland 0.68 0.37 0.16 0.09 0.67 0.31 France 5.75 3.14 5.13 2.77 8.80 4.10 Georgia 0.00 0.00 0.31 0.17 0.03 0.01 Germany 3.72 2.03 5.87 3.17 7.90 3.68 Hong Kong, China 3.43 1.87 6.23 3.36 4.74 2.21 India 16.65 9.08 18.29 9.87 13.04 6.07 Indonesia 2.74 1.49 2.67 1.44 5.25 2.44 Ireland 0.82 0.45 0.78 0.42 0.98 0.46 Italy 0.39 0.21 0.54 0.29 0.74 0.34 Japan 9.69 5.28 2.16 1.17 6.59 3.07 Kazakhstan 0.13 0.07 0.50 0.27 0.25 0.12 Kiribati 0.02 0.01 0.01 0.01 0.00 0.00Korea, Republic of 1.26 0.69 1.27 0.68 2.81 1.31 Kyrgyz Republic 0.58 0.32 0.40 0.21 0.20 0.09 Lao People’s Democratic Republic 0.35 0.19 0.78 0.42 0.42 0.20 Luxembourg 0.13 0.07 0.01 0.00 0.00 0.00Malaysia 0.80 0.43 0.82 0.44 2.18 1.01 Maldives 0.01 0.01 0.00 0.00 0.06 0.03 Marshall Islands 0.01 0.01 0.05 0.02 0.12 0.06 Micronesia, Federated States of 0.00 0.00 0.20 0.11 0.00 0.00 Mongolia 0.40 0.22 0.88 0.48 0.81 0.37 Myanmar 0.00 0.00 0.00 0.00 0.00 0.00Nauru 0.02 0.01 0.01 0.01 0.01 0.00 Nepal 2.94 1.60 2.67 1.44 1.31 0.61 The Netherlands 8.67 4.73 4.68 2.52 4.44 2.07 New Zealand 6.66 3.63 8.72 4.71 17.91 8.34 Norway 0.13 0.07 0.06 0.03 1.48 0.69 Pakistan 2.99 1.63 3.36 1.81 2.92 1.36 Palau 0.00 0.00 0.00 0.00 0.00 0.00 Papua New Guinea 0.15 0.08 0.39 0.21 0.19 0.09 Philippines 10.81 5.89 17.04 9.20 12.66 5.89 Portugal 0.05 0.02 0.10 0.05 0.10 0.05 Samoa 0.00 0.00 0.10 0.05 0.10 0.05 Singapore 3.07 1.67 2.15 1.16 1.53 0.71 Solomon Islands 0.05 0.03 0.04 0.02 0.12 0.06 Spain 2.46 1.34 2.92 1.58 2.38 1.11 Sri Lanka 1.08 0.59 1.65 0.89 3.13 1.46 Sweden 1.08 0.59 0.98 0.53 0.20 0.09 Switzerland 5.75 3.14 0.28 0.15 0.43 0.20 Taipei,China 0.00 0.00 0.04 0.02 0.04 0.02 Tajikistan 0.10 0.05 0.28 0.15 0.27 0.13 Thailand 0.81 0.44 1.48 0.80 7.20 3.35 Timor-Leste 0.00 0.00 0.11 0.06 0.05 0.02 Tonga 0.42 0.23 0.26 0.14 0.17 0.08 Turkey 0.00 0.00 0.01 0.01 0.00 0.00Turkmenistan 0.01 0.01 0.01 0.00 0.02 0.01 Tuvalu 0.00 0.00 0.00 0.00 0.05 0.02 United Kingdom 17.93 9.78 16.94 9.15 14.93 6.95 United States 15.18 8.28 22.99 12.41 37.87 17.63 Uzbekistan 0.61 0.33 0.51 0.28 0.83 0.38 Vanuatu 0.01 0.01 0.13 0.07 0.13 0.06 Viet Nam 0.85 0.46 1.13 0.61 0.80 0.37
tOtaL 183.40 100.00 185.25 100.00 214.86 100.00
0.00 = amount or percentage is nil or less than 0.01.Note: Totals may not add up because of rounding.
Asian Development Bank Annual Report 2011
302

Statistical Annex 31 CONTRACTS AWARDED BY NATIONALITY OF CONSULTANT, 2009–2011 GRANT OPERATIONS—ADB-Administered Consulting Services (amounts in $ million)
country
2009 2010 2011
amount % amount % amount %
Afghanistan 0.03 0.22 – – – – Armenia – – – – – – Australia 2.79 23.70 0.12 5.86 2.78 48.50 Austria – – – – – – Azerbaijan – – – – – – Bangladesh 0.10 0.85 – – – – Belgium 0.36 3.04 – – – – Bhutan – – 0.14 6.93 0.07 1.20 Brunei Darussalam – – – – – – Cambodia 0.26 2.22 0.37 18.07 0.11 1.90 Canada 0.39 3.32 0.09 4.36 – – China, People’s Republic of – – – – – – Cook Islands – – – – – – Denmark – – – – – – Fiji – – – – – – Finland – – – – – – France – – – – – – Georgia – – – – – – Germany 0.07 0.59 0.08 3.88 1.55 27.03 Hong Kong, ChinaIndia 0.39 3.33 0.23 11.05 0.39 6.71 Indonesia 0.57 4.86 0.03 1.60 0.03 0.47 Ireland 0.08 0.66 – – – ItalyJapan – – 0.11 5.09 0.03 0.53 Kazakhstan – – – – – – Kiribati – – – – – – Korea, Republic of – – – – – – Kyrgyz Republic – – – – – – Lao People’s Democratic Republic 0.03 0.24 – – – – Luxembourg – – – – – – Malaysia – – – – – – Maldives – – – – – – Marshall Islands – – – – 0.05 0.78 Micronesia, Federated States of – – – – – – Mongolia – – – – – – Myanmar – – – – – – Nauru – – – – – – Nepal – – 0.19 9.21 0.10 1.78 The Netherlands – – 0.06 2.91 – New Zealand 0.20 1.68 0.15 7.08 0.15 2.53 Norway – – – – – – Pakistan – – – – – – Palau – – – – – – Papua New Guinea 0.05 0.42 0.03 1.55 – – Philippines 0.37 3.10 0.11 5.48 0.35 6.14 Portugal – – – – – – Samoa – – – – – – Singapore – – – – – – Solomon Islands – – – – – – Spain – – – – – – Sri Lanka 0.09 0.75 0.08 3.88 – Sweden – – – – – – Switzerland – – – – – – Taipei,China – – – – – – Tajikistan 1.54 13.04 – – – – Thailand – – – – – – Timor-Leste – – – – – – Tonga – – – – – – Turkey – – – – – – Turkmenistan – – – – – – Tuvalu – – – – – – United Kingdom 2.05 17.39 – – 0.06 1.09 United States 2.35 19.90 0.15 7.17 0.08 1.34 Uzbekistan – – – – – – Vanuatu – – – – – – Viet Nam 0.08 0.70 0.12 5.88 – –
tOtaL 11.79 100.00 2.06 100.00 5.74 100.00
– = nil, 0.00 = amount or percentage is less than 0.01.Note: Totals may not add up because of rounding.
Statistical Annexes
303

Statistical Annex 32 CONTRACTS AWARDED BY NATIONALITY OF CONTRACTOR, 2009–2011 GRANT OPERATIONS—Executing Agency-Administered Goods, Works, and Consulting Services (amounts in $ million)
country
2009 2010 2011
amount % amount % amount %
Afghanistan 4.52 0.74 77.04 19.74 3.96 0.31 Armenia 9.10 1.49 0.12 0.03 0.00 0.00Australia 29.71 4.87 14.11 3.62 32.56 2.58 Austria 4.20 0.69 0.00 0.00 0.00 0.00Azerbaijan 0.10 0.02 3.37 0.86 0.00 0.00Bangladesh 6.50 1.06 8.87 2.27 9.11 0.72 Belgium 0.05 0.01 0.00 0.00 0.00 0.00Bhutan 2.97 0.49 2.06 0.53 61.06 4.85 Brunei Darussalam 0.00 0.00 0.00 0.00 0.00 0.00Cambodia 17.34 2.84 15.48 3.97 14.00 1.11 Canada 3.59 0.59 0.76 0.19 39.01 3.10 China, People’s Republic of 21.15 3.46 63.30 16.22 143.94 11.42 Cook Islands 0.00 0.00 0.00 0.00 0.06 0.00 Denmark 0.04 0.01 0.25 0.06 18.05 1.43 Fiji 0.05 0.01 0.38 0.10 0.29 0.02 Finland 0.33 0.05 3.93 1.01 17.09 1.36 France 50.46 8.26 3.81 0.98 8.86 0.70 Georgia 0.01 0.00 0.00 0.00 0.00 0.00Germany 21.16 3.47 3.23 0.83 39.51 3.14 Hong Kong, China 33.81 5.54 0.00 0.00 1.93 0.15 India 10.27 1.68 7.72 1.98 33.14 2.63 Indonesia 18.33 3.00 4.91 1.26 2.30 0.18 Ireland 0.02 0.00 4.17 1.07 0.00 0.00Italy 0.62 0.10 0.01 0.00 10.07 0.80 Japan 9.70 1.59 5.99 1.54 30.44 2.42 Kazakhstan 0.29 0.05 1.10 0.28 0.00 0.00 Kiribati 0.00 0.00 0.00 0.00 0.00 0.00Korea, Republic of 66.68 10.92 0.47 0.12 38.96 3.09 Kyrgyz Republic 12.95 2.12 6.19 1.59 32.27 2.56 Lao People’s Democratic Republic 9.57 1.57 33.88 8.68 20.96 1.66 Luxembourg 0.28 0.05 0.00 0.00 38.05 3.02 Malaysia 0.36 0.06 3.67 0.94 4.96 0.39 Maldives 0.18 0.03 0.00 0.00 0.00 0.00 Marshall Islands 0.00 0.00 0.00 0.00 0.32 0.03 Micronesia, Federated States of 0.19 0.03 0.17 0.04 0.26 0.02 Mongolia 11.63 1.91 22.09 5.66 12.79 1.01 Myanmar 0.00 0.00 0.00 0.00 0.00 0.00Nauru 0.00 0.00 0.00 0.00 0.00 0.00Nepal 28.95 4.74 26.90 6.89 54.19 4.30 The Netherlands 1.65 0.27 0.29 0.07 0.00 0.00 New Zealand 19.66 3.22 6.79 1.74 1.31 0.10 Norway 0.00 0.00 0.00 0.00 2.57 0.20 Pakistan 10.18 1.67 5.06 1.30 4.36 0.35 Palau 0.00 0.00 0.00 0.00 0.00 0.00Papua New Guinea 1.72 0.28 2.16 0.55 2.39 0.19 Philippines 1.84 0.30 3.48 0.89 9.94 0.79 Portugal 0.00 0.00 0.00 0.00 0.00 0.00Samoa 0.74 0.12 3.19 0.82 3.56 0.28 Singapore 0.77 0.13 5.41 1.39 2.94 0.23 Solomon Islands 1.99 0.33 3.24 0.83 9.83 0.78 Spain 0.05 0.01 0.00 0.00 0.39 0.03 Sri Lanka 10.40 1.70 17.22 4.41 10.31 0.82 Sweden 0.69 0.11 0.09 0.02 0.00 0.00 Switzerland 6.56 1.07 0.00 0.00 3.29 0.26 Taipei,China 0.00 0.00 0.00 0.00 0.00 0.00Tajikistan 0.87 0.14 2.26 0.58 8.24 0.65 Thailand 12.62 2.07 0.74 0.19 1.16 0.09 Timor-Leste 0.04 0.01 0.21 0.05 4.80 0.38 Tonga 0.12 0.02 9.09 2.33 0.13 0.01 Turkey 0.43 0.07 0.00 0.00 23.72 1.88 Turkmenistan 0.00 0.00 0.00 0.00 0.00 0.00Tuvalu 3.24 0.53 0.00 0.00 0.00 0.00United Kingdom 0.96 0.16 3.14 0.81 8.88 0.70 United States 4.76 0.78 8.93 2.29 478.44 37.96 Uzbekistan 142.27 23.30 0.14 0.04 4.09 0.32 Vanuatu 0.00 0.00 0.00 0.00 0.00 0.00Viet Nam 13.82 2.26 4.85 1.24 11.76 0.93
tOtaL 610.48 100.00 390.27 100.00 1,260.24 100.00
0.00 = amount or percentage is nil or less than 0.01.Note: Totals may not add up because of rounding.
Asian Development Bank Annual Report 2011
304

overall productionDepartment of External Relations
FulfillmentOffice of Administrative Services, Printing Unit
The Annual Report 2011 is printed using vegetable oil-based inks on recycled paper.
The Annual Report 2011 can be downloaded from ADB’s website at www.adb.org

2011
Asian D
evelopment Bank 2011 A
nn
uA
l RepoRt
Volume 2
About the Asian Development Bank
ADB’s vision is an Asia and pacific region free of poverty. Its mission is to help its developing member countries reduce poverty and improve the quality of life of their people. Despite the region’s many successes, it remains home to two-thirds of the world’s poor: 1.8 billion people who live on less than $2 a day, with 903 million struggling on less than $1.25 a day. ADB is committed to reducing poverty through inclusive economic growth, environmentally sustainable growth, and regional integration. Based in Manila, ADB is owned by 67 members, including 48 from the region. Its main instruments for helping its developing member countries are policy dialogue, loans, equity investments, guarantees, grants, and technical assistance.
printed in the philippines
ISBN 978-92-9092-634-4
789290 9263449
Asian Development Bank6 ADB Avenue, Mandaluyong City1550 Metro Manila, philippineswww.adb.org
printed on recycled paper
V o l u M e 2Financial Report