adaptor protein mediates dynamic pump assembly …chen.chem.uh.edu/publications/pnas_2017_si.pdf11....
TRANSCRIPT

1
Supporting Information
to
Adaptor protein mediates dynamic pump assembly for bacterial metal efflux
Ace George Santiagoa,1, Tai-Yen Chenb,1, Lauren A. Genovaa, Won Junga, Alayna M. George Thompsonc, Megan M. McEvoyd, Peng Chena,*
a Department of Chemistry and Chemical Biology, Cornell University, Ithaca, New York 14853, USA b Department of Chemistry, University of Houston, Houston, Texas 77204, USA
c Department of Chemistry and Biochemistry, University of Arizona, Tucson, Arizona 85721, USA d Department of Microbiology, Immunology and Molecular Genetics and Molecular Biology Institute,
University of California, Los Angeles, California 90095, USA
1 A.G.S. and T.-Y.C. contributed equally to this work. * Correspondence: [email protected]
Table of content 1. Materials and experimental methods ...................................................................................................... 2
1.1. Strain Construction .................................................................................................................... 2
1.2. Immunoblotting for protein intactness and expression level determination .............................. 9
1.3. Sample preparation, single-molecule tracking via stroboscopic imaging, and single-cell protein quantification .............................................................................................................................. 10
1.4. PALM and confocal microscopy of fixed cells ....................................................................... 11
1.5. Real-time reverse transcription PCR ....................................................................................... 11
2. The mEos3.2-tagged CusA is functional .............................................................................................. 12
3. Western blot shows that CusAmE is intact in the cell and that the protein levels of CusC, CusB, and CusF increase under copper stress ........................................................................................................ 12
4. PALM Imaging and confocal fluorescence microscopy show the membrane localization of CusAmE 13
5. CusAmE exists as stable trimers in the cell membrane .......................................................................... 13
6. mEos3.2 did not dimerize or oligomerize when fused to membrane proteins ..................................... 15
7. Cells are viable under our imaging conditions ..................................................................................... 15
8. Determination of the minimal number of diffusion states from PDF(r)’s across a range of [CusAmE] in the cell and application of inverse transformation of confined displacement distribution (ITCDD) ... 16
9. Pairwise distance distribution and localization distribution ................................................................. 20
10. Assignments of fast and slow states in ΔcusCB, ΔcusC, and ΔcusB strains ........................................ 23
11. Determination of assembly and disassembly rate constants from SMT trajectories and validation of ITCDD and kinetic analyses through simulation ................................................................................. 24
11.1. Determination of assembly and disassembly rate constants .................................................... 24
11.2. Validation of our data analysis with simulation data............................................................... 25
10.3. Analysis with the hidden Markov model and its limitations probed by simulation ................ 26
2
12. Increased mRNA levels of the cusCFBA operon after Cu stress.......................................................... 27
13. Metal dissociation constants (Kd) of Cus proteins for Cu+ and Ag+ ..................................................... 28
14. Broader relevance to other families of tripartite efflux systems .......................................................... 28
15. Additional references ........................................................................................................................... 29
1. Materials and experimental methods
1.1. Strain Construction
All constructed strains were derived from the E. coli BW25113 strain. The cusAmE strain was
generated by fusing to CusA’s C-terminus the monomeric, irreversibly photoconvertible fluorescent protein mEos3.2 at the cusA chromosomal locus using lambda-red homologous recombination (1). On the basis of CusA structure (2), its C-terminus is exposed to the cytoplasm. The mEos3.2 fusion tag is thus expected to fold and mature properly.
a. Tagging the C-terminal of cusA gene with photoconvertible fluorescent protein mEos3.2 gene
In this section, the three main steps for tagging the cusA gene with mEos3.2 will be described: 1) Making the plasmid template, pUCmEos3.2FLAG:cat. 2) Making linear DNA inserts with homology regions. 3) Electroporating linear DNA inserts into E. coli cells. Making the plasmid template, pUCmEos3.2FLAG:cat. The linear DNA insert linker-mEos3.2-FLAG was amplified using primers PstI-linker-mEos3.2-f and SalI-FLAG-mEos3.2-r using AccuPrime Pfx protocol, and pUCmEos3.2:cat (3) was used as template. The linker region was incorporated after the C-terminal of CusA to allow for more flexibility between CusA and the fluorescent protein mEos3.2. The PCR product was doubly digested with PstI-HF (NEB, R3140S) and SalI-HF (NEB, R3138S). This digest was agarose gel-purified and then ligated into a similarly digested and gel-purified pUCmEos3.2:cat plasmid to replace the mEos3.2 gene with the mEos3.2-FLAG gene. The ligated product was propagated in E. cloni 10G chemically competent cells (Lucigen). To extract the propagated plasmid template pUCmEos3.2FLAG:cat (Fig. S1 and Table S1), DNA miniprep was performed on the host cells using Qiagen Miniprep. The plasmid template was then linearized to prevent plasmid contamination in later procedures using SbfI-HF (NEB, R3642S) and SacI-HF (R3156S). The linearized DNA template containing the linker-mEos3.2FLAG:cat sequence cassette was gel-purified using Wizard PCR Clean-up system.
3
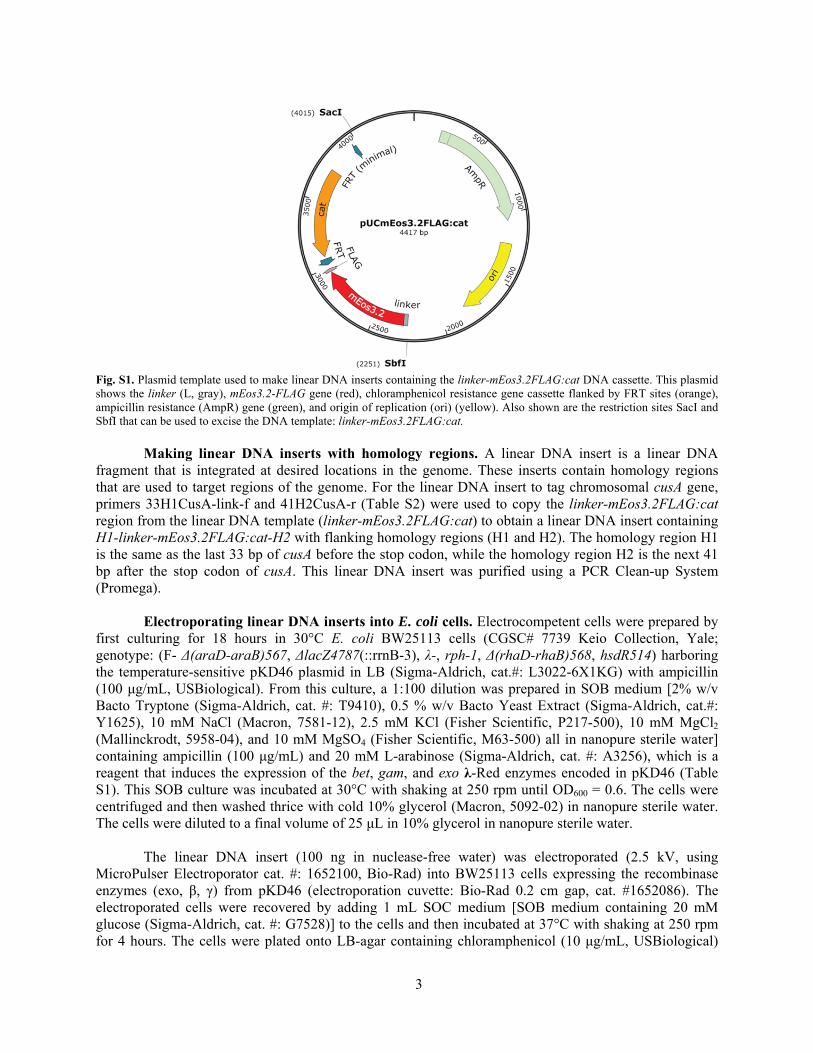
Fig. S1. Plasmid template used to make linear DNA inserts containing the linker-mEos3.2FLAG:cat DNA cassette. This plasmid shows the linker (L, gray), mEos3.2-FLAG gene (red), chloramphenicol resistance gene cassette flanked by FRT sites (orange), ampicillin resistance (AmpR) gene (green), and origin of replication (ori) (yellow). Also shown are the restriction sites SacI and SbfI that can be used to excise the DNA template: linker-mEos3.2FLAG:cat. Making linear DNA inserts with homology regions. A linear DNA insert is a linear DNA fragment that is integrated at desired locations in the genome. These inserts contain homology regions that are used to target regions of the genome. For the linear DNA insert to tag chromosomal cusA gene, primers 33H1CusA-link-f and 41H2CusA-r (Table S2) were used to copy the linker-mEos3.2FLAG:cat region from the linear DNA template (linker-mEos3.2FLAG:cat) to obtain a linear DNA insert containing H1-linker-mEos3.2FLAG:cat-H2 with flanking homology regions (H1 and H2). The homology region H1 is the same as the last 33 bp of cusA before the stop codon, while the homology region H2 is the next 41 bp after the stop codon of cusA. This linear DNA insert was purified using a PCR Clean-up System (Promega). Electroporating linear DNA inserts into E. coli cells. Electrocompetent cells were prepared by first culturing for 18 hours in 30°C E. coli BW25113 cells (CGSC# 7739 Keio Collection, Yale; genotype: (F- Δ(araD-araB)567, ΔlacZ4787(::rrnB-3), λ-, rph-1, Δ(rhaD-rhaB)568, hsdR514) harboring the temperature-sensitive pKD46 plasmid in LB (Sigma-Aldrich, cat.#: L3022-6X1KG) with ampicillin (100 μg/mL, USBiological). From this culture, a 1:100 dilution was prepared in SOB medium [2% w/v Bacto Tryptone (Sigma-Aldrich, cat. #: T9410), 0.5 % w/v Bacto Yeast Extract (Sigma-Aldrich, cat.#: Y1625), 10 mM NaCl (Macron, 7581-12), 2.5 mM KCl (Fisher Scientific, P217-500), 10 mM MgCl2 (Mallinckrodt, 5958-04), and 10 mM MgSO4 (Fisher Scientific, M63-500) all in nanopure sterile water] containing ampicillin (100 μg/mL) and 20 mM L-arabinose (Sigma-Aldrich, cat. #: A3256), which is a reagent that induces the expression of the bet, gam, and exo λ-Red enzymes encoded in pKD46 (Table S1). This SOB culture was incubated at 30°C with shaking at 250 rpm until OD600 = 0.6. The cells were centrifuged and then washed thrice with cold 10% glycerol (Macron, 5092-02) in nanopure sterile water. The cells were diluted to a final volume of 25 μL in 10% glycerol in nanopure sterile water. The linear DNA insert (100 ng in nuclease-free water) was electroporated (2.5 kV, using MicroPulser Electroporator cat. #: 1652100, Bio-Rad) into BW25113 cells expressing the recombinase enzymes (exo, β, γ) from pKD46 (electroporation cuvette: Bio-Rad 0.2 cm gap, cat. #1652086). The electroporated cells were recovered by adding 1 mL SOC medium [SOB medium containing 20 mM glucose (Sigma-Aldrich, cat. #: G7528)] to the cells and then incubated at 37°C with shaking at 250 rpm for 4 hours. The cells were plated onto LB-agar containing chloramphenicol (10 μg/mL, USBiological)

4
and incubated at 37°C for 18 h. About 10-20 colonies (1 mm diameter each) grew on the plate after incubation, and 8 colonies were chosen for screening. Successful integration of the linker-mEos3.2FLAG:cat at the chromosomal target site (C-terminal region of cusA gene) was confirmed by colony PCR screening and sequence analysis of PCR fragments amplified from the genomic extract (Wizard Genomic DNA Purification Kit, Promega, cat. #: A1120). The final construct is called CALMF, which is referred to as cusAmE, the wild-type strain in the main text. The strain CALM is similar to CALMF except that the former does not contain the FLAG tag (Table S3). To make CALM, the primers 33H1CusA-link-f and 41H2CusA-r were used, but the template DNA is the linker-mEos3.2:cat fragment excised from the pUCmEos3.2:cat plasmid. To make DCOCALMF, the linear DNA insert used to make CALMF was electroporated into JW0119-2 (ΔcueO) (Table S3) containing induced pKD46. To make DCODCA (ΔcueO, ΔcusA double knockout), the linear DNA insert was made using primer pair H1CueO-fp/H2CueO-rp (Table S2) and cat gene template from plasmid pUCmEos3.2:cat, then electroporated into JW0564-1 (ΔcusA) (Table S3) containing induced pKD46. Table S1. Plasmids used or constructed in this study
Plasmid name Relevant Characteristic or genotype Source
1. pSLTS bet, gam, exo recombinase enzymes, I-SceI enzyme
Kim et al (4) (Addgene plasmid 59386)
2. pKD46 bet, gam, exo enzymes Datsenko et al (1) 3. pUCmEos3.2:cat mEos3.2, cat Chen et al (3) 4. pUCmEos3.2FLAG:cat mEos3.2-FLAG, cat This study 5. pCALMF pBAD24 backbone, CALMF insert This study
6. pT2SK I-SceI recognition site, kanamycin resistance
Kim et al (4) (Addgene plasmid 59383)
7. pBAD24 bla, L-arabinose inducible Guzman et al (5)
Table S2. Primers used in this study †
Primer Name Sequence (5'-3')
1. 33H1CusA-link-f CTGATGTGGCTGCACCGACATCGGGTACGGAAAGGATCCGCTGGCTCCGCTGCTGGTTCT
2. 41H2CusA-r CGCAAGACACAATCCACACGGTTAAACGGGGTATCCTGCTTCGACGGCCAGTGAATTCGA
3. 28H1CusBHR3sm5 AGTCAGCCAGTAACCCAGGTTTAATGAGGGGAATAACCAATGAATCTCAAGAGTGGCAGC
4. 29H2CusBHR3sm3 AATAATCCATTCAATCATTGGTTATTCCCCTCATTAAACCTGGGTTACGCCCCGCCCTGC
5. 28H1CusCHR3sm5 GCATAAAATCACCAGAAATTATGAGCCTCAGCAATA TACTCGTATCTCAAGAGTGGCAGC
6. 29H2CusCHR3sm3 CAACTTGAAGTATGACGAGTATATTGCTGAGGCTCATAATTTCTTTACGCCCCGCCCTGC
7. 28H1CusFHR3sm5 TATGACTTTTAACTCCAGGAGAGAATAACCCAGGTTTAATGAGATCTCAAGAGTGGCAGC
8. 29H2CusFHR3sm3 GCGATTTTTTTCATCTCATTAAACCTGGGTTATTCTCTCCTGGATTACGCCCCGCCCTGC
9. 27H1CusBM36IHR3sm5 CGATAAACCAGGTAAATCGCCGTTTATtGATATGGATCTGGTGATCTCAAGAGTGGCAGC§
10. 28H2CusBM36IHR3sm3 CGGCATATTTCGGCACCAGATCCATATCaATAAACGGCGATTTATTACGCCCCGCCCTGC
11. 28H1NTCusBHR3sm5 GGCAGGTTTTACCTGGGTTGCAAAGGCGCAGAATCTGGGGGTGATCTCAAGAGTGGCAGC
12. 29H2NTCusBHR3sm3 ACGGTAGCCGTTTTCACCCCCAGATTCTGCGCCTTTGCAACCCATTACGCCCCGCCCTGC
13. PstI-linker-mEos3.2-f AGTCAG CTGCAGGCTGGCTCCGCTGCTGGTTCTGGCGAATTC AGTGCGATTAAGCCAGAC
14. SalI-FLAG-mEos3.2-r AGTCAG GTCGACTTATTTATCATCATCATCTTTATAATCAGGACG TCGTCTGGCATTGTC
15. CusA-M623I-sc-f GCAGTAACCCGCTCAATCG

5
16. CusA-M623I-sc-r CTTTTAATGCCGGTTGAGAG
17. qPCR-HKG-16srRNA-fp GTT AAT ACC TTT GCT CAT TGA
18. qPCR-HKG-16srRNA-rp ACC AGG GTA TCT AAT CCT GTT
19. H1CueO-fp TTTGATTTTG TTTCGCCTGC TTAAGAATAA GGAAATAACT GTGTAGGCTGGAGCTGCTTC
20. H2CueO-rp TGCCCGGAGAGATCCGGGCATATTTCCGAATACGGTCTTT CATATGAATATCCTCCTTAG
21. NheI-CusA-f1 AGTCAGGCTAGCAGGAGGAATT CACCATG ATT GAA TGG ATT ATT CGT CGC TCG GT
22. NcoI-CusA-fp AGTCAG CC ATGGCGATG ATT GAA TGG ATT ATT CGT CGC TCG
23. SalI-mEos3.2-r AGTCAGGTCGACTTATCGTCTGGCATTGTCAG
24. 40H1CusB-FLAG ACTGGAGCG GATGCGCTCT GAAAGTGCTA CCCATGCGCA T GACAATGCCAGACGACGT
25. 41H2CusB-cam-r CACCGAGCGACGAATAATCCATTCAATCATTGGTTATTCCC CATATGAATATCCTCCTTAG
26. 40H1CusC-FLAG GGTTAACGAAATTTCT TTG TATACC GCA CTT GGT GGC GGT GACAATGCCAGACGACGT
27. 41H2CusC-cam-r ACGCAGCACATGCAACTTGAAGTATGACGAGTATATTGCTGCATATGAATATCCTCCTTAG
28. 40H1CusF-FLAG GGGCAACCTTTCTTTATTACAGGATATTAAAGTCAGCCAGGACAATGCCAGACGACGT
29. 41H2CusF-cam-r CGATAATAAGCGCGATTTTTTTCATCTCATTAAACCTGGGCATATGAATATCCTCCTTAG †Red lower case fonts indicate the point mutations. Table S3. Strains used or constructed in this study
Strain Relevant characteristics or Genotype Reference or source 1. CALMF cusA-linker-mEos3.2-FLAG This study 2. DBCALMF ΔcusB, CALMF This study 3. DCCALMF ΔcusC, CALMF This study 4. DCBCALMF ΔcusC, ΔcusB, CALMF This study 5. DFCALMF ΔcusF, CALMF This study 6. BM36ICALMF cusB mutant (CusB(M36I)), CALMF This study 7. CALMF-DNTB cusB(ΔN), CALMF This study 8. JW0119-2 ΔcueO Keio collection 9. JW0564-1 ΔcusA Keio collection 10. DCOCALMF ΔcueO, CALMF This study 11. DCODCA ΔcueO, ΔcusA This study 12. DCOCALMF-p ΔcueO, CALMF, pCALMF This study 13. DCOCALMF-pBAD ΔcueO, CALMF, pBAD24 This study 14. CALM cusA-linker-mEos3.2 This study 15. CusB-FLAG cusB-FLAG, cat This study 16. CusC-FLAG cusC-FLAG, cat This study 17. CusF-FLAG cusF-FLAG, cat This study
18. BW25113
Base strain, F-, DE(araD-araB)567, lacZ4787(del)::rrnB-3, LAM-, rph-1, DE(rhaD-rhaB)568, hsdR514 Keio collection
b. Introduction of point mutations and deletions into the genome of the CALMF strain In this section, the I-SceI recombineering strategy is used to efficiently introduce point mutations and deletions in the chromosomal genes of E. coli (4) without introducing leftover foreign DNA sequences or “scars” on the chromosomal region that was edited. The general strategy for this genome editing is illustrated in Fig. S2.

6
Several strains were constructed using this technique (Table S3). First, the deletion strains include DBCALMF (ΔcusB, CALMF), DCCALMF (ΔcusC, CALMF), DCBCALMF (ΔcusCB, CALMF), and DFCALMF (ΔcusF, CALMF). The purpose of these deletion strains was to observe how CALMF would behave if any one or two of the CusCFB components in the efflux system were removed. Mutant strains were also constructed using this strategy: BM36ICALMF is a CusB mutant wherein the methionine-36 was mutated to isoleucine by introducing a single point mutation in the DNA encoding the M36 codon of CusB protein (6). In addition, CALMF-DNTB is a strain wherein the CusB protein’s N-terminal residues 1-61 were removed (7), while keeping the N-terminal leader peptide intact for periplasm targeting. The purpose of these mutants was to impair the copper binding ability of CusB, serving to help identify the molecular basis of the copper-responsive elements in CusB.

7
Fig. S2. Schematic of scarless genome editing in E. coli. In this scheme, the pSLTS plasmid (4) was first introduced via electroporation into CALMF cells (1). This plasmid expresses the recombinase enzymes required for λ-Red recombination, as well as the I-SceI meganuclease enzyme that can cut DNA at I-SceI recognition sequences, a process required for RecA recombination. Next, the DNA mutation cassette was introduced into the cell via electroporation (2). The DNA mutation cassette was obtained by using primers with homology regions (HR1 and HR2) that are identical to target chromosomal genes. The template used to obtain the mutation cassette is encoded in the pT2SK plasmid. HR3 includes the purple bar and wedge that indicate the mutation that is to be introduced into the genome. The DNA mutation cassette also contains the kanamycin resistance gene preceded by two transcription terminators (TT) and one I-SceI recognition or cleavage site. The cell then integrates the
8
DNA mutation cassette into its genome via λ-Red recombination (3), which is indicated by cells that gained kanamycin resistance. To remove the kanamycin resistance cassette, the expression of I-SceI enzyme is induced using anhydrotetracycline (aTc) (4). This I-SceI cleavage of the genome will result in cells that will only survive if RecA recombination was able to repair the cut (5). If the repair is successful, surviving cells will contain the desired genomic edit and will no longer be kanamycin resistant. To perform the experiment, the pSLTS was first introduced into the CALMF strain (Fig. S2). Linear DNA inserts (or DNA mutation cassettes) were obtained using primer pairs as follows (see Table S2 for primer sequences): 1) strain DCCALMF (primers 28H1CusCHR3sm5 and 29H2CusCHR3sm3). 2) DBCALMF (28H1CusBHR3sm5 and 29H2CusBHR3sm3). 3) DFCALMF (28H1CusFHR3sm5 and 29H2CusFHR3sm3). 4) BM36ICALMF (27H1CusBM36IHR3sm5 and 28H2CusBM36IHR3sm3). 5) CALMF-DNTB (28H1NTCusBHR3sm5 and 29H2NTCusBHR3sm3), and pT2SK plasmid (Table S1) bearing the kanamycin resistance and I-SceI cleavage site cassette as template. The linear DNA inserts were digested with DpnI to remove any methylated pT2SK plasmids, then gel purified. The resulting linear DNA insert contains homology regions, kanamycin resistance cassette for antibiotic selection, and the I-SceI cleavage site for subsequent RecA recombination. After PCR clean-up, 2 µL of the linear DNA insert was electroporated into CALMF strain harboring the temperature-sensitive pSLTS plasmid (Table S1) that was induced and made electrocompetent as in Section 1.1.a above. The cells were incubated at 30°C for 4 h before plating onto LB-agar plate containing ampicillin (100 µg/mL), chloramphenicol (25 µg/mL), and kanamycin (15 µg/mL). The plate was incubated at 30°C for 18 h. From this plate, colony PCR was performed on 8 colonies to probe for the successful insertion of the kanamycin resistance cassette containing the I-SceI recognition site. One successful colony was chosen and cultured in LB with ampicillin, chloramphenicol, and kanamycin antibiotics for 18 h. To induce I-SceI enzyme cleavage, and thus scar-less elimination of the kanamycin resistance cassette to produce the final construct, a sample of this overnight culture was diluted 1:50 in 10x PBS buffer, then 200 µL was plated onto LB-agar plate containing anhydrotetracycline (aTc) (150 ng/mL), ampicillin (100 µg/mL), and chloramphenicol (25 µg/mL). To confirm the elimination of the kanamycin resistance cassette in the genome, 8 colonies that grew on the aTc plate were tested for kanamycin sensitivity on LB-agar plate containing kanamycin (30 µg/mL). Cells that had ampicillin-resistant, chloramphenicol-resistant, and kanamycin-sensitive phenotypes were chosen for DNA sequencing to confirm the presence of the desired genomic edit. The pSLTS plasmid can be removed in the strains by culturing the cells at 42°C overnight (18 h). To make DCBCALMF (genotype ΔcusC, ΔcusB double deletion, Table S3), the linear DNA insert for making ΔcusC above was inserted into DBCALMF strain harboring the pSLTS plasmid. Subsequent steps were followed according to procedures described above.
c. Tagging the C-termini of CusB, CusC, and CusF gene with the FLAG peptide epitope for Western blot detection of protein expression Lambda red homologous recombination was used to tag the C-termini of CusB, CusC, and CusF
proteins separately on top of the base strain BW25113 with the FLAG epitope for Western blot detection of chromosomal expression (i.e., CusB-FLAG, CusC-FLAG, and CusF-FLAG, Table S3). First, linear DNA inserts were obtained using primer pairs 40H1CusB-FLAG and 41H2CusB-cam-r for CusB-FLAG, 40H1CusC-FLAG and 41H2CusC-cam-r for CusC-FLAG, 40H1CusF-FLAG and 41H2CusF-cam-r for CusF-FLAG, and pUCmEos3.2FLAG:cat as template for PCR. The resulting PCR product is a linear DNA insert containing the chloramphenicol resistance gene, cat, for antibiotic selection. Electroporation of the linear DNA insert into electrocompetent BW25113 cells expressing the λ-Red enzymes from pKD46 is the same as above. Successful integration of the FLAG tag at the desired genomic locus was confirmed using colony PCR screening and followed by DNA sequencing.
9
d. Cloning CusAmE into pBAD24 for overexpression in E. coli and Western blot detection of protein fusion intactness
To insert the cusA-linker-mEos3.2-FLAG gene into the arabinose-inducible pBAD24 plasmid, the
genome of a previously made CALM strain (CusA-linker-mEos3.2 without FLAG) was extracted using Wizard Genomic Extraction Kit. Primers NheI-CusA-f1 and SalI-FLAG-mEos3.2-r (Table S2) were used to obtain a PCR product containing cusA-linker-mEos3.2-FLAG. After PCR cleanup, the DNA was digested with NheI (NEB) and SalI (NEB) restriction enzymes, gel-purified, ligated into a similarly digested pBAD24 plasmid, and propagated using E. cloni 10G chemically competent cells giving the plasmid pCALMF (Table S1), which expresses CusA-L-mEos3.2-FLAG (where L is a flexible 10-amino acid linker). Colonies were screened using primers NcoI-CusA-fp and SalI-mEos3.2-r (Table S2). The plasmid construct was extracted from an overnight culture of a positive colony (i.e., one that showed in colony PCR the cusA-linker-mEos3.2-FLAG band genomic insertion) using DNA miniprep, and sent for DNA sequencing for final verification. This plasmid was then electroporated into the DCOCALMF strain to produce DCOCALMF-p (Table S3).
1.2. Immunoblotting for protein intactness and expression level determination
Sample preparation. For plasmid-expressed proteins. Strains DCOCALMF-p containing pCALMF, and a negative control strain DCOCALMF-pBAD, which contains the empty pBAD vector (Table S3), were grown overnight (17 h) in 6 mL LB with antibiotics. A sample (50 μL) of this overnight culture was added into 5 mL M9 medium containing amino acids (8% v/v 50x GIBCO), vitamins (4% v/v 100x GIBCO), glycerol (0.4%), and ampicillin (100 μg/mL). This culture was incubated at 37°C with shaking (250 rpm) for 4 h to reach OD600 ~ 0.3. The cells were taken out and L-arabinose was added to a final concentration of 1 mM to induce the production of the protein for 15 min or 30 min. 1 mL aliquots of the resulting cell culture were centrifuged (1300-1500 g) for 5 min. The supernatant was removed and replaced with M9 (amino acids, vitamins, 0.4% glucose), containing CuSO4 (0.5 mM), incubated at room temperature (22°C) for 20 min before centrifugation at 1300 g for 5 min. The cell pellets were collected and re-suspended in 2× SDS lysis buffer. For chromosome-expressed proteins. CALMF, CusB-FLAG, CusC-FLAG, and CusF-FLAG strains that express CusAmE, CusB-FLAG, CusC-FLAG, and CusF-FLAG, respectively, from their corresponding chromosomal loci (Table S3) were cultured overnight (18 h) at 37°C in 5 mL LB with appropriate antibiotics, and shaking at 250 rpm. 250 μL each of these overnight cultures were inoculated into 25 mL M9 medium (1:100 dilution) containing amino acids, vitamins, and 0.4% glycerol (similar to our imaging conditions) and incubated at 37°C for 4 h with shaking (250 rpm). CuSO4 was then added to a final concentration of 0.5 mM; the cells were allowed to grow for an additional 6 h before centrifugation at 4500 rpm. The cell pellets were collected and lysed with 500 µL B-PER Complete Bacterial Protein Extraction Reagent (Thermo Fisher Scientific, cat. # PI89821), 2 µL protease inhibitor cocktail (Promega, cat. #: G6521), and 10 µL of 50 mM EDTA. The cells were allowed to lyse for 15 mins at room temperature (22°C) with shaking (250 rpm) before centrifugation at 16,000 g for 20 mins. Immunoprecipitation was performed using Rockland Immunoprecipitation Kit (cat. #: RLKBA-319-383). Briefly, 200 µL of agarose bead-conjugated anti-FLAG antibody slurry was added into a Pierce spin column (Thermo Fisher Scientific, cat. #: 69705) and washed according to the manufacturer’s instructions. The protein lysate (500 µL) was added onto the column and incubated at 4°C for 18 h. The FLAG-tagged proteins were eluted using 85 µL of supplied eluent; then 15 µL of supplied neutralization buffer was immediately added. The FLAG-tagged protein eluates were mixed with 85 µL of 2x Laemmli sample buffer (Biorad, cat. #: 1610737) and 2.5 µL of beta-mercaptoethanol (Sigma-Aldrich, cat. # M6250) as reducing agent.
10
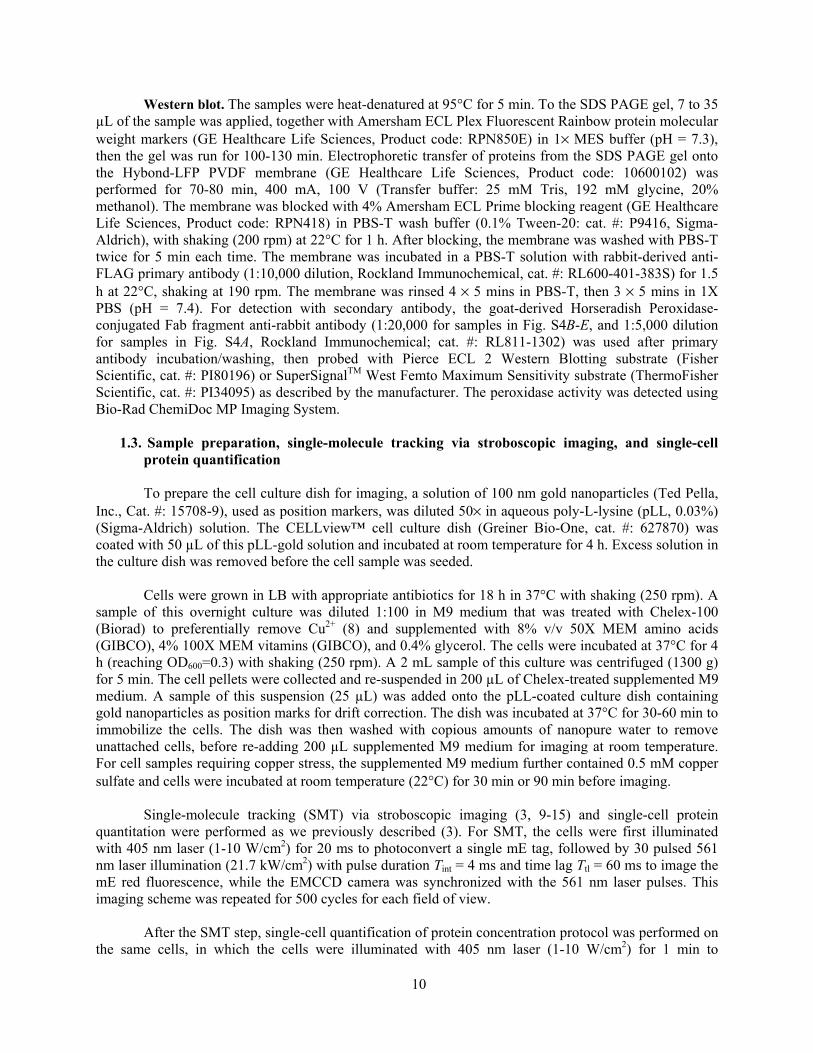
Western blot. The samples were heat-denatured at 95°C for 5 min. To the SDS PAGE gel, 7 to 35 µL of the sample was applied, together with Amersham ECL Plex Fluorescent Rainbow protein molecular weight markers (GE Healthcare Life Sciences, Product code: RPN850E) in 1× MES buffer (pH = 7.3), then the gel was run for 100-130 min. Electrophoretic transfer of proteins from the SDS PAGE gel onto the Hybond-LFP PVDF membrane (GE Healthcare Life Sciences, Product code: 10600102) was performed for 70-80 min, 400 mA, 100 V (Transfer buffer: 25 mM Tris, 192 mM glycine, 20% methanol). The membrane was blocked with 4% Amersham ECL Prime blocking reagent (GE Healthcare Life Sciences, Product code: RPN418) in PBS-T wash buffer (0.1% Tween-20: cat. #: P9416, Sigma-Aldrich), with shaking (200 rpm) at 22°C for 1 h. After blocking, the membrane was washed with PBS-T twice for 5 min each time. The membrane was incubated in a PBS-T solution with rabbit-derived anti-FLAG primary antibody (1:10,000 dilution, Rockland Immunochemical, cat. #: RL600-401-383S) for 1.5 h at 22°C, shaking at 190 rpm. The membrane was rinsed 4 × 5 mins in PBS-T, then 3 × 5 mins in 1X PBS (pH = 7.4). For detection with secondary antibody, the goat-derived Horseradish Peroxidase-conjugated Fab fragment anti-rabbit antibody (1:20,000 for samples in Fig. S4B-E, and 1:5,000 dilution for samples in Fig. S4A, Rockland Immunochemical; cat. #: RL811-1302) was used after primary antibody incubation/washing, then probed with Pierce ECL 2 Western Blotting substrate (Fisher Scientific, cat. #: PI80196) or SuperSignalTM West Femto Maximum Sensitivity substrate (ThermoFisher Scientific, cat. #: PI34095) as described by the manufacturer. The peroxidase activity was detected using Bio-Rad ChemiDoc MP Imaging System.
1.3. Sample preparation, single-molecule tracking via stroboscopic imaging, and single-cell
protein quantification
To prepare the cell culture dish for imaging, a solution of 100 nm gold nanoparticles (Ted Pella, Inc., Cat. #: 15708-9), used as position markers, was diluted 50× in aqueous poly-L-lysine (pLL, 0.03%) (Sigma-Aldrich) solution. The CELLview™ cell culture dish (Greiner Bio-One, cat. #: 627870) was coated with 50 µL of this pLL-gold solution and incubated at room temperature for 4 h. Excess solution in the culture dish was removed before the cell sample was seeded. Cells were grown in LB with appropriate antibiotics for 18 h in 37°C with shaking (250 rpm). A sample of this overnight culture was diluted 1:100 in M9 medium that was treated with Chelex-100 (Biorad) to preferentially remove Cu2+ (8) and supplemented with 8% v/v 50X MEM amino acids (GIBCO), 4% 100X MEM vitamins (GIBCO), and 0.4% glycerol. The cells were incubated at 37°C for 4 h (reaching OD600=0.3) with shaking (250 rpm). A 2 mL sample of this culture was centrifuged (1300 g) for 5 min. The cell pellets were collected and re-suspended in 200 µL of Chelex-treated supplemented M9 medium. A sample of this suspension (25 µL) was added onto the pLL-coated culture dish containing gold nanoparticles as position marks for drift correction. The dish was incubated at 37°C for 30-60 min to immobilize the cells. The dish was then washed with copious amounts of nanopure water to remove unattached cells, before re-adding 200 µL supplemented M9 medium for imaging at room temperature. For cell samples requiring copper stress, the supplemented M9 medium further contained 0.5 mM copper sulfate and cells were incubated at room temperature (22°C) for 30 min or 90 min before imaging.
Single-molecule tracking (SMT) via stroboscopic imaging (3, 9-15) and single-cell protein quantitation were performed as we previously described (3). For SMT, the cells were first illuminated with 405 nm laser (1-10 W/cm2) for 20 ms to photoconvert a single mE tag, followed by 30 pulsed 561 nm laser illumination (21.7 kW/cm2) with pulse duration Tint = 4 ms and time lag Ttl = 60 ms to image the mE red fluorescence, while the EMCCD camera was synchronized with the 561 nm laser pulses. This imaging scheme was repeated for 500 cycles for each field of view.
After the SMT step, single-cell quantification of protein concentration protocol was performed on
the same cells, in which the cells were illuminated with 405 nm laser (1-10 W/cm2) for 1 min to
11
photoconvert all remaining mE molecules, followed by 561 nm laser illumination for 2000 frames with the same laser power density and exposure time as in the SMT step to image, photobleach, and quantify the number of remaining mE molecules. All CusA concentrations cited in the study correspond to those of CusA trimers, i.e., one third of the total mE concentrations. The temporal invariance of the CusAmE copy number in the WT strain over a period of 90 min (Fig. 1D, first three data points) supports that the maturation of the mE tag does not affect our protein quantitation significantly.
1.4. PALM and confocal microscopy of fixed cells
For fixing cells, strain DCOCALMF-p containing pCALMF was cultured in LB overnight and transferred in M9 (0.4% glycerol, MEM amino acids and vitamins) and incubated at 37°C until OD600=0.3 (~4 h). L-arabinose was added to the culture to a final concentration of 10 mM and incubated for 2 h at room temperature (22°C) with shaking at 200 rpm. A sample of the M9 cultures (2 mL) was centrifuged (1500 g, 5 min) and the cell pellets were washed with M9 solution twice. Growth was continued for 2 h at room temperature (22°C). The cells were pelleted and re-suspended in 200 μL 4% paraformaldehyde solution in PBS (pH=6.9) to fix cells for 40 min at room temperature (22°C). The cells were pelleted and washed with 200 μL 10x PBS (pH=7.4) twice then finally re-suspended in equal volume of 10x PBS (pH=7.4). Gold nanoparticles (20 μL, 100 nm, Ted Pella, cat. #: 15708-9) to serve as position markers were added to this cell solution before imaging. To prepare the slides, a 3% (w/v) agarose gel pad was used to immobilize the cells. Agarose was first dissolved in M9 (0.4% glycerol, MEM amino acids and vitamins) by heating the mixture in a microwave oven. A sample of this solution was drop-casted onto the center of a glass slide and topped with another glass slide until the gel solidified at room temperature. The cell sample was then directly applied to the agarose gel surface then topped with a clean coverslip. The chamber was finally sealed with an epoxy glue to prevent evaporation of the liquid medium before imaging. For fixed cell PALM imaging routine, the protocol involved continuous illumination of cells with both a 405 nm laser at a low power density of ≤10 W/cm2 and a 561 nm laser at a power density of 21.7 kW/cm2 in epi-illumination mode while detecting the red-fluorescence of the single mEos3.2-tagged CusA molecules with the EMCCD camera using 50 ms exposure time. For confocal microscopy, the cells were imaged using a Zeiss LSM880 Confocal microscope equipped with a Plan-Apochromat 40x/1.4 Oil DIC M27 objective. Fluorescence was excited using 488 nm laser and with fluorescence emission collected between 491 and 597 nm (the green fluorescence of the mEos3.2) (pinhole = 32 µm). Image acquisition was performed using plane scanning mode.
1.5. Real-time reverse transcription PCR For real-time reverse transcription PCR, overnight cultures of strain CALMF (i.e., cusAmE) in LB with chloramphenicol (25 μg/mL) were used to inoculate cultures in Chelex-treated M9 medium containing amino acids, vitamins, and glycerol and grown for 4 hours at 37°C with shaking (200 rpm). Samples of each culture were exposed to copper sulfate (500 μM) for 0, 30, and 90 min. The total mRNA from each sample was extracted using PureLink® RNA Mini Kit (Life Technologies, cat. #: 12183018A). The cDNA was obtained using hexamer primers from SuperScript® III First-Strand Synthesis SuperMix kit (Life Technologies, cat. #: 18080-400) and used according to the manufacturer’s instructions. The amount of mRNA transcript for each target gene was assessed relative to the mRNA level of the housekeeping genes, HKG (16S rRNA), as internal control. The primers used to detect the target genes were: qPCR-HKG-16srRNA-fp and qPCR-HKG-16srRNA-rp for HKG, CusC-sc-f and CusC-sc-r for cusC, CusF-sc-f and CusF-sc-r for cusF, CusB-sc-f and CusB-sc-r for cusB, CusA-M623I-sc-f and CusA-

12
M623I-sc-r for cusA (Table S2). The primers (1 μL), cDNA (3 μL), SYBR Green reagent (25 μL) (Life Technologies, cat. #: 4309155), and RNAse-free H2O (20 μL) were mixed on a 96-well plate. Samples for each condition were prepared in triplicate and imaged using Applied Biosystems (LifeTech) Viia7 Sequence Detection System to determine the threshold cycle (CT) value, which is the quantitative endpoint for real-time PCR. The results were analyzed using the comparative CT method by Schmittgen et al (16).
2. The mEos3.2-tagged CusA is functional
Fig. S3. Metal resistance cell growth assay indicates that mEos3.2-tagged CusA, CusAmE, is functional. Using a ΔcueO base strain to increase sensitivity to copper stress, the strain containing the mEos3.2-tagged CusA at its chromosomal locus (i.e., ΔcueO, cusAmE) has significant higher tolerance than the ΔcueOΔcusA strain (even though it is ~20% lower than the untagged strain, ΔcueO). Therefore, tagging CusA with mEos3.2 at its C-terminal largely maintains its function in conferring copper resistance to the cell. Method: Cells were grown in LB solution with antibiotics containing varying concentrations of CuSO4. The cells were incubated for 22 h at 37°C before measuring their OD600. Data were collected in triplicate. Error bars are s.d. 3. Western blot shows that CusAmE is intact in the cell and that the protein levels of CusC, CusB,
and CusF increase under copper stress
Fig. S4. Western blot of FLAG-tagged CusAmE (i.e., CusA-Linker-mEos3.2-FLAG), CusB, CusC, and CusF. (A) CusAmE is intact in the cell. Western blot of CusAmE expressed from a pBAD24 plasmid under various induction with L-arabinose (column 2-4). The negative control is a strain containing the pBAD24 plasmid that does not have the CusAmE insert (column 5-7). CusAmE fusion protein is observed at its expected size of 143 kDa, while no significant cleavage products were detected relative to the negative control (e.g., at 27 kDa expected for the mEos3.2-FLAG fragment). In addition, the negative control that was used here contains CusAmE in the genome, suggesting that under these Western blot conditions, physiological expression levels of the chromosomal CusAmE are too low to be detected. We estimated that at least 11 ng of CusAmE molecules is needed for sufficient
13
detection on the gel, which corresponds to a protein copy number of ~1500 considering our original culture size and assuming no protein loss in the procedures. (B-E) Western blots after immunoprecipitation show that after copper stress, the cellular protein levels of CusB, CusC, and CusF increase from the expression of the chromosomal cusCFBA operon, while CusAmE remains un-detectable. Western blot images of FLAG-tagged CusAmE (B), CusB (C), CusC (D), and CusF (E) expressed from their respective chromosomal loci in cells grown in copper-depleted medium (2nd columns) or stressed by 0.5 mM CuSO4 in the medium for 6 hours (3rd columns). The increased protein expression levels of CusB, CusC, and CusF are clearly visible under Cu stress, whereas that of CusAmE remains undetectable; the latter is consistent with our single-molecule imaging results in Fig. 1D that CusAmE expression level stays low under Cu stress. Calibrated with a FLAG-tagged protein standard of known concentration, the CusB, CusC, and CusF protein levels after 6 hour Cu stress are estimated to be >7.5, >0.2, and >1.8 μM, respectively. The values are all lower limits because the protein loss during immunoprecipitation is not accounted for, and the loss likely differs for different proteins. 4. PALM Imaging and confocal fluorescence microscopy show the membrane localization of
CusAmE
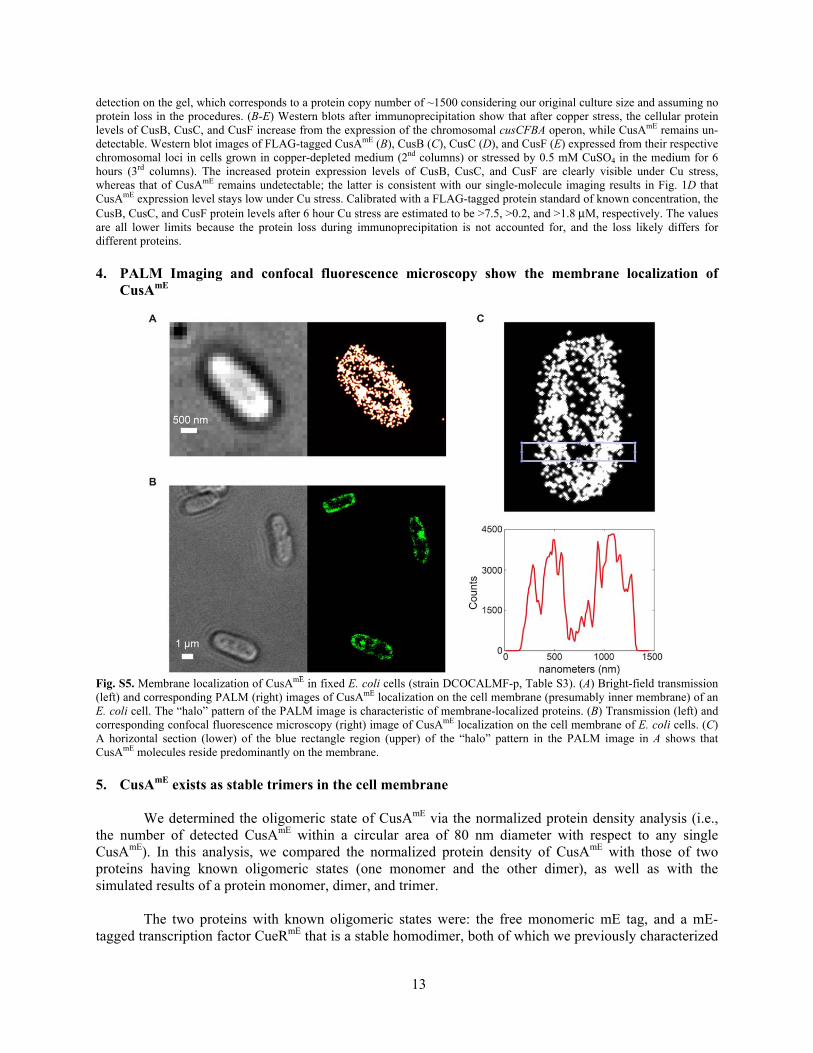
Fig. S5. Membrane localization of CusAmE in fixed E. coli cells (strain DCOCALMF-p, Table S3). (A) Bright-field transmission (left) and corresponding PALM (right) images of CusAmE localization on the cell membrane (presumably inner membrane) of an E. coli cell. The “halo” pattern of the PALM image is characteristic of membrane-localized proteins. (B) Transmission (left) and corresponding confocal fluorescence microscopy (right) image of CusAmE localization on the cell membrane of E. coli cells. (C) A horizontal section (lower) of the blue rectangle region (upper) of the “halo” pattern in the PALM image in A shows that CusAmE molecules reside predominantly on the membrane. 5. CusAmE exists as stable trimers in the cell membrane
We determined the oligomeric state of CusAmE via the normalized protein density analysis (i.e., the number of detected CusAmE within a circular area of 80 nm diameter with respect to any single CusAmE). In this analysis, we compared the normalized protein density of CusAmE with those of two proteins having known oligomeric states (one monomer and the other dimer), as well as with the simulated results of a protein monomer, dimer, and trimer. The two proteins with known oligomeric states were: the free monomeric mE tag, and a mE-tagged transcription factor CueRmE that is a stable homodimer, both of which we previously characterized

14
(3). The free mE tag was expressed from a pBAD24 plasmid (i.e., pBmEos3.2 in reference (3)); CueRmE was expressed from its chromosomal locus and/or a pBAD24 plasmid. We used PALM to image and localize the mE red fluorescence of CusAmE, free mE, and CueRmE, all in fixed E. coli cells.
We imaged protein localizations from ~300 cells with similar cell length and protein concentration for each of three proteins. We then analyzed the probability of finding 0, 1, 2, 3 … proteins within an 80 nm radius of each protein localization, which corresponds to having 1, 2, 3, 4 … proteins in the circular area. 80 nm is about 4 times of our localization precision (~20 nm); within 80 nm, our localization results have low confidence in distinguishing oligomeric proteins vs. proteins happening to be close to each other (17). The probabilities were then all normalized to that of having 1 protein in the circular area (Fig. S6).
We also simulated localizations of membrane trimers (i.e., CusAmE), cytosolic monomers (i.e.,
free mE), and cytosolic dimers (i.e., CueRmE). For example, for the membrane localized trimers, we first randomly sampled the initial position (x, y, z) on the cell membrane of a cell having the experimentally determined average cell geometry, where the values of x, y, and z were each a randomly generated number. The number of sampling was equal to the average number of CusAmE trimers from experiments divided by the photoconversion efficiency (0.42) of mE (18, 19). Second, using our localization precision of ~20 nm within the 4 ms laser exposure time that effectively corresponds to a diffusion with a diffusion constant of ~0.025 μm2 s-1, we generated the distribution of displacement vector within 4 ms. Next, 3 displacement vectors were randomly chosen from this distribution, and a 2-dimensional diffusion was simulated on a curved membrane surface, starting from each of the initial positions to generate three new locations that mimic the locations of the three subunits in each trimer. Finally, the z component was discarded to generate the final projected positions of all trimer proteins. For the cytosolic case, the randomly sampled initial position was performed within the cell volume, the number of displacement vectors in step 3 would change to 1 or 2 based on the polymeric state of the protein of interest; moreover, reflecting boundary was applied if the final localization were outside the cell (20). We then analyzed the simulated data to obtain the normalized protein density as we did on the experimental results.
For the simulated protein monomer, dimer, and trimer, the normalized probabilities increase with
the oligomeric state for any of the protein numbers in the circular area (except for the protein count 1, to which the probabilities were normalized; Fig. S6). The experimental results on free mE, CueRmE, and CusAmE show the same trend, and the normalized protein probability of CusAmE is the highest for any protein count (Fig. S6), supporting that CusAmE exists as stable trimers (or higher oligomeric states, which our analyses cannot rule out at the moment, as we do not have stable tetramer results to set the upper limit).
15
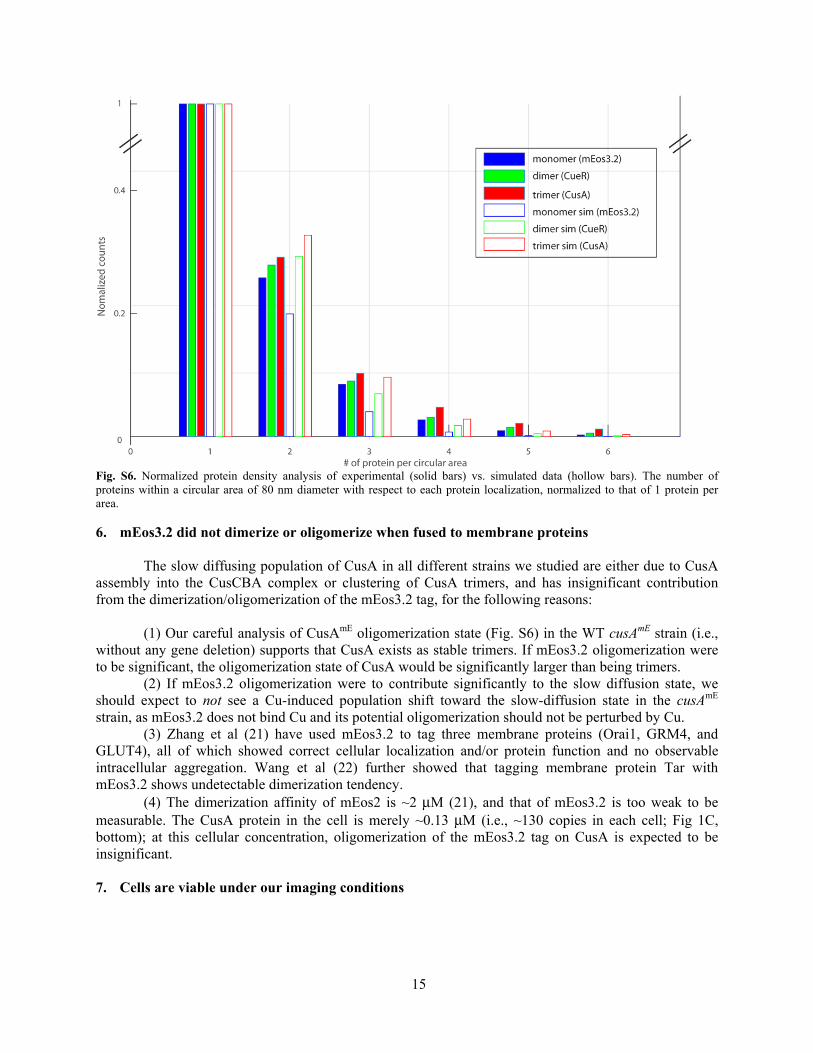
Fig. S6. Normalized protein density analysis of experimental (solid bars) vs. simulated data (hollow bars). The number of proteins within a circular area of 80 nm diameter with respect to each protein localization, normalized to that of 1 protein per area.
6. mEos3.2 did not dimerize or oligomerize when fused to membrane proteins The slow diffusing population of CusA in all different strains we studied are either due to CusA assembly into the CusCBA complex or clustering of CusA trimers, and has insignificant contribution from the dimerization/oligomerization of the mEos3.2 tag, for the following reasons: (1) Our careful analysis of CusAmE oligomerization state (Fig. S6) in the WT cusAmE strain (i.e., without any gene deletion) supports that CusA exists as stable trimers. If mEos3.2 oligomerization were to be significant, the oligomerization state of CusA would be significantly larger than being trimers. (2) If mEos3.2 oligomerization were to contribute significantly to the slow diffusion state, we should expect to not see a Cu-induced population shift toward the slow-diffusion state in the cusAmE strain, as mEos3.2 does not bind Cu and its potential oligomerization should not be perturbed by Cu. (3) Zhang et al (21) have used mEos3.2 to tag three membrane proteins (Orai1, GRM4, and GLUT4), all of which showed correct cellular localization and/or protein function and no observable intracellular aggregation. Wang et al (22) further showed that tagging membrane protein Tar with mEos3.2 shows undetectable dimerization tendency. (4) The dimerization affinity of mEos2 is ~2 μM (21), and that of mEos3.2 is too weak to be measurable. The CusA protein in the cell is merely ~0.13 μM (i.e., ~130 copies in each cell; Fig 1C, bottom); at this cellular concentration, oligomerization of the mEos3.2 tag on CusA is expected to be insignificant. 7. Cells are viable under our imaging conditions

16
Fig. S7. The cells are still viable under our imaging conditions. The growth and division of E. coli cells expressing CusAmE in M9 medium (copper-depleted) were monitored on the microscope at 20°C after being exposed to lasers as in our imaging experiments (bottom row) in comparison with those without laser exposure (top row). The cells were immobilized on a glass-bottom culture dish coated with 0.03% poly-L-lysine (pLL) solution. The doubling time for the cells not exposed to laser is estimated to be 201 ± 39 mins (number of cells, N=8), while the doubling time for cells that were exposed to laser is estimated to be 306 ± 46 mins (N=5). These results suggest that the growth of cells is temporarily impeded by our laser illumination scheme, but are viable.
8. Determination of the minimal number of diffusion states from PDF(r)’s across a range of
[CusAmE] in the cell and application of inverse transformation of confined displacement distribution (ITCDD)
The minimal number of diffusion states of CusAmE was determined from analyzing the results of
confinement-effect-removed PDF(r)’s (i.e., via ITCDD (20)) across a range of cellular CusAmE protein concentrations. Fitting the PDF(r)’s with the Brownian diffusion model resolves minimally two diffusion states with diffusion constants of 0.27 ± 0.06 and 0.052 ± 0.011 μm2s-1 and their respective fractional populations.
To construct the PDF of r in the confined space of a cell (PDFCS), only the first displacement
length of each single-molecule trajectory was collected for each cell to avoid biased sampling (23). The resulting PDFCS of r is distorted due to projecting the membrane protein diffusion in a curved three-dimensional boundary-less plane onto a two-dimensional plane confined by the cell boundary (20, 24). Cells were then grouped according to their [CusA] and the displacement lengths within the same concertation group of cells were used to produce the raw PDF(r). By globally analyzing these raw PDF(r)’s across different CusA concentrations in the cusAmE strain under copper-depleted conditions (i.e., [CusA] = 120 ± 60, 310 ± 40, and 440 ± 40 nM), three diffusion states were resolved with diffusion constants of 2.2 ± 0.1, 0.10 ± 0.02, and 0.025 ± 0.005 μm2s-1 and the corresponding fractional populations of 11-14, 31-39, and 49-55% (Fig. S8A). The fractional populations did not show any significant dependence on [CusA]. Considering CusA is a membrane protein, we suspected that the small fractional population (~10%) of the diffusion state at 2.2 μm2s-1 might be an artifact due to the cell confinement effect when projecting the membrane diffusion onto a 2-D plane that is known to distort the raw PDF(r)(3).

17
To reliably extract the number of diffusion states and their corresponding diffusion constants and fractional populations using the Brownian diffusion model from the PDF of r, we performed an inverse transformation of confined displacement distribution (ITCDD), as we (20) and others (24) have developed to deconvolute out the confinement effect. Here the raw PDF(r)’s in the confined space were multiplied by the inverse of the confinement transformation matrix ([CTM]−1), which defines the relation, for any given displacement length on the cell membrane, of the resulting distorted displacement length distribution after projection. The PDF of r in free space (PDFFS), where the confinement effect is deconvoluted out, can then be obtained through Equation S[1]:
PDFFS= CTM -1∙PDFCS S[1]
Here the [CTM] was generated through the following steps. First, create a model cell using
experimentally determined cell geometry parameters. Second, randomly position >100,000 displacement vectors of a given displacement length on the cell membrane. Third, calculate the end point of displacement vector on a surface curved in three-dimensional space, discard the z coordinates and create the confined displacement distribution (CDD) for each given displacement length on the membrane surface. Fourth, vary the length of displacement vector from 10 nm to 2.1 μm with 20 nm increments and repeat step 1 to 3. Lastly, combine all CDDs resulted in the CTM, which is a 2-D matrix where each column represents a CCD for a given displacement length on the curved membrane surface. More details are described in our earlier publication(20).
The resulting PDFFS was analyzed with the Brownian diffusion model requiring minimally two diffusion states (Equation S[2], where D represents the diffusion constants, A represents the corresponding fractional populations, and Af + As = 1): PDF2state= f2 f tl exp −4 f tl + s2 s tl exp −4 s tl S[2]
After deconvoluting out the confinement effect using the ITCDD method, the resulting PDF(r)’s
of all cell strains now merely resolve two diffusion states, each following the Brownian diffusion model with diffusion constants shared across the strains (Fig. S8B). The third component in fitting the original PDF(r) vanished, confirming our postulate that it was an artifact due to the confinement effect. The eventual diffusion constants for the two states, one faster and the other slower, are Df = 0.27 ± 0.06 and Ds = 0.052 ± 0.011 μm2 s−1, respectively, both agreeing well with literature-reported values as we discussed in the main text.

18
Fig. S8. Analysis of PDF(r) across a range of [CusA]. (A) PDF(r) generated from CusAmE SMT data at [CusA] of 120 ± 60, 310 ± 40, and 440 ± 40 nM (from left to right panel; all concentrations are in CusA trimers) in the cusAmE strain. Fitting the PDF(r) with the Brownian diffusion model results in 3 effective diffusion states with diffusion constants of 2.2 (D1), 0.1 (D2), and 0.025 (D3) μm2s-1 and the corresponding fractional populations of 11-14, 31-39, and 49-55%, respectively. The overall fit (black curve) and corresponding three diffusion states (blue, green, and red lines) for D1, D2, and D3 state, respectively) are overlaid on top of the data (bars). The D2 and D3 states intersect at ~100 nm (r0, red dashed line in the top left panel). (B) Same as A but with inversed transformed PDF(r), i.e., multiplied by the [CTM]−1. A two state model is sufficient to describe these inverse-transformed PDF(r)’s. The fitted diffusion constants for fast and slow state are Df = 0.27 ± 0.06 and Ds = 0.052 ± 0.011 μm2 s−1, respectively.
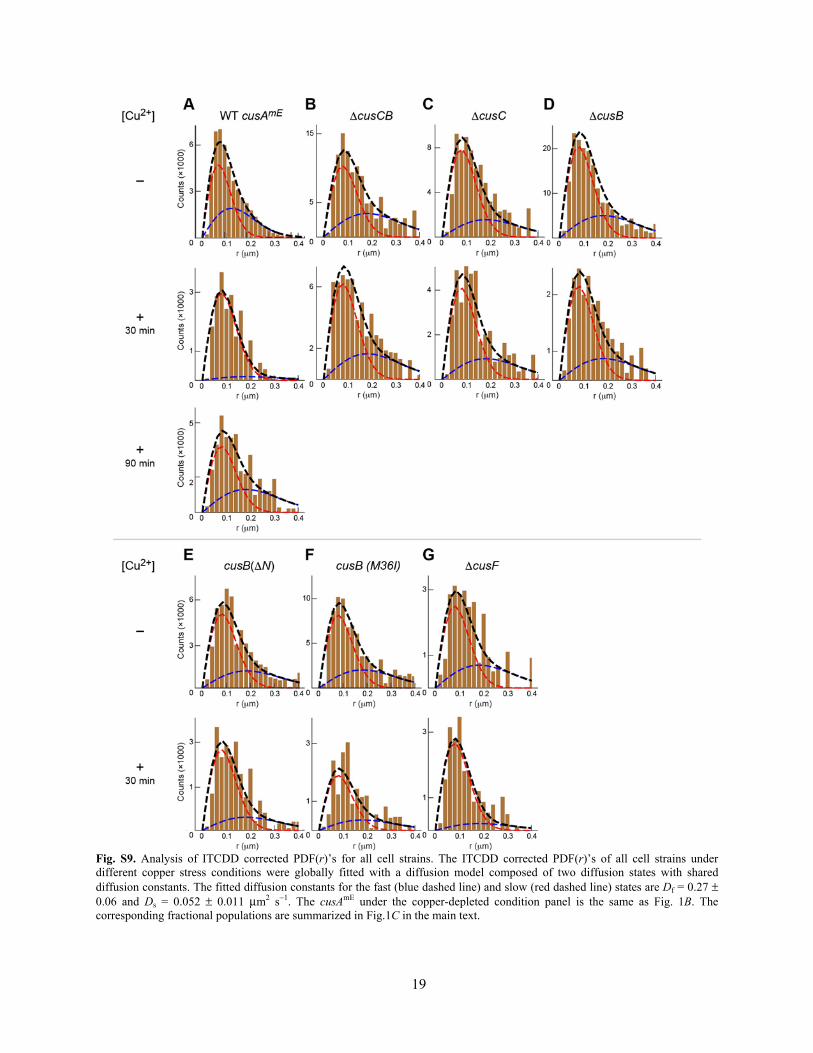
We thus applied ITCDD to all PDF(r)’s across all experimental conditions (different cell strains, as well as without and with copper stress) to evaluate how the fractional populations of these two diffusion states would change upon gene modification and copper stress (Fig. S9). Overall, the fitted diffusion constants for the fast and slow states are Df = 0.27 ± 0.06 and Ds = 0.052 ± 0.011 μm2 s−1. The corresponding fractional populations are summarized in Fig. 1C in the main text.
19
Fig. S9. Analysis of ITCDD corrected PDF(r)’s for all cell strains. The ITCDD corrected PDF(r)’s of all cell strains under different copper stress conditions were globally fitted with a diffusion model composed of two diffusion states with shared diffusion constants. The fitted diffusion constants for the fast (blue dashed line) and slow (red dashed line) states are Df = 0.27 ± 0.06 and Ds = 0.052 ± 0.011 μm2 s−1. The cusAmE under the copper-depleted condition panel is the same as Fig. 1B. The corresponding fractional populations are summarized in Fig.1C in the main text.
20
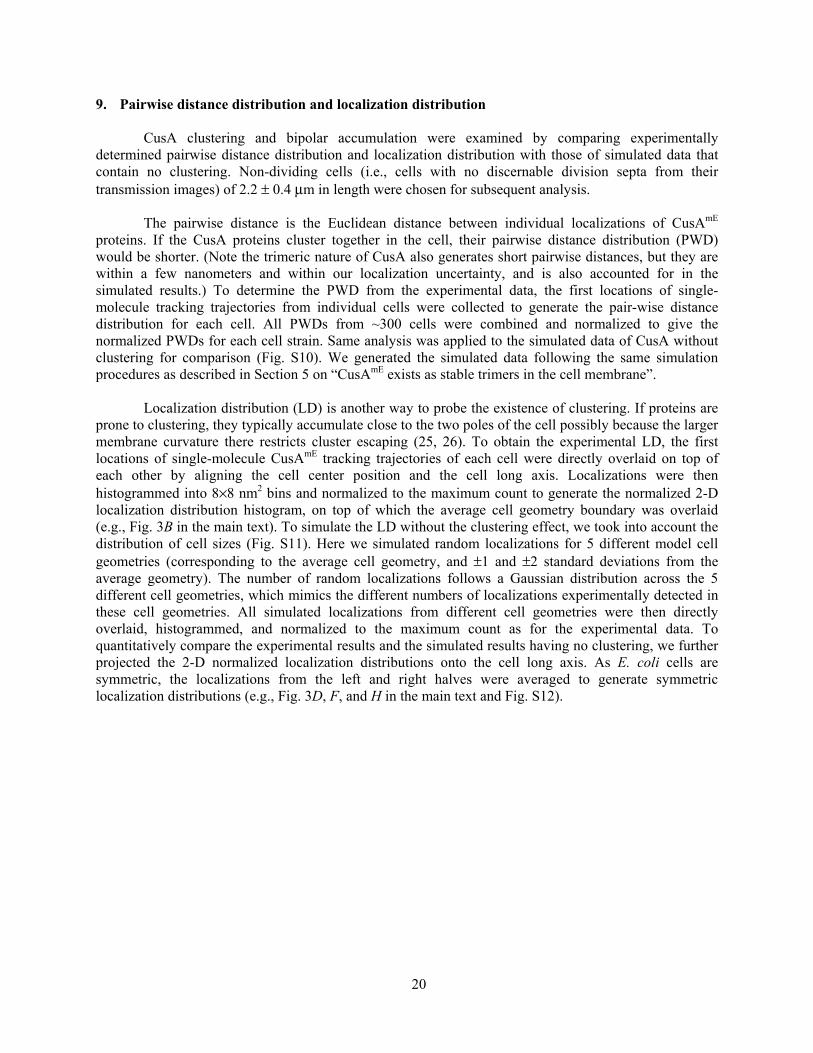
9. Pairwise distance distribution and localization distribution CusA clustering and bipolar accumulation were examined by comparing experimentally determined pairwise distance distribution and localization distribution with those of simulated data that contain no clustering. Non-dividing cells (i.e., cells with no discernable division septa from their transmission images) of 2.2 ± 0.4 μm in length were chosen for subsequent analysis. The pairwise distance is the Euclidean distance between individual localizations of CusAmE proteins. If the CusA proteins cluster together in the cell, their pairwise distance distribution (PWD) would be shorter. (Note the trimeric nature of CusA also generates short pairwise distances, but they are within a few nanometers and within our localization uncertainty, and is also accounted for in the simulated results.) To determine the PWD from the experimental data, the first locations of single-molecule tracking trajectories from individual cells were collected to generate the pair-wise distance distribution for each cell. All PWDs from ~300 cells were combined and normalized to give the normalized PWDs for each cell strain. Same analysis was applied to the simulated data of CusA without clustering for comparison (Fig. S10). We generated the simulated data following the same simulation procedures as described in Section 5 on “CusAmE exists as stable trimers in the cell membrane”. Localization distribution (LD) is another way to probe the existence of clustering. If proteins are prone to clustering, they typically accumulate close to the two poles of the cell possibly because the larger membrane curvature there restricts cluster escaping (25, 26). To obtain the experimental LD, the first locations of single-molecule CusAmE tracking trajectories of each cell were directly overlaid on top of each other by aligning the cell center position and the cell long axis. Localizations were then histogrammed into 8×8 nm2 bins and normalized to the maximum count to generate the normalized 2-D localization distribution histogram, on top of which the average cell geometry boundary was overlaid (e.g., Fig. 3B in the main text). To simulate the LD without the clustering effect, we took into account the distribution of cell sizes (Fig. S11). Here we simulated random localizations for 5 different model cell geometries (corresponding to the average cell geometry, and ±1 and ±2 standard deviations from the average geometry). The number of random localizations follows a Gaussian distribution across the 5 different cell geometries, which mimics the different numbers of localizations experimentally detected in these cell geometries. All simulated localizations from different cell geometries were then directly overlaid, histogrammed, and normalized to the maximum count as for the experimental data. To quantitatively compare the experimental results and the simulated results having no clustering, we further projected the 2-D normalized localization distributions onto the cell long axis. As E. coli cells are symmetric, the localizations from the left and right halves were averaged to generate symmetric localization distributions (e.g., Fig. 3D, F, and H in the main text and Fig. S12).
21
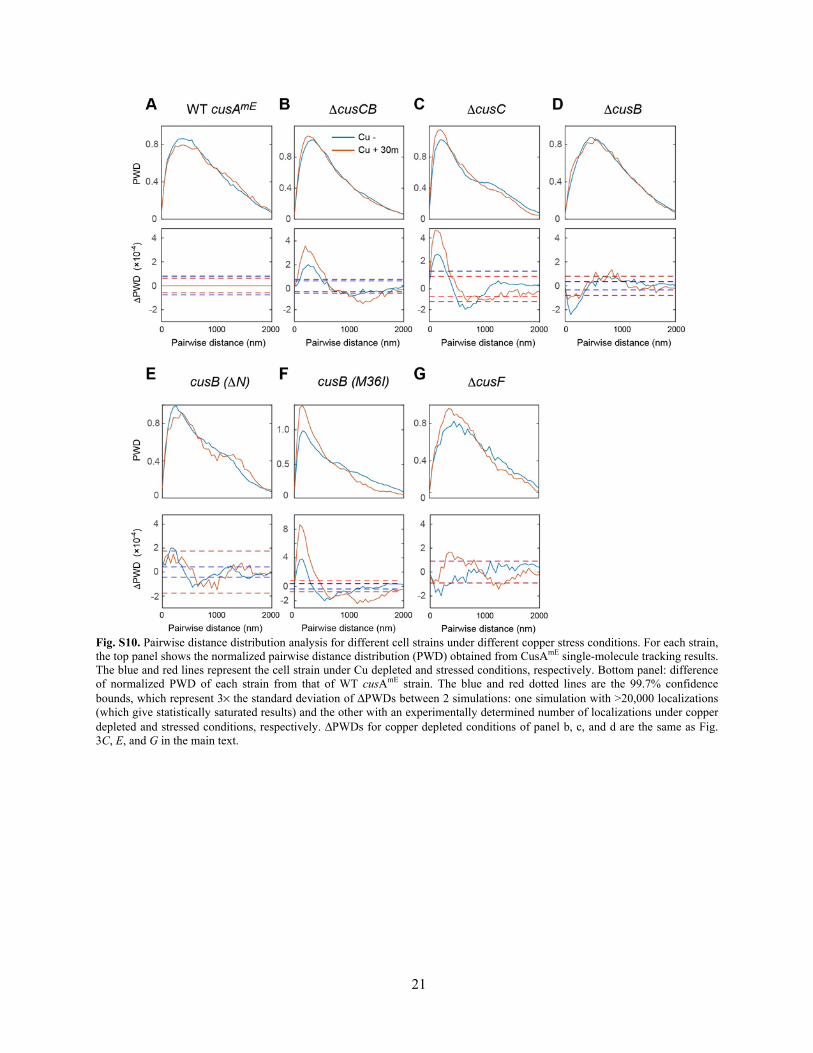
Fig. S10. Pairwise distance distribution analysis for different cell strains under different copper stress conditions. For each strain, the top panel shows the normalized pairwise distance distribution (PWD) obtained from CusAmE single-molecule tracking results. The blue and red lines represent the cell strain under Cu depleted and stressed conditions, respectively. Bottom panel: difference of normalized PWD of each strain from that of WT cusAmE strain. The blue and red dotted lines are the 99.7% confidence bounds, which represent 3× the standard deviation of ΔPWDs between 2 simulations: one simulation with >20,000 localizations (which give statistically saturated results) and the other with an experimentally determined number of localizations under copper depleted and stressed conditions, respectively. ΔPWDs for copper depleted conditions of panel b, c, and d are the same as Fig. 3C, E, and G in the main text.

22
Fig. S11. Distribution of cell geometric parameters across all experimental conditions. Cell geometric parameters were obtained by fitting the transmission image of each cell with the model of a cylinder with two hemispherical caps as described in our previous work (3). The cells were imaged in copper-depleted medium (blue) and in the presence of 500 μM [Cu2+] for 30 min (red). Each histogram is fitted with a Gaussian distribution function; the average and s.d. (i.e., center position ± s.d.) of each geometric parameter is denoted in the panel.
23
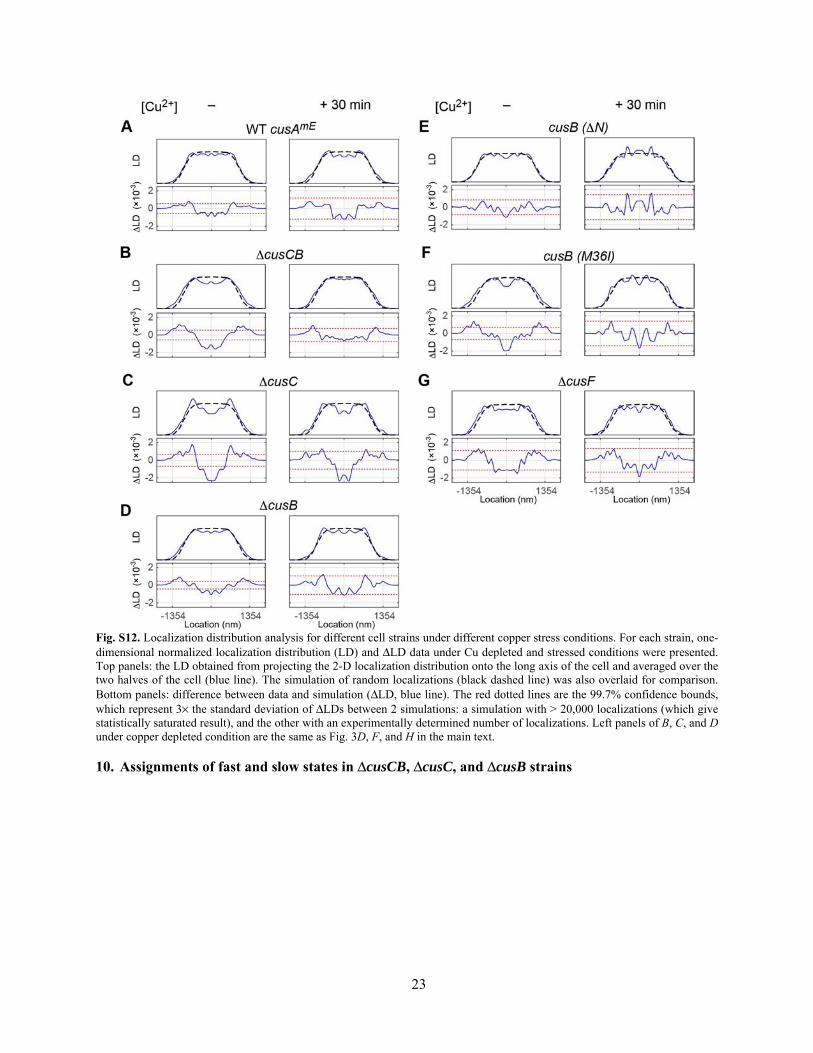
Fig. S12. Localization distribution analysis for different cell strains under different copper stress conditions. For each strain, one-dimensional normalized localization distribution (LD) and ΔLD data under Cu depleted and stressed conditions were presented. Top panels: the LD obtained from projecting the 2-D localization distribution onto the long axis of the cell and averaged over the two halves of the cell (blue line). The simulation of random localizations (black dashed line) was also overlaid for comparison. Bottom panels: difference between data and simulation (ΔLD, blue line). The red dotted lines are the 99.7% confidence bounds, which represent 3× the standard deviation of ΔLDs between 2 simulations: a simulation with > 20,000 localizations (which give statistically saturated result), and the other with an experimentally determined number of localizations. Left panels of B, C, and D under copper depleted condition are the same as Fig. 3D, F, and H in the main text.
10. Assignments of fast and slow states in ΔcusCB, ΔcusC, and ΔcusB strains
24
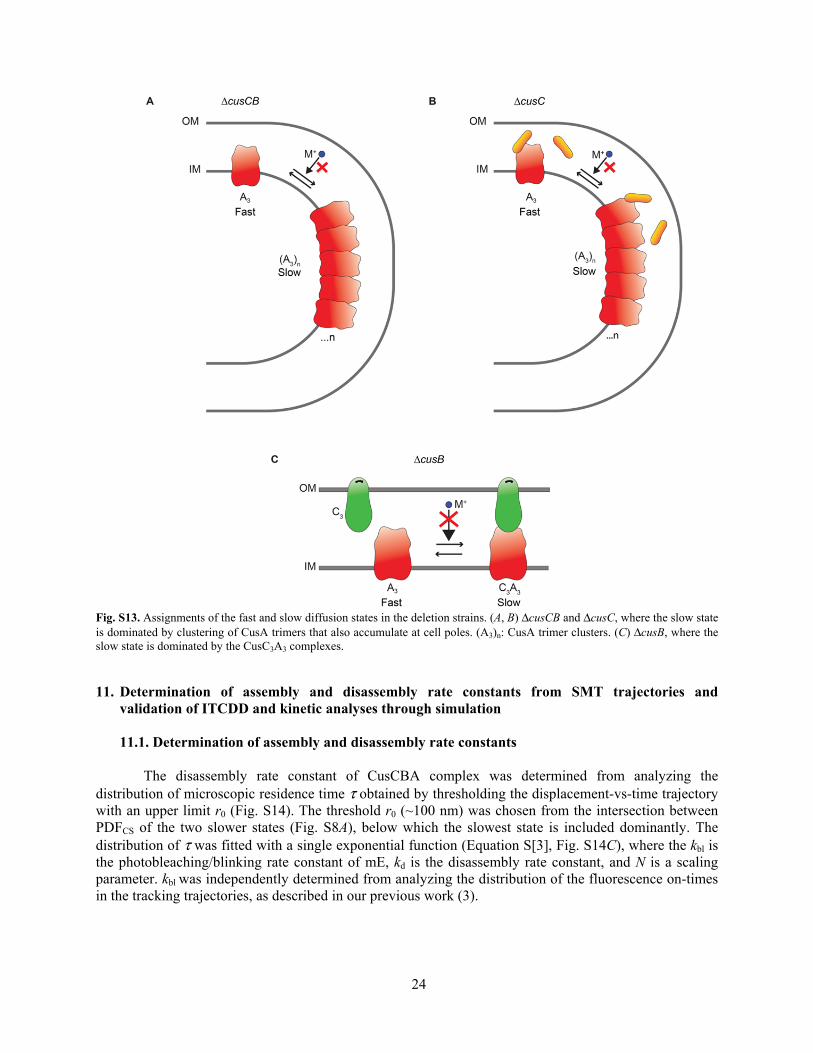
Fig. S13. Assignments of the fast and slow diffusion states in the deletion strains. (A, B) ΔcusCB and ΔcusC, where the slow state is dominated by clustering of CusA trimers that also accumulate at cell poles. (A3)n: CusA trimer clusters. (C) ΔcusB, where the slow state is dominated by the CusC3A3 complexes.
11. Determination of assembly and disassembly rate constants from SMT trajectories and
validation of ITCDD and kinetic analyses through simulation
11.1. Determination of assembly and disassembly rate constants
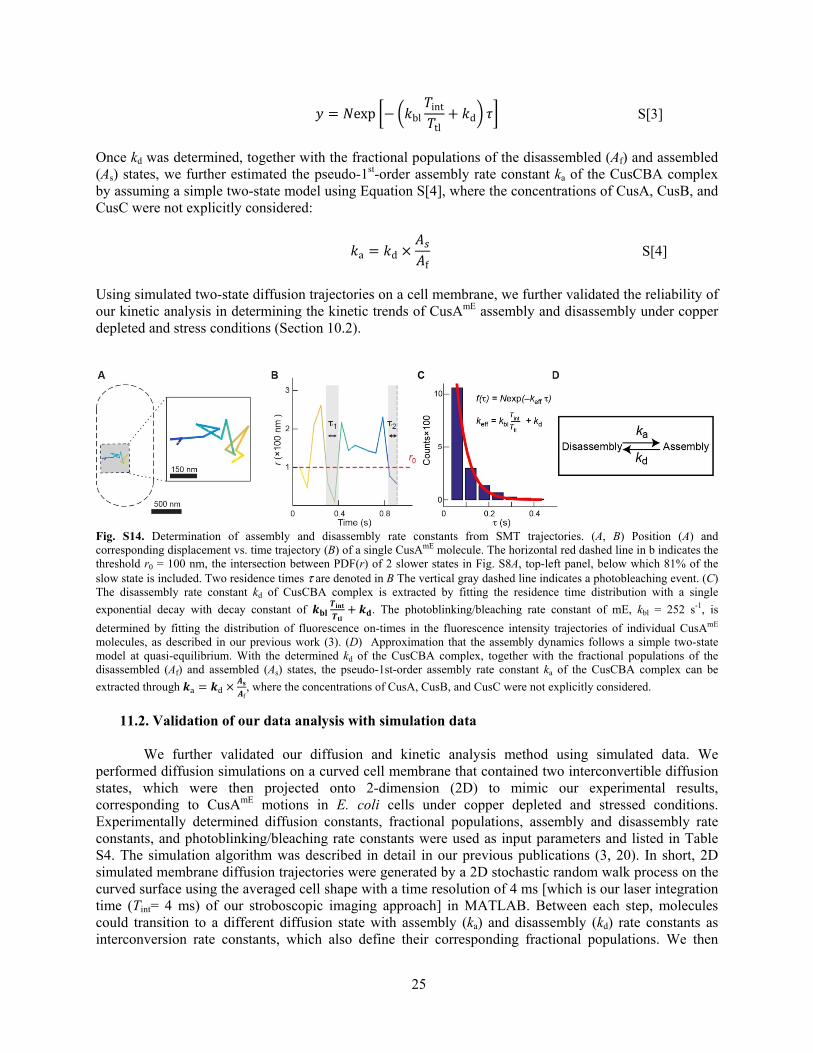
The disassembly rate constant of CusCBA complex was determined from analyzing the distribution of microscopic residence time τ obtained by thresholding the displacement-vs-time trajectory with an upper limit r0 (Fig. S14). The threshold r0 (~100 nm) was chosen from the intersection between PDFCS of the two slower states (Fig. S8A), below which the slowest state is included dominantly. The distribution of τ was fitted with a single exponential function (Equation S[3], Fig. S14C), where the kbl is the photobleaching/blinking rate constant of mE, kd is the disassembly rate constant, and N is a scaling parameter. kbl was independently determined from analyzing the distribution of the fluorescence on-times in the tracking trajectories, as described in our previous work (3).
25
= exp − bl inttl + d S[3]
Once kd was determined, together with the fractional populations of the disassembled (Af) and assembled (As) states, we further estimated the pseudo-1st-order assembly rate constant ka of the CusCBA complex by assuming a simple two-state model using Equation S[4], where the concentrations of CusA, CusB, and CusC were not explicitly considered: a = d × f S[4]
Using simulated two-state diffusion trajectories on a cell membrane, we further validated the reliability of our kinetic analysis in determining the kinetic trends of CusAmE assembly and disassembly under copper depleted and stress conditions (Section 10.2).
Fig. S14. Determination of assembly and disassembly rate constants from SMT trajectories. (A, B) Position (A) and corresponding displacement vs. time trajectory (B) of a single CusAmE molecule. The horizontal red dashed line in b indicates the threshold r0 = 100 nm, the intersection between PDF(r) of 2 slower states in Fig. S8A, top-left panel, below which 81% of the slow state is included. Two residence times τ are denoted in B The vertical gray dashed line indicates a photobleaching event. (C) The disassembly rate constant kd of CusCBA complex is extracted by fitting the residence time distribution with a single
exponential decay with decay constant of + . The photoblinking/bleaching rate constant of mE, kbl = 252 s-1, is
determined by fitting the distribution of fluorescence on-times in the fluorescence intensity trajectories of individual CusAmE molecules, as described in our previous work (3). (D) Approximation that the assembly dynamics follows a simple two-state model at quasi-equilibrium. With the determined kd of the CusCBA complex, together with the fractional populations of the disassembled (Af) and assembled (As) states, the pseudo-1st-order assembly rate constant ka of the CusCBA complex can be
extracted through a = d × f , where the concentrations of CusA, CusB, and CusC were not explicitly considered.
11.2. Validation of our data analysis with simulation data We further validated our diffusion and kinetic analysis method using simulated data. We performed diffusion simulations on a curved cell membrane that contained two interconvertible diffusion states, which were then projected onto 2-dimension (2D) to mimic our experimental results, corresponding to CusAmE motions in E. coli cells under copper depleted and stressed conditions. Experimentally determined diffusion constants, fractional populations, assembly and disassembly rate constants, and photoblinking/bleaching rate constants were used as input parameters and listed in Table S4. The simulation algorithm was described in detail in our previous publications (3, 20). In short, 2D simulated membrane diffusion trajectories were generated by a 2D stochastic random walk process on the curved surface using the averaged cell shape with a time resolution of 4 ms [which is our laser integration time (Tint= 4 ms) of our stroboscopic imaging approach] in MATLAB. Between each step, molecules could transition to a different diffusion state with assembly (ka) and disassembly (kd) rate constants as interconversion rate constants, which also define their corresponding fractional populations. We then
26
sampled the primary simulated trajectories every lapse time (Ttl= 60 ms) with trajectory length distribution
following Nexp − , and discarded the z components to have the 2D projection to yield the
eventual simulated diffusion trajectories for subsequent analyses. The temporal length distribution of the simulated trajectories was first checked. A fit with
Nexp − gives kbl = 240 ± 4.5 s-1, reproducing the input of photoblinking /bleaching kinetics of
the mE tag. We extracted diffusion constants and fractional populations by fitting the ITCDD-corrected PDF(r)’s with a 2-diffusion state model where the diffusion constants were shared across the copper depleted and stressed conditions. The extracted diffusion constants, Df = 0.24 μm2s-1 and Ds = 0.046 μm2s-
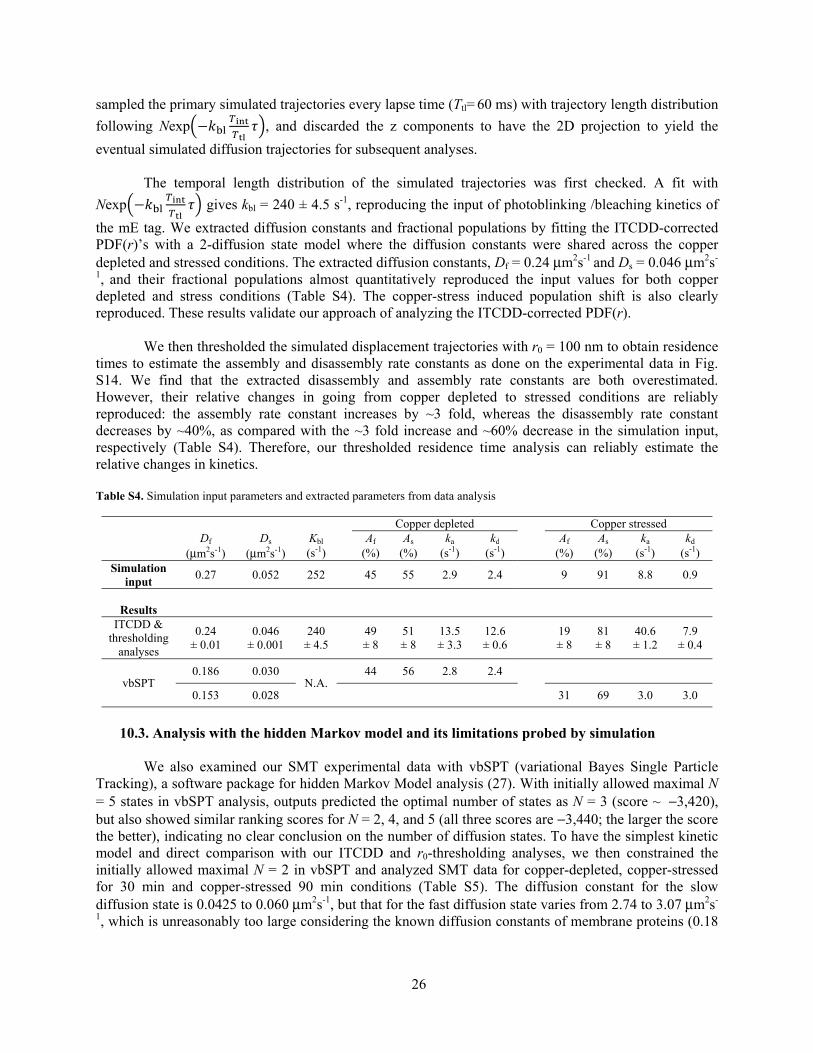
1, and their fractional populations almost quantitatively reproduced the input values for both copper depleted and stress conditions (Table S4). The copper-stress induced population shift is also clearly reproduced. These results validate our approach of analyzing the ITCDD-corrected PDF(r). We then thresholded the simulated displacement trajectories with r0 = 100 nm to obtain residence times to estimate the assembly and disassembly rate constants as done on the experimental data in Fig. S14. We find that the extracted disassembly and assembly rate constants are both overestimated. However, their relative changes in going from copper depleted to stressed conditions are reliably reproduced: the assembly rate constant increases by ~3 fold, whereas the disassembly rate constant decreases by ~40%, as compared with the ~3 fold increase and ~60% decrease in the simulation input, respectively (Table S4). Therefore, our thresholded residence time analysis can reliably estimate the relative changes in kinetics. Table S4. Simulation input parameters and extracted parameters from data analysis
10.3. Analysis with the hidden Markov model and its limitations probed by simulation We also examined our SMT experimental data with vbSPT (variational Bayes Single Particle Tracking), a software package for hidden Markov Model analysis (27). With initially allowed maximal N = 5 states in vbSPT analysis, outputs predicted the optimal number of states as N = 3 (score ~ −3,420), but also showed similar ranking scores for N = 2, 4, and 5 (all three scores are −3,440; the larger the score the better), indicating no clear conclusion on the number of diffusion states. To have the simplest kinetic model and direct comparison with our ITCDD and r0-thresholding analyses, we then constrained the initially allowed maximal N = 2 in vbSPT and analyzed SMT data for copper-depleted, copper-stressed for 30 min and copper-stressed 90 min conditions (Table S5). The diffusion constant for the slow diffusion state is 0.0425 to 0.060 μm2s-1, but that for the fast diffusion state varies from 2.74 to 3.07 μm2s-
1, which is unreasonably too large considering the known diffusion constants of membrane proteins (0.18
Copper depleted Copper stressed
Df Ds Kbl Af As ka kd Af As ka kd (μm2s-1) (μm2s-1) (s-1) (%) (%) (s-1) (s-1) (%) (%) (s-1) (s-1)
Simulation input
0.27 0.052 252 45 55 2.9 2.4 9 91 8.8 0.9
Results
ITCDD & thresholding
analyses
0.24 ± 0.01
0.046 ± 0.001
240 ± 4.5
49 ± 8
51 ± 8
13.5 ± 3.3
12.6 ± 0.6
19 ± 8
81 ± 8
40.6 ± 1.2
7.9 ± 0.4
vbSPT 0.186 0.030
N.A. 44 56 2.8 2.4
0.153 0.028 31 69 3.0 3.0

27
to 0.52 μm2 s−1) (28-30). The fractional populations and assembly and disassembly rate constants remain almost the same across all three experimental conditions (Af ~27%, As ~73%, ka ~6 s−1, and kd ~1.5 s-1).
Table S5. vbSPT analysis results of experimental data
Copper depleted Copper stressed 30 min
Copper stressed 90 min
Df (μm2s-1) 2.74 3.07 3.01 Ds (μm2s-1) 0.046 0.043 0.06
Af (%) 27 26 27 As (%) 73 74 73 ka (s
-1) 6.00 6.43 6.42 kd (s
-1) 1.45 1.36 1.50
The unreasonably large diffusion constant for the fast state and the apparent irresponsiveness to copper stress from the vbSPT analysis prompted us to check the reliability of vbSPT in handling the diffusive behaviors of CusAmE. Here we again used the simulated diffusion trajectories, as described in Section 11.1 above. With initially allowed maximal N = 5, vbSPT analysis determined the optimal number of states as N = 3 (i.e., one extra state than the actual simulation input; ranking score ~ 4,146), but with similar ranking scores for N = 2, 4, and 5 (with scores at ~ 4,144, 4144, and 4142, respectively), indicating no clear conclusion on the number of diffusion states. When forcing vbSPT to perform 2-state analysis on the simulated data (copper depleted and 30-min copper-stressed cases), the obtained diffusion constants are more reasonable but still significantly differ (~40% smaller) from the simulation inputs (Table S4). The fitted fractional populations showed a clear shift to the slow state upon copper stress, but the magnitude of shift is significantly reduced compared with the simulation input. The increasing trend in the assembly rate constant upon copper stress is correctly extracted by vbSPT, but the magnitude is merely ~7% compared with the expected ~3 fold. More problematic, the disassembly rate constant from vbSPT shows a wrong trend: it increases instead of decreases upon copper stress. Therefore, for the type of diffusive behaviors of CusAmE, vbSPT is not a reliable analysis method. 12. Increased mRNA levels of the cusCFBA operon after Cu stress
Fig. S15. Real-time reverse transcription PCR results show the increase in mRNA levels of the cusCFBA operon in the CusAmE strain exposed to 0.5 mM CuSO4 for 30 min (gray) and 90 min (white) in M9 medium relative to those grown in copper-depleted M9 medium at 37°C, consistent with literature (31, 32). Error bars are standard deviations for triplicate experiments.
28
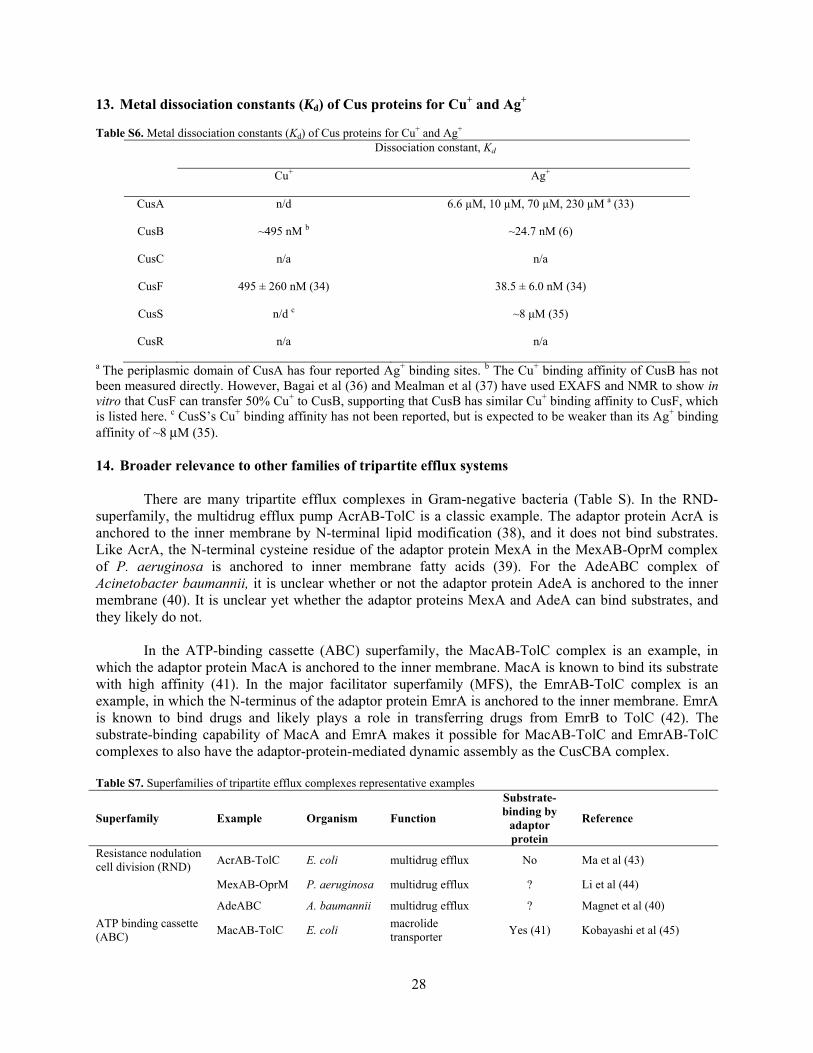
13. Metal dissociation constants (Kd) of Cus proteins for Cu+ and Ag+ Table S6. Metal dissociation constants (Kd) of Cus proteins for Cu+ and Ag+
Dissociation constant, Kd
Cu+ Ag+
CusA n/d 6.6 µM, 10 µM, 70 µM, 230 µM a (33)
CusB ~495 nM b ~24.7 nM (6)
CusC n/a n/a
CusF 495 ± 260 nM (34) 38.5 ± 6.0 nM (34)
CusS n/d c ~8 μM (35)
CusR n/a n/a
a The periplasmic domain of CusA has four reported Ag+ binding sites. b The Cu+ binding affinity of CusB has not been measured directly. However, Bagai et al (36) and Mealman et al (37) have used EXAFS and NMR to show in vitro that CusF can transfer 50% Cu+ to CusB, supporting that CusB has similar Cu+ binding affinity to CusF, which is listed here. c CusS’s Cu+ binding affinity has not been reported, but is expected to be weaker than its Ag+ binding affinity of ~8 μM (35).
14. Broader relevance to other families of tripartite efflux systems There are many tripartite efflux complexes in Gram-negative bacteria (Table S). In the RND-superfamily, the multidrug efflux pump AcrAB-TolC is a classic example. The adaptor protein AcrA is anchored to the inner membrane by N-terminal lipid modification (38), and it does not bind substrates. Like AcrA, the N-terminal cysteine residue of the adaptor protein MexA in the MexAB-OprM complex of P. aeruginosa is anchored to inner membrane fatty acids (39). For the AdeABC complex of Acinetobacter baumannii, it is unclear whether or not the adaptor protein AdeA is anchored to the inner membrane (40). It is unclear yet whether the adaptor proteins MexA and AdeA can bind substrates, and they likely do not. In the ATP-binding cassette (ABC) superfamily, the MacAB-TolC complex is an example, in which the adaptor protein MacA is anchored to the inner membrane. MacA is known to bind its substrate with high affinity (41). In the major facilitator superfamily (MFS), the EmrAB-TolC complex is an example, in which the N-terminus of the adaptor protein EmrA is anchored to the inner membrane. EmrA is known to bind drugs and likely plays a role in transferring drugs from EmrB to TolC (42). The substrate-binding capability of MacA and EmrA makes it possible for MacAB-TolC and EmrAB-TolC complexes to also have the adaptor-protein-mediated dynamic assembly as the CusCBA complex. Table S7. Superfamilies of tripartite efflux complexes representative examples
Superfamily Example Organism Function
Substrate-binding by
adaptor protein
Reference
Resistance nodulation cell division (RND)
AcrAB-TolC E. coli multidrug efflux No Ma et al (43)
MexAB-OprM P. aeruginosa multidrug efflux ? Li et al (44)
AdeABC A. baumannii multidrug efflux ? Magnet et al (40)
ATP binding cassette (ABC)
MacAB-TolC E. coli macrolide transporter
Yes (41) Kobayashi et al (45)

29
Major facilitator superfamily (MFS)
EmrAB-TolC E. coli multidrug efflux Yes (42) Lomovskaya et al (46)
15. Additional references 1. Datsenko KA, Wanner BL (2000) One-step inactivation of chromosomal genes in escherichia coli
k-12 using pcr products. Proc Natl Acad Sci U S A 97:6640-6645. 2. Long F, et al. (2010) Crystal structures of the cusa efflux pump suggest methionine-mediated
metal transport. Nature 467:484-488. 3. Chen T-Y, et al. (2015) Concentration- and chromosome-organization-dependent regulator
unbinding from DNA for transcription regulation in living cells. Nat Commun 6:7445. 4. Kim J, Webb AM, Kershner JP, Blaskowski S, Copley SD (2014) A versatile and highly efficient
method for scarless genome editing in escherichia coli and salmonella enterica. BMC Biotechnol 14:84.
5. Guzman LM, Belin D, Carson MJ, Beckwith J (1995) Tight regulation, modulation, and high-level expression by vectors containing the arabinose pbad promoter. J Bacteriol 177:4121-4130.
6. Bagai I, Liu W, Rensing C, Blackburn NJ, McEvoy MM (2007) Substrate-linked conformational change in the periplasmic component of a cu(i)/ag(i) efflux system. J Biol Chem 282:35695-35702.
7. Mealman TD, et al. (2012) The n-terminal region of cusb is sufficient for metal binding and metal transfer with the metallochaperone cusf. Biochemistry 51:6767-6775.
8. Goya H, Lai M (1967) Adsorption of trace elements from seawater by chelex 100. (DTIC Document).
9. Elf J, Li G-W, Xie XS (2007) Probing transcription factor dynamics at the single-molecule level in a living cell. Science 316:1191-1194.
10. English BP, et al. (2011) Single-molecule investigations of the stringent response machinery in living bacterial cells. Proc Natl Acad Sci U S A 108:E365-E373.
11. Mehta P, et al. (2013) Dynamics and stoichiometry of a regulated enhancer-binding protein in live escherichia coli cells. Nat Commun 4:1997.
12. Bakshi S, Bratton BP, Weisshaar JC (2011) Subdiffraction-limit study of kaede diffusion and spatial distribution in live escherichia coli. Biophys J 101:2535-2544.
13. Mazza D, Abernathy A, Golob N, Morisaki T, McNally JG (2012) A benchmark for chromatin binding measurements in live cells. Nucleic Acids Res 40:e119.
14. Gahlmann A, Moerner WE (2014) Exploring bacterial cell biology with single-molecule tracking and super-resolution imaging. Nat Rev Microbiol 12:9-22.
15. Uphoff S, Reyes-Lamothe R, de Leon FG, Sherratt DJ, Kapanidis AN (2013) Single-molecule DNA repair in live bacteria. Proc Natl Acad Sci U S A 110:8063-8068.
16. Schmittgen TD, Livak KJ (2008) Analyzing real-time pcr data by the comparative ct method. Nat. Protocols 3:1101-1108.
17. Frost NA, Lu HE, Blanpied TA (2012) Optimization of cell morphology measurement via single-molecule tracking palm. PloS One 7:e36751.
18. Durisic N, Laparra-Cuervo L, Sandoval-Alvarez A, Borbely JS, Lakadamyali M (2014) Single-molecule evaluation of fluorescent protein photoactivation efficiency using an in vivo nanotemplate. Nat Meth 11:156-162.
19. Annibale P, Scarselli M, Greco M, Radenovic A (2012) Identification of the factors affecting co-localization precision for quantitative multicolor localization microscopy. Optical Nanoscopy 1:9.
20. Chen T-Y, et al. (2015) Quantifying multistate cytoplasmic molecular diffusion in bacterial cells via inverse transform of confined displacement distribution. J Phys Chem B 119:14451-14459.
21. Zhang M, et al. (2012) Rational design of true monomeric and bright photoactivatable fluorescent proteins. Nat Meth 9:727-729.
30
22. Wang S, Moffitt JR, Dempsey GT, Xie XS, Zhuang X (2014) Characterization and development of photoactivatable fluorescent proteins for single-molecule-based superresolution imaging. Proc Natl Acad Sci U S A 111:8452-8457.
23. Gebhardt JCM, et al. (2013) Single-molecule imaging of transcription factor binding to DNA in live mammalian cells. Nat Meth 10:421-426.
24. Oswald F, L. M. Bank E, Bollen YJM, Peterman EJG (2014) Imaging and quantification of trans-membrane protein diffusion in living bacteria. Phys Chem Chem Phys 16:12625-12634.
25. Thiem S, Kentner D, Sourjik V (2007) Positioning of chemosensory clusters in e. Coli and its relation to cell division. EMBO J 26:1615-1623.
26. Kim KK, Yokota H, Kim SH (1999) Four-helical-bundle structure of the cytoplasmic domain of a serine chemotaxis receptor. Nature 400:787-792.
27. Persson F, Linden M, Unoson C, Elf J (2013) Extracting intracellular diffusive states and transition rates from single-molecule tracking data. Nat Meth 10:265-269.
28. Kumar M, Mommer MS, Sourjik V (2010) Mobility of cytoplasmic, membrane, and DNA-binding proteins in escherichia coli. Biophys J 98:552-559.
29. Nenninger A, et al. (2014) Independent mobility of proteins and lipids in the plasma membrane of escherichia coli. Mol Microbiol 92:1142-1153.
30. Oh D, Yu Y, Lee H, Wanner Barry L, Ritchie K (2014) Dynamics of the serine chemoreceptor in the escherichia coli inner membrane: A high-speed single-molecule tracking study. Biophys J 106:145-153.
31. Outten FW, Huffman DL, Hale JA, O'Halloran TV (2001) The independent cue and cus systems confer copper tolerance during aerobic and anaerobic growth in escherichia coli. J Biol Chem 2001:30670-30677.
32. Yamamoto K, Ishihama A (2005) Transcriptional response of escherichia coli to external copper. Mol Microbiol 56:215-227.
33. Yun B-Y, et al. (2010) Periplasmic domain of cusa in an escherichia coli cu+/ag+ transporter has metal binding sites. J Microbiol 48:829-835.
34. Kittleson JT, et al. (2006) Periplasmic metal-resistance protein cusf exhibits high affinity and specificity for both cui and agi. Biochemistry 45:11096-11102.
35. Gudipaty SA, McEvoy MM (2014) The histidine kinase cuss senses silver ions through direct binding by its sensor domain. Biochim Biophys Acta 1844:1656-1661.
36. Bagai I, Rensing C, Blackburn NJ, McEvoy MM (2008) Direct metal transfer between periplasmic proteins identifies a bacterial copper chaperone. Biochemistry 47:11408-11414.
37. Mealman TD, et al. (2011) Interactions between cusf and cusb identified by nmr spectroscopy and chemical cross-linking coupled to mass spectrometry. Biochemistry 50:2559-2566.
38. Ge Q, Yamada Y, Zgurskaya H (2009) The c-terminal domain of acra is essential for the assembly and function of the multidrug efflux pump acrab-tolc. J Bacteriol 191:4365-4371.
39. Akama H, et al. (2004) Crystal structure of the membrane fusion protein, mexa, of the multidrug transporter in pseudomonas aeruginosa. J Biol Chem 279:25939-25942.
40. Magnet S, Courvalin P, Lambert T (2001) Resistance-nodulation-cell division-type efflux pump involved in aminoglycoside resistance in acinetobacter baumannii strain bm4454. Antimicrob Agents Chemother 45:3375-3380.
41. Lu S, Zgurskaya HI (2013) Maca, a periplasmic membrane fusion protein of the macrolide transporter macab-tolc, binds lipopolysaccharide core specifically and with high affinity. J Bacteriol 195:4865-4872.
42. Borges-Walmsley MI, et al. (2003) Identification of oligomerization and drug-binding domains of the membrane fusion protein emra. J Biol Chem 278:12903-12912.
43. Ma D, et al. (1995) Genes acra and acrb encode a stress-induced efflux system of escherichia coli. Mol Microbiol 16:45-55.
44. Li XZ, Nikaido H, Poole K (1995) Role of mexa-mexb-oprm in antibiotic efflux in pseudomonas aeruginosa. Antimicrob Agents Chemother 39:1948-1953.

31
45. Kobayashi N, Nishino K, Yamaguchi A (2001) Novel macrolide-specific abc-type efflux transporter in escherichia coli. J Bacteriol 183:5639-5644.
46. Lomovskaya O, Lewis K (1992) Emr, an escherichia coli locus for multidrug resistance. Proc Natl Acad Sci U S A 89:8938-8942.