adaptive reuse office lease - tcn worldwide · sub-market momentum & forecast office sub-market...
TRANSCRIPT
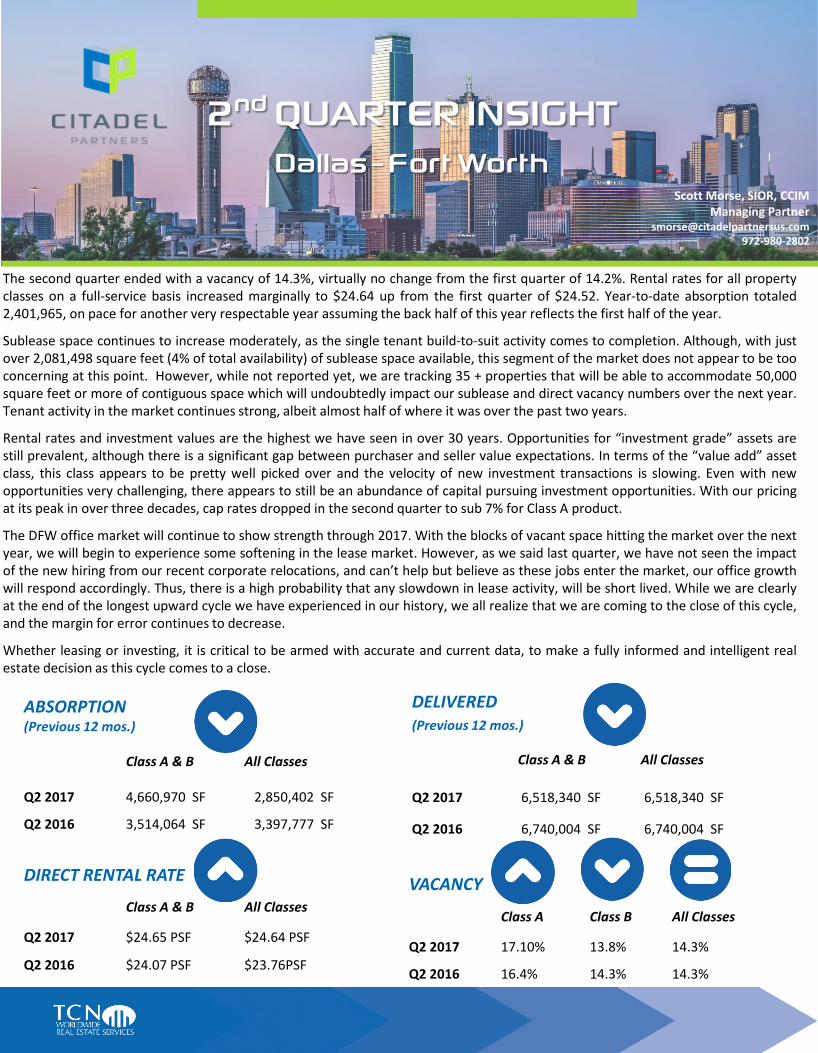
ABSORPTION (Previous 12 mos.)
Class A & B All Classes
Q2 2017 4,660,970 SF 2,850,402 SF
Q2 2016 3,514,064 SF 3,397,777 SF
DIRECT RENTAL RATE
Class A & B All Classes
Q2 2017 $24.65 PSF $24.64 PSF
Q2 2016 $24.07 PSF $23.76PSF
VACANCY
Class A Class B All Classes
Q2 2017 17.10% 13.8% 14.3%
Q2 2016 16.4% 14.3% 14.3%
The second quarter ended with a vacancy of 14.3%, virtually no change from the first quarter of 14.2%. Rental rates for all property classes on a full-service basis increased marginally to $24.64 up from the first quarter of $24.52. Year-to-date absorption totaled 2,401,965, on pace for another very respectable year assuming the back half of this year reflects the first half of the year.
Sublease space continues to increase moderately, as the single tenant build-to-suit activity comes to completion. Although, with just over 2,081,498 square feet (4% of total availability) of sublease space available, this segment of the market does not appear to be too concerning at this point. However, while not reported yet, we are tracking 35 + properties that will be able to accommodate 50,000 square feet or more of contiguous space which will undoubtedly impact our sublease and direct vacancy numbers over the next year. Tenant activity in the market continues strong, albeit almost half of where it was over the past two years.
Rental rates and investment values are the highest we have seen in over 30 years. Opportunities for “investment grade” assets are still prevalent, although there is a significant gap between purchaser and seller value expectations. In terms of the “value add” asset class, this class appears to be pretty well picked over and the velocity of new investment transactions is slowing. Even with new opportunities very challenging, there appears to still be an abundance of capital pursuing investment opportunities. With our pricing at its peak in over three decades, cap rates dropped in the second quarter to sub 7% for Class A product.
The DFW office market will continue to show strength through 2017. With the blocks of vacant space hitting the market over the next year, we will begin to experience some softening in the lease market. However, as we said last quarter, we have not seen the impact of the new hiring from our recent corporate relocations, and can’t help but believe as these jobs enter the market, our office growth will respond accordingly. Thus, there is a high probability that any slowdown in lease activity, will be short lived. While we are clearly at the end of the longest upward cycle we have experienced in our history, we all realize that we are coming to the close of this cycle, and the margin for error continues to decrease.
Whether leasing or investing, it is critical to be armed with accurate and current data, to make a fully informed and intelligent real estate decision as this cycle comes to a close.
Advisory Experience Advisory Experience
Maxim – 700,000 SF
The Domain, Austin, TX – 70 Acres Weaver – 58,000 SF
Knoll Trail Plaza – 120,000 SF Build-to-Suit
Weaver – 245,442 SF Multi-market Texas Instruments – 1,200,000 SF
Invensys – 45,000 SF Sublease
Texas Instruments – 70.537 Acres with a 441,362 SF Semiconductor
Flextronics – 1,500,000 SF
ESI – 70,000 SF
TECHNOLOGY LEASE
MULTIPLE LOCATIONS
DISPOSITION
ADAPTIVE REUSE OFFICE LEASE
This document has been prepared by Citadel Partners, LLC. for advertising and general information only. Citadel Partners, LL C. makes no guarantees, representations or warranties of any kind, expressed or implied,
regarding the information including, but not limited to, warranties of content, accuracy and reliability. Any interested party should undertake their own inquiries as to the accuracy of the information. Citadel Partners, LLC.
excludes unequivocally all inferred or implied terms, conditions and warranties arising out of this document and excludes all liability for loss and damages arising there from. This
publication is the copyrighted property of Citadel Partners, LLC. and/or their licensor(s). All rights reserved.
2nd QUARTER INSIGHT Dallas - Fort Worth
Scott Morse, SIOR, CCIM Managing Partner
[email protected] 972-980-2802
DELIVERED (Previous 12 mos.)
Class A & B All Classes
Q2 2017 6,518,340 SF 6,518,340 SF
Q2 2016 6,740,004 SF 6,740,004 SF
Sub-Market Momentum & Forecast
Office Sub-Market Highlights
DFW News
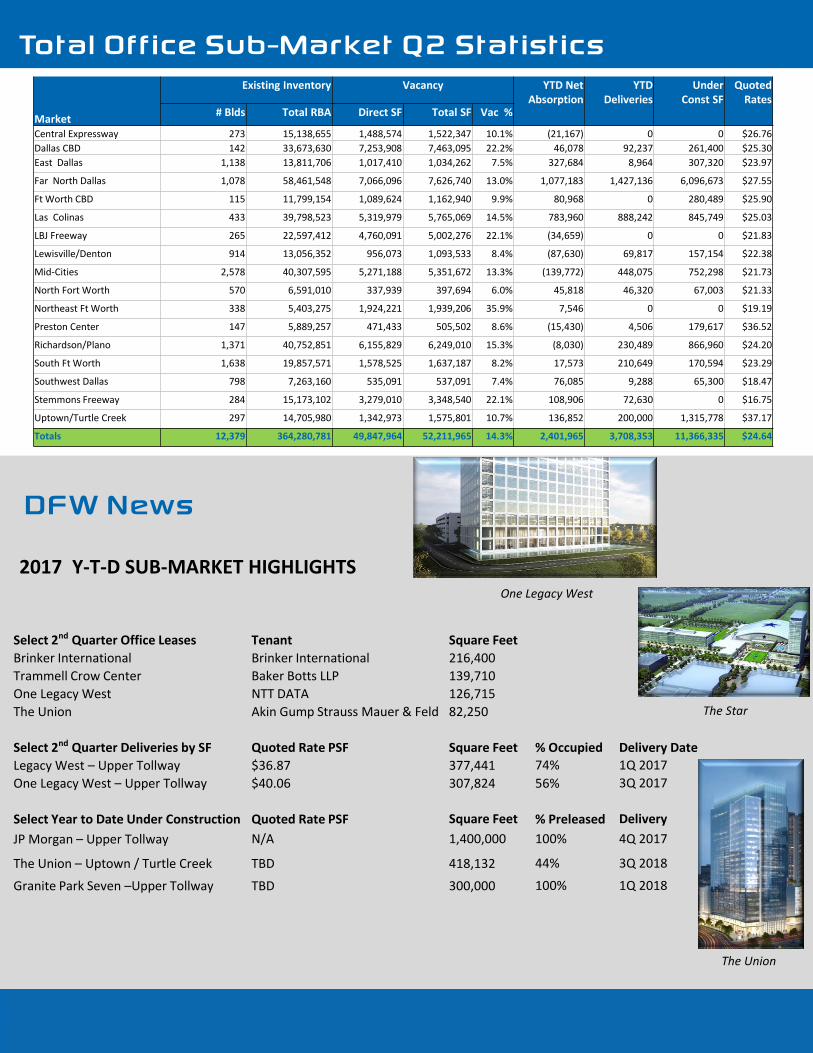
Total Office Sub-Market Q2 Statistics
2017 Y-T-D SUB-MARKET HIGHLIGHTS
National and Macroeconomic Overview
There is no more recurrent question posed in real estate analysis than, “Where are we in the cycle?” The mood amongst economic forecasters can best be described as “benign.” While there is a general consensus that the present expansion is getting long in the tooth, at 96 months and counting, most (correctly) assert that business cycles do not die of old age. For the record, this is already the third longest upcycle since 1850. But it is also the weakest since World War II. The upcycle of the 1990s reached 120 months, but averaged 3.6% annual real GDP growth over that decade. The recovery since the Global Financial Crisis has averaged a bit under 2.1% annually. Given slower labor force growth (even absent a lower participation rate) and decelerating productivity improvements, the baseline growth in the years ahead appears to be in the 1.7% - 1.9% range. Expectations of a return to the growth of the 1990s simply cannot be justified in the numbers. Some comfort is being taken by the absence of typical signs of economic overheating that often precede recessions. Inflation remains quiescent, with low energy prices driving prices at the gas pump down to near $2.00 per gallon during the peak summer travel season. The Federal Reserve has been gradually raising its benchmark rates, but is being careful to avoid squeezing economic growth in the process. The “Trump Bump” in stock prices has shown staying power on Wall Street, but as the year advances it becomes clearer that the agenda of tax reform, infrastructure spending, Dodd-Frank rollback, and entitlement reduction will not be accomplished in 2017. Hence, there is probably greater fragility in the economy than the consensus acknowledges and risk is present from either domestic disappointments or international disruption. Jobs. There seems to be a healthy fluidity in the labor markets, with the Bureau of Labor Statistics JOLTS (Job Openings and Labor Turnover Survey) showing job hires (5.5 million) well matched to job openings (5.7 million), and the number of voluntary separations (“quits”) at 3.2 million running roughly twice as high as layoffs and discharges (1.7 million). The unemployment rate was 4.4% as of June, its fourth consecutive month at 4.5% or less. Overall job growth averaged 180,000 per month during the
citadelpartnersus.com
Select 2nd Quarter Office Leases Tenant Square Feet
Brinker International Brinker International 216,400
Trammell Crow Center Baker Botts LLP 139,710
One Legacy West NTT DATA 126,715
The Union Akin Gump Strauss Mauer & Feld 82,250
Select 2nd Quarter Deliveries by SF Quoted Rate PSF Square Feet % Occupied Delivery Date
Legacy West – Upper Tollway $36.87 377,441 74% 1Q 2017
One Legacy West – Upper Tollway $40.06 307,824 56% 3Q 2017
Select Year to Date Under Construction Quoted Rate PSF Square Feet % Preleased Delivery
JP Morgan – Upper Tollway N/A 1,400,000 100% 4Q 2017
The Union – Uptown / Turtle Creek TBD 418,132 44% 3Q 2018
Granite Park Seven –Upper Tollway TBD 300,000 100% 1Q 2018
One Legacy West
The Star
The Union
Source: TCN State of the Market Central Edition Report Q2 2017
first half of the year, and the Blue Chip Economists forecast slippage to a 166,000 monthly average for the balance of 2017. Office sector demand has been bolstered with business and professional service employment rising by 625,000 year-over-year while financial service gained 169,000 jobs. Transportation and warehousing employment is up by 97,000, largely due to e-commerce (although this did limit retail job growth to just 20,000). Manufacturing eked out a 49,000 job gain, but construction activity posted a substantial job increase of 206,000 over the twelve months ending June 2017. Outlook. There is a very narrow range in forecasts for key variables in the economy: GDP growth; unemployment; personal consumption expenditures; trade balance; housing starts; vehicle sales; all are basically projected to continue recent trend lines. The difficulty is that while expectations are linear, risks are non-linear. Asset pricing in real estate as well as in the stock market is high, and investment volume is being driven more by the pool of capital than by earnings fundamentals. While some are extolling a “Goldilocks” condition in the economy, potential surprises are asymmetrical at this point – more likely on the downside than the upside – with risk managers now speaking more frequently about a possible “Black Swan” as the trigger for cyclical change.
Market
Existing Inventory Vacancy YTD Net Absorption
YTD Deliveries
Under Const SF
Quoted Rates
# Blds Total RBA Direct SF Total SF Vac %
Central Expressway 273 15,138,655 1,488,574 1,522,347 10.1% (21,167) 0 0 $26.76
Dallas CBD 142 33,673,630 7,253,908 7,463,095 22.2% 46,078 92,237 261,400 $25.30
East Dallas 1,138 13,811,706 1,017,410 1,034,262 7.5% 327,684 8,964 307,320 $23.97
Far North Dallas 1,078 58,461,548 7,066,096 7,626,740 13.0% 1,077,183 1,427,136 6,096,673 $27.55
Ft Worth CBD 115 11,799,154 1,089,624 1,162,940 9.9% 80,968 0 280,489 $25.90
Las Colinas 433 39,798,523 5,319,979 5,765,069 14.5% 783,960 888,242 845,749 $25.03
LBJ Freeway 265 22,597,412 4,760,091 5,002,276 22.1% (34,659) 0 0 $21.83
Lewisville/Denton 914 13,056,352 956,073 1,093,533 8.4% (87,630) 69,817 157,154 $22.38
Mid-Cities 2,578 40,307,595 5,271,188 5,351,672 13.3% (139,772) 448,075 752,298 $21.73
North Fort Worth 570 6,591,010 337,939 397,694 6.0% 45,818 46,320 67,003 $21.33
Northeast Ft Worth 338 5,403,275 1,924,221 1,939,206 35.9% 7,546 0 0 $19.19
Preston Center 147 5,889,257 471,433 505,502 8.6% (15,430) 4,506 179,617 $36.52
Richardson/Plano 1,371 40,752,851 6,155,829 6,249,010 15.3% (8,030) 230,489 866,960 $24.20
South Ft Worth 1,638 19,857,571 1,578,525 1,637,187 8.2% 17,573 210,649 170,594 $23.29
Southwest Dallas 798 7,263,160 535,091 537,091 7.4% 76,085 9,288 65,300 $18.47
Stemmons Freeway 284 15,173,102 3,279,010 3,348,540 22.1% 108,906 72,630 0 $16.75
Uptown/Turtle Creek 297 14,705,980 1,342,973 1,575,801 10.7% 136,852 200,000 1,315,778 $37.17
Totals 12,379 364,280,781 49,847,964 52,211,965 14.3% 2,401,965 3,708,353 11,366,335 $24.64

Sub-Market Momentum & Forecast
Office Sub-Market Highlights
DFW News
Total Office Sub-Market Q2 Statistics
2017 Y-T-D SUB-MARKET HIGHLIGHTS
National and Macroeconomic Overview
There is no more recurrent question posed in real estate analysis than, “Where are we in the cycle?” The mood amongst economic forecasters can best be described as “benign.” While there is a general consensus that the present expansion is getting long in the tooth, at 96 months and counting, most (correctly) assert that business cycles do not die of old age. For the record, this is already the third longest upcycle since 1850. But it is also the weakest since World War II. The upcycle of the 1990s reached 120 months, but averaged 3.6% annual real GDP growth over that decade. The recovery since the Global Financial Crisis has averaged a bit under 2.1% annually. Given slower labor force growth (even absent a lower participation rate) and decelerating productivity improvements, the baseline growth in the years ahead appears to be in the 1.7% - 1.9% range. Expectations of a return to the growth of the 1990s simply cannot be justified in the numbers. Some comfort is being taken by the absence of typical signs of economic overheating that often precede recessions. Inflation remains quiescent, with low energy prices driving prices at the gas pump down to near $2.00 per gallon during the peak summer travel season. The Federal Reserve has been gradually raising its benchmark rates, but is being careful to avoid squeezing economic growth in the process. The “Trump Bump” in stock prices has shown staying power on Wall Street, but as the year advances it becomes clearer that the agenda of tax reform, infrastructure spending, Dodd-Frank rollback, and entitlement reduction will not be accomplished in 2017. Hence, there is probably greater fragility in the economy than the consensus acknowledges and risk is present from either domestic disappointments or international disruption. Jobs. There seems to be a healthy fluidity in the labor markets, with the Bureau of Labor Statistics JOLTS (Job Openings and Labor Turnover Survey) showing job hires (5.5 million) well matched to job openings (5.7 million), and the number of voluntary separations (“quits”) at 3.2 million running roughly twice as high as layoffs and discharges (1.7 million). The unemployment rate was 4.4% as of June, its fourth consecutive month at 4.5% or less. Overall job growth averaged 180,000 per month during the
citadelpartnersus.com
Select 2nd Quarter Office Leases Tenant Square Feet
Brinker International Brinker International 216,400
Trammell Crow Center Baker Botts LLP 139,710
One Legacy West NTT DATA 126,715
The Union Akin Gump Strauss Mauer & Feld 82,250
Select 2nd Quarter Deliveries by SF Quoted Rate PSF Square Feet % Occupied Delivery Date
Legacy West – Upper Tollway $36.87 377,441 74% 1Q 2017
One Legacy West – Upper Tollway $40.06 307,824 56% 3Q 2017
Select Year to Date Under Construction Quoted Rate PSF Square Feet % Preleased Delivery
JP Morgan – Upper Tollway N/A 1,400,000 100% 4Q 2017
The Union – Uptown / Turtle Creek TBD 418,132 44% 3Q 2018
Granite Park Seven –Upper Tollway TBD 300,000 100% 1Q 2018
One Legacy West
The Star
The Union
Source: TCN State of the Market Central Edition Report Q2 2017
first half of the year, and the Blue Chip Economists forecast slippage to a 166,000 monthly average for the balance of 2017. Office sector demand has been bolstered with business and professional service employment rising by 625,000 year-over-year while financial service gained 169,000 jobs. Transportation and warehousing employment is up by 97,000, largely due to e-commerce (although this did limit retail job growth to just 20,000). Manufacturing eked out a 49,000 job gain, but construction activity posted a substantial job increase of 206,000 over the twelve months ending June 2017. Outlook. There is a very narrow range in forecasts for key variables in the economy: GDP growth; unemployment; personal consumption expenditures; trade balance; housing starts; vehicle sales; all are basically projected to continue recent trend lines. The difficulty is that while expectations are linear, risks are non-linear. Asset pricing in real estate as well as in the stock market is high, and investment volume is being driven more by the pool of capital than by earnings fundamentals. While some are extolling a “Goldilocks” condition in the economy, potential surprises are asymmetrical at this point – more likely on the downside than the upside – with risk managers now speaking more frequently about a possible “Black Swan” as the trigger for cyclical change.
Market
Existing Inventory Vacancy YTD Net Absorption
YTD Deliveries
Under Const SF
Quoted Rates
# Blds Total RBA Direct SF Total SF Vac %
Central Expressway 273 15,138,655 1,488,574 1,522,347 10.1% (21,167) 0 0 $26.76
Dallas CBD 142 33,673,630 7,253,908 7,463,095 22.2% 46,078 92,237 261,400 $25.30
East Dallas 1,138 13,811,706 1,017,410 1,034,262 7.5% 327,684 8,964 307,320 $23.97
Far North Dallas 1,078 58,461,548 7,066,096 7,626,740 13.0% 1,077,183 1,427,136 6,096,673 $27.55
Ft Worth CBD 115 11,799,154 1,089,624 1,162,940 9.9% 80,968 0 280,489 $25.90
Las Colinas 433 39,798,523 5,319,979 5,765,069 14.5% 783,960 888,242 845,749 $25.03
LBJ Freeway 265 22,597,412 4,760,091 5,002,276 22.1% (34,659) 0 0 $21.83
Lewisville/Denton 914 13,056,352 956,073 1,093,533 8.4% (87,630) 69,817 157,154 $22.38
Mid-Cities 2,578 40,307,595 5,271,188 5,351,672 13.3% (139,772) 448,075 752,298 $21.73
North Fort Worth 570 6,591,010 337,939 397,694 6.0% 45,818 46,320 67,003 $21.33
Northeast Ft Worth 338 5,403,275 1,924,221 1,939,206 35.9% 7,546 0 0 $19.19
Preston Center 147 5,889,257 471,433 505,502 8.6% (15,430) 4,506 179,617 $36.52
Richardson/Plano 1,371 40,752,851 6,155,829 6,249,010 15.3% (8,030) 230,489 866,960 $24.20
South Ft Worth 1,638 19,857,571 1,578,525 1,637,187 8.2% 17,573 210,649 170,594 $23.29
Southwest Dallas 798 7,263,160 535,091 537,091 7.4% 76,085 9,288 65,300 $18.47
Stemmons Freeway 284 15,173,102 3,279,010 3,348,540 22.1% 108,906 72,630 0 $16.75
Uptown/Turtle Creek 297 14,705,980 1,342,973 1,575,801 10.7% 136,852 200,000 1,315,778 $37.17
Totals 12,379 364,280,781 49,847,964 52,211,965 14.3% 2,401,965 3,708,353 11,366,335 $24.64

ABSORPTION (Previous 12 mos.)
Class A & B All Classes
Q2 2017 4,660,970 SF 2,850,402 SF
Q2 2016 3,514,064 SF 3,397,777 SF
DIRECT RENTAL RATE
Class A & B All Classes
Q2 2017 $24.65 PSF $24.64 PSF
Q2 2016 $24.07 PSF $23.76PSF
VACANCY
Class A Class B All Classes
Q2 2017 17.10% 13.8% 14.3%
Q2 2016 16.4% 14.3% 14.3%
The second quarter ended with a vacancy of 14.3%, virtually no change from the first quarter of 14.2%. Rental rates for all property classes on a full-service basis increased marginally to $24.64 up from the first quarter of $24.52. Year-to-date absorption totaled 2,401,965, on pace for another very respectable year assuming the back half of this year reflects the first half of the year.
Sublease space continues to increase moderately, as the single tenant build-to-suit activity comes to completion. Although, with just over 2,081,498 square feet (4% of total availability) of sublease space available, this segment of the market does not appear to be too concerning at this point. However, while not reported yet, we are tracking 35 + properties that will be able to accommodate 50,000 square feet or more of contiguous space which will undoubtedly impact our sublease and direct vacancy numbers over the next year. Tenant activity in the market continues strong, albeit almost half of where it was over the past two years.
Rental rates and investment values are the highest we have seen in over 30 years. Opportunities for “investment grade” assets are still prevalent, although there is a significant gap between purchaser and seller value expectations. In terms of the “value add” asset class, this class appears to be pretty well picked over and the velocity of new investment transactions is slowing. Even with new opportunities very challenging, there appears to still be an abundance of capital pursuing investment opportunities. With our pricing at its peak in over three decades, cap rates dropped in the second quarter to sub 7% for Class A product.
The DFW office market will continue to show strength through 2017. With the blocks of vacant space hitting the market over the next year, we will begin to experience some softening in the lease market. However, as we said last quarter, we have not seen the impact of the new hiring from our recent corporate relocations, and can’t help but believe as these jobs enter the market, our office growth will respond accordingly. Thus, there is a high probability that any slowdown in lease activity, will be short lived. While we are clearly at the end of the longest upward cycle we have experienced in our history, we all realize that we are coming to the close of this cycle, and the margin for error continues to decrease.
Whether leasing or investing, it is critical to be armed with accurate and current data, to make a fully informed and intelligent real estate decision as this cycle comes to a close.
Advisory Experience Advisory Experience
Maxim – 700,000 SF
The Domain, Austin, TX – 70 Acres Weaver – 58,000 SF
Knoll Trail Plaza – 120,000 SF Build-to-Suit
Weaver – 245,442 SF Multi-market Texas Instruments – 1,200,000 SF
Invensys – 45,000 SF Sublease
Texas Instruments – 70.537 Acres with a 441,362 SF Semiconductor
Flextronics – 1,500,000 SF
ESI – 70,000 SF
TECHNOLOGY LEASE
MULTIPLE LOCATIONS
DISPOSITION
ADAPTIVE REUSE OFFICE LEASE
This document has been prepared by Citadel Partners, LLC. for advertising and general information only. Citadel Partners, LL C. makes no guarantees, representations or warranties of any kind, expressed or implied,
regarding the information including, but not limited to, warranties of content, accuracy and reliability. Any interested party should undertake their own inquiries as to the accuracy of the information. Citadel Partners, LLC.
excludes unequivocally all inferred or implied terms, conditions and warranties arising out of this document and excludes all liability for loss and damages arising there from. This
publication is the copyrighted property of Citadel Partners, LLC. and/or their licensor(s). All rights reserved.
2nd QUARTER INSIGHT Dallas - Fort Worth
Scott Morse, SIOR, CCIM Managing Partner
[email protected] 972-980-2802
DELIVERED (Previous 12 mos.)
Class A & B All Classes
Q2 2017 6,518,340 SF 6,518,340 SF
Q2 2016 6,740,004 SF 6,740,004 SF