adaptive optics for high-peak-power lasers – an optical
TRANSCRIPT

5
Adaptive Optics for High-Peak-Power Lasers – An Optical Adaptive Closed-Loop Used for
High-Energy Short-Pulse Laser Facilities: Laser Wave-Front Correction
and Focal-Spot Shaping
Ji-Ping Zou1 and Benoit Wattellier2 1LULI, Ecole Polytechnique, CNRS, CEA, UPMC; Palaiseau,
2PHASICS, Ecole Polytechnique, Palaiseau,
France
1. Introduction
Since its invention in 1960, the laser has become a powerful tool not only for researches in
laboratory, but also in our everyday life. Numerous discoveries in many fields have been
led by laser developments. Tremendous progress has been achieved for high-peak-power
laser systems during the last decades thank to the use of the Chirped Pulse Amplification
(CPA) technique (Strickland & Mourou, 1985) and due to the advance in laser materials and
technologies .
Two families of high-peak-power lasers are distinguished:
laser facilities working in nanosecond (10-9 s) regime but producing pulse energy as high as 1 MJ (1MJ=106 J);
laser facilities generating ultra-short femtosecond (10-15 s), ultra-intense (~1024 W/cm2) pulses.
With lasers of the first group, such as National Ignition Facility (NIF) (Haynam et al., 2006)
and Le Laser Mégajoule (LMJ) (Cavaillier et al., 2003), research can be performed in the field
of laser induced dense and hot plasma physics, thermonuclear fusion, astrophysics in
laboratory, etc. With lasers of the second group, such as the laser facilities proposed by the
European project "Extreme Light Infrastructure" (ELI) (Korn & Antici, 2009), laser power of
200 PW will make possible to enter the ultra-relativistic regime, where protons become
relativistic. Fundamental physics can also be investigated, including particle physics,
vacuum structure, attosecond science, as well as photonuclear physics. In practice, the lasers
of the first group can be used as pump laser for the second group. Also, the combination of
nanosecond pulses together with picosecond pulses, or even femtosecond pulses, allows
exploiting new research domains and enhancing time-resolved diagnostics in dense and hot
plasma experiments.
www.intechopen.com

Topics in Adaptive Optics 96
The way for enhancing such laser system performance consists in increasing its delivered energy, reducing its pulse duration and improving its focal spot quality. In this chapter, we will discuss how focal spot quality can be improved by adaptive optics.
It is well-known that the focal spot quality directly depends on whether the laser wave front
is perfect or deformed. Laser beam wave front control is of crucial importance for both of
these two laser families. However, for large-scale high-energy laser facilities which belong to
the first family, wave front control is particularly requested. Such laser systems are
generally composed of a large number of optical components. At the end of the laser chains,
the optical components are very large (their diameter exceeds 200 mm) and a good optical
quality is hard to obtain at reasonable cost. Static aberrations may be generated by large size
optics and their misalignment. In addition, large-scale high-energy laser facilities use flash-
lamp-pumped rod and disk amplifiers for laser amplification. Once laser shots are
performed, heat is accumulated in the amplifier medium due to the very low conversion
efficiency from pump to laser energy. This heat generates a temperature rise in the materials
and then an optical index change. These thermal effects deform the wave front of the next
laser shots. However the heat is evacuated by thermal diffusion soon after the shot. Due to
the poor thermal conductivity of the used laser glass, heat evacuation takes typically more
than one hour for 200-mm-diameter class lasers. Thermally induced aberrations are the
main origin for dramatic laser wave front distortion. As a result, high-peak-power laser
systems suffer three consequences: 1) the focal spot quality degradation induces an
important decrease of the effective laser intensity on target; 2) the focal spot shape will not
be reproducible from shot to shot; so do experimental conditions on target; 3) the requested
long thermal recovery time slows down the shot repetition rate so that the laser operation
effectiveness of such facilities is limited to a few shots per day. Within the last decade we
have continuously investigated on dynamic wave front control for the LULI (Laboratoire
pour l'Utilisation des Lasers Intenses) laser facilities.
In this chapter, an overview will be given of our investigations and the wave front control
results for the LULI laser facilities: an optimized procedure of the laser wave front control
has been performed by an Adaptive Optics (AO) closed-loop combined with a semi-
automatic alignment system. This procedure enables us to obtain a shot-to-shot
reproducible focal spot on target with a near-diffraction-limited spot size. Also, the shot
repetition rate is improved by almost a factor of 2.
As an application of laser wave front control and for the study of the parametric instabilities
driven by laser-plasma interaction, we have successfully demonstrated the feasibility of the
generation of a bi-speckle far-field pattern by using the same AO system.
In Section 2, we give a complete wave front analysis based on Zernike polynomial
decomposition. Section 3 is dedicated to a description of the LULI AO system. Wave front
correction, presented in Section 4, aims at improving the deformed laser wave front to a flat
one. Its quality is characterized by the Strehl-ratio of the focal spot obtained for both low
energy pulsed beam and full-energy shots. In Section 5, the bi-speckle generation procedure
and its experimental results will be shown. The advantages and the limitations of this
method will also be analyzed. Finally, in Section 6, we will conclude and discuss on future
wave front control developments.
www.intechopen.com

Adaptive Optics for High-Peak-Power Lasers – An Optical Adaptive Closed-Loop Used for High-Energy Short-Pulse Laser Facilities… 97
2. Wave front deformation measurement and analysis
The LULI laser facilities consist of two large-scale flash-lamp pumped laser systems. The first one, ELFIE, is based on the chirped pulse amplification (CPA) technique and is an upgrade from the former existing 100TW system (Zou, 1998, 2007). This laser starts with a diode-pumped Ti:sapphire oscillator, which generates a train of 100 fs optical pulses at 1057 nm. These pulses are stretched to nanosecond duration by an Offner stretcher and pre-amplified to the milli-Joule level by a Ti:sapphire regenerative amplifier. The main amplification chains are composed of four stages of flash-lamp pumped rod and disk amplifiers. The laser media is a mix of Nd3+:Silicate and Phosphate glasses to ensure a large spectral bandwidth while optimizing the CPA gain. The beam diameter is as large as 100 mm. This system is capable of producing simultaneously twice 30 J/300 fs pulses, resulting in a peak power as high as 2x100 TW.
The second laser facility, LULI2000 as illustrated in Figure 1, uses large aperture rod and disk amplifiers for kilojoule/nanosecond pulse amplification at 1053 nm (Sauteret, 2000). Its amplification section is composed of two independent optical chains with flash-lamp pumped Nd3+:phosphate glass amplifiers. Each is composed of four sequential amplification stages with different aperture diameters: 50, 94, 150, and 208 mm respectively. Chirped pulse amplification in this system allows to perform plasma experiments by combining the nanosecond pulses with high-energy sub-picosecond ones.
On the amplification chains of the both LULI laser facilities, rod amplifiers are cooled by continuous water circulation. Air and nitrogen gas flows are used to cool down disk amplifiers after each laser shot.
Fig. 1. LULI2000 laser facility: top: amplification chains; button left: command control room; button right: one of the interaction chambers "MILKA".
www.intechopen.com

Topics in Adaptive Optics 98
2.1 Laser beam wave front and far-field patterns
2.1.1 Aberrations and Zernike polynomials
One common way to represent the measured wave front is to use the Zernike polynomial base (Noll et al., 1976). This is a set of polynomials which are orthogonal within the unit disk. Examples of such polynomials are given in Fig. 2.
Fig. 2. Examples of Zernike polynomials(top raw) and their corresponding far-field pattern (bottom raw). From left to right, you see defocus, 2 astigmatisms, 2 comas and spherical aberration.
If the orthonormal set of Zernike is used, the Zernike representation leads quickly to the wave front RMS, by the formula:
2 2
,mn
m n
Z (1)
2.1.2 Far-field patte rns characterization
What interests mostly the laser physicist is to estimate the intensity where the beam is focused: the highest the intensity, the strongest the interaction of light with matter. In this section, we will present observables that characterize a far-field pattern.
The simplest observables are scalar values. However they lack information and are often only indicative.
Peak intensity (W/cm²): the maximum laser intensity. This is compared to intensity levels for matter phase changes. Its absolute value is very hard to measure because it is hard to measure how much energy is really in the focus. Indirect measurements are possible, such as evaluating the plasma ionization state, which is related to the peak intensity in the laser that generated the plasma.
FWHM (Full Width at Half Maximum) (µm): this is the diameter of the focal spot where the intensity is half the peak intensity. This FWHM is usually compared to the FWHM of a diffraction limited spot.
Focal spot contrast: this is the ratio between the absolute peak intensity and the intensity of the first ring.
M²: this is the ratio between the focal spot 2nd moment and the 2nd moment of the focal spot of a perfect Gaussian beam. This is the most thorough scalar observable, since it is a propagation invariant.
www.intechopen.com

Adaptive Optics for High-Peak-Power Lasers – An Optical Adaptive Closed-Loop Used for High-Energy Short-Pulse Laser Facilities… 99
Strehl ratio: this is the ratio between the beam peak intensity and the peak intensity of a beam with the same near field intensity profile but with a flat wave front. Strehl ratio is often used to quantify how much intensity is lost due to the aberrations in the beam.
Beside these scalar values, the focal spot shape can be described using a radial averaging or the encircled energy. This is also called “Energy in the bucket”. This represents for a given distance from the focal spot centroid the fraction of the total energy which lies within this distance.
0
0
,
,
r
e
I x y dxdyE r
I x y dxdy∬∬
(2)
An example of an encircled energy function is illustrated in Fig. 3 for the Airy pattern (focal spot corresponding to a diffraction limited top hat circular beam).
0,0 0,5 1,0 1,5 2,0 2,5 3,00
20
40
60
80
100
En
circ
led e
ner
gy (
%)
Radial coordinate normalized to the first black ring
0,7 1,0 1,5 2,0 2,5 3,080
85
90
95
100
3rd zero
2nd zero
1st zero
Fig. 3. Encircled energy graph for an Airy pattern. Horizontal tangents correspond to the zeroes of the Airy pattern.
Encircled energy quantifies the concentration of light energy in the focal spot. Nowadays most of the commercial high power lasers are specified using encircled energy. The points where the encircled energy derivative vanishes correspond to local extrema in the intensity pattern. From the above graph, we can deduce that the energy contained in the first Airy disk represents 83.7% of the total energy. Moreover it remains more than 5% of the energy after the third ring.
Directly measuring the encircled energy is very tricky since at the focal spot edge part the intensity goes very close to the noise level of a sensor.
www.intechopen.com

Topics in Adaptive Optics 100
2.1.3 Far-field pattern simulation from wave front measurement
The focal spot is difficult to measure and characterize directly. This is because low noise cameras are required to do so and relay optics that alter the focal spot shape are necessary to increase the focal spot size, so that it fits the CCD sensor aperture.
In the frame of the Fraunhofer approximation, the intensity in the focal plane is equal to the Fourier transform of the electric field in the near-field, or in the wave front measurement plane. Since a wave front sensor gives the intensity and the phase of the beam, the far-field pattern is easily deduced from a wave front measurement by a simple FFT (Fast Fourier Transform) algorithm. Wave front measurement is then an alternative to focal spot imaging.
2.2 Wave front sensors
2.2.1 Wave front sensors for laser beam characterization
There are several techniques to characterize the wave front of laser beams. Among the most widely used, we can cite:
Shack-Hartmann: this is based on the displacement of focal spots of a microlens array, due to the phase gradients.
Propagation-based or curvature sensor: this is based on the fact that phase information is transferred to intensity information during the propagation. Using an iterative algorithm, the wave front is recovered from at least 3 intensity measurements.
Quadri-Wave Lateral Shearing Interferometry: the phase gradients are recovered from the deformation of an interferogram generated by a diffraction grating.
These three kinds of instruments form the family of the so-called wave front sensors (WFS).
2.2.2 Quadri-Wave Lateral Shearing Interferometer
Lateral shearing interferometry is a well-known technique to measure the phase gradients in one direction. The incident wave front is replicated into two identical but tilted wave fronts. After propagation, their mutual interference pattern is recorded with a CCD camera. The phase gradients are recovered from the fringe deformation, by means of a Fourier deconvolution around the interferogram fringe frequency. However, at this point, it lacks some gradient information to recover a full two dimensional phase-field. Multiwave interferometry (Primot & Sogno, 1995) extends this principle to more than one gradient direction. In the case of QWLSI, four replicas are created by a specific 2D diffraction grating. In this case, two gradients along two perpendicular directions are measured and then integrated to determine the field intensity and phase (Primot & Guérineau, 2000).
The interferogram deformation can be interpreted using either the wave or geometrical optics. Wave optics is more rigorous and underlies the interferogram numerical processing.
Geometrical optics is more intuitive to understand physical effects, such as the influence of spatial coherence on interferogram contrast.
2.2.2.1 Interferogram formation (Bon et al., 2009)
The incident light field complex amplitude is given in the frame of the slowly varying envelope by:
www.intechopen.com

Adaptive Optics for High-Peak-Power Lasers – An Optical Adaptive Closed-Loop Used for High-Energy Short-Pulse Laser Facilities… 101
( ) ( ) exp( [ ( )])A I i r r k r - r (3)
where r is the position vector, k the mean wave vector, I the field intensity, and the field phase. The wave front sensor measures the field phase.
The beam to be characterized enters the interferometer and is replicated by a diffraction grating. In the case of our QWLS Interferometer, the so-called Modified Hartmann Mask (MHM) is used (Primot & Guérineau, 2000). It is made of the superposition of a Hartmann
mask (amplitude grating of period p) and a -shift checker board (phase grating of period 2p) as presented in Fig. 4. This has been optimized to diffract more than 90% of the light energy into the 4 first orders carried by 4 wave vectors (see Fig. 4).
Fig. 4. (a) Ideal transparency for a 4-wave-only 2D diffraction grating. (b) MHM transparency, approximation of (a). (c) Intensity transmission of (a). (d) 1D interferogram formation by a MHM in the case of a disturbed input wave front; geometrical approach. (e) 2D interferogram formation by a MHM in the case of a plane input wave front; visualization of the 4 diffracted waves (arrows).
Each diffracted order propagates along its own wave vector direction. After a propagation
length z along the z-axis, in the scope of paraxial propagation and if we neglect free space
diffraction, the electromagnetic field is the coherent addition of all the replicas, which are
mutually displaced due to their deviation. It has already been shown, in a somewhat
different form, that the intensity is given by:
www.intechopen.com

Topics in Adaptive Optics 102
0
2 2 2 2( , ) 1 cos cos
1 2 2 2 2cos ( ) cos ( )
2 ( ) ( )
OPD OPDI z I x z y z
p p x p p y
OPD OPDx y z x y z
p p x y p p x y
r
(4)
where I0 is the interferogram maximum of intensity in z = 0.
The interferometer sensitivity is determined by the ratio p=z. This means that the interferometer sensitivity is easily tunable by moving the grating back or forth in front of the CCD sensor.
2.2.2.2 Interferogram analysis
The interferogram is interpreted as a non-uniform OPD (Optical Path Difference) function, frequency-modulating a perfect sinusoidal pattern. The OPD gradients are then recovered by demodulating the recorded interferogram around its specific carrier frequencies. The result is two gradient fields, which are then integrated:
2x
y
OPDH x
zOPDH p
y
(5)
Because the phase information is coded in the interferogram by a frequency modulation, the phase and the intensity are independently determined. The intensity image is recovered by applying a low-pass filter on the interferogram.
From Equation(5), both the interferogram period and the modulation due to the OPD are wavelength independent. Under the hypothesis of a wavelength independent beam OPD, the measured OPD with the wave front sensor is the same using either a monochromatic source or a polychromatic one. This makes this technique best suited for short pulses characterization where the spectral bandwidth can be as large as 100 nm.
2.3 Wave front deformation measurement and analysis
A flash-lamp pumped high-peak-power laser is a complex system. It is characterized not only by the use of a large number of large-scale optical and laser elements, set up in a chain extended on an important length, but also by a long thermal recovery cycle between two laser shots. Most of the broadband pumping energy from flash-lamps is actually not transferred to the laser pulses: it is dissipated as heat in the amplifiers host. The consequent temperature rise deforms the amplifying materials, even though the cooling system for each amplifier runs during or immediately after the shot. As a result, thermally induced aberrations appear and considerably evolve.
We measure and analyze laser wave front distortions in three different situations:
1. When the chain is "cold" (the laser had not been shot yet), we investigate the static aberrations induced from the imperfection in optics and its misalignment.
2. After a single full-energy shot and during several hours, we carry out the measurement of the thermal-effect-induced wave front distortions. It leads us to study the nature, the
www.intechopen.com

Adaptive Optics for High-Peak-Power Lasers – An Optical Adaptive Closed-Loop Used for High-Energy Short-Pulse Laser Facilities… 103
magnitude and the temporal evolution of the main thermal aberrations in our laser systems.
3. The wave front distortions measured during a shot sequence help us to understand how the cumulative thermal effect degrades further the beam wave front and hence the focal spot quality on target.
2.3.1 Wave front sensor implementation on LULI laser beams
The wave front sensors used for the LULI laser facilities are based on quadri-wave lateral
shearing interferometry. This technique is commercialized by Phasics under the name SID4®.
To evaluate the wave front distortions in the LULI laser systems, we implemented a wave
front sensor SID4 at the end of each amplification chain. In parallel, a far-field device
composed of an afocal system and a 12-bit CCD camera was set up to measure the
corresponding focal spot.
2.3.2 Static aberrations
The static aberrations can be characterized when the chain is "cold", i.e. the chain is not subject to any pump generated thermal effect before the first shot of the day. According to their origin, we can distinguish the static aberrations in two categories.
The first category is determined by optical quality of each element, therefore its amount remains constant for laser everyday operation. For instance, the LULI2000 amplification chain is built up of more than 100 optical components. Before implementation, optical quality of each element was tested separately by a ZYGO interferometer to check if its optical quality is as good as given by the specifications. For each, the measured transmitted or reflected wave front deformation (depending on if it is a transmissive or reflective optical component) is found to be less than or equal to λ/4 peak-to-valley (PtV) and about 0.025 λ rms at λ0= 1053 nm.
The second category is generated by laser axis misalignment. Its amount may change from laser day-to-day operation. The chain is "misaligned" when the beam axis does not perfectly coincide with the well-defined axes of the optical components. For both of the LULI laser facilities, laser beam alignment consists of centering the laser beam on alignment targets (crosshairs) for each amplification stage. The accuracy is typically 2% of the corresponding beam diameter. In parallel, beam pointing of each section is controlled by a far-field camera. Depending on pupil conjugations, the accuracy is different along the chain. The final beam pointing accuracy should be determined by the focal spot size and its alignment tolerance on target in the center of the interaction chamber. It is about 3 µrad in the case of LULI2000. When beam misalignment occurs, tilt-induced coma is increased. Normally coma remains negligible in our chain, because the laser beam axis should coincide with the axes of optical components, especially the lenses used for spatial filters. The amplitude of the coma, measured when the chain is "cold", can indicate us whether laser alignment is accurate or not.
At the end of the aligned chain the total measured wave front deformation (given in PtV) resulting from the cumulated wave front distortion of categories 1 and 2, is approximately 0.5 λ and the total rms value is 8 to 10 times smaller. It can be decomposed in low order Zernike aberrations with a similar amplitude among them. The corresponding Strehl ratio Rs is typically about 0.9.
www.intechopen.com

Topics in Adaptive Optics 104
2.3.3 Wave front deformation evolution after a full-energy shot
As we have shown in the former paragraph, Xe-flash-lamps have a broad spectrum extended from UV to IR (Brown, 1981), whereas the absorption line of Nd3+ for laser transition is very narrow. The thermal load originates therefore from the flash-lamp light absorbed within the Nd:glass, the cladding at the laser glass boundary and the mechanical mounts. This induces local dilatation and mechanical stress in the glass. Therefore effects like thermal lens, birefringence, etc. occur. Investigations have been done in order to measure and compensate these effects (Jasbir et al. 1986; Gopi et al. 1990; Liu e al. 2010; Kuzmin et al. 2011). The wave front aberrations induced by thermal gradients can be distinguished in two classes: the so-called pump-shot aberrations, appearing instantaneously during a shot, and the aberrations induced by thermal relaxation during the following hours. In this section we are focusing on the second class.
After a full-energy shot, a low-energy 10 Hz probe beam is immediately injected into the chain and propagates through all the chain towards the wave front sensor. Fig. 5 illustrates the typical temporal evolution of the wave front deformation at the LULI laser facilities. Wave front measurement has been performed once every two minutes during all the thermal recovery time: 40 minutes for ELFIE (Fig. 5.a) and more than 3 hours for LULI2000 (Fig. 5.b). Composed of larger optics and producing higher amplification gain, LULI2000 suffers more significantly from wave front deterioration than ELFIE. Three zones are clearly distinguished from the wave front deformation curve measured at LULI2000: 1) the rapid increases of the distortion during about 10 minutes; 2) the decrease during 50 minutes owing to the cooling performed by water, air and nitrogen flows; 3) the phase of slow evolution from one hour to more than 3 hours after the shot.
Time (minute)
0 5 1 0 1 5 2 0 2 5 3 0 3 5 4 00 , 1
0 , 2
0 , 3
0 , 4
0 , 5
Ptp
(=1
,05
7 m
)
T i m e (m in )
Time (minute)
0 10 20 30 40
0.5
0.4
0.3
0.2
0.1
0Wavefrontdistortion
(PtV, in unit of ?, ?= 1.053µm)
0
0,5
1
1,5
2
2,5
0 50 100 150 200
1 2 3
(a) (b)
Fig. 5. Temporal evolution of the wave front distortion measured after a full-energy shot at the end of (a) ELFIE and (b) LULI2000.
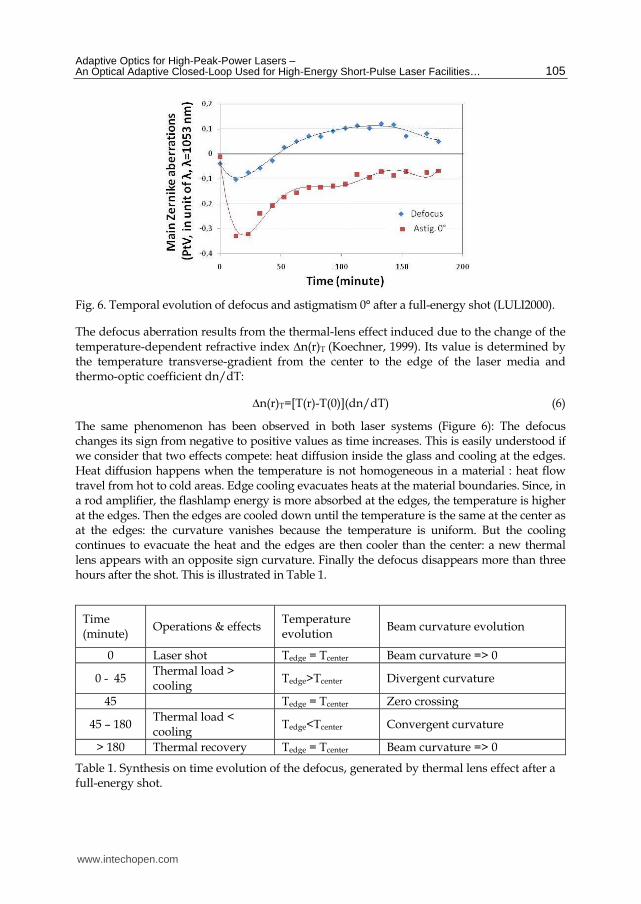
At the LULI laser facilities, the main thermal aberrations induced by a full-energy shot are defocus and astigmatism 0°. Fig. 6 presents their temporal evolution during the recovery time, decomposed from Fig. 5.b in the case of LULI2000.
Wav
efro
nt
dis
tort
ion
(PtV
, in
un
it o
f λ,
λ=
1.05
3 µ
m)
www.intechopen.com
Adaptive Optics for High-Peak-Power Lasers – An Optical Adaptive Closed-Loop Used for High-Energy Short-Pulse Laser Facilities… 105
Fig. 6. Temporal evolution of defocus and astigmatism 0° after a full-energy shot (LULI2000).
The defocus aberration results from the thermal-lens effect induced due to the change of the temperature-dependent refractive index ∆n(r)T (Koechner, 1999). Its value is determined by the temperature transverse-gradient from the center to the edge of the laser media and thermo-optic coefficient dn/dT:
∆n(r)T=[T(r)-T(0)](dn/dT) (6)
The same phenomenon has been observed in both laser systems (Figure 6): The defocus changes its sign from negative to positive values as time increases. This is easily understood if we consider that two effects compete: heat diffusion inside the glass and cooling at the edges. Heat diffusion happens when the temperature is not homogeneous in a material : heat flow travel from hot to cold areas. Edge cooling evacuates heats at the material boundaries. Since, in a rod amplifier, the flashlamp energy is more absorbed at the edges, the temperature is higher at the edges. Then the edges are cooled down until the temperature is the same at the center as at the edges: the curvature vanishes because the temperature is uniform. But the cooling continues to evacuate the heat and the edges are then cooler than the center: a new thermal lens appears with an opposite sign curvature. Finally the defocus disappears more than three hours after the shot. This is illustrated in Table 1.
Time (minute)
Operations & effects Temperature evolution
Beam curvature evolution
0 Laser shot Tedge = Tcenter Beam curvature => 0
0 - 45 Thermal load > cooling
Tedge>Tcenter Divergent curvature
45 Tedge = Tcenter Zero crossing
45 – 180 Thermal load < cooling
Tedge<Tcenter Convergent curvature
> 180 Thermal recovery Tedge = Tcenter Beam curvature => 0
Table 1. Synthesis on time evolution of the defocus, generated by thermal lens effect after a full-energy shot.
www.intechopen.com

Topics in Adaptive Optics 106
As for astigmatism, it can be produced in rod amplifiers by thermal-stress-induced birefringence. However, a strong astigmatism is observed and is identified mainly in our disk amplifier stages. The disks in a disk-amplifier have oval shape and their longer side is set up under Brewster's angle with respect to the beam propagation direction. The astigmatism can be generated under 2 situations: a) a spherical wave front, induced by thermal lens effect in the former amplification stages, propagates in the disks set up at Brewster's angle; b) thermal gradient is more important along the shorter side of the gain medium compared to the longer one, considering the flash-lamp geometry in the disk amplifiers. The second situation is dominant in our case and leads to a thermal cylindrical lens. In LULI2000, to generate a vertical rectilinear polarization (90°) at the end of the chain, the last disk amplifier is oriented with the shorter side of its disks in horizontal direction (0°). As a result, the wave front sensor inspects an important astigmatism 0° and its maximum value is measured 20 minutes after the shot.
2.3.4 Wave front deformation induced from cumulated thermal effect
The time lapse between two successive shots should be well matched with the thermal recovery time. This is necessary for the complete heat dissipation in all amplifiers of the chain. If the next shot takes place before the system is completely thermalized, cumulative thermal effects further degrade the laser wave front. Before the AO system was used, laser shot repetition rate of our chains resulted from a compromised value. For this, we defined the shot cycle by taking into account the facility use effectiveness and the focal spot quality on target. The shot repetition rate is one shot every 20 minutes for ELFIE and one shot every 2 hours for LULI2000. In this case, the complete recovery time is longer than the time delay between two shots for both of these two systems (Fig. 5a and Fig. 5b). Therefore, cumulative thermal effects appear when the laser chains operates in the desired shot sequence.
Fig. 7 presents the temporal evolution of the wave front distortion measured at LULI2000 during a shot sequence of 6 kJ-shots. The repetition rate of this shot sequence is one shot every hour. Two important features can be observed: 1) A complete thermalization after a full-energy shot is characterized by three distinguished phases: a rapid increase, a rapid decrease and a slow evolution of the plateau. However, for a "kJ" shot sequence with one-hour delay between shots, the next shot takes place before the end of the second phase. As a consequence, cumulative thermal effects impact the wave front deformation amplitude more and more important. 2) If we are only interested in the wave front deformation amplitude measured immediately before the shot (see Fig. 7, and Fig. 8 solid marks), we can find the wave front deformation amplitude increases according to an logarithmic tendency.
To characterize the influence of the shot repetition rate on the wave front quality, we compare the wave front distortions induced during a sequence of five high-energy shots with two different shot cycles: for ELFIE, in 20 and 40 minutes cycles; and for LULI2000, in one and two-hour cycles. Immediately before a next shot, the wave front and the associated far-field pattern were systematically recorded. The black curve in Fig. 8 illustrates the measured wave front distortion with one-hour recovery time in the case of LULI2000. We see that the wave front error increases considerably, resulting from accumulated heat during the shot sequence, and that a distortion of more than 3λ is measured at the fifth shot. The wave front degradation is still visible under the cumulated thermal effect even though the shot cycle is one shot every two hours (red curve in Fig. 8). Once decomposed on the set of
www.intechopen.com

Adaptive Optics for High-Peak-Power Lasers – An Optical Adaptive Closed-Loop Used for High-Energy Short-Pulse Laser Facilities… 107
Zernike polynomials, we note that under the cumulative thermal effect, the main wave front deformations are always defocus and astigmatism 0° and their amplitude increases continuously along the shot sequence.
Wavefront distortion
(PtV, in unit of ?)
1st shot
2nd shot
3th shot
4th shot
5th shot 6th shot
Time (minute )
0
1
2
3
4
5
0 50 100 150 200 250 300 350 400
Fig. 7. Wave front distortion temporal evolution measured with a probe beam during a sequence of 6 shots with one shot every hour in LULI2000.
Time (minute)
Wavefront distortion
(PtV, in unit of ?)
0 100 200 300 400 5000 100 200 300 400 500
0.0
1.0
2.0
3.0
4.0
a
b
Fig. 8. Cumulated thermal effect comparison: the wave front deformation measured before each kJ shot of LULI2000 during 2 shot sequences: one-hour delay between shots (black curve); two-hour delay between shots (red curve).
Fig. 9 illustrates the corresponding focal spot degradation for a shot sequence of one hour cycle at LULI2000. The initial near-diffraction-limited single spot is enlarged and transformed in a dissymmetrical pattern surrounded by several side lobes. The effective laser intensity decreases dramatically, characterized by a deduced Strehl ratio about 0.2 at the end of the shot sequence.
Wav
efro
nt
dis
tort
ion
(PtV
, in
un
it o
f λ)
Wav
efro
nt
dis
tort
ion
(PtV
, in
un
it o
f λ)
www.intechopen.com

Topics in Adaptive Optics 108
1st 2nd 3rd 4th 5thShot N°
Focal
spots
Fig. 9. Focal spots degradation under the cumulated thermal effects, measured immediately before each shot for a shot sequence of one-hour cycle.
3. Adaptive Optics (AO) systems for the LULI laser facilities
We have previously identified that thermal aberrations are the principal source of the wave front deterioration for the LULI laser facilities. To compensate these wave front errors and thus improve the laser focusability on target, the use of an adequate adaptive optics (AO) system is indispensable. In the following paragraph we describe at first the AO system we designed and implemented into the LULI laser systems, then we present the optimized wave front control procedure and finally we show how the AO system performance can be improved with a suitable high-order-mode filtering.
3.1 LULI Adaptive Optics closed-loop
The LULI AO system is composed of three key elements : a wave front sensor, a wave front corrector and a convergence loop. All these should be well studied to enable a rapid and efficient wave front error compensation. The corrector we use is a bimorph deformable mirror (DM) with 32 actuators distributed on three rings (Kudryashov, 1996). It has a large aperture (diameter of 100 mm) and a high damage threshold guaranteed by its multi-dielectric coating. The applied voltages on the actuators range from -300 to +300 V, corresponding to a dynamics for wave front correction of more than 6λ.
The results of AO wave front control for 100TW/ELFIE are described by the referred article (Wattellier et al. 2004). In this paragraph, only the AO system in LULI2000 is described. The DM was placed between the second and the third amplification stages and was associated with the SID-4 wave front sensor located at the chain output, as shown in Fig. 10. The measurement plane and the correction plane have to be optically conjugated to each other in order to have a linear response between them. The correction loop was applied using a low energy 10 Hz pulsed beam (λ =1053 nm).
To calibrate the mirror, we measure the wave front deformation induced by the DM actuators. Thirty-two phase-map influence functions are therefore obtained by applying a voltage of 150 V to each of them one after another. These 32 wave front maps are the columns of a matrix that links the voltage to the phase maps (Dalimier & Dainty, 2005). By inverting this matrix, we can deduce the voltages to apply in order to generate any phase map.
For each loop iteration, the wave front error is calculated as the difference between the measured aberrated wave front and the reference defined in our case as a flat spatial phase. The adjusted voltage is thus determined and applied for each actuator to minimize this error. In parallel, a far-field measurement characterizes the wave front quality improvement
www.intechopen.com

Adaptive Optics for High-Peak-Power Lasers – An Optical Adaptive Closed-Loop Used for High-Energy Short-Pulse Laser Facilities… 109
performed by the loop: during several seconds/iterations, the degraded focal spot is transformed to a single spot close to a diffraction-limited Airy pattern. A similar focal spot can also be computed using the measured laser intensity distribution and the phase.
100 mm
DM
Wavefront sensor SID‐4Far‐field measurement
RA50
RA50
RA50
DA94
DA94FR94SF150
FR150
DA150
SF208
DA208DA208 FR208SF kJ
Fig. 10. A 100 mm diameter bimorph DM, implemented at the output of the second amplification stage of LULI2000, is related to a wave front sensor (SID-4) and a far-field measurement module placed at the chain output. RA, rod amplifier; DA, disk amplifier; FR, Faraday rotator; SF, spatial filter.
3.2 Optimized wave front control
We have shown before that the laser misalignment may generate coma. Nevertheless, coma can also be induced by thermal tilt. For the LULI laser facilities, we deal differently with the aberrations due to the thermal tilt and all the remaining thermally induced aberrations. An optimized procedure for our wave front control system has been elaborated and characterized by a precise beam realignment between two successive shots and an AO closed-loop operation. Its main features are as follows. (1) We perform a beam alignment before the first shot, so that the wave front errors, corresponding to the second category of the static aberrations, are reduced to a minimum. The AO system is also activated at this stage. This way, the residual wave front error of the static aberrations is reduced from 0.5λ to 0.2λ PtV. (2) To correct the aberrations induced by thermal tilt, which appear between two successive shots, beam pointing and centering are checked and readjusted systematically with the semi-automatic alignment system. This way, thermally induced tilt and coma are minimized. Also, such an alignment allows a very accurate beam centering and pointing on the DM so that its response matrix is always the same from shot to shot. (3) The correction of the remaining thermal aberrations is made by the AO system.
For an optimized closed-loop performance, a fitted higher-order-mode filtering after a calibration procedure is necessary to define the closed-loop configuration. To understand its importance, we carried out the measurement of the residual rms phase distortion with respect to the mode number of the DM used for correction. As shown in Figure 11a, as the mode number increases, the residual phase distortion decreases continuously from more than 0.2 rad until its minimum value of 0.03 rad with 24 modes. With different mode filtering in the loop
www.intechopen.com

Topics in Adaptive Optics 110
configuration, we compare the residual phase maps and their corresponding focal spot patterns. It is obvious that an adequate higher-order mode filtering (8 modes filtered in our case) enables an excellent wave front correction and so the focal spot quality improvement (Fig. 11a and Fig. 11b). If the mode filtering is too important (e.g. 22 modes filtered, 10 modes kept) or not enough (e.g. only 2 modes filtered, 30 modes kept), the wave front correction is not complete; it results in a degraded peak intensity in the focal spot with side-lobes. In the 24-mode loop configuration, the maximum applied voltages are approximately 50 V. However, the voltages applied to the outer ring actuators are much higher and with strong oscillation when higher-order modes are activated. In fact, the higher-order modes have small eigenvalues, so the loop is more sensitive to noise perturbation and is difficult to converge. An adequate higher-order mode filtering for our AO system ensures, two at a time, high correction dynamics and a more stable loop convergence.
Number of modes used for correction
Residualrmsphase error(rad)
0
0.08
0.16
0.24
0 5 10 15 20 25 30
Intensity(a.u)
Pixel of CCD camera
24 mods
30 mods
10 mods
(a) (b)
Fig. 11. Residual rms phase error vs the mode number used for the correction loop. The residual phase maps(a) and the focal spot profiles(b) corresponding to 10, 24 and 30-mode loop configurations.
4. Wave front correction results
The dynamic wave front correction at the LULI laser facilities is performed only after the fast-evolution phase: 20 minutes after the shot for ELFIE and one hour after the shot for LULI2000. The wave front correction results presented in this paragraph have been obtained from LULI2000 facility during a shot sequence of 5 full-energy shots (one shot per hour). Before each shot, we first measure phase distortions and the corresponding focal spots. We perform a semi-automatic alignment to correct the residual thermal tilt before starting the convergence loop with the help of a low energy pulsed-probe beam.
Fig. 12 shows the residual phase measured before the 5th kJ-shot. The phase distortion, composed of essentially defocus and astigmatism 0°, is reduced significantly after using AO closed-loop: from more than 3λ to about 0.3 λ (PtV). In the meantime, a far-field device measures the associated focal spot evolution: the focal spot, strongly degraded by the cumulative thermal effects is restored after the loop convergence. A nearly Airy-disk like focal spot is obtained with a deduced Strehl ratio greater than 0.9. The AO loop is locked when we fire the next shot.
Res
idu
al r
ms
ph
ase
erro
r (r
ad)
Inte
nsi
ty a
.u
www.intechopen.com

Adaptive Optics for High-Peak-Power Lasers – An Optical Adaptive Closed-Loop Used for High-Energy Short-Pulse Laser Facilities… 111
Focal spot
Phase distortion
Before loop After loop
Fig. 12. Phase distortions and their corresponding focal spots measured before and after the loop performed with a 10 Hz pulsed laser for the 5th kJ shot of the shot sequence (one-hour delay between shots).
The focal-spot quality illustrated by Fig. 13 is evaluated during the 5th shot with AO wave front control. Compared with the case without wave front correction, the encircled energy of the focal spot has been considerably improved and is similar to that of the corresponding Airy spot. The Strehl ratio deduced from the measured focal spot is increased from 0.2 (without loop, Figure 10a) to more than 0.7. The difference of the Strehl ratio between 0.9 (probe beam) and 0.7 (kJ beam) comes essentially from the pump-shot induced aberrations.
(a)
Without loop With loop
0
2000
1000
3000
4000
0
2000
1000
3000
4000
0
200
400
0
200
400
µmµm
Intensity(a.u.)
Intensity(a.u.)
µmµm
Strehl ratio ~0.7
Spot radius (µm)
0 40 80 120 160 2000
1
0.8
0.6
0.4
0.2
Encircledenergy
(b)
Airy spot
Corrected spot
Fig. 13. (a) Focal-spot patterns measured during the fifth kilojoule shot, without and with the optimized AO wave front control. (b) Deduced Strehl ratio and encircled energy of the focal spot with loop convergence.
5. Application to focal-spot shaping: Bi-speckle generation
High-peak-power, short-pulse lasers are well suited for the study of the parametric instabilities driven by laser-plasma interaction, because these instabilities have a fast growth rate in the sub-picosecond range (Rousseaux, 2009). Using an AO closed-loop on one of the LULI facilities, previous experiments have provided measurements to study the parametric instability saturation generated by a mono-speckle in small size plasmas. Another interesting topic consists of investigating the interplay of the instability evolution generated by two hot spots on target.
It is well known that two symmetrical spots can be generated in focal plan if a linear phase bs with 2 opposite slopes in one direction is added to the spatial phase of a laser beam. The amplitude of the laser beam becomes:
www.intechopen.com

Topics in Adaptive Optics 112
)(exp)(exp y)E(x, 22
bsn iyx
(7)
with bs xk x and 2 2
D Dx (D : beam aperture). The two spots are separated by a
distance of 2a (Fig. 14), determined as following:
D
fNfka x
422 (8)
with N: integer number; f: focal distance. In the case of the LULI laser facility, an off-axis parabola with f = 75 cm is used.
Fig. 14. Double focal spots generation by use of an additional linear phase with two opposite slopes.
Several conventional methods exist for bi-speckles generation. For example, an accurately tilted mirror in bi-sections, a well-designed phase plate or a bi-prism, placed just before the focusing system, can produce double focal spots on target. Nevertheless, we choose the programmable AO closed-loop already integrated in our chain to produce them.
It is important to make sure that all laser spatial features are well studied when the bi-speckles are generated in the interaction chamber centre. In fact, the DM is set up in the middle of the chain, the introduced spatial phase for the bi-speckles generation may induce the modulations on the laser energy profile when laser beam propagates from DM towards the interaction chamber. We performed beam near-field and far-field investigations to determine the maximum phase amplitude for the bi-speckles generation while the beam energy-distribution remains correct.
We have previously computed a 64x64 pixel phase map in a conventional space xyz. This phase has two opposite linear slopes in the plane of x0z and with their interception on x=0. The phase amplitude in z is defined as the phase difference between x=0 and x=D/2. Nevertheless, the phase value should be kept constant in the direction of y. This phase map is then used as the phase target for our AO closed-loop.
The distance between the two focal spots is linear with respect to the additional phase amplitude. When the phase amplitude increases from 0 to 2.5 λ, the bi-speckles are separated from 0 to 100 µm if the focusing distance is 75 cm. The maximum phase amplitude is determined to ≤ 2.5 λ to get rid to the degradation of the laser near-field pattern while the beam continues to propagate in the chain. Fig. 15 illustrates the intensity and the phase measured after the closed-loop convergence with a phase amplitude of 2 λ.
www.intechopen.com

Adaptive Optics for High-Peak-Power Lasers – An Optical Adaptive Closed-Loop Used for High-Energy Short-Pulse Laser Facilities… 113
Fig. 15. Laser intensity distribution and spatial phase with a phase amplitude of 2λ between the center and the edge, measured by the SID4 after the AO closed-loop convergence.
Fig. 16a presents the simulated far-field result using a super-Gaussian beam profile and different phase maps: 1) the computed phase target with a linear profile; 2) the measured phase after the AO loop. We note that using the measured phase, an important amount of parasitic light appears around the two main focal spots. It results from a phase profile curved in x=0 instead of a linear one. Generally, for producing a phase close to the phase target, a large number of actuators in the deformable mirror is necessary and also the actuator distribution should be matched with the phase target. In our deformable mirror, the actuator number is quite limited. In addition, they are placed in rings and are not suitable to generate the phase with linear structure. To remove the parasitic light on target, a mask is placed just before the beam focusing system. This way, two spots separated to 85µm (Fig. 16b) have been obtained experimentally for the study of the parametric instabilities.
Spatial profile of laser beam
Parabola
f =75 cm
measured phase after AO loop without mask with mask
simulated focal spots
with phase target
with measured phase
+
computed phase target
(b)
(a)
(b)
Fig. 16. (a) Focal spot simulation using (top) the computed phase target with a linear profile and (button) the measured phase after the AO loop. (b) Bi-speckles measured in the interaction chamber centre and realized with a phase amplitude of ~2λ.
www.intechopen.com

Topics in Adaptive Optics 114
Bi-speckles generation by use of a programmable AO closed-loop enables us to control easily the energy contained in each of the two focal spots. By moving the phase curve in the direction of x, it could correct energy non-equilibrium between two spots induced by a near-field distribution defect. Also, it may change the ratio of the energy contained inside each of these two focal spots according to plasma experiment request. However, to minimize the parasitic light around the two focal spots, a corrector with more suitable geometry and much more actuators would be requested.
6. Conclusions and perspectives
We have demonstrated efficient wave front control and important focal spot quality improvement by the use of an AO setup on the LULI laser facilities. Following an optimized operation procedure, we perform the dynamic wave front control associated with an elaborate alignment system. It enables an effective correction of all static and thermal lower-order aberrations generated in the amplification chains. The shot-to-shot reproducibility of the focal spot on target has been obtained with a quality close to the diffraction limit. Also, the shot repetition rate of the LULI laser facilities was increased. For instance, with an AO wave front control, the LULI2000 shot cycle can speed up by a factor of 2. Laser intensity on target is significantly increased for laser-induced high-field physics research.
In the scope of Inertial Confinement Fusion and study of the laser parametric instabilities, we have proposed and validated the bi-speckles generation procedure using the same AO closed-loop as for the wave front control of the laser chain. With an adequate AO system design, it will be feasible to realize more complicated high-quality focal spot shaping.
In addition to the present work, further investigations include the study and compensation of pump-shot induced aberrations, the analysis and correction of the wave front distortion generated by the pulse compressor using large-scale optics and gratings. Additional investigations aim at improving the existing AO system with a more dynamic corrector and its more suitable location in our chains. All these points are key factors to improve the beam quality of the whole laser chain and so the laser intensity on target for laser-induced plasma physics research.
7. References
Bon, P.; Maucort, G.; Wattellier, B. & Monneret, S. (2009). Quadri-wave lateral shearing interferometry for quantitative phase microscopy of living cells, Opt. Express Vol. 17, 13080-13094
Brown, D. C. (1981). High-Peak-Power Nd:Glass Laser Systems, Springer-Verlag Cavaillier, C.; Camarcat, N.; Kovacs, F. & André, M. (2003). Status of the LMJ Program,
Proceedings of the Third International Conference on Inertial Fusion Sciences, American Nuclear Society, pp. 523–528.
Dalimier, E. & Dainty, C. (2005). Comparative analysis of deformable mirrors for ocular adaptive optics, Opt. Express,Vol. 13, 4275–4285
Gopi, N.; Nathan, T. P. S. & Sinha, B. K. (1990). Experimental studies of transient, thermal depolarization in a Nd:glass laser rod, Appl. Opt. Vol. 29, 2259-2265
www.intechopen.com

Adaptive Optics for High-Peak-Power Lasers – An Optical Adaptive Closed-Loop Used for High-Energy Short-Pulse Laser Facilities… 115
Haynam, C. A.; Wegner, P. J.; Auerbach, J. M.; Bowers, M. W.; Dixit, S. N.; Erbert, G. V.; Heestand, G. M.; Henesian, M. A.; Hermann, M. R.; Jancaitis, K. S.; Manes, K. R.; Marshall, C. D.; Mehta, N. C.; Menapace, J.; Moses, E.; Murray, J. R.; Nostrand, M. C.; Orth, C. D.; Patterson, R.; Sacks, R. A.; Shaw, M. J.; Spaeth, M.; Sutton, S. B.; Williams, W. H.; Widmayer, C. C.; White, R. K.; Yang, S. T. & Van Wonterghem, B. M. (2006). National Ignition Facility laser performance status, Appl. Opt. Vol. 46, pp. 3276–3303
Korn, G. & Antici, P. (2009). Report on the results of the Grand Challenges Meeting, Extreme
Light Infrastructure, 27-28 April 2009, Paris
Koechner, W. (1999). Solid-State Laser Engineering, 5th ed., Vol. 1 of Springer Series in Optical
Sciences, Springer
Kudryashov, A. V. & Shmalhausen, V. I. (1996). Semipassive bimorph flexible mirrors for
atmospheric adaptive optics applications, Opt. Eng.Vol. 35, pp. 3064-3073
Kuzmin, A. A.; Khazanov, E. A. & Shaykin, A. A. (2011). Large-aperture Nd:glass laser
amplifiers with high pulse repetition rate, Opt. Express, Vol. 19, No. 15, pp. 14224-
14232
Liu, L.; Wang, X.; Guo, S.; Xu, X. & Lu, Q. (2010). Model of thermally induced wave front
distortion and birefringence in side-pumped Nd-doped YAG and phosphate glass
heat capacity rod lasers, Appl. Opt. Vol. 49, No. 28, pp. 5245-5253
Noll, R.J. (1976). Zernike polynomials and atmospheric turbulence, J. Opt. Soc. Am. 66(3),
207-11.
Primot, J. & Sogno, L. (1995). Achromatic three-wave (or more) lateral shearing
interferometer, J. Opt. Soc. Am. A, 12(12), pp. 2679.
Primot, J. & Guérineau, N. (2000). Extended Hartmann test based on the pseudoguiding
property of a Hartmann mask completed by a phase chessboard, Appl. Opt. 39(31),
pp. 5715–5720.
Rousseaux, C.; Baton, S.; Bénisti, D.; Gremillet, L.; Adam, J. & Héron, A. (2009).
Experimental evidence of predominantly transverse electron plasma waves driven
by stimulated Raman scattering of picosecond laser pulses, Phys. Rev. Lett. Vol. 102,
Issue 18
Sauteret, C.; Sautivet, A. M.; Zou, J. P. & Maignan.J. (2000). Architecture of the LULI2000
facility, LULI Annual Scientific Report, Available from
www.luli.polytechnique.fr
Strickland, D. & Mourou, G. (1985). Compression of amplified chirped optical pulses, Opt.
Commun. Vol. 56, pp. 219–221
Uppal, J. S. & Monga, J. C. (1985). Contribution of stress-dependent variation of refractive
index to thermal lensing in Nd:glass laser rods. Appl. Opt. Vol. 24, No. 22, pp. 3690-
3692
Velghe, S.; Primot, J.; Guérineau, N.; Cohen, M. & Wattellier, B. (2005). Wave-front
reconstruction from multidirectional phase derivatives generated by multilateral
shearing interferometers, Opt. Lett. Vol. 30, pp. 245–247
Wattellier, B.; Fuchs, J.; Zou, J. P.; Abdeli, K.; Pépin, H. & Haefner, C. (2004). Repetition rate
increase and diffraction-limited focal spots for a nonthermal-equilibrium 100-TW
Nd:glass laser chain by use of adaptive optics, Opt. Lett. Vol. 29, No. 21, pp. 2494-
2496
www.intechopen.com

Topics in Adaptive Optics 116
Zou, J. P.; Descamps, D.; Audebert, P.; Baton, S.; Paillard, J. L.; Pesme, D.; Michard, A.;
Sautivet, A .M.; Timsit, H. & Migus. A. (1998). The LULI 100-TW TI :sappire/Nd :
glass laser : a first step towards a high performance petawatt facility. Proceedings of
the Third International Conference on Solid State Lasers for Application to Inertial
Confinement Fusion, Vol. 3492, pp. 94-97
Zou, J. P.; Le Blanc, C.; Audebert, P.; Janicot, S.; Sautivet, A. M.; Martin, L.; Sauteret, C.;
Paillard, J. L.; Jacquemot, S. & Amiranoff, F. (2008). Recent progress on LULI high
power laser facilities, Journal of Physics, Conf. Series. 112, 032021
www.intechopen.com

Topics in Adaptive OpticsEdited by Dr. Bob Tyson
ISBN 978-953-307-949-3Hard cover, 254 pagesPublisher InTechPublished online 20, January, 2012Published in print edition January, 2012
InTech EuropeUniversity Campus STeP Ri Slavka Krautzeka 83/A 51000 Rijeka, Croatia Phone: +385 (51) 770 447 Fax: +385 (51) 686 166www.intechopen.com
InTech ChinaUnit 405, Office Block, Hotel Equatorial Shanghai No.65, Yan An Road (West), Shanghai, 200040, China
Phone: +86-21-62489820 Fax: +86-21-62489821
Advances in adaptive optics technology and applications move forward at a rapid pace. The basic idea ofwavefront compensation in real-time has been around since the mid 1970s. The first widely used application ofadaptive optics was for compensating atmospheric turbulence effects in astronomical imaging and laser beampropagation. While some topics have been researched and reported for years, even decades, newapplications and advances in the supporting technologies occur almost daily. This book brings together 11original chapters related to adaptive optics, written by an international group of invited authors. Topics includeatmospheric turbulence characterization, astronomy with large telescopes, image post-processing, high powerlaser distortion compensation, adaptive optics and the human eye, wavefront sensors, and deformablemirrors.
How to referenceIn order to correctly reference this scholarly work, feel free to copy and paste the following:
Ji-Ping Zou and Benoit Wattellier (2012). Adaptive Optics for High-Peak-Power Lasers – An Optical AdaptiveClosed-Loop Used for High-Energy Short-Pulse Laser Facilities: Laser Wave-Front Correction and Focal-SpotShaping, Topics in Adaptive Optics, Dr. Bob Tyson (Ed.), ISBN: 978-953-307-949-3, InTech, Available from:http://www.intechopen.com/books/topics-in-adaptive-optics/ao-for-high-peak-power-lasers

© 2012 The Author(s). Licensee IntechOpen. This is an open access articledistributed under the terms of the Creative Commons Attribution 3.0License, which permits unrestricted use, distribution, and reproduction inany medium, provided the original work is properly cited.