adaptive management dr. e. r. irwin fish 7380. managing “adaptively” adaptation defined: the...
TRANSCRIPT
Adaptive management
Dr. e. r. irwin
FISH 7380

Managing “Adaptively”Adaptation defined:
The adjustment of strategy based on improved understanding or observed change
The term “adaptive” predates natural resources by at
least a generation
First used to describe management of engineering systems
Based on the fact that you don’t always fully understand the
system you’re managing
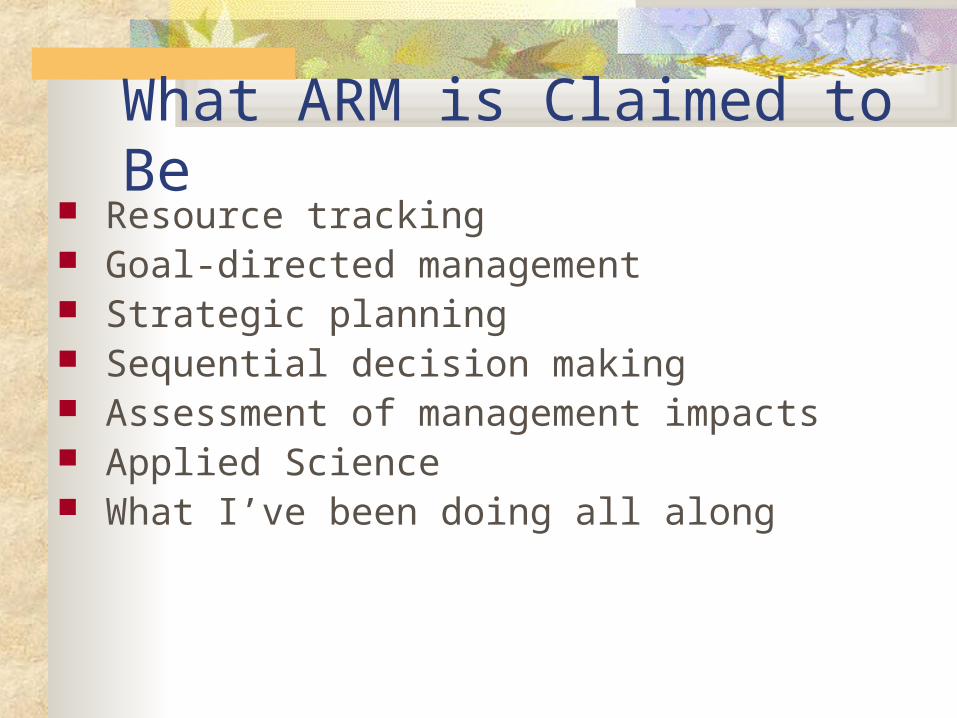
What ARM is Claimed to Be Resource tracking Goal-directed management Strategic planning Sequential decision making Assessment of management impacts Applied Science What I’ve been doing all along

What ARM is Not Not just the doing of science, even if management-
oriented Not just the tracking of resources, or activities, or
even impacts Not strategic planning per se Not the identification of goals and objectives Not a post-hoc assessment of management Most likely not what you’ve been doing all along
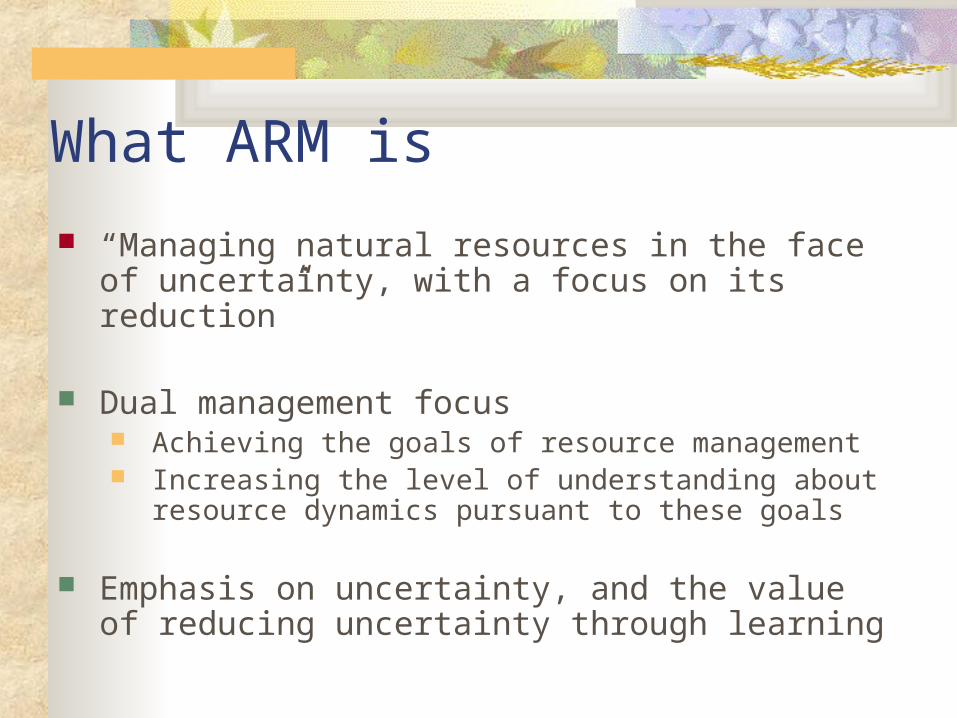
What ARM is
“Managing natural resources in the face of uncertainty, with a focus on its reduction”
Dual management focus Achieving the goals of resource management Increasing the level of understanding about resource
dynamics pursuant to these goals
Emphasis on uncertainty, and the value of reducing uncertainty through learning
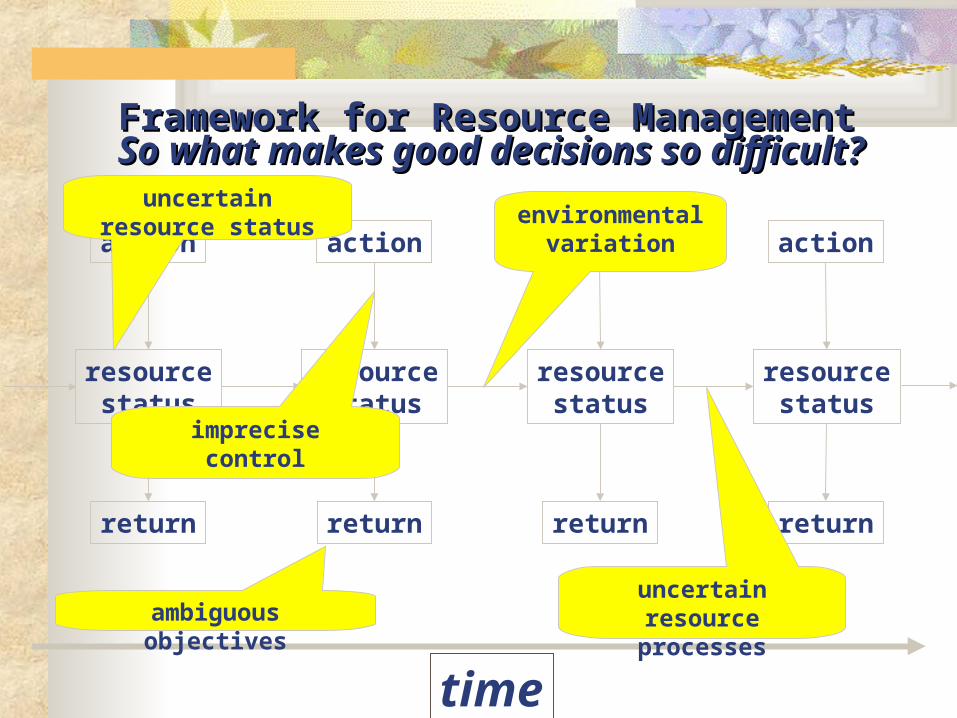
resourcestatus
resourcestatus
resourcestatus
resourcestatus
action action action action
return return return return
time
So what makes good decisions so difficult?So what makes good decisions so difficult?
environmentalvariation
imprecisecontrol
uncertainresource status
uncertainresource processesambiguous objectives
Framework for Resource ManagementFramework for Resource Management
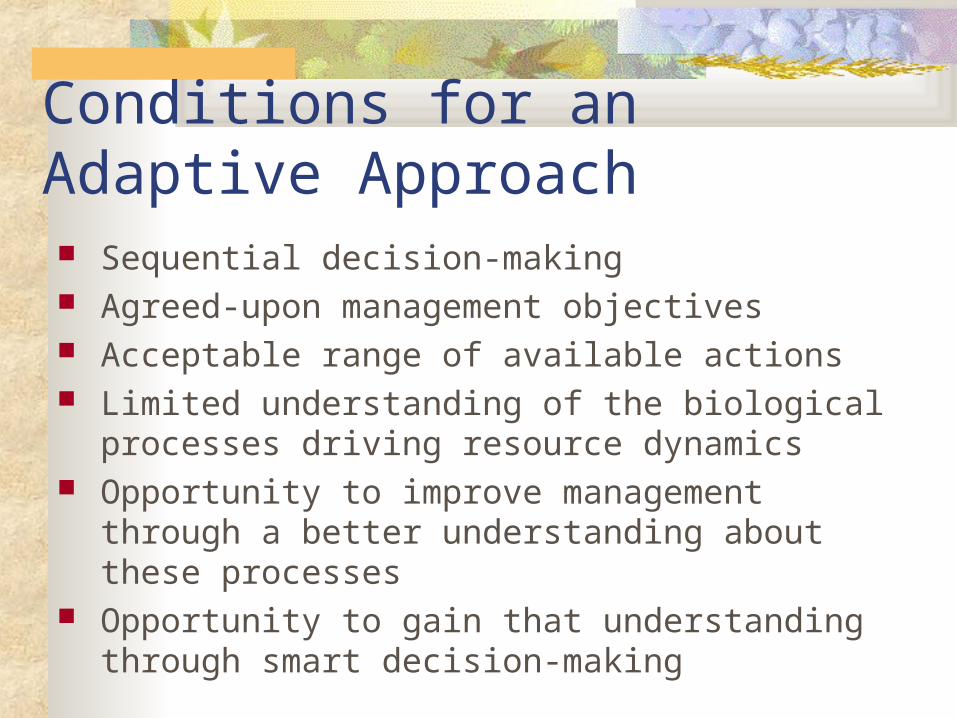
Conditions for an Adaptive Approach Sequential decision-making Agreed-upon management objectives Acceptable range of available actions Limited understanding of the biological processes
driving resource dynamics Opportunity to improve management through a
better understanding about these processes Opportunity to gain that understanding through
smart decision-making

So What’s New? Explicit accounting for uncertainty
Typically through the use of models incorporating different hypotheses about system dynamics
Focus on improving management through improved biological understanding
Use of data accumulated over time Involves acquisition of useful data as a goal of
management Involves design (or redesign) of monitoring
programs specifically to reduce uncertainty

Adaptive Decision-making decisiont…
monitoring assessment
decisiont+1 …
• Biological status and improvement in understanding are used in the
next round of decision-making in the next time period
• Actual vs. predicted responses are used to improve understanding
• Management objectives guide decision making at each point in time
• System responses to decisions are predicted with resource models
• Monitoring used to track actual system responses
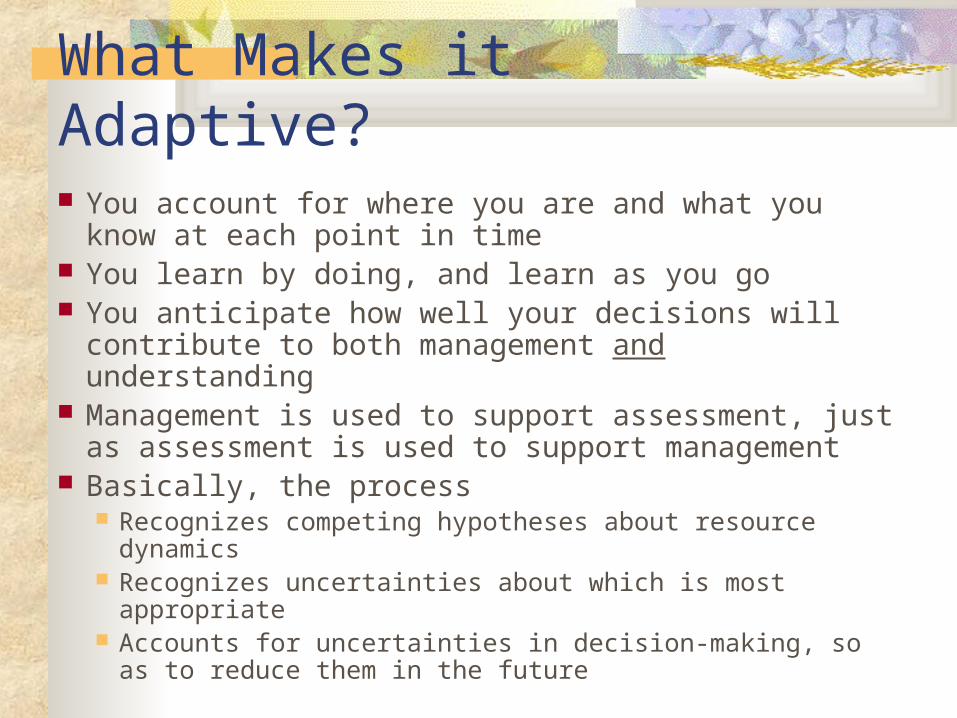
What Makes it Adaptive? You account for where you are and what you know at
each point in time You learn by doing, and learn as you go You anticipate how well your decisions will contribute
to both management and understanding Management is used to support assessment, just as
assessment is used to support management Basically, the process
Recognizes competing hypotheses about resource dynamics Recognizes uncertainties about which is most appropriate Accounts for uncertainties in decision-making, so as to
reduce them in the future

Alternatives to ARM Ad hoc management
Seat-of-the pants management Based on anecdotal information, absence of stated objectives Inadequate biological basis for action
Wait-and-see Risk-aversive strategy that seeks to minimize management
impacts as information accumulates Steady-state management
Attempts to sustain resource system in some targeted steady state
Conventional objective-based management Optimal management decisions based on an assumed
resource model

Example: Adaptive Harvest Management Used for setting annual waterfowl harvest
regulations over the last decade Regulations are used to influence harvest rates,
which in turn influence population dynamics
Harvest regulations are set each year based on Breeding population status Pond conditions on the breeding grounds Uncertainty about regulations impacts
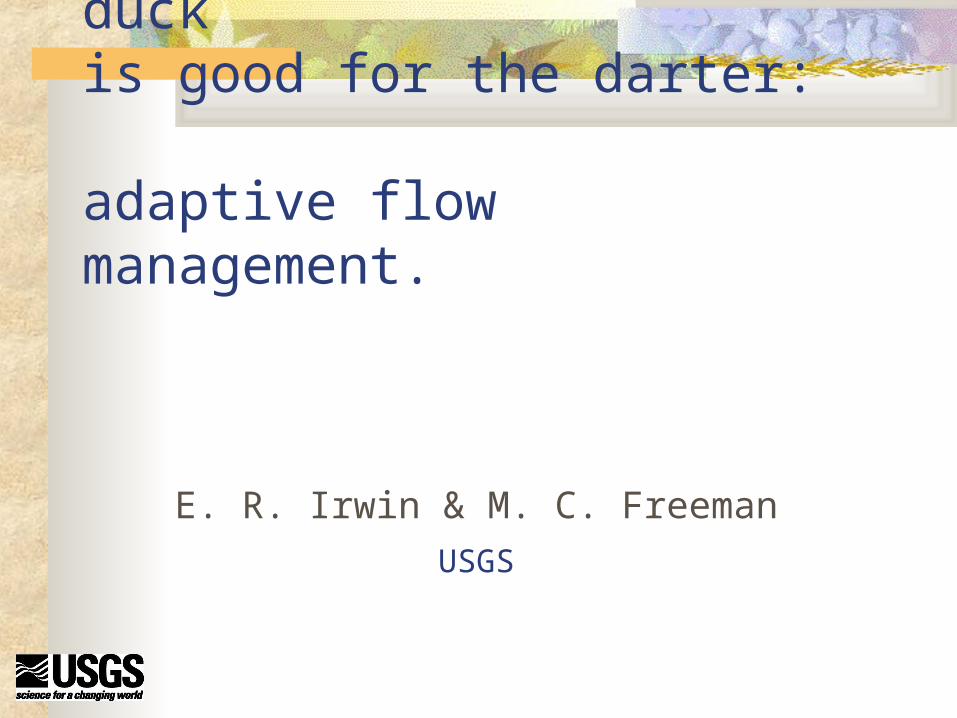
What is good for the duck is good for the darter: adaptive flow management.
E. R. Irwin & M. C. Freeman
USGS
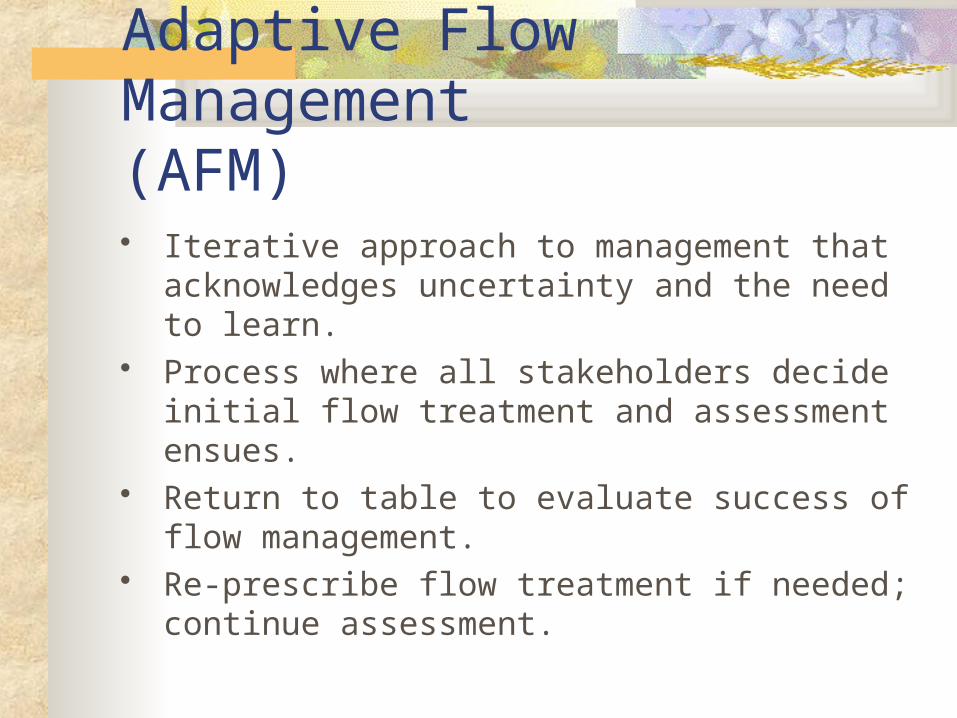
Adaptive Flow Management(AFM) Iterative approach to management that
acknowledges uncertainty and the need to learn. Process where all stakeholders decide initial flow
treatment and assessment ensues. Return to table to evaluate success of flow
management. Re-prescribe flow treatment if needed; continue
assessment.
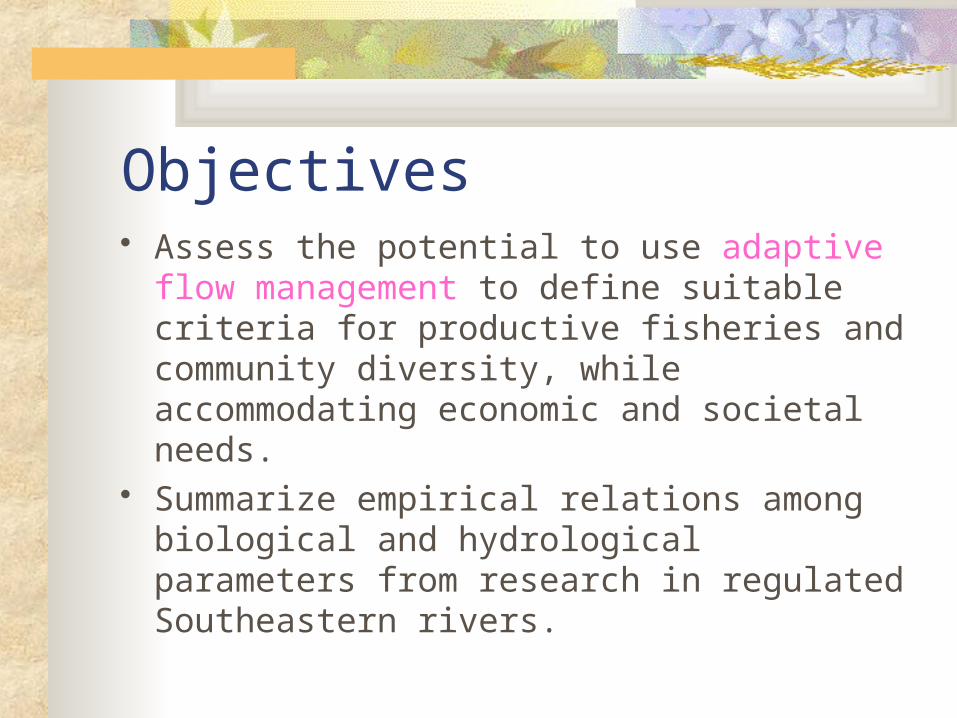
Objectives Assess the potential to use adaptive flow
management to define suitable criteria for productive fisheries and community diversity, while accommodating economic and societal needs.
Summarize empirical relations among biological and hydrological parameters from research in regulated Southeastern rivers.

Stakeholders decide flow regime based on management
goals.Societal
Economic
Assessment =management and research
to define ecological relations as system is managed
AFM
Transfer knowledge
Resource

Approach Compiled data from multiple projects to
determine components of flow regime essential for biological processes.
Quantify changes in flow regime. Constructed hypotheses testable in an
Adaptive Flow Management framework.

What is required for AFM? Stakeholders that realize “adaptive” allows
for adjustment of management regime as new information becomes available
Testable hypotheses with measurable objectives to refine management
Ability to embrace paradigm shifts, radical thinking
Baseline and reference data (?)
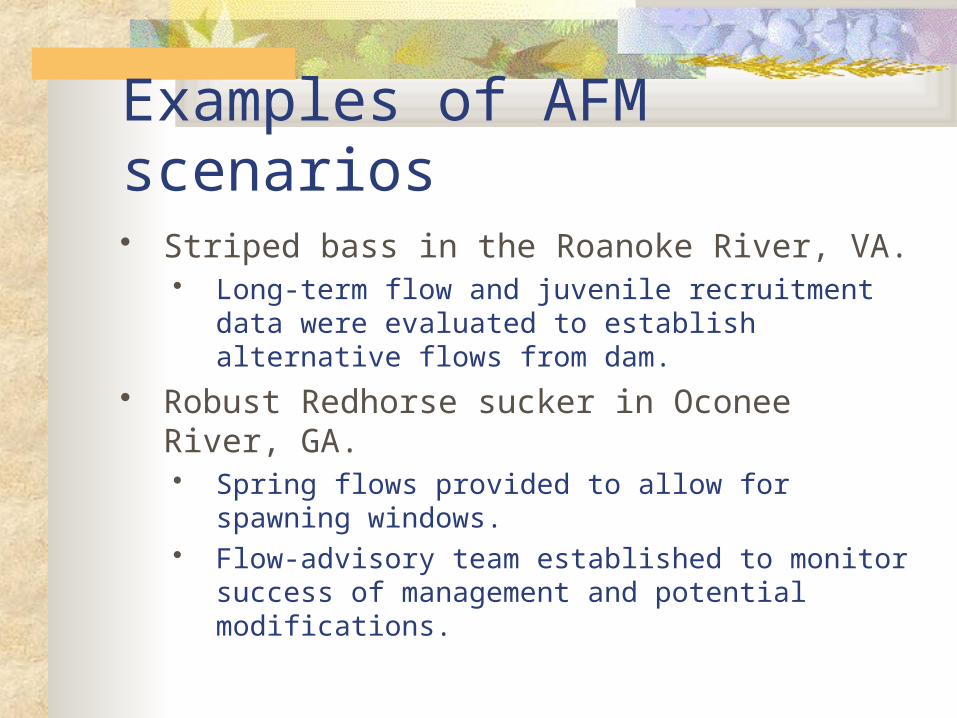
Examples of AFM scenarios Striped bass in the Roanoke River, VA.
Long-term flow and juvenile recruitment data were evaluated to establish alternative flows from dam.
Robust Redhorse sucker in Oconee River, GA. Spring flows provided to allow for spawning
windows. Flow-advisory team established to monitor success of
management and potential modifications.
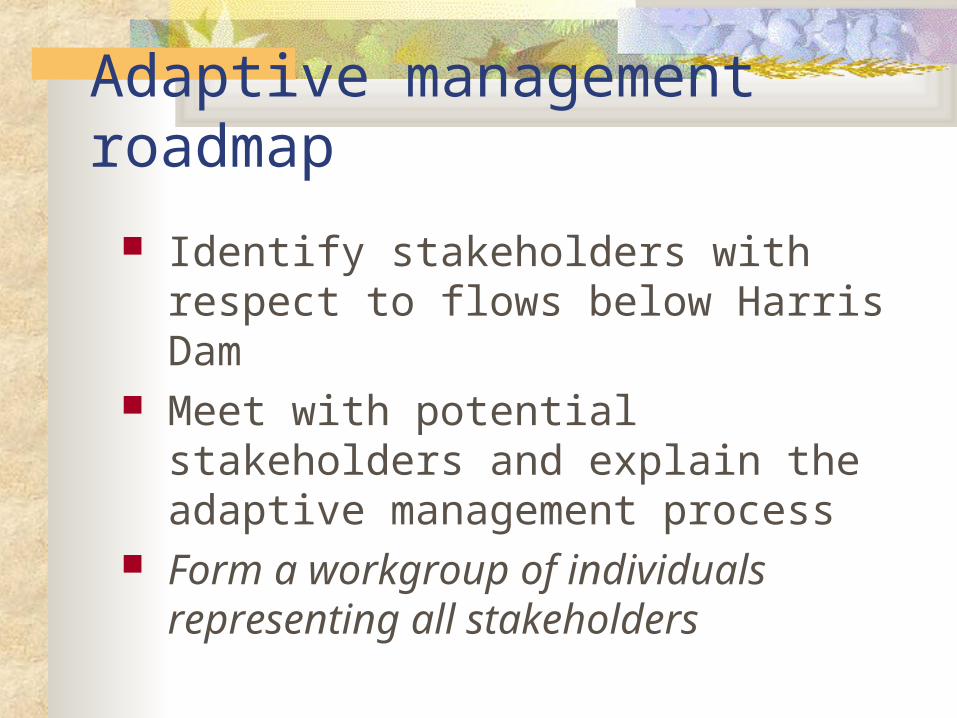
Adaptive management roadmap
Identify stakeholders with respect to flows below Harris Dam
Meet with potential stakeholders and explain the adaptive management process
Form a workgroup of individuals representing all stakeholders
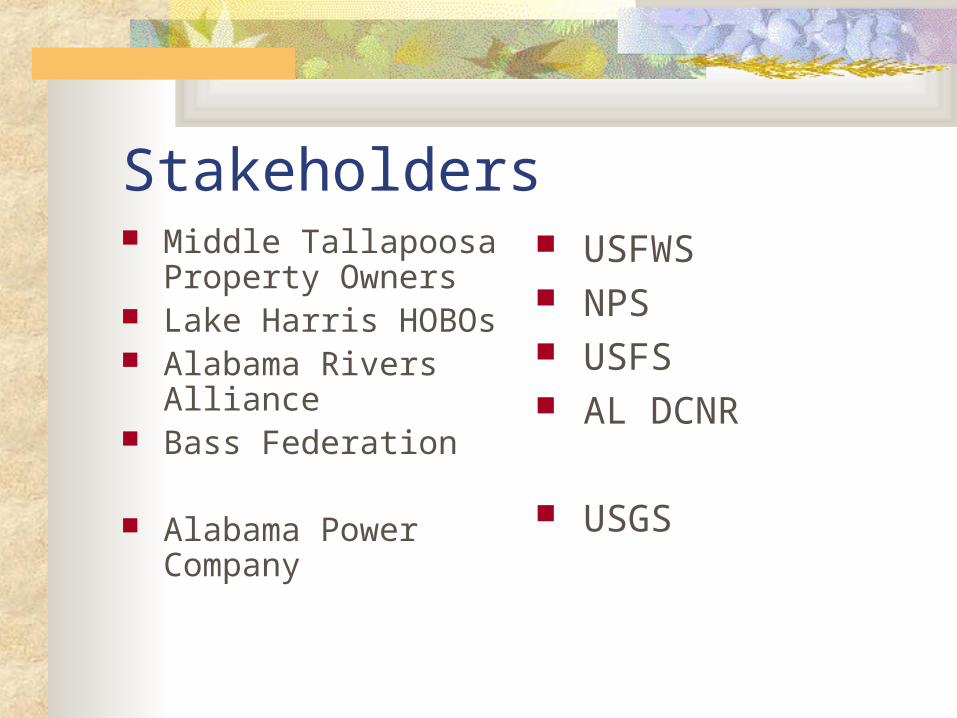
Stakeholders Middle Tallapoosa
Property Owners Lake Harris HOBOs Alabama Rivers
Alliance Bass Federation
Alabama Power Company
USFWS NPS USFS AL DCNR
USGS

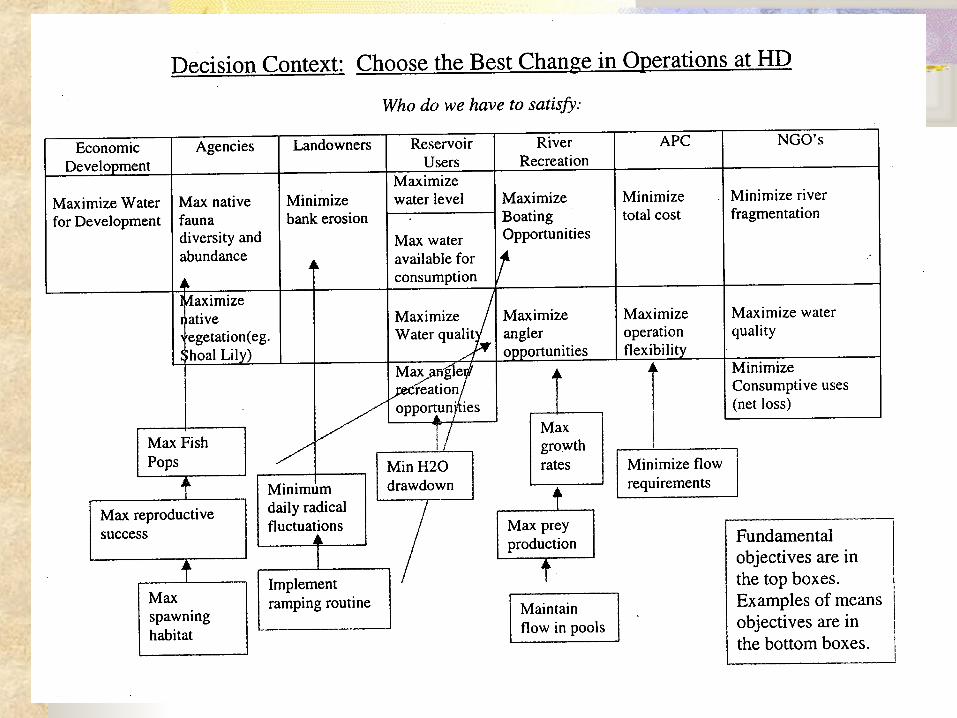
Next step---Workgroup Identify clear, focused management objectives
that represent all legitimate uses of the river. For example: Maintain biotic integrity within a certain range in
specified segments in the river; Increase angler catch rates of sport fishes to a certain
level in specified segments in the river; Maintain the economic value of the project at a
specified percentage of current value;

Setting biological management goals
(versus flow management goals)
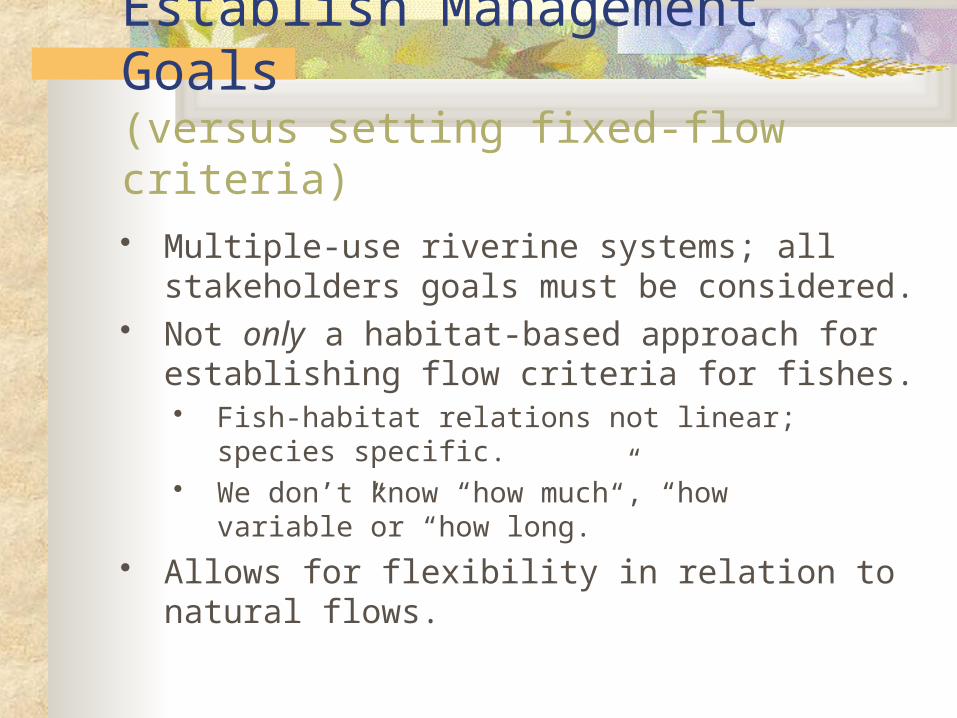
Establish Management Goals(versus setting fixed-flow criteria)
Multiple-use riverine systems; all stakeholders goals must be considered.
Not only a habitat-based approach for establishing flow criteria for fishes. Fish-habitat relations not linear; species specific. We don’t know “how much”, “how variable”or “how
long.”
Allows for flexibility in relation to natural flows.
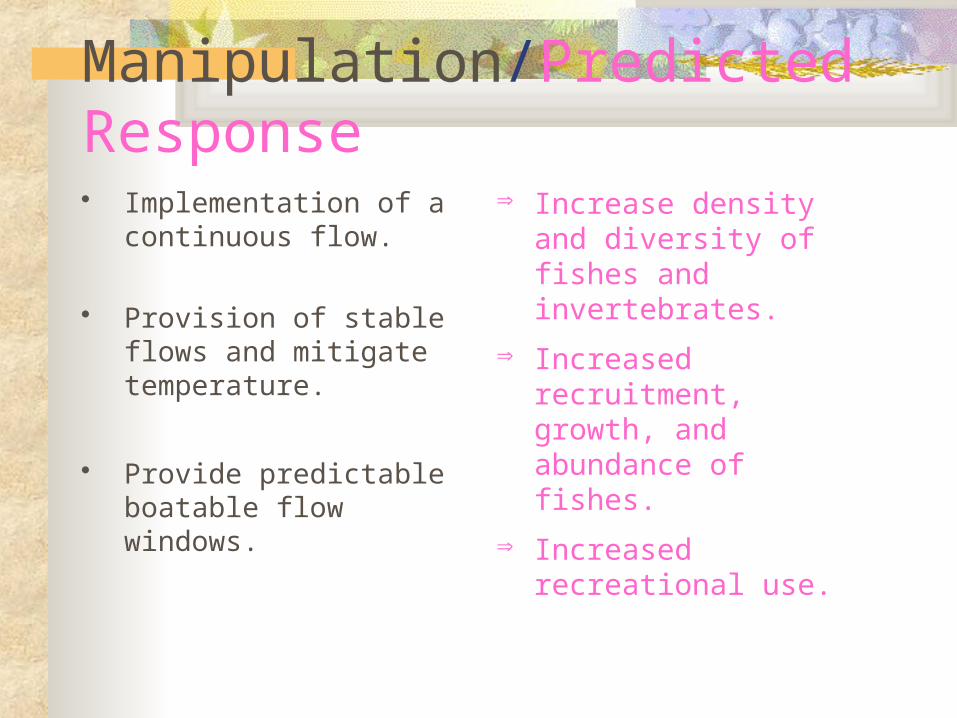
Manipulation/Predicted Response Implementation of a
continuous flow.
Provision of stable flows and mitigate temperature.
Provide predictable boatable flow windows.
Increase density and diversity of fishes and invertebrates.
Increased recruitment, growth, and abundance of fishes.
Increased recreational use.
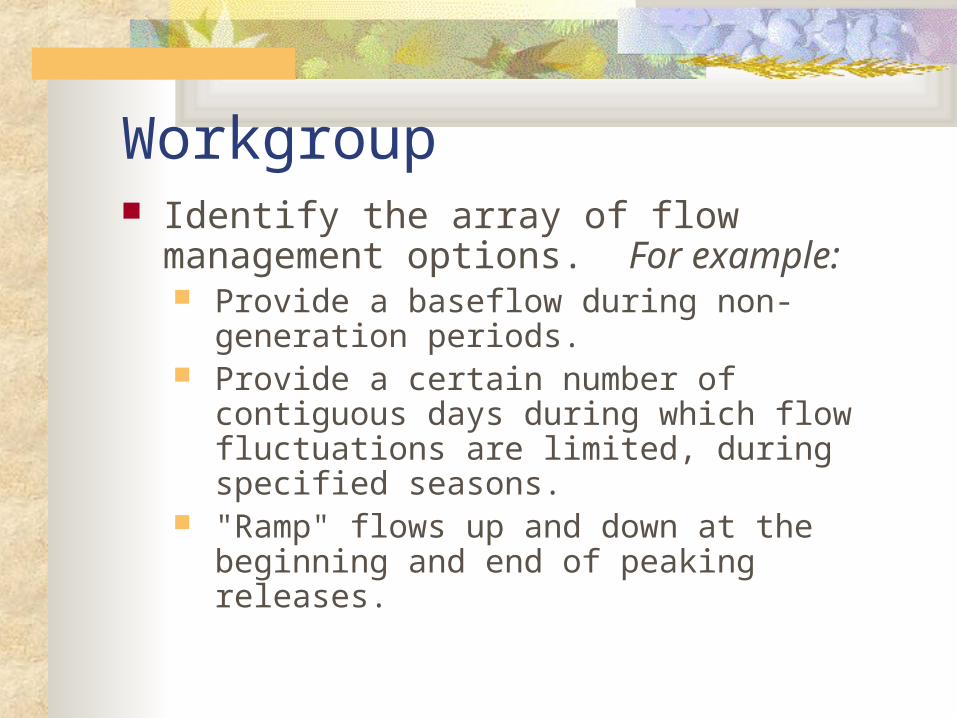
Workgroup Identify the array of flow management
options. For example: Provide a baseflow during non-generation
periods. Provide a certain number of contiguous days
during which flow fluctuations are limited, during specified seasons.
"Ramp" flows up and down at the beginning and end of peaking releases.

Workgroup Identify limits of acceptable management
outcomes for APC and for the regulatory agencies. What must management achieve to be acceptable from all perspectives represented in the workgroup?
Construct a set of meaningful hypotheses about relations between management objectives and flow parameters

Workgroup Incorporate alternative hypotheses into a
set of models (decision analysis) that that predict outcomes with respect to management objectives given different flow management strategies and observed levels of variation in inflow (using historical gage data)

Base flow (during non-generation intervals)
Present
Faunal response: e.g. Fish Abundance, IBI
Threshold
a b
c
d
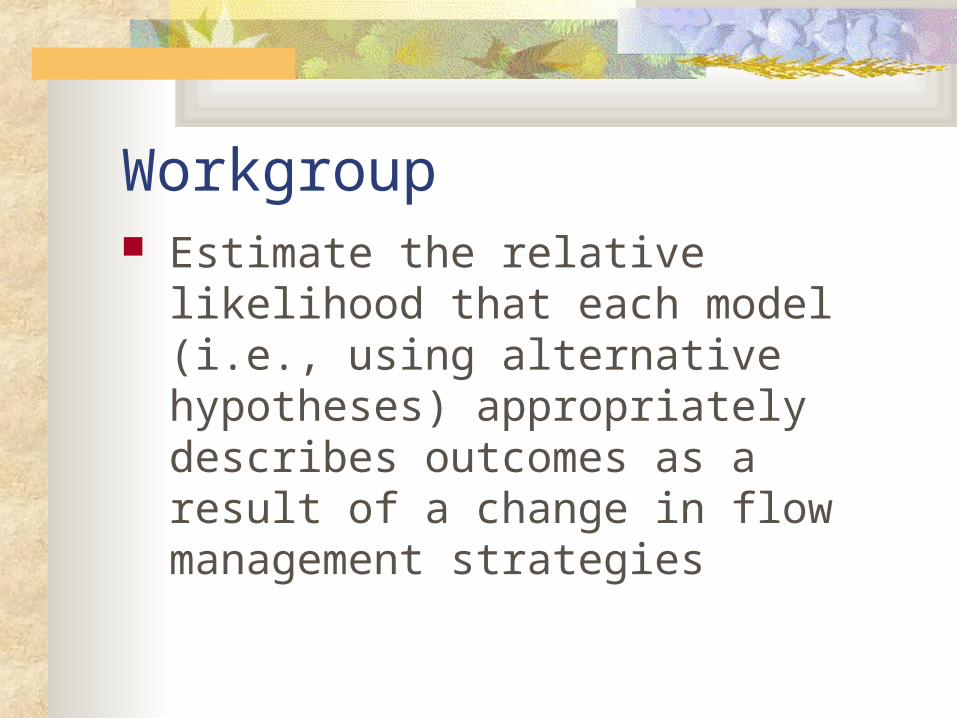
Workgroup Estimate the relative likelihood that each
model (i.e., using alternative hypotheses) appropriately describes outcomes as a result of a change in flow management strategies
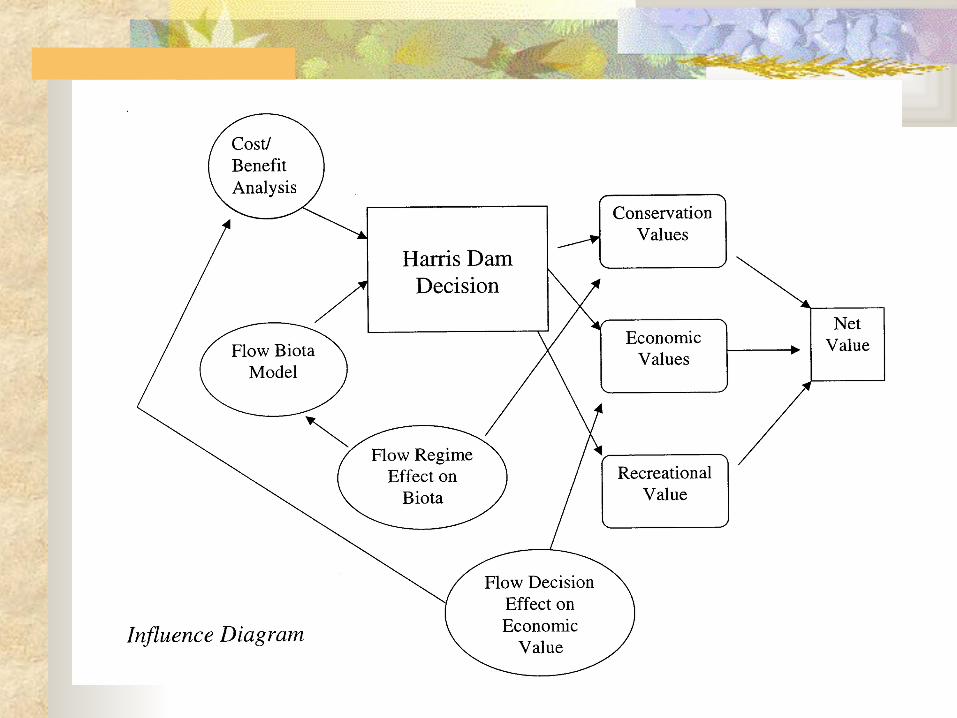
Decision Support Models
• Powerful tools for assessment, learning and defining options for management.
• Demonstrate how these models will help us decide what to do at R.L. Harris.
• Discuss the methods by which we will build the models.

Bridging the GAP
Conservationassessment
Resource management
Development of Quantitative Planning Tools for the Flint River Basin
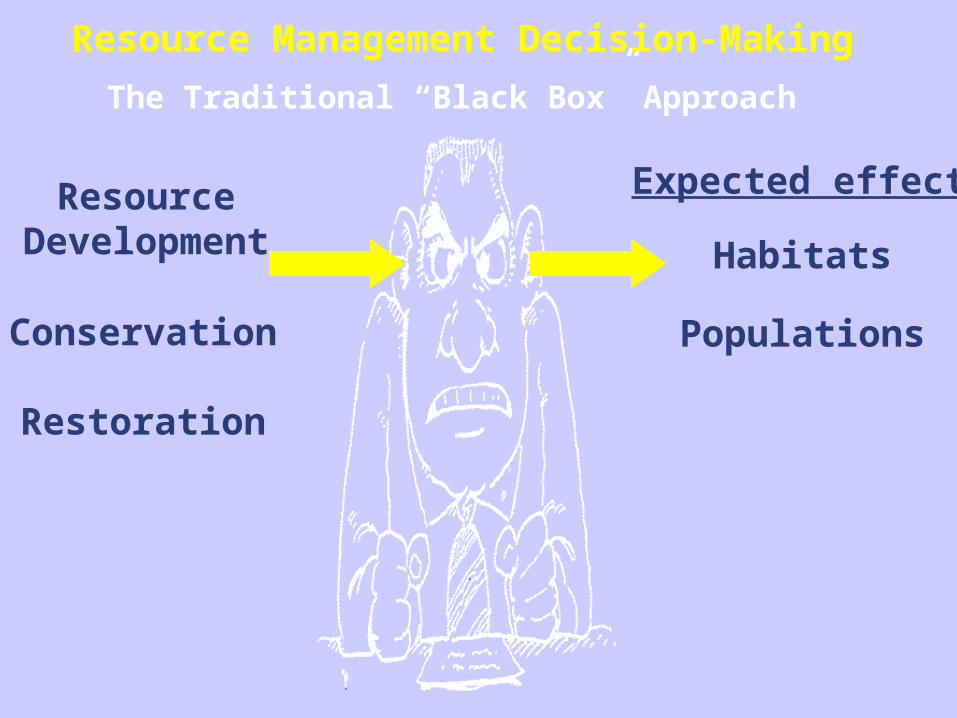
Habitats
Expected effects
Populations
The Traditional “Black Box” Approach
ResourceDevelopment
Conservation
Restoration
Resource Management Decision-Making

Quantitative Decision Modeling
ManagementActions
ExternalPhysical
Influences
AquaticCommunity
ExternalBiologicalInfluences
Stakeholder benefits
Explicitly incorporates uncertainty

Types of Uncertainty
System uncertainty
due to environmental and demographic variation
Statistical uncertainty
due to the use of sample data to estimate parameters
Process uncertainty
due to incomplete understanding of system dynamics
Factor A Factor B
Population response
Factor B
Population response
Factor A
Population response
or or

Quantifying Uncertainty
Empirical Models
Expert Judgement
Combination
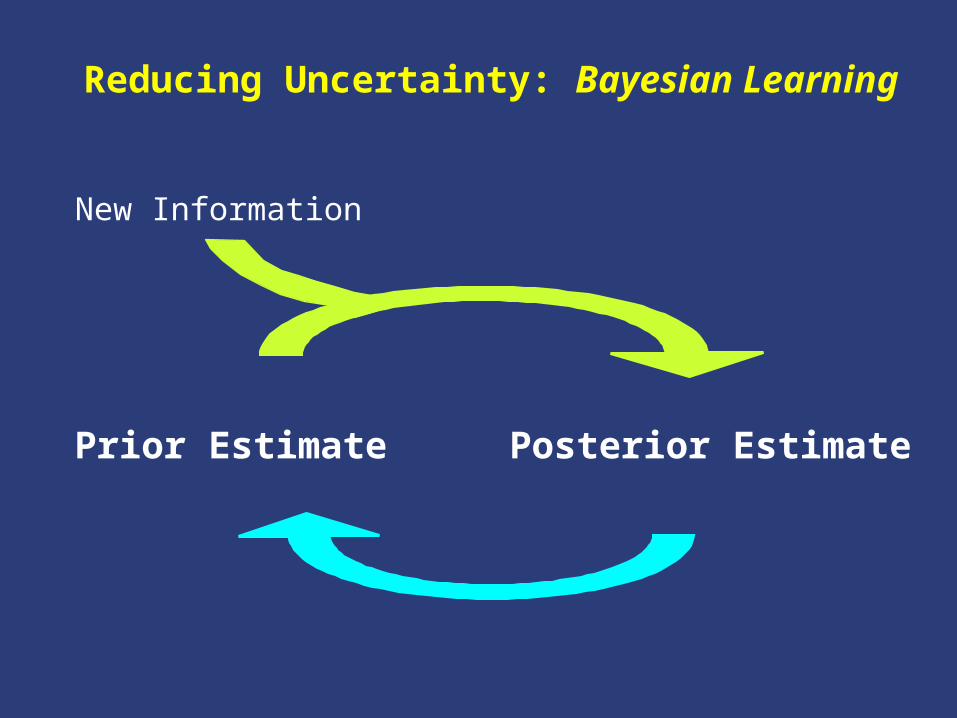
Reducing Uncertainty: Bayesian Learning
Prior Estimate Posterior Estimate
New Information

Learning How a System Works(Adaptation)
Currentstate
Managementaction
Actual futurestate
Model A(hypothesis)
Predicted State A
Model B(hypothesis)
Predicted future
State B
Infot Infot+1
Bayes’Rule
0
0.51
1.5
22.5
3
3.54
4.5
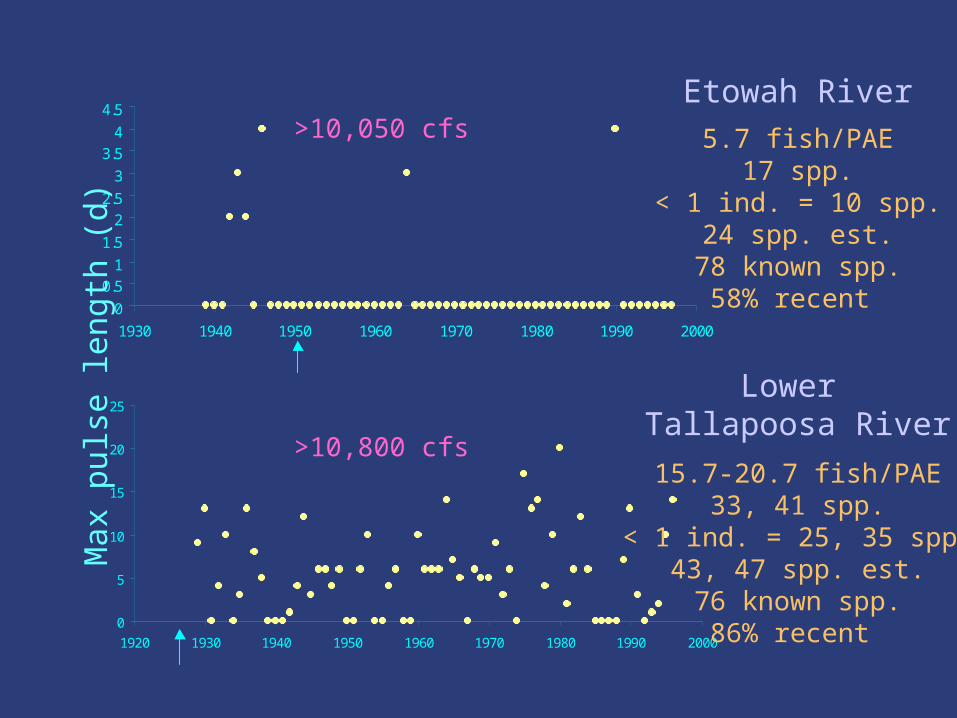
1930 1940 1950 1960 1970 1980 1990 2000
0
5
10
15
20
25
1920 1930 1940 1950 1960 1970 1980 1990 2000
Max
pul
se le
ngth
(d)
Etowah River
Lower Tallapoosa River
>10,800 cfs
>10,050 cfs 5.7 fish/PAE17 spp.
< 1 ind. = 10 spp.24 spp. est.
78 known spp.58% recent
15.7-20.7 fish/PAE33, 41 spp.
< 1 ind. = 25, 35 spp.43, 47 spp. est.76 known spp.
86% recent

Redbreast Sunfish Spawning Success 156 nests monitored daily (23 May-24 June
1999). Mean daily nest failure was 14% for all life
stages. Nest failure = 32% after 2-unit generation event. 71% of nests with swim-up fry failed (1-unit). Only a total of 3 SUF observed after 2-units.
0
20
40
60
80
100
120
140
160
180
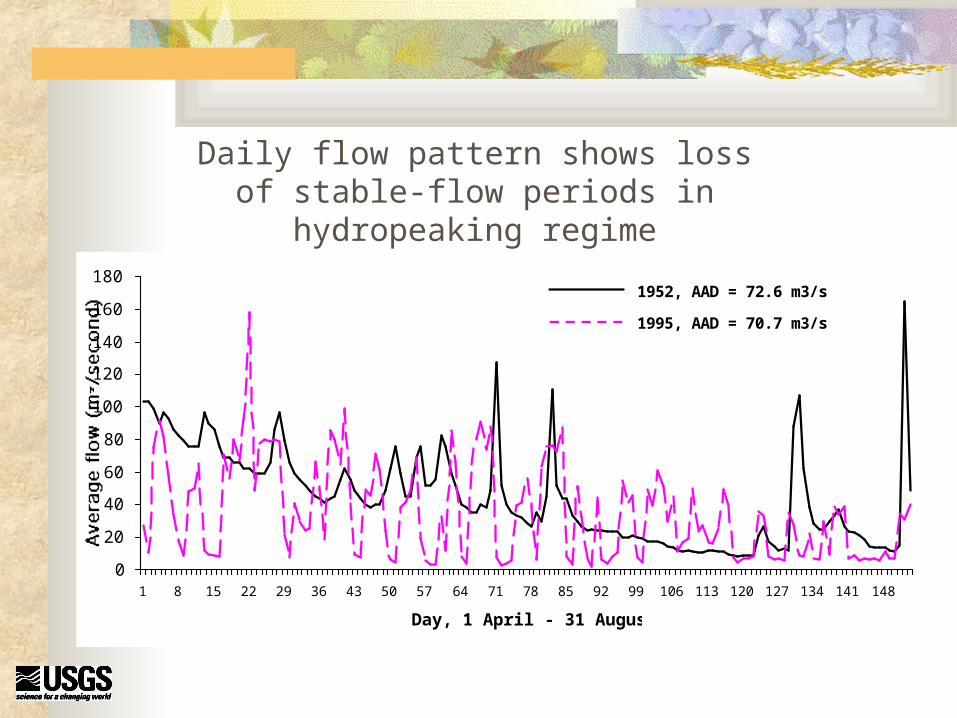
1 8 15 22 29 36 43 50 57 64 71 78 85 92 99 106 113 120 127 134 141 148
Day, 1 April - 31 August
1952, AAD = 72.6 m3/s
1995, AAD = 70.7 m3/s
Daily flow pattern shows loss of stable-flow periods in hydropeaking regime
0
50
100
150
200
250
300
350
400
450
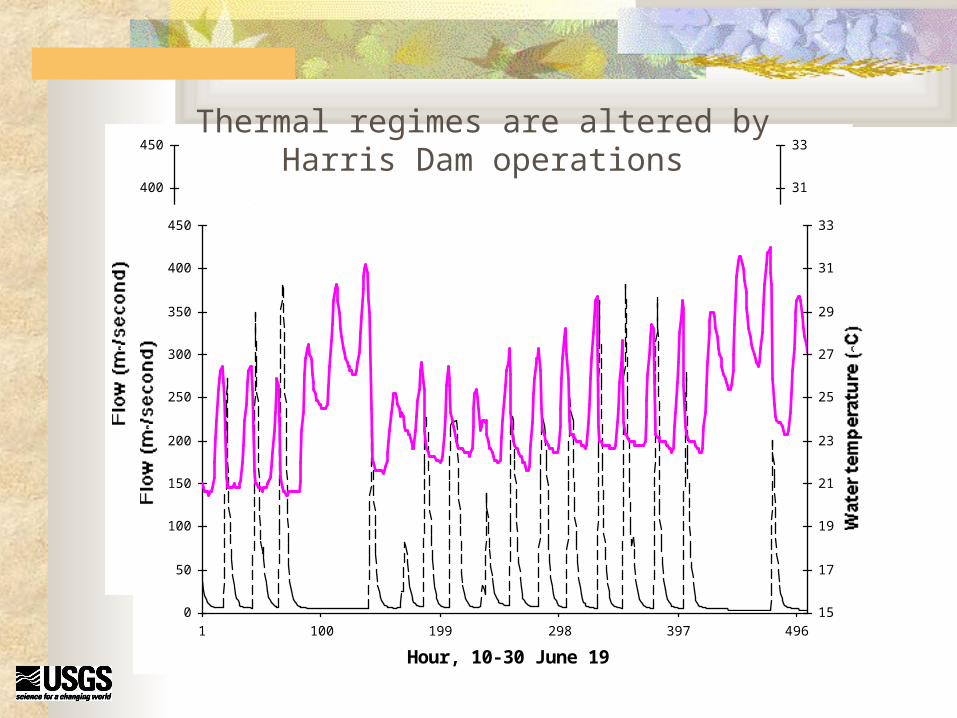
1 100 199 298 397 496
Hour, 10-30 June 1998
15
17
19
21
23
25
27
29
31
33
0
50
100
150
200
250
300
350
400
450
1 100 199 298 397 496
Hour, 10-30 June 1998
15
17
19
21
23
25
27
29
31
33
Thermal regimes are altered by Harris Dam operations
0
10
20
30
40
50
60
70
80
90
100
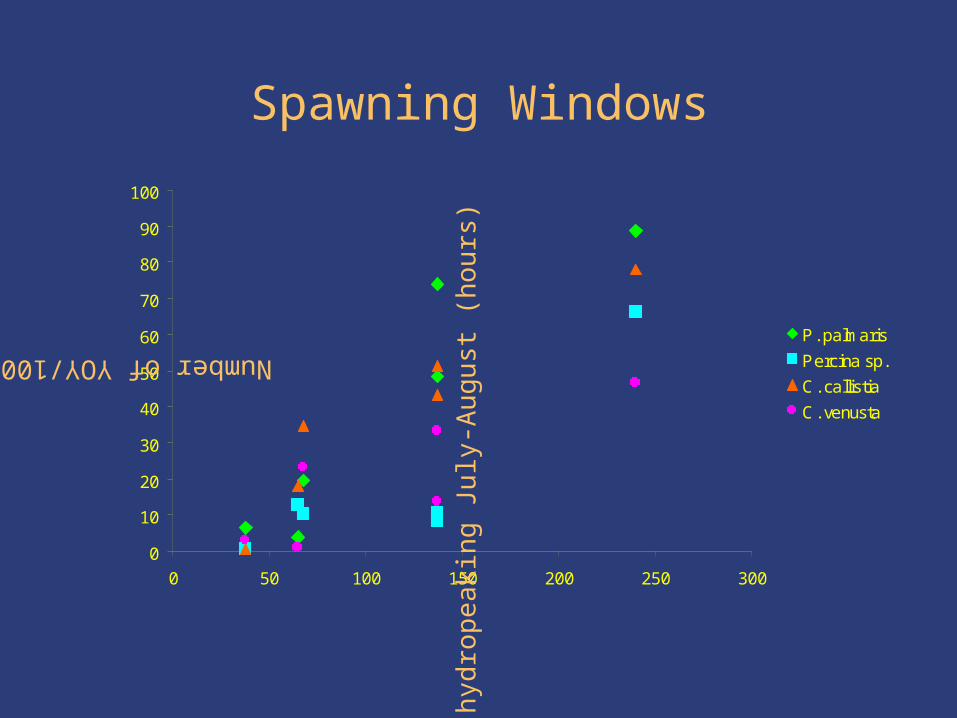
0 50 100 150 200 250 300
P. palmaris
Percina sp.
C. callistia
C. venusta
Spawning Windows
Lon
gest
per
iod
with
out h
ydro
peak
ing
July
-Aug
ust (
hour
s)Number of YOY/100 PAEs
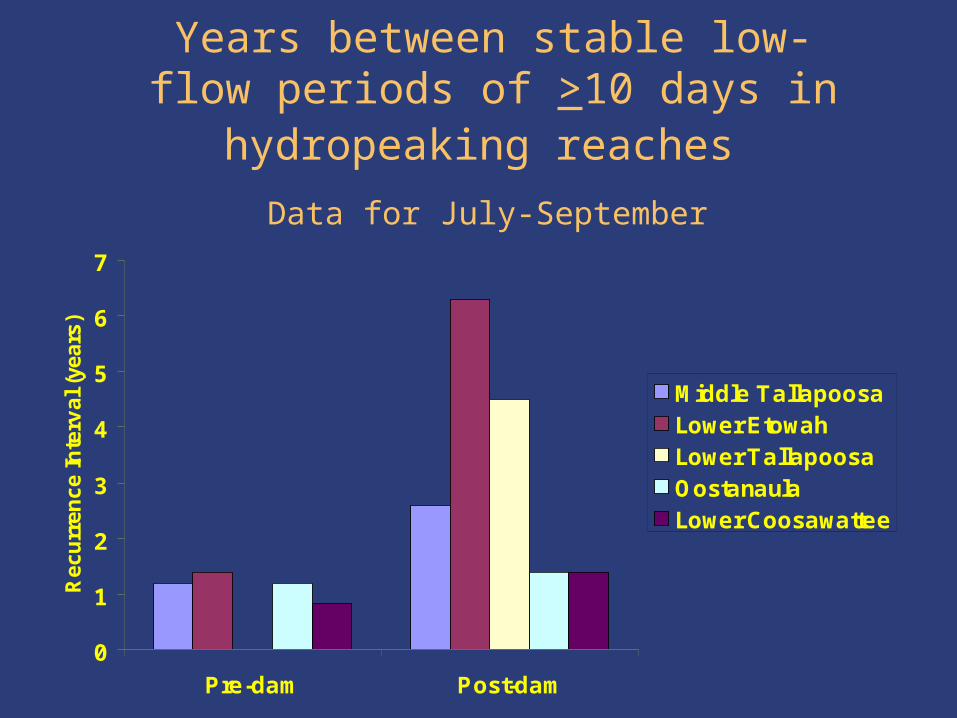
Years between stable low-flow periods of >10 days in hydropeaking
reaches
0
1
2
3
4
5
6
7
Pre-dam Post-dam
Rec
urr
ence
Inte
rval
(ye
ars)
Middle TallapoosaLower EtowahLower TallapoosaOostanaulaLower Coosawattee
Data for July-September

050
100150200
250300350
400450
Month
AugustJulyMay JuneApril
Flow regime below Harris Dam on the Tallapoosa River
Hourly flows, April - August 1995
0
20
40
60
80
1994 1995 1996 1997
0
20
40
60
80
1994 1995 1996 1997
% M
ax
imu
m p
os
sib
le a
rea Flow-Regulated Site Unregulated Site
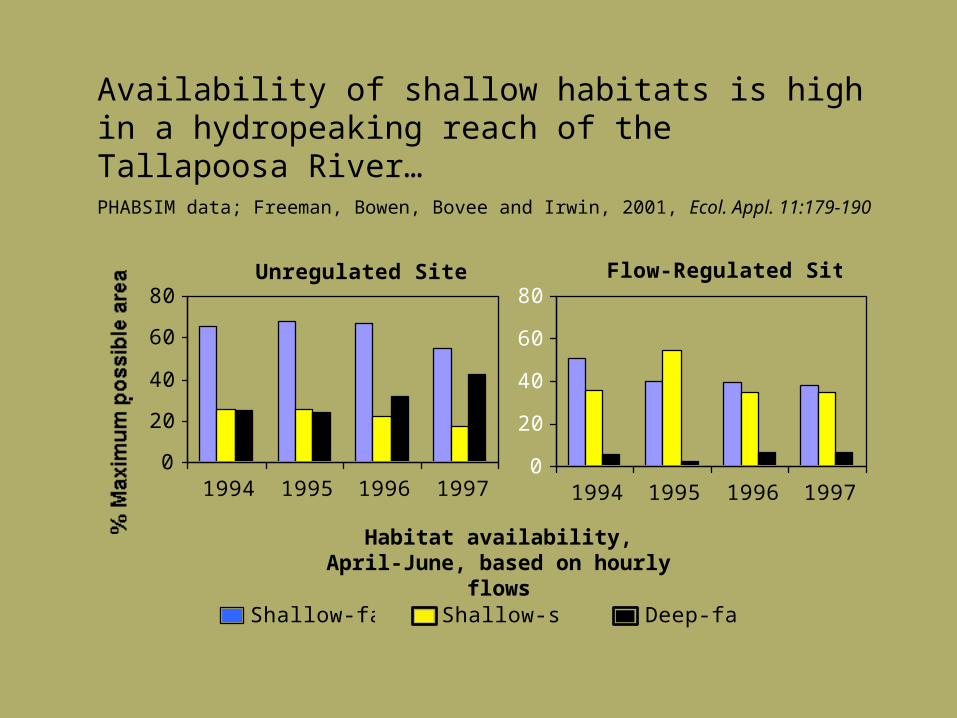
Availability of shallow habitats is high in a hydropeaking reach of the Tallapoosa River…PHABSIM data; Freeman, Bowen, Bovee and Irwin, 2001, Ecol. Appl. 11:179-190
Habitat availability, April-June, based on hourly flows
0
20
40
60
80
1994 1995 1996 19970
20
40
60
80
1994 1995 1996 1997
Shallow-fast Shallow-slow Deep-fast

0
200
400
600
800
1994 1995 1996 19970
200
400
600
800
1994 1995 1996 1997
Flow-Regulated Site Unregulated Site
Ha
bit
at
pe
rsis
ten
ce
, h
Maximum period of habitat stability, April-June, based on
hourly flows0
20
40
60
80
1994 1995 1996 19970
20
40
60
80
1994 1995 1996 1997
Shallow-fast Shallow-slow Deep-fast
But hydropeaking greatly reduces temporal habitat stability
Freeman, Bowen, Bovee and Irwin, 2001, Ecol. Appl. 11:179-190

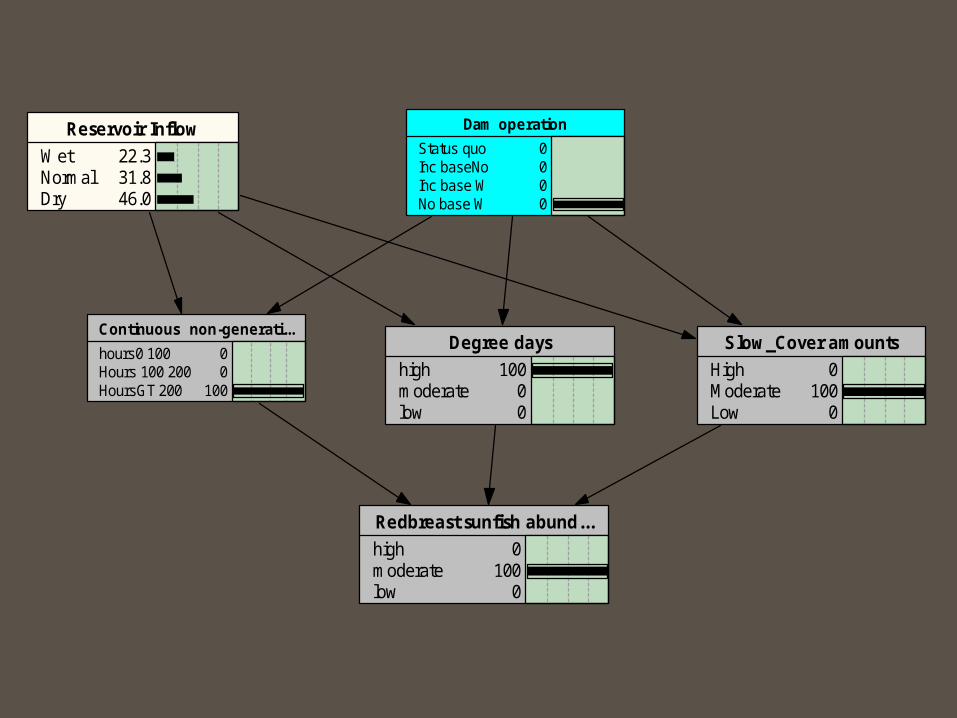
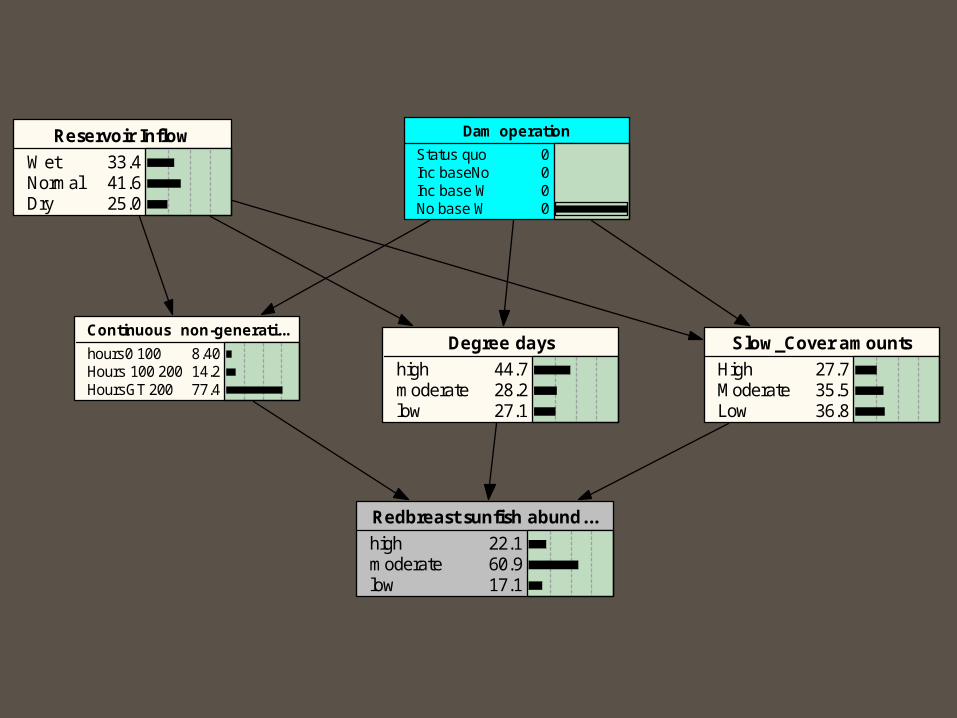
Dam operation
Status quoInc baseNoInc base WNo base W
0 0 0 0
Redbreast sunfish abund...
highmoderatelow
0 100 0
Reservoir Inflow
WetNormalDry
22.331.846.0
Slow_Cover amounts
HighModerateLow
0 100 0
Degree days
highmoderatelow
100 0 0
Continuous non-generati...
hours0 100Hours 100 200HoursGT 200
0 0
100

Dam operation
Status quoInc baseNoInc base WNo base W
0 0 0 0
Redbreast sunfish abund...
highmoderatelow
31.743.724.5
Reservoir Inflow
WetNormalDry
34.042.024.0
Slow_Cover amounts
HighModerateLow
33.333.333.3
Degree days
highmoderatelow
41.329.329.3
Continuous non-generati...
hours0 100Hours 100 200HoursGT 200
9.7013.976.4
Dam operation
Status quoInc baseNoInc base WNo base W
0 0 0 0
Redbreast sunfish abund...
highmoderatelow
0 100 0
Reservoir Inflow
WetNormalDry
22.331.846.0
Slow_Cover amounts
HighModerateLow
0 100 0
Degree days
highmoderatelow
100 0 0
Continuous non-generati...
hours0 100Hours 100 200HoursGT 200
0 0
100
Dam operation
Status quoInc baseNoInc base WNo base W
0 0 0 0
Redbreast sunfish abund...
highmoderatelow
22.160.917.1
Reservoir Inflow
WetNormalDry
33.441.625.0
Slow_Cover amounts
HighModerateLow
27.735.536.8
Degree days
highmoderatelow
44.728.227.1
Continuous non-generati...
hours0 100Hours 100 200HoursGT 200
8.4014.277.4
What is next? Refine models using empirical evidence or expert
opinion. Add to the model.
All other fundamental objectives.
To do this we will need to input appropriate data. We need to change something at the dam. Remember, this is a learn as you go process.
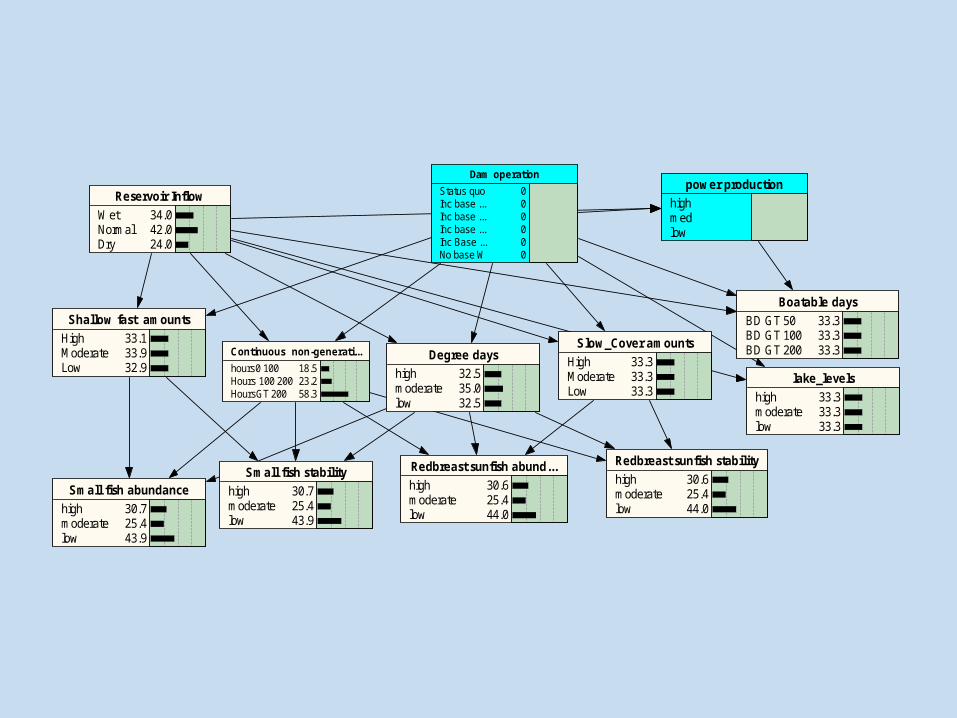
Shallow fast amounts
HighModerateLow
33.133.932.9
Reservoir Inflow
WetNormalDry
34.042.024.0
Slow_Cover amounts
HighModerateLow
33.333.333.3
Dam operation
Status quoInc base ...Inc base ...Inc base ...Inc Base ...No base W
0 0 0 0 0 0
Redbreast sunfish stability
highmoderatelow
30.625.444.0
Degree days
highmoderatelow
32.535.032.5
Small fish abundance
highmoderatelow
30.725.443.9
Small fish stability
highmoderatelow
30.725.443.9
Continuous non-generati...
hours0 100Hours 100 200HoursGT 200
18.523.258.3
Redbreast sunfish abund...
highmoderatelow
30.625.444.0
lake_levels
highmoderatelow
33.333.333.3
Boatable days
BD GT 50BD GT 100BD GT 200
33.333.333.3
power production
highmedlow

Workgroup Identify a starting point for changing the
flow regime below Harris Dam; the starting point should have a high likelihood (according to the models) of achieving management objectives. Use models to identify an appropriate time-frame for assessing whether or not management objectives are met
Workgroup and technical advisors Design a monitoring program designed to
assess attainment of management goals under a given flow management strategy
Collect data under new management regime for appropriate time-period
Workgroup and technical advisors After the agreed-upon period for
monitoring, use monitoring results to assess attainment of management goals. Based on the monitoring information, revise likelihood estimates for alternative models. Reassess the probabilities of attaining management objectives under alternative management strategies
Workgroup and technical advisors If management objectives are not being
met under the current flow regime, choose a new strategy more likely to be successful based on the revised models. Return to step (k)

Workgroup Stakeholders agree to implement the
change in flow regime, to monitor results for the appropriate period, how and when attainment of objectives will be assessed, and to then further modify the flow regime depending on outcomes relative to management objectives
Where are we now? Utility has provided some data that will be
incorporated into the model. We need more disclosure.
Utility has been “secretly” testing options at the dam.
The other stakeholders are restless. The scientists are frustrated (but still hopeful?) A facilitator (or group dynamics psychologist) is
needed for the next stakeholder meeting. Values need to be added.

Framework:
1. Define ecosystem flow requirementsdevelop initial numerical estimates of key aspects of river flow necessary to sustain native species and natural ecosystem functions; 2. Determine the influence of human activitiesaccounting for human uses of water, both current and future, through development of a computerized hydrologic simulation model that facilitates examination of human-induced alterations to river flow regimes; 3. Identify areas of incompatibilityassessing incompatibilities between human and ecosystem needs with particular attention to their spatial and temporal character; 4. Search for collaborative solutioncollaboratively searching for solutions to resolve incompatibilities; 5. Conduct water management experimentsdesign and implement water management experiments to resolve critical uncertainties that frustrate efforts to integrate human and ecosystem needs; and 6. Design and implement an adaptive management planusing the knowledge gained in steps 1-5, create an adaptive management program to facilitate ecologically sustainable water management for the long term.
The Ecologically Sustainable Water Management (ESWM) Framework
http://www.freshwaters.org/framework/