adaptive filteringtechnique for chronic wound analysis ... · (iden, gprs, edge), 3g (wcdma,...
TRANSCRIPT

Adaptive Filtering Technique for ChronicWound Analysis under Tele-Wound Network
Chinmay Chakraborty∗ and Bharat Gupta
Department of Electronics and Communication, Birla Institute of Technology,Jharkhand, India∗Corresponding Author: [email protected]
Received 2 March 2016; Accepted 21 March 2016;Publication 16 September 2016
Abstract
Efficient diagnosis of chronic wound depends on the quality of digitalimage that has reached the Tele-Medical Hub through Tele-Wound Network.However, how much ever precaution we take, while capturing the image bydigital camera or by smartphone, presence of random/impulse noise would bealways there to corrupt the captured image. The wound images give the vitalinformation such as size, wound status, tissue composition and healing rate. Inthis paper, we have proposed adaptive filtering technique for chronic wound(CW) image analysis under Tele-wound network to improve the diagnosis.Here, the best filter has been chosen which can help to improve the diagnosis ofwound. A comparative study of 16 different filters has also been performed on72 different wound images. The experimental results are given by comparing8 different parameters. These various parameters are Peak Signal to NoiseRatio (PSNR), Mean Square Error (MSE), Signal to Noise Ratio (SNR),NegativeAbsolute Error (NAE), Maximum Difference (MD), Mean StructuralSimilarity Index (MSSIM), Universal Image Quality Index (UIQI) and MeanAbsolute Error (MAE). Simulated results shows adaptive median providesbetter performances with respect to high value of PSNR (66.23), SNR (58.05)and lower value of MSE (3.01), MAE (0.29), and NAE (0.01) between originaland filtered image. The proposed methodology will assist the clinicians to takebetter decision towards diagnosis of CW in terms of qualitative at low-resourcesetup.
Journal of Communication, Navigation, Sensing and Services, Vol. 1, 57–76.doi: 10.13052/jconasense2246-2120.2016.005c© 2016 River Publishers. All rights reserved.

58 C. Chakraborty and B. Gupta
Keywords: Adaptive Median Filter; Chronic Wound; Wound Image Anal-ysis; Tele-Wound Network.
1 Introduction
Tele-wound network (TWN) is defined as the delivery of medical health careservices and sharing of clinical information over a distance using telecommu-nication platform [1, 2]. The objective is to provide better healthcare serviceto any place wherever and whenever required. TWN system offers reliableand efficient diagnostic aids to patients at affordable cost. TWN allows newtechnologies in sensing, medical imaging and wireless data communicationswith much lower cost, enabling the development of new widespread remotemedicine initiatives. Wound healing process is highly depend on time i.e. maybe required lengthy and several appointments with a clinician for treatment.TWN would reduce the problem of repeated and timely visits to doctors byremote monitoring and controlling. TWN would minimize the burden of healthcare unit and decreases the patients’worries. Efficient screening of CW imagesis important for prognostic and therapeutic intervention. Wound healing takeslonger duration and regular check-up in certain interval is one of the biggesthinderance in wound caring and healing [1]. Visual assessment by medicalexperts is time-consuming, subjective and inconsistent whereas computerizedanalysis of wound images will be rapid and efficient approach; which requiresappropriate image processing techniques and experts’ domain knowledge forimproved screening. A CW not only affects the individual but entire familygets suffered due to the enormous cost of wound care. Furthermore, it shouldbe noted that without intensive medical care and treatment, a CW will notheal most probable. The consequences of chronic wounds are mainly delayedto repair, suspended skin re-growth, slow older cell proliferation rate, socialisolation, depression, decrease in productivity and costly treatment. There are5 types of open wounds viz. abrasion (topmost layer of the skin is removed;painful), incision (smooth edges), laceration (irregular edges), puncture (deep;narrow wound) and avulsion (bleed heavily). The color change of CW’s givesimportant implication of the wound healing status. The image noise is thevariation of color information randomly in images produced by image sensorwith smartphones and digital camera. Hence, proper filtering is required toremove the random or impulse noise from wound images. The morphologicalfiltering is used to preserve edge information of an image and eliminating thenoise [3]. Wild et al. [4] developed digital wound measurement system wherequality of the pictures has been maintained by filter of the device.

Adaptive Filtering Technique for Chronic Wound Analysis 59
An optical imaging system is used in TWN system for capturing skinwound images from the patient. Skin’s abnormal conditions are common inthe developing countries where symptoms of skin diseases are observed [1].Christos et al. [5] has been taken 77 color wound photographs through Nikondigital SLR camera and used polarized filters to reduce the light reflectionfrom CW surface. Lie et al. [6] captured wound images by the smartphone’scamera and used Gaussian smoothing filter to minimize the noise. Baroneet al. [7] used SCIELab spatial filters for original wound image. Ederson et al.[8] applied anisotropic diffusion filtering to avoid the undesirable effects onsegmentation for dermatological ulcers. Marina et al. [9] used difference ofGaussians (DoG) filter for wound segmentation. In the help of DoG filtering,local intensity variations has been equalized. Dorra et al. [10] used Gaborfiltering technique for multispectral imaging. In this paper, the objective is toinvestigate best filter amongst all used filters on the basis of image qualityassessment. The camera images mostly suffer from independent impulsenoise that can be introduced on a wound image may be random/impulsenoise. The best filtering technique is required to remove the noises for betterquality of image. The adaptive wound image pre-processing module has beendeveloped using adaptive median filter. This proposed TWN system modelwill automatically check the optimal value of critical parameters and basedon that it will select the best filtering techniques.
The organization of paper is as follows: Section 2 describes the systemarchitecture of TWN system. In Section 3, different types of filters are dis-cussed in respect of wound image processing. Section 4 deals with experimen-tal results and discussion based on the image quality parameter. Conclusionis discussed in Section 5.
2 Tele-Wound Network System Architecture
In India, major percentage of the population is living in rural areas. They havebeen facing many problems due to shortages of healthcare facilities. Easyand affordable connectivity is required in rural areas to provide healthcare.Smartphone’s integrated with TWM system have the potential to provide cost-effective treatment to rural area. The patients’ outcomes can be improved;support’s user mobility; reduced hospitalization; manage extensive medicaldata; provides continuity care; minimize the risk; reducing healthcare cost andtime using this framework. TWN system model has been proposed for thiscase could be efficiently used in remote location where specialists’ servicesare not readily available.

60 C. Chakraborty and B. Gupta
TWN system is used for characterizing wound tissue accurately and dealswith large number of wound affected patients. The portable, handheld devicelike smartphones can be used to capture high-quality wound images andacquire patient’s demographic information. These devices would be able tosend information to the Tele-Medical Hub (TMH) [11, 12] through 2G, 2.5G(iDEN, GPRS, EDGE), 3G (WCDMA, CDMA2000, TD-CDMA), WLANand 4G technologies where the provision of faster data rate is possible.Wound healing process is time depended i.e. it may required lengthy andseveral appointments with a clinician. Chronic wound image analysis underTWN system scenario could help in cut down the time required. Hence, highquality wound images are required to diagnosis the wound status. Qualityof wound image can be enhanced at pre-processing stage by using variousfiltering techniques. Figure 1 represents the TWN system for wound statusmonitoring. The processed wound image goes to image processing toolbox inTMH for pre-processing purpose. The adaptive wound image pre-processing
Figure 1 Tele-wound network (TWN) system.

Adaptive Filtering Technique for Chronic Wound Analysis 61
module has been introduced in this system architecture to improve the qualityof image. The patient clinical or demographic information has been storedin wound database. The wound image filtering technique is required toremove the random/impulse noise. The wound image is smoothed by adaptivemedian filtering for noise reduction by providing well-defined and continuousedge information. Wireless communication technology enabled TWN systemreduces the need to transport patients for physical consultation from the expertdoctors which avoids the physical and mental stress, reduces time and cost.This framework is very much effective for both rural and urban people; itprovides good performance in terms of wound monitoring and advanceddiagnostic.
3 Denoising Filters for Wound Imaging
The image denoising is a substantial medical imaging task that is able toremove noise while preserving edges. In this paper, sixteen different filtershave been considered and a comparative study is presented below. Figure 2depicts the schematic diagram for wound image pre-processing with adaptivefiltering technique.
Figure 2 Schematic diagram for wound image processing.

62 C. Chakraborty and B. Gupta
These important filters are as follows: Mean, Average, Min, M3, Max,Log, Laplacian, Midpoint, Gaussian, Contra Harmonic, Median, Butterworth,Weiner, Alpha Trim Mean, Gabor, and Adaptive Median. Explanation of eachfilter technique is given below:
3.1 Mean Filter
This filter is belongs to linear filtering scheme. This filtering is used tosmoothing the images, mainly reducing the intensity variation between pixels.It is useful for removing Gaussian noise but preserving criteria is poor. Thestatistical model of the noise is swown in below:
p(x) =1
σ√
2πe− (x−μ)2
2σ2 (1)
Mean filter (x1. . . . xN ) =1N
N∑i=1
xi (2)
Where, x1 . . . . . . xN is the pixel range of image, σ is the standard deviationand N is the mask size.
3.2 Average Filter
It is non-linear smoothing filter. This filter is used to avoids the edge blurringby searching the homognity of current pixel neighbourhood and sharpendresulting image.
3.3 Min Filter
This filter is used to fine darkest point in an image and also reduces the saltnoise.
Min filter f̂(x, y) = min(s,t)∈Sx,y
[g(s, t)] (3)
Where, f(x, y) is represented as filtered image, g(s, t) is the original corruptedimage and window size depicted as sx,y.
3.4 M3 Filter
This is the smoothing and hybrid of mean and median filter and used to removethe noise.
M3 filter f(x, y) = max[
mean(s,t)∈Sxy
{g(s, t)}, median(s,t)∈Sxy
{g(s, t)}]
(4)

Adaptive Filtering Technique for Chronic Wound Analysis 63
Where, f(x, y) is represented as filtered image, g(s, t) is the original corruptedimage and window size depicted as sx,y.
3.5 Max Filter
This filter is used to findout the brightest point in an image and reduces thepepper noise from the wound image.
Max filter f̂(x, y) = max(s,t)∈Sxy
{g(s, t)} (5)
Where, f(x, y) is represented as filtered image and g(s, t) is the originalcorrupted image.
3.6 Log Filter
This filter is used to smoothing the wound image and it is very sensitive tonoise. This is a formula for LoG (combination of Laplacian and Gaussianfunctions) filtering:
Log(x, y) = − 1πσ4
[1 − x2 + y2
2σ2
]e− x2+y2
2σ2 (6)
Where σ is the standard deviation.
3.7 Laplacian Filter
It is used to sharpening and calculates the second derivatives of an image andalso measures the rate of change the first derivatives.
Laplacian filter g(x, y) = f(x, y) + c[�2f(x, y)
](7)
Where,f(x, y) is represented as filtered image,g(x, y) is the original corruptedimage and � represents the 2nd derivate respectively.
3.8 Midpoint Filter
This filter is very much useful for gaussian and uniform noise. This is thecombination of order and mean filter. It is the average of highest pixel and thelowest pixel with respect to intensity within the window sx,y. So, the outcomeof re instated wound image f at point (x, y) is given by,
Midpoint filter f̂(x, y) = 1/2
[max
(s,t)∈Sx,y
{g(s, t)} + min(s,t)∈Sx,y
{g(s, t)}]
(8)

64 C. Chakraborty and B. Gupta
Where, f(x, y) is represented as filtered image and g(s, t) is the originalcorrupted image.
3.9 Gaussian Filter
This popular filter is responsible for corrects the spectral coefficient andaplitude spectrum officients within filter window. Gaussian filter is similarto mean filter, but uses different kernel that depcts the shape of a Gaussian. Inone dimension, the Gaussian function can be represented as:
G(x) =1√2πσ
e− x2
2σ2 (9)
Where σ is the standard deviation of the distribution.
3.10 Median Filter
The Median filter is used in pre-processing stage for providing the imagecolor identification. The bright white spot arises on the wound image due toreflection. Median filter with 5 × 5 window size is employed to eliminate therandom/impulse noise in wound images [13]. The median filter can smoothnoisy regions, enhance the low-contrast wound region and better preserve thestructure of the edges. It considers each image pixel and looks at its close byneighbors to choose whether or not it is representative of its environs. Medianfilter replaces the value of central pixel with the median of all the surroundingneighborhood pixel values. The median is intended by first categorizationthe entire pixel values from the neighboring neighborhood into numericalcategorize and then restoring the pixel being measured with the middle pixelvalue. The average of two middle pixel values is taken when the neighborhoodunder consideration contains an even number of pixels. The Median filter isrepresented as:
Median filter(x1 . . . xN ) = Median[||x1||2 . . . . . . ||xN ||2] (10)
The two major advantages of median filter [14] over mean filter are: (a)the median is more robust averages than mean and as such, a single veryunrepresentative pixel in a neighborhood will not significantly affect themedian value and (b) as the median value is actually the value of one ofthe pixels in the neighborhood, it does not generate new improbable pixelvalues when the filter straddles an edge. Hence, the median filter is muchsuperior at preserving sharp edges than mean filter.

Adaptive Filtering Technique for Chronic Wound Analysis 65
3.11 Adaptive Median Filter
Adaptive median filtering has been widely used as an advanced techniquecompared with standard median filtering. This is performs spatial processingto determine which pixels in a wound image have been affected by ran-dom/impulse noise. This filter classifies pixels as noise by comparing everypixel in the image to its surrounding neighbor pixels. The noise pixels arereplaced by median pixel value in the neighborhood. This filter removesimpulse noise with higher probabilities and reduces distortion along the edges.
3.12 Contra Harmonic Filter
This is used to remove the Gaussian noise and preserve edge features.
3.13 Butterworth Filter
This filter is the sum of low pass filters in frequency domain where pass bandare designed to have a fixed gain with no ripples until the cut-off frequency.
3.14 Weiner Filter
It is used to produce an estimate of a desired random process by linear time-invariant filtering of an observed noisy process. This filter is designed for adesired frequency response and also used for restoration of a degraded image.
3.15 Alpha Trim Mean Filter
This filter is used for restoration of signals and wound images corrupted bynon-Gaussian noise. It is hybrid of linear and nonlinear approaches.
3.16 Gabor Filter
This filter can be used to remove the noise efficiently. It responds to edges andtexture changes.
3.16.1 Color HomogenizationCWs are having complex mixture of colored tissues with varied intensity.Anisotropic diffusion filtering [15] is used for homogenization of color alongwith preservation of edges, only smoothing between edges. The objective ofthis method is to reduce image noise without eliminating significant portionof the image. The color homogenization is used in this work using combinedGray world assumption and Retinex theory [16].
66 C. Chakraborty and B. Gupta
4 Result and Discussion
In this section, we present result of sixteen denoising filters. The outcomesof the different filters are shown in Figure 11. The pre-processing stage isimplemented to improve the efficiency using color correction, noise filtering,and color homogenization methods for improving the wound image quality.Color is the important indication for the visual CW tissue assessment. Thisvisual red-yellow-black (R-Y-B) color evaluation model has been used mostlyin clinical trials on wound assessment. The color corrected RGB image is thenassessed for different filters. All 16 filters were applied on set of 72 randomlyselected wound images from our developed wound database as well as anonline wound image database. Most of them use mathematical morphologyoperations. In order to access the quality of image after filtering are based on8 different quantitative performance measures, such as PSNR, MSE, SNR,NAE, MD, MSSIM, UIQI and MAE.
4.1 MSE
It is the most important image quality measuring method. It is basically squarederror between enhanced image and original CW image. Mathematically,defined as:
MSE =1
M × N
M−1∑x=0
N−1∑y=0
[F (x, y) − Ffltr(x, y)]2 (11)
where, F (x, y) and Ffltr(x, y) are the input, filtered output images andsize M × N.
4.2 PSNR
It is used to calculate the ratio between maximum possible intensity value ofthe CW image and MSE. PSNR is defined as:
PSNR = 10 log10
⎡⎢⎢⎢⎣
R2
1M×N
M−1∑x=0
N−1∑y=0
[F (x, y) − Ffltr(x, y)]2
⎤⎥⎥⎥⎦ (12)
Here, R is the maximum possible peak intensity value of the image.

Adaptive Filtering Technique for Chronic Wound Analysis 67
4.3 SNR
It is the ratio between signal i.e. enhanced image and noise in the spatialdomain. In this case, noise is the difference between input image and filteredimage. SNR can be computed as:
SNR =
⎡⎢⎢⎢⎣
M−1∑x=0
N−1∑y=0
[Ffltr(x, y)]2
M−1∑x=0
N−1∑y=0
[F (x, y) − Ffltr(x, y)]2
⎤⎥⎥⎥⎦ (13)
Where, F (x, y) and Ffltr(x, y) are the input and filtered output images.
4.4 MAE
This method is used to measure how close predictions are to the eventualoutcomes. The MAE is given by
MAE =1n
n∑i=1
|fi − yi| =1n
n∑i=1
|ei| (14)
where, MAE is an average of the absolute errors, ei = |fi − yi|, fi is theprediction and yi is the true value, n is the number of observations.
4.5 MSSIM
This method is used to predict the quality of CW images. It is designed toimprove the PSNR and MSE values [17].
SSIM(x,y) =(2μxμy + c1)(2σxy + c2)
(μ2x + μ2
y + c1)(σ2x + σ2
y + c2)(15)
Where, μx and μy is the average of x and y, σ2x and σ2
y is the variance of x andy, σxy is the covariance of x and y respectively.
4.6 NAE
NAE [3] is used to find out the similarity between original and filtered imagei.e. larger value of NAE provides poor quality of filtered image.

68 C. Chakraborty and B. Gupta
NAE =
M∑x=1
N∑y=1
|F (x, y) − Ffiltr(x, y)|M∑
x=1
N∑y=1
|F (x, y)|(16)
4.7 MD
MD [18] measures the maximum difference in the intensity values of originalwound image and filtered image.
MD = max |Ffiltr(x, y) − F (x, y)| (17)
4.8 UIQI
This parameter can be modeled using three important factors viz. loss ofcorrelation, luminance distortion and contrast distortion.
UIQI =1i
i∑k=1
Qk (18)
Where,
Qk =σi,fg
σi,fσi,g· 2figi
f2i + g2
i
· 2σi,fσi,g
σ2i,f + σ2
i,g
(19)
gi and fi defined as the mean value of sub image window for original andenhanced image, σi,f and σi,g is the standard deviation of ith sub imagewindow for original and enhanced image, σi,fg present the covariance betweenthem. In this paper, window size 5×5 has been considered.
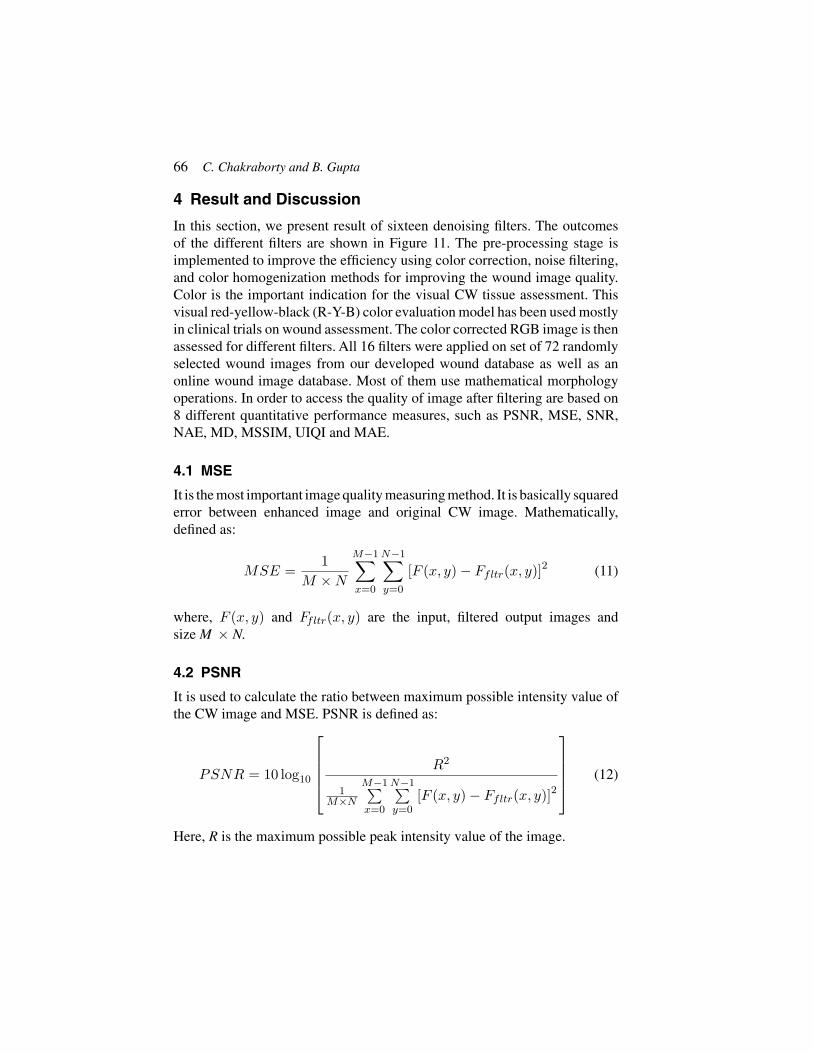
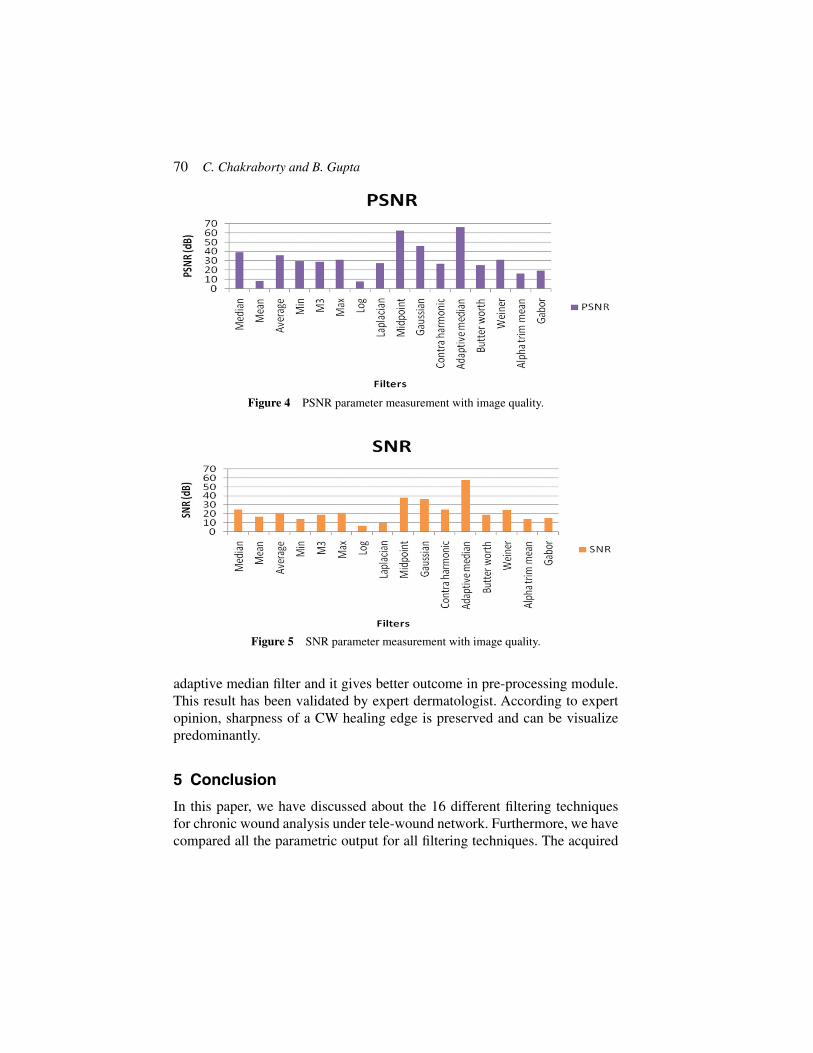
The 72 different RGB wound images are applied from our wound databaseto the 16 different filters and find out the best filter based on considering8 important parameters for improving the image quality. Then we havecomparatively analyzed by averaging the all parameters values that shownin Table 1. Lower value of MSE, NAE, and MAE refers that there isvery small change between original and filtered image. On the other hands,higher value of PSNR, SNR reports that there is very small change. FromFigure 3 to 10, we observe that adaptive median filter is the best alternative forvisualization because it provides good value of PSNR (66.23), SNR (58.05),MAE (0.29), NAE (0.01), MD (126.10), MSSIM (1.00), UIQI (0.99) andMSE (3.01) values. The value of MSSIM and UIQI closer to 1 refers the bestpossible quality of image as well as structural similarity. Midpoint filtering

Adaptive Filtering Technique for Chronic Wound Analysis 69
Table 1 Quality performance measure of 16 filters considered for studyFilters MSE SNR PSNR NAE MD MAE MSSIM UIQIMedian 13.09 25.12 39.21 0.02 154.16 1.03 0.98 0.99Mean 76.20 17.01 8.58 1.72 208.21 58.52 0.43 0.48Average 17.02 21.07 36.00 0.02 100.01 1.21 0.99 0.99Min 88.28 14.23 29.45 0.04 301.26 4.16 0.97 0.97M3 91.40 19.18 28.95 0.06 191.16 2.79 0.92 0.98Max 56.25 21.02 31.46 0.05 118.42 0.30 0.98 0.97Log 92.72 6.93 7.89 0.94 254.79 62.02 0.08 0.11Laplacian 94.64 9.90 27.70 0.08 143.68 3.42 0.95 0.99Midpoint 11.34 37.93 62.67 0.00 13.47 0.04 1.00 1.00Gaussian 33.11 36.84 46.40 0.02 45.84 1.30 1.00 0.99Contra harmonic 71.13 25.02 27.03 0.07 106.79 1.40 0.90 0.94Adaptive median 3.01 58.05 66.23 0.01 126.10 0.29 1.00 0.99Butter worth 86.02 19.18 25.66 0.10 80.00 3.71 0.89 0.94Weiner 60.14 24.23 31.38 0.07 69.74 2.15 0.90 0.94Alpha trim mean 94.10 14.25 16.53 0.35 225.68 31.99 0.82 0.78Gabor 65.01 15.23 19.74 0.24 138.74 22.17 0.93 0.90
Figure 3 MSE parameter measurement with image quality.
provides good results similar to the Adaptive Median but Midpoint havinghigher MSE value (11.34) in comparison the adaptive median. High valueof MSE means more error from the mean value. This filtering techniqueimproves the segmentation performance with the maintaining proper homo-geneity of the image. From all the above discussion, it can be concludedthat adaptive median filter provides better visualization after observing theall filtered image results. So any unknown image can be proceed through
70 C. Chakraborty and B. Gupta
Figure 4 PSNR parameter measurement with image quality.
Figure 5 SNR parameter measurement with image quality.
adaptive median filter and it gives better outcome in pre-processing module.This result has been validated by expert dermatologist. According to expertopinion, sharpness of a CW healing edge is preserved and can be visualizepredominantly.
5 Conclusion
In this paper, we have discussed about the 16 different filtering techniquesfor chronic wound analysis under tele-wound network. Furthermore, we havecompared all the parametric output for all filtering techniques. The acquired

Adaptive Filtering Technique for Chronic Wound Analysis 71
Figure 6 MAE parameter measurement with image quality.
Figure 7 MD parameter measurement with image quality.
wound images undergo filtering to remove the noise based on the optimalparameter for quality performance analysis. Simulated results have shown thatadaptive median filter is better for such noise removal than the other filters. Wehave presented a comparative study of all filters and selected best filter based onaverage values of set of all images. Results shows adaptive median providesbetter performances with respect to high PSNR (66.23) and reduced MSE(3.01), NAE (0.01), MAE (0.29), UIQI (0.99) between original and filteredimage. The overall system performances in pre-processing stage would have

72 C. Chakraborty and B. Gupta
Figure 8 NAE parameter measurement with image quality.
Figure 9 MSSIM parameter measurement with image quality.
been improved using adaptive filtering scheme. Outcome obtained manifeststhat the system has greater scope of utilization in the field of monitoring anddiagnosis of chronic wound through tele-wound network.
Acknowledgment
The authors would like to acknowledge Dr. Subhas C. Choudhary, Surgeon,Skin Specialist, Jharkhand, India, for his valuable opinion to carry outthis work.

Adaptive Filtering Technique for Chronic Wound Analysis 73
Figure 10 UIQI parameter measurement with image quality.
Figure 11 (a) Original Image, (b) Adaptive median, (c) Alpha Trim mean, (d) Average,(e) Butterworth, (f) Contra harmonic, (g) Gabor, (h) Median, (i) Gaussian, (j) Weiner,(k) Midpoint, (l) Mean, (m) Log, (n) Laplacian, (o) M3, (p) Max, (q) Min.

74 C. Chakraborty and B. Gupta
References
[1] Chakraborty C., Gupta B., Ghosh S.K., “Identification of Chronic WoundStatus under Tele-Wound Network through Smartphone, IGI GlobalInternational Journal of Rough Sets and Data Analysis,” Special issueon: Medical Image Mining for Computer-Aided Diagnosis, vol. 2, no. 2,pp. 56–75, 2015.
[2] Chakraborty C., Gupta B., Ghosh S.K., “Tele-wound monitoring throughsmartphone,” IEEE: Int. Conf. on Medical Imaging, m-Health andEmerging Communication Systems (MedCom), pp. 197–201, 2014.
[3] Gonzalez R., Richard W., “Digital Image Processing,” Addison-WesleyPublishing Company, 2001.
[4] Wild T., Prinz M., Fortner N., Krois W., Sahora K., Stremitzer S.,Hoelzenbein T., “Digital measurement and analysis of wounds basedon colour segmentation,” European Surgery, pp. 1–6, 2008.
[5] Christos P.L., Takis K., Michalis P., “Evaluation of wound healing processbased on texture image analysis,” Journal of Biomedical Graphics andComputing, vol. 3, no. 3, pp. 1–13, 2013.
[6] Lei W., Peder C.P., Diane S., Bengisu T., Emmanuel A., “Wound imageanalysis system for diabetics,” Medical Imaging, Proc. of SPIE, vol.8669, pp. 1–14, 2013.
[7] Barone S., Paoli A., Razionale A.V., “Assessment of chronic woundsby three-dimensional optical imaging based on integrating geometrical,chromatic, and thermal data,” Proc. of IMechE, vol. 225, no. 181,pp. 1–14, 2011.
[8] Éderson. A. G. D., Marco A. C., Frade1, Rangaraj M., Rangayyan, PauloM.,Azevedo M., “Segmentation and analysis of the tissue composition ofdermatological ulcers,” 23rd Canadian Conf. on Electrical and ComputerEngineering (CCECE), pp. 1–4, 2010.
[9] Marina K., Ales F., “Segmentation of wounds in the combined color-texture feature space,” SPIE, pp. 1–8, 2004.
[10] Dorra N.,Yves L., Sylvie T., Jolivot R., Marzani F., “Color and multispec-tral imaging for wound healing evaluation in the context of a comparativepreclinical study,” Medical Imaging, pp. 1–10, 2013.
[11] Chakraborty C., Gupta B., Ghosh S., “Mobile metadata assisted com-munity database of chronic wound,” Int. Journal of Wound Medicine,Elsevier, vol. 6, pp. 34–42, 2014.
[12] Chakraborty C., Gupta B., Ghosh S.K., “A Review on Telemedicine-Based WBAN Framework for Patient Monitoring,” Int. Journal of

Adaptive Filtering Technique for Chronic Wound Analysis 75
Telemedicine and e-Health, Mary Ann Libert inc., vol. 19, no. 8,pp. 619–626, 2013.
[13] Chakraborty C., Gupta B., Ghosh S.K., Das KD, Chakraborty C.,“Telemedicine Supported Chronic Wound Tissue Prediction Using Dif-ferent Classification Approach”, Journal of Medical Systems, vol. 40,no. 3, pp. 1–12, 2016.
[14] Arias-Castro E., Donoho D.L.,“Does median filtering truly preserveedges better than linear filtering,” Annals of Statistics, vol. 37, No. 3,pp. 1172, 2009.
[15] Perona P., Malik J., “Scale-space and edge detection using anisotropicdiffusion,” IEEE Transactions on Pattern Analysis and Machine Intelli-gence, vol. 12, No. 7, pp. 629–639, 1990.
[16] Brainard, D.H., Wandell, B.A., “Analysis of the retinex theory of colorvision,” JOSAA, Vol. 3, pp. 1651–1661, 1986.
[17] Wang, A.C. Bovik, Sheikh H.R., Simoncelli E.P., “Image quality assess-ment: From error visibility to structural similarity,” IEEE Trans. ImageProcess., vol. 13, no. 4, pp. 600–612, 2004.
[18] Poobal, S., Ravindran, G., “The performance of fractal image compres-sion on different imaging modalities using objective quality measures”International Journal of Engineering Science and Technology (IJEST),vol. 2, pp. 239–246, 2011.
Biographies
C. Chakraborty received the B.Tech. degree in Electronics and Communica-tion Engineering from Maulana Abul Kalam Azad University of Technology,India in 2006. From 2006 to 2007, he was with the Department of IndustrialEngineering and Management, Indian Institute of Technology, Kharagpur,India as a Research Consultant. He received the M.S. degree in Telecommu-nication Engineering from G. S. Sanyal School of Telecommunications, IITKharagpur, India in 2010. He is worked at ICFAI Univ., Agartala, India asSenior Lecturer. Currently He is working at Birla Institute of Technology,

76 C. Chakraborty and B. Gupta
Mesra, India as an Assistant Professor. His research interests include Internetof Medical Things, 5G, Telemedicine, and WBAN. He has published morethan 25 technical papers in various journals and conferences.
B. Gupta received B.E. and M.Tech. degrees in Electronics Engineeringfrom Govt. Engineering College of Ujjain, Madhya Pradesh, India and BirlaInstitute of Technology in 2000 and 2003 respectively. The Ph.D. degreehe received in the area of Wireless Communication from the Department ofMicroelectronics and Telecommunication at Univ. of Rome, Tor Vergata, Italy,in 2011. He is a senior member of IEEE and Member of IET. Dr. Gupta workedin Birla Institute of Technology, Mesra, from August 2004 till July, 2016.Presently, he has joined National Institute of Technology, Patna as a AssistantProfessor in Electronics and Communication Engineering department. Histeaching and research interests include UWB Communication, Energy Effi-cient MAC for WBAN, Vital Sign Monitoring and WSN. He has publishedmore than 40 technical papers in various journals and conferences.