adaptation of the performance failure appraisal inventory...
TRANSCRIPT
Ahi Evran Üniversitesi Kırşehir Eğitim Fakültesi Dergisi (KEFAD)
Cilt 17, Sayı 3, Aralık 2016, Sayfa 223-239
Adaptation of the Performance Failure Appraisal
Inventory (PFAI) into Turkish*
Nurcan KAHRAMAN1, Semra SUNGUR
2
Geliş Tarihi: 25.03.2016 Kabul Ediliş Tarihi: 09.11.2016
ABSTRACT The present study aimed at evaluate the psychometric properties of the 25-item
Performance Failure Appraisal Inventory (PFAI), developed by Conroy, 2001, for Turkish
middle school students to assess their fear of failure. The Turkish version of the PFAI was
administered to two independent samples. Sample 1 consisted of 211 and sample 2
consisted of 977 middle school students. Confirmatory factor analyses supported five-
factor structure of Turkish version of the PFAI. Reliabilities were deemed acceptable. In
addition, the five-factor PFAI was found to be invariant across gender. MANOVA results
revealed small to no significant gender differences with respect to the PFAI sub-scale
scores. Besides that, the canonical correlation analysis suggests that mastery avoidance,
performance avoidance and performance approach goals are positively related to all
dimensions of fear of failure. Although, mastery approach goals have a relationship
between fear of shame and embarrassment and fear of having uncertain future, the
strength of the relationship was small.
Keywords: Fear of failure, gender, performance failure appraisal inventory.
Performans Başarısızlık Değerlendirme Envanteri’nin
Türkçe’ye Uyarlanması*
ÖZ
Bu çalışma, Conroy (2001) tarafından başarısızlık korkusunu ölçmek için geliştirilen
Performans Başarısızlık Değerlendirme Envanteri’ nin Türkçe’ye uyarlamasının
yapılmasını amaçlamaktadır. Ortaokul öğrencileri üzerinde yapılan çalışmaya 211
ortaokul öğrencisi katılmıştır. Doğrulayıcı faktör analizi ölçeğin Türkçe versiyonunda 5
boyutlu yapısını doğruladı. Güvenilirlik sonuçları da kabul edilebilir seviyedeydi. Bunun
yanısıra, 5 faktörlü BDÖ cinsiyete göre değişmezlik göstermiştir. Kızlar ve erkekler
arasındaki başarısızlık korkusu MANOVA ile incelendiğinde ise, boyutlara göre küçük
farklılığın olduğu veya hiç anlamlı farklılığın olmadığı görülmüştür.
Anahtar kelimeler: Başarısızlık korkusu, Cinsiyet, Performans başarısızlık
değerlendirme envanteri.
INTRODUCTION
Achievement motivation, which refers to directing energy to a competence based
affect, explains the reasons of people’s motivation by two components; need for
* Bu çalışma ilk yazarın doktora tezinden uyarlanmıştır.
1 Yrd. Doç. Dr., Çanakkale Onsekiz Mart Üniversitesi, [email protected] 2 Prof. Dr., Orta Doğu Teknik Üniversitesi, [email protected]
224 Adaptation of the Performance Failure Appraisal… N. Kahraman, S. Sungur
achievement and fear of failure. Need for achievement refers to being motivated
to approach a positive possibility, to approach a success. Conversely, fear of
failure refers to being motivated to avoid a negative possibility, to avoid from a
failure (Elliot& Shledon, 1997; Elliot, 1999). Although fear of failure can bring
achievements especially for good performers, it can also cause people not to
demonstrate their full potential on a given subject. (Conroy, 2001; Conroy,
Willow, & Metzler, 2002). Fear of failure can arise from dwelling on past
negative experiences (Kesici& Erdoğan, 1999). Additionally, fear of failure is
related to negative affective outcomes, like test anxiety (Elliot & McGregor,
1999), and use of maladaptive cognitive strategies (Elliot & Thrash, 2004).
Researchers assessed fear of failure as a uni-dimensional construct in the past;
because little was known about why people worry, why they are afraid of being
unsuccessful (Conroy, 2001; Meece, Wigfield & Eccles, 1990). To elaborate the
knowledge about worry, Birney, Burdick, and Teevan (1969) proposed a three
dimensional fear of failure model. The model includes a) fear of devaluing one’s
self esteem, b) fear of non-ego punishment, and c) fear of reduced social value
(Conroy, 2001). Moreover, Conroy, Poczwardowski, and Henschen (2001)
enriched this model, and they defined five aversive consequences of failure: a)
experiencing shame and embarrassment, b) devaluing one’s self-estimate, c)
having an uncertain future, d) important others losing interest, and e) upsetting
important others. The first dimension of fear of failure, shame based fear of
failure, refers to people’s negative self-evaluations about themselves, in other
words they think that failure brings them shame and embarrassment, for that
reason they try to avoid from the failure. Secondly, some people can accuse
themselves for the failure. They can blame their talent, intelligence, etc. Hence,
the failure can cause to decrease in their self-confidence. The third possible
consequence of failure is fear of having uncertain future. Some people believe
that their future plans need to change after a failure, and these changes make
them see the future ambiguous. Another reason to fear of failure is fear of losing
interest. People who fear of losing interest believe that their value depends on
their success, and they also believe that if they cannot success, their value will
decrease for some people. According to them, failure brings loss social
influence. Lastly, people don’t want to be unsuccessful because they believe that
they will upset other people who are important for them, like their parents, or
their teachers (Conroy, 2001; Conroy, Willow, and Metzler, 2002). In line with
this revised model, Conroy (2001) developed the Performance Failure Appraisal
Inventory (PFAI) to assess individuals’ beliefs about consequences of failure. He
examined fear of failure in five subscales: the fear of shame and embarrassed, the
fear of devaluing one’s self estimate, the fear of having uncertain future, the fear
of losing social influence, and lastly the fear of upsetting important others.
During its development, Conroy (2001) tested the original instrument with 396
high school and college-aged students (167 females and 229 males) through
series of confirmatory factor analyses. The first confirmatory factor analysis was
conducted for the whole scale yielding the following fit indices: GFI= .77, CFI
=.87, RMSEA=.06, SRMR=.06. Then, separate CFAs for each of the sub-scale
Ahi Evran Ünv. Kırşehir Eğitim Fakültesi Dergisi (KEFAD), Cilt 17, Sayı 3, Aralık 2016 225
were performed. Concerning the reliability estimates, Cronbach’s alpha
coefficients were found to be .87 for the fear of shame and embarrassment, .75
for the fear of devaluing one’s self estimate, .73 for the fear of uncertain future,
.82 for the fear of losing social interest, and .87 for the fear of upsetting
important others.
Because the instrument was long with many reverse scored items, Conroy,
Willow, and Metzler (2002) revised the PFAI and developed a second version of
the PFAI by removing some of the items from the original version. The revised
version consists 25 items, consistent with the original version- in five-sub scales
namely, the fear of shame and embarrassed (7 items), the fear of devaluing one’s
self estimate (4 items), the fear of having uncertain future (4 items.), the fear of
losing social influence scale (5 items,), and the fear of upsetting important others
(5 items,). While revising the inventory, the researchers conducted validation
study with 438 college students (234 female, and 204 male). The internal
consistency reliabilities were .80 for the fear of shame and embarrassment, .74
for the fear of devaluing one’s self estimate, .80 for the fear of uncertain future,
.81 for the fear of losing social interest, and .78 for the fear of upsetting
important others. The developers also conduct the confirmatory factor analyses
(CFA) to assess the fit of the data. The results indicated a good data fit to the
model (GFI = .98, CFI = .95, RMSEA = .04, SRMR = .09). Thus, short version
of the PFAI was demonstrated to be a valid and reliable measure of fear of
failure.
Achievement Goals and Gender in relation to Fear of Failure
Researchers have shown that fear of failure has indirect effects on achievement
behavior such as choosing a task, showing effort and performance for the task. In
a sense, that fear has a domino effect; it affects directly the adaptation of
achievement goals, and from there achievement goals directly affect achievement
behaviour (Elliot& Church, 1997; Elliot& Sheldon, 1997; Elliot& McGregor,
1999; Conroy& Elliot, 2004; Elliot, Henry, Shell, & Maier, 2005). Since people
who desire to avoid failure are also likely to desire success, fear of failure is seen
as a predictor of not only avoidance goals, but also performance approach goals.
In brief, fear of failure is an antecedent of achievement goals (Elliot, 1999). To
illustrate, Elliot and Sheldon (1997) investigated that how fear of failure
influences the adoption of approach and avoidance achievement goals. The
researchers conducted the study using a trichotomous achievement goal
framework; mastery goals, performance approach goals, and performance
avoidance goals. Although, mastery goals and performance goals (approach
goals) were not differentiated in the study, both of them were examined as
approach goals. One hundred thirty-five undergraduate students (51male and 85
female) participated in the study. According to the results, there were positive
relationships between fear of failure and avoidance goals. Researchers also
concluded that fear of failure can be one of the antecedents of approach goals as
well.
226 Adaptation of the Performance Failure Appraisal… N. Kahraman, S. Sungur
In another study, Conroy and Elliot (2004) investigated the relationship between
fear of failure and achievement goals. Three hundred fifty-six undergraduates at
a large university participated in the study. Researchers used 25-item PFAI to
assess fear of failure. The results indicated that mastery-avoidance and
performance-avoidance achievement goals were positively associated with each
fear of failure appraisal score and each general fear of failure score. Additionally,
performance approach goals were positively associated with fears of
experiencing shame and embarrassment and also positively associated with
general fear of failure, of having an uncertain future, and of important others
losing interest.
In addition, Elliot and Murayama (2008) examined the effects of fear of failure
on adoption of achievement goals. Two hundred twenty-nine (76 male, 150
female, and 3 unspecified) undergraduate students participated the study. They
assessed students’ achievement goals by revising Achievement Goal
Questionnaire (Elliot& McGregor, 2001), and students’ fear of failure by short
form of Conroy’s (2001) PFAI. The results confirmed the previous ones. In other
words, students who have high fear of failure, tend to focus on avoiding word
grades, misunderstanding, and demonstrating themselves. Additionally, there
was no relationship between fear of failure and mastery approach goals.
To sum up, according to the research mentioned above, fear of failure has
observable direct effects on adoption of achievement goals. Researchers suggest
that approach and avoidance performance goals, along with mastery avoidance
goals, can emerge from fear of failure. Further, there were no relationships
between mastery approach goals and fear of failure. In conclusion, students with
high fear of failure want to achieve their goals, because they feel uncomfortable
of missing the point, not understanding, or looking stupid in front of their peers.
They wish to appear intelligent and skilled in front of others. Accordingly, a
positive relationship is expected to be found between students’ fear of failure and
students’ approach and avoidance performance goals, as well as mastery
avoidance goals.
Majority of research demonstrated that there is no gender difference with respect
to fear of failure. For example, Caraway, Tucker, Reinke and Hall (2003)
investigated the gender differences in fear of failure. 123 (61 boys, 62 girls) high
school students participated in the study. The General Fear of Failure Scale
(GFFS) was used to assess students’ fear of failure level. The results suggested
that there is no significant difference between boys and girls concerning fear of
failure. Additionally, studying with 219 (148 female, 71 male) college students,
Conroy, Elliot, and Pincus (2009) examined gender difference with respect to
fear of failure. The PFAI was used to assess students’ fear of failure. Results
demonstrated no gender difference in fear of failure. In another study, Massey
(2008) examined the differences in fear of failure among high school athletes. 95
athletes (53 males; 42 females) participated in the study. The researcher used the
PFAI to assess students’ fear of failure, and suggested that there is a significant
Ahi Evran Ünv. Kırşehir Eğitim Fakültesi Dergisi (KEFAD), Cilt 17, Sayı 3, Aralık 2016 227
difference in only one dimension of the fear of failure. According to the findings,
men experience fear of losing social influence more than women. Overall,
relevant literature suggested no gender difference for fear of failure.
Current Study
The present study aimed at adapting the 25-item PFAI into Turkish to assess
middle school students’ fear of failure. In order to provide validity evidences,
confirmatory factor analyses were conducted and the bivariate correlations
between the PFAI scores and achievement goals scores were examined.
Additionally, measurement invariance across gender was examined and gender
differences with respect to the PFAI scores were investigated. Cronbach’s alpha
coefficients were computed as reliability estimates.
METHOD
Sample
This study included two independent samples: Sample 1 consisted of 217 (110
boys and 101 girls) students attending public middle schools, Sample 2 consisted
of 977 middle school students. There were 494 girls and 483 boys in Sample 2.
Instruments
Performance Failure Appraisal Inventory (PFAI) The PFAI is a self-report instrument on a 5 point Likert scale originally
developed by Conroy (2001). The original instrument consisted of 41 items in
five sub-scales: the fear of shame and embarrassed, the fear of devaluing one’s
self estimate, the fear of having uncertain future, the fear of losing social
influence, and the fear of upsetting important others. Later, the instrument was
revised and 25-item short version of the PFAI was developed. Consistent with
the original version, short version of the PFAI measures fear of failure in five-
sub scales namely, the fear of shame and embarrassed (7 items; e.g. When I am
failing, it is embarrassing if others are there to see it”), the fear of devaluing
one’s self estimate (4 items, e.g. “When I am failing, I blame my lack of
talent”.), the fear of having uncertain future (4 items, e.g. “When I am failing,
my future seems uncertain”.), the fear of losing social influence scale (5 items,
e.g. “When I am not succeeding, people are less interested in me”), and lastly the
fear of upsetting important others (5 items, “When I am failing, it upsets
important others”).
Achievement Goal Questionnaire (AGQ) The AGQ is a self-report instrument developed by Elliot and Church (2001) to
assess students’ adoption of achievement goals. It consists of 15 items on a five-
point Likert scale ranging from strongly agree to strongly disagree. The AGQ
includes four sub scales: mastery approach goals (e.g. “I desire to completely
master the material that presented in this class”, n=3 items, α = .69), mastery
avoidance goals (e.g. “I just want to avoid doing poorly in this class”, n=3 items,
α = .67), performance approach goals (e.g. “It is important to me to do better
228 Adaptation of the Performance Failure Appraisal… N. Kahraman, S. Sungur
than other students”, n=3 items, α = .64) and performance avoidance goals (e.g.
“My goal for this class is to avoid performing poorly, n=6 items, α = .76). The
Turkish version of AGQ was translated and adapted into Turkish by Senler and
Sungur (2007). The confirmatory factor analysis results revealed a good model
fit for Turkish version of achievement goal questionnaire (GFI=.92, CFI=.92,
NFI=.90, SRMR=.07).
Procedure
In the present study, firstly, the PFAI was translated and adapted to Turkish. The
translated instrument was examined by two instructors from science education
department at the faculty of education for its content validity. The instructors
also judged the quality of items regarding clarity, sentence structure, and
comprehensiveness. Additionally, the grammar structure of the translation was
examined by one of the instructors from Academic Writing Center. Moreover,
middle school students’ opinions were gathered concerning the clarity of these
items. Then, the instrument was tested with middle school students.
RESULTS
Study 1
In order to validate the factor structure of the PFAI for Turkish sample,
confirmatory factor analysis was conducted. In evaluating model fit standardized
root mean square residual (SRMR), root mean square error of approximation
(RMSEA), comparative fit index (CFI), and non-normed fit index (NNFI) were
utilized. The following criteria were used to indicate goodness of fit: CFI and
NNFI .90 and higher, RMSEA .08 or lower, and SRMR .10 and lower,
(Bentler, 1990; Kline, 2005). Results revealed a good model fit (SRMR= .083;
RMSEA= .085; CFI= .913; NNFI=.902) and acceptable reliability coefficients
for each sub-scale. Reliability coefficients ranging from .64 to .85 were deemed
acceptable. However, reliability analysis revealed that one of the items from the
fear of devaluing one’s self estimate factor (Item 16: When I am not succeeding,
I am less valuable than when I succeed) did not contribute total variability well
with a corrected item-total correlation of .14. Although, lambda-ksi estimate for
this item was also low, remaining items had sufficiently large factor loadings and
the factor loadings of all 25 items were significant. Because, Item 16 contributes
to content validity, this item was decided be retained in the PFAI even though it
does not meet statistical criteria fully (Netemeyer, Bearden, & Sharma, 2003).
Study 2
The second pilot study was conducted with 977 middle school students. The
factor structure of 25-item PFAI was tested again using this new sample and
measurement invariance across gender was examined. Additionally, gender
difference was explored with respect to the PFAI sub-scales. Moreover, bivariate
correlations among PFAI sub-scale scores and the AGQ scores were examined to
provide further validity evidence. Finally, reliability estimates were computed.
Ahi Evran Ünv. Kırşehir Eğitim Fakültesi Dergisi (KEFAD), Cilt 17, Sayı 3, Aralık 2016 229
Confirmatory Factor Analyses
The results of study revealed a good model fit and high reliability coefficients for
each sub scale and reliability coefficients were deemed acceptable, ranging from
.70 to .86. However, reliability analysis revealed that one of the items from the
fear of devaluing one’s self estimate factor (Item 16: When I am not succeeding,
I am less valuable than when I succeed) did not contribute total variability well
with a corrected item-total correlation of .14. Although, lambda-ksi estimate for
this item was also low, remaining items had sufficiently large factor loadings and
the factor loadings of all 25 items were significant. Because, Item 16 contributes
to content validity, this item was decided be retained in the PFAI even though it
does not meet statistical criteria fully (Netemeyer, Bearden, & Sharma, 2003).
In order to validate the factor structure of the PFAI for Turkish sample,
confirmatory factor analysis was conducted. In evaluating model fit standardized
root mean square residual (SRMR), root mean square error of approximation
(RMSEA), comparative fit index (CFI), and non-normed fit index (NNFI) were
utilized. Results revealed a good model fit for the expected five-factor structure
(SRMR= .070; RMSEA= .087; CFI= .957; NNFI=.951). The t values across
measurement items ranged from 9.34 to 27.02 (p< .05). Standardized pattern
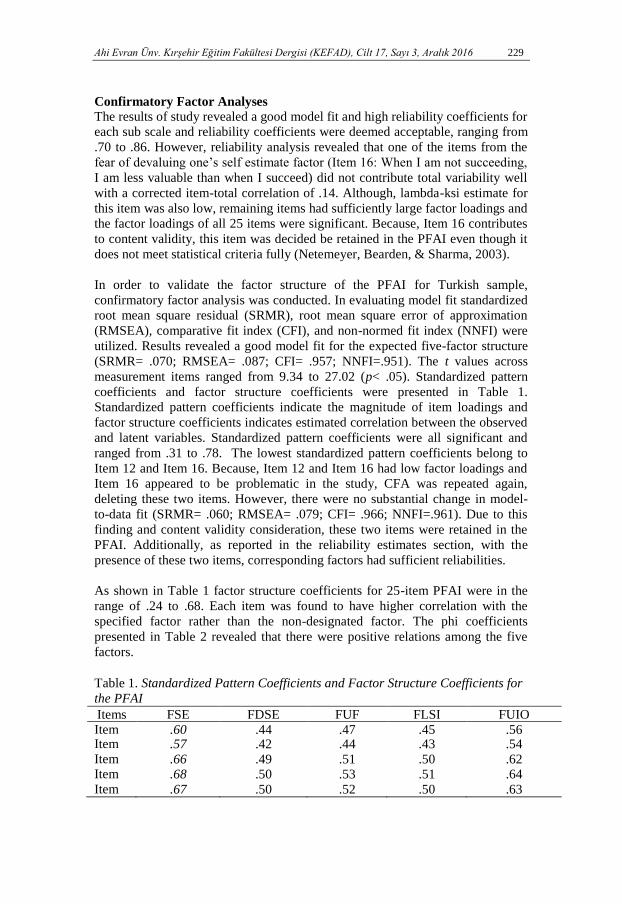
coefficients and factor structure coefficients were presented in Table 1.
Standardized pattern coefficients indicate the magnitude of item loadings and
factor structure coefficients indicates estimated correlation between the observed
and latent variables. Standardized pattern coefficients were all significant and
ranged from .31 to .78. The lowest standardized pattern coefficients belong to
Item 12 and Item 16. Because, Item 12 and Item 16 had low factor loadings and
Item 16 appeared to be problematic in the study, CFA was repeated again,
deleting these two items. However, there were no substantial change in model-
to-data fit (SRMR= .060; RMSEA= .079; CFI= .966; NNFI=.961). Due to this
finding and content validity consideration, these two items were retained in the
PFAI. Additionally, as reported in the reliability estimates section, with the
presence of these two items, corresponding factors had sufficient reliabilities.
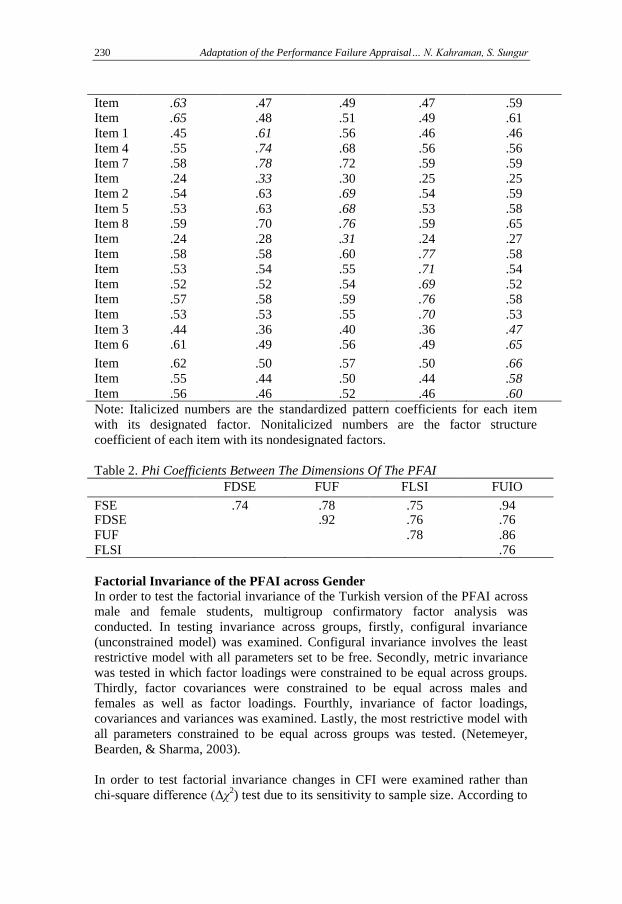
As shown in Table 1 factor structure coefficients for 25-item PFAI were in the
range of .24 to .68. Each item was found to have higher correlation with the
specified factor rather than the non-designated factor. The phi coefficients
presented in Table 2 revealed that there were positive relations among the five
factors.
Table 1. Standardized Pattern Coefficients and Factor Structure Coefficients for
the PFAI
Items FSE FDSE FUF FLSI FUIO Item
10
.60 .44 .47 .45 .56 Item
15
.57 .42 .44 .43 .54 Item
18
.66 .49 .51 .50 .62 Item
20
.68 .50 .53 .51 .64 Item
22
.67 .50 .52 .50 .63
230 Adaptation of the Performance Failure Appraisal… N. Kahraman, S. Sungur
Item
24
.63 .47 .49 .47 .59 Item
25
.65 .48 .51 .49 .61
Item 1 .45 .61 .56 .46 .46
Item 4 .55 .74 .68 .56 .56 Item 7 .58 .78 .72 .59 .59 Item
16
.24 .33 .30 .25 .25 Item 2 .54 .63 .69 .54 .59
Item 5 .53 .63 .68 .53 .58 Item 8 .59 .70 .76 .59 .65 Item
12
.24 .28 .31 .24 .27 Item
11
.58 .58 .60 .77 .58 Item
13
.53 .54 .55 .71 .54 Item
17
.52 .52 .54 .69 .52 Item
21
.57 .58 .59 .76 .58 Item
23
.53 .53 .55 .70 .53
Item 3 .44 .36 .40 .36 .47 Item 6 .61 .49 .56 .49 .65
Item
29
.62 .50 .57 .50 .66 Item
14
.55 .44 .50 .44 .58 Item
19
.56 .46 .52 .46 .60
Note: Italicized numbers are the standardized pattern coefficients for each item
with its designated factor. Nonitalicized numbers are the factor structure
coefficient of each item with its nondesignated factors.
Table 2. Phi Coefficients Between The Dimensions Of The PFAI
FDSE FUF FLSI FUIO
FSE .74 .78 .75 .94 FDSE .92 .76 .76
FUF .78 .86 FLSI .76
Factorial Invariance of the PFAI across Gender
In order to test the factorial invariance of the Turkish version of the PFAI across
male and female students, multigroup confirmatory factor analysis was
conducted. In testing invariance across groups, firstly, configural invariance
(unconstrained model) was examined. Configural invariance involves the least
restrictive model with all parameters set to be free. Secondly, metric invariance
was tested in which factor loadings were constrained to be equal across groups.
Thirdly, factor covariances were constrained to be equal across males and
females as well as factor loadings. Fourthly, invariance of factor loadings,
covariances and variances was examined. Lastly, the most restrictive model with
all parameters constrained to be equal across groups was tested. (Netemeyer,
Bearden, & Sharma, 2003).
In order to test factorial invariance changes in CFI were examined rather than
chi-square difference (Δχ2) test due to its sensitivity to sample size. According to
Ahi Evran Ünv. Kırşehir Eğitim Fakültesi Dergisi (KEFAD), Cilt 17, Sayı 3, Aralık 2016 231
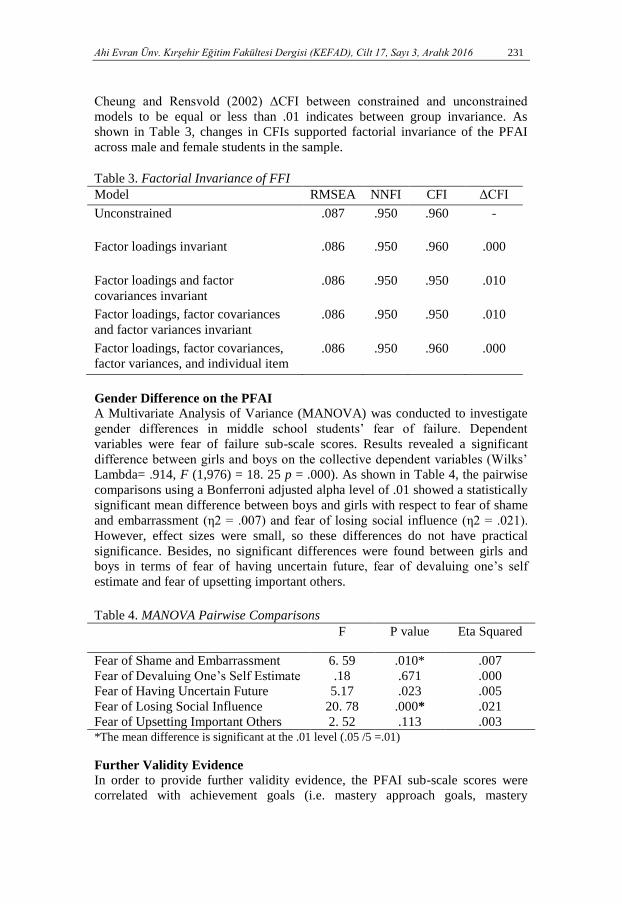
Cheung and Rensvold (2002) ΔCFI between constrained and unconstrained
models to be equal or less than .01 indicates between group invariance. As
shown in Table 3, changes in CFIs supported factorial invariance of the PFAI
across male and female students in the sample.
Table 3. Factorial Invariance of FFI
Model RMSEA NNFI CFI ΔCFI
Unconstrained .087 .950 .960 -
Factor loadings invariant .086 .950 .960 .000
Factor loadings and factor
covariances invariant
.086 .950 .950 .010
Factor loadings, factor covariances
and factor variances invariant
.086 .950 .950 .010
Factor loadings, factor covariances,
factor variances, and individual item
error terms invariant
.086 .950 .960 .000
Gender Difference on the PFAI
A Multivariate Analysis of Variance (MANOVA) was conducted to investigate
gender differences in middle school students’ fear of failure. Dependent
variables were fear of failure sub-scale scores. Results revealed a significant
difference between girls and boys on the collective dependent variables (Wilks’
Lambda= .914, F (1,976) = 18. 25 p = .000). As shown in Table 4, the pairwise
comparisons using a Bonferroni adjusted alpha level of .01 showed a statistically
significant mean difference between boys and girls with respect to fear of shame
and embarrassment (η2 = .007) and fear of losing social influence (η2 = .021).
However, effect sizes were small, so these differences do not have practical
significance. Besides, no significant differences were found between girls and
boys in terms of fear of having uncertain future, fear of devaluing one’s self
estimate and fear of upsetting important others.
Table 4. MANOVA Pairwise Comparisons
F P value Eta Squared
Fear of Shame and Embarrassment 6. 59 .010* .007
Fear of Devaluing One’s Self Estimate .18 .671 .000
Fear of Having Uncertain Future 5.17 .023 .005
Fear of Losing Social Influence 20. 78 .000* .021
Fear of Upsetting Important Others 2. 52 .113 .003 *The mean difference is significant at the .01 level (.05 /5 =.01)
Further Validity Evidence
In order to provide further validity evidence, the PFAI sub-scale scores were
correlated with achievement goals (i.e. mastery approach goals, mastery
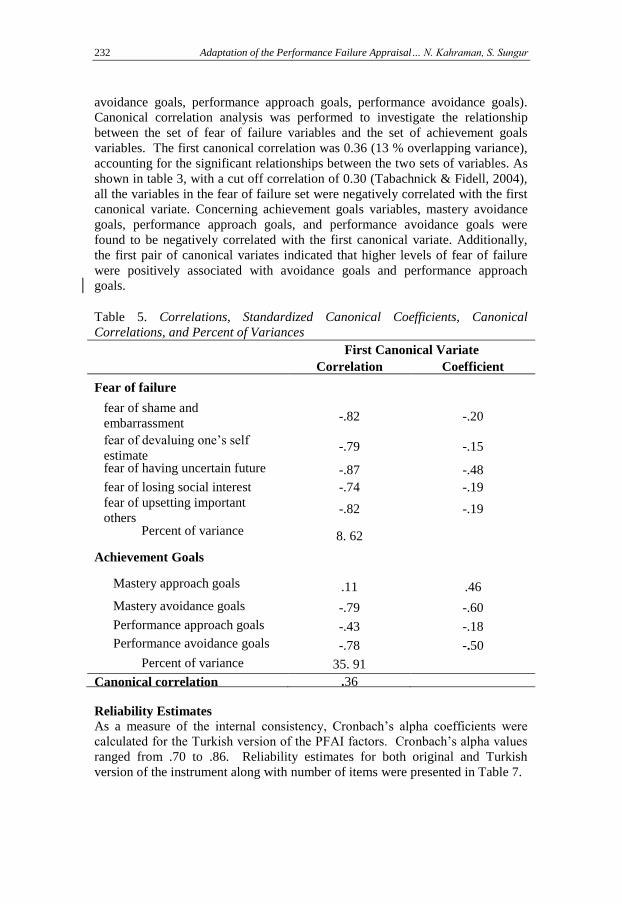
232 Adaptation of the Performance Failure Appraisal… N. Kahraman, S. Sungur
avoidance goals, performance approach goals, performance avoidance goals).
Canonical correlation analysis was performed to investigate the relationship
between the set of fear of failure variables and the set of achievement goals
variables. The first canonical correlation was 0.36 (13 % overlapping variance),
accounting for the significant relationships between the two sets of variables. As
shown in table 3, with a cut off correlation of 0.30 (Tabachnick & Fidell, 2004),
all the variables in the fear of failure set were negatively correlated with the first
canonical variate. Concerning achievement goals variables, mastery avoidance
goals, performance approach goals, and performance avoidance goals were
found to be negatively correlated with the first canonical variate. Additionally,
the first pair of canonical variates indicated that higher levels of fear of failure
were positively associated with avoidance goals and performance approach
goals.
Table 5. Correlations, Standardized Canonical Coefficients, Canonical
Correlations, and Percent of Variances
First Canonical Variate
Correlation Coefficient
Fear of failure
fear of shame and
embarrassment -.82 -.20
fear of devaluing one’s self
estimate -.79 -.15
fear of having uncertain future -.87 -.48
fear of losing social interest -.74 -.19
fear of upsetting important
others -.82 -.19
Percent of variance 8. 62
Achievement Goals
Mastery approach goals .11 .46
Mastery avoidance goals -.79 -.60
Performance approach goals -.43 -.18
Performance avoidance goals -.78 -.50
Percent of variance 35. 91
Canonical correlation .36
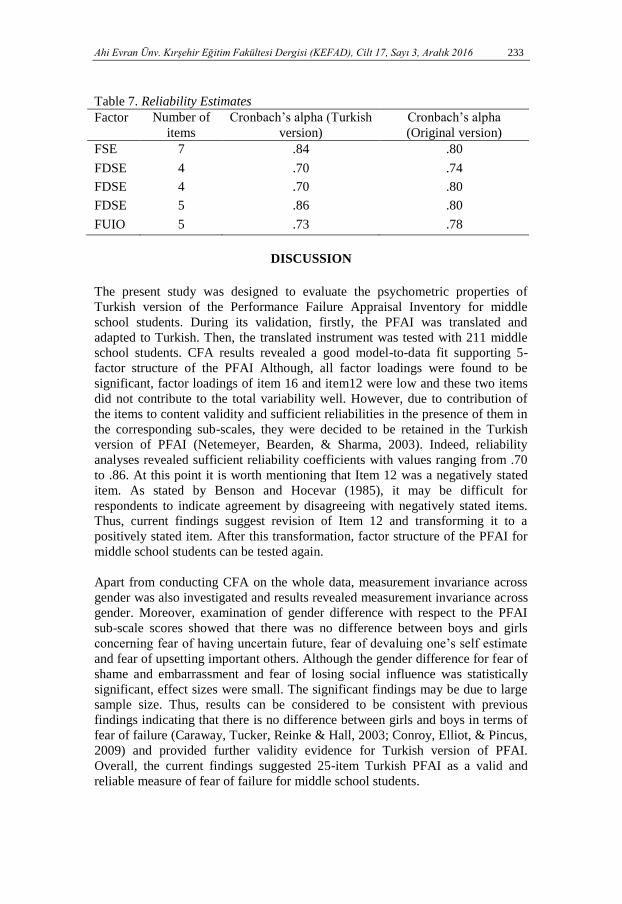
Reliability Estimates
As a measure of the internal consistency, Cronbach’s alpha coefficients were
calculated for the Turkish version of the PFAI factors. Cronbach’s alpha values
ranged from .70 to .86. Reliability estimates for both original and Turkish
version of the instrument along with number of items were presented in Table 7.
Ahi Evran Ünv. Kırşehir Eğitim Fakültesi Dergisi (KEFAD), Cilt 17, Sayı 3, Aralık 2016 233
Table 7. Reliability Estimates
Factor Number of
items
Cronbach’s alpha (Turkish
version)
Cronbach’s alpha
(Original version)
FSE 7 .84 .80
FDSE 4 .70 .74
FDSE 4 .70 .80
FDSE 5 .86 .80
FUIO 5 .73 .78
DISCUSSION
The present study was designed to evaluate the psychometric properties of
Turkish version of the Performance Failure Appraisal Inventory for middle
school students. During its validation, firstly, the PFAI was translated and
adapted to Turkish. Then, the translated instrument was tested with 211 middle
school students. CFA results revealed a good model-to-data fit supporting 5-
factor structure of the PFAI Although, all factor loadings were found to be
significant, factor loadings of item 16 and item12 were low and these two items
did not contribute to the total variability well. However, due to contribution of
the items to content validity and sufficient reliabilities in the presence of them in
the corresponding sub-scales, they were decided to be retained in the Turkish
version of PFAI (Netemeyer, Bearden, & Sharma, 2003). Indeed, reliability
analyses revealed sufficient reliability coefficients with values ranging from .70
to .86. At this point it is worth mentioning that Item 12 was a negatively stated
item. As stated by Benson and Hocevar (1985), it may be difficult for
respondents to indicate agreement by disagreeing with negatively stated items.
Thus, current findings suggest revision of Item 12 and transforming it to a
positively stated item. After this transformation, factor structure of the PFAI for
middle school students can be tested again.
Apart from conducting CFA on the whole data, measurement invariance across
gender was also investigated and results revealed measurement invariance across
gender. Moreover, examination of gender difference with respect to the PFAI
sub-scale scores showed that there was no difference between boys and girls
concerning fear of having uncertain future, fear of devaluing one’s self estimate
and fear of upsetting important others. Although the gender difference for fear of
shame and embarrassment and fear of losing social influence was statistically
significant, effect sizes were small. The significant findings may be due to large
sample size. Thus, results can be considered to be consistent with previous
findings indicating that there is no difference between girls and boys in terms of
fear of failure (Caraway, Tucker, Reinke & Hall, 2003; Conroy, Elliot, & Pincus,
2009) and provided further validity evidence for Turkish version of PFAI.
Overall, the current findings suggested 25-item Turkish PFAI as a valid and
reliable measure of fear of failure for middle school students.
234 Adaptation of the Performance Failure Appraisal… N. Kahraman, S. Sungur
For external validity, correlations were computed between the PFAI sub-scale
scores and achievement goals scores. Results showed that all dimensions of fear
of failure were positively related to avoidance goals and performance approach
goals. The PFAI sub-scale scores were found to show stronger correlations with
both mastery avoidance and performance avoidance goals than with performance
approach goals. There were no correlation between PFAI sub-scale scores and
mastery approach goals. In other words, students with high fear of failure want to
achieve their goals in science, because they feel uncomfortable of missing the
point, not understanding, or looking stupid in front of their peers. They wish to
appear intelligent and skilled in front of others. Relevant literature also suggests
parallel results with the current one. For instance, Conroy and Elliot (2004)
investigated the relationship between fear of failure and achievement goals and
suggest that mastery-avoidance and performance-avoidance achievement goals
were positively associated with each fear of failure appraisal score. Besides that,
performance approach goals were positively associated with fears of
experiencing shame and embarrassment and also positively associated with
general fear of failure. In a recent study, Elliot and Murayama (2008) confirmed
the previous results about students’ achievement goals’ relation to their fear of
failure. In other words, students who have high fear of failure, tend to focus on
avoiding word grades, misunderstanding, and demonstrating themselves.
Additionally, there was no relationship between fear of failure and mastery
approach goals.
Overall, the current findings suggested 25-item Turkish PFAI as a valid and
reliable measure of fear of failure for middle school students. Future studies can
examine the location of fear of failure in a nomological network with other
theoretically relevant constructs such as anxiety, self-efficacy, and performance.
REFERENCES
Benson, J.,& Hocevar, D. (1985). The impact of item phrasing on the validity of attitude
scales for elementary school children. Journal of Educational Measurement, 22,
213-240.
Bentler, P.M. (1990), "Comparative Fit Indexes in Structural Models," Psychological
Bulletin, 107 (2), 238-46.
Birney, R. C., Burdick, H., & Teevan, R. C. (1969). Fear of failure. New York: Van
Nostrand-Reinhold Company.
Caraway K., Tucker C. M., Reinke W. M.& Hall C. (2003). Self-efficacy, goal
orientation, and fear of failure as predictors of school engagement in high school
students. Psychology in the Schools, 40, 417–427.
Cheung, G. W., & Rensvold, R. B. (2002). Evaluating goodness-of-fit indexes for testing
measurement invariance. Structural Equation Modeling, 9(2), 233-255.
Conroy, D.E., (2001). Progress in the development of a multidimensional measure of fear
of failure: the performance failure appraisal inventory (PFAI). Anxiety, Stress, and
Coping, 14, 431-452.
Conroy, D.E., Poczwardowski, A., & Henschen, K.P. (2001). Evaluative criteria and
consequences associated with failure and success in elite athletes and performing
artists. Journal of Applied Sport Psychology, 13, 300-322.
Ahi Evran Ünv. Kırşehir Eğitim Fakültesi Dergisi (KEFAD), Cilt 17, Sayı 3, Aralık 2016 235
Conroy, D.E., Willow, J.P., & Metzler, J.N. (2002). Multidimensional measurement of
fear of failure: The Performance Failure Appraisal Inventory (PFAI). Anxiety,
Stress & Coping, 14, 431-52.
Conroy, D.E., Metzler, J.N and Hofer, S.M. (2003). Factorial invariance and latent mean
stability of performance failure appraisals. Structural Equation Modeling, 10,
401- 422.
Conroy, D.E., & Elliot, A.J., (2004). Fear of failure and achievement goals in sport:
adressing the issue of the chicken and the egg. Anxiety, Stress, and Coping, 17(3),
271-285.
Conroy, D.E., Elliot, A.J.,& Pincus, A.L. (2009). The expression of achievement motives
in interpersonal problems. Journal of Personality, 77(2), 495-526.
Elliot, A.J.& Church, M.A. (1997). A hierarchical model of approach and avoidance
achievement motivation. Journal of Personality and Social Psychology, 72, 218-
232
Elliot, A.J., & Sheldon, K.M. (1997). Avoidance achievement motivation: A personal
goals analysis. Journal of Personality and Social Psychology, 73, 171-185.
Elliot, A.J., & McGregor, H.A. (1999). Test anxiety and the hierarchical model of
approach and avoidance achievement motivation. Journal of Personality and
Social Psychology, 76, 628-644.
Elliot, A.J.& Thrash, T.M. (2001). Achievement goals and hierarchical of achievement
motivation. Educational Psychology Review, 13, 139-156.
Elliot, A., J.,& McGredor, H., A. (2001). A 2*2 Achievement goal framework. Journal of
personality and social psycology, 80, 50-519.
Elliot, A.J., & Thrash, T.M. (2004). The intergenerational transmission of fear of failure.
Personality and Social Psychology Bulletin, 30, 957-971.
Elliot, A. J., & Murayama, K. (2008). On the measurement of achievement goals:
Critique, illustration, and application. Journal of Educational Psychology, 100,
613-628.
Kesici, Ş. & Erdoğan, A. (2009). Predicting college students’ mathematics anxiety by
motivational beliefs and selp-regulated learning strategies. College Student
Journal, 43B(2), 631-642.
Kline, R.B. (2005), Principles and Practice of Structural Equation Modeling (2nd Edition
ed.). New York: The Guilford Press.
Massey, W. V. (2008). Differences in Shame Coping Styles and Fear of Failure Among
High School Aged Athletes. Southern Illinois University Carbondale.
Meece, J.L., Wigfield, A., Eccles, J.S. (1990). Predictors of math anxiety and its influence
on young adolescents' course enrollment intentions and performance in
mathematics. Journal of Educational Psychology, 82(1), 60-70.
Netemeyer, R.G., Bearden, W. O., & Sharma, S. (2003) Scaling procedures: Issues and
applications. Thousand Oaks, CA: Sage Publications, Inc.
Senler, B., & Sungur, S. (2007, November) Translation and adaptation of achievement
goals questionnaire to Turkish. Paper presented at 1. Ulusal Ilkogretim Kongresi,
Ankara, Turkey
236 Adaptation of the Performance Failure Appraisal… N. Kahraman, S. Sungur
GENİŞ ÖZET
Belirli bir yetkinliğe ulaşmak için gösterilen çaba olarak tanımlanabilen başarı
motivasyonu, bireylerin güdülenme sebeplerini iki unsur ile açıklar: başarı
ihtiyacı ve başarısızlık korkusu. Başarı ihtiyacı pozitif bir olasılık için motive
olmayı ifade ederken, başarısızlık korkusu ise negatif bir sonuçtan,
başarısızlıktan kaçınmak için motive olmak anlamındadır (Elliot& Shledon,
1997; Elliot, 1999). Başarısızlık korkusu bireylere, özellikle iyi performans
sergileyen bireylere, başarı getirebilirken aynı zamanda bireylerin verilen bir
görevde tüm potansiyellerini sergileyememesine de sebep olabilir. (Conroy,
2001; Conroy, Willow, and Metzler, 2002). Geçmişte yaşanan negatif olaylar
sonucu ortaya çıkabilen (Kesici& Erdoğan, 1999) başarısızlık korkusu negatif
duyuşsal sonuçlar (Elliot & McGregor, 1999) ve olumsuz bilişsel stratejiler ile
ilişkilidir (Elliot & Thrash, 2004).
Araştırmacılar geçmişte başarısızlık korkusunu tek boyutlu kavram olarak
ölçüyorlardı; çünkü bireylerin niçin kaygılandıkları ve başarısızlıktan niçin
korktukları hakkında çok az bilgi mevcuttu (Meece, Wigfield& Eccles, 1990;
Conroy, 2001). Birney, Burdick, ve Teevan (1969) kaygıyı daha detaylı bir
şekilde incelemek için 3 boyutlu başarısızlık korkusu modeli önermiştir. Bu
boyutlar; a) Özsaygı değerinin düşeceği korkusu b) gelecek belirsizliği korkusu
c) sosyal değerinin düşeceği korkusu. Conroy, Poczwardowski ve Henschen
(2001) bu modeli zenginleştirdiler ve başarısızlık korkusunun altında yatan beş
tane olası sonuç tanımlamışlardır: a) Utanç ve mahcubiyet b) Özsaygı değerinin
düşmesi c) gelecek belirsizliği d) Sosyal ilgiyi kaybetme e) Diğer kişileri hayal
kırıklığına uğratma. (Conroy, 2001; Conroy, Willow, and Metzler, 2002;
Conroy, Metzler, and Hofer, 2003; Conroy& Elliot, 2004). Bu model
doğrultusunda, Conroy (2001) bireylerin başarısızlığın sonuçları hakkındaki
inançlarını ölçmek için Performans Başarısızlık Değerlendirme Envanteri
geliştirmiştir. Ölçek başarısızlık korkusunu 5 boyutta incelemektedir: a) Utanç
ve mahcubiyet korkusu b) Özsaygı değerinin düşeceği korkusu c) Gelecek
belirsizliği korkusu d) Sosyal ilgiyi kaybetme korkusu e) Diğer kişileri hayal
kırıklığına uğratma korkusu. Fazla sayıda tersten puanlanan madde içermesi ve
uzunluğu sebebiyle Conroy, Willow ve Metzler (2002) ölçeği tekrar gözden
geçirmiş ve bazı maddeleri çıkartarak güncellemişlerdir. Bu haliyle ölçek 25
maddeden ve beş boyuttan oluşmaktadır. Boyutlar, ilk ölçek ile aynı boyutlardır:
Utanç ve mahcubiyet korkusu (7 madde), Öz saygı değerinin düşeceği korkusu
(4 madde), geleceğin belirsizliği (4 madde), Sosyal ilgiyi kaybetme (5 madde)
Diğer kişileri hayal kırıklığına uğratmak (5 madde). Güncellenen ölçeğin
geçerlilik çalışmaları 438 üniversite öğrencisi (234 kadın, 204 erkek) ile
yapılmıştır. Boyutların Cronbach alfa değerleri ise; utanç ve mahcubiyet korkusu
için .80, öz saygı değerinin düşeceği korkusu için .74, gelecek belirsizliği için
.80, sosyal ilgiyi kaybetme boyutu için .78, diğer kişileri hayal kırıklığına
uğratmak boyutu için ise .78 olarak hesaplanmıştır. DFA sonuçlarına göre de
model iyi uyum indekslerine sahiptir (GFI=.98, CFI=.95, RMSEA=.04,
SRMR=.09). Sonuç olarak, ölçek başarısızlık korkusunu ölçmek için geçerli ve
Ahi Evran Ünv. Kırşehir Eğitim Fakültesi Dergisi (KEFAD), Cilt 17, Sayı 3, Aralık 2016 237
güvenilirdir. Bu çalışma 25 maddelik, Performans Başarısızlık Değerlendirme
Envanteri’nin ortaokul öğrencilerinin başarısızlık korkusunu ölçmesi açısından
Türkçe’ ye adaptasyonunu yapmayı amaçlamaktadır.
Bu çalışma 2 bağımsız örneklem içermektedir. Örneklem 1 217, örneklem 2 ise
977 ortaokul öğrencisinden oluşmaktadır.
Ölçme araçları
Performans Başarısızlık Değerlendirme Envanteri
Conroy (2001) tarafından geliştirilip, Conroy, Willow ve Metzler (2002)
tarafından güncellenen 25 maddelik bir ölçektir. 5’li Likert yapıya sahiptir.
Hedef Yönelimi Ölçeği
Öğrencilerin hedef yönelimlerini ölçmek için Elliot ve Church (2001) tarafından
geliştirilen ölçek 15 maddeden oluşmaktadır. “Kesinlikle katılıyorum”dan
“kesinlikle katılmıyorum”a doğru giden 5’li Likert yapıya sahiptir. Ölçeğin dört
alt boyutu vardır: öğrenme yaklaşma hedefleri, öğrenme kaçınma hedefleri,
performans yaklaşma hedefleri ve performans kaçınma hedefleri.
Doğrulayıcı faktör analizi indeksleri model ile iyi uyum -vermiştir (SRMR=
.083; RMSEA= .085; CFI= .913; NNFI=.902). Ayrıca her bir boyut için
güvenirlik katsayıları, .64 ila .85 arası, kabul edilebilir seviyededir. Ölçeğin
Türkçe versiyonunun kız ve erkek öğrenciler açısından faktörel değişmezliğini
incelemek için, çoklu grup doğrulayıcı faktör analizi yapılmıştır. Gruplar arası
değişmezliği test etmek için öncelikle yapısal eşdeğerlik (yapılandırılmamış
model) incelenmiştir. Yapısal eşdeğerlik tüm parametrelerin serbestçe
tanımlandığı en az kısıtlayıcı modeli içermektedir. İkinci olarak, tüm faktör
yüklerinin gruplar arasında eşit bir şekilde yapılandığı metrik değişmezliği test
edilmiştir. Üçüncü adım olarak ise faktör kovaryansları gruplar arasında eşit
olarak yapılandırıldı. Dördüncü adım olarak faktör yüklerindeki,
kovaryanslarındaki ve varyanslarındaki değişmezlik incelenmiştir. Son olarak,
tüm parametreleri gruplar arasında eşit olarak içeren en az kısıtlayıcı model test
edilmiştir (Netemeyer, Bearden, & Sharma, 2003).
Faktöriyel değişmezlik, örneklem sayısındaki duyarlılığı sebebiyle ki-kare
farklılığı (Δχ2) yerine doğrulayıcı faktör analizindeki değişiklik (ΔDFI) olarak
incelendi. Cheung ve Rensvold (2002) yapılandırılmış ve yapılandırılmamış
modeller arasındaki ΔDFI değerinin .01 veya daha düşük olmasının grup
değişmezliğini gösterdiğini söylemektedir.
Çalışma bulguları ölçeğin geçerliliğini desteklemektedir. Sonuç olarak, bu
çalışma Performans Başarısızlık Değerlendirme Envanterinin, Türkçe versiyonun
ortaokul öğrencilerinin başarısızlık korkusunu ölçmek için geçerli ve güvenilir
olduğunu önermektedir.
238 Adaptation of the Performance Failure Appraisal… N. Kahraman, S. Sungur
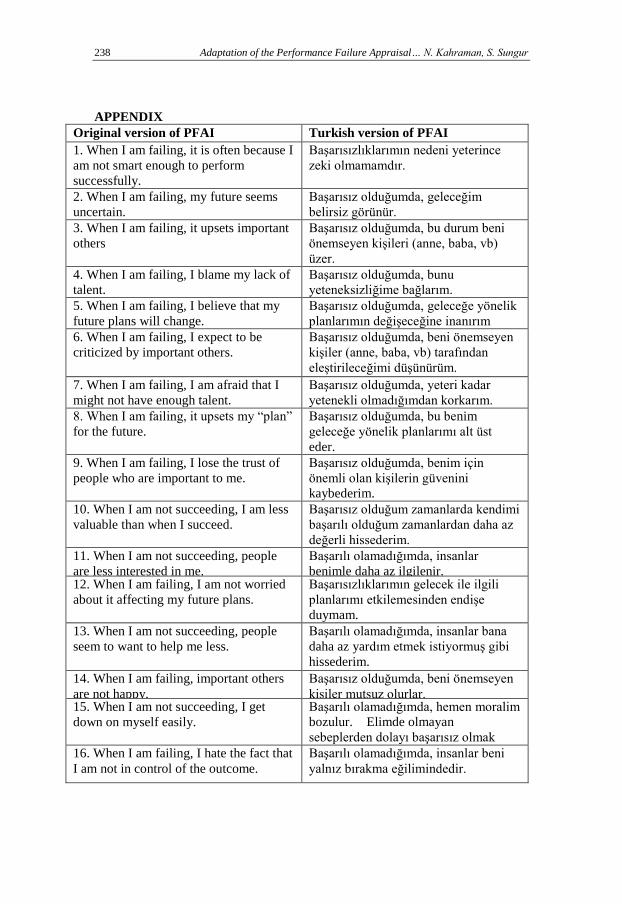
APPENDIX
Original version of PFAI Turkish version of PFAI
1. When I am failing, it is often because I
am not smart enough to perform
successfully.
Başarısızlıklarımın nedeni yeterince
zeki olmamamdır.
2. When I am failing, my future seems
uncertain.
Başarısız olduğumda, geleceğim
belirsiz görünür.
3. When I am failing, it upsets important
others
Başarısız olduğumda, bu durum beni
önemseyen kişileri (anne, baba, vb)
üzer.
4. When I am failing, I blame my lack of
talent.
Başarısız olduğumda, bunu
yeteneksizliğime bağlarım.
5. When I am failing, I believe that my
future plans will change.
Başarısız olduğumda, geleceğe yönelik
planlarımın değişeceğine inanırım
6. When I am failing, I expect to be
criticized by important others.
Başarısız olduğumda, beni önemseyen
kişiler (anne, baba, vb) tarafından
eleştirileceğimi düşünürüm.
7. When I am failing, I am afraid that I
might not have enough talent.
Başarısız olduğumda, yeteri kadar
yetenekli olmadığımdan korkarım.
8. When I am failing, it upsets my “plan”
for the future.
Başarısız olduğumda, bu benim
geleceğe yönelik planlarımı alt üst
eder.
9. When I am failing, I lose the trust of
people who are important to me.
Başarısız olduğumda, benim için
önemli olan kişilerin güvenini
kaybederim.
10. When I am not succeeding, I am less
valuable than when I succeed.
Başarısız olduğum zamanlarda kendimi
başarılı olduğum zamanlardan daha az
değerli hissederim.
11. When I am not succeeding, people
are less interested in me.
Başarılı olamadığımda, insanlar
benimle daha az ilgilenir. 12. When I am failing, I am not worried
about it affecting my future plans.
Başarısızlıklarımın gelecek ile ilgili
planlarımı etkilemesinden endişe
duymam.
13. When I am not succeeding, people
seem to want to help me less.
Başarılı olamadığımda, insanlar bana
daha az yardım etmek istiyormuş gibi
hissederim.
14. When I am failing, important others
are not happy.
Başarısız olduğumda, beni önemseyen
kişiler mutsuz olurlar. 15. When I am not succeeding, I get
down on myself easily.
Başarılı olamadığımda, hemen moralim
bozulur. Elimde olmayan
sebeplerden dolayı başarısız olmak
beni rahatsız eder. 16. When I am failing, I hate the fact that
I am not in control of the outcome.
Başarılı olamadığımda, insanlar beni
yalnız bırakma eğilimindedir.
Ahi Evran Ünv. Kırşehir Eğitim Fakültesi Dergisi (KEFAD), Cilt 17, Sayı 3, Aralık 2016 239
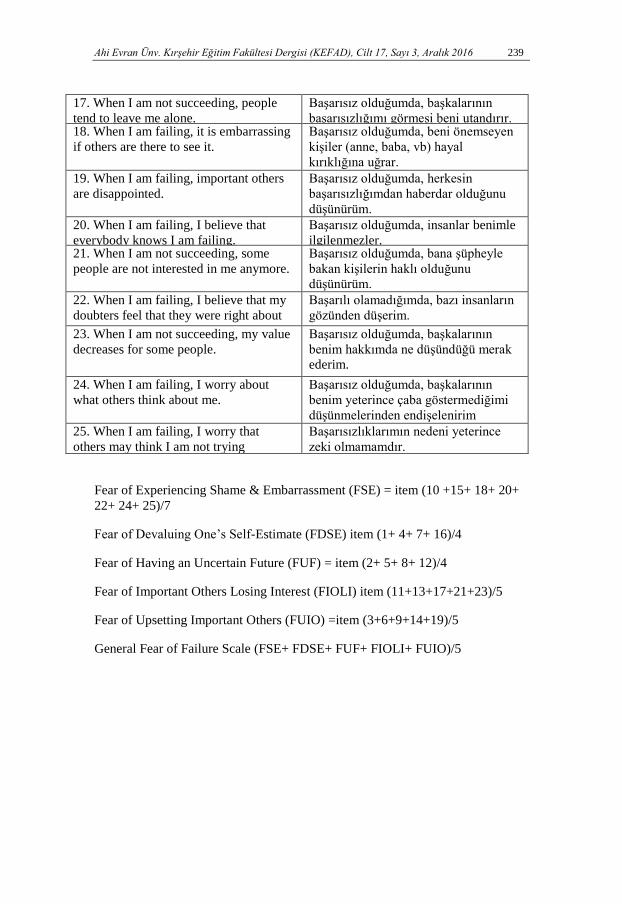
17. When I am not succeeding, people
tend to leave me alone.
Başarısız olduğumda, başkalarının
başarısızlığımı görmesi beni utandırır. 18. When I am failing, it is embarrassing
if others are there to see it.
Başarısız olduğumda, beni önemseyen
kişiler (anne, baba, vb) hayal
kırıklığına uğrar.
19. When I am failing, important others
are disappointed.
Başarısız olduğumda, herkesin
başarısızlığımdan haberdar olduğunu
düşünürüm.
20. When I am failing, I believe that
everybody knows I am failing.
Başarısız olduğumda, insanlar benimle
ilgilenmezler. 21. When I am not succeeding, some
people are not interested in me anymore.
Başarısız olduğumda, bana şüpheyle
bakan kişilerin haklı olduğunu
düşünürüm.
22. When I am failing, I believe that my
doubters feel that they were right about
me.
Başarılı olamadığımda, bazı insanların
gözünden düşerim.
23. When I am not succeeding, my value
decreases for some people.
Başarısız olduğumda, başkalarının
benim hakkımda ne düşündüğü merak
ederim.
24. When I am failing, I worry about
what others think about me.
Başarısız olduğumda, başkalarının
benim yeterince çaba göstermediğimi
düşünmelerinden endişelenirim
25. When I am failing, I worry that
others may think I am not trying
Başarısızlıklarımın nedeni yeterince
zeki olmamamdır.
Fear of Experiencing Shame & Embarrassment (FSE) = item (10 +15+ 18+ 20+
22+ 24+ 25)/7
Fear of Devaluing One’s Self-Estimate (FDSE) item (1+ 4+ 7+ 16)/4
Fear of Having an Uncertain Future (FUF) = item (2+ 5+ 8+ 12)/4
Fear of Important Others Losing Interest (FIOLI) item (11+13+17+21+23)/5
Fear of Upsetting Important Others (FUIO) =item (3+6+9+14+19)/5
General Fear of Failure Scale (FSE+ FDSE+ FUF+ FIOLI+ FUIO)/5