adaptation and resilience (climate change) (a&rcc)
TRANSCRIPT

ADAPTATION AND RESILIENCE (CLIMATE CHANGE) (A&RCC)
Report for 2011/12
JULY 2013

Contents Contents ................................................................................................................................ 2
1. Introduction ................................................................................................................... 3
2. Methodology.................................................................................................................. 4
2.1 Methodology............................................................................................................ 4
2.2 New Research Model for Isolating A&RCC Content ............................................... 4
3. Global A&RCC 2010/ 11................................................................................................... 7
4. UK A&RCC 2011/ 12....................................................................................................... 10
4.1 UK A&RCC Sales, Employment Companies and Growth ..................................... 10
4.2 Regional Analysis.................................................................................................. 14
4.3 UK Imports ............................................................................................................ 16
4.4 UK Exports ............................................................................................................ 19
Appendix A .......................................................................................................................... 22
A&RCC Definition.............................................................................................................. 22
Appendix B .......................................................................................................................... 23
Apportionments ................................................................................................................. 23
2

1. Introduction This is the third report on Adaptation & Resilience for Climate Change (A&RCC) and covers the period 2011/12. The first report was a joint BIS/ Defra and DECC research brief for 2009/ 10 and included a requirement to identify and measure A&RCC activities in the UK and the wider global economy. The definition of A&RCC was provided by Defra as part of the original brief for this research. An initial list of A&RCC activities to be investigated was also provided by Defra and these included: Construction & Retrofit Finance, Investment & Insurance Risk Management & Business Continuity Urban Environment Redesign & Re-Engineering Sustainable Drainage & Water Management Energy Storage Infrastructure Resilience Transport Infrastructure & Logistics Resilience, and Water Irrigation & Foot Printing. A more detailed breakdown of each A&RCC activity is included at Appendix A. In the 2009/10 report A&RCC economic activities were examined in two contexts. The first was an estimation of the value of the "new" A&RCC activities listed above. These activities were being researched and quantified for the first time. The second was an estimation of the A&RCC content of the activities included in the Low Carbon & Environmental Goods and Services (LCEGS) sector for BIS. LCEGS activities have been measured for a number of years, but this was the first attempt to calculate the proportion of LCEGS economic value that could be attributed to A&RCC. The results of this analysis can be found in the 2009/10 A&RCC report. The 2009/10 report recorded a number of observations about the pilot analysis of A&RCC activities. The key observation was that measuring the intended use of established/ new products and services specifically for their A&RCC purpose requires much more detailed analysis that just reporting "headline" sales, where the sales figure contains many different purchasing "intents." It was agreed that, for this reason, the 2009/10 analysis overstated the economic value of A&RCC activity, but by how much was uncertain. It was also agreed that further and deeper analysis of A&RCC activities would be required in the future and that analysis is a key feature of the 2010/11 and 2011/12 reports, where the focus has been upon establishing a more robust methodology for measuring the economic value of the "new" A&RCC activities listed above.
3

2. Methodology
2.1 Methodology
The analysis of A&RCC economic activity is based upon an existing methodology employed for estimating the LCEGS (and other) UK sectors. This methodology is used to define and quantify unobserved or "difficult-to-measure" markets where standard statistical data sources are non-existent, restricted or rapidly out-dated. This is achieved by identifying, evaluating, interpreting and transforming multiple data sources to estimate new values and by using a rules-based approach to collecting, assessing, selecting and then managing these data sources. A detailed explanation of the standard methodology is outlined in the LCEGS 2011/12 report and, for brevity, is not repeated here. While this methodology is not new, and has been applied to a wide variety of economic activities and markets, what is new is the decision making criteria used to decide if an economic activity should be considered as adaptive or resilient and, therefore, included in this research. This method for determining A&RCC was developed in 2009/10 and was revised in 2010/11. The model at Figure 1 was applied to the A&RCC activities identified by Defra. It takes into account both Adaptation to and Mitigation of climate change. It is a triple- gate approach that addresses the claim for A&RCC (Step 1), the intent to create new A&RCC market rather than create a substitution effect for existing goods and services (Step 2) and finally, the A&RCC economic impact i.e. is it measurable and significant. The most critical stage in the model is Step 2, trying to isolate the “intent” of use for products and services that may have multiple functions and applications. Figure 1: Decision Model
While the decision making model provides a valid route to defining A&RCC activity, it is this isolation of intent or purpose that was found deficient in the 2009/10 analysis because of the level of product and service detail at which it was being applied.
2.2 New Research Model for Isolating A&RCC Content
4
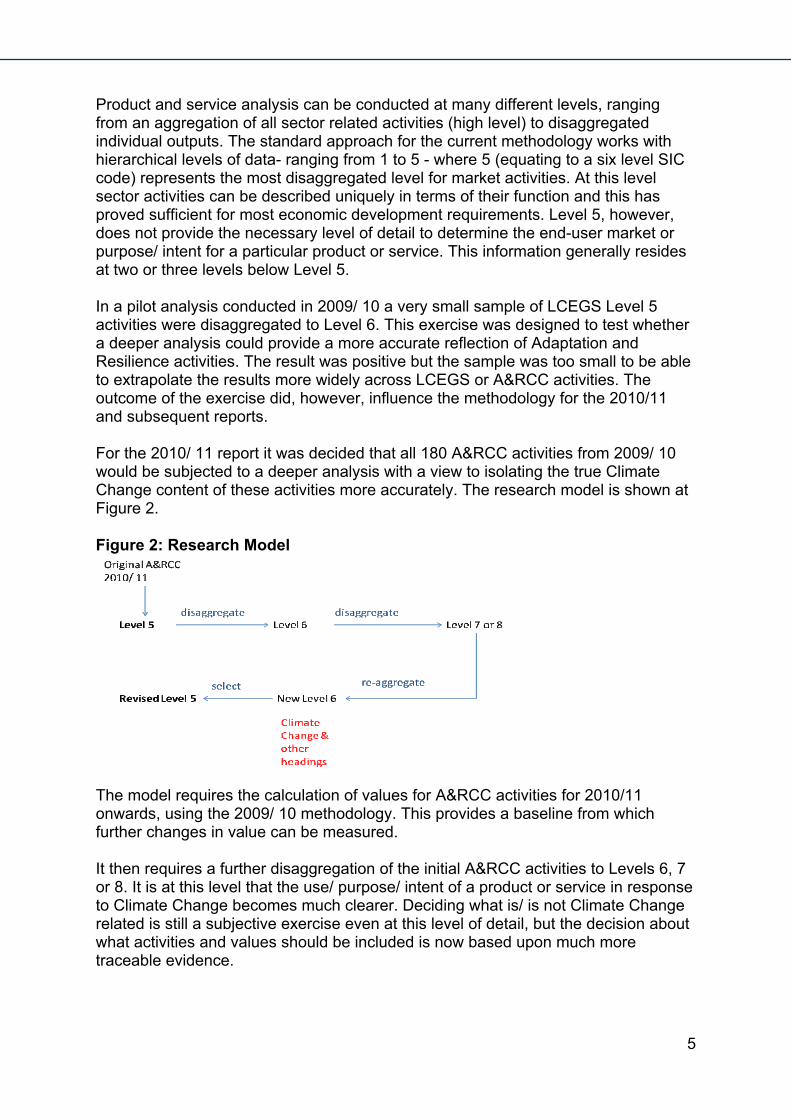
Product and service analysis can be conducted at many different levels, ranging from an aggregation of all sector related activities (high level) to disaggregated individual outputs. The standard approach for the current methodology works with hierarchical levels of data- ranging from 1 to 5 - where 5 (equating to a six level SIC code) represents the most disaggregated level for market activities. At this level sector activities can be described uniquely in terms of their function and this has proved sufficient for most economic development requirements. Level 5, however, does not provide the necessary level of detail to determine the end-user market or purpose/ intent for a particular product or service. This information generally resides at two or three levels below Level 5. In a pilot analysis conducted in 2009/ 10 a very small sample of LCEGS Level 5 activities were disaggregated to Level 6. This exercise was designed to test whether a deeper analysis could provide a more accurate reflection of Adaptation and Resilience activities. The result was positive but the sample was too small to be able to extrapolate the results more widely across LCEGS or A&RCC activities. The outcome of the exercise did, however, influence the methodology for the 2010/11 and subsequent reports. For the 2010/ 11 report it was decided that all 180 A&RCC activities from 2009/ 10 would be subjected to a deeper analysis with a view to isolating the true Climate Change content of these activities more accurately. The research model is shown at Figure 2. Figure 2: Research Model
The model requires the calculation of values for A&RCC activities for 2010/11 onwards, using the 2009/ 10 methodology. This provides a baseline from which further changes in value can be measured. It then requires a further disaggregation of the initial A&RCC activities to Levels 6, 7 or 8. It is at this level that the use/ purpose/ intent of a product or service in response to Climate Change becomes much clearer. Deciding what is/ is not Climate Change related is still a subjective exercise even at this level of detail, but the decision about what activities and values should be included is now based upon much more traceable evidence.
5

Research at this level of detail creates many more data lines than the original 180. Each new level of disaggregation adds 4-5 new data lines, so that for each of the original A&RCC activities at Level 5 there are up to 100 new subdivisions. This creates a new A&RCC research data set of approximately 18,000 data lines. After disaggregating A&RCC activities to levels 7 or 8, the next step is to re-aggregate the data at Level 6 in such a way that Climate Change content is differentiated from non- Climate Change content. A number of new categories are used that reflect: Response to Climate Change Responses to General Environmental/ Ecological Disasters Responses to General Environmental Policies and Targets General Maintenance Traditional (non- Climate Change) Applications Other non- Climate Change Services On average three other headings plus Climate Change are applied to each of the original 180 Level 5 activities. At level 6 the Climate Change category now reflects a much more accurate assessment and valuation than the previous Level 5 calculation for A&RCC. This Level 6 value can now be substituted for the previous A&RCC value and becomes the new baseline for A&RCC activity. This process is applied to all of the A&RCC activities and to all of the economic values calculated for each activity- sales, employment, companies, growth, imports and exports.
6

3. Global A&RCC 2010/ 11 The global A&RCC sales in 2011/ 12 is £68,656m or £68.7bn, compared with 2010/11 where the value was £65,772m or £65.8bn. The distribution of sales value across the sub sectors of A&RCC is shown at Figure 3. Figure 3: Global A&RCC Sales (£m) 2011/ 12
Figure 4: Global A&RCC Sales (%) 2011/ 12 Figure 4 shows global sales values as a percentage, with Transport Infrastructure and Construction and Retrofit accounting for 54% of the total. A&RCC activities in 2011/12 represent a 4.4% growth over 2010/ 11. This growth varied across the different sub sectors of A&RCC, from 14.9% for Climate Change Management and 12.8% for Enviro Finance to 1.6% for Finance, Investment & Insurance and 0.5% for Construction & Retrofit (see Table 1).
7

Table 1: A&RCC 2011/12 by Sub Sector (£m) Level 3 2011/ 12 2010/ 11 % GrowthArchitectural 8,924 8,461 5.5Climate Change Management 2,534 2,205 14.9Construction & Retrofit 22,181 22,068 0.5Enviro Finance 7,007 6,210 12.8Finance Investment & Insurance 6,431 6,329 1.6Risk Management & Business Continuity 2,337 2,296 1.8Sustainable Drainage & Water Management 3,654 3,367 8.5Transport Infrastructure 15,426 14,693 5.0Water Irrigation 162 146 10.6Total 68,656 65,772 4.4 The Top 53 global economies account for approximately 90% of global sales for most economic sectors. In the case of A&RCC, they account for 94% of global sales. Table 2 shows the Top 53 global economies ranked by value for 2011/12 and with their percentage of global market.
Table 2: A&RCC Sales 2010/11 and 2011/12 by Top 53 Countries
Country Ranking% of Global Total 2011/ 12 2010/ 11 % Growth Country Ranking
% of Global Total 2011/ 12 2010/ 11 % Growth
USA 1 21.6 14812.0 14316.7 3.5 Saudi Arabia 27 0.6 407.3 379.3 7.4China 2 13.2 9039.7 8552.3 5.7 Belgium 28 0.6 388.9 380.9 2.1Japan 3 6.4 4388.6 4267.4 2.8 Ukraine 29 0.6 384.3 343.2 12.0India 4 6.0 4109.8 3876.0 6.0 Egypt 30 0.6 382.9 365.0 4.9Germany 5 4.3 2970.0 2663.8 11.5 Colombia 31 0.6 382.2 348.8 9.6France 6 3.4 2313.5 2273.6 1.8 Bangladesh 32 0.5 327.7 333.0 -1.6UK 7 3.1 2125.3 2110.6 0.7 Sw eden 33 0.5 316.5 312.6 1.3Italy 8 2.8 1936.8 1840.7 5.2 Hong Kong 34 0.5 312.3 290.2 7.6Brazil 9 2.6 1798.6 1653.2 8.8 Sw itzerland 35 0.4 304.4 272.6 11.7Russian Federation 10 2.6 1772.8 1718.0 3.2 Austria 36 0.4 297.5 286.4 3.9Mexico 11 1.8 1203.1 1249.0 -3.7 Malaysia 37 0.4 288.8 270.4 6.8Canada 12 1.7 1170.4 1110.3 5.4 Greece 38 0.4 284.0 275.9 2.9Indonesia 13 1.6 1115.3 992.6 12.4 Vietnam 39 0.4 269.5 264.8 1.8Spain 14 1.6 1104.0 1095.0 0.8 Algeria 40 0.4 266.4 251.0 6.2South Korea 15 1.5 1041.0 1083.0 -3.9 Portugal 41 0.4 242.3 220.5 9.9Australia 16 1.1 732.6 725.6 1.0 Denmark 42 0.3 221.3 200.8 10.2Taiw an 17 1.0 685.7 603.0 13.7 Chile 43 0.3 219.2 198.1 10.6Thailand 18 1.0 655.7 584.8 12.1 Romania 44 0.3 209.5 206.4 1.5South Africa 19 0.9 622.2 578.3 7.6 Czechia 45 0.3 199.0 191.1 4.1Turkey 20 0.9 604.9 632.9 -4.4 Peru 46 0.3 181.5 179.2 1.3Argentina 21 0.9 602.2 614.6 -2.0 Finland 47 0.3 180.6 181.2 -0.4Iran 22 0.9 591.1 562.5 5.1 Hungary 48 0.3 175.6 180.1 -2.5Netherlands 23 0.8 565.2 566.4 -0.2 Venezuela 49 0.2 170.1 170.4 -0.1Poland 24 0.8 553.2 521.0 6.2 Morocco 50 0.2 158.0 152.7 3.4Philippines 25 0.8 542.6 475.1 14.2 Singapore 51 0.2 145.8 135.3 7.7Pakistan 26 0.6 437.1 458.0 -4.6 New Zealand 52 0.2 110.5 103.7 6.5
United Arab Emirates 53 0.1 79.6 80.3 -0.8 The UK is seventh overall, with 3.1% market share, behind the US, China, Japan, India, Germany and France. This compares with the UK’s position of sixth for LCEGS in 2011/ 12. This ranking is unchanged from 2010/11. Annual growth in the UK is down to 0.9% (see Section 4.1) compared with the global average of 4.4%. There are high levels of variation in country A&RCC growth overall, reflecting a wide spectrum of national responses to Climate Change. The UK is ranked fifth for Risk Management & Business Continuity, sixth for Architecture, Sustainable Drainage & Water Management, seventh for Construction
8

& Retrofit, Enviro Finance, Transport Infrastructure, Finance Investment & Insurance and eight for Water Irrigation and Climate Change Management. In Figure 5 the Top 13 European economies are ranked by sales value. The UK, with £2.1bn of sales is ranked third behind Germany and France. Figure 5: A&RCC Sales (£m) 2011/12 by Top 13 European Economies
In Figure 6 we show the forecast growth rates for the A&RCC total to 2015/161. These forecast growth rates are in line with the forecasts published in 2010/ 11 and show a healthy growth forecast when compared with the rest of the global economy as a whole.2 Figure 6: Global Growth Rate Forecast (%) from 2011/12 to 2015/16 for A&RCC
1 Growth forecasts are calculated by taking the mean value of a wide range of forecasting sources. The methodology is also used for the BIS LCEGS 2011/ 12 report and is explained in more detail there. 2 Forecast growth rates apply to the base year i.e. the 2011/ 12 growth rate is the percentage change that is forecast to apply to 2011/ 12 values and be realised in 2012/ 13 figures.
9

4. UK A&RCC 2011/ 12
4.1 UK A&RCC Sales, Employment Companies and Growth
UK A&RCC sales in 2011/12 is £2,125m or £2.1bn. The distribution of sales value across the sub sectors of A&RCC is shown at Figure 7. Figure 7: UK A&RCC Sales (£m) 2011/ 12
Figure 8: UK A&RCC Sales (%) 2011/ 12
Figure 8 shows UK sales values as a percentage, with Transport Infrastructure and Construction and Retrofit accounting for 54% of the total. The distribution of UK activity shows some minor variations from the global distribution at Figure 4. A&RCC activities in 2011/12 represents a 0.9% growth over the revised 2010/ 11 figure of £2,106m3. This is illustrated in Table 3, where 2010/ 11 and 2011/ 12 values are compared. Table 3 shows that growth is spread disproportionately across the different sub sectors, with only Architectural (7.4%) and Transport Infrastructure (3.6%) showing any real growth. Many sub sectors have actually shown a decline from the previous year's baseline.
3 This figure is revised downwards from the £2,111m published in the 2010/ 11 A&RCC report. The revision to £2,106m is due to the greater accuracy of regional v. national analysis.
10

Table 3: UK A&RCC Sales (£m) 2010/ 11 and 2011/ 2 Compared Level 3 2011/ 12 2010/ 11 % ChangeArchitectural 272 254 7.4Climate Change Management 81 82 -1.4Construction & Retrofit 655 669 -2.1Enviro Finance 217 220 -1.4Finance Investment & Insurance 190 188 1.2Risk Management & Business Continuity 97 99 -1.5Sustainable Drainage & Water Management 123 120 1.9Transport Infrastructure 486 470 3.6Water Irrigation 5 6 -18.7Total 2,125 2,106 0.9 The UK employment level for A&RCC in 2011/12 is 19,864 (Figure 9). The distribution of employment shown at Figure 9 broadly reflects the distribution of A&RCC sales for 2011/12. 2011/12 employment shows a small increase on the previous year figure of 19,7964. Figure 9: UK A&RCC Employment 2011/ 12
The UK companies involved in A&RCC in 2011/ 12 is 1,486 (Figure 10). The distribution of companies shown at Figure 10 is consistent with the UK the distribution of A&RCC sales and employment for 2011/ 12. The 2011/ 12 company count shows a small decline on the previous year figure of 1,4915.
4 This figure is revised downwards from the 21,012 published in the 2010/ 11 A&RCC report. The revision to 19,796 is due to the greater accuracy of regional v. national analysis. 5 This figure is revised downwards from the 1,566 published in the 2010/ 11 A&RCC report. The revision to 1,491 is due to the greater accuracy of regional v. national analysis.
11

Figure 10: UK A&RCC Companies 2011/ 12
The UK growth forecast for A&RCC is lower than the global forecast (Figure 8). This reflects the lowest than forecast growth in 2011/ 12. Figure 11 shows the forecast growth rates for UK A&RCC to 2015/16.6 Figure 11: UK Growth Rate Forecast 2012/ 13 to 2017/ 18 for A&RCC
In Table 4 the key measures are shown at the next level of detail. At Level 4 Road Transport Infrastructure (£304m), Environmental Finance (£182m), Architectural Project Management Services (£159m) and Rail Infrastructure (£148m) are the four largest activities and account for £793m or 37% of the total.
6 Forecast growth rates apply to the base year i.e. the 2011/ 12 growth rate is the percentage change that is forecast to apply to 2011/ 12 values and be realised in 2012/ 13 figures.
12

Table 4: UK A&RCC Sales, Employment and Companies for 2011/ 12 at Level 4 Level 3 Level 4 Sales £m Companies EmploymentArchitectural Architectural Design Services 22.73 17 225Architectural Architectural Engineering 90.69 72 838Architectural Architectural Project Management Services 158.93 133 1,442Climate Change Management Waterw ays and Barrier Management 73.42 32 591Climate Change Management Weather Station Services 7.07 2 50Construction & Retrof it Adaptive Civil Engineering Services 33.46 24 351Construction & Retrof it Agricultural 30.02 28 326Construction & Retrof it Domestic 36.08 30 384Construction & Retrof it Domestic Urban Enviro Redesign & Re Engineering 25 21 272Construction & Retrof it Industrial 74.88 55 671Construction & Retrof it Industrial Urban Enviro Redesign & Re Engineering 60.96 57 772Construction & Retrof it Manufacture of Retro Fit Engineering Equipment 74.94 56 733Construction & Retrof it Manufacture of Retro Fit Materials 61.72 40 491Construction & Retrof it Manufacturers of Temporary Accommodation For Renovation Projects 20.63 17 214Construction & Retrof it Public 59.65 44 577Construction & Retrof it Public Urban Enviro Redesign & Re Engineering 40.1 30 454Construction & Retrof it Retro Fit Buildings Services 71.68 51 680Construction & Retrof it Suppliers of Temporary Accommodation For Renovation Projects 13.97 10 136Construction & Retrof it Supply of Retro Fit Engineering Equipment 24.42 19 250Construction & Retrof it Supply of Retrofit Materials 27.05 25 292Enviro Finance Enviro Finance 182.45 67 1,347Enviro Finance Enviro Finance Planning 34.22 11 230Finance Investment & Insurance Banking Services 41.31 36 464Finance Investment & Insurance Equity Investment Services 73.12 56 767Finance Investment & Insurance Insurance Services 75.59 52 788Risk Management & Business Continuity Business Continuity 36.37 27 340Risk Management & Business Continuity Risk Mitigation 61.09 41 531Sustainable Drainage & Water Management Agricultural 8.61 7 80Sustainable Drainage & Water Management Domestic 20.77 14 191Sustainable Drainage & Water Management Industrial 47.73 40 456Sustainable Drainage & Water Management Public 45.48 27 393Transport Infrastructure Rail 148.27 123 1,676Transport Infrastructure Road 304.35 191 2,465Transport Infrastructure Waterw ays 33.8 26 345Water Irrigation Agriculture 2.76 2 29Water Irrigation Leisure Areas 1.91 1 15 The same data is shown in Figure 12 as a stacked bar chart. Figure 12: UK A&RCC Sales £m for 2011/ 12 by Level 3 and 4
Despite the low (and below forecast) growth in 2011/12 the growth forecasts for 2012/ 13 and beyond are still healthy, albeit lower than previous forecasts. Table 5 shows forecast growth rates to 2017/ 18 for Level 4 activities. The highest growth
13
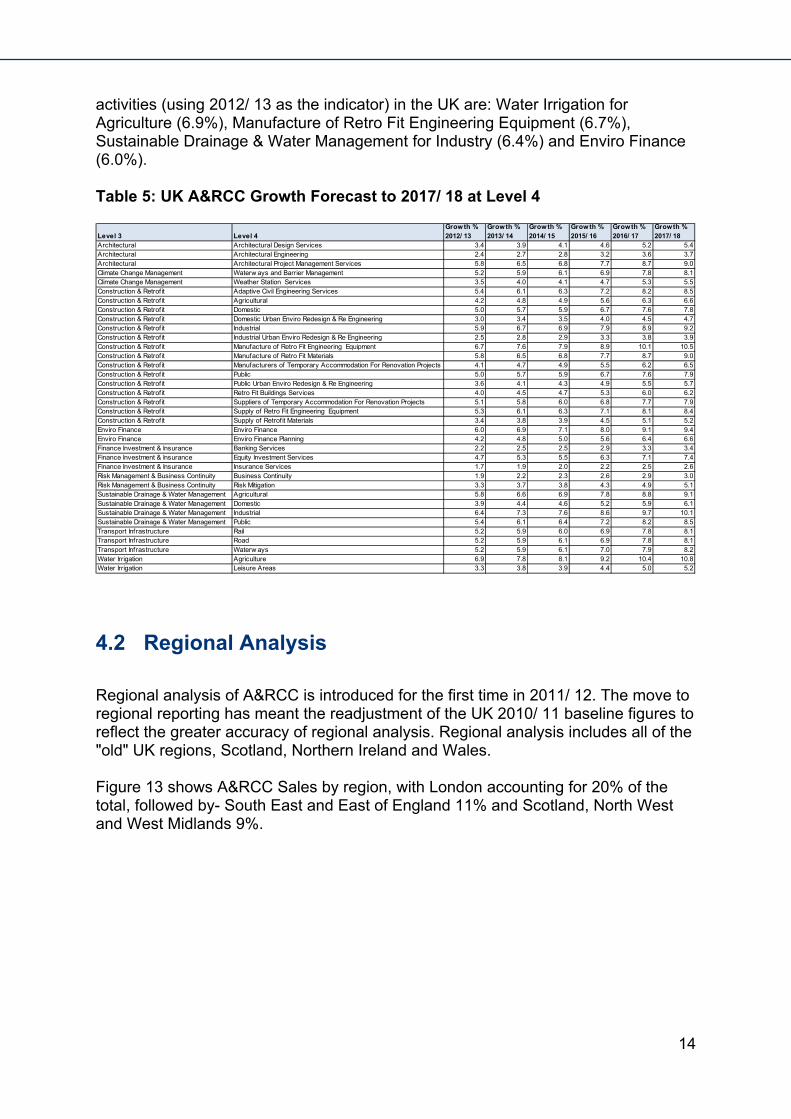
activities (using 2012/ 13 as the indicator) in the UK are: Water Irrigation for Agriculture (6.9%), Manufacture of Retro Fit Engineering Equipment (6.7%), Sustainable Drainage & Water Management for Industry (6.4%) and Enviro Finance (6.0%). Table 5: UK A&RCC Growth Forecast to 2017/ 18 at Level 4 Level 3 Level 4
Grow th % 2012/ 13
Growth % 2013/ 14
Growth % 2014/ 15
Growth % 2015/ 16
Growth % 2016/ 17
Growth % 2017/ 18
Architectural Architectural Design Services 3.4 3.9 4.1 4.6 5.2 5.4Architectural Architectural Engineering 2.4 2.7 2.8 3.2 3.6 3.7Architectural Architectural Project Management Services 5.8 6.5 6.8 7.7 8.7 9.0Climate Change Management Waterw ays and Barrier Management 5.2 5.9 6.1 6.9 7.8 8.1Climate Change Management Weather Station Services 3.5 4.0 4.1 4.7 5.3 5.5Construction & Retrofit Adaptive Civil Engineering Services 5.4 6.1 6.3 7.2 8.2 8.5Construction & Retrofit Agricultural 4.2 4.8 4.9 5.6 6.3 6.6Construction & Retrofit Domestic 5.0 5.7 5.9 6.7 7.6 7.8Construction & Retrofit Domestic Urban Enviro Redesign & Re Engineering 3.0 3.4 3.5 4.0 4.5 4.7Construction & Retrofit Industrial 5.9 6.7 6.9 7.9 8.9 9.2Construction & Retrofit Industrial Urban Enviro Redesign & Re Engineering 2.5 2.8 2.9 3.3 3.8 3.9Construction & Retrofit Manufacture of Retro Fit Engineering Equipment 6.7 7.6 7.9 8.9 10.1 10.5Construction & Retrofit Manufacture of Retro Fit Materials 5.8 6.5 6.8 7.7 8.7 9.0Construction & Retrofit Manufacturers of Temporary Accommodation For Renovation Projects 4.1 4.7 4.9 5.5 6.2 6.5Construction & Retrofit Public 5.0 5.7 5.9 6.7 7.6 7Construction & Retrofit Public Urban Enviro Redesign & Re Engineering 3.6 4.1 4.3 4.9 5.5 5.7Construction & Retrofit Retro Fit Buildings Services 4.0 4.5 4.7 5.3 6.0 6.2Construction & Retrofit Suppliers of Temporary Accommodation For Renovation Projects 5.1 5.8 6.0 6.8 7.7 7.9Construction & Retrofit Supply of Retro Fit Engineering Equipment 5.3 6.1 6.3 7.1 8.1 8.4Construction & Retrofit Supply of Retrofit Materials 3.4 3.8 3.9 4.5 5.1 5.2Enviro Finance Enviro Finance 6.0 6.9 7.1 8.0 9.1 9.4Enviro Finance Enviro Finance Planning 4.2 4.8 5.0 5.6 6.4 6.6Finance Investment & Insurance Banking Services 2.2 2.5 2.5 2.9 3.3 3.4Finance Investment & Insurance Equity Investment Services 4.7 5.3 5.5 6.3 7.1 7.4Finance Investment & Insurance Insurance Services 1.7 1.9 2.0 2.2 2.5 2.6Risk Management & Business Continuity Business Continuity 1.9 2.2 2.3 2.6 2.9 3.0Risk Management & Business Continuity Risk Mitigation 3.3 3.7 3.8 4.3 4.9 5.1Sustainable Drainage & Water Management Agricultural 5.8 6.6 6.9 7.8 8.8 9.1Sustainable Drainage & Water Management Domestic 3.9 4.4 4.6 5.2 5.9 6.1Sustainable Drainage & Water Management Industrial 6.4 7.3 7.6 8.6 9.7 10.1Sustainable Drainage & Water Management Public 5.4 6.1 6.4 7.2 8.2 8Transport Infrastructure Rail 5.2 5.9 6.0 6.9 7.8 8Transport Infrastructure Road 5.2 5.9 6.1 6.9 7.8 8Transport Infrastructure Waterw ays 5.2 5.9 6.1 7.0 7.9 8.2Water Irrigation Agriculture 6.9 7.8 8.1 9.2 10.4 10.8Water Irrigation Leisure Areas 3.3 3.8 3.9 4.4 5.0 5.2
.9
.5
.1
.1
4.2 Regional Analysis
Regional analysis of A&RCC is introduced for the first time in 2011/ 12. The move to regional reporting has meant the readjustment of the UK 2010/ 11 baseline figures to reflect the greater accuracy of regional analysis. Regional analysis includes all of the "old" UK regions, Scotland, Northern Ireland and Wales. Figure 13 shows A&RCC Sales by region, with London accounting for 20% of the total, followed by- South East and East of England 11% and Scotland, North West and West Midlands 9%.
14

Figure 13: UK A&RCC Regional Sales 2011/ 12
Table 6 shows A&RCC Sales by region and by sub sector.
Table 6: UK A&RCC Regional Sales 2011/ 12 by Sub Sector7 Level 3
East Midlands
East of England London N Ireland
North East
North West Scotland
South East
South West Wales
West Midlands Yorkshire Total
Architectural 13 26 63 9 8 25 25 33 18 14 20 19 272Climate Change Management 6 8 15 1 4 11 7 12 4 2 5 6 80Construction & Retrofit 37 63 140 19 22 55 67 65 47 29 65 45 655Enviro Finance 12 21 40 4 8 26 24 27 16 8 16 15 217Finance Investment & Insurance 11 23 30 5 6 15 19 19 17 9 22 15 190Risk Management & Business Continuity 7 14 23 3 4 4 4 16 7 4 5 7 97Sustainable Drainage & Water Management 8 12 29 5 3 8 12 12 9 8 9 8 123Transport Infrastructure 31 59 89 14 13 47 41 56 33 24 43 36 486Water Irrigation 0 0 1 0 0 0 0 0 0 0 0 0 5Total 126 226 431 59 68 191 198 242 151 98 185 150 2,125 Figure 14 shows A&RCC Employment by region, with London accounting for 20% of the total, followed by- South East 11%, East of England and Scotland 10% and North West 9%. Figure 14: UK A&RCC Regional Employment 2011/ 12
Table 7 shows A&RCC Employment by region and by sub sector.
7 There are very small differences in the regional totals shown by the bar charts and the tables, this is due to rounding differences at the national and regional level.
15

Table 7: UK A&RCC Regional Employment 2011/ 12 by Sub Sector
Level 3East Midlands
East of England London N Ireland
North East
North West Scotland
South East
South West Wales
West Midlands Yorkshire Total
Architectural 110 246 527 59 101 167 232 295 167 121 269 211 2,506Climate Change Management 43 53 88 18 32 66 32 110 95 12 59 33 641Construction & Retrofit 384 606 1,453 155 216 568 738 668 498 288 559 468 6,601Enviro Finance 90 98 227 46 74 280 136 195 139 50 123 117 1,576Finance Investment & Insurance 133 275 327 52 67 187 193 231 140 116 163 135 2,019Risk Management & Business Continuity 69 128 122 26 33 42 68 140 76 34 37 95 871Sustainable Drainage & Water Management 82 80 264 31 27 74 95 138 72 71 90 97 1,120Transport Infrastructure 321 515 911 133 134 457 404 399 347 203 369 293 4,486Water Irrigation 2 5 10 1 2 5 3 4 3 2 5 4 44Total 1,234 2,006 3,929 521 686 1,846 1,901 2,180 1,537 897 1,674 1,453 19,864
Figure 15 shows A&RCC Companies by region, with London accounting for 18% of the total, followed by- South East 11%, East of England 10% and North West, Scotland and West Midlands 9%. Figure 15: UK A&RCC Regional Companies 2011/ 12
Table 8 shows A&RCC Companies by region and by sub sector. Table 8: UK A&RCC Regional Companies 2011/ 12 by Sub Sector
Level 3East Midlands
East of England London N Ireland
North East
North West Scotland
South East
South West Wales
West Midlands Yorkshire Total
Architectural 10 23 40 5 7 15 12 36 14 11 26 23 223Climate Change Management 2 3 8 1 1 4 2 4 3 1 3 3 35Construction & Retrofit 36 51 95 13 15 44 59 57 41 22 46 28 506Enviro Finance 5 8 10 2 3 11 7 10 7 3 6 7 78Finance Investment & Insurance 11 18 26 4 5 14 10 11 9 7 13 16 144Risk Management & Business Continuity 6 8 13 3 4 4 4 10 4 2 2 9 68Sustainable Drainage & Water Management 7 8 22 2 3 5 9 7 5 4 7 9 88Transport Infrastructure 32 33 55 11 11 31 25 31 37 20 36 19 341Water Irrigation 0 1 1 0 0 0 0 1 0 0 0 0 3Total 109 153 270 41 49 128 128 167 120 70 139 114 1,486
4.3 UK Imports
The UK Imports value for A&RCC activities in 2011/ 12 is £249.7m. Figure 16 shows the distribution of Imports across the sub categories of A&RCC, with Construction & Retrofit accounting for 34% of the total. 2011/12 shows 4.4% growth in Imports on the previous year figure of £239.2m8.
8 This figure is revised downwards from the £250m published in the 2010/ 11 A&RCC report. The revision to £239,2m is due to the greater accuracy of regional v. national analysis.
16

17
Figure 16: A&RCC Imports 2011/ 12 (£m)
Figure 17 shows the top 13 countries providing A&RCC Imports into the UK in 2010/ 11. China accounts for 8%, followed by Hong Kong (5%). South Korea (5%) and the US (5%). The ranking of countries differs from that of LCEGS, as we would expect for different products and services, with the US ranked much higher for A&RCC activities than for LCEGS. Figure 17: A&RCC Imports 2011/ 12 (£m) by Country of Origin
Table 9 shows UK imports at Level 5 in a heat map format where Red starts at 0, Green finishes at £1.1m and Orange represents the midpoint (with gradations of colour in between). The heat map has been rationalised down to the 26 largest importing A&RCC activities and for the top 16 importing countriess. Table 5 shows a distinctive Import pattern for: A range of Environmental Finance Services from the US and China Road and Rail Anti Subsistence Works activities from most of the 17 countries Architectural Project Management Services for Industrial projects from most of
the 17 countries.

Table 9: A&RCC Imports 2011/ 12 (£m) at Level 5
Level 4 Level 5 Ch
ina
Fra
nce
Ger
man
y
Ho
ng
Ko
ng
Ind
ia
Ital
y
Jap
an
Pak
ista
n
Po
lan
d
Ro
man
ia
Ru
ssia
So
uth
Ko
rea
Sp
ain
Tu
rkey
UA
E
US
Architectural Project Management Services Architectural Project Management Services Highw ays 0.231 0.072 0.062 0.175 0.123 0.079 0.113 0.151 0.099 0.111 0.129 0.166 0.100 0.092 0.104 0.101Architectural Project Management Services Architectural Project Management Services Housing Development 0.239 0.074 0.063 0.187 0.127 0.077 0.113 0.161 0.105 0.118 0.127 0.172 0.103 0.090 0.112 0.105Architectural Project Management Services Architectural Project Management Services Industrial Projects 0.629 0.198 0.176 0.502 0.357 0.218 0.312 0.411 0.289 0.307 0.343 0.457 0.274 0.259 0.311 0.281Waterw ays and Barrier Management Sea Defence Management Services 0.235 0.059 0.077 0.008 0.112 0.045 0.108 0.013 0.015 0.006 0.044 0.024 0.028 0.018 0.002 0.424Industrial Manufacture of Path & Standing Area Porous Resurfacing Services 0.240 0.068 0.058 0.170 0.122 0.071 0.114 0.150 0.098 0.108 0.122 0.159 0.096 0.090 0.108 0.097Industrial Urban Enviro Redesign & Re Engineering Urban Re Engineering Civil Engineering Services Industrial Estates 0.460 0.144 0.122 0.339 0.234 0.149 0.215 0.296 0.199 0.211 0.246 0.304 0.200 0.178 0.206 0.198Manufacture of Retro Fit Engineering Equipment Manufacture of Anti Erosion Constructs 0.249 0.079 0.066 0.185 0.135 0.085 0.121 0.164 0.110 0.124 0.136 0.176 0.106 0.103 0.117 0.108Public Manufacture of Path & Standing Area Porous Resurfacing Services 0.265 0.081 0.067 0.190 0.133 0.085 0.123 0.170 0.117 0.128 0.139 0.178 0.112 0.100 0.116 0.108Public Supply of Porous Surfacing Materials 0.205 0.068 0.054 0.166 0.112 0.070 0.103 0.134 0.095 0.101 0.108 0.143 0.091 0.082 0.098 0.088Public Urban Enviro Redesign & Re Engineering Urban Re Engineering Civil Engineering Services Public Areas 0.331 0.099 0.083 0.258 0.174 0.106 0.152 0.204 0.138 0.156 0.170 0.226 0.143 0.129 0.147 0.134Retro Fit Buildings Services Retro Fit Electrical Services 0.391 0.121 0.101 0.292 0.202 0.124 0.186 0.251 0.165 0.189 0.201 0.262 0.160 0.148 0.175 0.162Enviro Finance Enviro Banking Services 0.386 0.081 0.112 0.012 0.154 0.072 0.173 0.019 0.023 0.008 0.067 0.042 0.040 0.023 0.003 0.561Enviro Finance Enviro Specif ic Capital Venture Services 0.457 0.097 0.140 0.016 0.233 0.100 0.218 0.024 0.031 0.011 0.093 0.052 0.061 0.031 0.005 0.865Enviro Finance Enviro Specif ic Equity Investment Services 0.410 0.088 0.119 0.015 0.182 0.083 0.195 0.018 0.024 0.009 0.084 0.053 0.055 0.028 0.004 0.656Enviro Finance Planning Business & Investment planning Services 0.294 0.061 0.129 0.012 0.136 0.066 0.162 0.016 0.020 0.007 0.062 0.034 0.046 0.022 0.003 0.480Equity Investment Services Equity Investment Services for Corporate Projects 0.222 0.076 0.063 0.180 0.125 0.077 0.116 0.155 0.102 0.113 0.121 0.168 0.098 0.092 0.108 0.096Insurance Services Flood Insurance Services 0.231 0.073 0.061 0.181 0.117 0.077 0.105 0.147 0.103 0.108 0.121 0.166 0.098 0.086 0.107 0.099Insurance Services Weather Insurance Services 0.291 0.090 0.078 0.225 0.155 0.092 0.141 0.178 0.124 0.138 0.155 0.205 0.126 0.113 0.129 0.124Business Continuity Business Continuity Recovery Implementation Services 0.216 0.066 0.055 0.163 0.114 0.072 0.102 0.142 0.095 0.101 0.118 0.143 0.096 0.081 0.103 0.091Risk Mitigation Risk Assessment Services 0.446 0.136 0.114 0.329 0.230 0.150 0.204 0.294 0.190 0.211 0.212 0.300 0.187 0.167 0.195 0.183Rail Anti Subsidence Works 0.574 0.176 0.149 0.426 0.291 0.185 0.273 0.364 0.252 0.274 0.295 0.376 0.237 0.226 0.262 0.237Rail Flood Abatement Works 0.335 0.101 0.089 0.260 0.183 0.112 0.158 0.219 0.148 0.166 0.178 0.238 0.143 0.134 0.157 0.144Rail Surface Water Drainage Works 0.254 0.078 0.065 0.195 0.137 0.081 0.119 0.164 0.107 0.121 0.129 0.178 0.104 0.100 0.115 0.109Road Anti Subsidence Works 1.086 0.343 0.291 0.843 0.565 0.369 0.514 0.708 0.493 0.529 0.570 0.770 0.464 0.428 0.491 0.490Road Flood Abatement Works 0.755 0.220 0.204 0.572 0.388 0.244 0.350 0.466 0.322 0.345 0.390 0.524 0.322 0.298 0.348 0.325Road Re Location and & Re laying 0.501 0.153 0.139 0.387 0.257 0.162 0.238 0.316 0.219 0.239 0.272 0.350 0.214 0.206 0.227 0.218

4.4 UK Exports
The UK Exports value for A&RCC activities in 2011/ 12 is £266m, Figure 18 shows the distribution of Exports across the sub categories of A&RCC, with Construction & Retrofit accounting for 32%, Transport Infrastructure 23% and Architecture 14% of the total. 2011/12 shows 4.7% growth in Imports on the previous year figure of £254m9. This level of growth in Exports suggests that the reduced levels of sales for A&RCC in 2011/12 is due to a downturn in domestic market demand. Figure 18: A&RCC Exports 2011/ 12 (£m)
Figure 19 shows UK exports for the top 13 export destinations in 2011/ 12. The top countries are South Africa and Canada (6%), followed by Germany, Italy, Hong Kong and Singapore (4%). This is a very different ranking order to LCEGS as a whole but is consistent with the 2010/ 11 report. Figure 19: A&RCC Exports 2010/ 11 (£m) by Country of Origin
Table 10 shows UK exports at Level 5 in a heat map format where Red starts at 0, Green finishes at £1.3m and Orange represents the midpoint (with gradations of
9 This figure is revised downwards from the £265m published in the 2010/ 11 A&RCC report. The revision to £254m is due to the greater accuracy of regional v. national analysis.

20
colour in between). The heat map has been rationalised down to the 36 largest exporting A&RCC activities and for the top 20 exporting destinations. Table 6 shows a polarised export pattern with: Environmental Finance activities being most important to the US, China, India,
Japan and Germany Road and Rail Transport Infrastructure activities being most important to Canada,
Germany, South Africa, Singapore, Italy and Hong Kong.

Table 10: A&RCC Exports 2011/ 12 (£m) at Level 5
Level 4 Level 5 Can
ada
Ch
ina
Ger
man
y
Ho
ng
Ko
ng
Ind
on
esia
Iran
Ital
y
Jap
an
Net
her
lan
ds
Per
u
Po
lan
d
Ru
ssia
Sau
di A
rab
ia
Sin
gap
ore
So
uth
Afr
ica
Sw
eden
Tai
wan
Tu
rkey
Ukr
ain
e
US
Architectural Engineering Architectural Engineering Airports, Ports & Railw ays 0.169 0.030 0.106 0.105 0.068 0.066 0.095 0.055 0.082 0.062 0.076 0.069 0.047 0.103 0.167 0.088 0.080 0.083 0.068 0.014Architectural Engineering Architectural Engineering Highw ays 0.180 0.034 0.121 0.122 0.077 0.081 0.108 0.067 0.097 0.072 0.082 0.080 0.054 0.116 0.193 0.102 0.089 0.093 0.082 0.016Architectural Engineering Architectural Engineering Housing Development 0.135 0.025 0.089 0.086 0.057 0.056 0.082 0.048 0.070 0.050 0.064 0.059 0.037 0.088 0.136 0.071 0.064 0.067 0.057 0.012Architectural Engineering Architectural Engineering Large Civil Structures Projects 0.122 0.022 0.081 0.078 0.049 0.051 0.071 0.043 0.063 0.045 0.057 0.051 0.034 0.076 0.120 0.068 0.059 0.060 0.052 0.011Architectural Engineering Architectural Engineering Public Buildings & Complexes 0.120 0.023 0.079 0.078 0.050 0.050 0.072 0.043 0.062 0.047 0.056 0.052 0.034 0.077 0.123 0.067 0.057 0.062 0.052 0.011Architectural Project Management Services Architectural Project Management Large Civil Structures Projects 0.125 0.022 0.082 0.079 0.050 0.049 0.074 0.044 0.061 0.046 0.056 0.051 0.033 0.077 0.130 0.069 0.060 0.063 0.050 0.011Architectural Project Management Services Architectural Project Management Services Airports, Ports & Railw ays 0.151 0.028 0.098 0.100 0.061 0.062 0.093 0.052 0.079 0.055 0.071 0.062 0.042 0.101 0.158 0.084 0.073 0.076 0.065 0.014Architectural Project Management Services Architectural Project Management Services Highw ays 0.231 0.042 0.154 0.150 0.097 0.097 0.145 0.085 0.118 0.087 0.107 0.099 0.064 0.154 0.233 0.123 0.110 0.121 0.099 0.020Architectural Project Management Services Architectural Project Management Services Housing Development 0.190 0.034 0.126 0.117 0.077 0.078 0.108 0.065 0.096 0.068 0.083 0.078 0.050 0.111 0.203 0.100 0.088 0.090 0.078 0.017Architectural Project Management Services Architectural Project Management Services Industrial Projects 0.687 0.121 0.455 0.434 0.262 0.280 0.393 0.237 0.344 0.242 0.302 0.282 0.192 0.428 0.715 0.365 0.322 0.349 0.286 0.058Industrial Manufacture of Path & Standing Area Porous Resurfacing Services 0.180 0.034 0.121 0.119 0.076 0.077 0.110 0.066 0.099 0.070 0.082 0.076 0.050 0.120 0.182 0.100 0.086 0.090 0.080 0.017Industrial Manufacture of Rain Water Capture Systems 0.158 0.029 0.103 0.101 0.065 0.065 0.094 0.053 0.079 0.059 0.073 0.067 0.042 0.098 0.159 0.086 0.075 0.080 0.063 0.014Industrial Supply of Porous Surfacing Materials 0.208 0.038 0.143 0.141 0.088 0.089 0.126 0.076 0.112 0.081 0.101 0.089 0.060 0.136 0.222 0.114 0.102 0.111 0.093 0.019Industrial Urban Enviro Redesign & Re Engineering Urban Re Engineering Civil Engineering Services Industrial Estates 0.377 0.068 0.249 0.247 0.156 0.153 0.222 0.133 0.191 0.145 0.174 0.165 0.107 0.233 0.402 0.209 0.183 0.192 0.165 0.034Manufacture of Retro Fit Engineering Equipment Manufacture of Anti Erosion Constructs 0.230 0.040 0.149 0.144 0.093 0.091 0.136 0.081 0.115 0.085 0.103 0.096 0.065 0.139 0.231 0.121 0.103 0.110 0.095 0.019Manufacture of Retro Fit Engineering Equipment Manufacture of Structural Braces for Buildings 0.171 0.031 0.112 0.110 0.070 0.071 0.102 0.061 0.091 0.063 0.077 0.072 0.051 0.108 0.180 0.097 0.080 0.088 0.073 0.014Public Urban Enviro Redesign & Re Engineering Urban Re Engineering Civil Engineering Services Public Areas 0.267 0.051 0.177 0.173 0.107 0.114 0.164 0.095 0.138 0.103 0.124 0.115 0.075 0.170 0.289 0.153 0.127 0.142 0.117 0.025Retro Fit Buildings Services Retro Fit Electrical Services 0.318 0.058 0.208 0.208 0.127 0.127 0.176 0.113 0.156 0.118 0.143 0.134 0.089 0.196 0.317 0.179 0.154 0.155 0.132 0.028Enviro Finance Enviro Banking Services 0.080 0.586 0.176 0.019 0.063 0.037 0.116 0.277 0.033 0.015 0.038 0.107 0.026 0.010 0.042 0.020 0.045 0.038 0.027 0.920Enviro Finance Enviro Specif ic Capital Venture Services 0.112 0.711 0.224 0.024 0.073 0.051 0.151 0.349 0.047 0.017 0.047 0.146 0.035 0.010 0.047 0.024 0.061 0.047 0.028 1.254Enviro Finance Enviro Specif ic Equity Investment Services 0.084 0.699 0.197 0.023 0.080 0.038 0.122 0.300 0.040 0.015 0.039 0.135 0.028 0.012 0.053 0.022 0.052 0.045 0.026 1.088Enviro Finance Enviro Specif ic Fund Management Services 0.055 0.319 0.118 0.011 0.040 0.022 0.069 0.152 0.023 0.007 0.024 0.069 0.014 0.006 0.020 0.012 0.028 0.028 0.014 0.488Enviro Finance Planning Business & Investment planning Services 0.073 0.468 0.174 0.017 0.055 0.036 0.106 0.250 0.031 0.011 0.031 0.101 0.020 0.009 0.029 0.018 0.040 0.037 0.022 0.745Insurance Services Flood Insurance Services 0.208 0.039 0.135 0.135 0.086 0.089 0.128 0.076 0.109 0.080 0.096 0.092 0.060 0.133 0.217 0.114 0.100 0.107 0.087 0.019Insurance Services Weather Insurance Services 0.196 0.036 0.127 0.127 0.079 0.082 0.121 0.068 0.102 0.075 0.088 0.085 0.055 0.122 0.204 0.109 0.090 0.101 0.082 0.018Business Continuity Business Continuity Recovery Implementation Services 0.218 0.040 0.136 0.142 0.095 0.090 0.124 0.076 0.116 0.085 0.095 0.092 0.064 0.134 0.232 0.117 0.105 0.111 0.095 0.020Risk Mitigation Risk Assessment Services 0.343 0.061 0.219 0.214 0.140 0.135 0.204 0.118 0.174 0.123 0.147 0.143 0.096 0.206 0.348 0.188 0.166 0.177 0.137 0.031Industrial Anti Subsidence Works 0.182 0.033 0.117 0.115 0.074 0.071 0.106 0.064 0.090 0.067 0.079 0.075 0.051 0.114 0.175 0.097 0.082 0.089 0.076 0.015Industrial Flood Abatement Works 0.104 0.020 0.068 0.067 0.044 0.044 0.063 0.038 0.054 0.039 0.050 0.045 0.030 0.068 0.107 0.059 0.051 0.055 0.046 0.009Public Bank Maintenance Services 0.220 0.041 0.146 0.140 0.091 0.090 0.128 0.075 0.109 0.081 0.100 0.095 0.060 0.137 0.236 0.117 0.105 0.111 0.093 0.019Rail Anti Subsidence Works 0.509 0.098 0.340 0.337 0.207 0.220 0.308 0.178 0.273 0.200 0.242 0.224 0.156 0.332 0.517 0.282 0.256 0.266 0.215 0.047Rail Flood Abatement Works 0.285 0.050 0.183 0.177 0.114 0.115 0.158 0.100 0.139 0.105 0.123 0.117 0.080 0.177 0.284 0.148 0.135 0.144 0.114 0.025Road Anti Subsidence Works 1.128 0.209 0.750 0.727 0.452 0.480 0.650 0.402 0.582 0.423 0.500 0.488 0.318 0.720 1.169 0.611 0.530 0.551 0.498 0.096Road Flood Abatement Works 0.662 0.128 0.439 0.441 0.272 0.273 0.400 0.233 0.348 0.246 0.303 0.293 0.204 0.419 0.671 0.359 0.322 0.328 0.278 0.056Road Re Location and & Re laying 0.366 0.067 0.241 0.238 0.155 0.155 0.223 0.131 0.193 0.139 0.174 0.157 0.107 0.229 0.388 0.203 0.182 0.185 0.158 0.033Road Surface Water Drainage Works 0.195 0.035 0.124 0.115 0.077 0.078 0.112 0.065 0.097 0.068 0.084 0.078 0.054 0.119 0.199 0.102 0.091 0.095 0.081 0.017
21

Appendix A
A&RCC Definition
The A&RCC definition used for analysis in this report is identical to the 2009/ 10 study. The main categories of activity are shown below. Level 2 Level 3 Level 4Adaption & Resilience Architectural Architectural Design ServicesAdaption & Resilience Architectural Architectural EngineeringAdaption & Resilience Architectural Architectural Project Management ServicesAdaption & Resilience Climate Change Management Waterways and Barrier ManagementAdaption & Resilience Climate Change Management Weather Station ServicesAdaption & Resilience Construction & Retrofit Adaptive Civil Engineering ServicesAdaption & Resilience Construction & Retrofit AgriculturalAdaption & Resilience Construction & Retrofit DomesticAdaption & Resilience Construction & Retrofit Domestic Urban Enviro Redesign & Re EngineeringAdaption & Resilience Construction & Retrofit IndustrialAdaption & Resilience Construction & Retrofit Industrial Urban Enviro Redesign & Re EngineeringAdaption & Resilience Construction & Retrofit Manufacture of Retro Fit Engineering EquipmentAdaption & Resilience Construction & Retrofit Manufacture of Retro Fit MaterialsAdaption & Resilience Construction & Retrofit Manufacturers of Temporary Accommodation For Renovation ProjectsAdaption & Resilience Construction & Retrofit PublicAdaption & Resilience Construction & Retrofit Public Urban Enviro Redesign & Re EngineeringAdaption & Resilience Construction & Retrofit Retro Fit Buildings ServicesAdaption & Resilience Construction & Retrofit Suppliers of Temporary Accommodation For Renovation ProjectsAdaption & Resilience Construction & Retrofit Supply of Retro Fit Engineering EquipmentAdaption & Resilience Construction & Retrofit Supply of Retrofit MaterialsAdaption & Resilience Enviro Finance Enviro FinanceAdaption & Resilience Enviro Finance Enviro Finance PlanningAdaption & Resilience Finance Investment & Insurance Banking ServicesAdaption & Resilience Finance Investment & Insurance Equity Investment ServicesAdaption & Resilience Finance Investment & Insurance Insurance ServicesAdaption & Resilience Risk Management & Business Continuity Business ContinuityAdaption & Resilience Risk Management & Business Continuity Risk MitigationAdaption & Resilience Sustainable Drainage & Water Management AgriculturalAdaption & Resilience Sustainable Drainage & Water Management DomesticAdaption & Resilience Sustainable Drainage & Water Management IndustrialAdaption & Resilience Sustainable Drainage & Water Management PublicAdaption & Resilience Transport Infrastructure RailAdaption & Resilience Transport Infrastructure RoadAdaption & Resilience Transport Infrastructure WaterwaysAdaption & Resilience Water Irrigation AgricultureAdaption & Resilience Water Irrigation Leisure Areas

Appendix B
Apportionments
When allocating sale values to adaptation and resilience, the data sources varied widely in terms of not only what they included in their definition for adaptation and resilience but also their granularity of detail. In some cases reported data was clear and the sales were accounted separately, however in others the sales figures reported included several other aspects not classified as adaptation and resilience. In cases such as this there is a need to triangulate with data sources outside of the industry. In the worked example included these additional data sources are shown where further evidence is needed to apportion an activity value. Our experience of needing these additional sources has varied across the major sub categories of A&RCC and a brief summary of this is provided below. In the case of enviro finance and enviro finance planning we have taken into account only those activities which have been identified by the industry as relevant to climate change as this sector is relatively well informed via the actuarial and financial analytical sectors. Any variation in value identified via our data triangulation process, as a back check, was minimal. In the case of waterways and barrier management we have looked at additional demand placed due to natural water course change and water burden management due to changing weather conditions. Although project definition was highly variable works procurement data gave higher definition and granularity in this area. In the case of weather station services we have taken the new demand on the sector for longer term weather change forecasting for sectors other than those who would normally require weather services for normal operational need, for example agriculture, shipping, aviation etc In the case of architectural project management services, architectural design services and architectural engineering data returns were relatively clear in the sector, as was the industry bodies definition for adaptation and resilience. In the case of insurance services we have used business return outputs from the actuarial sector where they clearly define new quotations business as a result of changing risk due to climate adjustment over previous years In the case of banking services and equity investment services whilst the financial sector is relatively well informed and has rich data sets in support, the sub sectors of banking services and equity investment are extremely difficult to segment and, therefore, allocate sales proportion to adaptation and resilience. In this case it has been necessary to triangulate the data in order to get a view of the proportionality of activity relevant to adaptation and resilience.
23

In the case of risk mitigation the industry is well segmented with growing specialism in the area of climate change and its affect and also how adaptation and resilience contributes to risk mitigation. As a result, data returns in this area are specific to adaptation and resilience and in this case, it has not been necessary to take market ripple effect into account as these services tend to rely only on technically proven demand. In the case of business continuity, this sub sector is broad in that it covers both normally occurring events and natural and man-made disaster. We were somewhat surprised to discover that this sector does not delineate well those services that are specific to climate change and adaptation and resilience. Therefore in this case it has been necessary to break out the allocated figures via triangulation with the construction, water, strata management, flood abatement and risk mitigation sectors in order to allocate values to adaptation and resilience. In the case of domestic, industrial and public urban enviro redesign & re engineering the industrial and public urban data sources were relatively specific in their delineation of adaptation and resilience. However, the domestic data had no delineation at all. Therefore as a result we have had to rely upon parallel data from the construction and civil engineering industry in order to see some proportionality in this area. Furthermore the domestic housing buildings insurance data networks have been helpful here. In the case of agricultural we have used data provided via the procurement industry and its industrial bodies in order to see spend in the sector. The agricultural sector overall is not well documented for our purposes when looking at the allocation of spend on a farm by farm basis. The most reliable data used here was from the water industry and its network of supply. It was also necessary to triangulate this data with waterways and barrier management sector data which also looks at irrigation and spur supplies. In the case of the manufacture of retro fit materials, supply of retrofit materials and retro fit buildings services. The construction industry trade bodies along with civil engineering and engineering institutions have been actively reporting the change in market demand as a result of climate change. Whilst data sources tend to conflict as a result of variances in definition and in this particular case significant differences as a result of the market ripple effect there are a large number of sources with which to triangulate. The key problem faced in this particular area was to reach agreement on the definition of a retro fit material that is relevant to climate change. In the case of adaptive civil engineering services, the sector is well reported with detailed information on the proportionality of adaptive and resilience projects and associated spend overall. Minimal data triangulation was required in this area. In the case of the manufacture of retro fit engineering equipment and the supply of retro fit engineering equipment the equipment is also used for other applications which are not associated with climate change, therefore it is necessary to relate sales to individual projects and specialisms which are specifically to do with climate change and adaptation and resilience. In order to achieve this we have triangulated data with additional data sources, which include the civil engineering, risk mitigation, architectural and actuarial sectors and their industry bodies. In the case of the manufacturers and suppliers of temporary accommodation for renovation projects we have taken the sales values which are over and above the normal
24

market trend for these temporary accommodation units as the same units are used in various other applications. As this sector is relatively small in terms of the construction sector, the end use of unit sales for temporary buildings was relatively well reported. In the case of construction & retrofit domestic, industrial, public and agricultural the industrial and public urban data sources were relatively specific in their delineation of adaptation and resilience. However, the domestic data had no delineation at all. Therefore as a result we have had to rely upon parallel data from the construction and civil engineering industry in order to see some proportionality in this area. Furthermore the domestic housing buildings insurance data networks have been helpful here. In the case of agricultural, however, the most reliable data used here was from the water industry and its network of supply. It was also necessary to triangulate this data with waterways and barrier management sector data which also looks at irrigation and spur supplies. In the case of sustainable drainage & water management domestic, industrial, public and agricultural we have relied almost solely on data from the water industry and its network of supply. Adaptation and resilience is a key focus in this sector at this time. In the case of transport infrastructure rail and road sector data is relatively good, with some triangulation from the procurement chain. In the case of transport infrastructure waterways we have relied almost solely on data from the water industry and its network of supply. Adaptation and resilience is a key focus in this sector at this time. In the case of water irrigation agriculture we have relied heavily on the procurement sector data as individual reporting is limited on a farm by farm basis. In the case of water irrigation leisure areas the sector has almost no detailed reporting on expenditure in this area. Therefore we have been reliant primarily on data streams from the civil engineering and construction industries for meaningful data.

26
© Crown copyright 2013
You may re-use this information (not including logos) free of charge in any format or medium, under the terms of the Open Government Licence. Visit www.nationalarchives.gov.uk/doc/open-government-licence, write to the Information Policy Team, The National Archives, Kew, London TW9 4DU, or email: [email protected].
This publication available from www.gov.uk/bis
Any enquiries regarding this publication should be sent to:
Department for Business, Innovation and Skills 1 Victoria Street London SW1H 0ET Tel: 020 7215 5000 If you require this publication in an alternative format, email [email protected], or call 020 7215 5000. BIS/13/P144