adams county gis websiteadamscountygis.com/docs/adamscounty_training book.pdf · adams county...
TRANSCRIPT

ADAMS COUNTY GIS
WEBSITE
USER GUIDE 2010

Adams County Geographic Information System
The Adams County GIS project is a multiparticipant project designed to develop an accurate, up to date geographic information system and is used to create more efficient local government. The Adams County GIS is a system which enables the user to see any geographic based information on a map and to analyze that information through the computer. This project began in 1992 and is now fully operational. Cooperation has been the focal point of this GIS. Funding has been provided by Adams County, the City of Quincy and the five major principal utilities operating within the County (AmerenCIPS, Adams Telephone Cooperative, Comcast Cablevision, Adams Electric Cooperative and Ameritech). Other major participants include the Great River Economic Development Foundation (GREDF), and the Quincy Area Chamber of Commerce. There has also been funding from Federal, State and private sector sources. We also appreciate the assistance we received from the Tri Township Fire Department, Road District Commissioners and Two Rivers Regional Planning Council. Our GIS has won many awards from a variety of organizations including the Illinois Geographic Information Association Special Service Award, the Special Achievement Award from the Consulting Engineers Council of Illinois and the Outstanding Civil Engineering Achievement Award from the American Society of Civil Engineers. The County also received the Excellence in Floodplain Management Award from the Illinois Association of Stormwater and Floodplain Management for its work with the GIS. The current web site is used on a daily basis by realtors, engineers, planners developers, educators and residents throughout the world. We have seen hits on our site from as far away as Washington DC, California and Florida as well as 26 Countries including India, Malaysia, Poland, Egypt, England, Germany and Hong Kong to name a few. We are proud to teach you the basics of using this web site. If you need any additional assistance with the site, feel free to call or email us anytime. You may contact us at [email protected] or by phone at 217-223-0614.

Section 1 - Introduction 1 Section 6 - Continued 19Website address 1 Bookmarks 20Information (home page) 1 Print PDF 21Pop Up Blockers 1 Settings 21Section 1 exercise 1 Help 24
Exit 24Section 2 - The Map Layout 2 Section 6 Exercise 24
Section 2 exercise 2Section 7 - The Tool Bar 25
Section 3 - Introduction to layers 3 Zoom In or Out 25Layers and folders 3 Zoom Full Extent 25Layer Types 3 Zoom to Layer 26Drawing of layers on map 3 Zoom previous 26Listing of layers 3 Pan 26Section 3 exercise 9 Identify 26
Erase selected 26Section 4 - Working with Layers 10 Query 27
Viewing layers on the map 10 Turn off all layers 28Visible scale levels 11 Section 7 exercise 28Active Layers 12Links to other sites or images 12 Section 8 - The Tool Boxes 29Section 4 exercise 14 Red Tool Box - advanced tools 29
Toggle Map Tips 29Section 5 - Map View and Component 15 Toggle Scale Bar 29
Map View 15 Create Callout text 29Slider Scale Bar 15 Measure Distance 30Information Bar 15 Measure Area 31Scale Box 16 Dynamic Layer Theming 32Quick View 16 Saving Session 32Current Map Tool 16 Open Session 34Active Layer 16 Email map image 34Jump to Box 16 Section 8- exercise 1 36Section 5 Exercise 16
Green Toolbox - Mark Up Tools 37Section 6 - Menu Tabs 17 points 37
About 17 lines 38Layers 17 buffered line 39Legend 17 rectangle 40Find drop down box 17 polygon 41Key Map 18 text 42
Adams County GIS WebsiteUsers Guide
Table of Contents

Section 8 - ContinuedGreen Toolbox continued
label 44grid 45x,y coordinates 46move mark up 46resymbolize mark up 47move vertex 48snap markup 50deselect markup 51undo/redo markup 51erase markup 51erase all markups 52section 8- exercise 2 52
Blue Toolbox 53Query 53Identify visible 54identify by radius 55select by rectangle 56select by line 56select by polygon 56select by radius 58select by buffer 59extract excel 61section 8- exercise 3 62
Other Tools 63Export KML 63Filter Builder 66Section 8 Exercise 4 67
2010 ©Adams County GISall rights reserved
Adams County GIS WebsiteUsers Guide
Table of Contents - continued

Section 1 - Introduction to the Adams County GIS Website 1. Website Address You may access the Adams County GIS website a couple of different ways. You may type in http://www,adamscountygis.com in the address window on your browser or go to the Adams County website at http://www.co.adams.il.us and click on online map from the home page. 2. Information Page The home page gives information about our website. To enter the map click on “Launch map viewer” as shown below.
3. Disable Pop Up Blockers The Adams County GIS website makes heavy use of pop up windows. It is important that you either turn off your pop up blockers or choose to allow pop ups from our website. After you click on “Launch Map Viewer” the site will check for any pop up blockers you may have turned on. You will see one of the following messages: Figure 1 Figure 2 If the message in figure 1 appears, you may continue to the website by clicking Launch Viewer. If the message in figure 2 appears you must turn off your pop up blocker. You may have a pop up blocker on your internet browser as well as any tool bars you have active, such as Google or Yahoo. Your virus protection may also have a pop up blocker. *Hint – If you do not want to disable your pop up blockers, you may use the crtl key to override the blocker while on the map page. Section 1 - Exercise – a. Access the Adams County Website b. Disable pop up blockers c. Launch the map viewer
1

Section 2 – The Map Layout The main map page is broken out into areas. The following areas will be covered in this manual. Section 3 and 4 - Map Layers Section 5 - Map View & Components Section 6 - Menu Tabs Section 7 – Toolbars Section 8 - Toolboxes Section 2 – Exercise 1. Find the map layers 2. Find the information bar 3. Find the menu tabs 4. Find the slider scalebar 5. Find the toolboxes 6. Find the toolbar
2

Section 3 – Introduction of Layers Layers and Folders Layers are arranged under folders similar to what you see in windows explorer. Each folder can be expanded to reveal the layers associated with the folder. Folders may be opened and closed to suit the user. A folder is shown as the folder icon and the layer is shown as the check box The folders represent a general area of interest and the layers for that area of interest are found within the folder. For example, the Transportation folder contains any layers having to do with transportation such as Road Labels, Road Centerline, Traffic Counts, Railroads and Railroad Crossings. The Adams County GIS has 2 main folders. The first is the Adams County IL GIS folder and contains all of the folders and layers pertaining to Adams County only. This is the main folder for the website and is the most often used. The second folder is National/Regional/State/Local and contains folders and layers for areas outside of Adams County. Adams County houses these layers as a “Good Neighbor” policy. Many counties do not have a full GIS and have no means by which to show any data they may have. Adams County realizes that sometimes the user is interested in data for areas outside of our own boundaries and so we have offered to house other data at no charge to these counties as a “good neighbor”.
Layer Types The layers are the heart of the Adams County GIS. A vector layer is drawn on the map as a point, line, or polygon. A raster layer is drawn as an image. Each vector layer has its own database which gives the user information about every segment of the layer. For example, the parcel layer shows the approximate property boundaries on the map as a polygon and, when identified, gives the additional information such as property owner, parcel identification number, taxes, etc. The address layer is a point file and the identify button results in the address. The centerline layer is a line file which contains data such as road name, address range, and jurisdiction. The 2009 Color Countywide layer under images is a raster layer and has no database. It is only drawn on the map. A raster image cannot be queried or identified.
Drawing of Layers on map Layers are drawn on the map from the bottom up. For example, the Addresses layer will be drawn on top of the Road Centerline. This is important to know because the image files are also drawn from the bottom up. The 2009 color countywide images will draw on top of the 1996 B & W Countywide which will cover up the 1996 images. Also solid color polygon files may cover a point or line file. The following is a list of the current folders and layers on the website. These folders and layers may change from time to time:
Adams County Layers Addresses -
Addresses - Transportation
Road Labels Road Centerline Traffic Counts (2000)
3

Railroads Railroad Crossings
Property Info
Section Labels Section Lines Parcel PIN Labels Parcel Owner Labels Parcels Subdivisions Rural Land Use
Jurisdictional Limits Quincy Limits Village Limits Unincorporated Villages Camp Point Zoning Quincy Zoning Townships Adams County Enterprise Zone
Districts Fire Districts Library Districts School Districts Drainage Districts
Economic Development Available Sites RADC
Points of Interest Lodging Food and Drink Businesses Places of Worship Schools Area Golf Courses
Hydrology Streams Mississippi River
Voting Info Precincts County Board Districts Quincy Wards
Floodplain Info River Gages FIRM MAP
4

LOMA LOMR BFE
Topography Planimetric Lines 2006 Planimetric Poly 2006 Index Contours 2006 (tri-township) 2 Foot contours 2006 USGS Contours Soil Name Labels Soils
Census Info Adams County Cities and Villages Adams County Census Blocks Illinois Counties Illinois Census Tracts
Survey Control/Tiles Adams County Control Points 2009 Aerial Tiles 2004
City of Quincy Services Quincy Bus Routes Quincy Sunday-Holiday Bus Routes Quincy Garbage Routes
Miscellaneous Siloam Springs Boundary
Cemeteries Cemeteries Ellington Cemetery – Quincy
Historical 1940s Survey Maps
Beverly Township Burton Township Camp Point Township Clayton Township Columbus Township Concord Township Ellington Township Fall Creek Township Gilmer Township Honey Creek Township Houston Township Keene Township Liberty Township Lima Township McKee Township Melrose Township
5

Mendon Township Northeast Township Payson Township Richfield Township Riverside Township Ursa Township 1938 Images 1938 Aerial Photos 1870s Township Maps Ursa Richfield Payson Northeast Mendon Melrose McKee Lima Liberty Keene Houston Honey Creek Gilmer Fall Creek Ellington/Riverside Concord Columbus Clayton Camp Point Burton Beverly
Images Quad Map 2009 Color Countywide 2009 Color Countywide (USDA 1 Meter) 2007 Color Countywide (USDA 1 Meter) 2006 Color (tritownship) 2004 Countywide 2005 B&W Countywide (1 Meter) 1998 B&W Countywide (1 Meter) 1996 B&W Countywide (1 Meter)
National/Regional/State/Local National Major Highways Places Counties States
6

IA_IL_MO DOQ-Quad Map Names Tri-State Boundaries USACE-Pool 19 – 1ft res USACE-Pool 20 – 1ft res USACE-Pool 21 – 1.5ft res USACE-Pool 22 – 1.5ft res Regional Regional Counties Regional Cities Regional PLSS_IL Regional PLSS_IA Regional PLSS_MO Regional Hydro Regional Highways Regional Street Names IA Images ` Ci-Keokuk-6inch-2002-BW Ci-Ft Madison-6inch-2002-BW IA-NAIP-2009-Color 1990s-DOQ-IA IL GIS in IL Municipal Web Sites IL County Web Sites Status of GIS in Counties Transportation Ci-Nauvoo-Road Labels-2008 Ci-Nauvoo-Roads-Surface Type – 2008 Ci-Nauvoo-Roads-City Maint-Yes/No-2008 Co-Mason-Roads IL-Roads Parcels Ci-Hull-Parcel Annotation Ci-Hull-Parcel Lines Jurisdictional Limits IL- Municipalities IL-Townships IL-Counties IL-State Boundaries Ci-Nauvoo-State Pk Boundary Ci-Nauvoo State Pj Lake
7
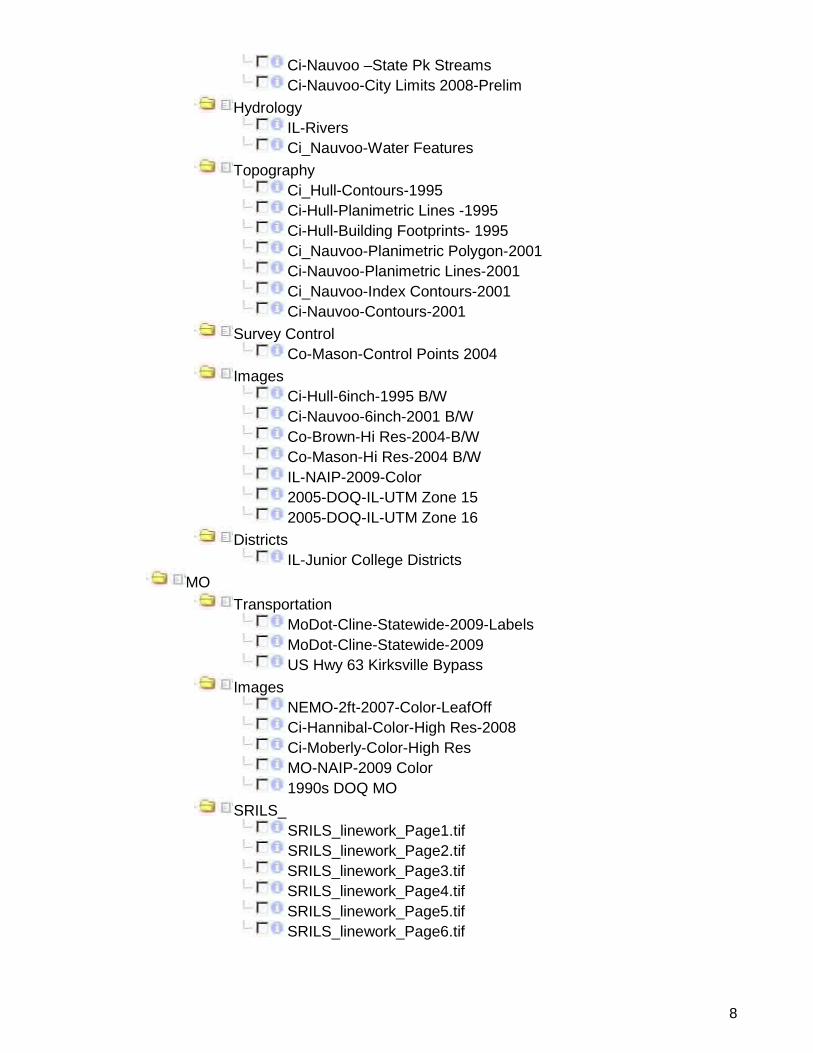
Ci-Nauvoo –State Pk Streams Ci-Nauvoo-City Limits 2008-Prelim Hydrology IL-Rivers Ci_Nauvoo-Water Features Topography Ci_Hull-Contours-1995 Ci-Hull-Planimetric Lines -1995 Ci-Hull-Building Footprints- 1995 Ci_Nauvoo-Planimetric Polygon-2001 Ci-Nauvoo-Planimetric Lines-2001 Ci_Nauvoo-Index Contours-2001 Ci-Nauvoo-Contours-2001 Survey Control Co-Mason-Control Points 2004 Images Ci-Hull-6inch-1995 B/W Ci-Nauvoo-6inch-2001 B/W Co-Brown-Hi Res-2004-B/W Co-Mason-Hi Res-2004 B/W IL-NAIP-2009-Color 2005-DOQ-IL-UTM Zone 15 2005-DOQ-IL-UTM Zone 16 Districts IL-Junior College Districts MO Transportation MoDot-Cline-Statewide-2009-Labels MoDot-Cline-Statewide-2009 US Hwy 63 Kirksville Bypass Images NEMO-2ft-2007-Color-LeafOff Ci-Hannibal-Color-High Res-2008 Ci-Moberly-Color-High Res MO-NAIP-2009 Color 1990s DOQ MO SRILS_ SRILS_linework_Page1.tif SRILS_linework_Page2.tif SRILS_linework_Page3.tif SRILS_linework_Page4.tif SRILS_linework_Page5.tif SRILS_linework_Page6.tif
8

Section 3 - Exercise 1. Which folder contains the Road Centerline file?________________________ 2. Which layer will draw on top, the road centerline or parcels?________________ 3. Is the addresses layer a point, line, polygon or image layer?_________________ 4. Is transportation a layer or a folder? ___________________________ 5. Which folder contains the Fire Districts layer?___________________________
9

Section 4 – Working with Layers Viewing layers on the map To view a layer on the map, simply click the check box next to that layer. For example, to see the parcels layer, 1. Click on the Property Info Folder 2. Click the box next to Parcels. 3. The parcel layer will now be visible in the map window. To turn off all layers within a folder, click the icon next to the folder.
10

Visible Scale levels Due to file size or visibility some layers are only able to be viewed at a certain zoom level. These layers will be grayed out until at the specified zoom level. For example, the Parcel Pin Labels and Parcel Owner Labels will make the map unreadable at the full view scale of the map. For this reason the Parcel Pin Labels and Parcel Owner labels are currently grayed out. To view the labels, click on the red plus sign next to the grayed out layer. The map will zoom to the visible extent and the layer will be checked with the labels visible on the map.
11

Active Layers Each point, line or polygon layer, (not image files), is associated with a database. Information can be found by making the layer active. To make a layer active, click on the blue button next to the layer in the Map layers column. This will turn the layer button black, indicating that it is the active layer. Fig. 1 Parcel layer not active Fig. 2 Parcel layer is active Identifying Information With the identify button, click anywhere within a parcel to find the information about that parcel. The active layer must be checked as “on” in order to identify any information. Links within an identify box. Some layers, when identified, contain links to pictures, files or other websites. This will be shown as “more data” within the identify information box. Clicking on the “more data” will take the user to the additional information.
12

1. Make the layer active.
2. Your active map tool should be “Identify”
3. Click on the desired location 4. A pop up window will appear with information about the chosen location for the layer 5. Click on “More Data” 6. A new window will open for the link to additional data
13

Section 4 – Exercise 1. Turn on the address layer 2. Turn on Parcel layer and Parcel Owner Labels 3. Turn off all layers within the Property Info folder 4. Make the address layer active 5. Identify an address 6. Make the parcel layer active (remember to turn parcel layer on first) 7. Identify a parcel. 8. Using the Ellington Cemetery Layer, what does the link take you to, an image, website or file?________________________ 9. At what scale do the parcel owner labels show?_______________________ (hint: look at the information bar) 10. Identify a traffic count. What 2 pieces of information are given? _____________________ and__________________________
14
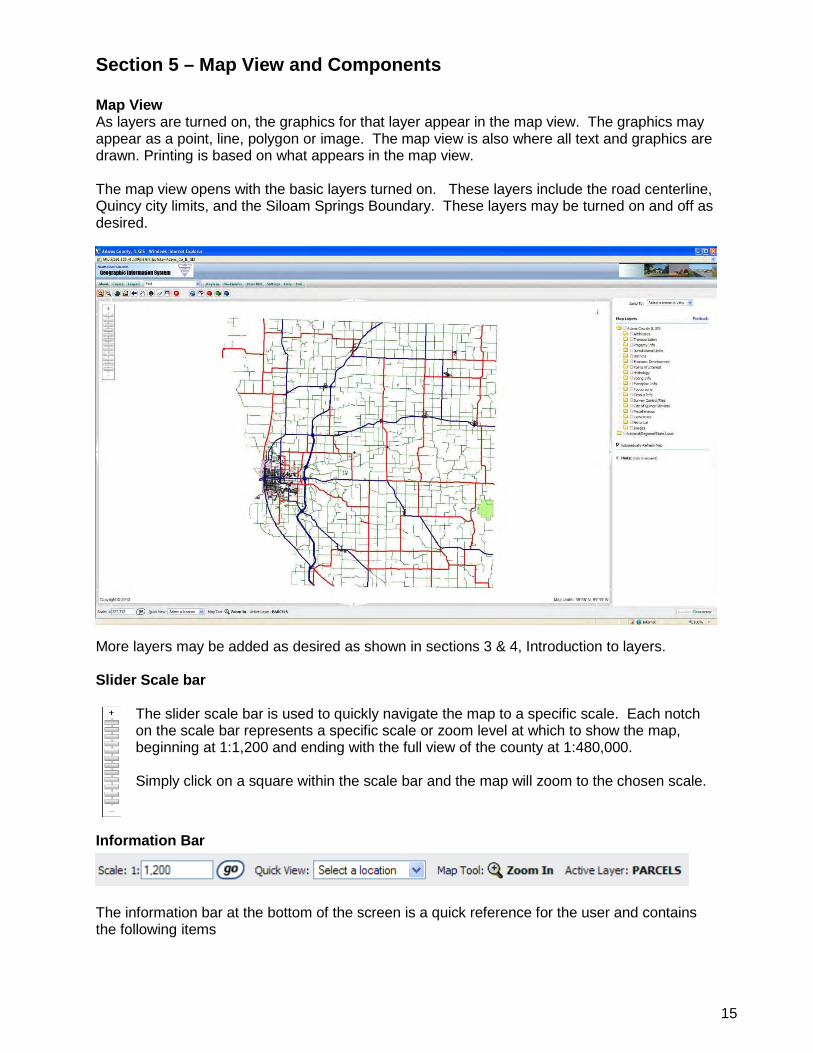
Section 5 – Map View and Components Map View As layers are turned on, the graphics for that layer appear in the map view. The graphics may appear as a point, line, polygon or image. The map view is also where all text and graphics are drawn. Printing is based on what appears in the map view. The map view opens with the basic layers turned on. These layers include the road centerline, Quincy city limits, and the Siloam Springs Boundary. These layers may be turned on and off as desired. More layers may be added as desired as shown in sections 3 & 4, Introduction to layers. Slider Scale bar
The slider scale bar is used to quickly navigate the map to a specific scale. Each notch on the scale bar represents a specific scale or zoom level at which to show the map, beginning at 1:1,200 and ending with the full view of the county at 1:480,000. Simply click on a square within the scale bar and the map will zoom to the chosen scale.
Information Bar The information bar at the bottom of the screen is a quick reference for the user and contains the following items
15

Scale box – Shows the current scale of the map. Also used to view the map at a specific scale. Simply enter the desired scale into the box and click go. Quick view – Used to quickly zoom the map to a specific area. Click the down arrow and choose the area to zoom. The choices are Regional Counties, Adams County, the TriTownship area and the City of Quincy. The quick view does not change the layer settings, it simply zooms to a preset area.
The Map tool – Shows the current tool in use.
Active Layer – Shows the current layer that is active.
Jump To Box - The jump to box allows the user to go back to the original view for the Adams County Base layers and the Regional Data layers. This choice will reset all layers to the original settings the map shows when first logged on.
Section 5 - Exercise: 1. Turn on the addresses layer. Are the addresses a point, line, polygon or image? (circle one) 2. Using the slider scalebar, view the map at a scale of 1:60,000. 3. Using the scale box, view the map at 1:6,120. 4. What is the current map tool? ___________________________________ 5. What is the current active layer?________________________________ 6. Quickly zoom to the TriTownship Area. Which tool was used?_______________ 7. Return to the original settings of the Adams County Base Layers. Which tool was used? _______________________
16

Section 6 – Menu Tabs
1. Simply tells a little about the Geocortex software used to power the Adams County Website
2. Used to view the “layers” window
3. Used to view the legend of the map 4. Find Drop Down Box:
This drop down box is used to quickly find a specific item. For example, to find an address
Scroll down to Street Address.
A new window will appear
Type an address in box. (Hint – it is better to NOT type in the entire address. Type in the house number only.) Click Search (you must click the search bar. If you hit enter on the keyboard, it will erase the address and not return an answer)
17

A new window with choices of matching addresses will appear. Choose the desired address. Click Zoom
The map will zoom to the chosen address and highlight the point. (The address layer must be checked as “on” to view the point)
5. It is easy to “get lost” when zoomed in. To find the area of the county your map is showing click the keymap button.
Map View:
Click Key Map
Result: A map appears on the right side showing where the map view is zoomed.
18

6. Sometimes the user frequents a certain area of the county. A Bookmark is created to be able to return to that area. To create a bookmark:
Zoom to desired area:
Click If other bookmarks have been created, they will show here. To create a new bookmark click (add current extent)
Type a name for the bookmark in box and click ok
Your bookmark has now been created. To return to this area click and choose the name of your bookmark.
19

7. Printing from the website is very easy. Maps are printed to a “pdf” file which may be opened in Adobe Acrobat or Acrobat reader. The map may be printed immediately or saved as a file to be emailed or opened at a later date.
To create the map you wish to produce. click The following screen will appear:
Choose the layout and scale desired and click ok The following message will appear
When the map is created the following message will appear
Click on open map Your map will open in adobe acrobat (or acrobat reader if you do not have adobe acrobat) At this point you may print the map or save the map for future use.
20

8. The user may change several settings for the map viewer. Click and the following menu will appear: Setting 1 - Clicking on will bring up the following box:
All layers in the Adams County GIS will be shown in this box. By default, all layers are checked as to show on the legend. Scrolling down to the bottom of this box gives the following choices
21

If only a few layers are desired, click the and then check the boxes for the desired layers.
Scroll back to the bottom and click Setting 2 - This sets whether a small crosshair is drawn at the center of the map. Click the Following box will appear
Choose yes or no and click ok. Setting 3 - Sets which layers and associated attributes will be shown when the user hovers over a map feature. Click . The following window will appear.
22

Choose the layer you wish the information to appear as you hover over an item. For example, if you want the owner name to appear as you hover over a parcel, choose the Parcels layer. The following box will appear showing all of the attributes of the parcels layer:
Click on Owner name as shown above. Scroll to the bottom of the window and click apply
Go back to the map and “hover” the curser over a property. The property owners name will appear as below:
23

9. This button is a generic help button for the software used.
10. Closes your session and your browser. Section 6 – Exercise 1. What do red roads represent on the map? (hint – check legend) __________________ 2. Find the Address of 117 Park Plaza, Quincy (Turn address points on) 3. Make a bookmark for that address. 4. Define a map tip to show the addresses of the address layer. 5. Print a map of the tritownship area. (hint – remember your quick view) 6. Go to the bookmark you created for 117 Park Plaza 7. Open the keymap 8. Exit the program
24

Section 7 – The Tool Bar
The tool Bar is used to navigate the map.
Zoom In or Out – These tools are the standard zoom in and out buttons found on most digital maps.
To Zoom in to a specific area on the map click Click on the map and hold the left mouse button down. Draw a box around the area you want to see.
Release the mouse button and your map will zoom the to area defined by the box
To Zoom out click Click once anywhere on the map and the map will zoom out. To continue zooming out, click again on the map.
To zoom to the full extent of the map click Some layers do not cover the entire County. Some are only to the extent of the City of Quincy
or the TriTownship Area. To zoom to a specific Area click a new window will appear as follows:
25
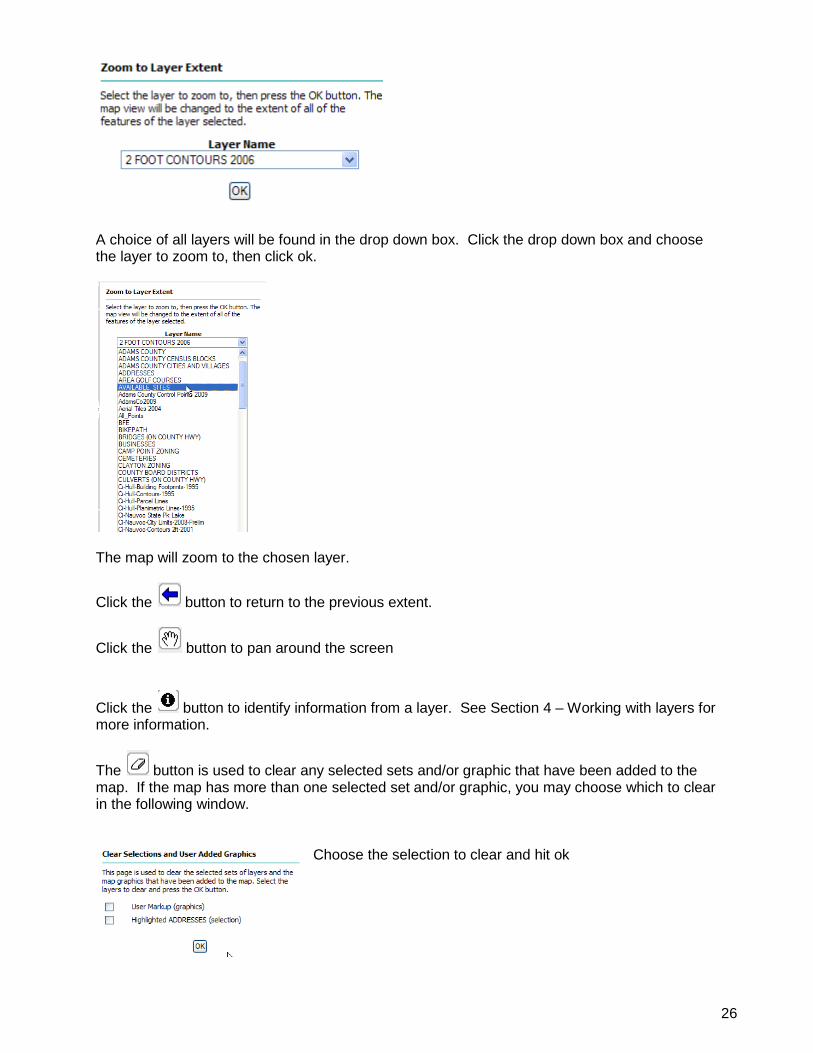
A choice of all layers will be found in the drop down box. Click the drop down box and choose the layer to zoom to, then click ok.
The map will zoom to the chosen layer.
Click the button to return to the previous extent.
Click the button to pan around the screen
Click the button to identify information from a layer. See Section 4 – Working with layers for more information.
The button is used to clear any selected sets and/or graphic that have been added to the map. If the map has more than one selected set and/or graphic, you may choose which to clear in the following window.
Choose the selection to clear and hit ok
26

The Query tool is similar to the find drop down box, except is used for more complex searches.
Click the The following box will appear
Build the query you wish for. For Example, to find the Camp Point Fire District Choose Fire Districts Click Having “Fire Dist” Click = Enter Camp Point Click add to Query Click Execute The Result will turn on the Fire Districts Layer and Highlight the Camp Point Fire District.
27

To Turn all Layers off, click Section 7 – Exercise 1. Zoom to the full extents of the map. 2. Zoom in to a small area in the Northeast part of the County. 3. Zoom to the extents of the bikepath layer 4. Pan to the North. 5. Go back to the bikepath layer 6. Query the Quincy Bus Routes to find the Route Name of “Blue” 7. Clear that selection. 8. Zoom out a small amount. 9. Turn all the layers off.
28

Section 8 – The Tool Boxes
This section will cover the toolboxes to the right of the toolbar and two icons to the left of these boxes.
The red tool box contains advanced tools. Click on the red toolbox to see these tools.
Toggle map tips Toggle scale bar Create callout text Measure distance Measure Area Dynamic Layer Theming Saving Session Open Session Email map image
Toggle map tips is used when you have defined map tips in the “Settings” menu tab. Click the toggle map tips button to turn off the display of these map tips.
Toggle Scale bar is use to turn off and on the scale bar shown on the map
The Callout text button is used to add callout text to the map. Click the callout text button And click the map at the point you want to start the callout text. The following box appears: Click the map again to set the position of the text box. The following box will appear: Enter your text in the box Click OK Optionally: Set text size Set Text Color Set background color Click OK
29
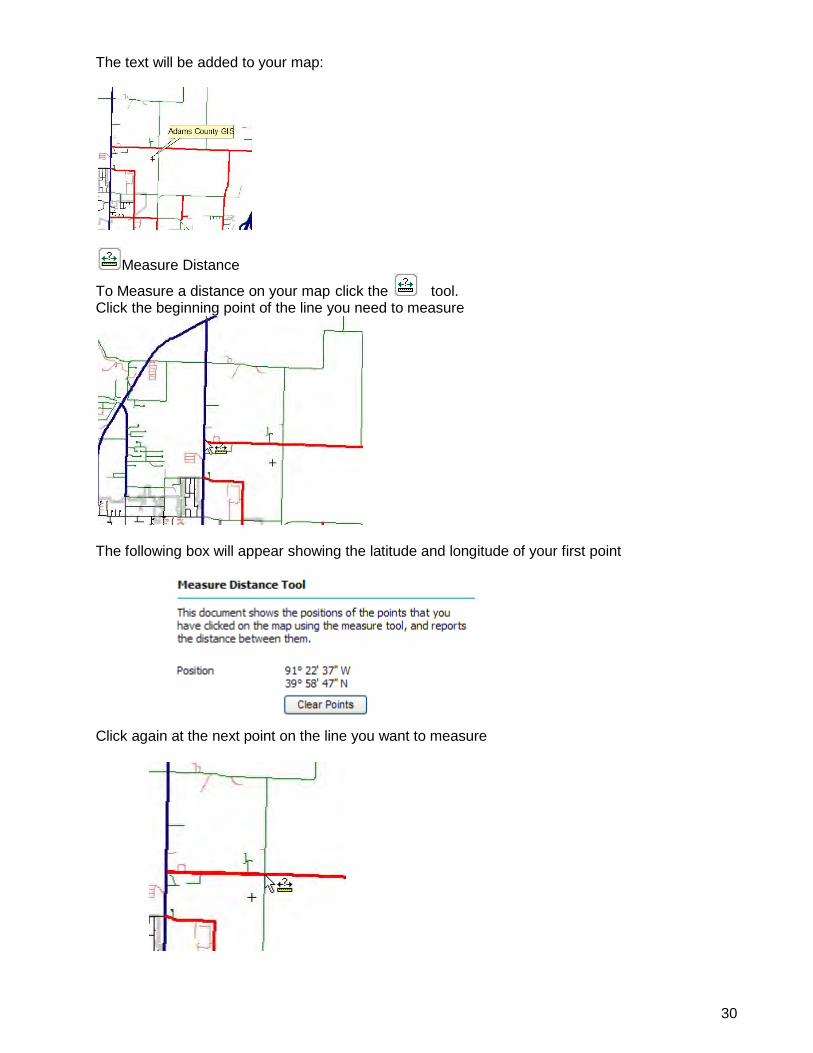
The text will be added to your map:
Measure Distance
To Measure a distance on your map click the tool. Click the beginning point of the line you need to measure
The following box will appear showing the latitude and longitude of your first point Click again at the next point on the line you want to measure
30

The following dialog box will appear showing the latitude and longitude of the last point clicked, the distance between the two points and the true course of the line.
Measure Area – To measure an area click the tool and click the first point of your area on the map.
The following dialog box appears showing the latitude/longitude of the first point Continue Clicking at various points around the area until you complete a polygon.
31
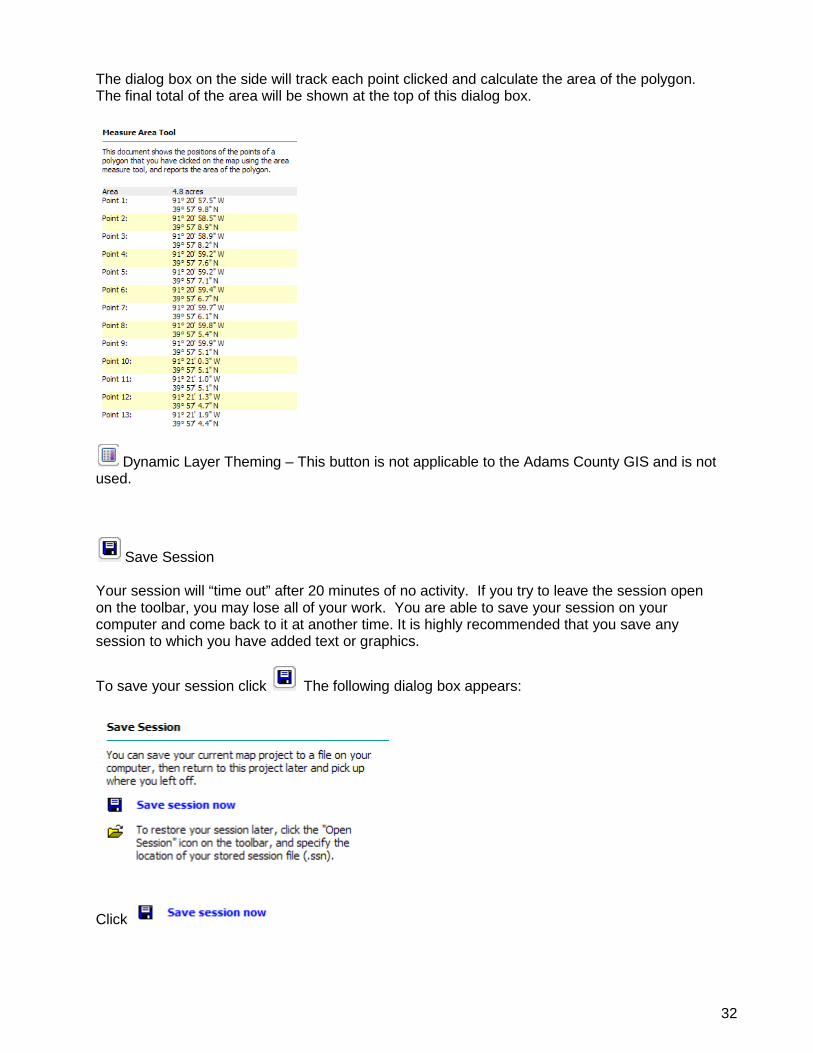
The dialog box on the side will track each point clicked and calculate the area of the polygon. The final total of the area will be shown at the top of this dialog box.
Dynamic Layer Theming – This button is not applicable to the Adams County GIS and is not used.
Save Session Your session will “time out” after 20 minutes of no activity. If you try to leave the session open on the toolbar, you may lose all of your work. You are able to save your session on your computer and come back to it at another time. It is highly recommended that you save any session to which you have added text or graphics.
To save your session click The following dialog box appears:
Click
32

The following message appears
Click You will then be shown a box to name and save the file on your computer.
Choose the location and name for your session. Click Save. A box will appear verifying that the file was saved. Click Close.
33

Open Session
To open a previously saved session click The following box will appear
Click and navigate to your saved session:
Click
Click Your saved session will open, including and text or graphics you may have added and saved.
Emailing maps There are two ways to email a map. You may simply print the map to a pdf, save it and email it
as an attachment from your own email or click The Email message box appears:
34

Enter the email to address Enter your own email address Choose the file type for your map Type in a message to appear in the email Click send
Your map is on its way!
35

Section 8 – Exercise 1. Toggle off the sliding scalebar. 2. Add the Callout text “I DID IT” to your map. 3. Measure 48th Street from Broadway to Maine. What is the distance?_______________ 4. Pan up to the Wal Mart building. 5. Measure the perimeter of the Wal Mart Building. What is the Area?______________ 6. Add your name and the Area of the Wal mart Building as call out text to your map. 7. Save your project. 8. Zoom to the extents of the map. 9. Open your saved project. 10. Email your map to [email protected]
36

Section 8 – The Tool Boxes - Continued The green toolbox contains the Mark up tools.
Points Lines Buffered line Rectangle Polygon Text Label Grid X, y location Move markup Resymbolize markup Move vertex Snap markup Deselect markup Undo/redo markup Erase markup Erase all markups
Click on the green toolbox to open. POINTS To add a point to your map click Click the location on the map where you want the point.
The following dialog box appears
Choose the symbol type Choose the fill color Choose the outline color Choose the point size Add text (if desired)
37

Click Submit The point will appear on your map with any text (if added) LINES
To add a line to the map click Click the location on the map to start the line
Continue clicking until the desired line is complete.
When finished, click Choose your color and width
Choose line color Choose line width Click ok
38

The line will be drawn on the map.
BUFFERED LINE
To add a buffered line click Click the beginning point of your line The following dialog box will appear
Continue clicking until the desired line is complete
Click Choose the desired line symbols
39

Click OK The line will be drawn on the map
RECTANGLE
To add a rectangle to the map click Click on the map where the rectangle will appear. Do not release the left mouse button. Hold the left mouse button down and continue drawing the size rectangle you want.
The following dialog box will appear
Choose the settings and click
40

The rectangle will appear on the map.
*HINT – For a rectangle with no fill (outline only) use the line tool instead of rectangle. The rectangle tool will not draw a rectangle without fill. POLYGON
To draw a polygon click Click on the map the starting place of the polygon. Continue clicking until the desired shape is achieved.
The following dialog box will appear.
Click
41

The following dialog box will appear
Choose the desired settings and click The polygon will appear on the map
*HINT – As with the rectangle tool, to draw a polygon with no fill (outline only) use the line tool instead of polygon. The polygon tool will not draw a rectangle without fill. TEXT
To add text to the map, click Click the map at the point the text should begin. The following dialog box will appear.
42

Add desired text here Choose Font Choose Style Choose Text size Choose Text Color Choose Background Color Click ok The text will be added to the map.
43
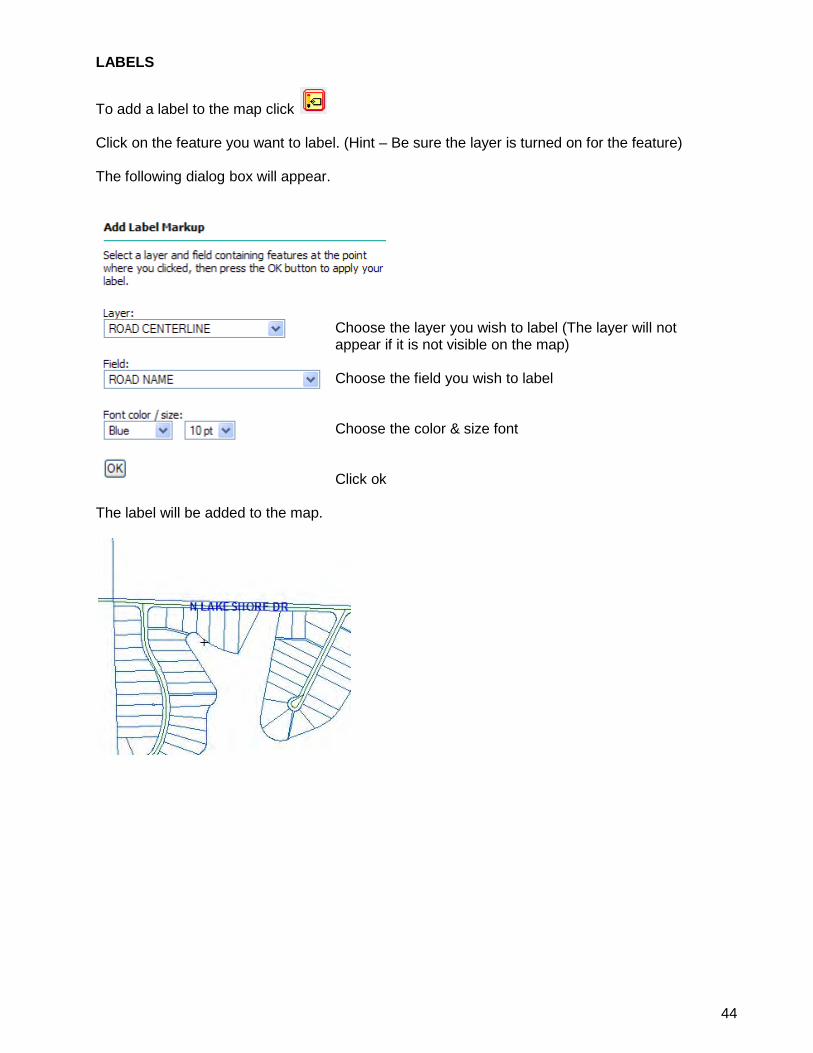
LABELS
To add a label to the map click Click on the feature you want to label. (Hint – Be sure the layer is turned on for the feature) The following dialog box will appear. Choose the layer you wish to label (The layer will not appear if it is not visible on the map) Choose the field you wish to label Choose the color & size font Click ok The label will be added to the map.
44
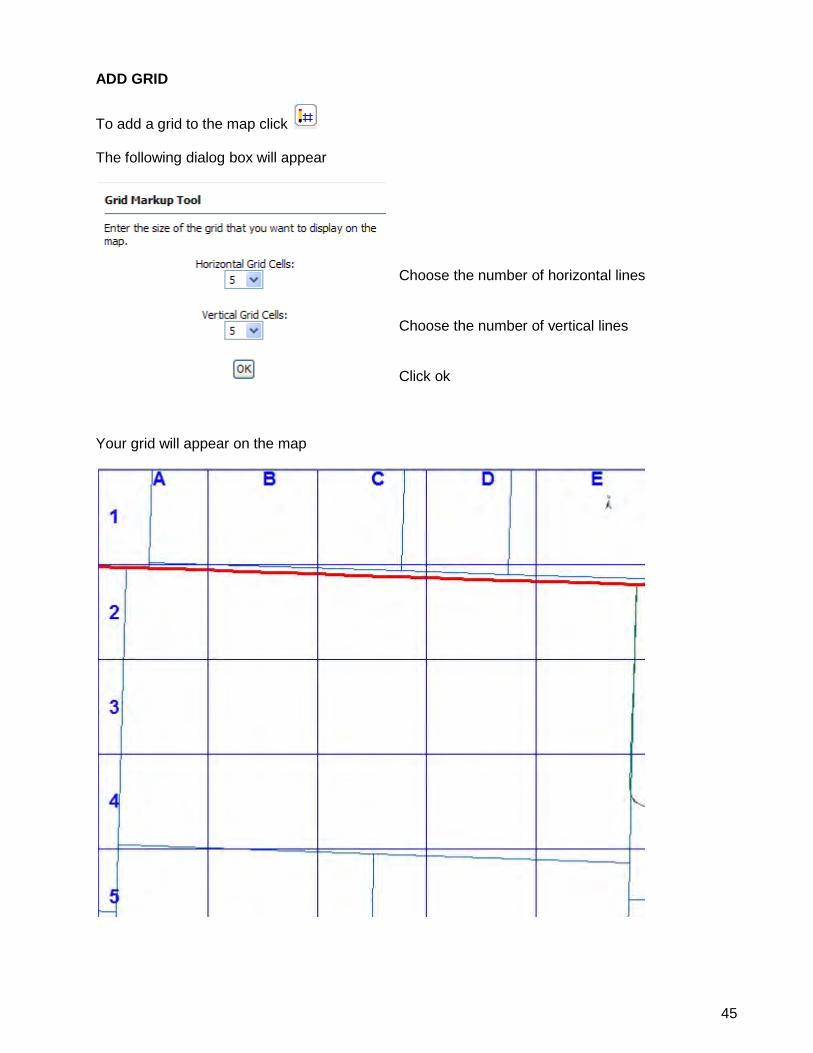
ADD GRID
To add a grid to the map click The following dialog box will appear
Choose the number of horizontal lines Choose the number of vertical lines Click ok
Your grid will appear on the map
45

ADDING LATITUDE AND LONGITUDE TO MAP
To add the latitude and longitude to your map click Click the point on the map you want the coordinates The latitude and longitude will appear.
MOVING MARKUPS
To move a markup click Click and hold left mouse button and draw a box around the markup.
The markup will be selected
46

Click the location to move the markup to. The markup will be moved on the map.
RESYMBOLIZE MARKUP
To resymbolize a markup click Click and hold left mouse button and draw a box around the markup.
Markup will be selected
The following dialog box will appear
47

Change the settings as desired. Click Markup will change
MOVE VERTEX A vertex is a point at which to angles meet within a polygon.
To move a vertex of your markup click
48

Click the markup you wish to edit
Click again at the vertex area you wish to edit Click the new position for the vertex The vertex will move
49

SNAP SELECTED MARKUP
To snap a markup to a specific layer use Click on the mark up The following dialog box will appear with markups around each vertex on the map
Choose the layer to snap to Choose the distance for snapping click update Click Submit
The markup will snap to the layer
50

DESELECT MARKUP
To delselect a markup click UNDO REDO
To undo a markup operation click
To redo a markup operation click ERASE MARKUP
To erase one mark up click Hold the left mouse button down and draw a box around the markup
The markup will be deleted
51

DELETE ALL MARKUPS
To delete all markups click Map with markups erase all markups All markups removed
Section 8 – Exercise 2 1. Find PIN # 233129600000 (hint-use the find drop down box). Zoom to the parcel. Zoom again to have the parcel almost fill the screen 2. Label the parcel by the Owner name. 3. Move the owner name so that it is centered in the parcel 4. Change the color of the owner name to red and the text size to 12. 5. Add the latitude and longitude to the upper part of the parcel. 6. Outline the parcel using the line tool. Make the line green and 5 pixlels. 7. Erase the owner name 8. Undo the erasure owner name. 9. Erase all the mark ups
52

Section 8 – The Tool Boxes - Continued The blue toolbox contains the Selection tools.
Query Identify Visible Identify by radius Select by rectangle Select by line Select by polygon Select by Radius Select by buffer Extract to excel Click on the blue toolbox to open. QUERY BUILDER This is the same query builder as is found on the toolbar.
To start the query builder click The following box will appear
Build the query you wish for. For Example, to find the Camp Point Fire District Choose Fire Districts Click Having “Fire Dist” Click = Enter Camp Point Click add to Query Click Execute The Result will turn on the Fire Districts Layer and Highlight the Camp Point Fire District.
53

Identify visible The identify visible tool is similar to the identify tools except it will identify all layers that are visible instead of only the active layer. We have the following layers turned on (visible) Addresses Parcels Precincts
Click Click anywhere on the map. (if you want the address you must click on a point)
The following information will be shown
Notice that you just identified information from 3 separate layers, The Precincts, the Parcels and the addresses.
54

IDENTIFY BY RADIUS This feature is used to identify by radius. Please note that this is NOT the same as select by radius which will be discussed later. This will simply give you a window identifying all the features, it will not select the features. To identify by radius click Click the center area of the map on which you want to identify features within a radius. For example, we want to identify all properties within 250 ft of the center a property. Click Click the center of the property
The following dialog box will appear
Choose the layer from which you want to identify the features Choose the distance from the point clicked Click ok
55

You will return the following results: a map showing the radius and a listing of all properties within that area SELECT BY RECTANGLE, LINE OR POLYGON
To select a group of features using a rectangle click , a line click , select by polygon
click , Click one corner of the area you wish to select and, holding the mouse button down, draw a rectangle around the features, click each end of the line for a line through the features or click each vertex of the poygon for a polygon around the features you wish to select.
Select by rectangle Select by line Select by polygon
56

Features will be selected
You will have a choice of reports
The Default Report
The default report is the same report you receive when identifying a feature. Scroll through the list to see all features selected. You are able to zoom to each feature individually.
57
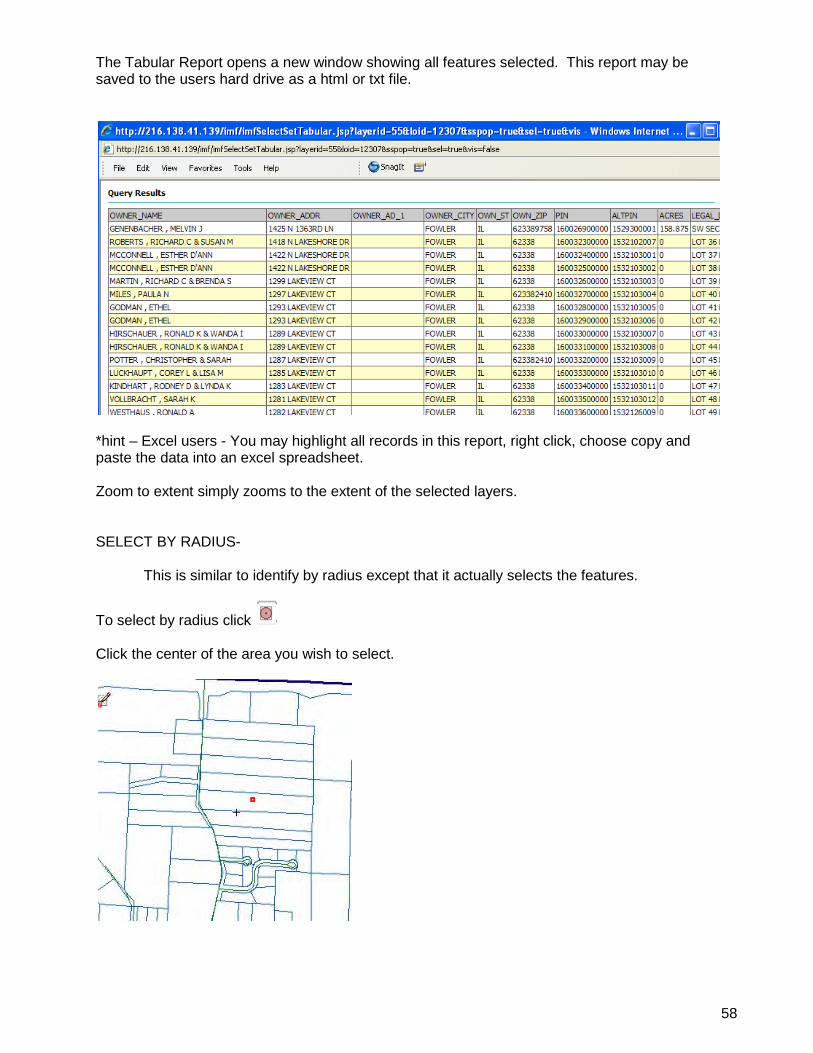
The Tabular Report opens a new window showing all features selected. This report may be saved to the users hard drive as a html or txt file.
*hint – Excel users - You may highlight all records in this report, right click, choose copy and paste the data into an excel spreadsheet. Zoom to extent simply zooms to the extent of the selected layers. SELECT BY RADIUS- This is similar to identify by radius except that it actually selects the features.
To select by radius click Click the center of the area you wish to select.
58
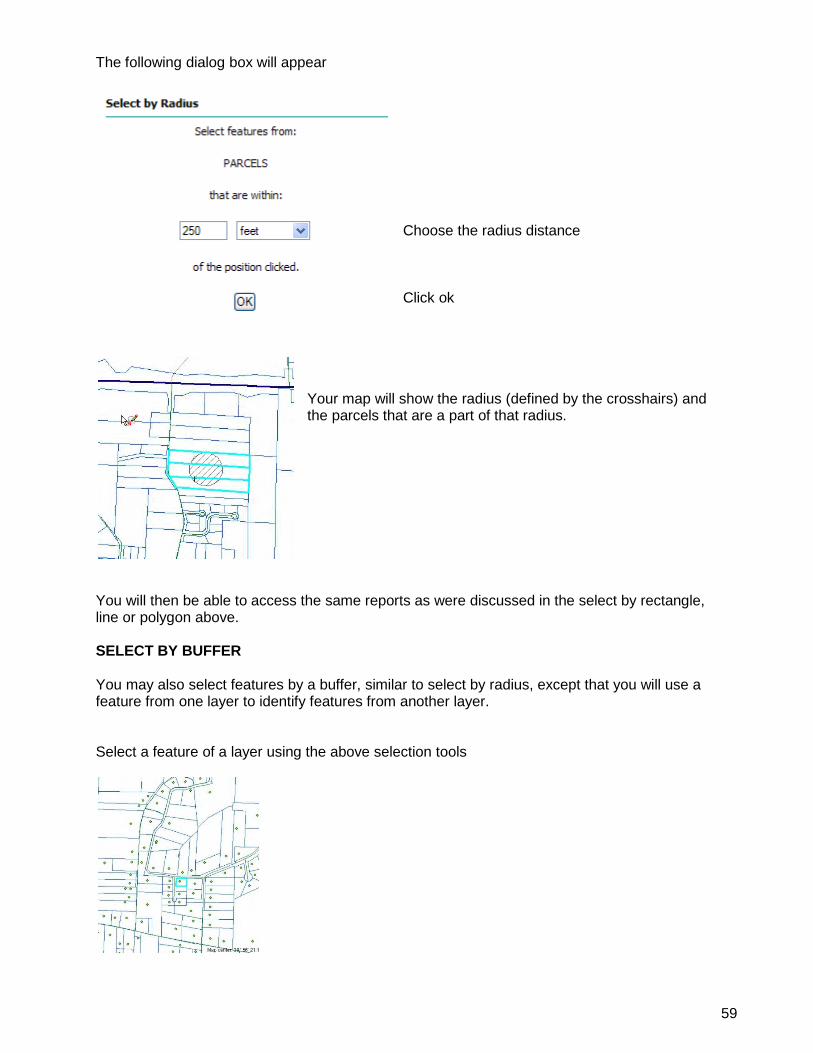
The following dialog box will appear
Choose the radius distance Click ok
Your map will show the radius (defined by the crosshairs) and the parcels that are a part of that radius.
You will then be able to access the same reports as were discussed in the select by rectangle, line or polygon above. SELECT BY BUFFER You may also select features by a buffer, similar to select by radius, except that you will use a feature from one layer to identify features from another layer. Select a feature of a layer using the above selection tools
59

Click The following box will appear
Choose another layer to select the features from Choose the distance for the buffer Click ok All addresses within 250 ft of the selected parcel will be selected.
You will also have the same reports as listed above. *not – at this time you cannot select the features from the same layer as your original selection (such as selecting all parcels within a distance of the selected parcel) We are currently trying to find a workaround for this problem)
60

EXTRACT TO EXCEL Any selected set map be exported to an excel spreadsheet. This is especially useful when needing to create address labels. Create a set of selected features using any of the methods listed previously.
Click The following box appears
Choose the layer where your features are selected Choose whether the visible extent only or to include features outside the view Choose yes for selected features only* Click ok
* Do not try to export all of the features from a layer. Most layers have many features and may lock up your computer if you try to export everything in the layer. The following box will appear:
From here you may download the file and unzip it on your computer or simply open the excel file at which time you may save it to your computer.
61

Section 8 – Exercise 3 1. Find the address of 117 Park Plaza 2. Select all of the addresses in the subdivision using a polygon 3. Open the tabular report 4. Extract the selection to excel using only the selected addresses within the view extent 5. Turn on only the addresses, section lines, parcels and Quincy Wards 6. Click on any address point. Identify by visible. Which layers did you get results from? _____________________________________________________________________ 7. Find all the parcels within 400 ft of 215 Anderson Ct. Extract them to an excel file.
62

Section 8 – Other Tools There are two additional tools located to the left of the toolboxes
EXPORT TO KML Google Earth is a popular mapping program used by many. Data from the Adams County GIS may be exported to Google Earth using the export to KML tool. IMPORTANT – YOU MUST HAVE GOOGLE EARTH INSTALLED ON YOUR COMPUTER TO UTILIZE A KML FILE. Select the features you wish to export to Google Earth. (Note – do not try to export a large selection or an entire layer to a kml. This may cause your system to lock up.)
Click The following dialog box appears
Choose the layer of the selected set Choose yes or no for the extent Export only the selected features Click ok
63

Another dialog box appears
Complete the Fields. The Name of the extract folder is the only required field. Others are optional.
Click While the program creates the kml file this message appears
When the file has successfully been created, this dialog box appears.
64

You may download this as a zip file or open the kml file.
Click This message appears
Click Google earth will open and your layer will be placed on the map.
65

FILTER BUILDER At times, you may not want to see all parts of a layer. For example, The Precincts layer currently shows all the precincts in Adams County. You may only want to show the precincts located in Mendon Township.
All Precincts
Click The following dialog box appears
Choose precincts layer Where Precinct Is equal to Mendon1 (or Mendon 2) Add to Query Click Execute
66

Your resulting map will show only the precincts in Mendon Township
This is very similar to the selection queries covered earlier, however the filter builder does not select a feature. It simply makes only the queried feature visible. Section 8 – Exercise 4 1. Zoom to 281 Lexington 2. Make the parcel layer active 3. Select all the parcels around the address 4. Export the parcels to a kml file and open the file in Google Earth 5. Close Google earth 6. Go to the Adams County Base Layers 7. Turn on the Fire Districts Layer 8. Show only the Ursa Fire District on your map.
67

For Questions or Comments, please contactAdams County GIS
101 N 54th StQuincy, IL 62305
(email) [email protected]
GIS Specialist
2010 ©Adams County GISall rights reserved
Joye Dell Baker, GISP
(phone) 217-223-0614(FAX) 217-223-9418