ad hoc reporting - bureau of indian education | home
TRANSCRIPT

Ad hoc ReportingNovember 2009
User Guide
Document Features:Ad hoc Reporting Tools
Sample Queries, Filters and ReportsExplanation of Ad hoc Options

Infinite Campus User Guide – Ad hoc Reporting
This document is intended for restricted use only.
Infinite Campus asserts that this document contains proprietary information that would give our competitors undue advantage should they come into possession of any part or all of it. As such, this document cannot be publicly disclosed unless so ordered by a court of competent jurisdiction.
©2009 Infinite Campus, Inc. All rights reserved.
INFINITE CAMPUS and Transforming K12 Education are registered trademarks of Infinite Campus, Inc. The INFINITE CAMPUS logo is a trademark of Infinite Campus, Inc. This publication, or any part thereof, may not be reproduced or transmitted in any form or any means, electronic or mechanical, including photocopying, recording, storage in an information retrieval system, or otherwise, by anyone other than Infinite Campus, Inc. without written permission of Infinite Campus, Inc., 4321 109th Avenue NE, Blaine, MN 55449, tel. (651) 631-0000, email [email protected].
Infinite Campus User Guide – Ad hoc Reporting
Table of ContentsIntroduction 1Overview of Ad hoc Reporting 2
Filter Designer 5Saved Filters 6Copy Filters 7Delete Filters 8Query Wizard 8
Query Wizard Filter Options 9Data Element Fields 12Sample Queries for the Query Wizard 13
Selection Editor 18Pass-through SQL Query 19
Report Designer 22
Report Builder 26
Gender Pronouns 28
Data Export 30
Cube Designer 32Saving Reports 34Display Options 37Report Height and Width Display Options 38Preferences 39Options on the Pivot Table 60Data Analysis Help Features 65Sample Reports in the Cube Designer 65
Data Warehouse 66
Student Information – Ad hoc Reports 67

Infinite Campus User Guide – Ad hoc Reporting
1
IntroductionThis user guide provides detailed, end-user information related to the Ad hoc Reporting module, which provides alternatives to standard reports and allows users to select data elements for the report and alter certain reporting layouts.
All graphics and related depictions of confidential user information have been modified in accordance with privacy laws. Graphics are for example purposes only and do not necessarily depict actual district or state configurations.
AudienceThe information contained in this document is intended ONLY for use by Campus internal staff, Campus district system administrators and district staff responsible for creating reports.
DocumentationRelated documentation may be available from the Customer Support Portal, http://support.infinitecampus.com, or upon request.
For more information related to the topic of this user guide, please refer to the following documentation:• Technical Guide – Ad hoc Filter Designer and Report Designer• Technical Reference – Cube Designer• Technical Reference – Ad hoc Pass-Through SQL Queries• Technical Reference – Honor Roll Pass-Through Queries
Related documentation is also available within the Help Index.
Software SupportCampus district system administrators should contact their designated support representative or Campus Support.
Feature UpdatesPer the publication date of this document, no changes have been made to the discussed features. Please see the most current release notes for product fixes and enhancements. Recently addressed modifications to the user interface are viewable within the Help Index when those items have adequately passed quality assurance procedures.
Hardware RequirementsThe tasks mentioned in this technical guide may be performed on a PC or Macintosh. Please see the Supported Platforms Technical Reference, available on the Customer Support Portal, for specific requirements.

Infinite Campus User Guide – Ad hoc Reporting
2
Overview of Ad hoc ReportingData stored within Campus can be managed to define, design, display and report information needed for instruction, reports and communications. Most elements visible in the user interface are available for inclusion in an ad hoc filter, which can then be used in standard reports, ad hoc reports, advanced search, and many other areas of Campus.
There are five tools within Ad hoc Reporting:• Filter Designer – allows selection of data elements or creation of custom groups of students• Report Designer – allows creation of custom reports and letters• Report Builder – combines filters with designed reports• Data Export – exports certain ad hoc filters in various formats• Cube Designer – analyzes data within Infinite Campus
Users can also generate reports from a flattened database if using Data Warehouse.
User SecurityIn addition to other tool rights, individuals required to create filters or build reports should have the following tool rights. System administrators will need to be members of any group with whom they need to share filters and reports.

Infinite Campus User Guide – Ad hoc Reporting
3
Campus Tool Name Path Read Write Add DeleteStudent Ad hoc tab Student Information > General > Ad hoc XFilter Designer Ad hoc Reporting > Filter Designer X X X XReport Designer Ad hoc Reporting > Report Designer X X X XReport Builder Ad hoc Reporting > Report Builder X X X XData Export Ad hoc Reporting > Data Export X X X XCube Designer Ad hoc Reporting > Cube Designer X X X X
Additional information on tool rights is provided in the User Tool Rights Technical Guide.
NOTE: Ad hoc Reporting tools contain sensitive information about students related to FIRPA and HIPPA. It is advised that users who have the ability to generate reports are aware of the importance of this data.

Infinite Campus User Guide – Ad hoc Reporting
4
Explanation of Tool Right OptionsRead – allows a user to view tool, but not make changesWrite – allows a user to view tool, and make changesAdd – allows a user to view tool, make changes and add new itemsDelete – allows a user to view tool, make changes, add new items and delete existing items

Infinite Campus User Guide – Ad hoc Reporting
5
Filter DesignerPath: Ad hoc Reporting > Filter Designer
The Filter Designer provides a tool for the end user to select certain fields located throughout the product and place them in one central report.
The Filter Designer provides three different ways of creating student filters:• Using the Query Wizard; • Using the Selection Editor; and • Using a pass-through SQL Query.
Filters are a selection of data (student, census/staff, courses/section) used to generate other custom reports, report cards, mailing labels, etc.
Filters that have been created previously and saved will appear in the Saved Filters box on the left-hand side of the screen. Icons are shown for the different filters created. There are also three types of filter data from which a user can select. When selected, the data in the filter will only display information from that data type. Options are Student, Census/Staff or Course/Section.
Several state reporting extracts can be generated using the Filter Designer, and reports can be made available to certain user groups to access these reports.

Infinite Campus User Guide – Ad hoc Reporting
6
Saved FiltersAny filter created can be saved for use in the report builder. Only query wizard filters are available in the Data Export Wizard.
Saved filters are organized alphabetically by the name of the filter and have the following icons:
Query Wizard
Selection Editor
Pass-through SQL Query
Saved filters can be edited at any time by selecting the filter and clicking the Edit button. This will display the filter so users can modify the selected fields and verify the operations and export options.
Search results on the Search tab can be populated with saved filters. When a saved filter is selected, click the Search button. Results returned in the filter will be displayed in the Search tab.

Infinite Campus User Guide – Ad hoc Reporting
7
Copy FiltersFilters can be copied for additional editing. Select a saved filter and click the Copy button. A pop-up message will appear indicating the filter has been copied. Copied filters are named Copy of [Original Filter Name].

Infinite Campus User Guide – Ad hoc Reporting
8
Delete FiltersA saved filter created by a user can also be deleted by that user. Because filters can be shared with other users, only the person who created the filter has the ability to delete it.
Query WizardPath: Ad hoc Reporting > Filter Designer > Query Wizard
In the Query Wizard, elements are organized in a straightforward pattern, so it is easy to select the elements needed. Filters can be designed with student information, census/staff information or course/section information.
Queries for students and course/section data will pull results from the calendar selected in the Campus toolbar. Census/Staff data will pull results from the entire Campus database regardless of the calendar selected.
NOTE: Unless using the Data Warehouse, queries should be created in such a way to avoid large results. Generating large queries may cause performance issues.
Infinite Campus User Guide – Ad hoc Reporting
9
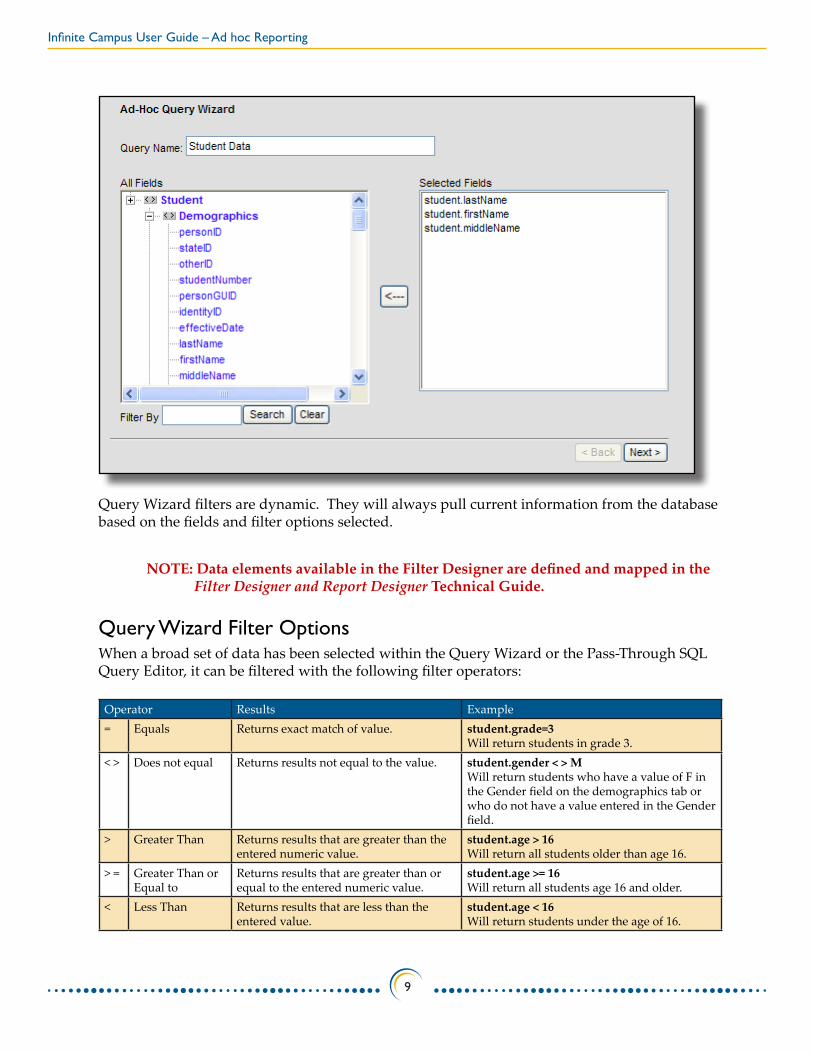
Query Wizard filters are dynamic. They will always pull current information from the database based on the fields and filter options selected.
NOTE: Data elements available in the Filter Designer are defined and mapped in the Filter Designer and Report Designer Technical Guide.
Query Wizard Filter OptionsWhen a broad set of data has been selected within the Query Wizard or the Pass-Through SQL Query Editor, it can be filtered with the following filter operators:
Operator Results Example= Equals Returns exact match of value. student.grade=3
Will return students in grade 3.< > Does not equal Returns results not equal to the value. student.gender < > M
Will return students who have a value of F in the Gender field on the demographics tab or who do not have a value entered in the Gender field.
> Greater Than Returns results that are greater than the entered numeric value.
student.age > 16Will return all students older than age 16.
> = Greater Than or Equal to
Returns results that are greater than or equal to the entered numeric value.
student.age >= 16Will return all students age 16 and older.
< Less Than Returns results that are less than the entered value.
student.age < 16Will return students under the age of 16.

Infinite Campus User Guide – Ad hoc Reporting
10
Operator Results Example< = Less Than or
Equal toReturns results that are less than or equal to the entered numeric value.
student.age <= 16Will return students 16 and younger.
IN Includes value student.grade IN 9,10Will return students in 9th and 10th grade.
NOTE: When using this format, do not put spaces after the comma.
NOT IN Excludes value student.grade NOT IN 11,12Will return all students not in 11th or 12th grade.
NOTE: When using this format, do not put spaces after the comma.
LIKE Searches for test string in field course LIKE histWill return courses like History 101.
SOUNDS LIKE Returns names with similar Soundex patterns
student.lastName SOUNDS LIKE BallWill return “Ball,” “Bell” and “Boll.”
IS NULL Returns fields that have not had data entered into them.
student.StateID IS NULLWill return all students who do not have a state ID number.
IS NOT NULL Returns fields containing data student.ssn IS NOT NULLWill return all students who have a Social Security number entered.
IS TODAY Returns results dated as of the current date.
start.date IS TODAY Will return entries where the start.date is the current date.
IS YESTERDAY Returns results dates as of yesterday’s date.
start.date IS YESTERDAYWill return results for one day previous to the current date.
=TRUE Returns checkbox values of “true” (checkbox is marked)
enrollment.stateExclude = TRUEWill return students who have the State Exclude checkbox marked on their enrollment records.
=FALSE Returns checkbox values of “false” (checkbox is not marked).
Enrollment.stateExclude=FALSE Will return students who do not have the State Exclude checkbox marked on their enrollment records.
In addition to the above options, wildcard searching is also available. The following are instances of those options.
Wildcard or Pattern SQL Meaning Standard Examples% 0 or more characters Entering the word Man returns the same results
when entering Man%.
%son finds names that end in -son: Johnson, Manson, Jason-Benson, etc.

Infinite Campus User Guide – Ad hoc Reporting
11
Wildcard or Pattern SQL Meaning Standard Examples_ (underscore) One character Olson_Zierke and Olson Zierke returns the same
results.
L__ (with two underscores) does not look only for 3-character names that start with L, but L_e will find names where L is the first and e the third character (e.g. Lee, Luewenhook).
If the two underscores are entered at the end of a name, like Hack__, results will list names with two additional letters exist (Hacker).
[token] A range of possible characters L[ae] finds names that start with La or Le. ,James No SQL wildcard Searches for first name equal to or beginning with
James.
NOTE: This can only be used in the Quick Search fields.
Gonzales-Uribe Compound name Finds that last name.
This will return compound names regardless of whether they are linked by a space or hyphen.
Gonzales Uribe orGonzales_uribe orGonzales%uribe
A compound name with a space Will find the name with or without a space or hyphen.
Try wildcards if there is a space between the compound name.
Use the following combinations in ad hoc filters using the Like operator.
Wildcard or Pattern SQL Meaning Standard Examples% 0 or more characters L% finds names that start with L
L finds names that contain an L
LAN finds names containing LAN (Blanko, Landesburg, Blankenship, etc.)
_ (underscore) One character L__ (two underscores) finds Lee and Lor, not Luewenhook[token] A range of possible characters L[ae]% finds names that start with La or Le. ^ Negation of token L[^ae] finds names that do not start with La or Le.
Creating a Filter Using the Query Wizard Filter and Data Type1. Select the Create a New Filter Using the Query Wizard option.2. Select a Filter Data Type. 3. Click the Next button. The screen will display a list of items to select in order to create the
filter.

Infinite Campus User Guide – Ad hoc Reporting
12
Data Element Selection4. Enter a Name for this filter. 5. Select the data elements from the All Fields list by clicking on them. The fields will move to
the Selected Fields list. To remove a field from the Selected Fields list, click on it to highlight and click the left pointing arrow button.
6. To search for a particular field, enter part of the name of the field in the Filter By section and click the Search button. All fields that contain that name will appear in the All Fields list. To clear the selection, click the Clear button and all available fields will appear again.
7. Click the Next button to continue creating the filter, narrow returned results and sort the filter into the desired order.
Operators, Values and Sort Options8. Select the Operator from the dropdown list. See the table above for definitions of the
operators. 9. Enter the value to which the operator relates. For example, to return only students in the
third grade, the field Grade has an operator of equal to and the value is set to 03. A search for student.grade = 3 will return no results.
10. If the field should appear in the filter output, verify the Output checkbox is marked. If it is not marked, the field will not appear in the output but will be used to filter data. For example, the field student.activeToday might be chosen to filter out inactive students (student.activeToday = 1), but the Output checkbox could be unselected so that field is not included in the output.
11. Determine and enter the Sequence field. This number places the field in that order on the output.
12. Enter a number in the Sort field. This determines the order in which fields will be sorted. 13. Determine how the field should be sorted - ascending or descending - and select that
option from the Direction dropdown list. This field can only be selected if a sort number is entered. If the Sequence and Sort fields are left blank, the fields will appear in the order selected and will be sorted how the elements appear on the screen.
14. Select the Organized To option to share the filter with the selected user groups. 15. Click the Save icon when finished.
Users can also test the filter by clicking the Test icon. Doing this will not the save the filter but will generate the filter with the chosen elements. This allows the user to rework fields, values, sorting options, etc.
NOTE: Users must have popups enabled on the web browser to see Test results.
Data Element FieldsAlmost any field viewable in the user interface is available in the Query Wizard. Because of this, searching through the entire list is cumbersome.

Infinite Campus User Guide – Ad hoc Reporting
13
Searching for Fields1. Enter the keyword of the field to include in the query in the Filter By text field. 2. Click the Search button. 3. Matching results will appear in the All Fields area. The area headers may need to be
expanded to see results. 4. Select the appropriate options for the query. 5. Click the Clear button to reset the fields list.
Sample Queries for the Query WizardFollowing is a listing of queries that can be generated in the Ad hoc Filter Designer.
Bus InformationThis filter uses Student Information (Student Filter Data Type).
Data Element Category Element Name Select Fields Operator ValuesStudent
Demographics lastName student.lastNamefirstName student.firstNamestudentNumber student.studentNumber
Census

Infinite Campus User Guide – Ad hoc Reporting
14
Data Element Category Element Name Select Fields Operator ValuesHousehold Contact Summary
guardian contacts.guardian = TRUE
lastName contacts.lastNamefirstName contacts.firstName
relationship contacts.relationship NOT IN Parent,Father,Mother
NOTE: This will return relationship types used in building a household. Users should enter values that are used in their districts.
Mailing Addresses addressLine1 contacts.addressLine1
addressLine2 contacts.addressLine2
Transportation inBusNumber bus.inBusNumber
inBusStop bus.inBusStop
outBusNumber bus.outBusNumber
outBusStop bus.outBusStop
milesTransported bus.milesTransported
Sample Query - Bus Information

Infinite Campus User Guide – Ad hoc Reporting
15
Absences in a Particular Course for Term 1This filter uses Student Information (Student Filter Data Type).
Data Element Category Element Name Select Fields Operator ValuesStudent
Demographics lastName student.lastNamefirstName student.firstNamestudentNumber student.studentNumber
Attendance
Course Term Summary
courseName attendanceCourseTermSummary.courseName
term1periodabsences attendanceCourseTermSummary.term1periodAbsences
<> 0
Sample Query - Term 1 Absences for a Course
FeesThis filter uses Student Information (Student Filter Data Type).
Data Element Category Element Name Select Fields Operator ValuesStudent
Demographics lastName student.lastNamefirstName student.firstNamestudentNumber student.studentNumber
Census
HouseholdContactSummary
householdName contacts.householdName
Fee

Infinite Campus User Guide – Ad hoc Reporting
16
Data Element Category Element Name Select Fields Operator ValuesFee Detail balance feeDetail.balance
dueDate feeDetail.dueDate
Sample Query - Fees
Course InformationThis filter uses Course information (Course/Section Filter Data Type).
Data Element Category Element Name Select Fields Operator ValuesCourse
Course Information courseName CourseInfo.courseNamevocationalCode courseInfo.vocationCode
Section Information sectionNumber sectionInfo.sectionNumber
teacherDisplay sectionInfo.teacherDisplay
Roster Summary maleStudentcount rosters.maleStudentCount
femaleStudentCount rosters.femaleStudentCount

Infinite Campus User Guide – Ad hoc Reporting
17
Sample Query - Course Information
Staff Mailing ListThis filter uses Course information (Course/Section Filter Data Type).
Data Element Category Element Name Select Fields Operator ValuesPerson
Demographics staffNumber individual.staffNumberlastName individual.lastName
firstName individual.firstNameCensus
Mailing Address addressLine1 mailingAddress.addressLine1
addressLine2 mailingAddress.addresslLine2
StaffAssignment schoolName schoolEmployment.
schoolName

Infinite Campus User Guide – Ad hoc Reporting
18
Sample Query - Staff Mailing List
Selection EditorPath: Ad hoc Reporting > Filter Designer > Selection Editor
The Selection Editor provides a list of all students (currently enrolled and ended enrollment) in the selected calendar chosen in the Campus toolbar who can be selected for the query. Once chosen, this selection is saved and can be used in standard reports. An attendance clerk may be given access to this selection and easily record attendance for those chosen students.

Infinite Campus User Guide – Ad hoc Reporting
19
Creating a New Filter Using the Selection Editor Filter and Data Type1. Select the Create a New Filter Using the Selection Editor option.2. Select a Filter Data Type of Student. The Selection Editor is not available for Census/Staff or
Course/Section data.3. Click the Next button. The screen will display a list of items to select in order to create the
filter. All students in the selected Calendar are listed, first by grade, then last name, then first name. Students are available whether they are active or inactive.
Student Selection4. Enter a Name for the selection. 5. Select the students to include in the selection filter from the All Students list on the left by
highlighting the name and clicking the right-pointing arrow key. This will move the student name to the Selected Students column.
6. Remove a student from the selected students list by clicking the left-pointing arrow key. 7. To select all students appearing in the list, highlight the first student and scroll to the very
end of the list. Hold down the SHIFT key on the keyboard and select the last student. All student names should now be highlighted.
8. Click the Save icon when finished. The new filter will be listed in the Saved Filters list on the main page of the Filter Designer.
Selection editor lists are static. Any changes must be made manually.
Once a selection query is saved, it can be used in the Report Builder to create more detailed reports and letters.
Pass-through SQL QueryPath: Ad hoc Reporting > Filter Designer > Pass-through SQL Query
A pass-through query uses SQL language to gather the desired information. Using this option requires a basic knowledge of SQL and a working knowledge of the Campus data schema. Pass-through queries allow users to search for data in a more customized way, to search on tables and views not used in the Query Wizard and to use SQL operators.
Unless All Schools is selected in the Campus Toolbar, only students and course information from the selected calendar will be displayed in the query. Census/Staff information is not dependent on the selection of a calendar.

Infinite Campus User Guide – Ad hoc Reporting
20
The SELECT clause changes depending on the filter data type chosen.
Student Data Type SELECT Clause
Census/Staff Data Type SELECT Clause

Infinite Campus User Guide – Ad hoc Reporting
21
Course/Section Data Type SELECT Clause
Because the SELECT statement is predetermined, only certain fields will be returned by a pass-through query. • The Student data type will return grade, last name, first name and student number; • Census/Staff will return last name and first name; • Course/Section will return course number and course name. Nested SELECT statements
and ORDER BY clauses are not supported by the pass-through query.
The Infinite Campus Schema and Data Dictionary is available by request from Campus Support Services or from the district’s Client Executive.
Creating a New Filter Using the Pass-through QueryFilter and Data Type1. Select the Create a New Filter Using the Pass-Through Query option. 2. Select a Filter Data Type. 3. Click the Next button. The screen will display the beginnings of a SQL SELECT statement.
Pass-through Query Detail4. Enter a name for the filter in the Filter Name field. 5. In the text fields on the left-hand side of the screen, enter more querying definitions. The
beginning part of the query is already written (Select DISTINCT…). Users can join to database tables and views in the first text field.
6. In the second text field, enter more criteria for the SQL WHERE clause. For example, a desired query may list all students with the first name of Ashley. The text in this field would be ‘and student.firstName = ‘Ashley’. The second text field can also include GROUP BY and HAVING clauses, which must be used together.
7. Click the Test Query button to verify that the data returned is the data needed. Results will appear in the Test Query Results field on the right-hand side of the screen.
8. Click the Save button when finished. The new filter will be listed in the Saved Filters list on the main page of the Filter Designer.

Infinite Campus User Guide – Ad hoc Reporting
22
For more information on SQL Pass-Through Queries, see the SQL Pass-Through Queries Technical Reference.
Report DesignerPath: Ad hoc Reporting > Report Designer
The Report Designer allows districts to create custom reports or letters using a WYSIWYG editor.
District-specific forms and letters can be generated by multiple users throughout the district. There are many fields from which to choose and particular attention should be given to the options that are chosen.

Infinite Campus User Guide – Ad hoc Reporting
23
Standard formatting options are available on the WYSIWYG editor. The last two options on the right-hand side contain data elements to insert into the letter. These elements are defined in the Ad hoc Reporting Filter and Report Designer Technical Guide.
The Report Designer used Campus Field Properties and Campus Sub-Reports that will pull data into the letter.

Infinite Campus User Guide – Ad hoc Reporting
24
Letters can be created using the Blank Form Letter or the Addressed Form Letter. Instructions for both letters are the same. However, when creating an Addressed Form Letter, a heading will appear at the top of the letter that includes the school name, address and phone number, Parent/Guardian of with the student’s name, date the report was generated, student number, grade and birth date. This heading cannot be customized.
Blank Form Letter

Infinite Campus User Guide – Ad hoc Reporting
25
Addressed Form Letter
Blank Form Letters and Addressed Form Letters appear the same way in the Saved Reports list. To identify the different letters, it is recommended the report be named to indicate the letter usage.
Creating a New Report Using the Blank Form LetterLetter Type Selection1. Select the Blank Form Letter format. 2. Click the New Format button in the lower right-hand corner.
Letter Design3. Enter a Format Name for the new report. 4. Select the Font, Font Size and Font Color. 5. Type the layout of the letter in the white text field. Select the Campus Fields and
Subreports to aid in the collection of data. 6. Select which users should share this report in the Organize To dropdown list. 7. Click the Save button when finished. The new report is listed in the Saved Reports box.
Users will need to reselect the Report Designer tool in the outline to view the list of saved reports.
Once the reports have been saved, use the Report Builder tool to generate the printed version of the report.
Creating a New Report Using the Addressed Form Letter Letter Type Selection1. Select the Addressed Form Letter format. 2. Click the New Format button in the lower right-hand corner.

Infinite Campus User Guide – Ad hoc Reporting
26
Letter Design3. Enter a Format Name for the new report. 4. Select the Font, Font Size and Font Color. 5. Type the layout of the letter in the white text field. Select the Campus Fields and Subreports
to aid in the collection of data. 6. Select which users should share this report in the Organize To dropdown list. 7. Click the Save button when finished. The new report is listed in the Saved Reports box.
Users will need to reselect the Report Designer tool in the outline in the outline to view the list of saved reports.
Once the reports have been saved, use the Report Builder tool to generate the printed version of the report.
To delete saved reports, select the report from the list of Saved Reports and click the Delete button.
Report BuilderPath: Ad hoc Reporting > Report Builder
The Report Builder will combine saved filters with saved reports. If more than one filter is needed, the filters are combined using a union operation or an intersection operation.
• A union operation combines two or more filters by appending one to the other. Example: all Dodgeball Team members and all 10th grade boys
• An intersection operation is used to find data that one or more filters have in common. Example: Dodgeball Team members who are also 10th grade boys

Infinite Campus User Guide – Ad hoc Reporting
27
Reports can be sorted in four ways:• Alphabetically by student’s last name• By grade level, then alphabetically by student’s last name• By the mailing address zip code (for bulk mail rates)• By the teacher
The sort by teacher option requires the selection of a calendar, an effective date (student’s start date in that teacher’s class) and the period of the day by which to sort.

Infinite Campus User Guide – Ad hoc Reporting
28
Generating a Report in the Ad hoc Report Builder 1. Select one or more filters from the list of Saved Filters in the left-hand window. 2. Select one report from the Saved Reports window on the right-hand side of the screen. 3. Select the Set Operation from the dropdown list – union or intersection (if more than one
filter is selected). 4. Select the appropriate Sort Options – Alphabetical, by Grade/Alpha, by Zip code or by
Teacher. 5. Click the Build Report button. The report will be generated in a new window in PDF
(Adobe) format.
Gender PronounsOptions have been added to allow users to add his/her and he/she pronouns in a report. Fields in the ad hoc filter have no bearing on what fields are available in the letter. Users can select the pronoun options in a filter and use them in a mail merge Microsoft Word/Excel format.
Determination of whether the report displays one pronoun over the other is based on the gender field on the student’s Demographics tab in Census.

Infinite Campus User Guide – Ad hoc Reporting
29
Ad hoc Filter Designer - Gender Pronoun Options (in Demographics)
Users will need to build a report using the Report Designer to create a letter, and then use the Report Builder to combine the designed report with the saved query filter.
Using the Gender PronounsCreate a Filter1. Create any filter in the Filter Designer using the Filter Data Type of Student.
Create a Report2. From the Report Designer, select the appropriate Report Format – Blank Form Letter or
Addressed Form Letter. 3. Click the New Format button.4. Enter a Name for the report.5. Type the content of the letter. Where appropriate, insert the Campus Field Properties
including the desired gender pronouns.6. Click the Save Format button.
Combine Query Filter and Report Designer7. From the Report Builder, select the saved filter and the saved report. 8. Set the Set Operation if using more than one filter.9. Select the Sort Options as desired.

Infinite Campus User Guide – Ad hoc Reporting
30
10. Click the Build Report button. The report will appear in a new window, replacing the student’s name with the appropriate pronoun where indicated.
Data ExportPath: Ad hoc Reporting > Data Export
The Data Export tool displays the filters that were created in the Filter Designer Query Wizard in a selected format. Users can display the reports in different formats, depending on what needs to be done with them.
Saved queries built with the Query Wizard can be exported into multiple formats.
HTML list report will open a browser window.

Infinite Campus User Guide – Ad hoc Reporting
31
XML will display the data in extensible markup language, often used by computer programs. This will appear in the browser window.
Comma Separated Values and Tab delimited values can be used in Excel or other spreadsheet applications.
PDF will display the report in an non-editable printable format.

Infinite Campus User Guide – Ad hoc Reporting
32
Exporting a Report in the Data Export Wizard1. Select one Filter from the list of saved filters in the left-hand window. 2. Select the Export Format in which to display the filter.3. Check the box to have the system prompt the user to save the file. 4. Click the Export button. The report will display in the format chosen.
Cube DesignerPath: Ad hoc Reporting > Cube Designer
The Cube Designer analyzes Campus data and displays that data in a pivot-table format, allowing users to move data around that table for specific needs.
Users are able to group student information by category. For example, a list of students who have a specific race/ethnicity can be selected and cross-referenced with those students’ attendance records, behavior incidents and semester grades.
Users can select previously created cubes in the Saved Cubes box to view, edit or delete. On the right-hand side of the screen, users can create a new cube by selecting the appropriate Measures. Measures determine which standard educational measures will be used as the selected data is assembled into a cube.
• Student Counts – bases information on total number of students.• Attendance Mark Counts – bases information on students’ attendance records.

Infinite Campus User Guide – Ad hoc Reporting
33
• Behavior Event Counts – bases information on students’ behavior records.• Grade Mark Counts – bases information on students’ grades tabs (i.e., current term grades).• Transcript Mark Counts – bases information on students’ transcript grades.• Special Education Analysis – bases information on special education data.
Cube Designer categories and data elements are defined in the Cube Designer Technical Reference.
Creating a New CubeData Measure1. Begin by selecting which measure the cube will compare the other data against - Student
Counts, Attendance Mark Counts, Behavior Event Counts, Grade Mark Analysis, Transcript Mark Analysis or Special Education Analysis.
2. Click the New Cube button. The screen will change to the Ad hoc Cube Builder screen, which is divided into four sections.
Cube Information3. Enter a Cube Name for the new cube. 4. Enter a Created Date. Dates are entered in mmddyy format. If no date is entered, the current
date will be used.
Student Filters5. If there is a filter in which the students to be viewed are already available, select that filter

Infinite Campus User Guide – Ad hoc Reporting
34
from the Ad hoc Filter dropdown list. If there is no matching filter, leave this selection blank.
6. Enter an Effective Date. This date will base the data in the cube on that date. 7. To return only students who are actively enrolled as of the effective date, mark the Active
Only checkbox.
MeasuresNot all measures are available for each count option. Additional measures are not necessary. If no measures are chosen, the cube will be built with the single measure chosen in Create a New Cube.
8. Mark the Display Average Cumulative GPA Measure checkbox to show the student’s GPAs in relation to their transcripted grades.
9. Mark the Display Average Test Scores Measure checkbox to display the selected students’ average tests scores.
10. Mark the Use only MAX test score checkbox to display the highest test score for the selected students.
11. Mark the Display ADM/ADA Summaries checkbox to show students’ average daily membership and average daily attendance.
12. Select the Organized To dropdown list to share this cube with a particular user group.
Categories13. Select the Categories to include on the report. Categories are descriptive attributes of
students ( i.e., gender, grade, etc). At least one category must be selected. 14. Once all filters, measures and categories have been selected, click the Display Cube button.
The system will process this information and will display the data in a new screen. From there, the user can move the data around, view the data in chart form, etc.
NOTE: Only a Cube Name and a category need to be entered. 15. Click the Save button to save this cube for easier generation at a later time.
Saving ReportsA user can save a configuration of the cube data by selecting from the Reports dropdown option Save, and then enter the name of the report. When saving reports from here, the user is saving the format of the report only. Cubes can be saved (and viewed later) if selection criteria are saved in the Cube Designer.

Infinite Campus User Guide – Ad hoc Reporting
35
For detailed options, select the Save icon in the SmartIcon row. This option provides choices for exporting reports in different formats.
When choosing to save using any option, the user will be prompted to save the file on the user’s hard drive. The file will be saved to that location. No other prompts will be given to the user.
Saving Cube Designer Reports as an Excel File1. When the report is displayed as desired, select the Save icon from the SmartIcon row. 2. Select the Save As option and select the Microsoft Excel selection. The Save As pop-up
window will appear. 3. Determine where the report should be saved and enter a file name in the File Name field.4. Click the Save button.
The report is now saved. It will not open on the screen, but can be found in the location in which it was saved.
When saving a chart or graph to Excel, the underlying data is saved, not the graphic presentation. If the graph is desired, select the Word or PDF format.
Saving Cube Designer Reports as a Word Document1. When the report is displayed as desired, select the Save icon from the SmartIcon row. 2. Select the Save As option and select the Microsoft Word selection. The Save As pop-up
window will appear.

Infinite Campus User Guide – Ad hoc Reporting
36
3. Select the appropriate paper size (letter, legal, etc.) and determine the margins and if the headers and footers should show.
4. Determine where the report should be saved and enter a file name in the File Name field.5. Click the Save button. The report is now saved. It will not open on the screen, but can be
found in the location in which it was saved. Saving Cube Designer Reports as an Adobe PDF DocumentAdobe Reader will need to be installed on the user’s machine.
1. When the report is displayed as desired, select the Save icon from the SmartIcon row. 2. Select the Save As option and select the Adobe (.pdf) selection. The Save As pop-up
window will appear. 3. Select the appropriate paper size (letter, legal, etc.) and determine the margins and if the
headers and footers should show. 4. Determine where the report should be saved and enter a file name in the File Name field.5. The report is now saved. It will not open on the screen, but can be found in the location in
which it was saved.
Saving Cube Designer Reports as a Tab Separated Value Document1. When the report is displayed as desired, select the Save icon from the SmartIcon row. 2. Select the Save As option and select the Tab Separated Values (.tsv) selection. The Save As
pop-up window will appear. 3. Determine where the report should be saved and enter a file name in the File Name field.4. The report is now saved. It will not open on the screen but can be found in the location in
which it was saved.5. When using the Tab-Separated option, the user will want to tell the computer what
program to use when displaying the report. This should be an Excel file.
Saving Cube Designer Reports as a Comma Separated Value Document1. When the report is displayed as desired, select the Save icon from the SmartIcon row. 2. Select the Save As option and select the Comma Separated Values (.csv) selection. The Save
As pop-up window will appear. 3. Determine where the report should be saved and enter a file name in the File Name field.4. The report is now saved. It will not open on the screen but can be found in the location in
which it was saved.5. When using the Tab-Separated option, the user will want to tell the computer what
program to use when displaying the report. This should be an Excel file.

Infinite Campus User Guide – Ad hoc Reporting
37
Saving Cube Designer Reports as an Offline DocumentWorking offline allows a user to work with a copy of the cube independent of the district’s network availability.
1. When the report is displayed as desired, select the Save icon from the SmartIcon row. 2. Select the Work Offline selection. The Save As pop-up window will appear. 3. Determine where the report should be saved and enter a file name in the File Name field.4. The report is now saved. It will not open on the screen, but can be found in the location in
which it was saved. This type of report will be saved as an HTML file. A folder will also be created with the same name of this report for easy location of any documents that may have changed as the user was working offline.
Display OptionsOnce a cube is displayed, a user can alter how it appears. A cube can be viewed in graph format – pie, table or line. There is the option to change the presentation layout, alter the report to fit the screen and much more.
By moving the available categories, the sample above, Student Count by Race/Ethnicity and Gender, can quickly be changed to Gender by Race/Ethnicity, Student Count.

Infinite Campus User Guide – Ad hoc Reporting
38
This works in the same way as pivot tables are used in Microsoft Excel.
Data can be saved or printed by selecting different SmartIcons.
Report Height and Width Display OptionsFit to Height and Fit to Width will change the display of the cube report, depending on which one is selected. Using these options will adjust the table to fit within the allotted display area. The default view is displayed below:

Infinite Campus User Guide – Ad hoc Reporting
39
Fit to Page Height When using the Fit to Page Height option, the report will be displayed like this. Notice how the rows and columns are stretched out, as compared to the picture above.
Fit to Width When using the Fit to Width option, the report will be displayed like this. Notice how the columns are elongated, as compared to the default view of the first picture.
PreferencesThis icon allows the user to change the original settings of the cube tool. A user can select what things would automatically show on the report, how rows and columns are displayed, the user’s preference for charts and graphs and the user’s experience level.
There are two ways of accessing the preferences screens. • From the SmartIcon row, click on the preferences icon. • Move the mouse over one of the fields of data. A pop-up window will appear that provides
more detail on that dataset. In that window it reads, Right click for more options. If a user does right click, the Preferences option window will appear, where a user can select the appropriate tab to select their options.

Infinite Campus User Guide – Ad hoc Reporting
40
Preferences Icon
Preferences Right-click Option

Infinite Campus User Guide – Ad hoc Reporting
41
General PreferencesThe General Preferences tab changes basic details of the report sheet. A user can turn off what is shown by unchecking the box next to the option listed and clicking OK.
Show Expand and Collapse ControlsWhen this option is turned on, the user has the option of closing certain results, as shown by the plus (+) sign in the picture detail below. This aids the user in working only with the data he/she needs.
If this option is turned off in the Preferences section, the user can still expand or collapse this

Infinite Campus User Guide – Ad hoc Reporting
42
data, but the plus (+) sign will not show.
Show Grid LinesIf a user prefers not to show the grid lines as a normal spreadsheet would appear, he/she can uncheck the option to show the grid lines.
With grid lines
Without grid lines
Show Cell Value with % of TotalWith Data Analysis, a user can insert a row or column into a category that calculates the percent of total for corresponding values in a row or column. That is, for each value, a percentage of the row or column total can be calculated. If a user does not want this option available, it can be unchecked.

Infinite Campus User Guide – Ad hoc Reporting
43
Decimal Places for % of TotalIf a user chooses to display more decimal places for a result, he/she can increase or decrease that field accordingly.
Show Labels AsIn the Analysis view, a user can select to view the data as either Columnar or Hierarchical. The default selection is columnar. The change is subtle, but the hierarchical option allows the columns to be collapsed and expanded as needed, displaying parent-child categories of the columns.
Columnar View

Infinite Campus User Guide – Ad hoc Reporting
44
Hierarchical view
Repeat Labels in ExcelWhen exporting data to an Excel spreadsheet, repeating labels can display as short labels or long labels.
Short Labels
Long Labels

Infinite Campus User Guide – Ad hoc Reporting
45
Row and Column PreferencesRow settings modify how the data across appears to the users. The options available on this tab are discussed below. Show TotalsThere are two options for this preference – Leading or Trailing. This option changes where the grade header is located. The default preference is set to leading.
Totals - Leading: The Grade header appears at the top
Totals - Trailing: The Grade header appears at the bottom
Show Category HierarchyTo show the parent-child hierarchy of the categories on the rows axis, select the Show category hierarchy check box. This option applies only if Show labels as is set to Hierarchical.

Infinite Campus User Guide – Ad hoc Reporting
46
Category Hierarchy - Off
Category Hierarchy - On
Show Blank RowsTo only show rows that have data, a user would want to uncheck the option to show blank rows. This would be used for finding data that has null values.
Show Blank Rows Unchecked - only rows with data will be displayed

Infinite Campus User Guide – Ad hoc Reporting
47
Show Blank Rows Checked - rows without data will display
Show Rows with all zerosTo show rows containing only zero (0) values, select the Show rows with all zeros option. This would be used for finding missing data.
Automatically Size Label WidthThis option will reformat your spreadsheet to enhance optimal display.
Bar Chart PreferencesTo change the display of bar charts, select the Preferences icon and choose the graph tab. The following options are available.
Show 3-D Visual EffectGraphs and charts are formatted in a 3-D view when using the Cube Designer. If a user prefers not to see the graph in 3-D, he/she can uncheck that option in the preferences window.

Infinite Campus User Guide – Ad hoc Reporting
48
3-D view Non-3-D view Show Data Values When displaying the graphs, there is the option of showing the data as a percentage or as a number.
Data value is displayed as a number Data value is displayed as a percentage

Infinite Campus User Guide – Ad hoc Reporting
49
Line Graph Preferences To change the display of line graphs, select the Preferences icon and choose the line graph tab. The following options are available.
Show Data Values as Percentage or NumberWhen working with line graphs, a user can select to show the values as either a percentage or a number.
Values shown as a percentage Values shown as a number There is also an option to turn the value setting off completely by removing the checkmark from the data values option. The graph would appear with lines only and no number or percent values.
Infinite Campus User Guide – Ad hoc Reporting
50
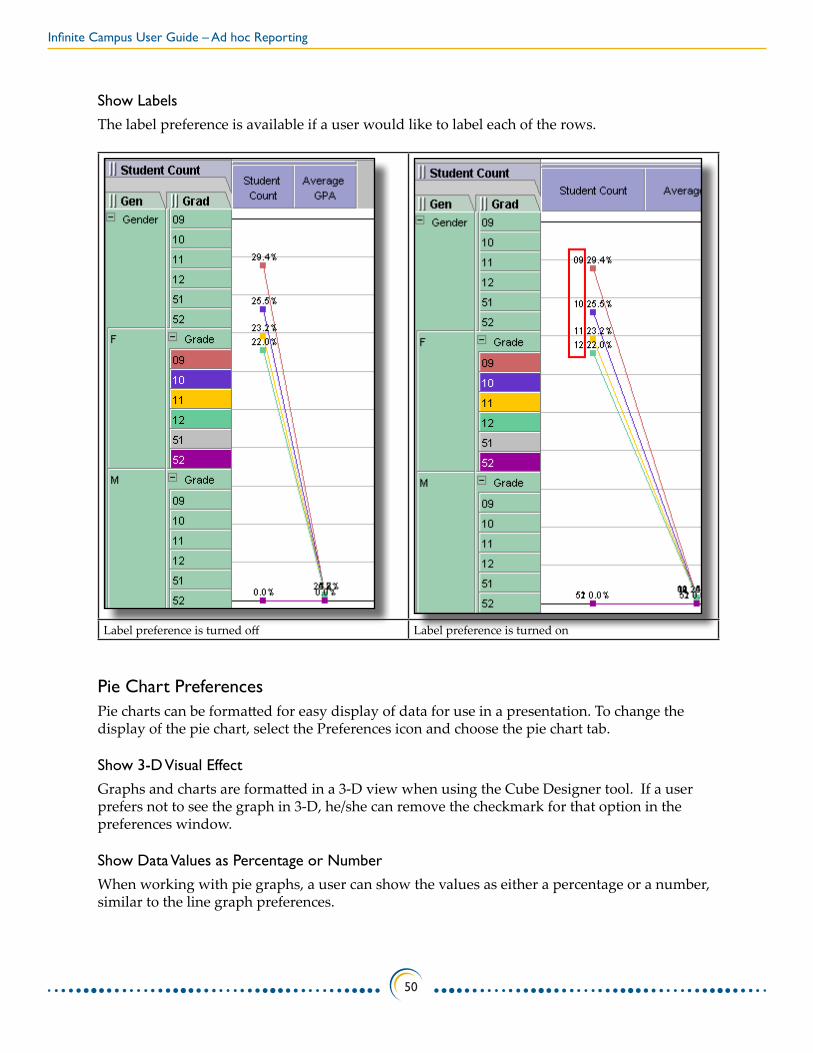
Show LabelsThe label preference is available if a user would like to label each of the rows.
Label preference is turned off Label preference is turned on
Pie Chart PreferencesPie charts can be formatted for easy display of data for use in a presentation. To change the display of the pie chart, select the Preferences icon and choose the pie chart tab.
Show 3-D Visual EffectGraphs and charts are formatted in a 3-D view when using the Cube Designer tool. If a user prefers not to see the graph in 3-D, he/she can remove the checkmark for that option in the preferences window.
Show Data Values as Percentage or NumberWhen working with pie graphs, a user can show the values as either a percentage or a number, similar to the line graph preferences.

Infinite Campus User Guide – Ad hoc Reporting
51
Show LabelsAs with the line graph preferences, a user can decide to show the labels or not to show the labels. In the following picture, the 3-D option is turned on, the values are shown as a percentage and the labels are turned on.
Pie SlicesPreferences apply to individual pie slices. The following options are available.
Preference DefinitionShow All Slices This option will display all data regardless of the size of the result. If a
certain data field has a percentage of .05 and this option is chosen, it will be displayed on the pie chart.
Limit Display to a Certain Percentage
This option will show data combined for results that are within a certain percentage. This number can be increased or decreased by clicking on the up or down arrows.
Limit Display to a Certain Number of Slices
If this option is chosen, only that number of slices will be displayed regardless of the data returned. If there are six different slices offered and the user only wants three to show on the pie, select this option and set the number to three.
In the following screenshot, a user is looking at average GPAs by student grade and gender. There are three grade levels involved; however, the pie chart is only be showing two slices. If the user sets the number of slices equal to two, the two lowest levels will be combined into one pie slice.

Infinite Campus User Guide – Ad hoc Reporting
52
Experience LevelThe last option in the Preferences icon is the Experience level. This changes the display of the SmartIcon row. There are three levels available: Novice, Standard and Advanced.

Infinite Campus User Guide – Ad hoc Reporting
53
Level DefinitionNovice Level This level provides the user with basic options for navigating
around the Data Analysis tool. The user can save, print, undo or redo, change their preferences and change the graph display.
Standard Level The standard level is the default level. All items listed in the preceding pages are available to use.
Advanced Level The advanced level provides more SmartIcons to the user, including an Exception Highlighting and Calculate option. Also in this mode, there are icons to quickly save the cube as a Microsoft Word document or Excel spreadsheet.
Exception HighlightingException highlighting is used to reveal anomalies and significant trends in data. Different colors are applied to certain data cells based on the cell value, or how the cell value compares to other values. For example, cells with values below ten might be colored red, while cells with values exceeding 100 might be colored green. More than one exception highlighting rule can be used within the same pivot table.
Applying New Exception Highlighting Rules1. On the toolbar, click the Exception Highlighting button. The Exception Highlighting
dialog box appears.2. Click the New button on the lower left hand side of the Exception Highlighting window.3. In the Rule Properties area (right hand side), type a label name. This will be the name of the
rule.4. Select the Condition. The choices available are cell value, percent (%) of column total,
percent (%) of row total, or percent (%) of grand total.5. Specify the qualifier in the Is field. The options available are equal, greater than, less than,
greater than/equal to, less than/equal to, not including, between and not between.6. Enter the Value. For example, the report is showing GPAs for males and females and the
rows for a certain GPA should be highlighted if the GPA value is more than 2.8. The IS field is set to greater than (>). The value is set at 2.8.
7. Select the color to apply to this set of data. Below is an example of what the highlighting rule might look like. There are options to change the font color and the fill color. If font color is chosen, the text within the cell will be color-coded. If fill color is changed, the background color of the cell will be changed to that color.
8. Click the Save Change button. 9. To apply this new rule to the data table, click the Apply button. The data that matches that
rule will be changed to the color the user selected.10. When satisfied with the display of this highlighting rule, click the OK button to close the
highlighting window.

Infinite Campus User Guide – Ad hoc Reporting
54
Exception Highlighting Notes• To use exception highlighting, the user must be working in table format. Exception
Highlighting can also be used to change or delete exception-highlighting rules.• If more than one exception-highlighting rule applies to the same table cell, the highlights

Infinite Campus User Guide – Ad hoc Reporting
55
will be applied in the order they appear in the Exception Highlighting dialog. In the Exception Highlighting dialog, use the up or down arrows - -to change the ordering.
• In the Rule Properties area, if the Condition box is set to % of row total, % of column total, or % of grand total, then the Value box is assumed to contain percentage values. In the Value box, type 20 for 20%, rather than 0.2.
CalculationsThis feature, only available in the Experience level, allows the user to calculate the data displayed in the cube from an inserted row or column. The data values in an inserted row or column are calculated from corresponding values in other rows or columns. For example, a user might insert a row that averages the values in three other rows. Once inserted in a table, the data is displayed in the calculated rows and columns in a chart or graph. To insert a calculated row or column, the user must be working in table format.
Calculating a Sum1. Select multiple rows or columns (by holding the CTRL key as selections are made) by
clicking on the row or column header. 2. On the toolbar, select the Calculate button and then highlight the word Sum. The Calculate
dialog box appears.3. In the Label box, type a name for the calculated row or column, e.g., Male and Female
Freshmen. This label will appear on the table when finished.4. In the Format area, select the formatting options applicable to this calculation.5. Click OK when finished. The calculated row or column is inserted after the last row or
column that is selected.

Infinite Campus User Guide – Ad hoc Reporting
56
Calculating an AverageAn average (A+B/2) is calculated by adding the values in the selected rows or columns together and then dividing that value by the total amount of rows or columns chosen.
1. Select the row or column to average by holding down the CTRL button and selecting the appropriate data headers. For example, to average the sophomore GPAs, select the 10 row header in the F and M section.
2. On the toolbar, click Calculate button and then select Average. The Calculate dialog box appears.
3. In the Label box, type a name for the calculated row or column, i.e., Sophomore GPAs.4. In the Format area, select the formatting options to apply to the calculated values. 5. Click the OK button when finished. The averaged data is then displayed after the last row
or column selected.
Calculating a Percent of Total1. Select the row or column to calculate the percentage of total values.2. On the toolbar, click the Calculate button and then select % of Total. The Calculate dialog
box appears.3. In the Label box, type a name for the calculated row or column, e.g., % of Total Student
Count.4. In the Format area, select the formatting options you want to apply to the calculated values.
Notice that when this percentage option is chosen, the Symbol is already selected for the user as a percentage, when before it read none.
5. Click the OK button when finished. The data is then displayed after the last row or column selected.

Infinite Campus User Guide – Ad hoc Reporting
57
Here, the percent of the total was calculated on the Student Count column. There are a total of 785 students in this sample school. In the sophomore class, there are 147 students. This is 18.73% of the total population of the school.
Calculating a RatioA ratio value (A/B) is calculated by dividing a value in the first row or column by the corresponding value in the second row or column.1. Select the rows or columns for which to calculate the ratio. For example, to calculate the
ratio of the male juniors and seniors, select the 11 and 12 row in the M section.2. On the toolbar, click the Calculate button and then select Ratio. The Calculate dialog box
appears.3. In the Label box, type a name for the calculated row or column, e.g., Ratio of Male Junior
and Senior.4. In the Format area, select the formatting options to apply to the calculated values. 5. Click OK when finished. The data is then displayed after the last row or column selected.

Infinite Campus User Guide – Ad hoc Reporting
58
Calculating Percent GrowthA percentage of growth value ((B-A)/A) is calculated by subtracting a value in the first row or column from the corresponding value in the second row (or column), and then dividing this result by the value in the first row or column. This could also be called % Difference.
1. Select the row or column for which to calculate the percentage. For example, to calculate the percent of growth of the juniors, select the 11 row for the F and M sections.
2. On the toolbar, click the Calculate button and then select % of Growth. The Calculate dialog box appears.
3. In the Label box, type a name for the calculated row or column, e.g., Percent of Growth Between Juniors.
4. In the Format area, select the formatting options you want to apply to the calculated values. 5. Click OK when finished. The data is then displayed after the last row or column selected.
Calculating a Minimum Value1. Select the row or column for which to calculate the minimum value by selecting the row or
column to calculate. For example, to find the minimum value in all grade levels, select all of the grade levels from the M and F section.
2. On the toolbar, click the Calculate button and then select Minimum. The Calculate dialog box appears.

Infinite Campus User Guide – Ad hoc Reporting
59
3. In the Label box, type a name for the calculated row or column, e.g., Minimum GPA of the High School.
4. In the Format area, select the formatting options you want to apply to the calculated values. 5. Click OK when finished. The data is then displayed after the last row or column selected.
In this example, the minimum value is 121, which is the total enrollment of the female seniors in the student count. The minimum value of the average GPA is 2.51, which is the average GPA of the male sophomores.
Calculation Notes• To insert a calculated row (or column), the user must be working in table format. Also,
when the categories are stacked on the rows or columns axis, a calculated row (or column) can only be inserted into a category that borders the data display area.
• A calculated row (or column) is automatically deleted when the category is moved or removed from the rows (or columns) axis, or another report is opened.
• If a cell value calculation results in a division by zero, the symbol “/0” appears in the cell.• If a calculated row and calculated column intersect, the column calculation takes
precedence. In the following example, the calculated row A/B, which calculates the ratio of A to B, intersects the calculated column X+Y, which calculates the sum of X and Y. Since the column calculation takes precedence, the intersecting cell’s value is 1.25 (= 0.50 + 0.75), rather than 0.67 (= 4 / 6).
X Y X+YA 1 3 4B 2 4 6A/B .50 .75 1.25

Infinite Campus User Guide – Ad hoc Reporting
60
Options on the Pivot TableAs the mouse moves around the pivot table, notice that pop-up windows appear. This allows the user to see more information about a certain set of data. It also gives the user the option to go directly to the students’ information.
There are also options to look at specific schools or specific school years. To select the school years of data to analyze, right click on the category listing. From there, select the options to appear on the report. To use this option, the cube must have been created with All Years selected in the Campus toolbar, and School Year must be on the categories selected.

Infinite Campus User Guide – Ad hoc Reporting
61
Right Clicking for OptionsIn the pop-up window, there is a choice to right click for options. When this is done, the user has the opportunity to collapse the rows, view student detail and change preferences about this data set. There are two places to see this. One is on the actual data table. The other is on the data headers.

Infinite Campus User Guide – Ad hoc Reporting
62
Right Clicking on Table
Option DetailsCollapse Choosing the collapse option will unexpand the row over which the user is currently
hovering.View Student Detail This option will bring the user directly to the students to whom this data relates. In
the example below, the option is hovering over the female juniors. If this option is chosen, a search index of those students will be displayed in the user outline section of Campus, and will display a list of the female juniors. From here, the user can view additional information about the students.
Show Column and Row Totals
To change how the column and row totals are displayed, select that option from the pop up box, and change the default of the total display to none, leading or trailing. This can also be done from the Preferences icon under the appropriate tab.
Preferences Preferences can be changed from this option as well. The same possibilities are available here that are available by clicking the Preferences icon.
Right Clicking on Headers
Option DetailsCollapse Choosing the collapse option will unexpand the row that the user is currently
hovering over.Expand to Level This option is used to focus on a particular section. Instead of having the report
expand all fields, a user could use this to expand only the needed sections. For example, instead of having all grade levels expanded for each race/ethnicity category, only the female tenth graders are expanded.

Infinite Campus User Guide – Ad hoc Reporting
63
Option DetailsFilter Out Blank or Zero Values
A user can display only the rows that have a non-blank or non-zero value for a column. Conversely, a user can display only the columns that have a non-blank or non-zero value for a row. For example, you might want to display the Race/Ethnicity rows that have a non-zero value in the Average GPA column.
All rows or columns that do not meet the filter criteria are hidden from view, and appears in the lower right corner of the data item label indicating a filter is applied.
Sort A user can sort the rows in ascending or descending order based on the values in a column. Conversely, a user can sort the columns in ascending or descending order based on the values in a row.
All rows or columns are displayed in the chosen order, and appears in the lower right corner of the data item label indicating a sort is applied.
Show Highest 10 or Lowest 10
A user can display only the rows with the highest 10 or lowest 10 values in a column. A user can also display only the columns with the highest 10 or lowest 10 values in a row.
The highest 10 or lowest 10 rows or columns are displayed, and an arrow appears in the lower right corner of the data item label indicating a sort is applied.
Show Highest to Lowest or Lowest to Highest
A user can sort the rows in ascending or descending order based on the values in a column. Also, a user can sort the columns in ascending or descending order based on the values in a row.
All rows or columns are displayed in the chosen order, and appears in the lower right corner of the data item label indicating a sort is applied.
CustomThere is also a custom sorting option. This allows a user to establish his/her own sorting options. • To custom sort, a user must work in the Analysis view, and the category must border
the data display area. Furthermore, the Show Labels As preference option must be set to Hierarchical.
• If a user has set Show to All values in the Sort dialog, the rows or columns are sorted relative to their peers within the category hierarchy. For example, States might be sorted within each Country. If a user wants to sort the rows or columns without regard for the category hierarchy, select the Disregard category hierarchy check box.
Creating a Custom Sort Rule1. Select the Sort Custom option from the right click action. A pop-up window will display on
the screen.2. Options will be defaulted to All values and Lowest to Highest. To change this, select the
options you would like on the report. 3. Click the Lowest or Highest buttons and set the values to correspond to the data. When this
is done, the Sort section will be grayed out, as well as the hierarchy option.4. If a user wants to show all values, but wishes to change the sort options, select either lowest
to highest or highest to lowest.

Infinite Campus User Guide – Ad hoc Reporting
64
5. Determine if you want the category hierarchy to show.6. Click OK when finished. Your custom sorting rule has been applied.
Filter by ValueA user can display only the rows that meet criteria he/she specifies for a column. A user can display only the columns that meet criteria specified for a row. For example, a user might want to display only the grade rows that have a value greater than 3.0 in the Average GPA column.
Adding a Filter1. Select the Filter by Value option from the right-click view.2. In the filter box, type the filter criteria. 3. Click OK when finished. The table is now sorted based on that filter.
Swap Rows and ColumnsSelecting this option will instantly flip the data table. All headers that were columns will now be displayed as rows, and vice versa. To undo this action, a user can click the undo arrow or re-select the Swap option.

Infinite Campus User Guide – Ad hoc Reporting
65
Data Analysis Help FeaturesThis document is designed to cover basic principles of the Cube Designer tool. For more detailed information about what can be done within the cubes, use the Help feature available on the SmartIcon toolbar, by clicking on the question mark.
Sample Reports in the Cube DesignerProvided below are sample reports that can be formatted for a school’s use.
Analyzing Attendance Data and Race/EthnicityAttendance mark counts are represented at the period level.1. Create a new cube using the Attendance Mark Counts option and click the New Cube
button.2. Enter a Name for the report – R/E by G/Grade.3. If desired, enter the current date in the Created Date field.4. Select the following fields from the choice of options:
• Student Filters - select Active Only• Student - select Gender, Race/Ethnicity, and Grade• Attendance - select Status (this is either absent or tardy)
5. Click the Display Cube button.6. Move the Grade and Race/Ethnicity categories next to the Gender header. 7. Move the Status category next to the Student header. 8. The user may format additional items by doing calculations, adding in highlighting options,
turning on or off the totals display.
Analyzing Student Enrollment Data1. Create a new cube using the Select Student counts measure and click the New Cube button. 2. Enter the Cube Name and Created Date.3. Select the following options from the Cube Designer screen:
• Student Filters - select Active Only• Student - select Gender and Race/Ethnicity• Enrollment – select Start and End Status
4. Click the Display Cube button.
Analyzing Student Behavior Data1. Create a new cube using the Behavior Event Counts measure and click the New Cube
button. 2. Enter the Cube Name and Created Date.

Infinite Campus User Guide – Ad hoc Reporting
66
3. Select the following options from the Cube Designer screen:• Student Filters - select Active Only• Student – Grade and Gender• Behavior – Role, Event and Resolution
4. Click the Display Cube button.
Data WarehouseWhen a district has Data Warehouse (DW) enabled, ad hoc filters, queries and reports can use either the main database or the data warehouse database to generate the information.
Users will need an additional user sub-right to see the DW source in the ad hoc tools, named Data Warehouse: Allow Live Data as Source. This sub-right makes it possible to have a reporting user who only has access to the DW database, eliminating access of data in the main database.
A Data Warehouse option is available for the Filter Designer, Report Builder, Data Export and Cube Designer. Ad hoc tools function the same way.
For more information on data warehouse, see the Data Warehouse Technical Reference.

Infinite Campus User Guide – Ad hoc Reporting
67
Student Information – Ad hoc Reports The Ad hoc Reports tab lists the reports that involve the selected student. This tab allows a person to generate the selected report for just this student.
To generate the reports listed here, select the desired report and click the Print icon. The report will appear in PDF format.
Read rights to Ad hoc Reporting must be given to generate reports listed on this tab.