ad-a259 346 - defense technical information center 346 by r. mark bricka, teresa t. holmes, m. john...
TRANSCRIPT
TECHNICAL REPORT EL-92-33
A COMPARATIVE EVALUATIONOF TWO EXTRACTION PROCEDURES:
THE TCLP AND THE EP
AD-A259 346 by
R. Mark Bricka, Teresa T. Holmes, M. John Cullinane
7Environmental Laboratory
Eli DEPARTMENT OF THE ARMYS•, ,,, W~~v ater-w ays E pr i . . m en-t, Stai on-,÷ • C or-rps of Em -!i ers•r'
3909 Halls Ferry Road. Vicksburg, Mississippi 39180-6199
ECt E
i E C82 1992
A A
October 1992
* .Final Report
Approved For Public Release. Distnbljt..... Is UJn! mited
2 1. ,,i' 92-32639
Prepared for Risk Reduction Engineering Laboratory
U.S. Environment"' 0Dt-tion AqencyCincinnati, Ohio 45268
Destroy this report when no longer needed. Do not returnit to the originator.
The findings in this report are not to be construed as an officialDepartment of the Army position unless so designated
by other authorized documents.
The contents of this report are not to be used foradvertising, publication, or promotional purposes.
Citation of trade names does not constitute anofficial endorsement or approval of the use of
such commercial products.
1 Form Approved
REPORT DOCUMENTATION PAGE OMB No. 0704-0188
PUblic reporting burden for this co tion of information is estnmated to average 1 hour per response, including the time for reviewing instructions, searching existing data sources.
gathrin nd anaiigtedtned.anco leigadeiengheolctnofnor ton.c Send comments regarding this burden estimate or any other aspect of thiscollection of information, including su tions for reducing this burden. to Washington .. eadiuarters Services, Directorate for information operations and Reports. 121S -e-ersonDavis Highway. Suite 1204. Arlington. VA 2202-4302. and to the Office ot Management and Budget. Paperwork Reduction Project (0704-0188). Washington, DC 20503.
1. AGENCY USE ONLY (Leave blank) 2. REPORT DATE 3. REPORT TYPE AND DATES COVERED
October 1992 Final report4. TITLE AND SUBTITLE S. FUNDING NUMBERS
A Comparative Evaluation of Two Extraction Procedures: Interagency AgreementThe TCLP and the EP No. DA930146-01-05
6. AUTHOR(S)
R. Mark Bricka, Teresa T. Holmes, M. John Cullinane
7. PERFORMING ORGANIZATION NAME(S) AND ADDRESS(ES) 8. PERFORMING ORGANIZATIONREPORT NUMBER
U.S. Army Engineer Waterways Experiment Station, Technical ReportEnvironmental Laboratory, 3909 Halls Ferry Road, EL-92-33Vicksburg, MS 39180-6199
9. SPONSORING/ MONITORING AGENCY NAME(S) AND ADDRESS(ES) 10. SPONSORING/MONITORING
AGENCY REPORT NUMBER
U.S. Environmental Protection Agency, Office ofResearch and Development, Risk Reduction EngineeringLaboratory, Cincinnati, OH 45268
11. SUPPLEMENTARY NOTES
Available from National Technical Information Service, 5285 Port Royal Road,Springfield, VA 22161.
72a. DISTRIBUTION /AVAILABILITY STATEMENT 12b. DISTRIBUTION CODE
Approved for public release; distribution is unlimited.
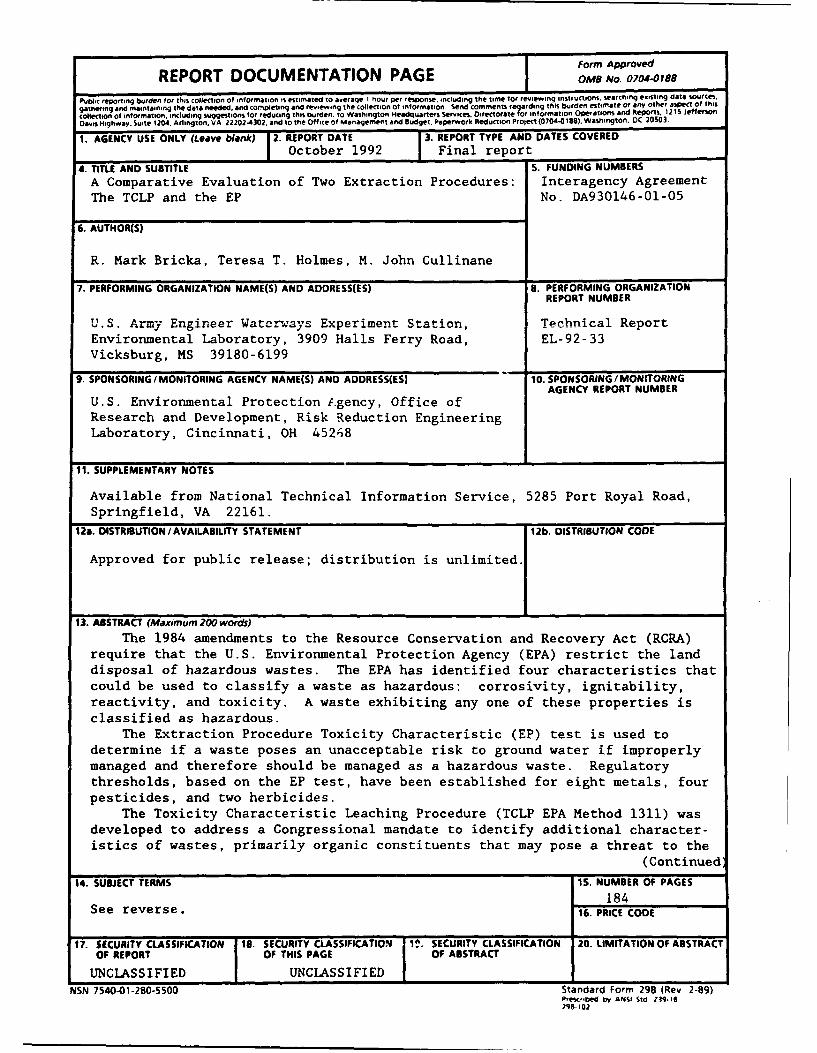
13. ABSTRACT (Maximum 200 words)
The 1984 amendments to the Resource Conservation and Recovery Act (RCRA)require that the U.S. Environmental Protection Agency (EPA) restrict the landdisposal of hazardous wastes. The EPA has identified four characteristics thatcould be used to classify a waste as hazardous: corrosivity, ignitability,reactivity, and toxicity. A waste exhibiting any one of these properties isclassified as hazardous.
The Extraction Procedure Toxicity Characteristic (EP) test is used todetermine if a waste poses an unacceptable risk to ground water if improperlymanaged and therefore should be managed as a hazardous waste. Regulatorythresholds, based on the EP test, have been established for eight metals, fourpesticides, and two herbicides.
The Toxicity Characteristic Leaching Procedure (TCLP EPA Method 1311) wasdeveloped to address a Congressional mandate to identify additional character-istics of wastes, primarily organic constituents that may pose a threat to the
(Continued
14. SUBJECT TERMS 15. NUMBER OF PAGES
184See reverse. 16. PRICE CODE
t7. SECURITY CLASSIFICATION 18. SECURITY CLASSIFICATION 1ý. SECURITY CLASSIFICATION 20. LIMITATION OF ABSTRACTOF REPORT OF THIS PAGE OF ABSTRACT
UNCLASSIFIED UNCLASSIFIED I I _I
NSN 7540-01-280-5500 Standard Form 298 (Rev 2-89)Prescfrbed by ANSI Std Z39-1i2968102
13. (Concluded).
environment. The TCLP has been promulgated for use in determining specifictreatment standards associated with the land disposal restrictions of RCRA.The TCLP has also been proposed as a replacement procedure for the EP test.Using the TCLP procedure, the EPA has also proposed to expand with hazardouswaste regulatory levels the list of contaminants from the 14 listed in the EPprotocol to a total of 52. The additional contaminants include 20 volatileorganics, 16 semivolatile organics, and 2 pesticides.
The purpose of this study was to compare the results of the TCLP withthose of the EP. The study was divided into three substudies In the firstsubstudy, a synthetic heavy metal waste was chemically solidified/stabilized,and a variety of interfering compounds were added to the solidified/stabilizedwaste. The solidified/stabilized waste w-s clred for 28 days and subjectcd tLthe TCLP and EP extractions. The extracts were analyzed for Cd, Cr, Ni, andHg. In the second substudy, two heavy metal synthetic wastes and a per-chloroethene still-bottom waste were used. The two synthetic heavy metalwastes were chemically solidified/stabilized, and the perchloroethene wastewas untreated. Twelve volatile organic compounds were added to each wastetype at two ratios. The EP and the TCLP extractions were performed on threesamples from each waste type. The extract from each sample was analyzed forAs, Ag, Ba, Cd, Cu, Ni, Pb, and Zn and the 12 volatile organic compounds. Inthe third substudy, volatile losses due to the mechanics of the TCLP and EPextractions were investigated, by spiking the TCLP and EP extracts with knownconcentrations of organic compounds. The results of this study indicate that,for most of the metal contaminants, the TCLP and EP produce similar resultswhen TCLP extraction fluid 2 is used but differ when TCLP extraction fluid Iis used. The results of testing for volatile organic contaminants indicatethat, for 8 of the 12 contaminants, the concentrations measured in the TCLPleachates were significantly greater than those measured in the EP leachates.
14. (Concluded).
EP SolidificationExtraction StabilizationExtraction Procedure TCLPFixation Toxicity CharacteristicHeavy metals Leaching ProcedureMetals Volatile organic compounds

PREFACE
The study reported herein was conducted by personnel of the Environmen-
tal Laboratory (EL) of the U.S. Army Engineer Waterways Experiment Station
(WES). The research was sponsored by the U.S. Environmental Protection Agency
(EPA) Office of Research and Development under Interagency Agreement No.
DA930146-01-05. The EPA Project Officers were Messrs. Carlton Wiles and Paul
de Percin. Special assistance was provided by Mr. David Friedman of the EPA
Office of Solid Waste.
The report was prepared by Mr. R. Mark Bricka, Ms. Teresa T. Holmes, and
Dr. M. John Cullinane of the Water Supply and Waste Treatment Group (WSWTG),
Environmental Engineering Division (EED), EL. Chemical analyses were per-
formed by the Analytical Laboratory Group, EED. Technician.support was pro-
vided by Messrs. Jim Ball, Dan Williams, and Larry L. Pugh.
Direct supervision was provided by Mr. Norman R. Francingues, Jr.,
Chief, WSWTG. General supervision was provided by Dr. Raymond L. Montgomery,
Chief, EED, and Dr. John Harrison, Director, EL.
At the time of publication of this report, Director of WES was
Dr. Robert W. Whalin. Commander was COL Leonard G. Hassell, EN.
This report should be cited as follows:
Bricka, R. Mark, Holmes, Teresa T., and Cullinane, M. John. 1992. "AComparative Evaluation of Two Extraction Procedures: The TCLP and theEP," Technical Report EL-92-33, U.S. Army Engineer Waterways ExperimentStation, Vicksburg, MS.
Ac;'......i. 2 i _ .NTCSýD_
ii,-, --- - -

CONTENTS
Preface ............................................................... iList of Figures ....................................................... vList of Tables ............................................................ viii
Abbreviations and Symbols .................................................. xiConversion Factors, Non-SI to SI Units of Measurement ................. xii
1. Introduction .................................................. i..... . 1Background ........................................................ 1Leaching procedure methods ....................................... 2Associated projects ............................................. 9Purpose and scope ............................................ . ... . .Organization of the report ...................................... 10
2. Conclusions ....................................................... 123. Recommendations .................................................... 134. Materials and Methods ............................................ 14
Project overview ............................................... 14Study A ......................................................... 18Study B ......................................................... 22Statistical procedures ......................................... 30
5. Results and Discussion ........................................... 32Study A ......................................................... 32Study B ......................................................... 42Spike and recovery study ....................................... 57Quality assurance/quality control .............................. 61Procedural difficulties encountered with the TCLP .......... 61
References ................................................................... 76
AppendicesA. Extraction procedure toxicity test and structural
integrity test ................................................... 79B. Toxicity characteristic leaching procedure ................... 91C. Laboratory determination of moisture content of
hazardous waste materials ...................................... 109D. Physical properties of the organic compounds ................. 113E. Study A raw data ................................................. 115F. Graphical representation of the results of TCLP and
EP extractions for Study A metals .............................. 135G. Study B metals raw data .......................................... 139H. Graphical representation of the results of TCLP and
EP extractions for Study B metals .............................. 147I. Study B organics raw data ........................................ 153J. Graphical representation of the results of TCLP and
EP extractions for Study B organics ............................ 165
iv
LIST OF FIGURES
No.
1 Extraction procedure flowchart ..................................... 3
2 TCLP flowchart ..................................................... 6
3 Project flowchart for overall study ................................ 15
4 Project flowchart for Study A ...................................... 16
5 Project flowchart for Study B ...................................... 17
6 Flowchart of the PCE waste production .............................. 27
7 Average normalized Study A cadmium extract concentrationsexpressed as the TCLP concentration divided by the EPconcentration ...................................................... . 3
8 Average normalized Study A chromium extract concentrationsexpressed as the TCLP concentration divided by the EPconcentration ....................................................... 37
9 Average normalized Study A nickel extract concentrationsexpressed as the TCLP concentration divided by the EPconcentration ...................................................... 38
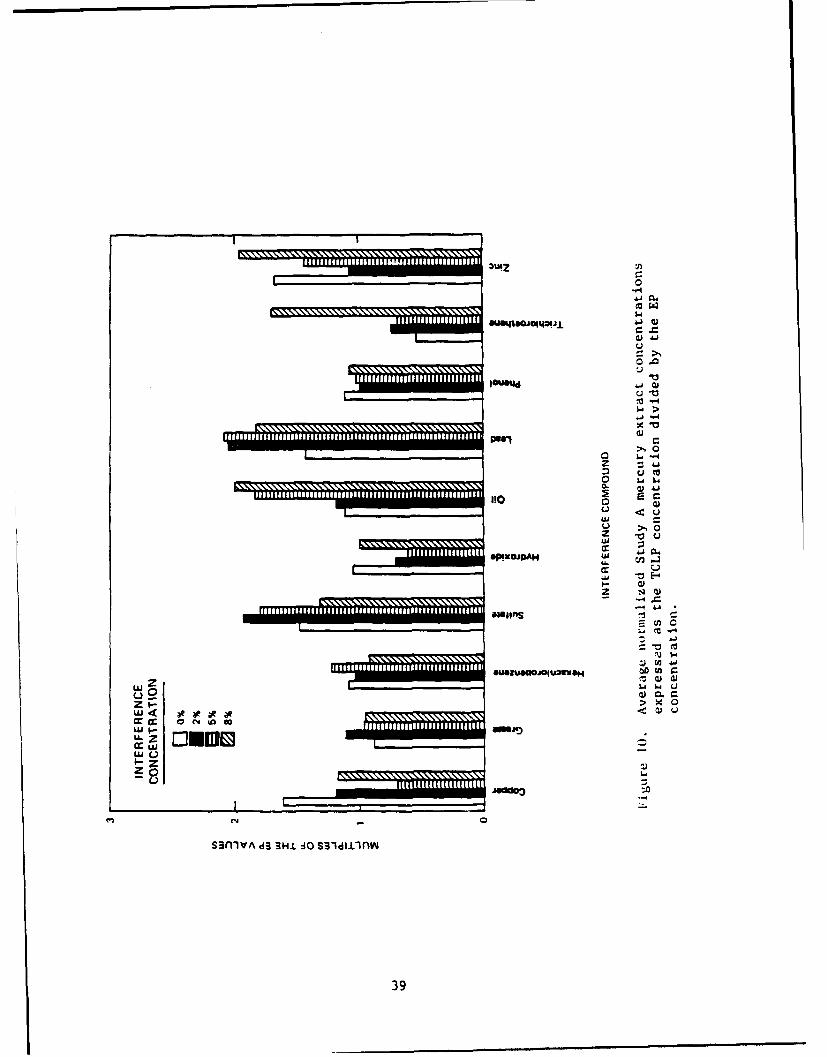
10 Average normalized Study A mercury extract concentrationsexpressed as the TCLP concentration divided by the EPconcentration ...................................................... 39
11 Average normalized Study B metal extract concentrationsexpressed as the TCLP concentration divided by the EPconcentration ...................................................... 49
12 Average normalized Study B 0.1% organic extract concentrationsexpressed as the TCLP concentration divided by the EPconcentration ...................................................... 55
13 Average normalized Study B 1.0% organic extract concentrationsexpressed as the TCLP concentration divided by the EPconcentration ...................................................... 56
A-1 EP extractor ....................................................... 81
A-2 EP rotary extractor ................................................ 81
A-3 EP EPRI extractor .................................................. 82
A-4 EP compaction tester ............................................... 85
B-1 TCLP flowchart ..................................................... 92
B-2 TCLP rotary agitator ............................................... 94
B-3 TCLP zero-headspace extraction vessel .............................. 95
F-1 Normalized EP extract concentrations versus the normalized TCLPextract concentrations for the Study A cadmium contaminant ......... 136
F-2 Normalized EP extract concentrations versus the normalized TCLPextract concentrations for the Study A chromium contaminant ........ 136
v
F-3 Normalized EP extract concentrations versus the normalized TCLPextract concentrations for the Study A nickel contaminant .......... 137
F-4 Normalized EP extract concentrations versus the normalized TCLPextract concentrations for the Study A mercury contaminant ......... 137
H-i Normalized EP extract concentrations versus the normalizedTCLP extract concentrations for the Study B antimony and silvercontaminants ....................................................... 148
H-2 Normalized EP extract concentrations versus the normalized TCLPextract concentrations for the Study B arsenic contaminant ......... 148
H-3 Normalized EP extract concentrations versus the normalized TCLPextract concentrations for the Study B cadmium contaminant ......... 149
H-4 Normalized EP extract concentrations versus the normalized TCLPextract concentrations for the Study B chromium contaminant ........ 149
H-5 Normalized EP extract concentrations versus the normalized TCLPextract concentrations for the Study B lead contaminant ............ 150
H-6 Normalized EP extract concentrations versus the normalized TCLPextract concentrations for the Study B mercury, zinc andcopper contaminants ................................................ 150
H-7 Normalized EP extract concentrations versus the normalized TCLPextract concentrations for the Study B nickel and bariumcontaminants ....................................................... 151
J-1 Normalized EP extract concentrations versus the normalized TCLPextract concentrations for the Study B benzene contaminant ......... 166
J-2 Normalized EP extract concentrations versus the normalized TCLPextract concentrations for the Study B carbon tetrachloridecontaminant ........................................................ 166
J-3 Normalized EP extract concentrations versus the normalized TCLPextract concentrations for the Study B chloroform contaminant ...... 167
J-4 Normalized EP extract concentrations versus the normalized TCLPextract concentrations for the Study B 1,2-dichloroethanecontaminant ........................................................ 167
J-5 Normalized EP extract concentrations versus the normalized TCLPextract concentrations for the Study B ethylbenzene contaminant .... 168
J-6 Normalized EP extract concentrations versus the normalized TCLPextract concentrations for the Study B l,l,2,2-tetrachloroethanecontaminant ........................................................ 168
J-7 Normalized EP extract concentrations versus the normalized TCLPextract concentrations for the Study B tetrachloroethenecontaminant ........................................................ 169
J-8 Normalized EP extract concentrations versus the normalized TCLPextract concentrations for the Study B l,l,l-trichloroethanecontaminant ........................................................ 169
J-9 Normalized EP extract concentrations versus the normalized TCLPextract concentrations for the Stujdv B trichloroethenecontaminant ....................................................... 170
vi

No.
J-1O Normalized EP extract concentrations versus the normalized TCLPextract concentrations for the Study B toluene contaminant ........ 170
J-11 Normalized EP extract concentrations versus the normalized TCLFextract concentrations for the Study B 4-methyl-2-pentanonecontaminant ....................................................... 171
J-12 Normalized EP extract concentrations versus the normalized TCLPextract concentrations for the Study B 2-butanonecontaminant ...... I ................................................. 171
vii

LIST OF TABLES
La e
1 Maximum Concentration of Contaminants for Characteristicof EP Toxicity .............................................. 5
2 Volatile Contaminants as Listed by the TCLP ................. 8
3 Analysis of the WES Sludge .................................. 18
4 Compositional Analyses of Binder Materials .................. 20
5 Chemical Analyses of Binder Materials ....................... 21
6 Interference Compounds Utilized in Study A .................. 22
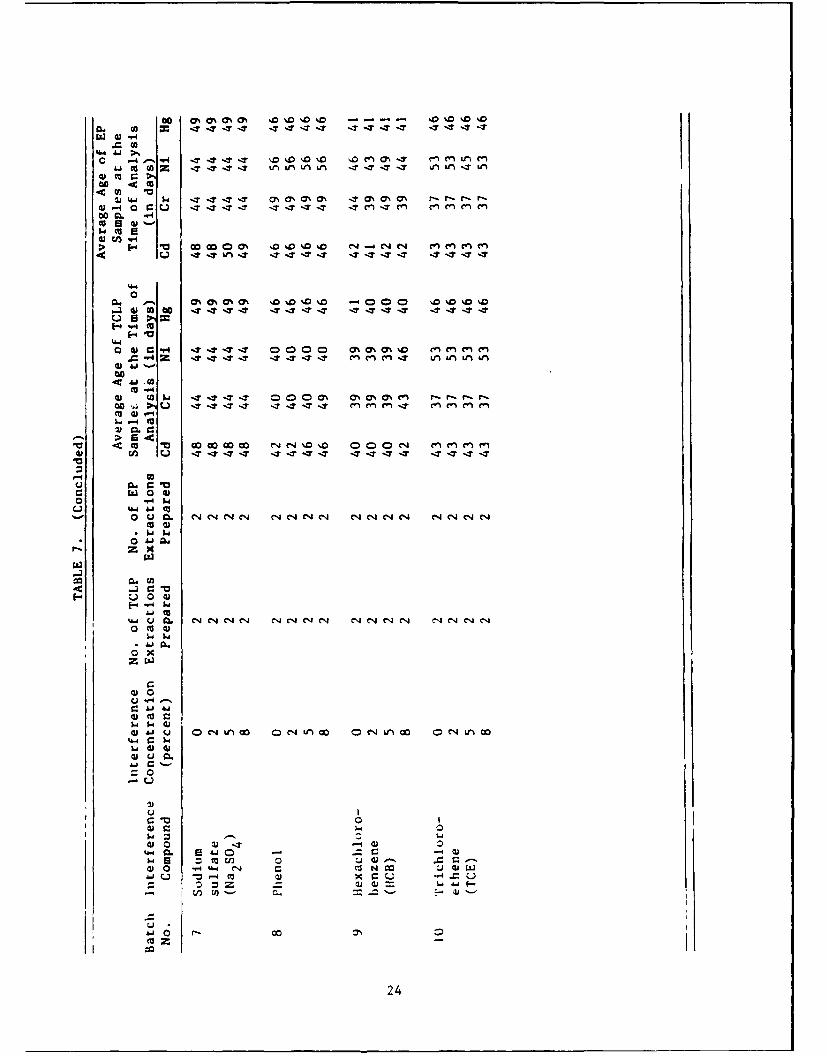
7 Test Specimen Matrix for Study A Metals Data:Extraction Sample Age at the Time of Analysis ............... 23
8 Chemical Analysis Methods ................................... 25
9 Bulk Analysis of WTC Solution ............................... 26
10 Bulk Analysis of Perchloroethlene Waste ..................... 27
11 Organic Compounds Added to Study B Sludges .................. 28
12 Volatile Spike Additions for Study B ........................ 29
13 Study A Multifactor Factorial Experimental Design ........... 31
14 Study B Multifactor Factorial Experimental Design ........... 31
15 Study A: Average TCLP and EP Extract Concentrations ........ 33
16 Summary Statistics for the Study A Metals Data .............. 35
17 Results of AVKFT Performed on NormalizedStudy A TCLP and EP Metals Results .......................... 40
18 Results of Paired-Sample T Test Performed on NormalizedStudy A TCLP and EP Nickel and Mercury Data ................. 40
19 Study B Average TCLP and EP Extract Concentrations forMetal Contaminants .......................................... 43
20 Summary Statistics for Study B M:'tals Data .................. 45
21 Results of Statistical Analysis for NormalizedStudy B TCLP and EP Metal Extracts .......................... 47
22 Results of Paired-Sample T Test for NormalizedStudy B TCLP and EP Metal Extracts .......................... 48
23 Study B Average TCLP and EP Extract Concentration for theOrganic Contaminants ........................................ 50
24 Results of Statistical Analysis for Normalized TCLPand EP Organic Extract Concentrations ....................... 53
25 Result of the Paired-Sample T Test for Normalized Study BTCLP and EP Organic Extract Concentrations .................. 54
26 Study B Organic Sludge Bulk Analyses ........................ 58
27 Average Percent of Volatiles Lost from PrespikeSamples ..................................................... 59
viii
28 Average Percent of Volatiles Lost from PostspikeSamples ..................................................... 59
29 Analysis of Method Blanks for the Metals Study A TCLP/EPTest ........................................................ 61
30 Analysis of Method Blanks for the Metals Study B TCLP/EPTest ........................................................ 63
31 Analysis of Method Blanks for the Volatile Organics Study BTCLP/EP Test ................................................ 64
32 Study A Metals Percent Accuracy of the AnalyticalLaboratory's Internal Standards ............................. 65
33 Study B Metals Percent Accuracy of the Analytical
Laboratory's Internal Standards ............................. 66
34 Study B Organic Internal Surrogate Spikes ................... 67
35 Study B Organic Duplicate and Percent Recovery Analyses ..... 68
36 Study A Metals Percent Accuracy of the External Standards... 74
37 Study B Metals Percent Accuracy of External Standards ....... 75
38 Concentration of 1,1-Dichloroethene Measured in the TCLP andEP Extracts ................................................. 75
A-i Maximum Concentration of Contaminants for Characteristicof EP Toxicity .............................................. 80
A-2 EPA-Approved Filter Holders ................................. 83
A-3 EPA-Approved Filtration Media ............................... 84
B-i Volatile Contaminants ....................................... 93
B-2 Suitable Rotary Agitation Apparatus ......................... 94
B-3 Suitable Zero-Headspace Extractor Vessels ................... 95
B-4 Suitable Filter Holders ..................................... 97
B-5 Suitable Filter Media ....................................... 97
D-I Physical Properties for the Organic Compounds Used in ThisStudy ....................................................... 113
E-I TCLP and EP Extract Analysis for Cadmium .................... 115
E-2 TCLP and EP Extract Analysis for Chromium ................... 120
E-3 TCLP and EP Extract Analysis for Mercury .................... 124
E-4 TCLP and EP Extract Analysis for Nickel ..................... 129
G-i Study B TCLP and EP Extract Analysis for the WES SludgeMetal Contaminants .......................................... 139
G-2 Study B TCLP and EP Extract Analysis for the WTC Waste MetalContaminants ................................................ 141
G-3 Study B TCLP and EP Extract Analysis for the PCE Waste MetalContaminants ................................................ 143
ix
I-I Study B TCLP and EP Extract Analyses for CarbonTetrachloride .................................................... 153
1-2 Study B TCLP and EP Extract Analyses for Chloroform ......... 154
1-3 Study B TCLP and EP Extract Analyses for 1,2-Dichloroethane ................................................... 155
1-4 Study B TCLP and EP Extract Analyses for1,1,l-Trichloroethane ............................................ 156
1-5 Study B TCLP and EP Extract Analyses for Trichloroethtne .... 157
1-6 Study B TCLP and EP Extract Analyses for Benzene ............ 158
1-7 Study B TCLP and EP Extract Analyses for1,1,2,2-Tetrachloroethane ....................................... 159
1-8 Study B TCLP and EP Extract Analyses forTetrachloroethene ................................................ 160
1-9 Study B TCLP and EP Extract Analyses for Toluene ............ 161
1-10 Study B TCLP and EP Extract Analyses for Ethylbenzene ....... 162
1-11 Study B TCLP and EP Extract Analyses for 2-Butanone ......... 163
1-12 Study B TCLP and EP Extract Analyses for4-Methyl-2-Pentanone ............................................. 164
X

LIST OF ABBREVIATIONS AND SYMBOLS
Abbreviations
ANOVA -- analysis of varianceAVMFT -- analysis of the variance multifactor factorial testBDAT -- best demonstrated available technologyEP - Extraction Procedure Toxicity TestEPTC -- Extraction Procedure Toxicity CharacteristicHDPE -- high density polyethyleneLD50 -- lethal dose to 50 percent of the populationPCE -- perchloroethenePTFE -- polytetrafluoroethyleneQA/QC -- quality assurance/quality controlRCPRA -- Resource Conservation and Recovery ActSIP -- Structural Integrity ProcedureS/S -- solidification/stabilizationTCLP -- Toxicity Characteristic Leaching Procedure (EPA Method 1311)ZHE -- Zero-headspace extraction
Symbols
B -- weight fraction of raw waste in the solidified/stabilizedinterfered waste mixture
EC -- contaminant concentration measured in the TCLP or EPextract, mg/l
ECý -- normalized extract concentration, mg/kgH -- solids concentration of the solidified/stabilized waste
extracted, expressed as a decimalV -- volume of extraction fluid, litersW -- weight of the wet waste extracted, kg
xi
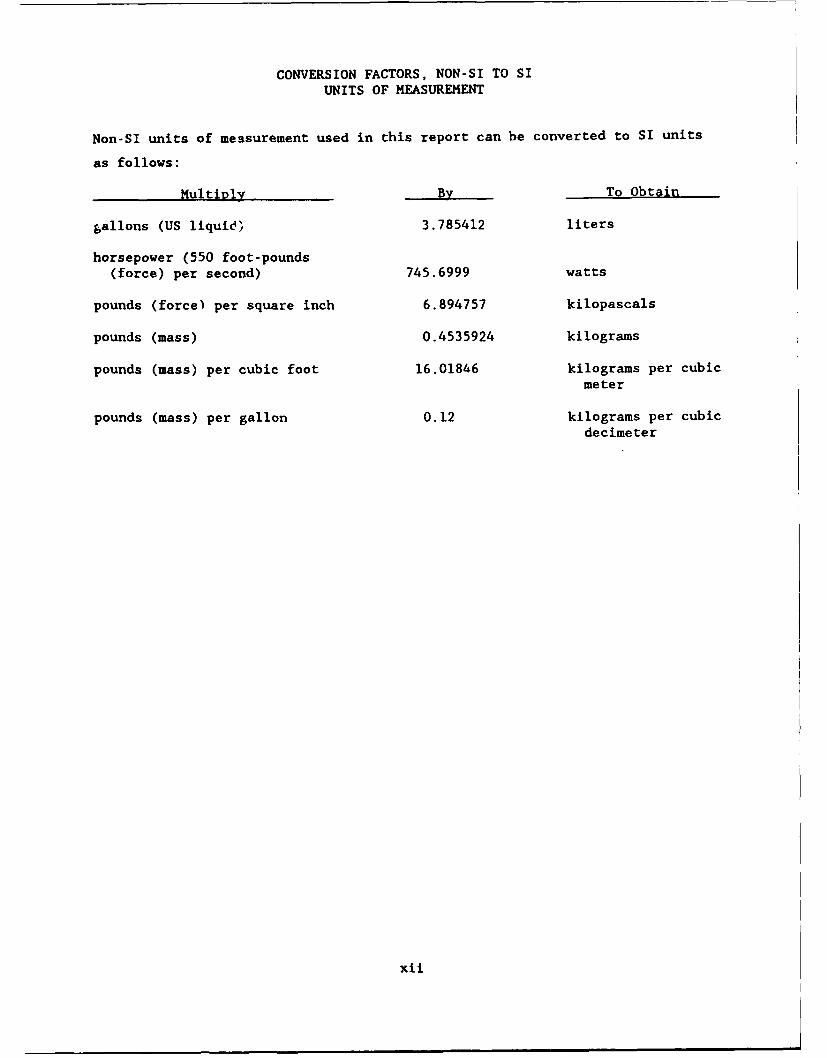
CONVERSION FACTORS, NON-SI TO SIUNITS OF MEASUREMENT
Non-SI units of measurement used in this report can be converted to SI units
as follows:
Multiply By To Obtain
gallons (US liquid) 3.785412 liters
horsepower (550 foot-pounds(force) per second) 745.6999 watts
pounds (force) per square inch 6.894757 kilopascals
pounds (mass) 0.4535924 kilograms
pounds (mass) per cubic foot 16.01846 kilograms per cubicmeter
pounds (mass) per gallon 0.12 kilograms per cubicdecimeter
xii
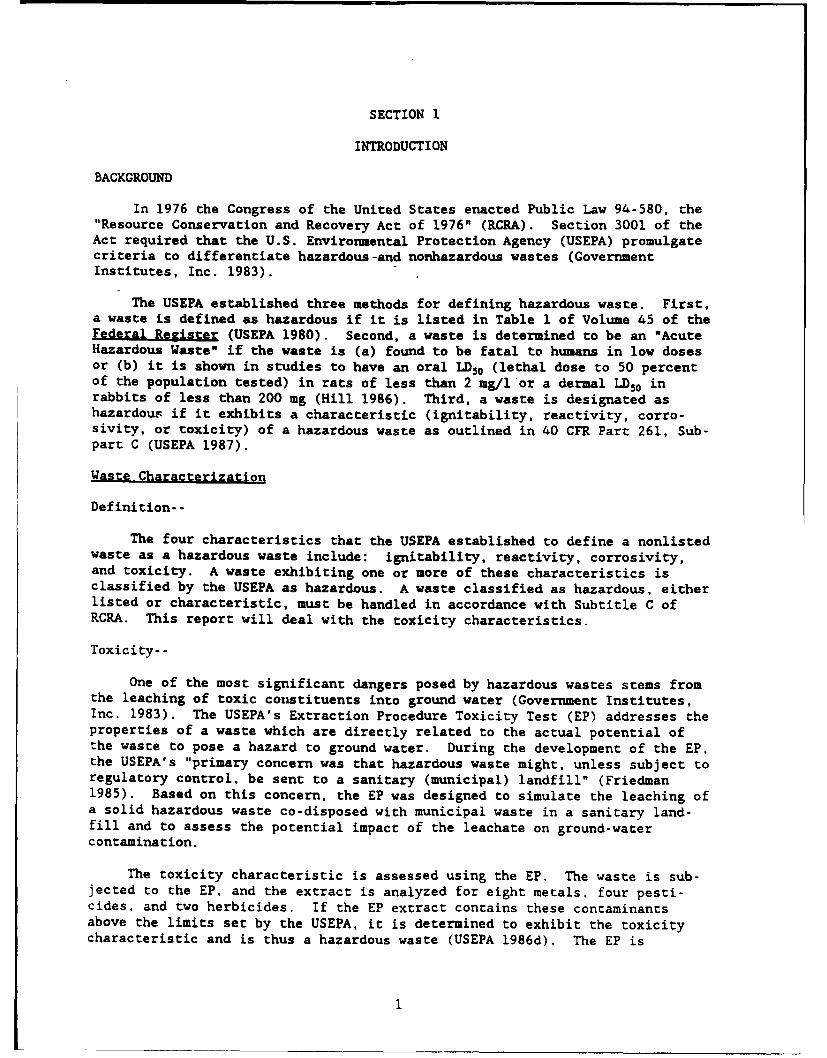
SECTION I
INTRODUCTION
BACKGROUND
In 1976 the Congress of the United States enacted Public Law 94-580, the"Resource Conservation and Recovery Act of 1976" (RCRA). Section 3001 of theAct required that the U.S. Environmental Protection Agency (USEPA) promulgatecriteria to differentiate hazardous-and nonhazardous wastes (GovernmentInstitutes, Inc. 1983).
The USEPA established three methods for defining hazardous waste. First,a waste is defined as hazardous if it is listed in Table 1 of Volume 45 of theFederal Register (USEPA 1980). Second, a waste is determined to be an "AcuteHazardous Waste" if the waste is (a) found to be fatal to humans in low dosesor (b) it is shown in studies to have an oral LD50 (lethal dose to 50 percentof the population tested) in rats of less than 2 mg/l or a dermal LD50 inrabbits of less than 200 mg (Hill 1986). Third, a waste is designated ashazardous if it exhibits a characteristic (ignitability, reactivity, corro-sivity, or toxicity) of a hazardous waste as outlined in 40 CFR Part 261, Sub-part C (USEPA 1987).
Waste Characterization
Definition�-
The four characteristics that the USEPA established to define a nonlistedwaste as a hazardous waste include: ignitability, reactivity, corrosivity,and toxicity. A waste exhibiting one or more of these characteristics isclassified by the USEPA as hazardous. A waste classified as hazardous, eitherlisted or characteristic, must be handled in accordance with Subtitle C ofRCRA. This report will deal with the toxicity characteristics.
Toxicity--
One of the most significant dangers posed by hazardous wastes stems fromthe leaching of toxic constituents into ground water (Government Institutes,Inc. 1983). The USEPA's Extraction Procedure Toxicity Test (EP) addresses theproperties of a waste which are directly related to the actual potential ofthe waste to pose a hazard to ground water. During the development of the EP,the USEPA's "primary concern was that hazardous waste might, unless subject toregulatory control, be sent to a sanitary (municipal) landfill" (Friedman1985). Based on this concern, the EP was designed to simulate the leaching ofa solid hazardous waste co-disposed with municipal waste in a sanitary land-fill and to assess the potential impact of the leachate on ground-watercontamination.
The toxicity characteristic is assessed using the EP. The waste is sub-jected to the EP, and the extract is analyzed for eight metals, four pesti-cides, and two herbicides. If the EP extract contains these contaminantsabove the limits set by the USEPA, it is determined to exhibit the toxicitycharacteristic and is thus a hazardous waste (USEPA 1986d). The EP is
I

summarized in the section below, entitled "Leaching Procedure Methods," and is
presented in its entirety in Appendix A.
Toxicity Characteristic Leaching Procedure
The Toxicity Characteristic Leaching Procedure (TCLP) is a "second-
generation" extraction procedure developed by the USEPA. The TCLP is proposed
as a replacement for the EP test as a waste characterization tool. The TCLP
method is summarized below in the section entitled "Leaching Procedure
Methods" and is presented in its entirety in Appendix B.Regulations defining a waste as hazardous were first promulgated in 1980.
At that time, the USEPA recognized that the EP addressed only a small portionof the recognized toxic constituents (Friedman 1985). The USEPA initiatedwork to develop a leaching procedure that would address additional toxic con-stituents of hazardous waste, primarily a number of organic compounds. TheTCLP has been proposed as a method of addressing the shortcomings of the EP(Friedman 1985). Since the TCLP was first published in the Federal Register(USEPA 1986a), it has undergone several modifications. This study was con-ducted according to the June 13, 1986, publication of the TCLP (USEPA 1986b).More recently, the November 7, 1986, version of the TCLP method has beenpublished in the Code of Federal Regulations, Part 267, Appendix I (USEPA1987).
LEACHING PROCEDURE METHODS
Extraction ProcedureToxicity Test Method
The Extraction Procedure Toxicity Test, as outlined in USEPA's TestMethods for Evaluating Solid Waste, SW-846 (USEPA 1982), is presented inAppendix A. Specific modifications to this procedure implemented during thisstudy are described in Section 2, "Materials and Methods." The EP extractionconsists of five steps that are summarized below. A flowchart illustratingthe steps in the EP is presented as Figure 1.
Separation Procedure--
A waste containing unbound liquid is filtered, and if the solid phase isless than 0.5% of the waste, the solid phase is discarded and the filtrateanalyzed for trace elements, pesticides, and herbicides (step 5). If thewaste contains more than 0.5% solids, the solid phase is extracted and theliquid phase is stored for later use.
Structural Integrity Procedure/Particle Size Reduction--
Prior to extraction, the solid material must pass through a 9.5-mmstandard sieve, have a surface area per gram of waste of 3.1 cm2 , or, if itconsists of a single piece, be subjected to the Structural Integrity Proce-dure. This procedure is used to demonstrate the ability of the waste toremain intact after disposal. If the waste does not meet one of these condi-tions, it must be ground to pass the 9.5-mm sieve.
2

Wet Waste SampeRContains < 0.5% A Wast Somme Co ins > 0.5%Nonfiitrable 100 Grams 1 NonfiitrabieSolids Solids
i~ ld l'~ dS :]__+- UquidSolidqudS ori dn S ld Solid
a SSeparation
I 0DiscardI
1, uicl Ir€ SineU uid
.> 5.mm < .5mm Monolithic
Sample Size StructuralReduction Integrity
Procedure
Store at 40CExtraction of Solid Waste at pH ,2
Solid +- Uquid Solid Separation JDiscard
Uquid
EP Extract
i I Analysis Methods
Figure I. Extraction procedure flowchart.
3
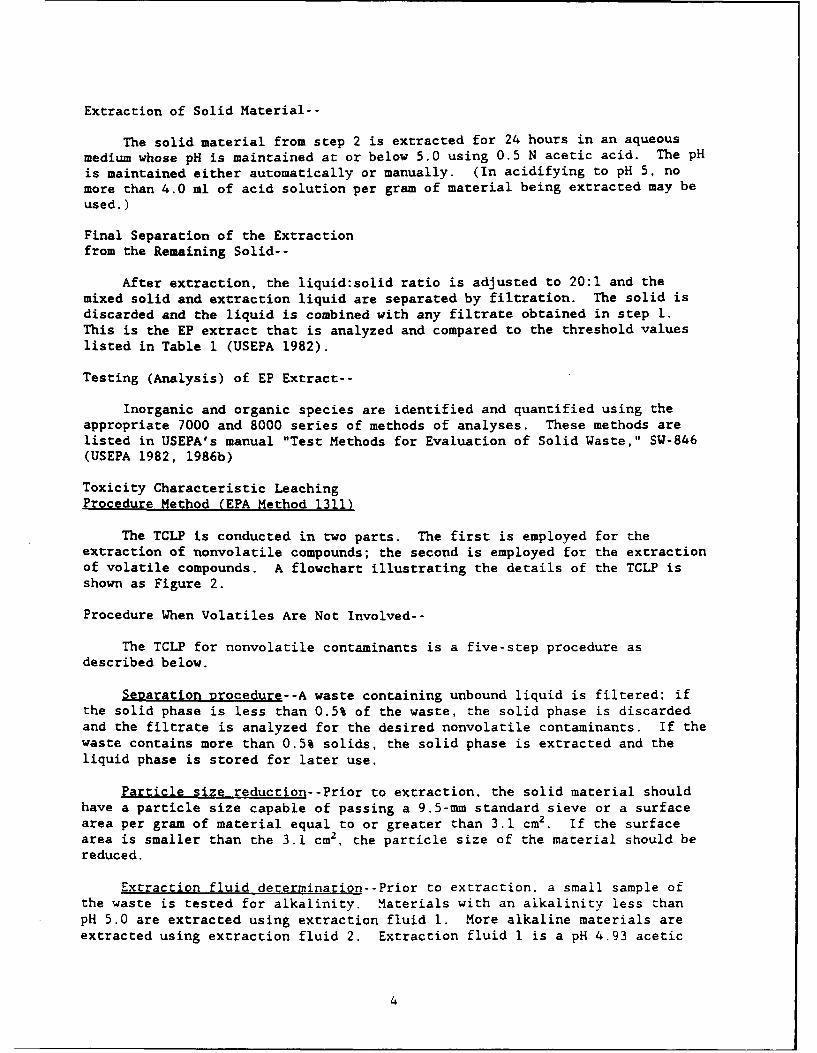
Extraction of Solid Material--
The solid material from step 2 is extracted for 24 hours in an aqueousmedium whose pH is maintained at or below 5.0 using 0.5 N acetic acid. The pHis maintained either automatically or manually. (In acidifying to pH 5, nomore than 4.0 ml of acid solution per gram of material being extracted may beused.)
Final Separation of the Extractionfrom the Remaining Solid--
After extraction, the liquid:solid ratio is adjusted to 20:1 and themixed solid and extraction liquid are separated by filtration. The solid isdiscarded and the liquid is combined with any filtrate obtained in step 1.This is the EP extract that is analyzed and compared to the threshold valueslisted in Table 1 (USEPA 1982).
Testing (Analysis) of EP Extract--
Inorganic and organic species are identified and quantified using theappropriate 7000 and 8000 series of methods of analyses. These methods arelisted in USEPA's manual "Test Methods for Evaluation of Solid Waste," SW-846(USEPA 1982, 1986b)
Toxicity Characteristic LeachingProcedure Method (EPA Method 1311)
The TCLP is conducted in two parts. The first is employed for theextraction of nonvolatile compounds; the second is employed for the extractionof volatile compounds. A flowchart illustrating the details of the TCLP isshown as Figure 2.
Procedure When Volatiles Are Not Involved--
The TCLP for nonvolatile contaminants is a five-step procedure asdescribed below.
Separation procedure--A waste containing unbound liquid is filtered; ifthe solid phase is less than 0.5% of the waste, the solid phase is discardedand the filtrate is analyzed for the desired nonvolatile contaminants. If thewaste contains more than 0.5% solids, the solid phase is extracted and theliquid phase is stored for later use.
Particle size reduction--Prior to extraction, the solid material shouldhave a particle size capable of passing a 9.5-mm standard sieve or a surfacearea per gram of material equal to or greater than 3.1 cm2 . If the surfacearea is smaller than the 3.1 cm2 , the particle size of the material should bereduced.
Extraction fluid determination--Prior to extraction, a small sample ofthe waste is tested for alkalinity. Materials with an alkalinity less thanpH 5.0 are extracted using extraction fluid 1. More alkaline materials areextracted using extraction fluid 2. Extraction fluid 1 is a pH 4.93 acetic
4

TABLE I. MAXIMUM CONCENTRATION OF CONTAMINANTSFOR CHARACTERISTIC OF EP TOXICITY
EPA MaximumHazardous ConcentrationWaste Number Contaminant (mg/1)
D004 Arsenic 5.0
D005 Barium 100.0
D006 Cadmium 1.0
D007 Chromium 5.0
D008 Lead 5.0
D009 Mercury 0.2
DOO Selenium 1.0
DOll Silver 5.0
D012 Endrin (l, 2 , 3 ,4,10,10-Hexachloro-1 0.027-epoxy-1,4,4a,5,6,7,8,8a-octahydro-i4-endo, endo-5, 8 -dimethano-naphthalene)
D013 Lindane (1,2,3,4,5, 6-Hexa-chloro-cyclohexane,gamma isomer) 0.4
D014 Methoxychlor (11,l-Trichloro-2,2-bis(p-methoxyphenyl)ethane) 10.0
DO5 Toxaphene (C10H10 C1 8 , Technical chlorinated
camphene, 67-69% chlorine) 0.5
D016 2,4-D ( 2 , 4 -Dichlorophenoxyacetic acid)
D017 2,4,5-TP (Silvex) (2,4,5- 10.0Trichlorophenoxypropionic acid)
1.0
5

WET WASTE SAMPLE REPRESENTATIVE WASTE WET WASTE SAMPLE
CONTAINS < 0.5% R-- R SAMPLE CONTAINS > 0.5%NON FILTERABLE SOLIDS NON FILTERABLE SOLIDS
DRY WASTE SAMPLE
SLIQUID/SOLIDSEPARATION DISCARD SOLID e 0.6 - 0.8 um
0.6 - 0.8 um SOLIDGLASS FIBER GLASS FIBER
FILTERS SOLID FILTERS
REDUCE PARTICLE SIZE IF LIQUID
> 9.5 mm OR
SURFACE AREA< 3.1 cm 2
STORE AT40 C
PRESCREENING ZERO HEAD EXTRACTION
TO SELECT EXTRACTION OF SOLID FOR
FLUID VO LATI LE CONTAMINANTS
TCLP EXTRACTION OF LIQU ID/SOLIDSOLID FOR NON- SEPARATION
VOLATILE CONTAMINANTS 0.6 - 0.8 um SOLID
GLASS FIBER DISCARDEDFILTERS
LIQUID/SOLIDSEPARATION
DISCARD 0.6 - 0.8 umGLASS FIBER LIQUID
FIF#LTERSI
LIQUID
S"TCLP EXRE XTRACT
TCLP EXTRACT -IANALYTICAL METHODS I-TLEXRC
Figure 2. TCLP flowchart.
6

acid/sodium acetate buffer solution. Extraction fluid 2 is an acetic acid
solution having a pH of 2.88.
Extraction of the solid material--The solid waste is placed in an extrac-
tion bottle, and 20 times the weight of the solid waste of the appropriate
extraction fluid is used to slurry the solid waste. The waste is extractedfor 18 hours.
Final saearation of the extraction from the remaining solid--Followingextraction, the liquid is separated from the solid by filtration. The solidis discarded, and the liquid is combined with any filtrate obtained in step 1.This is the TCLP extract that is analyzed for nonvolatile contaminants.
Procedure When Volatiles Are Involved--
The TCLP used for the extraction of volatile contaminants is a four-stepprocedure as described below. Table 2 specifies the volatile contaminantslisted by the TCLP.
StusraLion procedure--A separation procedure, similar to the one used forthe nonvolatile extraction, is performed. This procedure was described in thesubsection entitled "Procedure When Volatiles Are Not Involved."
Particle size reduction--The method used to reduce the particle size ofthe waste extracted for volatile compounds is similar to the particle sizereduction method used for the nonvolatile extraction. This method is alsodescribed under the nonvolatile section.
Zero-headspace extraction of the solid material--The solid waste isextracted utilizing extraction fluid 1 regardless of pH. The waste is placedin a zero-headspace extraction (ZHE) device and slurried (under zero head con-ditions) with extraction fluid at 20 times the weight of the waste. The wasteis extracted for 18 hours.
Final separation of the extraction from the remaining solid--Followingextraction, the liquid is simultaneously filtered and removed from the ZHEdevice. The solid is discarded, and the extraction liquid is combined withany filtrate obtained in step 1. This is the TCLP extract that is analyzedfor volatile contaminants.
Comparison of EP and TCLP Methods
There are many contrasts between the EP and TCLP methods (Callaway, Parr,and Bollinger 1987), some of which are quite prominent; others are buried deepwithin the procedures. The most obvious difference is that the TCLP requiresthe use of the ZHE vessel for volatile compounds and an extraction fluidselection step for nonvolatile extractions. Other differences include:
1. In the TCLP method for nonvolatiles, one of two extraction fluids isselected to extract the soiid waste sample. The type of extractionfluid is determined in an initial test on the waste and is based onthe waste's alkalinity. Extraction fluid 1 is an acetate buffer at a
pH of 4.93 ± 0.05. Extraction fluid 2 is an acetic acid solution
7
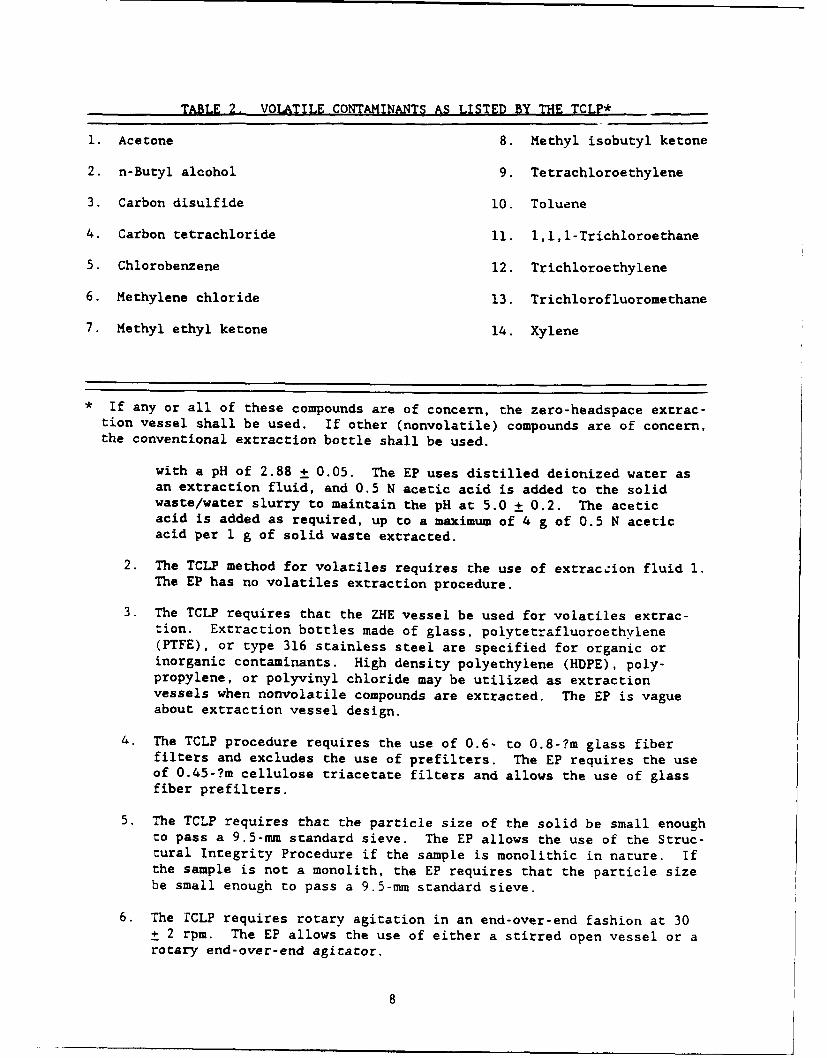
TABLE 2. VOLATILE CONTAMINANTS AS LISTED BY THE TCLP*
1. Acetone 8. Methyl isobutyl ketone
2. n-Butyl alcohol 9. Tetrachloroethylene
3. Carbon disulfide 10. Toluene
4. Carbon tetrachloride 11. 1,1,1-Trichloroethane
5. Chlorobenzene 12. Trichloroethylene
6. Methylene chloride 13. Trichlorofluoromethane
7. Methyl ethyl ketone 14. Xylene
* If any or all of these compounds are of concern, the zero-headspace extrac-tion vessel shall be used. If other (nonvolatile) compounds are of concern,the conventional extraction bottle shall be used.
with a pH of 2.88 ± 0.05. The EP uses distilled deionized water asan extraction fluid, and 0.5 N acetic acid is added to the solidwaste/water slurry to maintain the pH at 5.0 ± 0.2. The aceticacid is added as required, up to a maximum of 4 g of 0.5 N aceticacid per 1 g of solid waste extracted.
2. The TCLP method for volatiles requires the use of extraction fluid 1.The EP has no volatiles extraction procedure.
3. The TCLP requires that the ZHE vessel be used for volatiles extrac-tion. Extraction bottles made of glass, polytetrafluoroethylene(PTFE), or type 316 stainless steel are specified for organic orinorganic contaminants. High density polyethylene (HDPE), poly-propylene, or polyvinyl chloride may be utilized as extractionvessels when nonvolatile compounds are extracted. The EP is vagueabout extraction vessel design.
4. The TCLP procedure requires the use of 0.6- to 0.8-?m glass fiberfilters and excludes the use of prefilters. The EP requires the useof 0.45-?m cellulose triacetate filters and allows the use of glassfiber prefilters.
5. The TCLP requires that the particle size of the solid be small enoughto pass a 9.5-mm standard sieve. The EP allows the use of the Struc-tural Integrity Procedure if the sample is monolithic in nature. Ifthe sample is not a monolith, the EP requires that the particle sizebe small enough to pass a 9.5-mm standard sieve.
6. The TCLP requires rotary agitation in an end-over-end fashion at 30± 2 rpm. The EP allows the use of either a stirred open vessel or arotary end-over-end agitator.
8

7. The extraction period for the TCLP is 18 hours. The extractionperiod for the EP is 24 hours ± 2 hours.
8. The EP requires monitoring and adjustment of the pH during theextraction. The TCLP does not.
ASSOCIATED PROJECTS
The waste materials utilized in this study were also used in three otherstudies funded by the USEPA and conducted at the U.S. Army Engineer WaterwaysExperiment Station. These studies include: (1) Investigation of Test Methodsfor Solidified Waste Characterization - A Cooperative Program," (2) "Evalua-tion of Factors Affecting Stabilization/Solidification of Toxic and HazardousWaste," and (3) "Evaluation of Stabilization/Solidification as a Best Demon-strated Available Technology." Brief descriptions of these projects and theirrelationships to this study are presented below.
Investigation of Test Methodsfor Solidified Waste Character-ization - A Cooperative Program
This study was designed to develop and evaluate techniques to assess theeffectiveness of a variety of solidification/stabilization' (S/S) tech-nologies. Three laboratories, the U.S. Army Engineer Waterways ExperimentStation (WES), the Wastewater Technology Centre (WTC), and the Alberta Envi-ronmental Centre (AEC), participated in the study. Five raw wastes weresolidified/stabilized by 15 commercial S/S vendors. The resulting solidi-fied/stabilized materials were shipped to the three labs (WES, WTC, and AEC),and 12 testing protocols were performed on the solidified/stabilized mate-rials. Details - f the cooperative study are .. tlne.. in the report entitled"Laboratory Assessment of Short-Term Test Methods for the Evaluation ofSolidified/Stabilized Waste Materials" (Holmes and Bricka 1988) and in"Investigation of Test Methods for Solidified Waste Characterization: ACooperative Program" (Stegemann and Cote, in press).
One of the five raw wastes developed for the cooperative study was asynthetic metal solution formulated by the WTC laboratory. This waste isreferred to as the "WTC waste" through the remainder of this report.
Evaluation of Factors AffectingS/S of Toxic and Hazardous Wastes
This study (referred to as "The Interference Project") was designed toassess the effects of a variety of industrial chemicals on the physical andchemical properties of typical S/S processes.
1 Solidification/stabilization is a process that involves the mixing of ahazardous waste with a binder waterial to enhance the physical and chemicalproperties of the waste and to chemically bind any free liquid (USEPA1986a).
9
Many hazardous wastes contain materials that are known to inhibit the settingand strength development properties of S/S techniques. The effects offive organic and five inorganic chemicals on a solidified/stabilized syntheticheavy metal sludge were evaluated. The synthetic metal sludge was solidified/stabilized using three generic binders. The details of this study are out-lined in a report entitled "An Assessment of Materials That Interfere withStabilization/Solidification Processes" (Cullinane, Bricka, and Francingues1987).
The synthetic metal plating sludge evaluated in the Interference Projectwas also used in this TCLP/EP comparison study. The synthetic metal platingsludge is identified as the "WES waste" through the remainder of this report.
Evaluation of S/S as a Best Demon-strated Available Technolozy (BDAT)
The BDAT S/S study determined whether S/S techniques could be applied toa variety of "listed" wastes and evaluated the effects of the S/S techniqueson the mobility of the contaminants contained in the wastes. Data collectedas part of the BDAT S/S study are being utilized by the USEPA to support thedevelopment of treatment standards for wastes subject to the land disposalrestrictions (USEPA 1987). The details of this study are outlined in a seriesof reports (see Bricka, Holmes, and Cullinane 1988).
One of the listed wastes evaluated in the BDAT S/S study, a by-productfrom the reclamation of spent perchloroethene solvent, was also used in thisTCLP/EP comparison study. Throughout the remainder of this report, theperchloroethene solvent waste is identified as the "PCE waste."
PURPOSE AND SCOPE
The purpose of this study was to compare the results of the TCLP to thoseof the EP. This comparison was accomplished by dividing this study into sub-studies. The first substudy evaluated the metal-extraction effectiveness ofthe two methods. The second substudy investigated the extraction of volatilecompounds. The third substudy examined the volatile losses due to themechanics of conducting the extractions and the storage of extracts prior toanalyses.
ORGANIZATION OF THE REPORT
Section 1: Introduction
The introduction briefly describes the origin of the EP and TCLP extrac-tions, the difference between the TCLP and EP extractions, various projectsassociated with this study, and the scope of the study.
Sections 2 and 3:Conclusions and Recommendations
Conclusions based on the results of this study and recommendations forfuture research are presented in these sections.
10
Section 4: Materials and Methods
This section describes the three separate substudies conducted as part ofthis research effort. Each substudy details the methods used for preparing
the wastes and the extraction procedures performed.
Section 5: Results
This section presents the results of the EP and TCLP extraction and com-
pares the extraction tests.
11

SECTION 2
CONCLUS IONS
This study was conducted to compare the results of the TCLP and the EP.The EP and TCLP extractions were performed on a number of different wastessubjected to a variety of conditions. Based on the results of this study, thefollowing conclusions can be drawn.
(1) Generally, the TCLP was a more aggressive leaching procedure thanthe EP.
(a) When the TGLP extraction fluid 2 was used for the extraction ofmetal contaminants, the EP and TCLP produced similar results.
(b) When the TCLP extraction fluid 1 was used for the extraction ofmetal contaminants, the EP and TCLP produced statistically different results,with the TCLP generally being the more aggressive extraction.
(c) The TCLP zero-headspace extraction was only a slightly more aggres-sive extraction for volatile organics than the EP extraction in this study.
(2) Although the TCLP zero-headspace extraction was a more aggressiveextraction procedure than the EP for the volatile organics, the difference inthe concentrations of volatile organics in the TCLP and EP extracts was lessthan expected.
(3) When the ZHE vessel was used, cross contamination presented a poten-rial problem.
(4) The TCLP and EP extraction of the solidified/stabilized specimensappeared to produce conditions that permit dechlorination reactions to occur.Significant amounts of l,l-dichloroethene were detected in the TCLP and EPextracts although no ll-dichloroethene was added, and none was detected inthe raw wastes.
12

SECTION 3
RECOMMENDATIONS
The TCLP method, while more difficL-t to perform that the EP method, isan extraction test that can be performec in most laboratories. The TCLPmethod, unlike the EP method, addresses semivolatile and volatile contami-nants. Several areas should be clarified in the TCLP extraction method. Thefollowing recommendations are base% on the results of this study.
(1) The ZHE vessel is difficult to clean. The TCLP method needs to makerecommendations on the most effective method of cleaning the ZHE vessel. Mod-ification of the valve design is highly recommended to improve cleaningtechniques.
(2) The TCLP method is vague about procedures for sample collection fromthe ZHE vessel when Tedlar bags are not used. A section describing the col-lection of a sample using volatile vials should be included in the TCLPmethod.
(3) Additional research should be initiated to investigate why volatilechlorinated compounds extracted from solidified/stabilized wastes are con-verted to other chlorinated forms.
13

SECTION 4
MATERIALS AND METHODS
PROJECT OVERVIEW
General ApDroach to the Investigation
This project includes two independent evaluations, Study A and Study B.These studies compare the results from the-EP and TCLP extraction proceduresusing common waste types. Project flowcharts for both studies are presentedin Figures 3 through 5.
Study A--Study A was conducted in four phases, as summarized below.
Phase I--A synthetic metal plating sludge containing cadmium (Cd), chro-mium (Cr), nickel (Ni), and mercury (Hg) was prepared.
Pbase Il--The synthetic sludge was solidified/stabilized using a limekiln dust binding agent. Prior to the initial set, the solidified/stabilizedsludge was divided into portions, and a single "interfering" compound wasmixed with each portion of solidified/stabilized sludge. A total of 10 inter-fering compounds were added to the various portions of the sludge.
Phase III--The kiln dust/sludge/interference mixtures were cured for28 days. After curing, each waste mixture was subjected to the EP extractionand the TCLP extraction. The extracts of the TCLP and EP were analyzed forCd, Cr, Ni, and Hg.
Phase IV--The results of chemical analyses performed for the TCLP and EPextracts were compared to evaluate differences between the two extractionmethods.
Study B--
Study B was conducted in four phases as summarized below.
Phase I--Three wastes, the metal sludge used in Study A, a syntheticmetal waste solution, and a perchloroethene still-bottom waste (K030), wereused in Study B. The synthetic metal solution and the metal sludge weresolidified/stabilized using Type I Portland cement as a binding agent. Theperchloroethene sludge was not solidified/stabilized. Prior to the initialset, each of these solidified/stabilized mixtures and the untreated perchloro-ethene waste were divided into two portions. Twelve volatile organic com-pounds were added to each portion at approximate concentrations of 0.1% and1.0%, respectively.
Phase II--These six mixtures were placed in sealed bottles and allowed tocure for 14 days. After curing, each waste material was subjected to the EPand TCLP extractions. The TCLP and EP extracts were analyzed for metals andvolatile organic compounds.
14
PROJECT: LABORATORY COMPARATIVE EVALUATIONOF THE
TCLP AND EP
STUDY A STUDY B
CONTINUED IN FIGURE 4 CONTINUED IN FIGURE 5
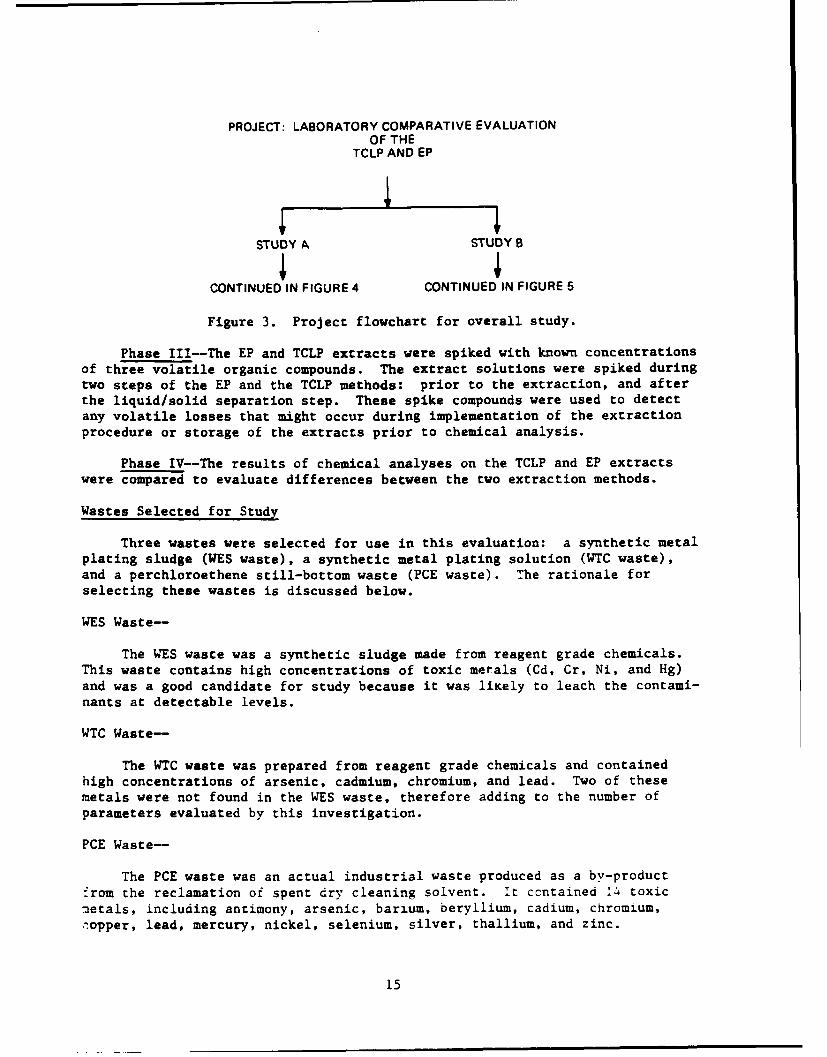
Figure 3. Project flowchart for overall study.
Phase III-The EP and TCLP extracts were spiked with known concentrationsof three volatile organic compounds. The extract solutions were spiked duringtwo steps of the EP and the TCLP methods: prior to the extraction, and afterthe liquid/solid separation step. These spike compounds were used to detectany volatile losses that might occur during implementation of the extractionprocedure or storage of the extracts prior to chemical analysis.
Phase IV--The results of chemical analyses on the TCLP and EP extracts
were compared to evaluate differences between the two extraction methods.
Wastes Selected for Study
Three wastes were selected for use in this evaluation: a synthetic metalplating sludge (WES waste), a synthetic metal plating solution (WTC waste),and a perchloroethene still-bottom waste (PCE waste). The rationale forselecting these wastes is discussed below.
WES Waste--
The WES waste was a synthetic sludge made from reagent grade chemicals.This waste contains high concentrations of toxic metals (Cd, Cr, Ni, and Hg)and was a good candidate for study because it was liKely to leach the contami-nants at detectable levels.
WTC Waste-
The WTC waste was prepared from reagent grade chemicals and containedhigh concentrations of arsenic, cadmium, chromium, and lead. Two of thesemetals were not found in the WES waste, therefore adding to the number ofparameters evaluated by this investigation.
PCE Waste-
The PCE waste was an actual industrial waste produced as a by-productfrom the reclamation of spent dry cleaning solvent. It ccntained 14 toxicmetals, including antimony, arsenic, barium, beryllium, cadium, chromium,,opper, lead, mercury, nickel, selenium, silver, thallium, and zinc.
15

C'm
z ui2-
16 -

w+zUz .
00
LU
00= -40 < 11
+ENJIuj u
UR
cc17
STUDY A
Waste DescriDtion
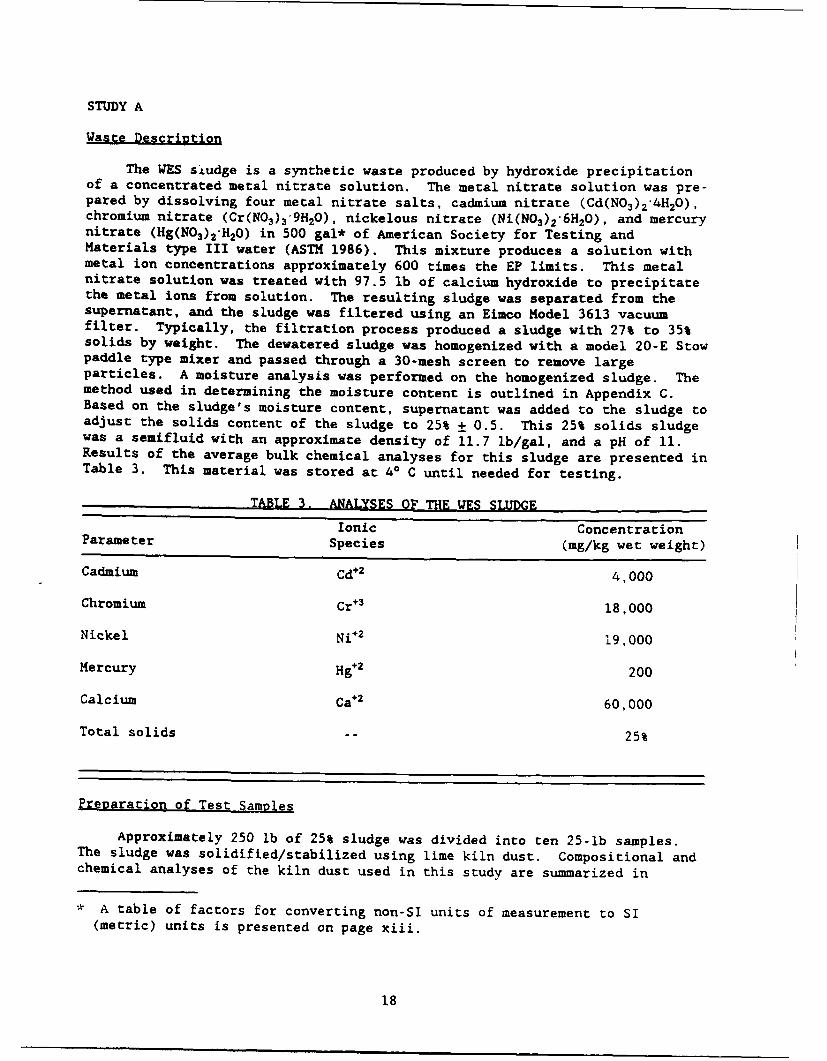
The WES sludge is a synthetic waste produced by hydroxide precipitationof a concentrated metal nitrate solution. The metal nitrate solution was pre-pared by dissolving four metal nitrate salts, cadmium nitrate (Cd(N0 3) 2 4H20),chromium nitrate (Cr(NO3 ) 3 9H20), nickelous nitrate (Ni(NO3) 2'6H20), and mercurynitrate (Hg(N0 3 ) 2.H20) in 500 gal* of American Society for Testing andMaterials type III water (ASTM 1986). This mixture produces a solution withmetal ion concentrations approximately 600 times the EP limits. This metalnitrate solution was treated with 97.5 lb of calcium hydroxide to precipitatethe metal ions from solution. The resulting sludge was separated from thesupernatant, and the sludge was filtered using an Eimco Model 3613 vacuumfilter. Typically, the filtration process produced a sludge with 27% to 35%solids by weight. The dewatered sludge was homogenized with a model 20-E Stowpaddle type mixer and passed through a 30-mesh screen to remove largeparticles. A moisture analysis was performed on the homogenized sludge. Themethod used in determining the moisture content is outlined in Appendix C.Based on the sludge's moisture content, supernatant was added to the sludge toadjust the solids content of the sludge to 25% + 0.5. This 25% solids sludgewas a semifluid with an approximate density of 11.7 lb/gal, and a pH of 11.Results of the average bulk chemical analyses for this sludge are presented inTable 3. This material was stored at 40 C until needed for testing.
TABLE 3. ANALYSES OF THE WES SLUDGE
Ionic ConcentrationParameter Species (mg/kg wet weight)
Cadmium Cd+2 4,000
Chromium Cr"3 18,000
Nickel Ni+2 19,000
Mercury Hg+2 200
Calcium Ca+2 60,000
Total solids 25%
Preoaration of Test Samples
Approximately 250 lb of 25% sludge was divided into ten 25-lb samples.The sludge was solidified/stabilized using lime kiln dust. Compositional andchemical analyses of the kiln dust used in this study are summarized in
SA table of factors for converting non-SI units of measurement to SI(metric) units is presented on page xiii.
18

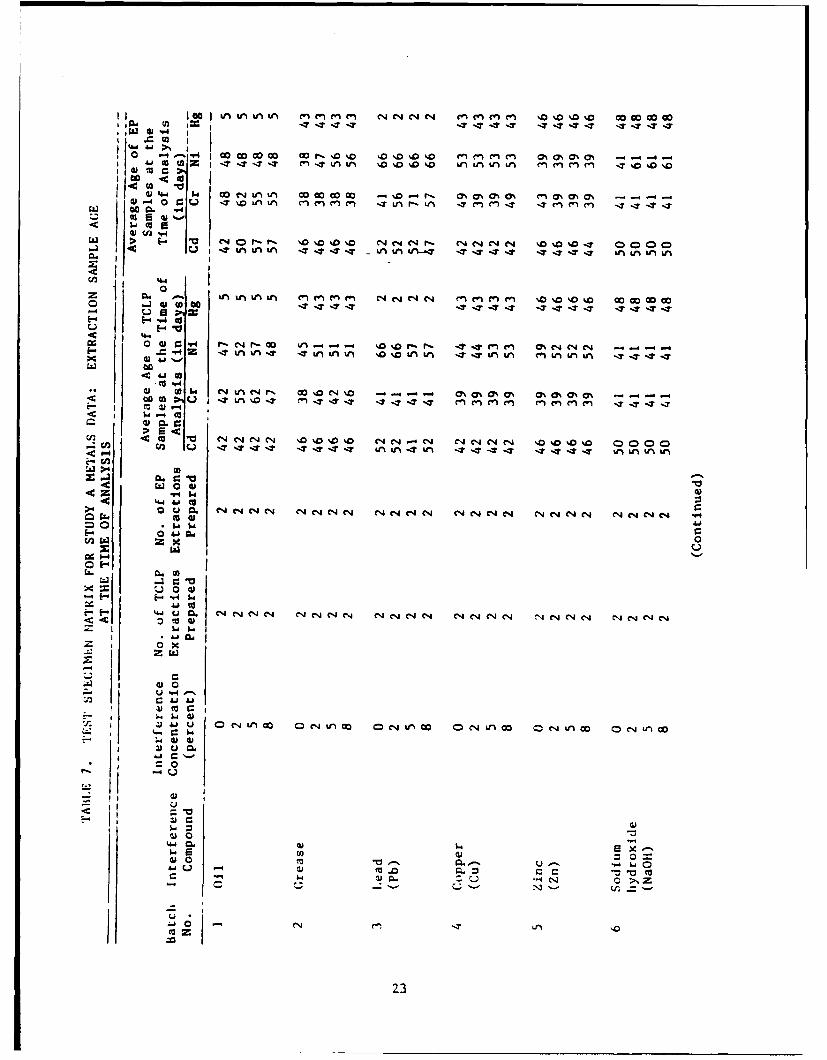
Tables 4 and 5. Each 25-lb sample of sludge was solidified/stabilized with27.5 lb of the lime kiln dust. Prior to the initial set, each sample was sub-divided into four equal portions. One of the ten interfering compounds(Table 6) was added to each portion at approximate percentages* of 0%, 2%, 5%,or 8% (wet weight interference compound to kiln dust/sludge mixture). Due tothe large number of samples required, all the specimens used in this studycould not be prepared at one time. The sludge/kiln dust/interference mixtureswere prepared in several batches according to the schedule presented inTable 7.
After each waste/kiln dust/interference mixture was thoroughly homog-enized, two samples were prepared by pouring the slurry into two 850-miplastic disposable cylindrical molds. The samples were cured in the molds at230 C and 98 percent relative humidity for a minimum of 24 hours and removedfrom the molds whenever they developed sufficient strength to be free stand-ing. After removal from the molds, the samples continued curing for a periodof 28 days under the same conditions.
At the end of the 28-day cure period, the samples were ground with a mor-tar and pestle to pass a 9.5-mm sieve. Ground materials from duplicate sam-ples were recombined and sealed in 1,000-ml polyethylene bottles. Thus, asingle sample was prepared for each of the 10 interfering compounds at thefour interference compound percentages.
The bottles were agitated in an end-over-end fashion to mix their con-tents, and samples were collected to determine the moisture content of thematerials (as outlined in Appendix C). Duplicate subsamples were collectedfrom each bottle containing the ground materials. These duplicate subsampleswere subjected to EP and TCLP methods outlined in Appendices A and B. Amethod blank was carried through the extraction procedures for each inter-ference compound. The matrix of test specimens subjected to the EP and TCLPextractions along with the age of the extraction sample at the time of analy-sis is presented as Table 7.
Analytical Procedures
The EP and TCLP extracts were analyzed for various metals. The analyti-cal and digestion methods used are presented in Table 8.
Qluality Assurance/Quality Control
Both internal and external laboratory quality assurance/quality control(QA/QC) measures were performed during the course of Study A. External QA/QCis defined as that which is performed by the laboratory conducting the extrac-tions; internal QA/QC is the which performed by the laboratory that analyzesthe extract for the contaminants of interest. External QA/QC consisted of(1) carrying method blanks through the extractions every 9th sample and(2) submitting standards to the analytical laboratory every 10th sample.Internal QA/QC consisted of performing the metal analysis by the method ofstandard additions.
* Actual concentrations were 0%, 1.96%, 4.76%, and 7.41%.
19
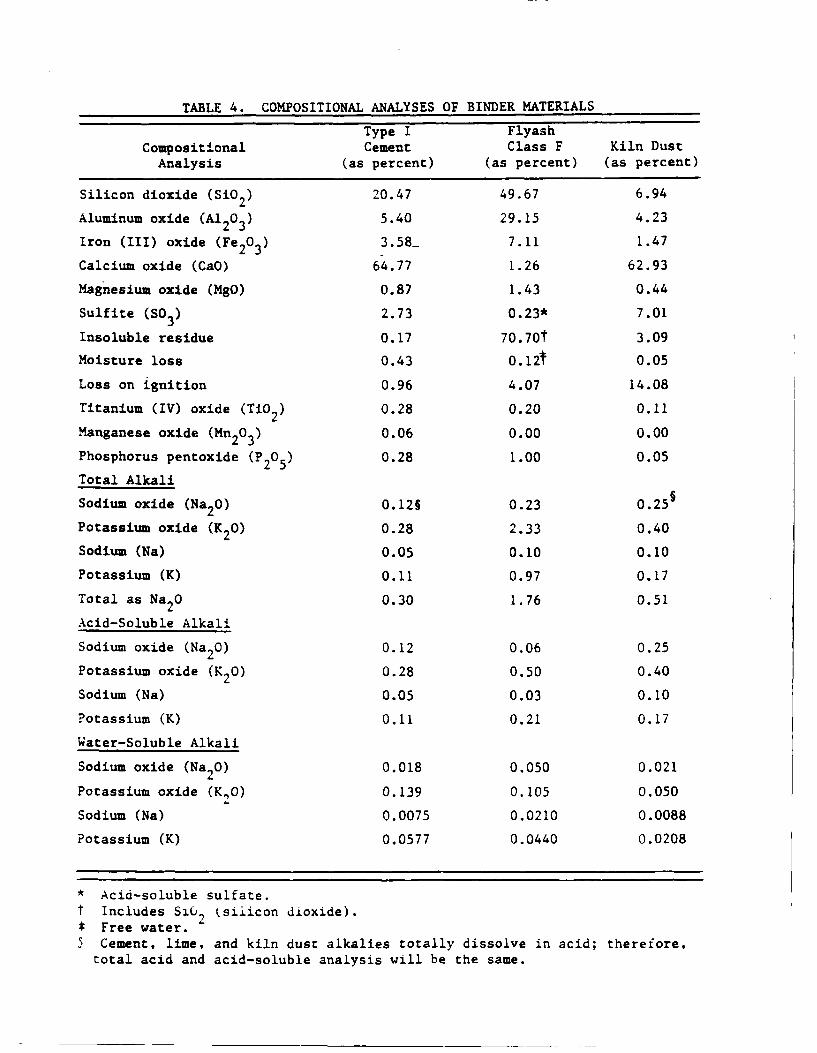
TABLE 4. COMPOSITIONAL ANALYSES OF BINDER MATERIALS
Type I FlyashCompositional Cement Class F Kiln Dust
Analysis (as percent) (as percent) (as percent)
Silicon dioxide (SiO2 ) 20.47 49.67 6.94
Aluminum oxide (AI 2 0 3 ) 5.40 29.15 4.23
Iron (III) oxide (Fe 2 0 3 ) 3.58- 7.11 1.47
Calcium oxide (CaO) 64.77 1.26 62.93
Magnesium oxide (MgO) 0.87 1.43 0.44
Sulfite (SO3) 2.73 0.23* 7.01
Insoluble residue 0.17 70.70t 3.09
Moisture loss 0.43 0.12t 0.05
Loss on ignition 0.96 4.07 14.08
Titanium (IV) oxide (TiO2) 0.28 0.20 0.11
Manganese oxide (Mn2 03 ) 0.06 0.00 0.00
Phosphorus pentoxide (P 205 ) 0.28 1.00 0.05
Total Alkali
Sodium oxide (Na2 0) 0.12§ 0.23 0.25§
Potassium oxide (K2 0) 0.28 2.33 0.40
Sodium (Na) 0.05 0.10 0.10
Potassium (K) 0.11 0.97 0.17
Total as Na20 0.30 1.76 0.51
Acid-Soluble Alkali
Sodium oxide (Na20) 0.12 0.06 0.25
Potassium oxide (K2 0) 0.28 0.50 0.40
Sodium (Na) 0.05 0.03 0.10
Potassium (K) 0.11 0.21 0.17
Water-Soluble Alkali
Sodium oxide (Na2,0) 0.018 0.050 0.021
Potassium oxide (K.O) 0.139 0.105 0.050
Sodium (Na) 0.0075 0.0210 0.0088
Potassium (K) 0.0577 0.0440 0.0208
* Acid-soluble sulfate.
t Includes Sib, (siiicon dioxide).*Free water.5 Cement, lime, and kiln dust alkalies totally dissolve in acid; therefore,
total acid and acid-soluble analysis will be the same.
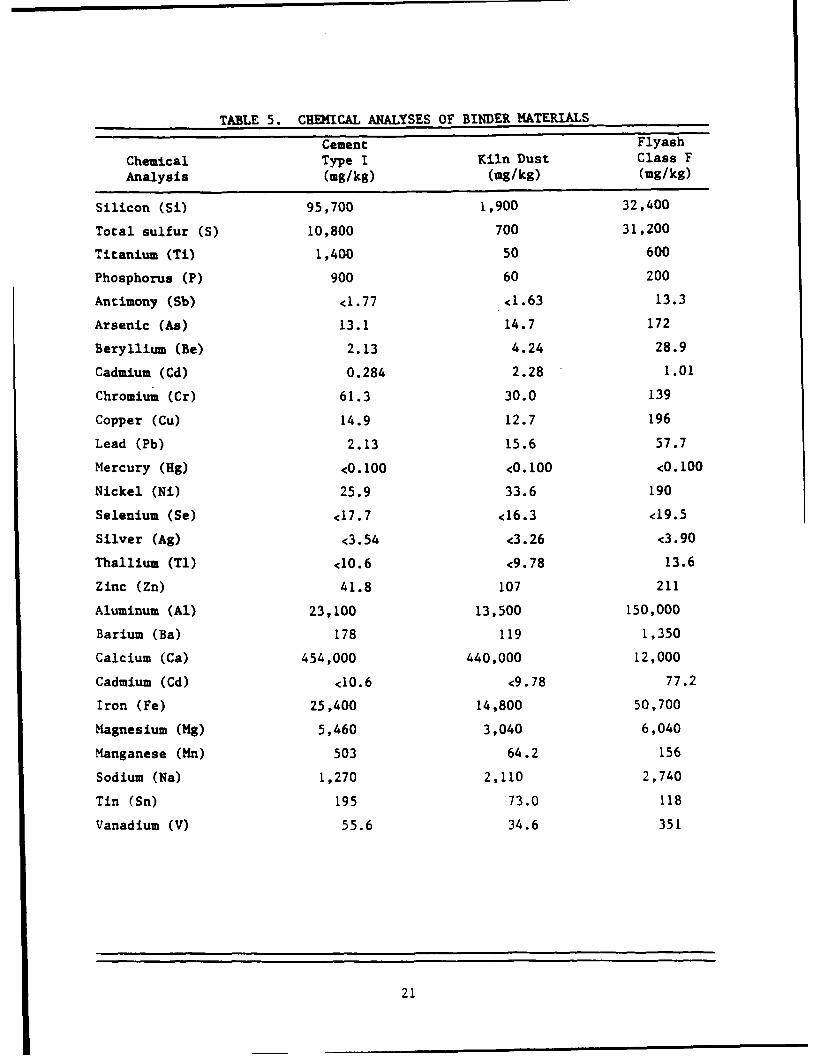
TABLE 5. CHEICAL ANALYSES OF BINDER MATERIALS
Cement FlyashChemical Type I Kiln Dust Class FAnalysis (mg/kg) (mg/kg) (mg/kg)
Silicon (Si) 95,700 1,900 32,400
Total sulfur (S) 10,800 700 31,200
Titanium (Ti) 1,400 50 600
Phosphorus (P) 900 60 200
Antimony (Sb) <1.77 <1.63 13.3
Arsenic (As) 13.1 14.7 172
Beryllium (Be) 2.13 4.24 28.9
Cadmium (Cd) 0.284 2.28 1.01
Chromium (Cr) 61.3 30.0 139
Copper (Cu) 14.9 12.7 196
Lead (Pb) 2.13 15.6 57.7
Mercury (Hg) <0.100 <0.100 <0.100
Nickel (Ni) 25.9 33.6 190
Selenium (Se) <17.7 <16.3 <19.5
Silver (Ag) <3.54 <3.26 <3.90
Thallium (Tl) <10.6 <9.78 13.6
Zinc (Zn) 41.8 107 211
Aluminum (Al) 23,100 13,500 150,000
Barium (Ba) 178 119 1,350
Calcium (Ca) 454,000 440,000 12,000
Cadmium (Cd) <10.6 <9.78 77.2
Iron (Fe) 25,400 14,800 50,700
Magnesium (Mg) 5,460 3,040 6,040
Manganese (Mn) 503 64.2 156
Sodium (Na) 1,270 2,110 2,740
Tin (Sn) 195 73.0 118
Vanadium (V) 55.6 34.6 351
21
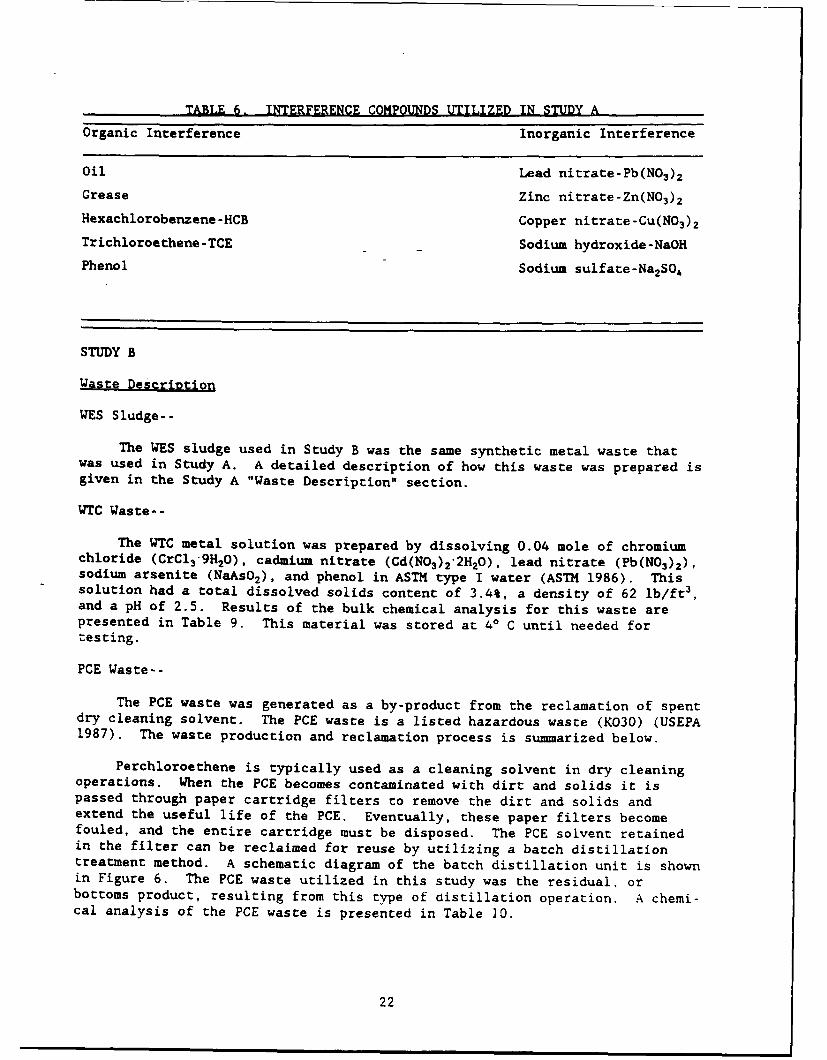
TABLE 6. INTERFERENCE COMPOUNDS UTILIZED IN STUDY AOrganic Interference Inorganic Interference
Oil Lead nitrate-Pb(N0 3) 2Grease Zinc nitrate-Zn(NO3)2Hexachlorobenzene-HCB Copper nitrate-Cu(N03 )2Trichloroethene-TCE Sodium hydroxide-NaOHPhenol Sodium sulfate-Na2 SO4
STUDY B
Waste Description
WES Sludge--
The WES sludge used in Study B was the same synthetic metal waste thatwas used in Study A. A detailed description of how this waste was prepared isgiven in the Study A "Waste Description" section.
WTC Waste-
The WTC metal solution was prepared by dissolving 0.04 mole of chromiumchloride (CrCl 3 .9H20), cadmium nitrate (Cd(N0 3 ) 2-2H20), lead nitrate (Pb(N0 3)2 ),sodium arsenite (NaAsO 2), and phenol in ASTM type I water (ASTM 1986). Thissolution had a total dissolved solids content of 3.4%, a density of 62 lb/ft 3,and a pH of 2.5. Results of the bulk chemical analysis for this waste arepresented in Table 9. This material was stored at 40 C until needed fortesting.
PCE Waste--
The PCE waste was generated as a by-product from the reclamation of spentdry cleaning solvent. The PCE waste is a listed hazardous waste (K030) (USEPA1987). The waste production and reclamation process is summarized below.
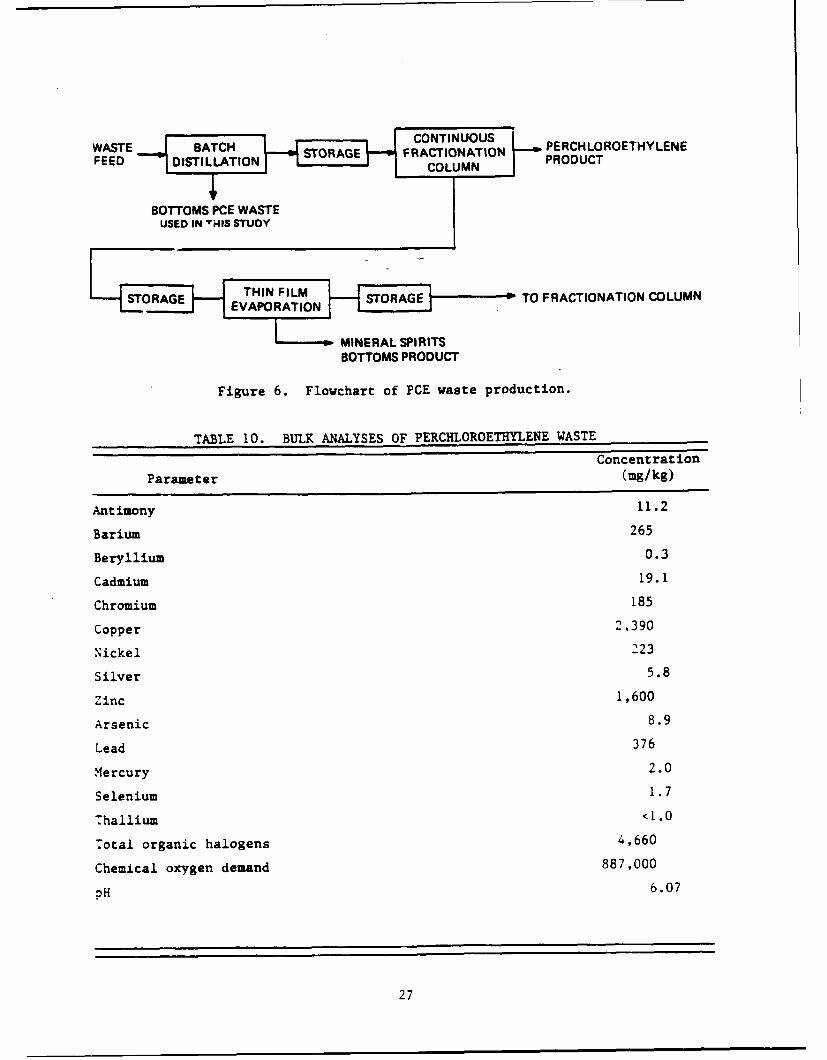
Perchloroethene is typically used as a cleaning solvent in dry cleaningoperations. When the PCE becomes contaminated with dirt and solids it ispassed through paper cartridge filters to remove the dirt and solids andextend the useful life of the PCE. Eventually, these paper filters becomefouled, and the entire cartridge must be disposed. The PCE solvent retainedin the filter can be reclaimed for reuse by utilizing a batch distillationtreatment method. A schematic diagram of the batch distillation unit is shownin Figure 6. The PCE waste utilized in this study was the residual, orbottoms product, resulting from this type of distillation operation. A chemi-cal analysis of the PCE waste is presented in Table 10.
22
Un Ioog LM k~n m f m CJ~C mmmm O~%0%0% w0000
41 Vf 4
0 - -A c o oG . ,% %Q ý'orT~ %O~'. meJ~- CenJ'~ en ~ O 0000C7 C-~nI n r 0W wl wl wlru~r m muuI- m~7t m.-- ui r%a
to . C
w 44 $ 0LjUlV 0c ocor %UONM c %m0w 4 0 r n M m m en I nr r 7 m M T - 1 -T -
u IW "
A..5
(n i44
w w
Er .-4 co
0 aO 0 4011 r o L 4cl n (AC
410 CO ~ 'cJs N~J~ CJ'I e~j.J~ ~ ,C e ( Cor'.w v 14r o Q %
cc f 04.0 L0L%%o1 ne nc e nc T1 11mf0
' U 0. t-4 C,4 C4 Cj .4 j C'Jc.C4 cq ~ ' C'4c ~ CCJN V4 L1 . .
z
02r.10E- Uy w
41 to
j Ia-.)
a) 01
01 -P -
-V CI C -'
".. 0 w'0
4)41 u C n 0 C4Lr 0 0 L) 0 C L O z n 0 0 ,23)0
40 ~ ~ ~ ~ % %Q'OO %QOO~ - -
0 Z4*% -.-~7IT-T? 'O)Lr O L 0 I I I U,0O)- ~CLn 17
21 4 T- Na %a a r -r ,r
<DV
4.4 .
41 IT ITI TI 1IT4iw Nu
00
- a 4104 ~-T-7--T 0000% N 0% 0 en#-- r-~-
< cc M. Go-7. 000 Q00O~ co C4 D.Q CID Mmf
w 00
0 C1 C% -CN C C4C1 1
w 6
z CD
~04
0 u ~ C1'4 CNC14(N C C'J4JC14JC14 cJC14 C%4 C 04J'C-4
0 x
C013
004
4100
10= w0 =" .
~4124

TABLE 8. CHEMICAL ANALYSIS METHODS
Parameter USEPA* USEPAof Interest Digestion Method Analytical Method
Antimony NA 7041* with Zeeman
Arsenic NA 7760*
Barium 3020 6010t
Beryllium 3020 6010t
Cadmium 3020 7131*
Chromium 3020 7191*
Copper 3020 6010t
Lead 3020 7421*
Mercury NA 7470*
Nickel 3020 6010t
Selenium 3020 7740* with Zeeman
Silver 3020 7761*
Thallium 3020 7841t
Zinc 3020 6010*
Volatile organics NA 8240
* USEPA SW-846 2nd edition (USEPA 1982).USEPA SW-846 3rd edition (USEPA 1986d).
Preparation of Test Samples
WES Sludge--
Approximately 4.2 lb of Type I Portland cement was mixed with 14 lb ofthe 25% solids WES sludge in a Hobart C-100 mixer. A compositional analysisof the cement is presented in Table 4. After thorough mixing and prior to theinitial set, this solidified/stabilized sludge was divided into two equal por-tions, each weighing 8.59 lb. To the first portion, 0.086 and 0.0086 lb,respectively, of each of the 12 organics listed in Table 11 was added to thecement/sludge slurry and thoroughly mixed. This resulted in cement/sludgemixtures that contained approximately 1.0% (by weight) and 0.1%, respectively,total of organics. Each of these mixtures was poured into three 1-liter
25
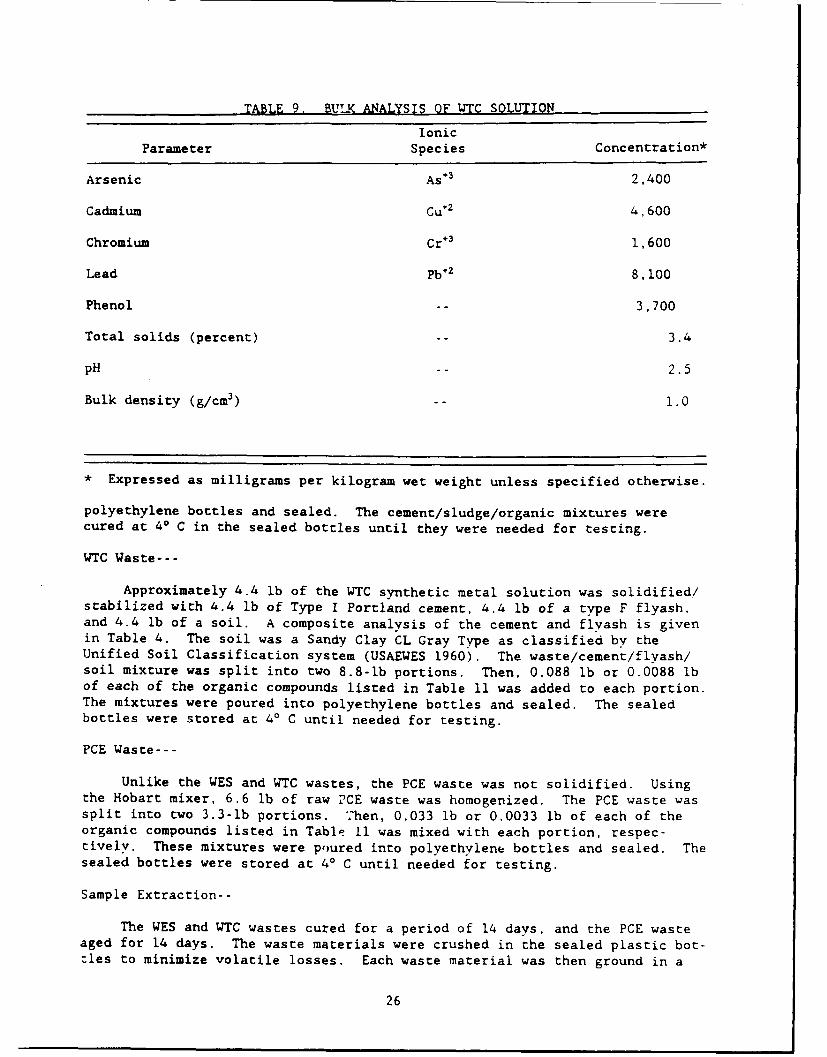
TABLE 9. BULK ANALYSIS OF WTC SOLUTION
IonicParameter Species Concentration*
Arsenic As÷3 2,400
Cadmium Cuý2 4,600
Chromium Cr+3 1,600
Lead Pb 2 8,100
Phenol -- 3,700
Total solids (percent) -3.
pH 2.5
Bulk density (g/cm3 ) 1.0
* Expressed as milligrams per kilogram wet weight unless specified otherwise.
polyethylene bottles and sealed. The cement/sludge/organic mixtures werecured at 40 C in the sealed bottles until they were needed for testing.
WTC Waste---
Approximately 4.4 lb of the WTC synthetic metal solution was solidified/stabilized with 4.4 lb of Type I Portland cement, 4.4 lb of a type F flyash,and 4.4 lb of a soil. A composite analysis of the cement and flvash is givenin Table 4. The soil was a Sandy Clay CL Gray Type as classified by theUnified Soil Classification system (USAEWES 1960). The waste/cement/flyash/soil mixture was split into two 8.8-lb portions. Then, 0.088 lb or 0.0088 lbof each of the organic compounds listed in Table 11 was added to each portion.The mixtures were poured into polyethylene bottles and sealed. The sealedbottles were stored at 4' C until needed for testing.
PCE Waste---
Unlike the WES and WTC wastes, the PCE waste was not solidified. Usingthe Hobart mixer, 6.6 lb of raw PCE waste was homogenized. The PCE waste wassplit into two 3.3-lb portions. "7hen, 0.033 lb or 0.0033 lb of each of theorganic compounds listed in Table 11 was mixed with each portion, respec-tively. These mixtures were poured into polyethylene bottles and seaied. Thesealed bottles were stored at 40 C until needed for testing.
Sample Extraction--
The WES and WTC wastes cured for a period of 14 days, and the PCE wasteaged for 14 days. The waste materials were crushed in the sealed plastic bot-tles to minimize volatile losses. Each waste material was then ground in a
26
WASTE STHCONTINUOUS PERCH LOROETHYLENEFEED DISTILILATION STORAGE VFRACTIONATION PRODUCT
-- ESOERGDE 1 TIN FLM STOAGETO FRACTIONATION COLUMN
MINERAL SPIRITSBOTTOMS PRODUCT
Figure 6. Flowchart of PCE waste production.
TABLE 10. BULK ANALYSES OF PERCHLOROETRYLENE WASTE
ConcentrationParameter (mg/kg)
Antimony 1.1.2
Barium 265
Beryllium 0.3
Cadmium 19.1
Chromium 1.85
Copper 2,390
Nickel 223
Silver 5.8
Zinc 1,600
Arsenic 8.9
Lead 376
Mercury 2.0
Selenium 1.7
Thallium <1.0
Total organic halogens 4,660
Chemical oxygen demand 887,000
pH 6.07
27
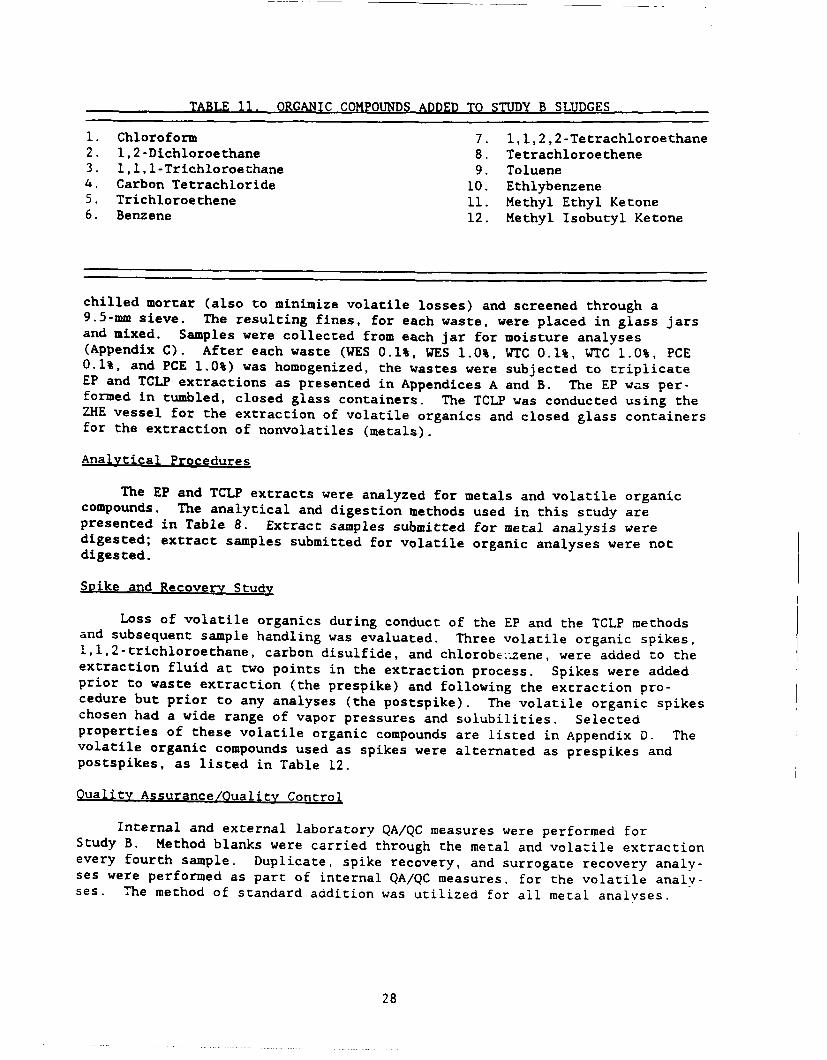
TABLE 11. ORGANIC COMPOUNDS ADDED TO STUDY B SLUDGES
I. Chloroform 7. 1,1,2,2-Tetrachloroethane2. 1,2-Dichloroethane 8. Tetrachloroethene3. 1,1,1-Trichloroethane 9. Toluene4. Carbon Tetrachloride 10. Ethlybenzene5. Trichloroethene 11. Methyl Ethyl Ketone6. Benzene 12. Methyl Isobutyl Ketone
chilled mortar (also to minimize volatile losses) and screened through a9 .5-mm sieve. The resulting fines, for each waste, were placed in glass jarsand mixed. Samples were collected from each jar for moisture analyses(Appendix C). After each waste (WES 0.1%, WES 1.0%, WTC 0.1%, WTC 1.0%, PCE0.1%, and PCE 1.0%) was homogenized, the wastes were subjected to triplicateEP and TCLP extractions as presented in Appendices A and B. The EP was per-formed in tumbled, closed glass containers. The TCLP was conducted using theZHE vessel for the extraction of volatile organics and closed glass containersfor the extraction of nonvolatiles (metals).
Analytical Procedures
The EP and TCLP extracts were analyzed for metals and volatile organiccompounds. The analytical and digestion methods used in this study arepresented in Table 8. Extract samples submitted for metal analysis weredigested; extract samples submitted for volatile organic analyses were notdigested.
Soike and Recovery Study
Loss of volatile organics during conduct of the EP and the TCLP methodsand subsequent sample handling was evaluated. Three volatile organic spikes,1,l,2-trichloroethane, carbon disulfide, and chlorobezzene, were added to theextraction fluid at two points in the extraction process. Spikes were addedprior to waste extraction (the prespike) and following the extraction pro-cedure but prior to any analyses (the postspike). The volatile organic spikeschosen had a wide range of vapor pressures and solubilities. Selectedproperties of these volatile organic compounds are listed in Appendix D. Thevolatile organic compounds used as spikes were alternated as prespikes andpostspikes, as listed in Table 12.
Quality Assurance/Quality Control
Internal and external laboratory QA/QC measures were performed forStudy B. Method blanks were carried through the metal and volatile extractionevery fourth sample. Duplicate, spike recovery, and surrogate recovery analy-ses were performed as part of internal QA/QC measures, for the volatile analy-ses. The method of standard addition was utilized for all metal analyses.
28
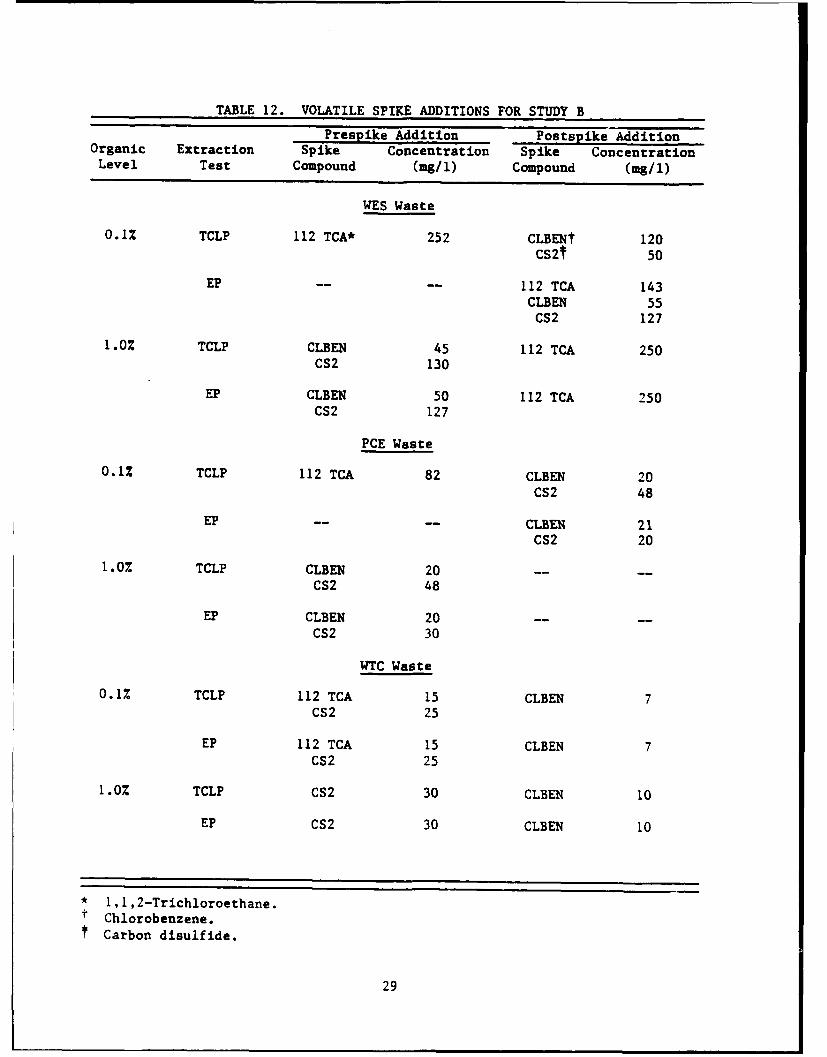
TABLE 12. VOLATILE SPIKE ADDITIONS FOR STUDY B
Prespike Addition Postspike AdditionOrganic Extraction Spike Concentration Spike ConcentrationLevel Test Compound (mg/i) Compound (mg/i)
WES Waste
0.1% TCLP 112 TCA* 252 CLBENt 120CS2t 50
EP -- 112 TCA 143CLBEN 55
CS2 127
1.0% TCLP CLBEN 45 112 TCA 250CS2 130
EP CLBEN 50 112 TCA 250CS2 127
PCE Waste
0.1% TCLP 112 TCA 82 CLBEN 20CS2 48
EP -- -- CLBEN 21CS2 20
1.0% TCLP CLBEN 20 --
CS2 48
EP CLBEN 20 --
CS2 30
WTC Waste
0.1% TCLP 112 TCA 15 CLBEN 7CS2 25
EP 112 TCA 15 CLBEN 7CS2 25
1.0% TCLP CS2 30 CLBEN 10
EP CS2 30 CLBEN 10
* 1,1,2-Trichloroethane.T Chlorobenzene.
Carbon disulfide.
29
STATISTICAL PROCEDURES
Statistical analyses were performed, using the Statistical Analysis Sys-tem (SAS) software package provided by SAS Institute, Inc. (1987). An analy-sis of the variance multifactor factorial test, as described by Miller andFreund (1985), was conducted on data sets produced by Study A and Study B. Ananalysis of variance (ANOVA) procedure outlined in Chapter 11 of the SAS/STATuser guide (SAS Institute, Inc. 1987) was used to perform this statisticalprocedure.
When it was determined that the levels of interaction were significant, a"paired-sample T test" (Miller and Freund 1985) was used to determine if theEP and TCLP results differed significantly. A MEANS procedure outlined inChapter 33 of the SAS/STAT user guide (SAS Institute, Inc. 1987) was used toperform this statistical procedure.
Concentrations below detection levels were estimated by dividing thedetection level by 2 rather than using the actual detection level or zero, asan estimate of the concentration. This is an accepted method of reportingconcentration values near the detection limit (Francis and Maskarinec 1986).
The multifactor factorial experimental designs for Study A and Study Bare illustrated in Tables 13 and 14, respectively. One multifactor factorialmethod was performed for each contaminant. Decisions on whether to reject oraccept the null hypothesis were made using an alpha level of significance of0.05, or 20:1 odds.
30

TABLE 13. STUDY A MULTIFACTOR FACTORIAL EXPERIMENTAL DESIGN
A. B. C.Interference Interference Extraction D.
Level Compound Concentration Test Replicate
1 Oil 0% TCLP 1
2 Grease 2% EP 2
3 HCB* 5Z
4 Phenol 8%
5 TCEt
6 Leadnitrate
7 Zincnitrate
8 Coppernitrate
9 Sodiumhydroxide
10 Sodiumsulfate
* Hexachlorobenzene.t Trichloroethene.
TABLE 14. STUDY B MULTIFACTOR FACTORIAL EXPERIMENTAL DESIGN
A. Sludge B. Organic C. Extrac- D.Level Type Concentration tion Test Replicate
I WES 1.0% TCLP 1
2 WTC 0.1% EP 2
3 PCE
31
SECTION 5
RESULTS AND DISCUSSION
STUDY A
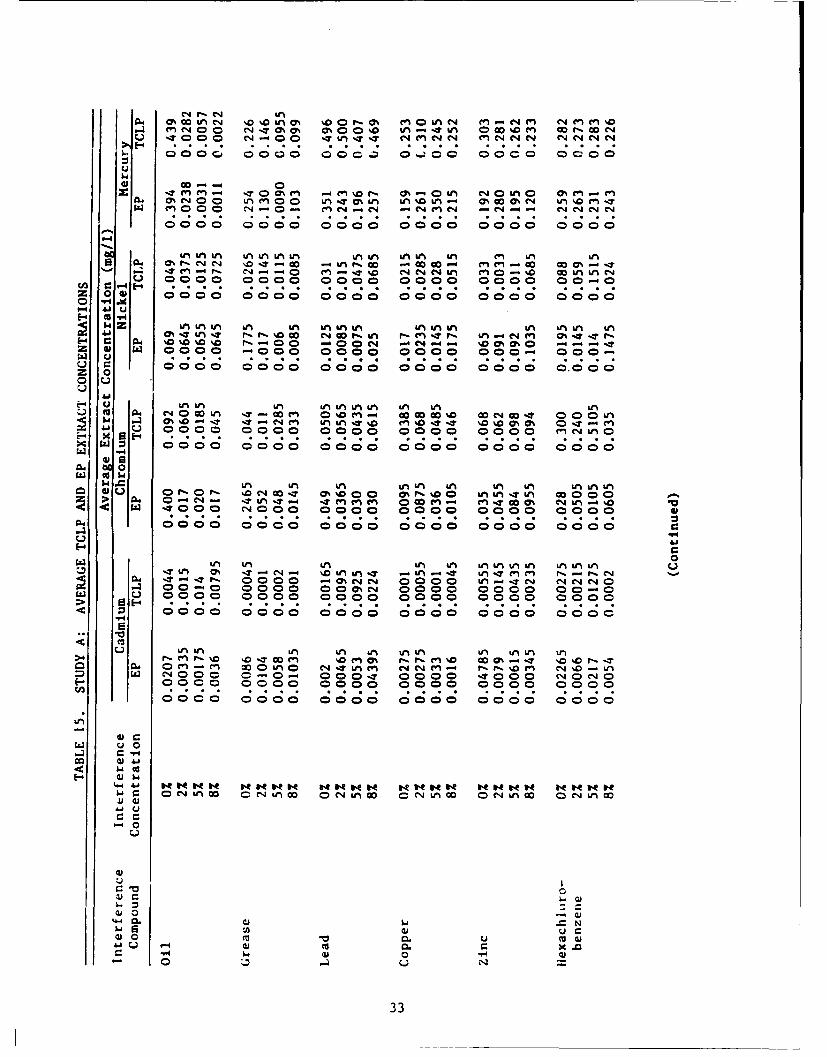
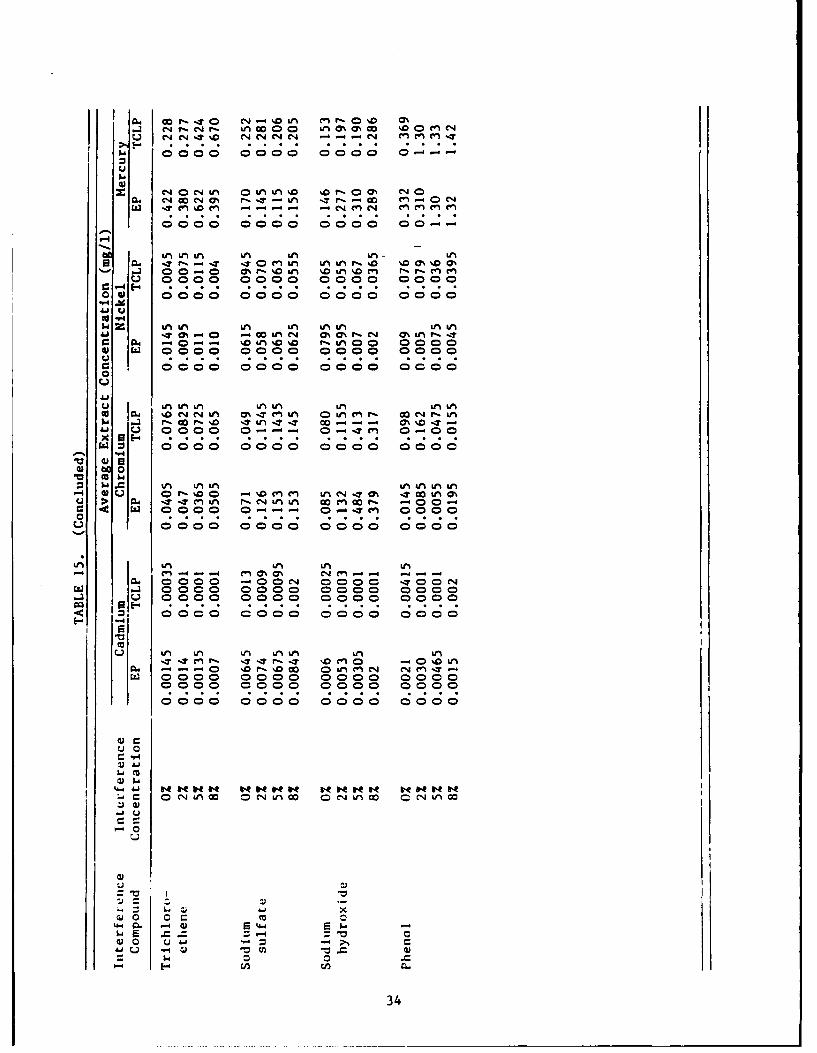
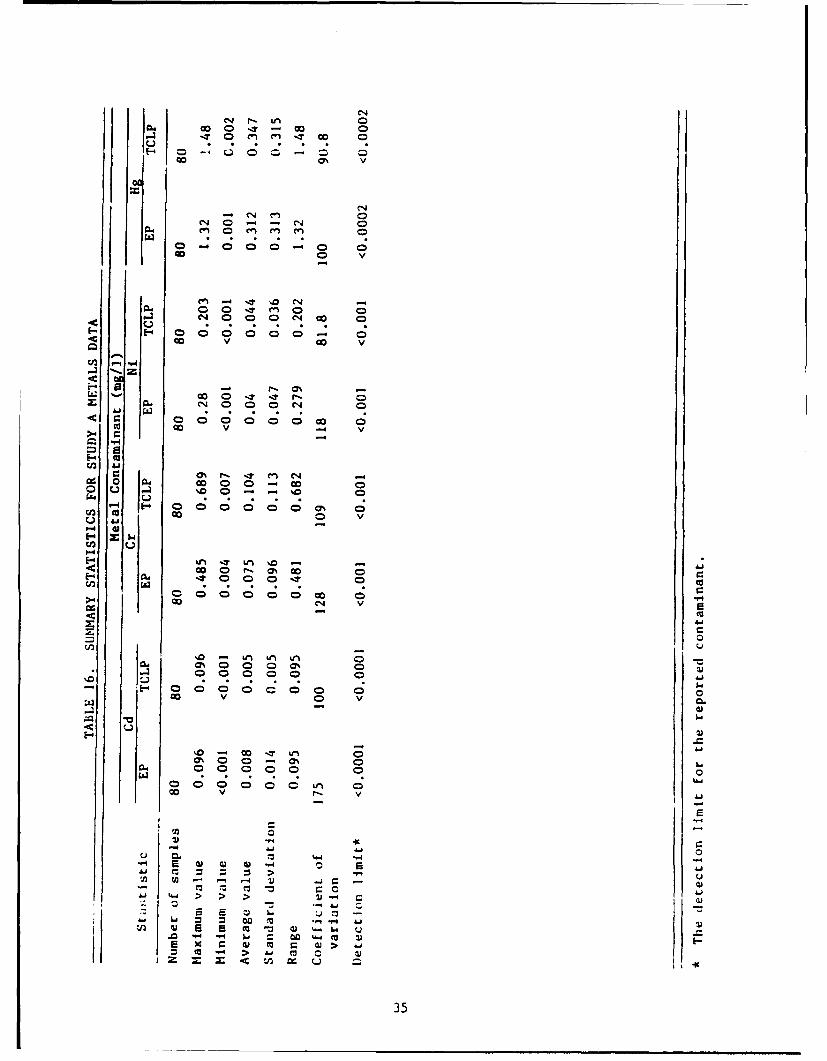
The results from the EP and TCLP extractions conducted during Study A arepresented in Tables 15 and 16 and Figures 7 through 10. Raw data for eachsample subjected to an EP or TCLP extraction are presented in Appendix E.
Table 15 presents the average (averaged over the duplicate samples)extract concentrations for the TCLP and EP test for each contaminant. Summarystatistics for this data set are presented in Table 16. The values presentedin Table 16 are averaged across the different interference compounds and con-centrations and thus cannot be utilized for a detailed interpretation of thedata. However, this information can be used to visualize general trends inthe data set. Table 16 indicates that a larger concentration of mercury isdetected .in the TCLP and EP leachates than the other metals. -Table 16 alsoindicates that the TCLP average extract values for chromium are 1.3 timeslarger than the average EP extract values.
To establish a basis for comparing the many batches of sludge that wereextracted as part of Study A, it was necessary to normalize the data. Theextract concentrations that were compared in this study were normalized totheir dry-raw waste concentration. Normalization corrects for dilution by theinterference materials, small changes in the binder ratio, and variations inthe moisture contents of the extracted materials. Normalized extract concen-trations were derived using the following equation:
EC, - (EC * V)/(W * M * B) ()
where ECn - normalized extract concentration, mg/kg
EC - contaminant concentrat:.on measured in the TCLP or EP extract. mg/l
V - volume of extraction fluid, liters
W - weight of the wet treated waste extracted, kg
M - solids concentration of the solidified/stabilized waste extracted,expressed as a decimal
B - weight fraction of raw waste in the solidified/stabilized/interfered waste mixture, calculated as follows:
weight of raw waste (2)(weight of raw waste + weight of binder + weight
of interference agent)
Rcsults of the analysis of the variance multifactor factorial test(AVMFT) performed on the Study A normalized extract concentrations arepresented in Table 17. -hen the results of the AVMFT indicated the levels ofinteractions between the tests and the other variables were significant, apaired-sample T test was also performed. If the test interactions are sig-nificant, the paired T test result must be utilized to evaluate the data. The
32
-T o0 "-00 NN T C4e n... . . . .
SOnO L~~ON C.) Co.%D r I.A%OIC.- 0 OC 0 Oenýcn-" "z C~ 00 W% enC 4CC' -c 4- WN- 0 l nQJ)0%CD 7 lQmI0 0 0 0 00o0 0 0 0 0 0 0 0 0 0 0 0 00C4 14C
'-4
z 00 0 00 00 0 000 000 000 0000C C ; ;C;C0 -4 W"~ 41 u
r . a 0 %0000%D f- -4000 000 000 0 C ýC 4- 0 0 0000 - ý%z0 0000 0000 0000 0000 0000 0.000
w Q0 0
E-s Ui iLn nL L A UIA ,I IA IA IA L
to Ow C 0000 00'T 00 0000 00e o oa 0 coC4a T0 000 r 0c4Iu 0000 0 D000 0000 0CD000 0000 0000 W
w~ -4
wi IA %n &A'A ALnLn k LM Ln %n UM AP,% "I. 0r.f' ý? ODo00 Q% r-%C0 II&ATUi O ~0 00S 04 0-4 - -T -t T d 11lc'*( 1rI 0~r~ co 1*? o % " Lm -1 %C- 0#0 0NO 0000 000 0 0 0 00 0000o
0.0000 CD0000 0 000 C 0000 0000 0 000 0
ý44
m00 0 n0 04 (C~ 000 IAm C4eno- - . e CN %0 L40"0 C 0000 0 0 0 : 0000 000r0 0 0- 14CD0C)0000 0000 0000 00 Da000 0 Q000 0 0 00
ca *) * *1
-4 ( $
0 w o nGoo-o-L) 0 - U-1- 0 00 -00 C4nco aC'j4eVI0c
L: 0
- ) 0-
w 0 10I
000
-33
C%4 crJ. CNr- L Go0 0 Ln 71 % o% 0 MC1~4U~ rJNtq ~C1~4 -4r e n 4
hi
V4 0 WNL OLM LM Q %.Q tl00 m cNO
ULM LA Ln LA LA- L'T IT. CV W LM l t'-.0 .0% %0 m
E, - C! C! . .C! 9 f9t9
OW 0000 0000 0000 0000
Szi LAIn LA LA LAL W LALWW
-4 000 000 % - M0 000 0000
0
u LA iLAL LAin LA u LAL%aC1 C14 O nL ON 1'7 enLn 0 Ln (' % ~CO r. L
8 C 0000 0 ~a 4 .0~Cn ) 0 00x 6 14 * * * * . . * . . . . .*
0 0000 0000 0000 0000
to 0
VIIi. LA LAL LA LMAnLAL0 r- 0 %a 0 -4% ne Ln C-4 . 1 I t L 0%
CJ0000 0 -4 - 0 4'T (n 0000
U0000 0000 0000 0 000oc
ALA LAn LA LAt
-. 0000 -00J 0000o -qo00"Ca - 0000000 0000 0000
U0000 0000 0000 0000
10u LA LA1 LA ULAlA LA LA
-. --- 0 %D f'-.O() ( 0Ln n'4 " n'T .-CD 0 000 CD000m0 0 0 00 00000000 0000O 0000 0000
000 00 0 0 00 0 0
.r41
U-4 im. j -4 4)r t. r
4) 0 0 A
34
co 0 wN
0 0
ad 0 0 0
c . C-I 0 0 ;
0 V 0 co
00
E0 ad ITz 0. -I 0 0 C %4 0
ad C
v- C6
0 C) -) %0 0 %0 0
C;. C;.) C
a 41
00 0 '-i0 0 0M >
z C
= 35

20
INTERFERENCECONCENTRATION
13 0%
10 - 3 5%
5
-j, 0.8L-
0.6-
0.4 -0
CIL 0.3
o7;
-l_ U * - I S
INTERFERENCE COMPOUND
Figure 7. Average normalized Study A cadmium e::tract
-oncentrations expressed as the _C.P
concentrat~ion divided by the EP
concent~ration.
36

so
40 INTERFERENCECONCENTRATION
30 - 0%
2%
s %10.I L
3.5
'U
0 3.0
1S2.5
-J
2.0
1.5
10
0.53. S
INTERFERENCE COMPOUND
Figure 8. Average normalized Study A chromium extract
concentrations expressed as the TCLPconcentration divided by the EPconcentration.
37

20
INTERFERENCE
15 CONCENTRATION
00%
S5%
10
In
>
W 4XI-U.0
InIwi-j
S3
2-
a
o l I In I6C
CC UU
INTERFERENCE COMPOUND
Figure 9. Average normalized Study A nickel concen-trations expressed as the TCLP concentrationdivided by the EP concentration.
38
""-4x Vz
0. .w
wJ-UA
(n 0
LU ~w
z > x
U.QC oE I.'SCom
--
:D
r' o 7
Mw
S~~nlVA~. d33Io ~iun
39~
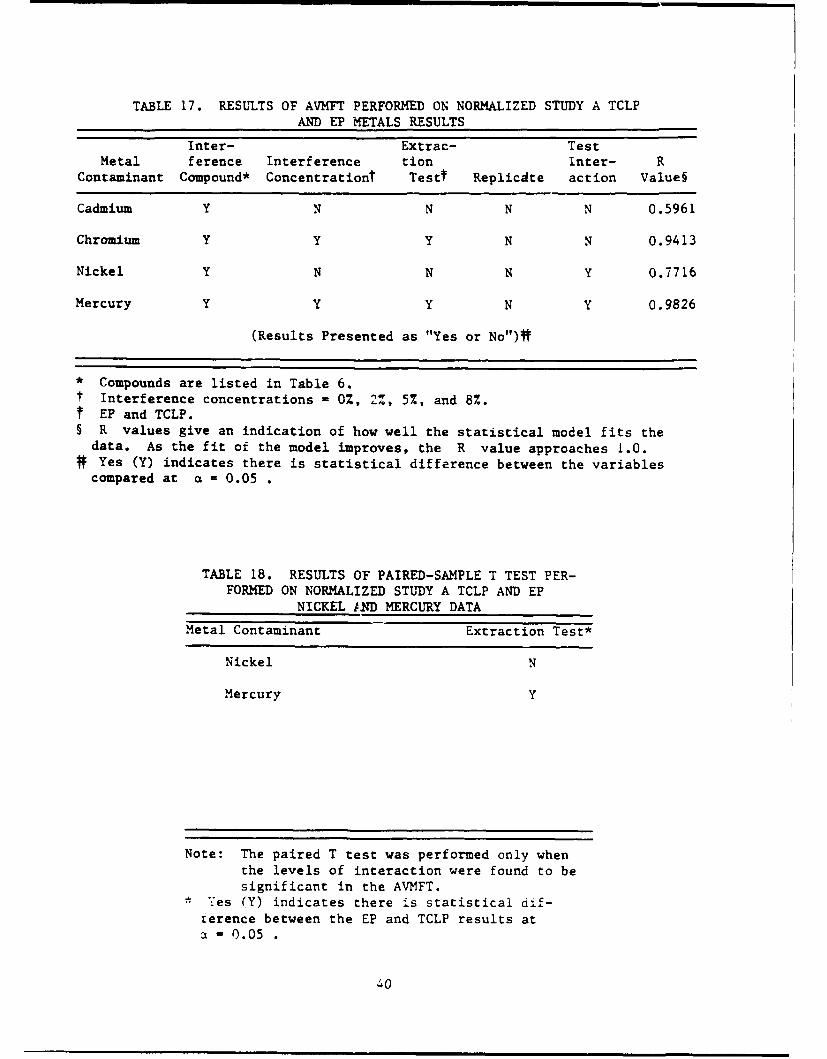
TABLE 17. RESULTS OF AVMFT PERFORMED ON NORMALIZED STUDY A TCLPAND EP METALS RESULTS
Inter- Extrac- TestMetal ference Interference tion Inter- R
Contaminant Compound* Concentrationt Testt ReplicAte action Value§
Cadmium Y N N N N 0.5961
Chromium Y Y Y N N 0.9413
Nickel Y N N N Y 0.7716
Mercury Y Y Y N Y 0.9826
(Results Presented as "Yes or No")R
* Compounds are listed in Table 6.SInterference concentrations = 0%, 2%, 5%, and 8%.SEP and TCLP.§ R values give an indication of how well the statistical model fits the
data. As the fit of the model improves, the R value approaches 1.0.SYes (Y) indicates there is statistical difference between the variables
compared at a = 0.05 .
TABLE 18. RESULTS OF PAIRED-SAMPLE T TEST PER-FORMED ON NORMALIZED STUDY A TCLP AND EP
NICKEL tND MERCURY DATA
Metal Contaminant Extraction Test*
Nickel N
Mercury Y
Note: The paired T test was performed only whenthe levels of interaction were found to besignificant in the AVMFT.
* Yes (Y) indicates there is statistical cif-rerence between the EP and TCLP results ata = 0.05
40

results of the paired T test are presented in Table 18. As indicated byTables 17 and 18, using a level of significance of a - 0.05 , the results ofthe TCLP and EP extractions for chromium and mercury are statistically dif-ferent, while the results for nickel and cadmium contaminants were notstatistically different.
Results of the TCLP and EP extractions for each metal contaminant inStudy A are presented in Appendix F, Figures F1 through F4. In these figures,the normalized EP extract concentrations are plotted versus the normalizedTCLP extract concentrations. A discussion accompanies these figures.
Figures 7 through 10 present the normalized TCLP and EP extractsexpressed as multiples of the average EP values for the duplicate samples.The values presented in these figures were calculated as shown by thefollowing equation:
(TCLPI + TCLP 2 )/2
(EP 1 + EP 2 )/2
where TCLP and TCLP2 = normalized TCLP replicate extract concentration forthe contaminant of interest, mg/g
EP1 and EP2 - normalized EP replicate extract concentration for thecontaminant of interest, mg/g
Thus, for these figures, a value of 1.0 indicates that the amount of a partic-ular contaminant measured in the TCLP extract is equal to the amount of thatcontaminant measured in the EP extracts. Values greater than 1.0 indicatethat the TCLP extract concentration is greater than the EP extract concentra-tion, and values less than 1.0 indicate that the EP concentration is greaterthan the TCLP.
Figure 9, showing the nickel data, indicates that for the majority of theconditions evaluated, the EP and TCLP produce similar results. Figures 8 and10 illustrate that the TCLP extraction is more aggressive for chromium andmercury. Figure 10 (the mercury data) indicates that of the 40 conditionsinvestigated in Study A, 28 resulted in TCLP extracts containing higher con-centrations of mercury. Figure 8 (the chromium data) indicates that 25 of the40 conditions resulted in TCLP extracts containing higher concentrations ofchromium.
It is interesting to note that inspection of Figure 7 provides informa-tion which is in direct conflict with the results of the statistical analysis.Figure 7 (the cadmium data) indicates that, for 33 of the 40 conditions eval-uated, the EP cxtracts contained higher concentrations of cadmium. Figure 7indicates that the results of the EP and TCLP differ, while the statisticalresults presented in Table 17 indicate no difference between the extract con-centrations. Based on this information, there is a possibility that a Type IIerror was made. (A Type II error occurs when the results of the EP and TCLPextraction are actually different but this is not revealed by the analysis ofche variance statistic.i
41
Although it is interesting that for some contaminants the EP and TCLPextraction results differ, it is beyond the scope of this study to pinpoint
the variables that are responsible for the dissimilarities. However, there isone observation that should be noted. Due to the fact that every TCLP extrac-tion for Study A utilized extraction fluid 2, and every EP extraction requiredthe full 400 ml of 0.5 acetic acid (Appendix A), the buffering capacity of theEP and TCLP extraction fluids was equal. This leads to the conjecture thatthe EP and TCLP extractions should be similar in their aggressiveness. Con-trary to the similarity between extraction fluids, the TCLP results variedfrom the EP results for mercury and-chromic-m. Consequently, the variationsbetween the EP and TCLP extracts cannot be attributed just to pH influencesbut-must be a function of other differences between the extraction procedures,such as time of extraction, method of agitation, etc.
STUDY B
Results for the Metal Contaminants
The results for the Study B metal EP and TCLP extraction tests are pre-sented in Tables 19 through 22 and Figure 11. Raw data for each sample sub-jected to the EP or TCLP extraction for metal compounds are presented inAppendix G, Tables GI through G3. Table 19 presents the average (averagedover the three replicates) metal extract concentrations for the TCLP and EPtests. Results presented in this table generally indicate that the TCLP-generated extracts contained higher concentrations of the metal contaminantsthan the EP extracts.
Summary statistics for this data set are presented in Table 20. As indi-cated in this table, 10 of the 15 average metal values were higher in the TCLPthan the EP extracts. This table also illustrates that the EP data generallyvaried over a larger range than the TCLP data.
Results of the AVMFT performed on the Study B metal data are presented inTable 21. As in Study A, when the results of the AVMFT indicate that thelevels of test interaction are significant, a paired T test was performed.Results of the paired T test are presented in Table 22. Statistical analysisfor the WES waste indicates that there is not a significant difference betweenthe EP and TCLP extraction for any of the metals except mercury. The statis-tical analysis for the WTC waste indicates that the EP and TCLP differ signi-ficantly for arsenic and lead and were not statistically different forchromium. The results of the PCE was~a extractions indicated that there werestatistical differences between concentrations of copper, zinc, and bariumcontaminants measured in the TCLP and EP extracts. Several values arereported in Table 21 as "DL." This indicates that the concentration of thesecontaminants were, in the TCLP and EP extracts, at or below the detectionlimits. These extracts have no basis for comparison; consequently, theresults for the PCE-arsenic, PCE-silver, and WIC-cadmium are omitted for theremainder of the discussion.
A graphical representation of the results of the TCLP and EP extractionsfor each metal contaminant in Study B is presented in Appendix H, Figures HIthrough H7. In these figures, the normalized EP extract concentrations areplotted versus the normalized TCLP extract concentrations. A discussion ofthe results accompanies these figures.
42

TABLE 19. STUDY B AVERAGE TCLP AND EP EXTRACT CONCENTRATIONS FORMETAL CONTAMINANTS (AVERAGED OVER THREE REPLICATE SAMPLES)
Extract ConcentrationMetal Organic Level (mg/i)
Contaminant Sludge Percentage EP TCLP
Antimony WES 0.1 NA* NA1.0 NA NA
WTC 0.1 NA NA1.0 NA NA
PCE 0.1 0.0273 0.03671.0 0.023 0.038
Arsenic WES 0.1 NA NA1.0 NA NA
WTC 0.1 0.021 0.0551.0 0.028 0.121
PCE 0.1 0.0041 <0.0051.0 0.005 0.007
Barium WES 0.1 NA NA1.0 NA NA
WTC 0.1 NA NA1.0 NA NA
PCE 0.1 0.382 0.4591.0 0.334 0.561
Cadmium WES 0.1 0.001 0.0101.0 0.030 0.007
WTC 0.1 0.0004 0.00021.0 <0.0001 0.0018
PCE 0.1 NA NA1.0 NA NA
Chromium WES 0.1 0.024 0.0701.0 0.130 0.056
WTC 0.1 0.041 0.0401.0 0.032 0.036
PCE 0.1 NA NA1.0 NA NA
Copper WES 0.1 NA NAi.0 NA NA
ArC 0.1 NA NA1.0 NA NA
PCE 0.1 10.747 13.0671.0 10.833 16.333
(Continued)
* Not analyzed.
43
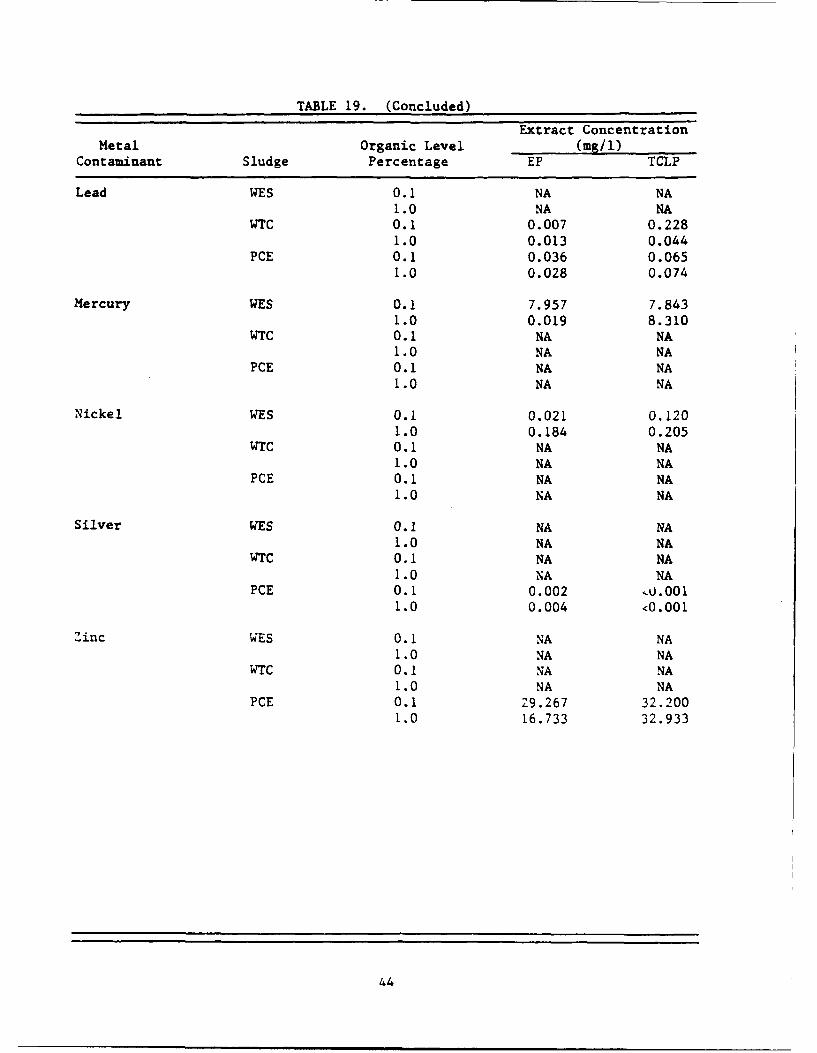
TABLE 19. (Concluded)
Extract ConcentrationMetal Organic Level (mg/i)
Contaminant Sludge Percentage EP TCLP
Lead WES 0.1 NA NA1.0 NA NA
WTC 0.1 0.007 0.2281.0 0.013 0.044
PCE 0.1 0.036 0.0651.0 0.028 0.074
Mercury WES 0.1 7.957 7.8431.0 0.019 8.310
WTC 0.1 NA NA1.0 NA NA
PCE 0.1 NA NA1.0 NA NA
Nickel WES 0.1 0.021 0.1201.0 0.184 0.205
WTC 0.1 NA NA1.0 NA NA
PCE 0.1 NA NA1.0 NA NA
Silver WES 0.1 NA NA1.0 NA NA
WTC 0.1 NA NA1.0 NA NA
PCE 0.1 0.002 .O.0011.0 0.004 <0.001
Zinc WES 0.1 NA NA1.0 NA NA
WTC 0.1 NA NA1.0 NA NA
PCE 0.1 29.267 32.2001.0 16.733 32.933
44
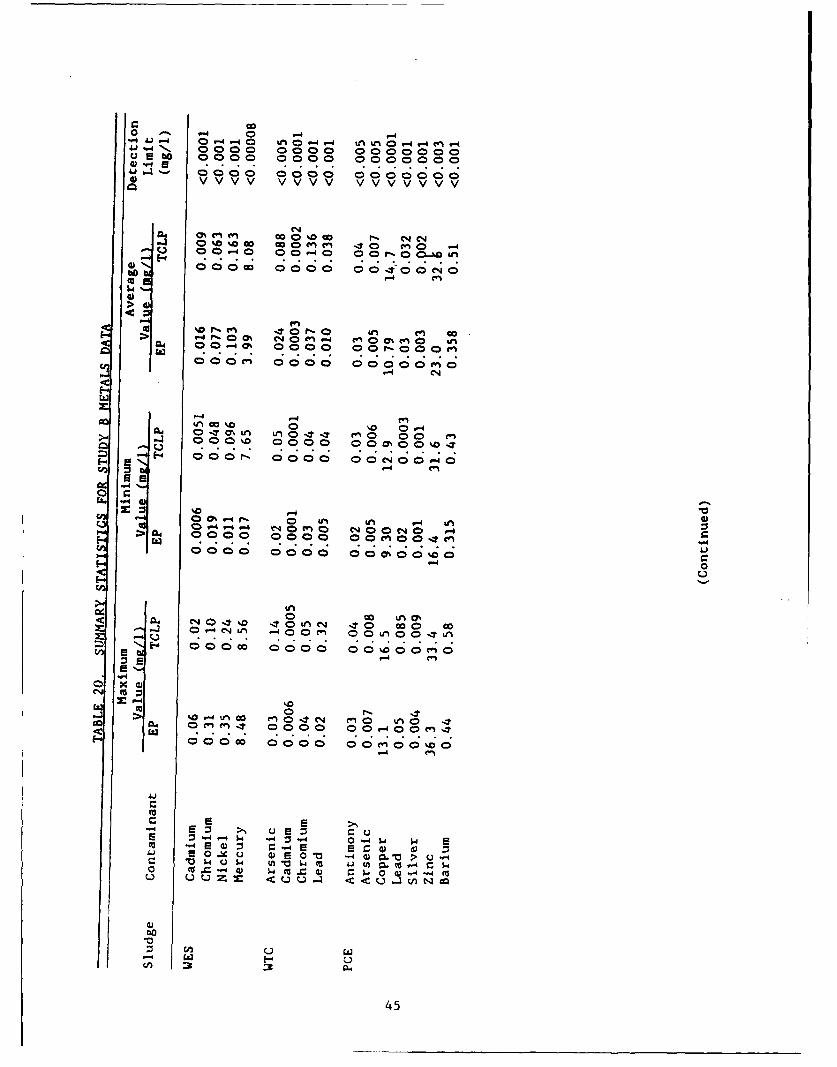
0 -4--P 4 04 40 U0 ý4-4 0.t 94v-~.4C"44Jf- 0000 0000 0000000u e b 0000 0000 00000004v . . . . . . . . . . . . . . .
en c ao0 % 00 rl C4 eq.-.J0~ O k 40 co0 m n0 -40 ooo0 0 00r40 o - o &A - 5.O .
C-4~0o Mo~ 4 r" ON) in
Coc o 00 000 0 0 00%0
-4 1- C0oc 0 0 C40.-4
Eu
1' % 4 r- n 440o 0
r-4 0
a00n '0 c o 0 1
-M
u~ E-
0 ~000 co
'O-,4t -4 W 4 0 ` AO $4 w
la0 0 00 Z0E r-(L) d
tC " IV c 5 ) Cw 0ý
C~ '-4 O~ C'-.545

a 0
'4.4 .#0- %00%. 0 0 CN0at r-. .~ * . . .. .. . . . .
41 ~ ~ C4 E- n en-+
VY4 V4
en enoGP. PZ , t%000 1. en0 T en cn
-4-6-4-
04 u -C..7 0 0 0 0C~ 0 GO 0 L~-I00.-40 00 e 00%o cc0co
Coc000 0000 00(n00-40
*0
cc 0%. 0%e0 0 00%n 0I 0 " Ln04 enC~ -40-40 "00 0-
000w~C 000 00C0 %
V-4
E-~ -W~ 0 -I0 Cn 0 C00 0 0..Q 0 0f-LnC3 . 0 C 000..- . . . 0. .0. .I .0
-40000 c 0000 00-0000
m 0
=" s r-I0. 401( -0E00-% 000 a 0- 4) 0 u
mi Ioo.4 0 000 00 0 44 "
C. - N g
04
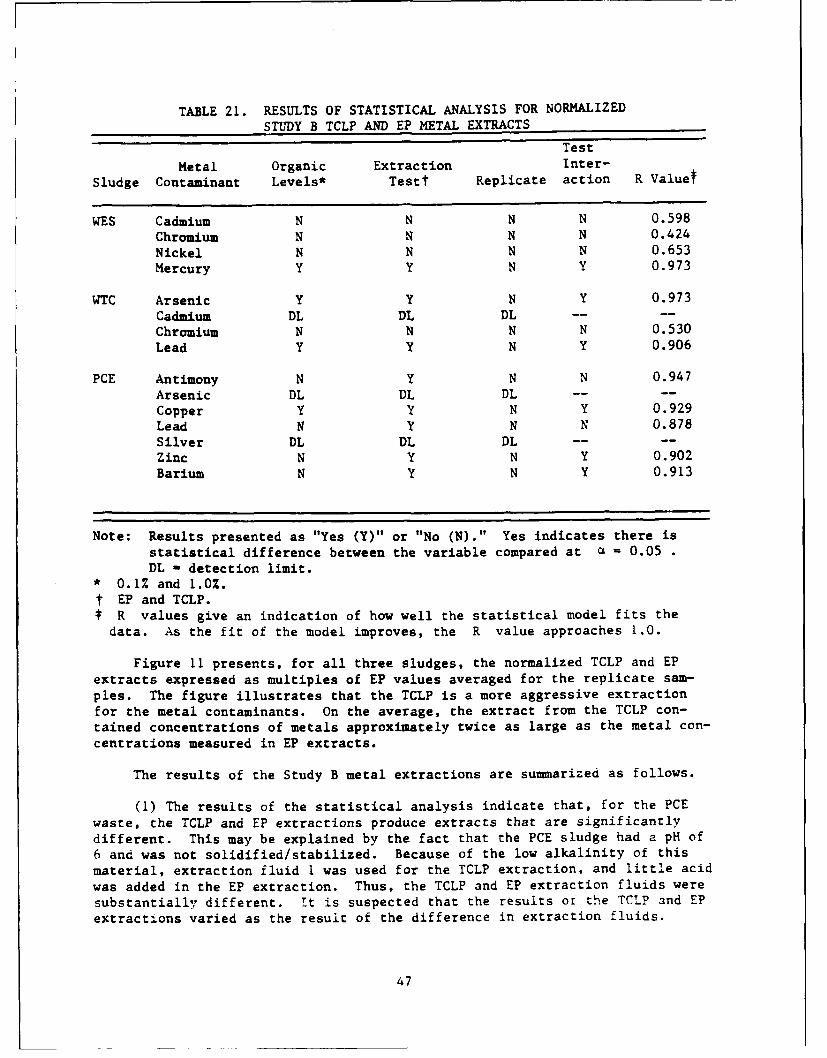
TABLE 21. RESULTS OF STATISTICAL ANALYSIS FOR NORMALIZEDSTUDY B TCLP AND EP METAL EXTRACTS
Test
Metal Organic Extraction Inter-Sludge Contaminant Levels* Testt Replicate action R Valuef
WES Cadmium N N N N 0.598Chromium N N N N 0.424Nickel N N N N 0.653Mercury Y Y N Y 0.973
WTC Arsenic Y Y N Y 0.973Cadmium DL DL DL ....Chromium N N N N 0.530Lead Y Y N Y 0.906
PCE Antimony N Y N N 0.947Arsenic DL DL DL ....
Copper Y Y N Y 0.929Lead N Y N N 0.878Silver DL DL DL ....Zinc N Y N Y 0.902Barium N Y N Y 0.913
Note: Results presented as "Yes (Y)" or "No (N)." Yes indicates there isstatistical difference between the variable compared at a - 0.05DL - detection limit.
* 0.1% and 1.O.
t EP and TCLP.SR values give an indication of how well the statistical model fits the
data. As the fit of the model improves, the R value approaches 1.0.
Figure 11 presents, for all three sludges, the normalized TCLP and EPextracts expressed as multiples of EP values averaged for the replicate sam-ples. The figure illustrates that the TCLP is a more aggressive extractionfor the metal contaminants. On the average, the extract from the TCLP con-tained concentrations of metals approximately twice as large as the metal con-centrations measured in EP extracts.
The results of the Study B metal extractions are summarized as follows.
(1) The results of the statistical analysis indicate that, for the PCEwaste, the TCLP and EP extractions produce extracts that are significantlydifferent. This may be explained by the fact that the PCE sludge had a pH of6 and was not solidified/stabilized. Because of the low alkalinity of thismaterial, extraction fluid I was used for the TCLP extraction, and little acidwas added in the EP extraction. Thus, the TCLP and EP extraction fluids weresubstantially different. Tt is suspected that the results or the TCLP and EPextractions varied as the result of the difference in extraction fluids.
47

TABLE 22. RESULTS OF PAIRED-SAMPLE T TEST FOR NORMALIZED
STUDY B TCLP AND EP METAL EXTRACTS
Metal Extraction
Sludge Contaminant Test*
WES CadmiumChromiumNickelMercury N
WTC Arsenic YCadmiumChromiumLead Y
PCE AntimonyArsenicCopper YLeadSilverZinc YBarium Y
Note: The paired T test was performed only when the levels of interactionwere found to be significant in the AVMFT.
* Yes (Y) indicates there is statistical difference between the EP and TCLPresults at a - 0.05 .
(2) For a majority of the cases studied, the WES and WTC wastes producedTCLP and EP extracts that were not statistically different. Arsenic and leadwere the only contaminants for which the TCLP and EP statistically differed.One possible explanation for the EP and TCLP generating extracts with similarcontaminant concentrations is that the WTC and WES wastes were solidified/stabilized, resulting in high alkalinity. Consequently, the TCLP extractionfor the WES and WTC wastes required the use of extraction fluid 2. The EPextraction, performed on the WES and WTC wastes, also required the addition ofthe full 400 ml of acetic acid because of the low alkalinity. When 400 ml of0.5 N acetic acid is added to 1,600 ml of water, the alkaline neutralizationcapacity of the EP extraction fluid and the TCLP's extraction fluid 2 areequal. Equal alkaline neutralization capacity offers one explanation for theWTC and WES sludges producing similar TCLP and EP extracts.
Results for the Organic Contaminants
The results of the organic analyses for the Study B extraction proceduresare presented in Tables 23 through 25 and Figures 12 through 13. The raw datafor each sample subjected to an EP or TCLP extraction for the crganic com-nounds are also presented in Appendix I, Tables 7! through 112. Table 23presents the average (averaged over the three replicates) extract concentra-tions for the TCLP and EP tests. The results presented in this table indicate
48

So0
400 ORGANICCONCENTRATION
o 0.1%51.0%
300 -
200 -
• 100
'CU.
U,,
LL 4
3
2
E 'E E~
SE aUU
wES PCE -WTC
INTERFERENCE COMPOUND
Figure 11. Average normalized Study B metal extract concentrations
expressed as the TCLP concentration divided by the EPconcentration.
49

TABLE 23. STUDY B AVERAGE TCLP AND EP EXTRACT CONCENTRATIONSFOR THE ORGANIC CONTAMINANTS
(AVERAGED OVER THREE REPLICATE EXTRACT SAMPLES)
Extract Concentration
Organic Organic (mg/i)
Contaminant Sludge Level EP TCLP
Chloroform WES 0.1% 0.88 1.401.0% 13.97 27.27
PCE 0.1% 1.01 1.561.0% 23.77 32.70
WTC 0.M% 0.22 .201.0% 8.98 9.13
1,2-Dichloroethane WES 0.1% 1.57 1.271.0% 38.70 61.37
PCE 0.1% 3.61 4.231.0% 57.30 71.40
WTC 0.1% 0.76 0.49
1.0% 45.03 44.23
1,1,1-Trichloroethane WES 0.1% 0.96 1.93
1.0% 18.33 46.80
PCE 0.1% 0.55 4.801.0% 15.07 25.07
WTC 0.1% 0.29 0.45
1.0% 15.07 24.83
Carbon Tetrachloride WES 0.1% 0.42 0.891.0% 3.93 7.60
PCE 0.1% 0.23 0.501.0% 10.00 10.00
WTC 0.1% 0.10 0.20
1.0% 5.00 5.00
Trichloroethene WES 0.1% 3.47 6.901.0% 64.63 134.33
PCE 0.1% 1.48 3.541.0% 33.73 39.97
WTC 0.1% 2.32 2.551.0% 98.07 135.67
(Continued)
(Sheet cf 2)
50

TABLE 23. (Continued)
Extract ConcentrationOrganic Organic (mg/l)
Contaminant Sludge Level EP TCLP
Benzene WES 0.1% 1.60 2.301.0% 42.97 85.33
PCE 0.1% 2.62 5.291.0% 54.17 76.57
WTC 0.1% 0.91 0.791.0% 55.23 62.40
1,1,2,2-Tetrachloroethane WES 0.1% 0.25 0.22
1.0% 1.00 5.00PCE 0.1% 7.31 9.04
1.0% 92.70 79.63WTC O.1Z 0.10 0.20
1.0% 5.00 5.00
Tetrachloroethene WES 0.1% 3.10 7.001.0% 25.97 38.670.1% 3.03 3.191.0% 28.30 13.37
WTC 0.1% 1.00 1.601.0% 18.87 39.87
Toluene WES 0.1% 3.03 4.431.0% 55.43 93.67
PCE 0.1% 1.37 2.501.0% 36.67 35.77
WTC 0.1% 1.24 1.391.0% 65.67 89.57
Ethylbenzene WES 0.1% 5.27 17.331.0% 33.83 47.33
PCE 0.1% 2.03 2.331.0% 34.53 20.93
WTC 0.1% 2.93 3.941.0% 36.10 95.60
'Continued)
(Sheet 2 of 3)
51
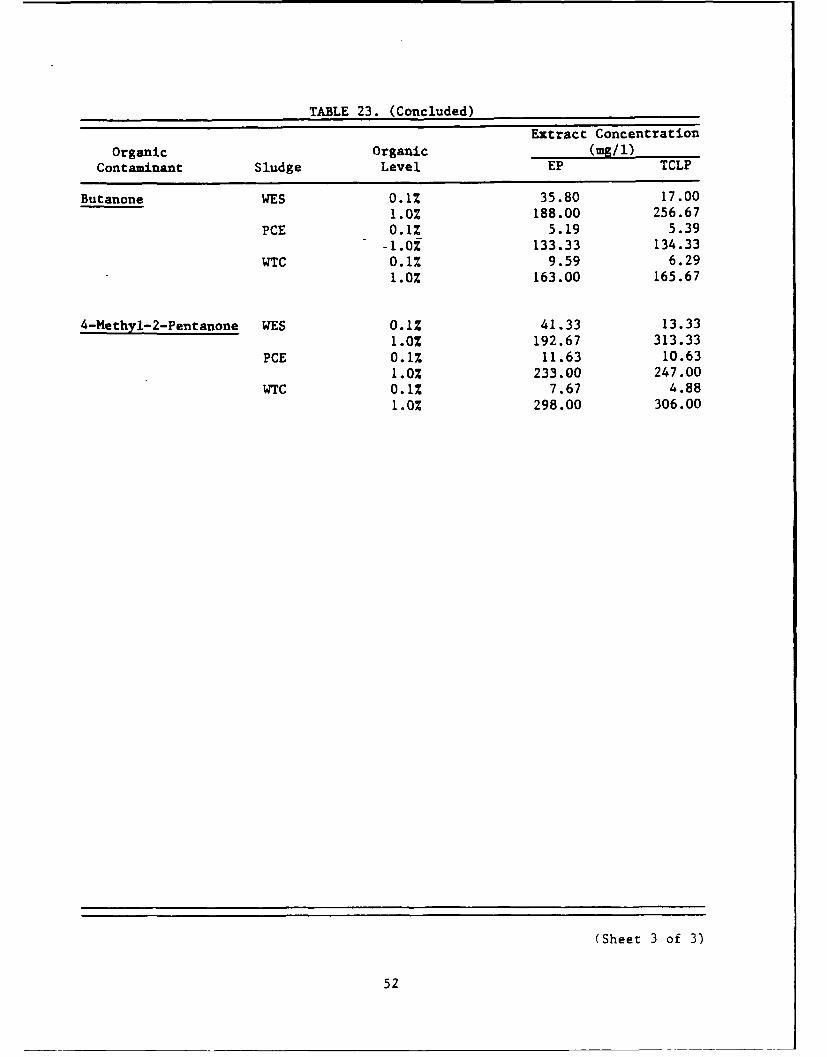
TABLE 23. (Concluded)
Extract ConcentrationOrganic Organic (mg/i)
Contaminant Sludge Level EP TCLP
Butanone WES 0.1% 35.80 17.001.0% 188.00 256.67
PCE 0.1% 5.19 5.391.0% 133.33 134.33
WTC 0.1% 9.59 6.291.0% 163.00 165.67
4 -Methyl-2-Pentanone WES 0.1% 41.33 13.33
1.0% 192.67 313.33PCE 0.1% 11.63 10.63
1.0% 233.00 247.00WTC 0.1% 7.67 4.88
1.0% 298.00 306.00
(Sheet 3 of 3)
52
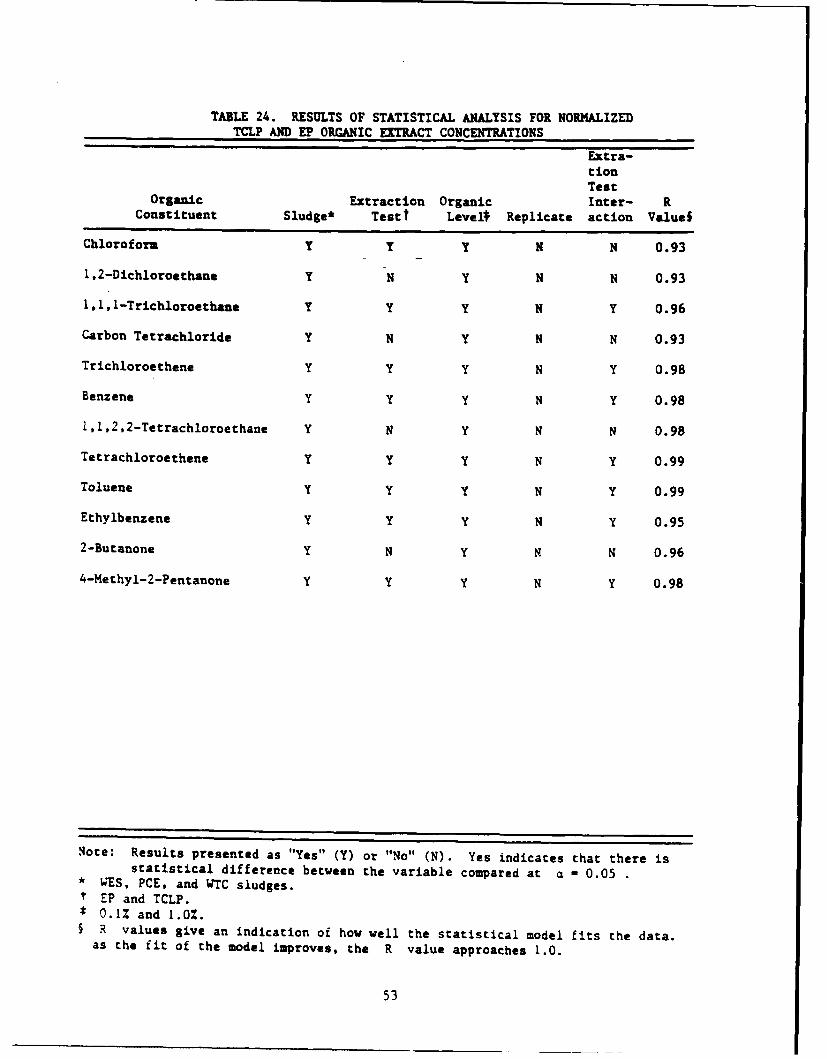
TABLE 24. RESULTS OF STATISTICAL ANALYSIS FOR NORMALIZEDTCLP AND EP ORGANIC EXTRACT CONCENTRATIONS
Extra-tionTest
Organic Extraction Organic Inter- RConstituent Sludge* Testt LevelA Replicate action Valuel
Chloroform Y Y Y N N 0.93
1,2-Dichloroethane Y N Y N N 0.93
ll,l-Trichloroethane Y Y Y N Y 0.96
Carbon Tetrachloride Y N Y N N 0.93
Trichloroethene Y Y Y N Y 0.98
Benzene Y Y Y N Y 0.98
l,l, 2 ,2-Tecrachloroethane Y N Y N N 0.98
Tetrachloroethene Y Y Y N Y 0.99
Toluene Y Y Y N Y 0.99
Ethylbenzene Y Y Y N Y 0.952-Butanone Y N Y N N 0.964 -Methyl-2-Pentanone Y Y Y N Y 0.98
Note: Results presented as "Yes" (Y) or "No" (N). Yes indicates that there isstatistical difference between the variable compared at e - 0.05
* WES, PCE, and WTC sludges.SEP and TCLP.S0.1% and 1.0%.§ R values give an indication of how well the statistical model fits the data.
as the fit of the model improves, the R value approaches 1.0.
53

TABLE 25. RESULTS OF PAIRED-SAMPLE T TEST FORNORMALIZED STUDY B TCLP AND EP ORGANIC
EXTRACT CONCENTRATIONS
Organic ExtractionConstituent Test*
Chloroform1,2-Dicnloroethane1,1,1-Trichloroethane YCarbon Tetrachloride --
Trichloroethene YBenzene Y1,1,2,2-Tetrachloroethane --
Tetrachloroethene NToluene YEthylbenzene Y2-Butanone4-Methyl-2-Pentanone N
Note: The paired T test was performed only whenthe levels of interaction were found to besignificant in the AVMFT.
* Yes (Y) indicates there is statistical dif-ference between the EP and TCLP results ata - 0.05 .
that, generally, the TCLP test generated extracts that contained higher con-centrations of organic contaminants than the EP extracts. Higher concentra-tions of organics in the TCLP extracts were expected because the TCLPextraction was performed under zero-headspace conditions. However, the dif-ference was not as great as expected.
Results of the AVMFT performed on the Study B organic data are presentedin Table 24. As in Study A, when the results of the AVMFT indicated that thelevels of test interaction are significant, a paired T test was performed.The results of the paired T test are presented in Table 25. The TCLP and EPextracts are statistically different for over half of the organic constituentsevaluated. Statistical analysis for only six of the organic constituents(1,2-dichloroethane, carbon tetrachloride, 1,1,2,2-tetrachloroethane, tetra-chloroethene, 2-butanone, and 4-methyl-2-pentanone) indicated no statisticaldifference between leach test extracts. Contaminant levels of two (1,1,2,2-tetrachloroethene and carbon tetrachloride) of the six organic constituentswere near the detection limit. Consequently, 1.2-dichloroethane, tetrachloro-ethene, 2-butanone, and 4-methyl-2-pentanone were the only organics extractedfrom the waste equally by the EP and TCLP.
A graphical representation of the results of the TCLP and EP extractionsfor the organic compounds in Study B is presented in Appendix J, Figures Jlthrough J12. In these figures, the normaiizeo EP extract concentratLons areplotted versus the nornalized TCLP extract concentrations. A discussion ofthe results accompanies these figures.
54
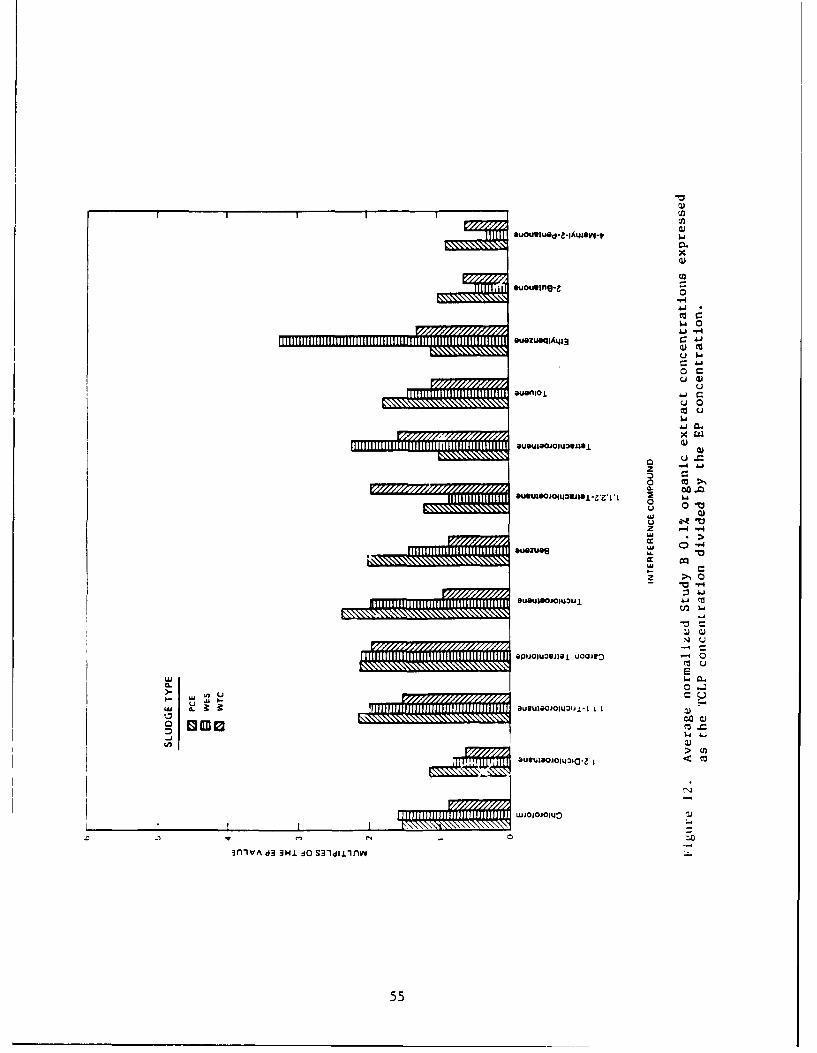
J L auo iJ nuO d- Z-IA tUjoV-*
0.
ououving-z Z
o -6A -4
I ot u ozuoqlA ~l3C
L)OC
ouacd~ 4)
0ccz
o w~>
Z.) r_
0 ,-o~
*UOZUO ~ Ua.
ouglsooltoviei- ~ z k -LOUO4JOOJOI~I~j0
E, 0
U3 0)L)
opuou~wjaj uQ~e -4~
ausluse Ucr c
0.ugif~ll..
~ w~U
OU wo ovla -0jo
0- wi CL t allUluaOJIAOIuJI-.LLL
3fliVA d3 3HI :jo S31dui1flb
55

ououginq-z 0.4
x 4)
u0
vlo-
ouo~B~ogL43J1Q 0 4
.U CU.0 -n 0
umu
suezues N 0)
cc .4
r_ U)
M 4)aueuaoa~oriajeu 0oje cJ
LUUEs ID E3
auv4l9jolA~j-z 41
UJJOIO 41 .O
S~eajiouVe d3je 3H. :1 3div
56
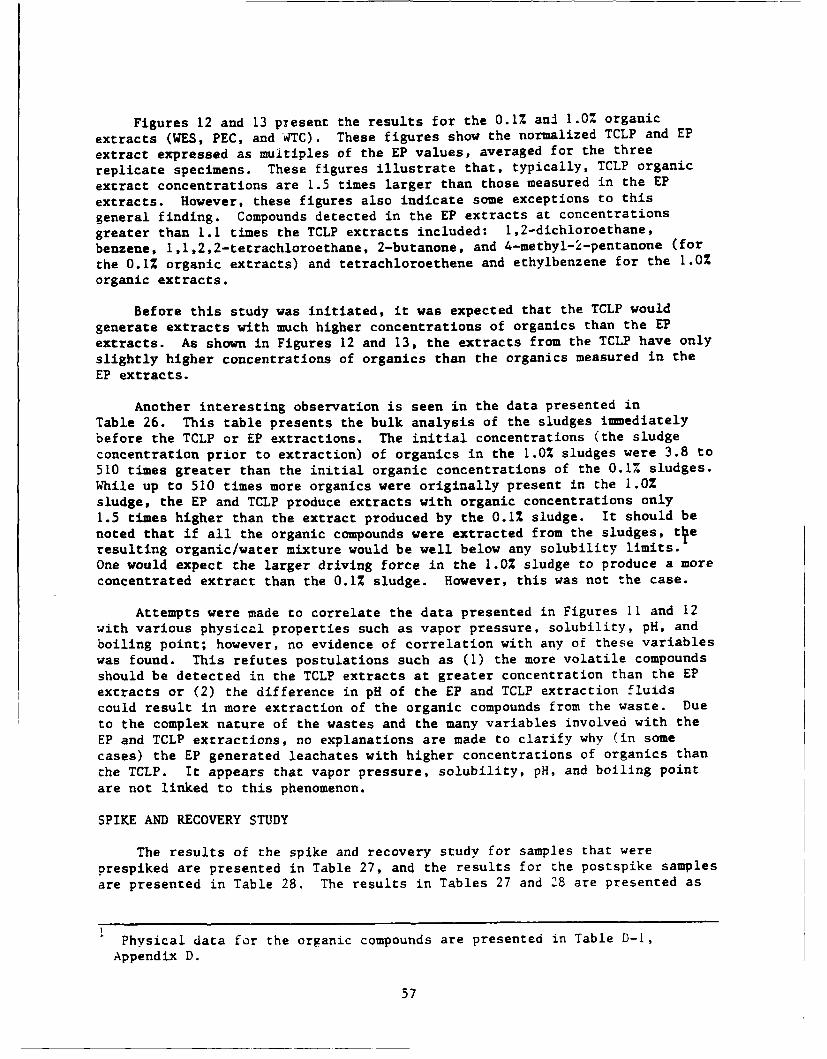
Figures 12 and 13 present the results for the 0.1% and 1.0% organic
extracts (WES, PEC, and WTC). These figures show the normalized TCLP and EP
extract expressed as multiples of the EP values, averaged for the three
replicate specimens. These figures illustrate that, typically, TCLP organic
extract concentrations are 1.5 times larger than those measured in the EP
extracts. However, these figures also indicate some exceptions to this
general finding. Compounds detected in the EP extracts at concentrations
greater than 1.1 times the TCLP extracts included: 1,2-dichloroethane,benzene, 1,1,2,2-tetrachloroethane, 2-butanone, and 4-methyl-2-pentanone (for
the 0.1% organic extracts) and tetrachloroethene and ethylbenzene for the 1.0%
organic extracts.
Before this study was initiated, it was expected that the TCLP wouldgenerate extracts with much higher concentrations of organics than the EPextracts. As shown in Figures 12 and 13, the extracts from the TCLP have onlyslightly higher concentrations of organics than the organics measured in theEP extracts.
Another interesting observation is seen in the data presented inTable 26. This table presents the bulk analysis of the sludges immediatelybefore the TCLP or EP extractions. The initial concentrations (the sludgeconcentration prior to extraction) of organics in the 1.0% sludges were 3.8 to510 times greater than the initial organic concentrations of the 0.1% sludges.While up to 510 times more organics were originally present in the 1.0%sludge, the EP and TCLP produce extracts with organic concentrations only1.5 times higher than the extract produced by the 0.1% sludge. It should benoted that if all the organic compounds were extracted from the sludges, t~eresulting organic/water mixture would be well below any solubility limits.One would expect the larger driving force in the 1.0% sludge to produce a moreconcentrated extract than the 0.1% sludge. However, this was not the case.
Attempts were made to correlate the data presented in Figures 11 and 12with various physical properties such as vapor pressure, solubility, pH, andboiling point; however, no evidence of correlation with any of these variableswas found. This refutes postulations such as (1) the more volatile compoundsshould be detected in the TCLP extracts at greater concentration than the EPextracts or (2) the difference in pH of the EP and TCLP extraction fluidscould result in more extraction of the organic compounds from the waste. Dueto the complex nature of the wastes and the many variables involved with theEP and TCLP extractions, no explanations are made to clarify why (in somecases) the EP generated leachates with higher concentrations of organics thanthe TCLP. It appears that vapor pressure, solubility, pH, and boiling pointare not linked to this phenomenon.
SPIKE AND RECOVERY STUDY
The results of the spike and recovery study for samples that wereprespiked are presented in Table 27, and the results for the postspike samplesare presented in Table 28. The results in Tables 27 and Z8 are presented as
Physical data for the organic compounds are presented in Table D-1,
Appendix D.
57

TABLE 26. STUDY B ORGANIC SLUDGE BULK ANALYSES(PRESENTED ON WET AND DRY BASIS)
0.1% 1.0%Wet Dry Wet Dry
(mg/kg) (mg/kg) (mg/kg) (mg/kg)
WES Sludge
Chloroform 70.3 35.9 6,443.6 3,212.81,2-Dichloroethane 264.4 134.9 11,248.8 5,608.6l,1,1-Trichloroethane 62.0 31.6 18,581.4 9,264.7Carbon Tetrachloride 62.6 31.9 7,572.4 3,775.6Trichloroethene 221.7 113.1 42,257.7 21,069.7Benzene 131.2 66.9 22,077.9 11,008.11,1, 2 ,2-Tetrachloroethane 24.4 12.4 249.8 124.5Tetrachloroethene 255.5 130.3 41,158.8 20,521.8Toluene 232.6 118.7 33,066.9 16,487.2Ethylbenzene 427.5 218.0 47,952.0 23,908.92 -Butanone 3,707.9 1,891.4 47,052.9 23,460.64-Methyl-2-Pentanone 2,892.8 1,475.6 70,030.0 34,916.9
PCE Sludge
Chloroform 217.7 169.6 6,337.3 4,512.81,2-Dichloroethane 445.4 347.0 9,769.6 6,956.9l,l,1-Trichloroethane 328.6 256.0 8,516.0 6,064.3Carbon Tetrachloride 194.8 151.7 4,536.6 3,230.5Trichloroethene 870.9 678.5 17,808.1 12,681.1Benzene 830.9 647.4 18,106.5 12,893.61,I,2,2-Tetrachloroethane 4,104.8 3,198.1 22,185.5 15,798.3Tetrachloroethene 3,625.4 2,824.6 16,216.3 11,547.6Toluene 729.1 568.0 18,902.4 13,460.4Ethylbenzene 5,832.6 4,544.2 24,175.2 17,215.12-Butanone 485.4 378.2 25,667.5 18,277.84 -Methyl-2-Pentanone 1,018.7 793.7 25,866.4 18,419.5
WTC Sludge
Chloroform 2.9 2.4 576.4 458.41,Z-Dichloroethane 13.1 10.8 1,931.4 1,535.81,1,1-Trichloroethane 4.2 3.4 2,180.3 1,733.7Carbon Tetrachloride 1.2 1.0 333.5 265.2Trichloroethene 44.6 36.7 9,537.4 7,584.1Benzene 11.2 9.2 3,793.0 3,016.2l,1,2,2-Tetrachloroethane 1.2 1.0 125.4 99.7Tetrachloroethene 51.2 42.0 7,566.2 6,016.6Toluene 28.9 23.7 6,590.5 5,240.8Ethylbenzene 114.9 94.3 10,552.8 8,391.62-Butanone 192.5 158.0 3,195.7 2,541.2A-Methyl-2-Pentanone 150.2 123.3 10,652.4 8,470.8
58

TABLE 27. AVERAGE PERCENT OF VOLATILES LOST FROM PRESPIKE SAMPLES
Organic Spike CompoundLeach Level Chlorobenzene Carbon Disulfide
Sludge Test (percent) (percent) (percent)
WTC TCLP 0.1 * NDtWTC EP 0.1 * 99.24WTC TCLP 1 * NDWTC EP 1 * NDPCE TCLP 1 ND NDPCE EP 1 ND NND
* Sample not spiked with analyte.t Compound was below the detection limit; thus, not detected in the extract.
TABLE 28. AVERAGE PERCENT OF VOLATILES LOST FROM POSTSPIKE SAMPLES
Organic Spike CompoundLeach Level Chlorobenzene Carbon Disulfide
Sludge Test (percent) (percent) (percent)
WTC TCLP 0.1 23.53 *WTC EP 0.1 5.50 *WTC TCLP 1 4.58 *WTC EP 1 25.77 *PCE TCLP 0.1 8.62 23.60PCE EP 0.1 16.59 9.11
• Sample not spiked with analyte.
59
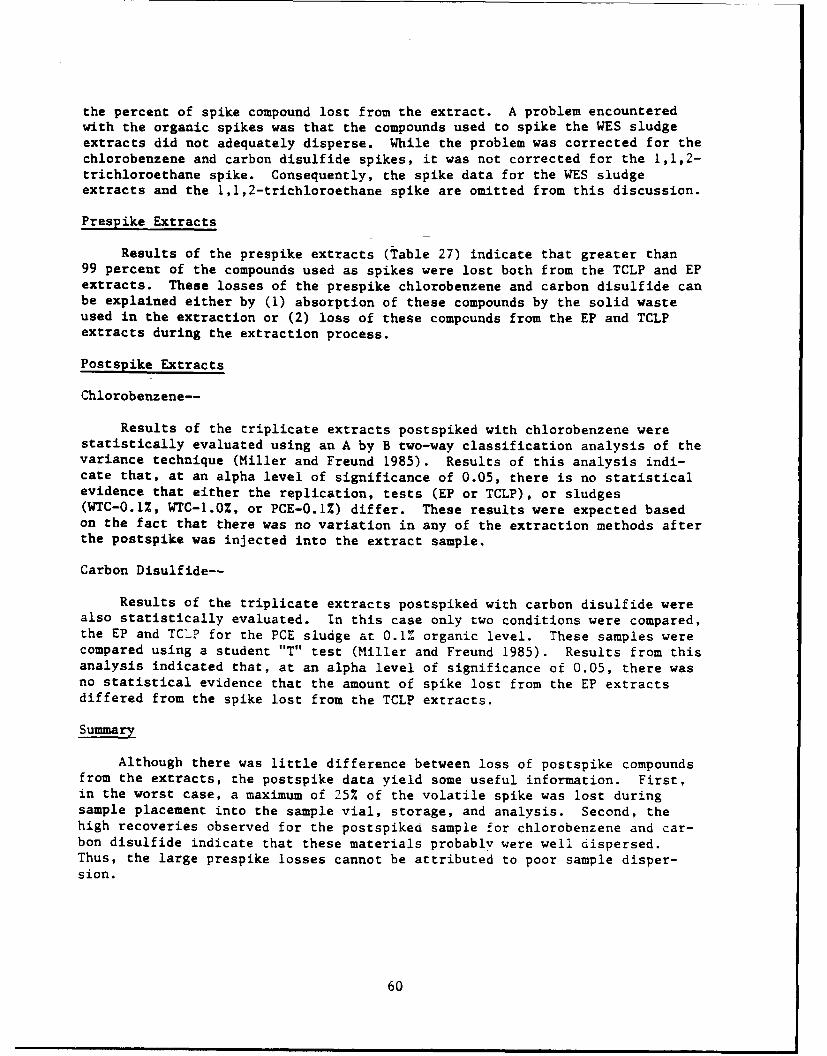
the percent of spike compound lost from the extract. A problem encounteredwith the organic spikes was that the compounds used to spike the WES sludgeextracts did not adequately disperse. While the problem was corrected for thechlorobenzene and carbon disulfide spikes, it was not corrected for the 1,1,2-trichloroethane spike. Consequently, the spike data for the WES sludgeextracts and the 1,1,2-trichloroethane spike are omitted from this discussion.
Prespike Extracts
Results of the prespike extracts (Table 27) indicate that greater than99 percent of the compounds used as spikes were lost both from the TCLP and EPextracts. These losses of the prespike chlorobenzene and carbon disulfide canbe explained either by (1) absorption of these compounds by the solid wasteused in the extraction or (2) loss of these compounds from the EP and TCLPextracts during the extraction process.
Postspike Extracts
Chlorobenzene--
Results of the triplicate extracts postspiked with chlorobenzene werestatistically evaluated using an A by B two-way classification analysis of thevariance technique (Miller and Freund 1985). Results of this analysis indi-cate that, at an alpha level of significance of 0.05, there is no statisticalevidence that either the replication, tests (EP or TCLP), or sludges(WTC-0.1%, WTC-1.0%, or PCE-0.1%) differ. These results were expected basedon the fact that there was no variation in any of the extraction methods afterthe postspike was injected into the extract sample.
Carbon Disulfide--
Results of the triplicate extracts postspiked with carbon disulfide werealso statistically evaluated. In this case only two conditions were compared,the EP and TCLP for the PCE sludge at 0.1% organic level. These samples werecompared using a student "T" test (Miller and Freund 1985). Results from thisanalysis indicated that, at an alpha level of significance of 0.05, there wasno statistical evidence that the amount of spike lost from the EP extractsdiffered from the spike lost from the TCLP extracts.
Summary
Although there was little difference between loss of postspike compoundsfrom the extracts, the postspike data yield some useful information. First,in the worst case, a maximum of 25% of the volatile spike was lost duringsample placement into the sample vial, storage, and analysis. Second, thehigh recoveries observed for the postspiked sample for chlorobenzene and car-bon disulfide indicate that these materials probably were well dispersed.Thus, the large prespike losses cannot be attributed to poor sample disper-sion.
60

QUALITY ASSURANCE/QUALITY CONTROL
The results of the method blanks for the Study A metal analyses arepresented in Table 29; for the Study B metal analyses in Table 30; and for theStudy B volatile organic analyses in Table 31. The method blanks for bothStudy A and B metal analyses indicate that some of the contaminants aredetected in the method blanks; however, for the majority of the samples thatwere analyzed, the method blanks are relatively uncontaminated (excludingnickel). Although nickel concentrations 10 times the detection limit aredetected in the method blanks, no method blank corrections for nickel, or anymetal compounds, are made. This decision is based on the fact that the con-centrations of most of the metal compounds are well above the detectionlimits.
The results of the method blanks for the Study B volatile organics dataindicate that, for many contaminants, the concentration of organics detectedin the blank extracts is well above the detection limit. This indicates thatsome residual contamination of the extraction media is occurring. It is sus-pected that this contamination may be the result of residual left in the ZEEapparatus, although many precautions were taken to prevent such contamination.
Results of the internal QA/QC are presented in Tables 32 through 35. Asindicated in these tables, the internal QA/QC was excellent.
Results of the external QA/QC are presented in Tables 36 and 37. Theresults of the external sample do not reflect the level of quality indicatedby the internal QA/QC. However, except for some of the mercury data, theexternal QA/QC data represent a relatively high degree of quality throughoutthis study.
PROCEDURAL DIFFICULTIES ENCOUNTERED WITH THE TCLP
The TCLP extraction is more difficult to perform than the EP extraction.Factors that contribute to the difficulty include:
(1) The TCLP requires two extractions, one for volatiles and another fornonvolatiles. The EP only requires one extraction.
(2) The TCLP uses two extraction fluids and requires a prescreening testto determine which extraction fluid to use. The EP requires one extractionfluid.
(3) The TCLP ZHE vessel is difficult to clean, as illustrated by thehigh degree of contamination in the ZHE blanks (Table 31). It is suspectedthat the valve on the ZHE may trap small amounts of liquid which may contami-nate subsequent extractions.
(4) The TCLP method does not provide clear directions on the use ofvolatile organic vials for extract collection. Since the sample must beexposed to the atmosphere during sample collection, incorrect sample handlingmay result in large volatile organic losses.
61
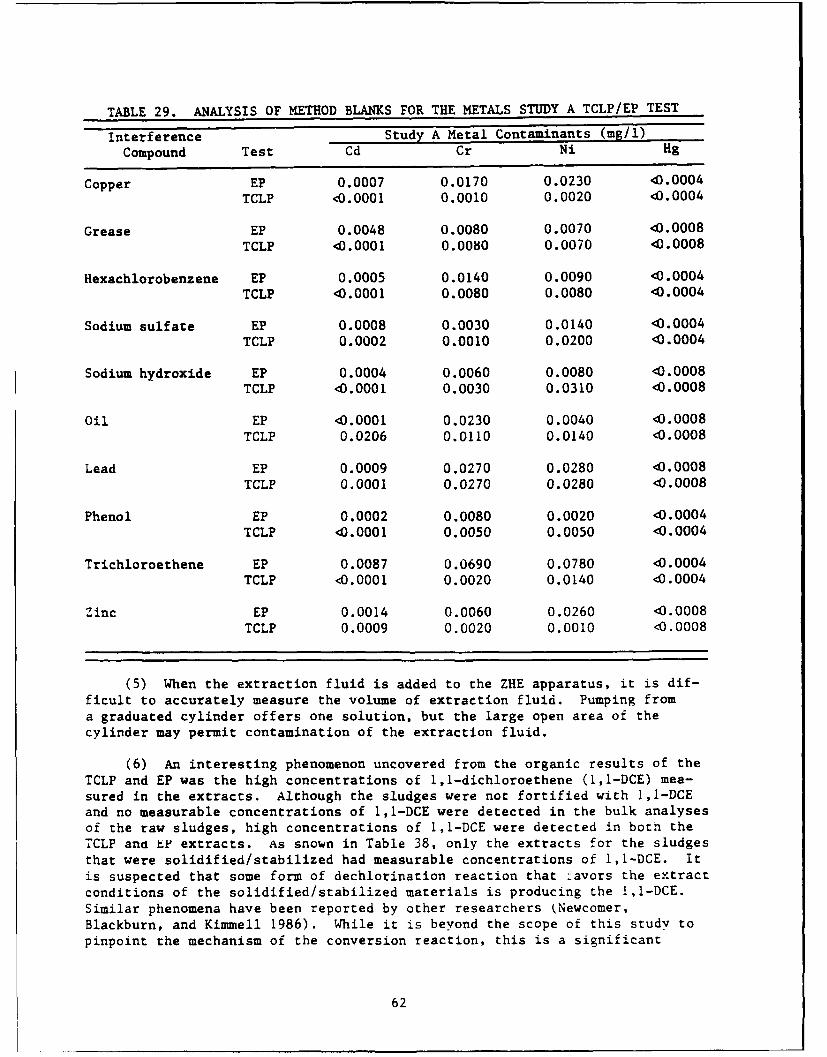
TABLE 29. ANALYSIS OF METHOD BLANKS FOR THE METALS STUDY A TCLP/EP TEST
Interference Study A Metal Contaminants (mg/l)
Compound Test Cd Cr Ni Hg
Copper EP 0.0007 0.0170 0.0230 <0.0004
TCLP <0.0001 0.0010 0.0020 <0.0004
Grease EP 0.0048 0.0080 0.0070 <0.0008
TCLP <0.0001 0.0080 0.0070 <0.0008
Hexachlorobenzene EP 0.0005 0.0140 0.0090 <0.0004
TCLP 43.0001 0.0080 0.0080 <0.0004
Sodium sulfate EP 0.0008 0.0030 0.0140 <0.0004TCLP 0.0002 0.0010 0.0200 <0.0004
Sodium hydroxide EP 0.0004 0.0060 0.0080 <0.0008TCLP <0.0001 0.0030 0.0310 <0.0008
Oil EP <0.0001 0.0230 0.0040 <0.0008TCLP 0.0206 0.0110 0.0140 <0.0008
Lead EP 0.0009 0.0270 0.0280 <0.0008TCLP 0.0001 0.0270 0.0280 <0.0008
Phenol EP 0.0002 0.0080 0.0020 <0.0004TCLP <0.0001 0.0050 0.0050 <0.0004
Trichloroethene EP 0.0087 0.0690 0.0780 <0.0004TCLP <0.0001 0.0020 0.0140 <0.0004
Zinc EP 0.0014 0.0060 0.0260 <0.0008TCLP 0.0009 0.0020 0.0010 <0.0008
(5) When the extraction fluid is added to the ZHE apparatus, it is dif-ficult to accurately measure the volume of extraction fluid. Pumping froma graduated cylinder offers one solution, but the large open area of thecylinder may permit contamination of the extraction fluid.
(6) An interesting phenomenon uncovered from the organic results of theTCLP and EP was the high concentrations of 1,1-dichloroethene (1,1-DCE) mea-sured in the extracts. Although the sludges were not fortified with 1,1-DCEand no measurable concentrations of I,1-DCE were detected in the bulk analysesof the raw sludges, high concentrations of 1,1-DCE were detected in both theTCLP and tP extracts. As snown in Table 38, only the extracts for the sludgesthat were solidified/stabilized had measurable concentrations of I,I-DCE. Itis suspected that some form of dechlorination reaction that favors the extractconditions of the solidified/stabilized materials is producing the I,1-DCE.Similar phenomena have been reported by other researchers (Newcomer,Blackburn, and Kimmell 1986). While it is beyond the scope of this study topinpoint the mechanism of the conversion reaction, this is a significant
62
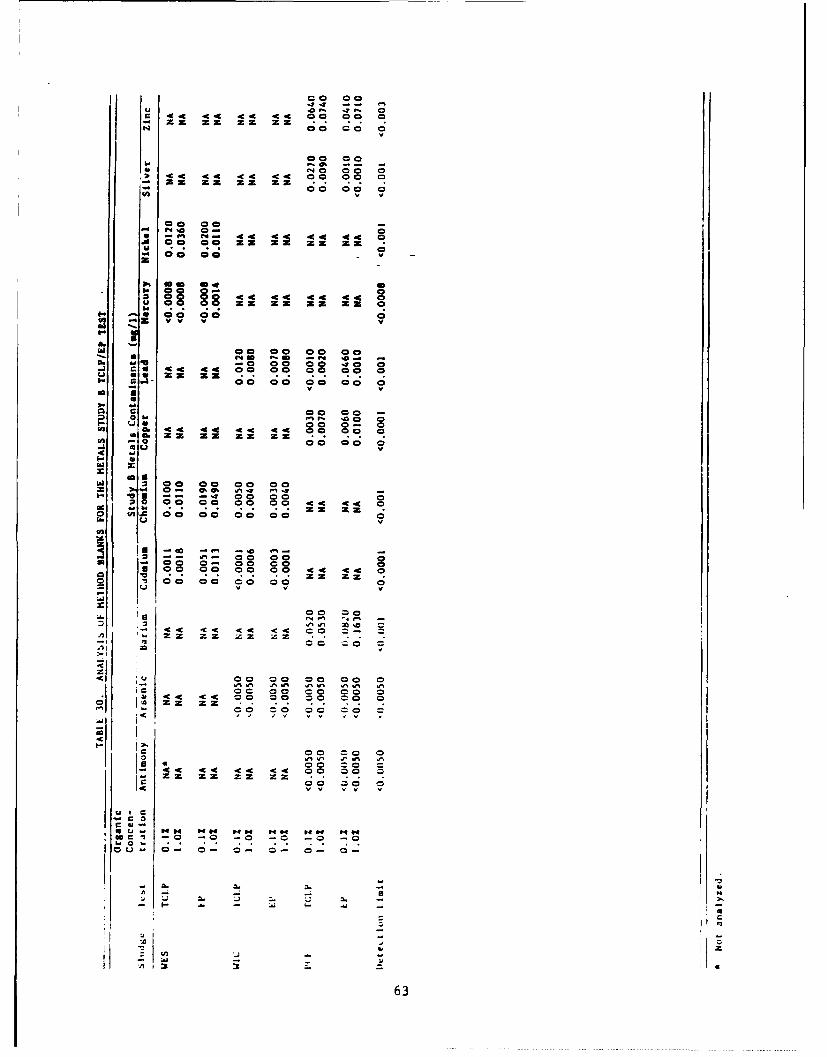
-C 44 44 -C44 44 00 00 0- z zx z z z z 9 .. 9
N4 00 0 0 a
co cc 0 0
00 0.04 44 4. 0 0
u ~ a za zz m m00 00c0c
00 00 x mc0$- cc 00
ma 00 00 00 ZZ00Z6 a c. . 0-1 00 00- 1
am
Q .C cc 0
& 1 -C -C 44 4C 44 0 Cwa. z m m z 9
I- 00 00 0
w 0 0 00 0c 00 00- Sn 140 r.m -ý -
a. 49 - 00 -C -C *0. 0~ U 4 400 00 00 4ý 00 0z m c
000 os 00 00 00 0 8.9 9 go 00V C Cý
0 00 00 C-ýC;7 ,Z C
i Is co 00 0
004 4 44 4 00 00 c 0^n -eýýn ýW
15 00 00 0
cc -
c 0
00 - -Is 0 0~~~~ -79.. . . . z 2
0 WZ 0 00 0 003

00 c 00 00 a% 00 00
5" 00 0-c c0 0c 00I 00 00 00 00 00 00 0c
e4
4 ~ c 00 00 O. D00
0 00 00 00 cc0 00 00 0
0 a000 00 00 CO 0 00cc cc c 0 01.
in04 W 0 LNfin 0 0 on4
d6.0 W . .; 00 00 c0 0e4 00 00 0
ci C ciC; c 4c cc c c a aw
IA 0%i 'A0 W% W% .0 0% A- Do .
so 80 00 00 00 0
cc cc c c
a.. or.W% 4 0 00 0m 0-o en0 00 0 Ai
-~ 0-
O~~~~~w 0-8 88 8 88%
(30-0 C-4
0o c 0 0 00 00 00 0
e404c
-i ~ c U 00 0c0cW 0 .~ 0
v v vv v ~a
~~ h.
U~~~~. 00 0 0 0 0 0
-C
~ 464

TABLE 32. STUDY A METALS PERCENT ACCURACY OF THE ANALYTICAL LABORATORY'SINTERNAL STAN.DARDS
Interference NBS* Traceable Internal StandardCompound Cadium Chromium Nickel Mercury
(Percent Accuracy)Oil 98.5 94.3 98.3 94.6
Grease 89.6 97.1 96.6 98.0
Lead 98.5 94.3 99.2 94.6
Copper 94.0 91.4 90.4 98.7
Zinc 95.5 95.7 93.3 97.4
Sodium hydroxide 97.0 98.6 97.1 97.4
Sodium sulfate 73.1 89.3 94.6 98.7
Phenol 83.6 95.7 92.5 98.0
Hexachlorobenzene 85.1 94.3 95.4 100.0
Trichloroethene 91.0 98.6 93.3 94.6
* National Bureau of Standards.
65

TABLE 33. STUDY B METALS PERCENT ACCURACY OF ANALYTICAL LABORATORY'SINTERNAL STANDARDS
Type of StandardWaste Contaminant Standards Accuracy
WTC Arsenic A 98.0
B 96.6
Cadmium A 93.4
Lead B 97.1
Chromium A 80.0
B 95.6C 97.0D 97.0
WES Cadmium A 92.2
B 92.2
Chromium A 89.4
Nickel A 98.6B 97.5C 97.5
Mercury A 96.8
PCE Arsenic A 94.3
B 100.0
Antimony A 81.1
Copper A 95.0B 99.0C 99.0
Lead A 86.2B 86.2
Silver A 85.7B 85.7
Barium A 90.7B 92.2C 90.7
Zinc A 97.7B 97.7
66

TABLE 34. STUDY B ORGANIC INTERNAL SURROGATE SPIKES
Organic Surrogate SpikeSludge Test Level Replicate Toluene D8 1-2-DCA D4* BFBT
(Percent Recovery)WES TCLP 0.1% RI 94.9 90.8 96.0
R2 108.0 103.0 114.0R3 98.5 82.4 112.0BL* 97.3 80.7 105.0
1.0% -RL 97.6 118.0 104.0R2 100.0 83.0 90.0R3 100.0 108.0 101.0
EP 0.1% R1 99.2 102.0 99.8R2 100.0 98.5 112.0R3 107.0 96.0 96.6BL 105.0 98.1 113.0
1.0% R1 108.0 99.9 89.0R2 109.0 94.4 93.6R3 100.0 102.0 108.0
WTC TCLP 0.1% RI 97.0 90.0 92.7R2 100.0 119.0 100.0R3 97.0 99.0 102.0BL 96.4 93.1 90.9
1.0% Ri 101.0 100.0 98.7R2 105.0 93.4 102.0R3 97.1 100.0 103.0
EP 0.1% R1 102.0 90.1 98.0R2 102.0 90.8 99.3R3 99.2 94.4 100.0BL 109.0 93.0 100.0
1.0% R1 96.2 93.0 98.8R2 99.7 92.7 95.8R3 98.6 98.4 100.0
PCE EP 0.1% RI 101.0 89.3 103.0R2 95.8 97.6 94.4R3 98.4 102.0 96.3
PCE EP 1.0% R1 101.0 95.0 100.0R2 99.7 92.8 98.5R3 99.2 93.8 99.9
TCLP 0.1% RI 99.4 100.0 97.3R2 101.0 102.0 87.1R3 99.3 91.7 101.0
TCLP 1.0% RI 99.7 98.8 96.5R2 97.2 99.2 92.6R3 96.7 96.2 <93.3
* 1-2-Dichloroethane D4.t Bromofluorobenzene.
SBlank.
67
u M OD0 0CN
C; 4zP ZZZO 04
r - Cr.-
cc
C..7
u 0 zz z 0' V
4C -4
0 'J "
9z
GD 0l coco 0
Gb- -' C" rn r n C"r
CL. M.IL 1. C
I-s
0. 0
0 91 *
- 0. - -60 -
0 Gb
4.68
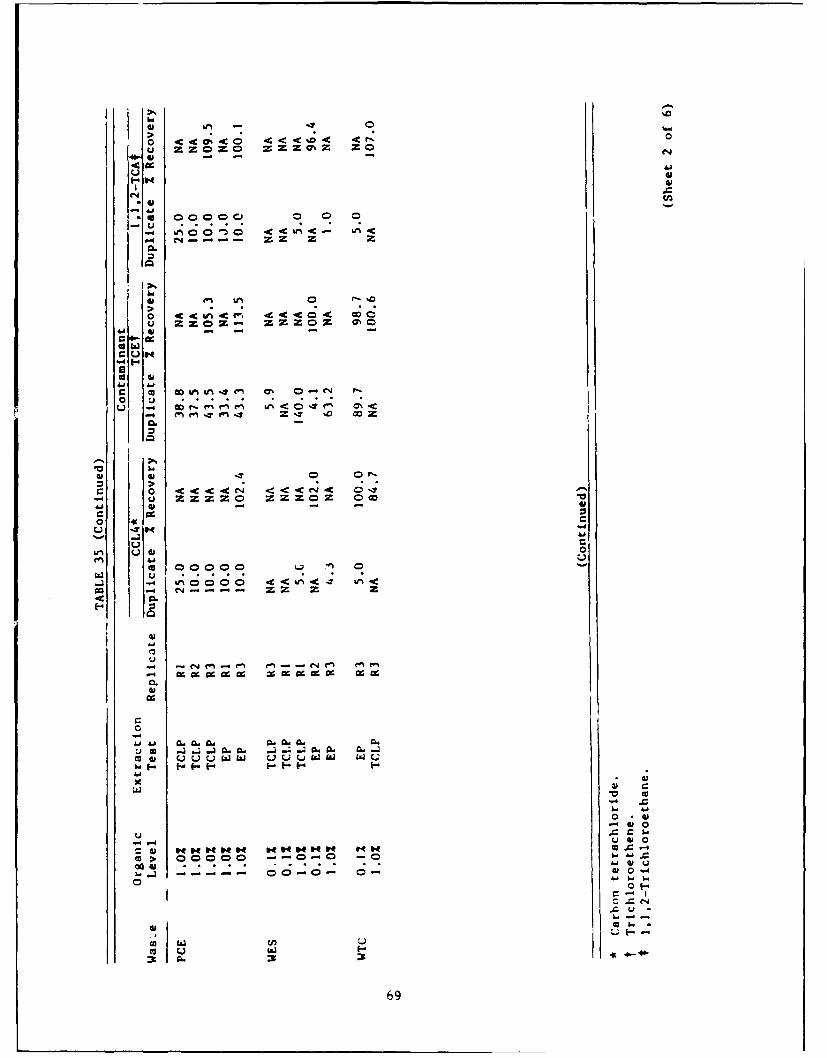
U, - w0
0ý C;% 0 r
I a1,
-g
LM 0 00 C l 0 4c
.4 C4 - - - Z -Z
0.
el (WI t, %Ic0
41 41- --
4j5
o L
-3 -; j .o w -.3 06A C
V cc
0~~ 00 00
-~~~6 4) U, 0 0 .UU~
w
LIi
- 69
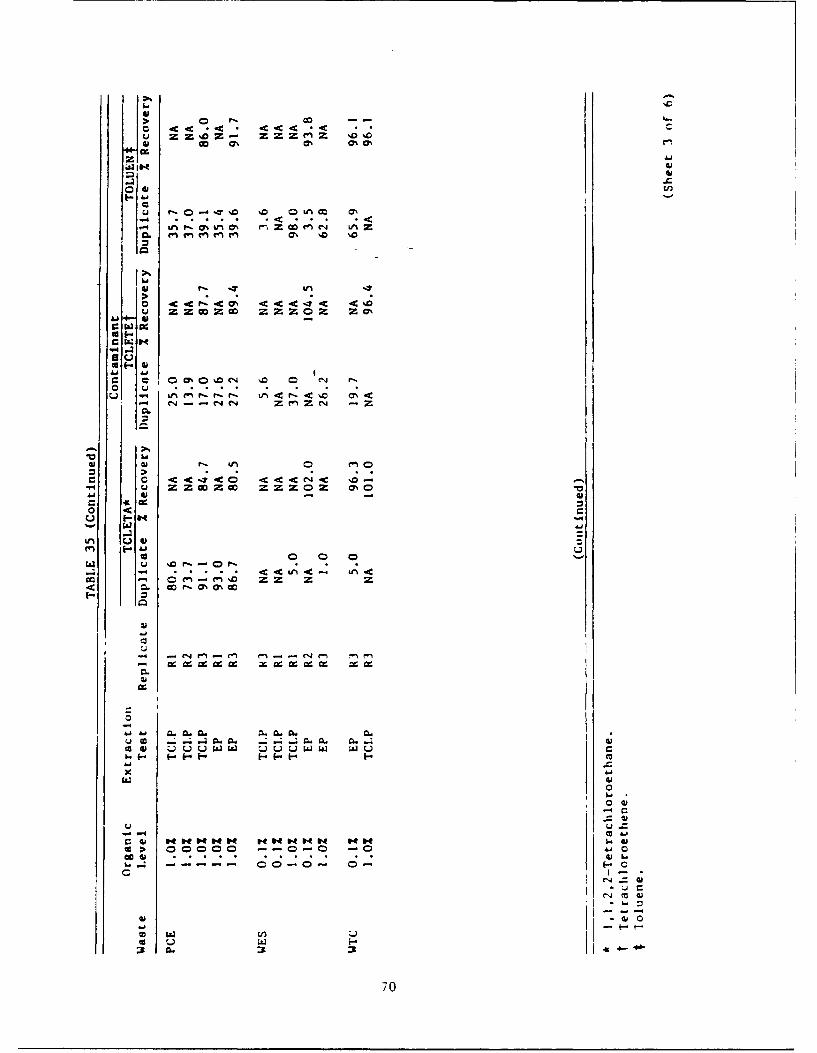
0c10 F< --
40 co m ON m 7
z 'iaJ IH 0
:31
4)
V-4 *ý 0< L4...zwmCN L
o C -C. r- .4c % -C 4r%
'a II -
on m
-j z CK--r cc zIZ -z 00"
C Z
oo Ch C C
IA; CA.1
00
ad :
07

0 a
Za Z - 00% cr%0C64
to f-
cc 00 0 00
w01
Ga 7- 0 N z
-4 z
u u (.3
1- o u
00
C 4 CNM Mkn c
9L. CL C~-: "a~ 00 41uuuLIW LUu W wuw
Ga
-4
U7
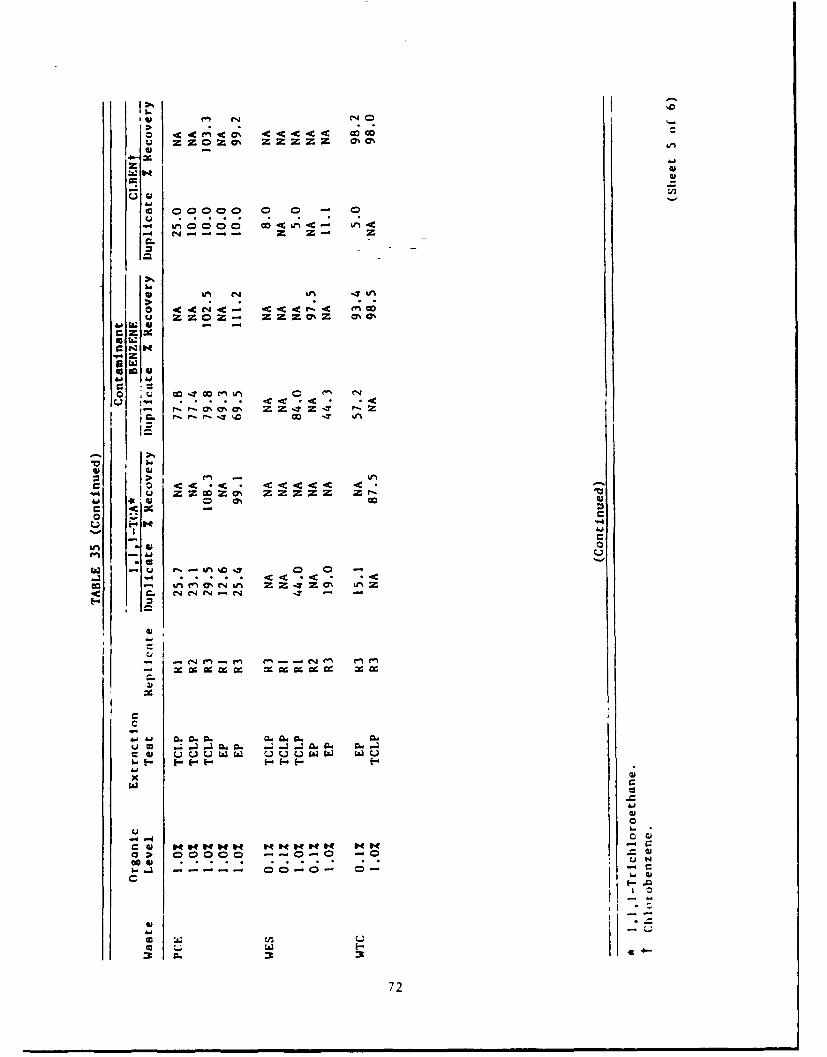
(40
4~0 a ZZMZ r. knO
id-
Z 0Z00 0 0 -l 7 0%r. z
o o GoN LM
-. zz zr
O. 0
4'1~
.4~C fn enZO ZZ ZZ Z
o o uu0 uu w
0
-uPC W4 W4 W4 "
0.:) c4o(Nc -0- -0c
14u,
cc U;cm L;~ -, rL ..L ji
4.72
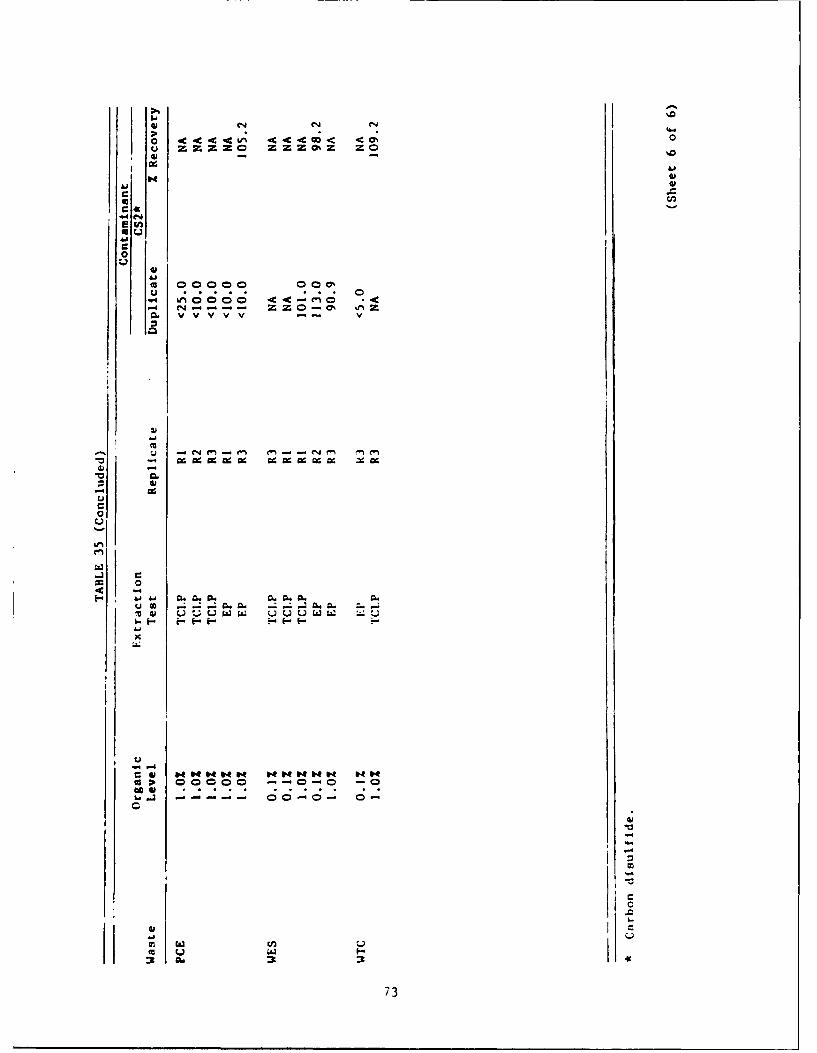
4)
o 4c 4 U 4 44c -C-0'C- 0) ,z z 0 MZZO'%Z ZO
CC
.4 N-E W'a
0
t~00000 007'
-4 N7 --- ZZo-O. LMZ
C.n r"vv --
W. ccJ~s- cc-cJr
uk -
0
on 0
V v4
-4 ~
CC
*0
to4
73

TABLE 36. STUDY A METALS PERCENT ACCURACY OF THE EXTERNAL STANDARDS
Extraction Interference External StandardTest Compound Cadium Chromium Nickel Mercury
TCLP Oil 90.3 74.6 95.0 <0.16
EP 103.6 94.4 98.1 <0.32
TCLP Grease 100.0 94.6 100.7 90.0
EP 112.0 96.4 101.7 53.0
TCLP Lead 103.4 96.8 99.5 <0.16EP 99.6 92.0 95.9 <0.32
TCLP Copper 106.4 101.2 104.9 70.0EP 108.8 102.4 98.4 64.5
TCLP Zinc 102.0 97.6 101.1 67.0
EP 95.5 81.0 96.9 96.0
TCLP Sodium hydroxide 104.0 88.4 100.4 60.0EP 118.0 112.0 102.7 57.0
TCLP Sodium sulfate 10.1 75.4 101.6 49.0EP 104.6 94.0 102.1 188.0
TCLP Phenol 87.4 87.2 101.7 67.6EP 105.4 86.0 100.8 58.0
TCLP Hexachlorobenzene 102.8 96.8 97.5 42.0EP 90.5 83.0 99.7 56.0
TCLP Trichloroethene 90.0 88.8 97.2 67.0EP 110.0 106.4 103.9 140.0
factor that must be considered. If the contaminants of interest in thesolidified/stabilized waste are converted to 1,1-DCE during the extraction,the concentration of 1,1-DCE in the extracts must be measured. If 1,1-DCE isan omitted parameter, large concentrations of volatile contaminants leachingfrom the solidified/stabilized waste will remain undetected. This could even-tually result in long-term environmental degradation. Additional research isneeded to clarify this issue.
74
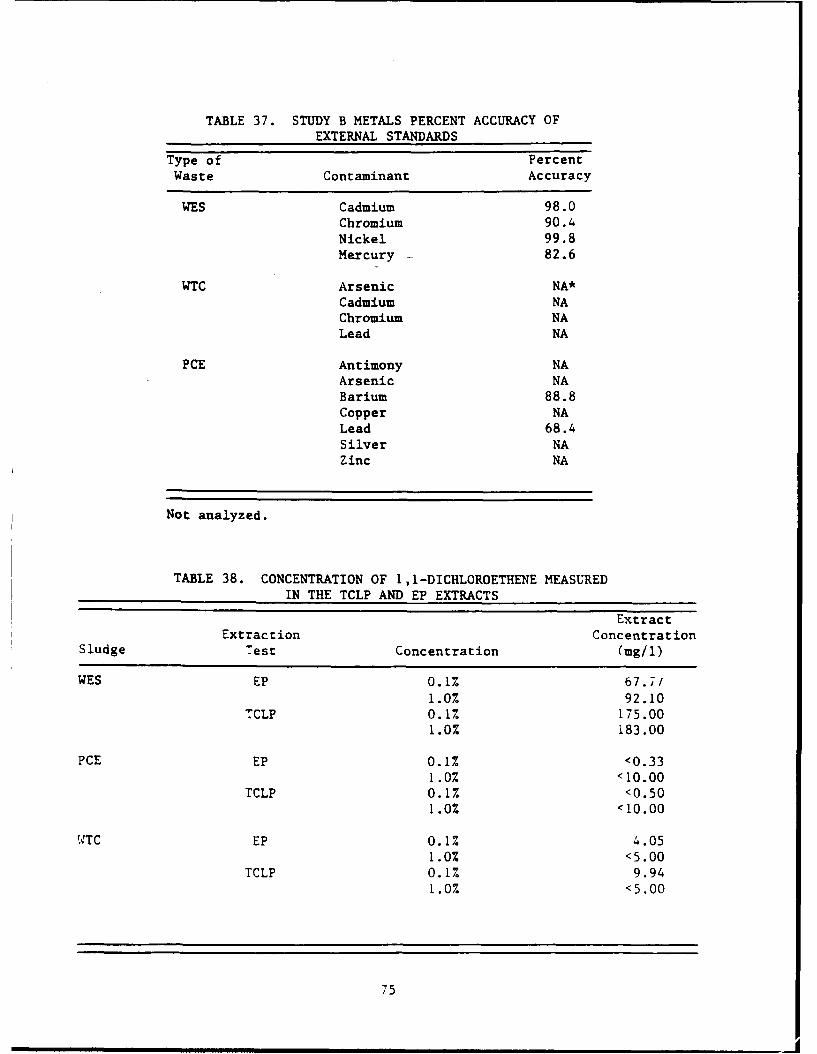
TABLE 37. STUDY B METALS PERCENT ACCURACY OFEXTERNAL STANDARDS
Type of PercentWaste Contaminant Accuracy
WES Cadmium 98.0Chromium 90.4Nickel 99.8Mercury 82.6
WTC Arsenic NA*Cadmium NAChromium NALead NA
PCE Antimony NAArsenic NABarium 88.8Copper NALead 68.4Silver NAZinc NA
Not analyzed.
TABLE 38. CONCENTRATION OF 1,1-DICHLOROETHENE MEASUREDIN THE TCLP AND EP EXTRACTS
Extract
Extraction ConcentrationSludge Test Concentration (mg/i)
WES EP 0.1% 67.7/
1.0% 92.10TCLP 0.1% 175.00
1.0% 183.00
PCE EP 0.1% <0.331.0% <10.00
TCLP 0.1% <0.501.0% <10.00
WTC EP 0.1% 4.051.0% <5.00
TCLP 0.1% 9.941.0% <5.00
75

REFERENCES
American Society for Testing and Materials. 1986. "Annual Book of ASTMStandards: Water and Environmental Technology," Vol 11.01, Water,Philadelphia, PA.
Bricka, R. M., Holmes, T., and Cullinane, M. J., Jr. 1988. "An Evaluation ofStabilization/Solidification of Fluidized Bed Incineration Ash (K048 andK051)," Technical Report EL-88-24, U.S. Army Engineer Waterways ExperimentStation, Vicksburg, MS.
Callaway, 0., Parr, J., and Bollinger, M. 1987. "Comparison of EPA's EP andTCLP Procedures," presented to Water Pollution Control Federation SpecialtyConference, June 1, 1987, Rocky Mountain Analytical Laboratory, Arvada, CO.
Cullinane, M. John, Jr., Bricka, R. Mark, and Francingues, Norman R., Jr.1987 (Jul). "An Assessment of Materials That Interfere with Stabilization/Solidification Processes," Proceedings, USEPA 13th Annual Research Symposium,EPA/600/9-87/015, Hazardous Waste Engineering Research Laboratory, Cincinnati,OH.
Francis, C. W., and Maskarinec, M. P. 1986. "Field and Laboratory Studies inSupport of a Hazardous Waste Extraction Test," ORNL-6247, Oak Ridge NationalLaboratory, Oak Ridge, TN.
Friedman, David. 1985. "Development of an Organic Toxicity Characteristicfor Identification of Hazardous Waste," USEPA Office of Solid Waste,Washington, DC, Proceedings, 5th International Conference on Chemistry forProtection of the Environment, Elsevier Science Publishers, Amsterdam.
Government Institutes, Inc. 1983 (May). Environmental Law Handbook, 7th ed..Rockville, MD.
Hill, Ronald D. 1986. "Definition of a Hazardous Waste," EPA/600/D-86/018,Hazardous Waste Engineering Research Laboratory, Land Pollution ControlDivision, U.S. Environmental Protection Agency, Cincinnati, OH.
Holmes, T., and Bricka, R. Mark. 1988. "Laboratory Assessment of Short-TermTest Methods for the Evaluation of Solidified/Stabilized Waste Materials,"Internal Draft, Hazardous Waste Engineering Research Laboratory,U.S. Environmental Protection Agency, Cincinnati, OH.
Miller, Irwin, and Freund, John E. 1985. Probability and Statistics forEngineers, Prentice-Hall, Englewood Cliffs, NJ.
Newcomer, R. Lynn, Blackburn, W. Burton, and Kimmell, Todd A. 1986. "Per-formance of the Toxicity Characteristic Leaching Procedure," WilsonLaboratories, Salina, KS.
SAS Institute Inc. 1987. SAS/STAT Guide for Personal Computers, Version 6Edition, Cary, NC.
Stegemann, J. and Cote, P. "Investigation of Test Methods for SolidifiedWaste Characterization: A Cooperative Program" (in press), Wastewater Tech-nology Centre, Burlington, Ontario, Canada.
USAEWES. 1960. "The Unified Soil Classification System," Technical Memoran-dum 2-357, T.S. Army Engineer Waterways Experiment Station, Vicksburg, "S.
76
USEPA. 1979 (Dec). "Water-Related Environmental Fate of 129 PriorityPollutants; Volume II," EPA-440/4-79/029b, Office of Water Planning and Stan-dards, Washington, DC.
USEPA. 1980 (May 19). Federal Register, Vol 45, No. 98, Washington, DC.
USEPA. 1982. "Test Methods for Evaluating Solid Waste," SW-846, 2nd ed.,Office of Solid Waste and Emergency Response, Washington, DC.
USEPA. 1986a (Jan 14). Federal Register, Vol 51, No. 9, Washington, DC.
USEPA. 1986b (Jun 13). Federal Register, Vol 51, No. 114, Washington, DC.
USEPA. 1986c. "Test Methods for Evaluating Solid Waste," SW-846, 3rd ed.,Office of Solid Waste and Emergency Response, Washington, DC.
USEPA. 1987 (Jul). Code of Federal Regulations, Vol 40, U.S. GovernmentPrinting Office, Washington, DC.
Verschueren, Karel. 1977. Handbook of Environmental Data on Organic Chemi-cals, 2nd ed., Van Nostrand Reinhold Company, New York.
77

APPENDIX A
EXTRACTION PROCEDURE (EP) TOXICITY TEST ANDSTRUCTURAL INTEGRITY TEST*
1.0 Scope and ADDlication
1.1 The extraction procedure (EP) described in this method is designedto simulate the leaching a waste will undergo if disposed of in an improperlydesigned sanitary landfill. Method 1310 is applicable to liquid, solid, andmultiphasic samples.
2.0 Summary of Method
2.1 If a representative sample of the waste contains more than 0.5%solids, the solid phase of the sample is extracted with deionized water whichis maintained at a pH of 5 + 0.2 using acetic acid. The extract is analyzedto determine if any of the threshold limits listed in Table A-i are exceeded.Table A-i also specifies the approved method of analysis. Wastes that containless than 0.5% solids are not subjected to extraction, but are directly ana-lyzed and evaluated in a manner identical to that of extracts.
3.0 Intfnces
3.1 Potential interferences that may be encountered during analysis arediscussed in the individual analytical methods referenced in Table A-i.
4.0 Apparatus and Materials
4.1 Extractor: For purposes of this test, an acceptable extractor isone that will impart sufficient agitation to the mixture to (1) prevent strat-ification of the sample and extraction fluid and (2) ensure that all samplesurfaces are continuously brought into contact with well-mixed extractionfluid. Examples of suitable extractors are shown in Figures A-i through A-3of this method and are available from Associated Design and Manufacturing Co.,Alexandria, VA; Glas-Col Apparatus Co., Terre Haute, IN; Millipore, Bedford,MA; and Rexnard, Milwaukee, WI.
4.2 pH meter or pH controller: Chemtrix, Inc., Hillsboro, OR, is a pos-sible source of a pH controller.
4.3 Filter holder: A filter holder capable of supporting a 0. 4 5-A fil-ter membrane and able to withstand the pressure needed to accomplish separa-tion. Suitable filter holders range from simple vacuum units to relativelycomplex systems that can exert up to 75 psi of pressure. The type of filterholder used depends upon the properties of the mixture to be filtered. Filterholders known to EPA and deemed suitable for use are listed in Table A-2.
4.4 Filter membrane: Filter membrane suitable for conducting therequired filtration shall be fabricated from a material that (1) is not
* Source: U.S. Environmental Protection Agency, 1982, "Test Methods forEvaluating Solid Waste," SW-846, 2nd ed., Office of Solid Waste andEmergency Response, Washington, DC.
79
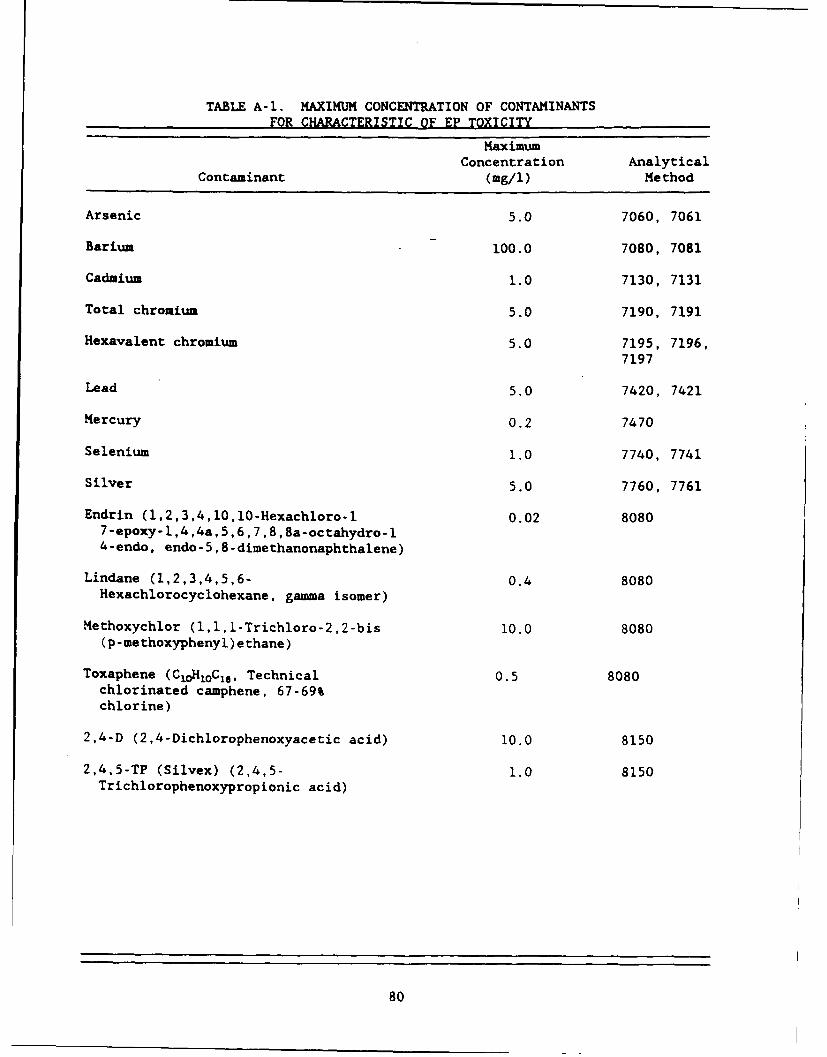
TABLE A-I. MAXIMUM CONCENTRATION OF CONTAMINANTS
FOR CHARACTERISTIC OF EP TOXICITY
MaximumConcentration Analytical
Contaminant (mg/i) Method
Arsenic 5.0 7060, 7061
Barium 100.0 7080, 7081
Cadmium 1.0 7130, 7131
Total chromium 5.0 7190, 7191
Hexavalent chromium 5.0 7195, 7196,7197
Lead 5.0 7420, 7421
Mercury 0.2 7470
Selenium 1.0 7740, 7741
Silver 5.0 7760, 7761
Endrin (1,2,3,4,10,10-Hexachloro-l 0.02 80807 -epoxy-l,4,4a,5,6,7,8,8a-octahydro-i4-endo, endo-5,8-dimethanonaphthalene)
Lindane (1,2,3,4,5,6- 0.4 8080Hexachlorocyclohexane, gamma isomer)
Methoxychlor (l,l,l-Trichloro-2,2-bis 10.0 8080(p-methoxyphenyl)ethane)
Toxaphene (CLOHIOCl, Technical 0.5 8080chlorinated camphene, 67-69%chlorine)
2,4-D (2, 4 -Dichlorophenoxyacetic acid) 10.0 8150
2,4,5-TP (Silvex) (2,4,5- 1.0 8150Trichlorophenoxypropionic acid)
80

5.0 IN.
I- ~ 4-----0.25 IN.
NONCLOGGING SUPPORT BUSHINGS1-IN. BLADE AT 300 TO HORIZONTAL
Figure A-I. EP extractor.
1/15-HP ELECTRIC MOTOR 2-LITER PLASTIC ORGLASS BOTTLES
SCREWS FOR HOLDING BOTTrLES
Figure A-2. EP rotary extractor.
81

cc1C)II I
LU CA
77-
LU
0 I0
UJ uiCL0
Q)I
O-C 0
82
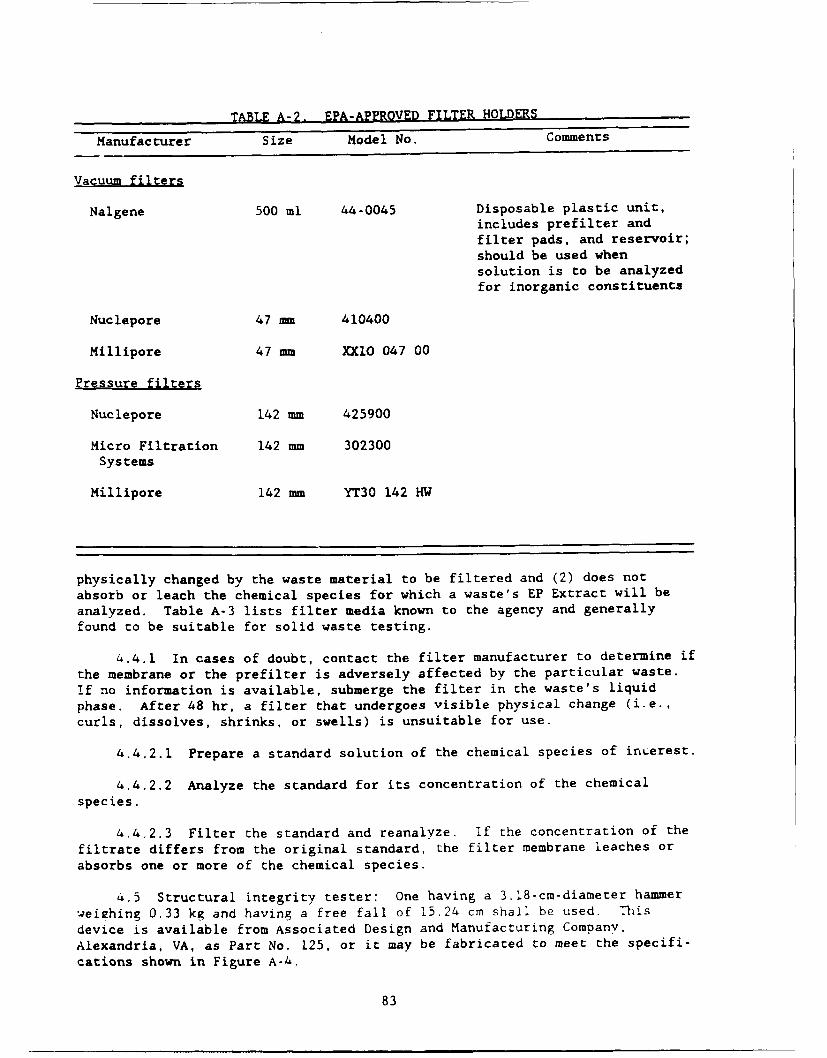
TABLE A-2. EPA-APPROVED FILTER HOLDERS
Manufacturer Size Model No. Comments
Vacuum filters
Nalgene 500 ml 44-0045 Disposable plastic unit,includes prefilter andfilter pads, and reservoir;should be used whensolution is to be analyzedfor inorganic constituents
Nuclepore 47 mm 410400
Millipore 47 mm XX1O 047 00
Pressure -filters
Nuclepore 142 mm 425900
Micro Filtration 142 mm 302300Systems
Millipore 142 mm YT30 142 HW
physically changed by the waste material to be filtered and (2) does notabsorb or leach the chemical species for which a waste's EP Extract will beanalyzed. Table A-3 lists filter media known to the agency and generallyfound to be suitable for solid waste testing.
4.4.1 In cases of doubt, contact the filter manufacturer to determine ifthe membrane or the prefilter is adversely affected by the particular waste.If no information is available, submerge the filter in the waste's liquidphase. After 48 hr. a filter that undergoes visible physical change (i.e.,curls, dissolves, shrinks, or swells) is unsuitable for use.
4.4.2.1 Prepare a standard solution of the chemical species of inrerest.
4.4.2.2 Analyze the standard for its concentration of the chemicalspecies.
4.4.2.3 Filter the standard and reanalyze. if the concentration of the
filtrate differs from the original standard, the filter membrane leaches orabsorbs one or more of the chemical species.
4.5 Structural integrity tester: One having a 3.18-cm-diameter hammerweighing 0.33 kg and having a free fall of 15.24 cm shall be used. Thisdevice is available from Associated Design and Manufacturing Company,Alexandria, VA, as Part No. 125, or it may be fabricated to meet the specifi-cations shown in Figure A-4.
83
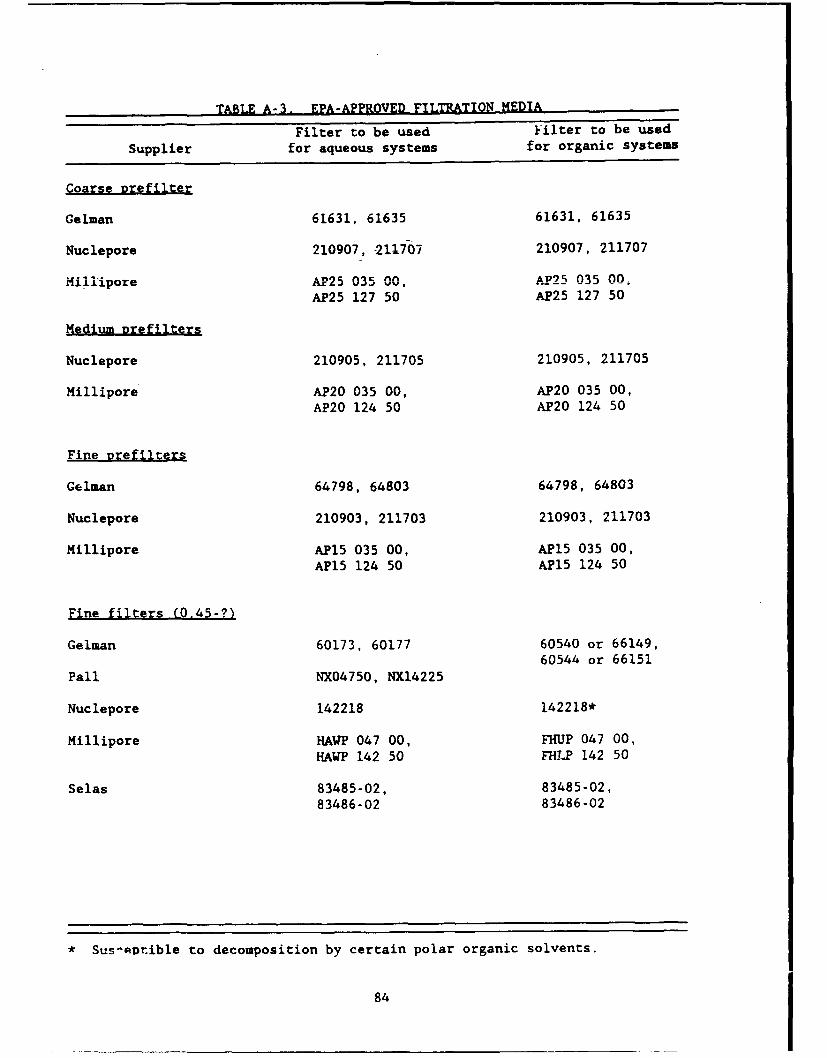
TABLE A-3. EPA-APPROVED FILTRATION MEDIA
Filter to be used kilter to be used
Supplier for aqueous systems for organic systems
Coarse Drefilter
Gelman 61631, 61635 61631, 61635
Nuclepore 210907, -211707 210907, 211707
Milriipore AP25 035 00, AP25 035 00iAP25 127 50 AP25 127 50
Medium Drefilters
Nuclepore 210905, 211705 210905, 211705
Millipore AP20 035 00, AP20 035 00,AP20 124 50 AP20 124 50
Fine prefilters
Gelman 64798, 64803 64798, 64803
Nuclepore 210903, 211703 210903, 211703
Millipore AP15 035 00, AP15 035 00,API5 124 50 API5 124 50
Fine filters (0.45-?)
Gelman 60173, 60177 60540 or 66149,60544 or 66151
Pall NX04750, NX14225
Nuclepore 142218 142218*
Millipore HAWP 047 00, FHUP 047 00,HAWP 142 50 FHL2 142 50
Selas 83485-02, 83485-02,83486-02 83486-02
* Sus-Autible to decomposition by certain polar organic solvents.
84

COMiNVEDWEIGH(T
0.33 KG (0.73 LB)
-i
t (1. IN.)
9.4 CM(3.7 IN.)
Figure A-4. EP compaction tester.
85
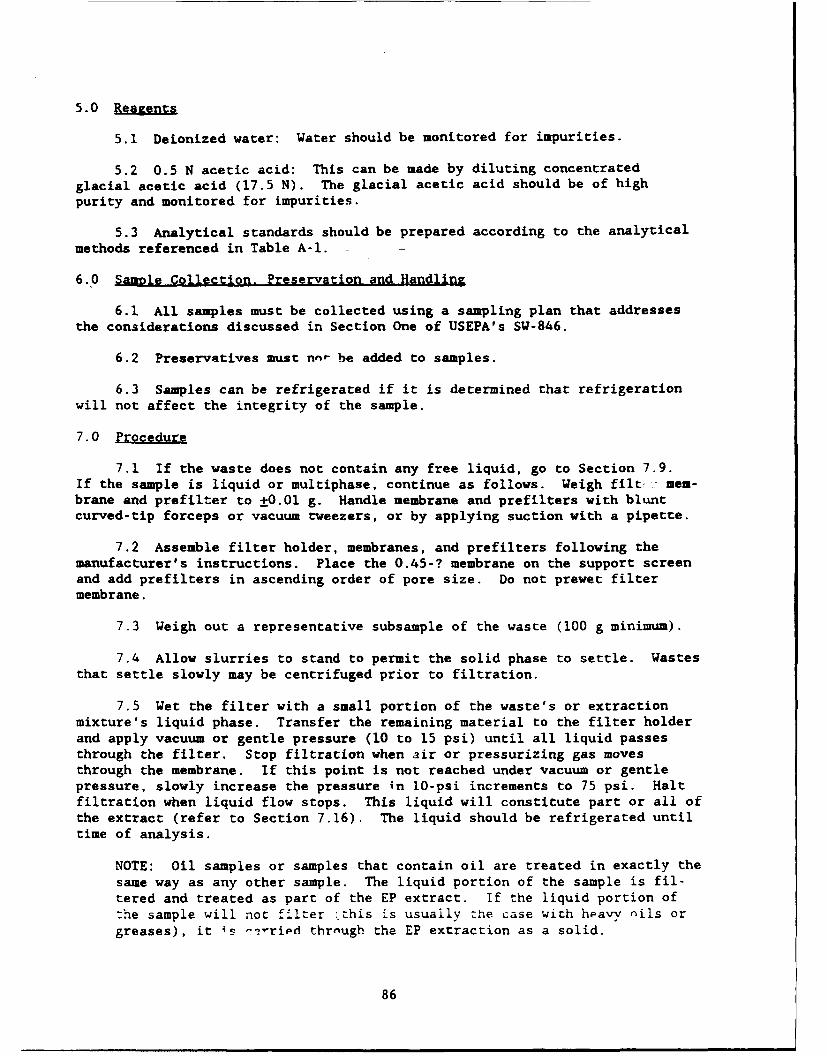
5.0 R
5.1 Deionized water: Water should be monitored for impurities.
5.2 0.5 N acetic acid: This can be made by diluting concentratedglacial acetic acid (17.5 N). The glacial acetic acid should be of highpurity and monitored for impurities.
5.3 Analytical standards should be prepared according to the analytical
methods referenced in Table A-I.
6.0 Sanmle Collection. Preservation and Handling
6.1 All samples must be collected using a sampling plan that addressesthe considerations discussed in Section One of USEPA's SW-846.
6.2 Preservatives must nnt- be added to samples.
6.3 Samples can be refrigerated if it is determined that refrigerationwill not affect the integrity of the sample.
7.0 Procedure
7.1 If the waste does not contain any free liquid, go to Section 7.9.If the sample is liquid or multiphase, continue as follows. Weigh filt- mem-brane and prefilter to ±0.01 g. Handle membrane and prefilters with bluntcurved-tip forceps or vacuum tweezers, or by applying suction with a pipette.
7.2 Assemble filter holder, membranes, and prefilters following themanufacturer's instructions. Place the 0.45-? membrane on the support screenand add prefilters in ascending order of pore size. Do not prewet filtermembrane.
7.3 Weigh out a representative subsample of the waste (100 g minimum).
7.4 Allow slurries to stand to permit the solid phase to settle. Wastesthat settle slowly may be centrifuged prior to filtration.
7.5 Wet the filter with a small portion of the waste's or extractionmixture's liquid phase. Transfer the remaining material to the filter holderand apply vacuum or gentle pressure (10 to 15 psi) until all liquid passesthrough the filter. Stop filtration when air or pressurizing gas movesthrough the membrane. If this point is not reached under vacuum or gentlepressure, slowly increase the pressure in 10-psi increments to 75 psi. Haltfiltration when liquid flow stops. This liquid will constitute part or all ofthe extract (refer to Section 7.16). The liquid should be refrigerated untiltime of analysis.
NOTE: Oil samples or samples that contain oil are treated in exactly thesame way as any other sample. The liquid portion of the sample is fil-tered and treated as part of the EP extract. If the liquid portion ofthe sample will not filter :this is usually the case with heavy nils orgreases), it is -- ried thrnugh the EP extraction as a solid.
86
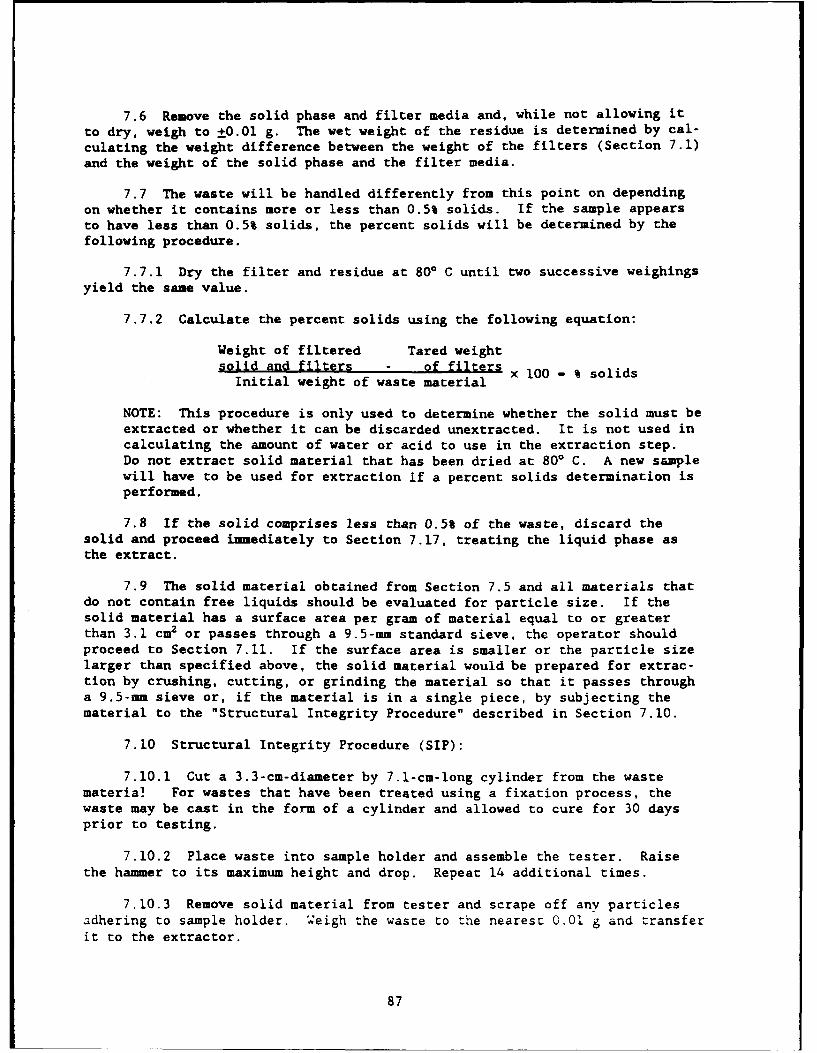
7.6 Remove the solid phase and filter media and, while not allowing itto dry, weigh to +0.01 g. The wet weight of the residue is determined by cal-culating the weight difference between the weight of the filters (Section 7.1)and the weight of the solid phase and the filter media.
7.7 The waste will be handled differently from this point on dependingon whether it contains more or less than 0.5% solids. If the sample appearsto have less than 0.5% solids, the percent solids will be determined by thefollowing procedure.
7.7.1 Dry the filter and residue at 800 C until two successive weighingsyield the same value.
7.7.2 Calculate the percent solids using the following equation:
Weight of filtered Tared weightsolid and filters - of filters
Initial weight of waste material
NOTE: This procedure is only used to determine whether the solid must beextracted or whether it can be discarded unextracted. It is not used incalculating the amount of water or acid to use in the extraction step.Do not extract solid material that has been dried at 800 C. A new samplewill have to be used for extraction If a percent solids determination isperformed.
7.8 If the solid comprises less than 0.5% of the waste, discard thesolid and proceed immediately to Section 7.17, treating the liquid phase asthe extract.
7.9 The solid material obtained from Section 7.5 and all materials thatdo not contain free liquids should be evaluated for particle size. If thesolid material has a surface area per gram of material equal to or greaterthan 3.1 cm2 or passes through a 9.5-mm standard sieve, the operator shouldproceed to Section 7.11. If the surface area is smaller or the particle sizelarger than specified above, the solid material would be prepared for extrac-tion by crushing, cutting, or grinding the material so that it passes througha 9.5-mm sieve or, if the material is in a single piece, by subjecting thematerial to the "Structural Integrity Procedure" described in Section 7.10.
7.10 Structural Integrity Procedure (SIP):
7.10.1 Cut a 3.3-cm-diameter by 7.1-cm-long cylinder from the wastematerial For wastes that have been treated using a fixation process, thewaste may be cast in the form of a cylinder and allowed to cure for 30 daysprior to testing.
7.10.2 Place waste into sample holder and assemble the tester. Raisethe hammer to its maximum height and drop. Repeat 14 additional times.
7.10.3 Remove solid material from tester and scrape off any particlesadhering to sample holder. weigh the waste to the nearest 0.01 g and transferit to the extractor.
87
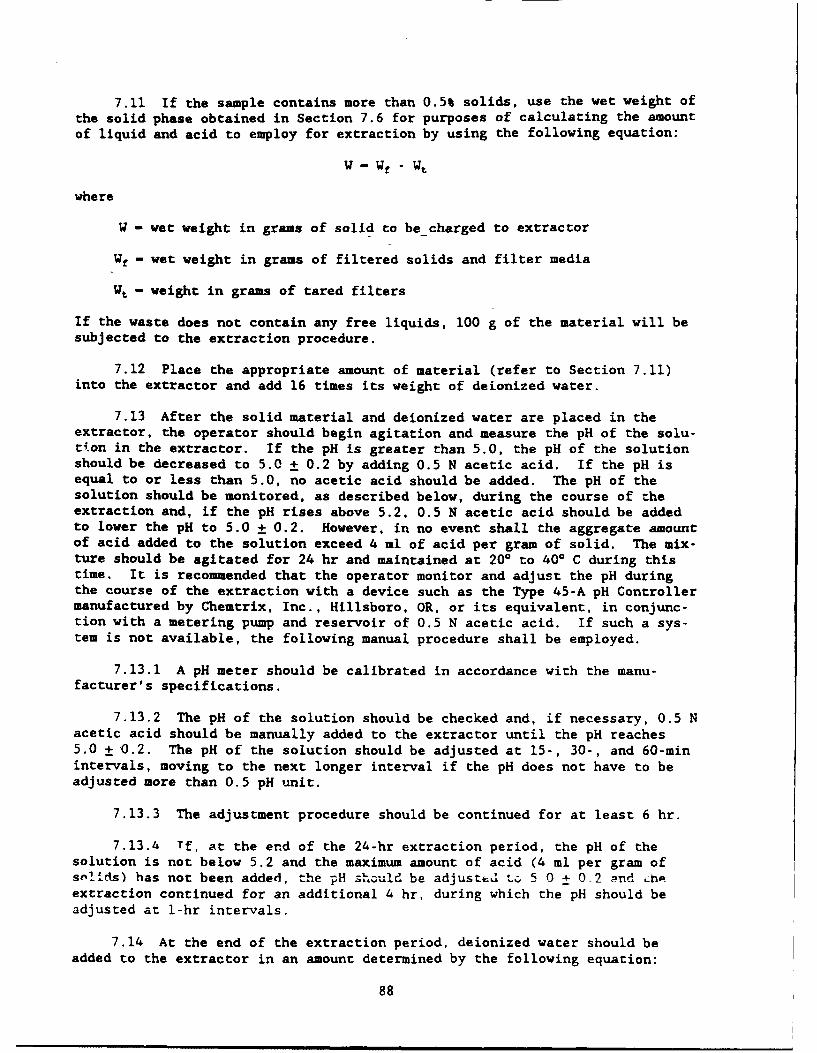
7.11 If the sample contains more than 0.5% solids, use the wet weight ofthe solid phase obtained in Section 7.6 for purposes of calculating the amountof liquid and acid to employ for extraction by using the following equation:
W - Wf - Wt
where
W - wet weight in grams of solid to be_charged to extractor
Wf - wet weight in grams of filtered solids and filter media
Wt - weight in grams of tared filters
If the waste does not contain any free liquids, 100 g of the material will besubjected to the extraction procedure.
7.12 Place the appropriate amount of material (refer to Section 7.11)into the extractor and add 16 times its weight of deionized water.
7.13 After the solid material and deionized water are placed in theextractor, the operator should begin agitation and measure the pH of the solu-tion in the extractor. If the pH is greater than 5.0, the pH of the solutionshould be decreased to 5.0 ± 0.2 by adding 0.5 N acetic acid. If the pH isequal to or less than 5.0, no acetic acid should be added. The pH of thesolution should be monitored, as described below, during the course of theextraction and, if the pH rises above 5.2, 0.5 N acetic acid should be addedto lower the pH to 5.0 + 0.2. However, in no event shall the aggregate amountof acid added to the solution exceed 4 ml of acid per gram of solid. The mix-ture should be agitated for 24 hr and maintained at 200 to 400 C during thistime. It is recommended that the operator monitor and adjust the pH duringthe course of the extraction with a device such as the Type 45-A pH Controllermanufactured by Chemtrix, Inc., Hillsboro, OR, or its equivalent, in conjunc-tion with a metering pump and reservoir of 0.5 N acetic acid. If such a sys-tem is not available, the following manual procedure shall be employed.
7.13.1 A pH meter should be calibrated in accordance with the manu-facturer's specifications.
7.13.2 The pH of the solution should be checked and, if necessary, 0.5 Nacetic acid should be manually added to the extractor until the pH reaches5.0 ± 0.2. The pH of the solution should be adjusted at 15-, 30-, and 60-minintervals, moving to the next longer interval if the pH does not have to beadjusted more than 0.5 pH unit.
7.13.3 The adjustment procedure should be continued for at least 6 hr.
7.13.4 Tf, at the end of the 24-hr extraction period, the pH of thesolution is not below 5.2 and the maximum amount of acid (4 ml per gram ofsolids) has not been added, the pH zh.;uld be adjusted tL. 5 0 ± 0.2 and Lnhextraction continued for an additional 4 hr, during which the pH should beadjusted at 1-hr intervals.
7.14 At the end of the extraction period, deionized water should be
added to the extractor in an amount determined by the following equation:
88
V - (20)(W) - 16(W) - A
where
V - milliters of deionized water to be addedW - weight of solid, in grams, charged to extractorA - milliters of 0.5 N acetic acid added during extraction
7.15 The material in the extractor should be separated into its compo-nent liquid and solid phases in the following manner.
7.15.1 Allow slurries to stand to permit the solid phase to settle(wastes that are slow to settle may be centrifuged prior to filtration) andset up the filter apparatus (refer to Sections 4.3 and 4.4).
7.15.2 Wet the filter with a small portion of the waste's or extractionmixture's liquid phase. Transfer the remaining material to the filter holderand apply-vacuum or gentle pressure (10 to 15 psi) until all liquid passesthrough the filter. Stop filtration when air or pressurizing gas movesthrough the membrane. If this point is not reached under vacuum or gentlepressure, slowly increase the pressure in 10-psi increments to 75 psi. Haltfiltration when liquid flow stops.
7.16 The liquids resulting from Sections 7.5 and 7.15 should be com-bined. This combined liquid (or the waste itself if it has less than 0.5%solids, as noted in Section 7.8) is the extract and should be analyzed for thepresence of any of the contaminants specified in Table A-i using the analyt-ical procedures designated in Section 7.17.
7.17 The extract will be prepared and analyzed according to the analyt-ical methods specified in Table A-1. All of these analytical methods areincluded in this manual. The method of standard addition will be employed forall metal analyses.
NOTE: If the EP extract includes two phases, concentration of contami-nants is determined by using a simple weighted average. For example: An EPextract contains 50 ml of oil and 1,000 ml of an aqueous phase. Contaminantconcentrations are determined for each phase. The final contamination concen-tration is taken to be
(50)(Contaminant conc. in oil) (.,000)(Contaminant conc. of aqueous phase)1,050 1,050
89
7.18 The extract concentrations are compared to the maximum contamina-tion limits listed in Table A-1. If the extract concentrations are equal toor greater than the respective values, the waste is considered to be EPtoxic.*
8.0 Oualit~y Control
8.1 All quality control data should be maintained and available for easyreference or inspection.
8.2 Employ a minimum of one blank per sample batch to determine if con-tamination or any memory effects are occurring.
8.3 All quality control measures suggested in the referenced analyticalmethods should be followed.
*Chromium concentrations have to be interpreted differently. A waste con-taining chromium will be determined to be EP toxic if (1) the waste extracthas an initial pH of less than 7 and contains more than 5 mg/1 of hexavalentchromium in the resulting extract, (2) the waste extract has an initial pHgreater than 7 and a final pH greater than 7 and contains more than 5 mg/1of hexavalent chromium in the extract, or (3) the waste extract has aninitial pH greater than 7 and a final pH less than 7 and contains more than5 mg/l of total chromium, unless the chromium is trivalent. To determinewhether the chromium is trivalent, the sample must be processed according toan alkaline digestion method (Method 3060) and analyzed for hexavalentchromium (Method 7195, 7196, or 7197).
90
APPENDIX B
TOXICITY CHARACTERISTIC LEACHING PROCEDURE*
1.0 Scoie and ADolication
1.1 The TCLP is designed to determine the mobility of both organic andinorganic contaminants present in liquid, solid, and multiphasic wastes.
1.2 If a total analysis of the waste demonstrates that individual con-taminants are not present in the waste, or that they are present, but at suchlow concentrations that the appropriate regulatory thresholds could not pos-sibly be exceeded, the TCLP need not be run.
2.0 Summary of Method (see Figure B-l1
2.1 For wastes containing less than 0.5% solids, the waste, after fil-tration through a 0.6- to 0.8-? glass fiber filter, is defined as the TCLPextract.
2.2 For wastes containing greater than 0.5% solids, the liquid phase, ifany, is separated from the solid phase and stored for later analysis. Theparticle size of the solid phase is reduced (if necessary), weighed, andextracted with an amount of extraction fluid equal to 20 times the weight ofthe solid phase. The extraction fluid employed is a function of the alka-linity of the solid phase of the waste. A special extractor vessel is usedwhen testing for volatilas (see Table B-1). Following extraction, the liquidextract is separated from the solid phase by 0.6- to 0.8-? glass fiber filterfiltration.
2.3 If compatible (e.g. precipitate or multiple phases will not form oncombination), the initial liquid phase of the waste is added to the liquidextract, and these liquids are analyzed together. If incompatible, theliquids are analyzed separately and the results are mathematically combined toyield the volume-weighted average concentration.
3.0 Intefrnces
3.1 Potential interferences that may be encountered during analysis arediscussed in the individual analytical methods.
4.0 Apnaratus and Materials
4.1 Agitation apparatus: An acceptable agitation apparatus is one thatis capable of rotating the extraction vessel in an end-over-end fashion (seeFigure B-2) at 30 + 2 rpm. Suitable devices known to EPA are identified inTable B-2.
* Source: U.S. Environmental Protection Agency, 1986, Federal Register.Vol 51 (13 Jun), No. 114, Washington, DC.
91
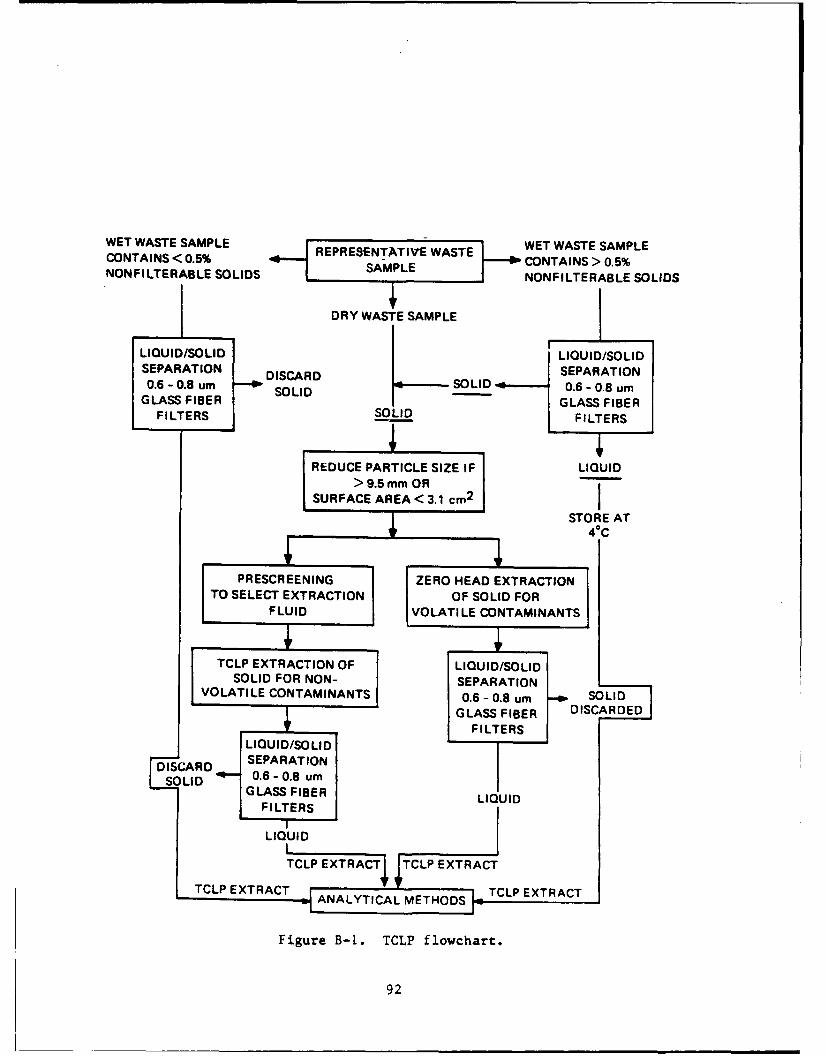
WET WASTE SAMPLE WET WASTE SAMPLECONTAINS < 0.5% REPRESENTATIVE WASTENONFILTERABLE SOLIDS SAMPLE CONITAINS 0.5%• / ~NONF ILTERAB LE SO LIDS
DRY WASTE SAMPLE
LIQUID/SOLID LIQUID/SOLIDSEPARATION DISCARD SEPARATION0.6 - 0.8 um SOLID SOLID 0.6 - 0.8 um
GLASS FIBER SO GLASS FIBERI FILTERS SOLID FILTERS
REDUCE PARTICLE SIZE IF LIQUID> 9.5 mm OR
SURFACE AREA< 3.1 cm 2
STORE AT4aC
PRESCREENING ZERO HEAD EXTRACTIONTO SELECT EXTRACTION OF SOLID FOR
FLUID VOLATI LE CONTAMINANTS
TCLP EXTRACTION OF LIQUID/SOLIDSOLID FOR NON- SEPARATION
VOLATILE CONTAMINANTS 0.6 - 0.8 umr SOLIDSGLASS FIBER DISCARDED
FILTERSLIQUID/SOLID
DISCARD SEPARATIONISCARD 0.6 - 0.8 um
GLASS FIBER LIQUIDFILTERSI
LIQUID
TCLP EXTRATI •TCLP EXTRACT
T C L P E X R C A N L T C L M T O S T L E X R T
Figure B-I. TCLP flowchart.
92

TABLE B-1. VOLATILE CONTAMINANTS*
Compound
Acetone 67-64-1Acrylonitrile 107-13-1
Benzene 71-43-2n-Butyl alcohol 71-36-6
Carbon disulfide 75-15-0Carbon tetrachloride 56-23-5Chlorobenzene 108-90-7Chloroform 67-66-31,2-Dichloroethylene 107-06-21,1-Dichloroethylene 75-35-4Ethyl acetate 141-78-6Ethyl benzene 100-41-4Ethyl ether 60-29-7Isobutanol 78-83-1Methanol 67-56-1Methylene chloride 75-09-2Methyl ethyl ketone 78-93-3Methyl isobutyl ketone 108-10-11,1,1,2-Tetrachloroethane 630-20-61,1,2,2-Tetrachloroethane 79-34-5Tetrachloroethene 127-18-4Toluene 108-88-31,1,1-Trichloroethane 71-55-61,1,2-Trichloroethane 79-00-5Trichloroethylene 79-01-6Trichlorofluoromethane 75-69-41,1,2-Trichloro-1,2,2-trifluoroethane 76-13-1Vinyl chloride 75-01-4Xylane 1330-20-7
* Includes compounds identified in both the Land Disposal Restrictions Ruleand the Toxicity Characteristics.
93
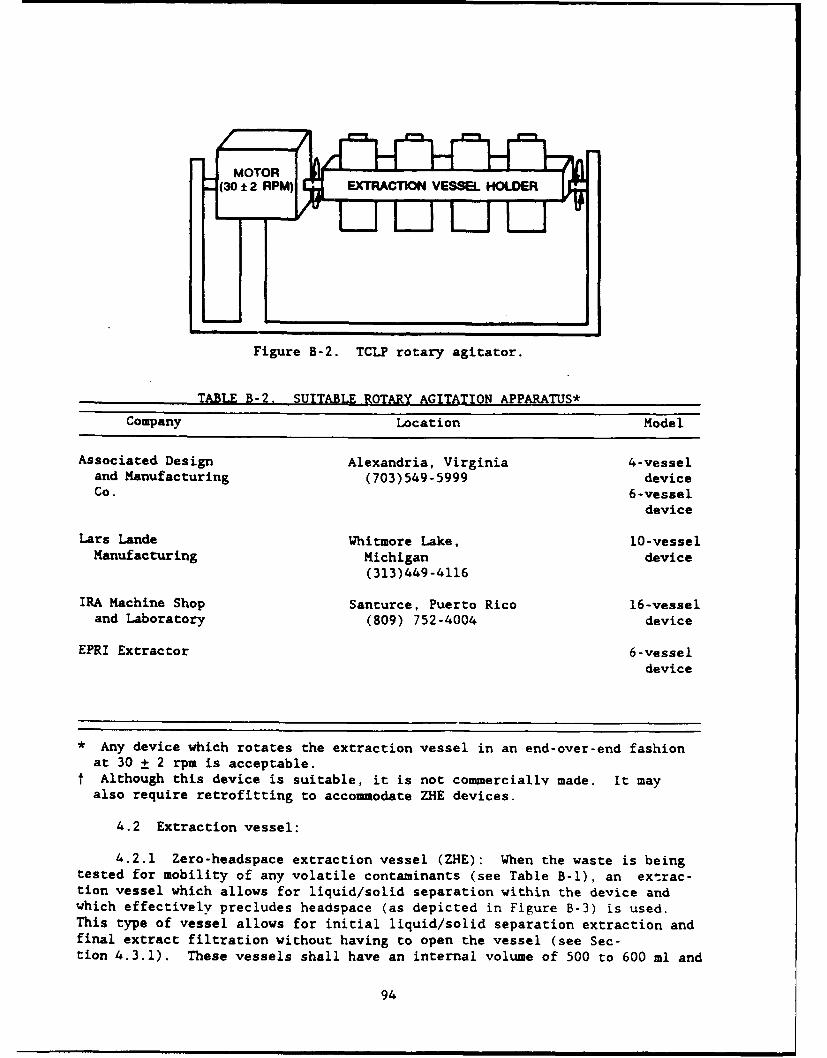
(30±12 RPM) k EXTRACTION VgESSEL HOLDER
Figure B-2. TCLP rotary agitator.
TABLE B-2. SUITABLE ROTAY AGITATION APPARATUS*Company Location Model
Associated Design Alexandria, Virginia 4-vesseland Manufacturing (703)549-5999 deviceCo. 6-vessel
device
Lars Lande Whitmore Lake, 10-vesselManufacturing Michigan device
(313)449-4116
IRA Machine Shop Santurce, Puerto Rico 16-vesseland Laboratory (809) 752-4004 device
EPRI Extractor 6-vesseldevice
* Any device which rotates the extraction vessel in an end-over-end fashionat 30 ± 2 rpm is acceptable.
t Although this device is suitable, it is not commercially made. It mayalso require retrofitting to accommodate ZHE devices.
4.2 Extraction vessel:
4.2.1 Zero-headspace extraction vessel (ZHE): When the waste is beingtested for mobility of any volatile contaminants (see Table B-1), an extrac-tion vessel which allows for liquid/solid separation within the device andwhich effectively precludes headspace (as depicted in Figure B-3) is used.This type of vessel allows for initial liquid/solid separation extraction andfinal extract filtration without having to open the vessel (see Sec-tion 4.3.1). These vessels shall have an internal volume of 500 to 600 ml and
94
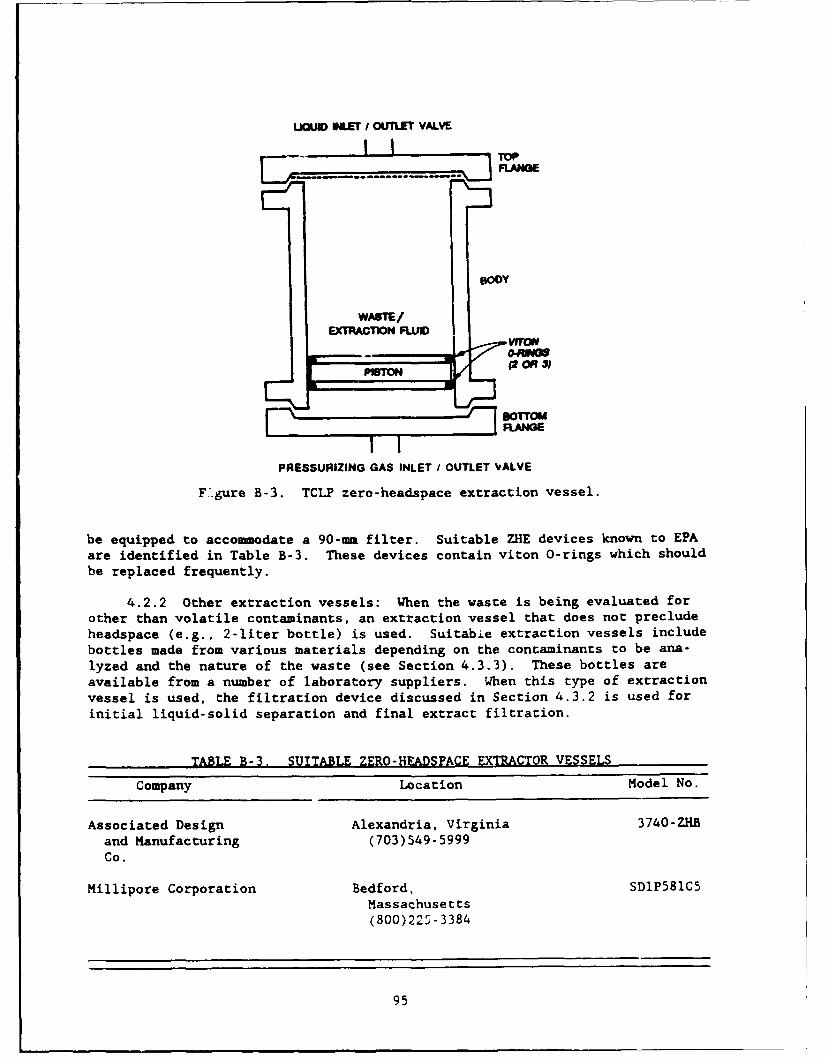
LUID ILET I OUTLET VALVE
FLAM
PRESSURIZING GAS INLET / OUTLET VALVE
I F1.ure B-3. TCLP zero-headapace extraction vessel.
be equipped to accommodate a 90-mm filter. Suitable ZHE devices known to EPAare identified in Table B-3. These devices contain viton 0-rings which shouldbe replaced frequently.
4.2.2 Other extraction vessels: When the waste is being evaluated forother than volatile contaminants, an extraction vessel that does not precludeheadspace (e.g., 2-liter bottle) is used. Suitabie extraction vessels includebottles made from various materials depending on the contaminants to be ana-lyzed and the nature of the waste (see Section 4.3.3). These bottles areavailable from a number of laboratory suppliers. When this type of extractionvessel is used, the filtration device discussed in Section 4.3.2 is used forinitial liquid-solid separation and final extract filtration.
TAE B-, SUITAL ZERO-HAADSPACE ETRACTOR VESSE
Company Location Model No.
Associated Design Alexandria, Virginia 3740-ZHBand Manufacturing (703)549-5999Co.
Millipore Corporation Bedford, SDlP581CSMassachusetts(800)225-3384
95

4.3 Filtration devices:
4.3.1 Zero-headspace extractor vessel (see Figure B3): When the wasteis being evaluated for volatiles, the zero-headspace extraction vessel is usedfor filtration. The device shall be capable of supporting and keeping inplace the glass fiber filter and be able to withstand the pressure needed toaccomplish separation (50 psi).
NOTE: When it is suspected that the glass fiber filter has beenruptured, an in-line glass fiber fi-lter may be used to filter theextract.
4.3.2 Filter holder: When the waste is being evaluated for other thanvolatile compounds, a filter holder capable of supporting a glass fiber filterand able to withstand the pressure needed to accomplish separation is used.Suitable filter holders range from simple vacuum units to relatively complexsystems capable of exerting pressure up to 50 psi and more. The type of fil-ter holder used depends on the properties of the material to be filtered (seeSection 4.3.3). These devices shall have a minimum internal volume of 300 mland be equipped to accommodate a minimum filter size of 47 mm. Filter holdersknown to EPA to be suitable for use are shown in Table B-4.
4.3.3 Materials of construction: Extraction vessels and filtrationdevices shall be made of inert materials which will not leach or absorb wastecomponents. Glass polytetrafluoroethylene (PTFE) or type 316 stainless steelequipment may be used when evaluating the mobility of both organic and inor-ganic components. Devices made of high density polyethylene (HDPE), polypro-pylene, or polyvinyl chloride may be used when evaluating the mobility ofmetals.
4.4 Filters: Filters shall be made of borosilicate glass fiber, containno binder materials, and have an effective pore size of 0.6 to 0.8 ? or equiv-alent. Filters known to EPA to meet these specifications are identified inTable B-5. Prefilters must not be used. When evaluating the mobility ofmetals, filters shall be acid-washed prior to use by rinsing with 1.0 N nitricacid followed by three consecutive rinses with deionized distilled water(minimum of 500 ml per rinse). Glass fiber filters are fragile and should behandled with care.
4.5 pH meters: Any of the commonly available pH meters are acceptable.
4.6 ZHE extract collection devices: Tedlar* bags or glass, stainlesssteel, or PTFE gas-tight syringes are used to collect the initial liquid phaseand the final extract of the waste when using the ZHE device.
4.7 ZHE extraction fluid collet in devices: Any device capable oftransferring the extraction fluid into che ZHE without changing the nature ofthe extraction fluid is acceptable (e.g. a constant displacement pump, a gas-tight syringe, pressure filtration unit (see Section 4.3.2), or another ZHEdevice).
* Registered trademark of DuPont.
96

TABLE B-4. SUITABLE FILTER HOLDERS*
Size
Company Location Model (mn)
Nuclepore Corporation Pleasanton, 425910 142California 410400 47(800)882-7711
Micro Filtration Dublin, California 302400 142Systems (415)828-6010
Millipore Corporation Bedford, YT30142HW 142Massachusetts XX1004700 47(800)225-3384
Any device capable of separating the liquid from the solid phase of thewaste is suitable, providing that it is chemically compatible with the wasteand the constituents to be analyzed. Plastic devices (not listed above) maybe used when only inorganic contaminants are of concern.
TABLE B-5. SUITABLE FILTER MEIA
NominalPore
Company Location Model Size
Whatman Clifton, New Jersey GFF 0.7Laboratory (201)773-5800Products, Inc.
4.8 Laboratory balance: Any laboratory balance accurate to within±0.01 gram (g) may be used (all weight measurements are to be within +0.1 g).
5.0 Reagg]3ts
5.1 Water: ASTM Type 1 deionized, carbon treated, decarbonized, fil-tered water (or equivalent water that is treated to remove volatile compo-nents) shall be used when evaluating wastes for volatile contaminants. Other-wise, ASTM Type 2 deionized distilled water (or equivalent) is used. Thesewaters should be monitored periodically for impurities.
5.2 1.0 N Hydrochloric acid (HCl) made from ACS Reagent grade.
5.3 1.0 N Nitric acid (HN02) made from ACS Reagent grade.
5.4 1.0 N Sodium hydroxide (NaOH) made from ACS Reagent grade.
97

5.5 Glacial acetic acid (HOAc) made from ACS Reagent grade.
5.6 Extraction fluid:
5.6.1 Extraction fluid 1: This fluid is made by adding 5.7 ml glacialHOAc to 500 ml of the appropriate water (see Section 5.1), adding 64.3 ml of1.0 N NaOH, and diluting to a volume of 1 liter. When correctly prepared, thepH of this fluid will be 4.93 + 0.05.
5.6.2 Extraction fluid 2: This fluid is made by diluting 5.7 ml glacialHOAc with ASTM Type 2 water (see Section 5.1) to a volume of 1 liter. Whencorrectly prepared, the pH of this fluid will be 2.88 ± 0.05.
NOTE: These extraction fluids shall be made up fresh daily. The pHshould be checked prior to use to ensure that the fluids are made upaccurately, and they should be monitored frequently for impurities.
5.7 Analytical standards shall be prepared according to the appropriate
analytical method.
6.0 Sanmle Collection, Preservation, and Handling
6.1 All samples shall be collected using a sampling plan that addressesthe considerations discussed in "Test Methods for Evaluating Solid Wastes"(SW-846).
6.2 Preservatives shall not be added to samples.
6.3 Samples can be refrigerated unless it results in irreversible phys-ical changes to the waste.
6.4 When the waste is to be evaluated for volatile contaminants, caremust be taken to ensure that these are not lost. Samples shall be taken andstored in a manner which prevents the loss of volatile contaminants. If pos-sible, any necessary particle size reduction should be conducted as the sampleis being taken (see Step 8.5). Refer to SW-846 for additional sampling andstorage requirements when volatiles are contaminants of concern.
6.5 TCLP extracts should be prepared for analysis and analyzed as soonas possible following extraction. If they need to be stored, even for a shortperiod of time, storage shall be at 40 C, and samples for volatiles analysisshall not be allowed to come into contact with the atmosphere (i.e., noheadspace).
7.0 Procedure When Volatiles Are Not Involved
NOTES: Although a minimum sample size of 100 g is required, a largersample size may be necessary, depending on the percent solids of thewaste sample. Enough waste sample should be collected such that at least75 g of the solid phase of the waste (as determined using glass fiberfilter filtration) is extracted. This will ensure that there is adequateextract for the required analyses (e.g. semivolatiles, metals, pesti-cides, and herbicides).
98
The determination of which extraction fluid to use (see Step 7.12) may
also be conducted at the start of this procedure. This determination
shall be based on the solid phase of the waste (as obtained using glass
fiber filter filtration).
7.1 If the waste will obviously yield no free liquid when subjected to
pressure filtration, weigh out a representative subsample of the waste (lO0-g
minimum) and proceed to Step 7.11.
7.2 If the sample is liquid or multiphasic, liquid/solid separation is
required. This involves the filtration device discussed in Section 4.3.2 andoutlined in Steps 7.3 to 7.9.
7.3 Preweigh the filter and the container that will receive thefiltrate.
7.4 Assemble filter holder and filter following the manufacturer'sinstructions. Place the filter on the support screen and secure. Acid-washthe filter if evaluating the mobility of metals (see Section 4.4).
7.5 Weigh out a representative subsample of the waste (l00-g minimum)and record weight.
7.6 Allow slurries to stand to permit the solid phase to settle. Wastesthat settle slowly may be centrifuged prior to filtration.
7.7 Transfer the waste sample to the filter holder.
NOTES: If waste material has obviously adhered to the container used totransfer the sample to the filtration apparatus, determine the weight ofthis residue and subtract it from the sample weight determined inStep 7.5, to determine the weight of the waste sample that will be fil-tered. Gradually apply vacuum or gentle pressure of 1 to 10 psi, untilair or pressurizing gas moves through the filter. If this point is notreached under 10 psi, and if no additional liquid has passed through thefilter in any 2-min interval, slowly increase the pressure in 10-psiincrements to a maximum of 50 psi. After each incremental increase of10 psi, if the pressurizing gas has not moved through the filter and noadditional liquid has passed through the filter in any 2-min interval,proceed to the next 10-psi increment. When the pressurizing gas beginsto move through the filter, or when liquid flow has ceased at 50 psi(i.e., does not result in any additional filtrate within any 2-minperiod), filtration is stopped.
Instantaneous application of high pressure can degrade the glass fiberfilter and may cause premature plugging.
7.8 The material in the filter holder is defined as the solid phase ofthe waste, and the filtrate is defined as the liquid phase.
NOTE: Some wastes, such as oily wastes and some paint wastes, will obvi-ously contain some material that appears to be a liquid; however, evenafter applying vacuum or pressure filtration as outlined in Step 7.7,this material may not filter. If this is the case, the material within
99

the filtration device is defined as a solid and is carried through theextraction as a solid.
7.9 Determine the weight of the liquid phase by subtracting the weightof the filtrate container (see Step 7.3) from the total weight of thefiltrate-filled container. The liquid phase may now be either analyzed (seeStep 7.15) or stored at 40 C until time of analysis. The weight of the solidphase of the waste sample is determined by subtracting the weight of theliquid phase from the weight of the total waste sample, as determined inStep 7.5 or 7.7. Record the weight of the liquid and solid phases.
-NOTE: If the weight of the solid phase of the waste is less than 75 g,review Step 7.0.
7.10 The sample will be handled differently from this point, dependingon whether it contains more or less than 0.50 solids. If the sample obviouslyhas greater than 0.5% solids, go to Step 7.11. If it appears that the solidmay comprise less than 0.5% of the total waste, the percent solids will bedetermined as follows:
7.10.1 Remove the solid phase and filter from the filtration apparatus.
7.10.2 Dry the filter and solid phase at 100 + 200 C until two succes-sive weighings yield the same value. Record final weight.
7.10.3 Calculate the percent solids as follows: Weight of dry waste andfilters minus tared weight of filters divided by initial weight of waste(Step 7.5 or 7.7) multiplied by 100 equals percent solids.
7.10.4 If the solid comprises less than 0.5% of the waste, the solid isdiscarded, and the liquid phase is defined as the TCLP extract. Proceed toStep 7.14.
7.10.5 If the solid is greater than or equal to 0.5% of the waste,return to Step 7.1, and begin the procedure with a new sample of waste. Donot extract the solid that has been dried.
NOTE: This step is only used to determine whether the solid must beextracted or whether it may be discarded unextracted. It is not used incalculating the amount of extraction fluid to use in extracting thewaste, nor is the dried solid that is derived from this step subjected toextraction. A new sample will have to be prepared for extraction.
7.11 If the sample has more than 0.5% solids, it is now evaluated forparticle size. If the solid material has a surface area per gram of materialequal to or greater than 3.1 cm2 or is capable of passing through a 9.5-rnstandard sieve, proceed to Step 7.12. If the surface area is smaller or theparticle size is larger than that described above, the solid material is pre-pared for extraction by crushing, cutting, or grinding the solid material to asurface area or particle size as described above. When surface area orparticle size has been appropriately altered, proceed to Step 7.12.
100
7.12 This step describes the determination of the appropriate extractingfluid to use (see Sections 5.0 and 7.0).
7.12.1 Weigh out a small subsample of the solid phase of the waste,reduce the solid (if necessary) to a particle size of approximately 1 ma indiameter or less, and transfer a 5.0-g portion to a 500-ml beaker orErlenmeyer flask.
7.12.2 Add 96.5 ml distilled deionized water (ASTM Type 2), cover withwatchglass, and stir vigorously for-5 min using a magnetic stirrer. Measureand record the pH. If the pH is <5.0, extraction fluid 1 is used. Proceed toStep 7.13.
7.12.3 If the pH from Step 7.12.2 is >5.0, add 3.5 ml 1.0 N HC1, slurryfor 30 sec, cover with a watchglass, heat to 500 C, and hold for 10 min.
7.12.4 Let the solution cool to room temperature and record pH. If pHis <5.0,. use extraction fluid 1. If the pH is >5.0, extraction fluid 2 isused.
7.13 Calculate the weight of the remaining solid material by subtractingthe weight of the subsample taken for Step 7.12 from the original amount ofsolid material, as obtained from Step 7.1 or 7.9. Transfer remaining solidmaterial into the extractor vessel, including the filter used to separate theinitial liquid from the solid phase.
NOTES: If any of the solid phase remains adhered to the walls of thefilter holder, or the container used to transfer the waste, its weightshall be determined and subtracted from the weight of the solid phase ofthe waste, as determined above; this weight is used in calculating theamount of extraction fluid to add into the extractor bottle.
Slowly add an amount of the appropriate extraction fluid (see Step 7.12)into the extractor bottle equal to 20 times the weight of the solid phasethat has been placed into the extractor bottle. Close extractor bottletightly, secure in rotary extractor device, and rotate at 30 + 2 rpm for18 hr. The temperature shall be maintained at 220 ± 30 C during theextraction period.
As agitation continues, pressure may build up within the extractor bottle(due to the evolution of gases such as carbon dioxide). To relieve thesepressures, the extractor bottle may be periodically opened and ventedinto a hood.
7.14 Following the 18-hr extraction, the material in the extractorvessel is separated into its component liquid and solid phases by filteringthrough a new glass fiber filter as outlined in Step 7.7. This new filtershall be acid-washed (see Section 4.4) if evaluating the mobility of metals.
7.15 The TCLP extract is now prepared as follows:
101

7.15.1 If the waste contained no initial liquid phase, the filteredliquid material obtained from Step 7.14 is defined as the TCLP extract. Pro-ceed to Step 7.16.
7.15.2 If compatible (e.g. will not form precipitate or multiplephases), the filtered liquid resulting from Step 7.14 is combined with theinitial liquid phase of the waste as obtained in Step 7.9. This combinedliquid is defined as the TCLP extract. Proceed to Step 7.16.
7.15.3 If the initial liquid phase of the waste, as obtained fromStep 7.9, is not or may not be compatible with the filtered liquid resultingfrom Step 7.14, these liquids are not combined. These liquids are collec-tively defined as the TCLP extract, analyzed separately, and the results com-bined mathematically. Proceed to Step 7.16.
7.16 The TCLP extract will be prepared and analyzed according to theappropriate SW-846 analytical methods identified in Appendix III of40 CFR 261. TCLP extracts to be analyzed for metals shall be acid-digested.If the individual phases are to be analyzed separately, determine the volumeof the individual phases (to 0.1 ml), conduct the appropriate analyses, andcombine the results mathematically by using a simple weighted average:
(V1 )(CI) + (V2 )(C 2 )Final contaminant concentration -
V + V1 2
whereV, - volume of the first phase, litersC, - concentration of the contaminant of concern in the first phase,
milligrams per literV2 - volume of the second phase, litersC2 - concentration of the contaminant of concern in the second phase,
milligrams per liter
7.17 The contaminant concentrations in the TCLP extract are compared tothe thresholds identified in the appropriate regulations. Refer to Section 9for quality assurance requirements.
8.0 Procedure When Volatiles Are Involved
NOTES: The ZHE device has approximately a 500-ml internal capacity.Although a minimum sample size of 100 g was required in the Section 7procedure, the ZHE can only accommodate a maximum 100-percent solidssample of 25 g, due to the need to add an amount of extraction fluidequal to 20 times the weight of the solid phase. Step 8.4 provides themeans by which to determine the approximate sample size for the ZHEdevice.
Although the following procedure allows for particle size reductionduring the conduct of the procedure, this could result in the loss ofvolatile compounds. If possible, any necessary particle size reduction(see Step 8.5) should be conducted on the sample as it is being taken.
102
Particle size reduction should only be conducted during the procedure ifthere is no other choice.
In carrying out the following steps, do not allow the waste to be exposedto the atmosphere for any more time than is absolutely necessary.
8.1 Preweigh the (evacuated) container that will receive the filtrate(see Section 4.6), and set aside.
8.2 Place the ZHE piston within the body of the ZHE (it may be helpfulto first moisten the piston O-rings slightly with extraction fluid). Securethe gas inlet/outlet flange (bottom flange) onto the ZHE body in accordancewith the manufacturer's instructions. Secure the glass fiber filter betweenthe support screens and set aside. Set liquid inlet/outlet flange (topflange) aside.
8.3 If the waste will obviously yield no free liquid when subjected topressure filtration, weigh out a representative subsample of the waste (25-gmaximum - see Step 8.0), record weight, and proceed to Step 8.5.
8.4 This step provides the means by which to determine the approximatesample size for the ZHE device. If the waste is liquid or multiphasic, followthe procedure outlined in Steps 7.2 to 7.9 (using the Section 7 filtrationapparatus) and obtain the percent solids by dividing the weight of the solidphase of the waste by the original sample size used. If the waste obviouslycontains greater than 0.5% solids, go to Step 8.4.2. If it appears that thesolid may comprise less than 0.5% of the waste, go to Step 8.4.1.
8.4.1 Determine the percent solids by using the procedure outlined inStep 7.10. If the waste contains less than 0.5% solids, weigh out a new lO0-gminimum representative sample, proceed to Step 8.7, and follow until theliquid phase of the waste is filtered using the ZHE device (Step 8.8). Thisliquid filtrate is defined as the TCLP extract and is analyzed directly. Ifthe waste contains greater than or equal to 0.5% solids, repeat Step 8.4 usinga new 100-g minimum sample, determine the percent solids, and proceed toStep 8.4.2.
8.4.2 If the sample is <25% solids, weigh out a new 100-g minimum repre-sentative sample and proceed to Step 8.5. If the sample is >25% solids, themaximum amount of sample the ZHE can accommodate is determined by dividing25 g by the percent solids obtained from Step 8.4. Weigh out a new represen-tative sample of the determined size.
8.5 After a representative sample of the waste (sample size determinedfrom Step 8.4) has been weighed out and recorded, the sample is now evaluatedfor particle size (see Step 8.0). If the solid material within the wasteobviously has a surface area per gram of material equal to or greater than3.1 cm2 , or is capable of passing through a 9.5-mm standard sieve, proceedimmediately to Step 8.6. If the surface area is smaller or the particle sizeis larger than that described above, the solid material that does not meet theabove criteria is separated from the liquid phase by sieving (or equivalentmeans), and the solid is prepared for extraction by crushing, cutting, orgrinding to a surface area or particle size as described above.
103
NOTE: Wastes and appropriate equipment should be refrigerated, if pos-sible, to 4° C prior to particle size reduction. Grinding and millingmachinery which generates heat shall not be used for particle size reduc-tion. If reduction of the solid phase of the waste is necessary, expo-sure of the waste to the atmosphere should be avoided to the extent pos-sible. When surface area or particle size has been appropriatelyaltered, the solid is recombined with the rest of the waste.
8.6 Waste slurries need not be allowed to stand to permit the solidphase to settle. Wastes that settle slowly shall not be centrifuged prior tofiltration.
8.7 Transfer the entire sample (liquid and solid phases) quickly to theZHE. Secure the filter and support screens into the top flange of the deviceand secure the top flange to the ZHE body in accordance with the manufac-turer's instructions. Tighten all ZHE fittings and place the device in thevertical position (gas inlet/outlet flange on the bottom). Do not attach theextract collection device to the top plate.
NOTE: If waste material has obviously adhered to the container used totransfer the sample to the ZHE, determine the weight of this residue andsubtract it from the sample weight determined in Step 8.4, to determinethe weight of the waste sample that will be filtered.
Attach a gas line to the gas inlet/outlet valve (bottom flange), and withthe liquid inlet/outlet valve (top flange) open, begin applying gentlepressure of 1 to 10 psi (or more if necessary) to slowly force all head-space out of the ZHE device. At the first appearance of liquid from theliquid inlet/outlet valve, quickly close the valve and discontinuepressure.
8.8 Attach evacuated preweighed filtrate collection container to theliquid inlet/outlet value and open valve. Begin applying gentle pressure of1 to 10 psi to force the liquid phase into the filtrate collection container.If no additional liquid has passed through the filter in any 2-min interval,slowly increase the pressure in 10-psi increments to a maximum of 50 psi.After each incremental increase of 10 psi, if no additional liquid has passedthrough the filter in any 2-min interval, proceed to the next 10-psi incre-ment. When liquid flow has ceased such that continued pressure filtration at50 psi does not result in any additional filtrate within any 2-min period,filtration is stopped. Close the liquid inlet/outlet valve, discontinue pres-sure to the piston, and disconnect the filtrate collection container.
NOTE: Instantaneous application of high pressure can degrade the glassfiber filter and may cause premature plugging.
8.9 The material in the ZHE is defined as the solid phase of the waste,and the filtrate is defined as the liquid phase.
NOTE: Some wastes, such as oily wastes and some paint wastes, willobviously contain some material that appears to be a liquid; however,even after applying pressure filtration, this material will not filter.
If this is the case, the material within the filtration device is definedas a solid and is carried through the TCLP extraction as a solid.
104

If the original waste contained less than 0.5% solids (see Step 8.4),this filtrate is defined as the TCLP extraction and is analyzed directly.Proceed to Step 8.13.
8.10 Determine the weight of the liquid phase by subtracting the weightof the filtrate container (see Step 8.1) from the total weight of thefiltrate-filled container. The liquid phase may now be either analyzed (seeSteps 8.13 and 8.14) or stored at 40 C until time of analysis. The weight ofthe solid phase of the waste sample is determined by subtracting the weight ofthe liquid phase from the weight of the-total waste sample (see Step 8.4).Record the final weight of the liquid and solid phases.
8.11 The following paragraphs detail the addition of the appropriateamount of extraction fluid to the solid material within the ZHE and agitationof the ZHE vessel. Extraction fluid 1 is used in all cases (see Section 5.6).
8.11.1 With the ZHE in the vertical position, attach a line from theextraction-fluid reservoir to the liquid inlet/outlet valve. The line usedshall contain fresh extraction fluid and should be preflushed with fluid toeliminate any air pockets in the line. Release gas pressure on the ZHE piston(from the gas inlet/outlet valve), open the liquid inlet/outlet valve, andbegin transferring extraction fluid (by pumping or similar means) into theZHE. Continue pumping extraction fluid into the ZHE until the amount of fluidintroduced into the device equals 20 times the weight of the solid phase ofthe waste that is in the ZHE.
8.11.2. After the extraction fluid has been added, immediately close theliquid inlet/outlet valve and disconnect the extraction fluid line. Check theZHE to make sure that all valves are in their closed positions. Pick up theZHE and physically rotate the device in an end-over-end fashion 2 or 3 times.Reposition the ZHE in the vertical position with the liquid inlet/outlet valveon top. Put 5 to 10 psi behind the piston (if necessary), and slowly open theliquid inlet/outlet valve to bleed out any headspace (into a hood) that mayhave been introduced due to the addition of extraction fluid. This bleedingshall be done quickly and shall be stopped at the first appearance of liquidfrom the valve. Repressurize the ZHE with 5 to 10 psi and check all ZHE fit-tings to ensure that they are closed.
8.11.3 Place the ZHE in the rotary extractor apparatus (if it is notalready there) and rotate the ZHE at 30 ± 2 rpm for 18 hr. The temperatureshall be maintained at 220 + 30 C during agitation.
8.12 Following the 18-hr extraction, check the pressure behind the ZHEpiston by quickly opening and closing the gas inlet/outlet valve and notingthe escape of gas. If the pressure has not been maintained (i.e., no gasrelease observed), the device is leaking. Replace ZHE O-rings or otherfittings, as necessary, and redo the extraction with a new sample of waste.If the pressure within the device has been maintained, the material in theextractor vessel is once again separated into its component liquid and solidphases. If the waste contained an initial liquid phase, the liquid may befiltered directly into the same filtrate collection container (i.e. Tedlarbag, gas-tight syringe) holding the initial liquid phase of the waste, unlessdoing so would create multiple phases or there is not enough volume leftwithin the filtrate collection container. A separate filtrate collection con-tainer must be used in these cases. Filter through the glass fiber filter,
105
using the ZHE device as discussed in Step 8.8. All extract shall be filteredand collected if the extract is multiphasic or if the waste contained an ini-tial liquid phase.
NOTE: If the glass fiber filter is not intact following agitation, thefiltration device discussed in the Note to Section 4.3.1 may be used tofilter the material within the ZHE.
8.13 If the waste contained no initial liquid phase, the filtered liquidmaterial obtained from Step 8.12 is defined as the TCLP extract. If the wastecontained an initial liquid phase, the filtered liquid material obtained fromStep 8.12 and the initial liquid phase (Step 8.8) are collectively defined asthe TCLP extract.
8.14 The TCLP extract will be prepared and analyzed according to theappropriate SW-846 analytical methods, as identified in Appendix III of 40 CFR261. If the individual phases are to be analyzed separately, determine thevolume of the individual phases (to 0.1 ml), conduct the appropriate analyses,and combine the results mathematically by using a simple volume weightedaverage:
Final contaminant concentration - (V1)(C1) + (V2)(C2V1I + V 2
whereV, - volume of the first phase, litersC, - concentration of the contaminant of concern in the first phase,
milligrams per literV2 - volume of the second phase, litersC2 - concentration of the contaminant of concern in the second phase,
milligrams per liter
8.15 The contaminant concentrations in the TCLP extract are compared tothe thresholds identified in the appropriate regulations. Refer to Section 9for quality assurance requirements.
9.0 Quality Assurance Reouirements
9.: All data, including quality assurance data, should be maintained andavailable for reference or inspection.
9.2 A minimum of one blank for every 10 extractions that have been con-ducted in an extraction vessel shall be employed as a check to determine ifany memory effects from the extraction equipment are occurring. One blankshall also be employed for every new batch of leaching fluid that is made up.
9.3 All quality control measures described in the appropriate analyticalmethods shall be followed.
9.4 The method of standard addition shall be employed for each wastetype if recovery of the compound from spiked splits of the TCLP extract is notbetween 50% and 150% or if the concentration of the constituent measured inthe extract is within 20% of the appropriate regulatory threshold. If morethan one extraction is being run on samples of the same waste, the method of
106
standard addition need only be applied once and the percent recoveries appliedto the remainder of the extractions.
9.5 TCLP extracts shall be analyzed within the following periods aftergeneration: volatiles - 14 days: semivolatiles - 40 days; mercury - 28 days;other metals - 180 days.
107

APPENDIX C
LABORATORY DETERMINATION OF MOISTURE CONTENT OFHAZARDOUS WASTE MATERIALS
BACKGROUND
This method was developed to determine the mojsr':.e content of raw andsolidified/stabilized hazardous waste materials. Due to the wide diversity ofproperties which hazardous wastes may exhibit, this method cannot address, noris it applicable to, all waste types. Caution m -_ be utilized when applyingthis-method. It may be necessary to modify this tethod to address conditionsmandated by the waste. ASTM method D 2216-80 was utilized as a guide in pre-paring this method.
SIGNIFICANCE AND USE
The waste content of a material is defined as the ratio, expressed as apercentage, of the mass of "pore" or "free" water in a given mass of materialto the mass of the solid materials particles. A hazardous waste material maycontain various constituents which may artificially add or subtract from theresults of moisture content. Such variables include: (1) chemically boundwater (water of hydration) which may be released at relative low temperature,thus appearing as free water loss, (2) organic materials which oxidize at lowtemperature, and (3) any condition, except for "free" water loss, which mayincrease or decrease the weight of sample upon drying. Discretion must beutilized when applying this method to ensure such situations are consideredand steps are taken to provide results consistent with the purpose of thetest.
APPARATUS
Drying oven - thermostatically controlled, preferably of the forced-drafttype, and capable of maintaining a uniform temperature of 600 C in the dryingchamber. This oven should also be capable of maintaining approximately1100 C. If a forced-draft oven is used, the draft should not be strong enoughto "blow" any sample from the specimen container.
Balances - having a precision of +0.0001 g.
Specimen containers - suitable containers made of materials resistant to cor-rosion and a change in mass upon repeated heating and cooling.
Mortar and pestle - capable of reducing the particle .ize of the waste to2.0 a or less.
Sieve - a 2.0-mm (No. 10) sieve.
Desiccator - a desiccator of suitable size containing a hydrous compound.
109
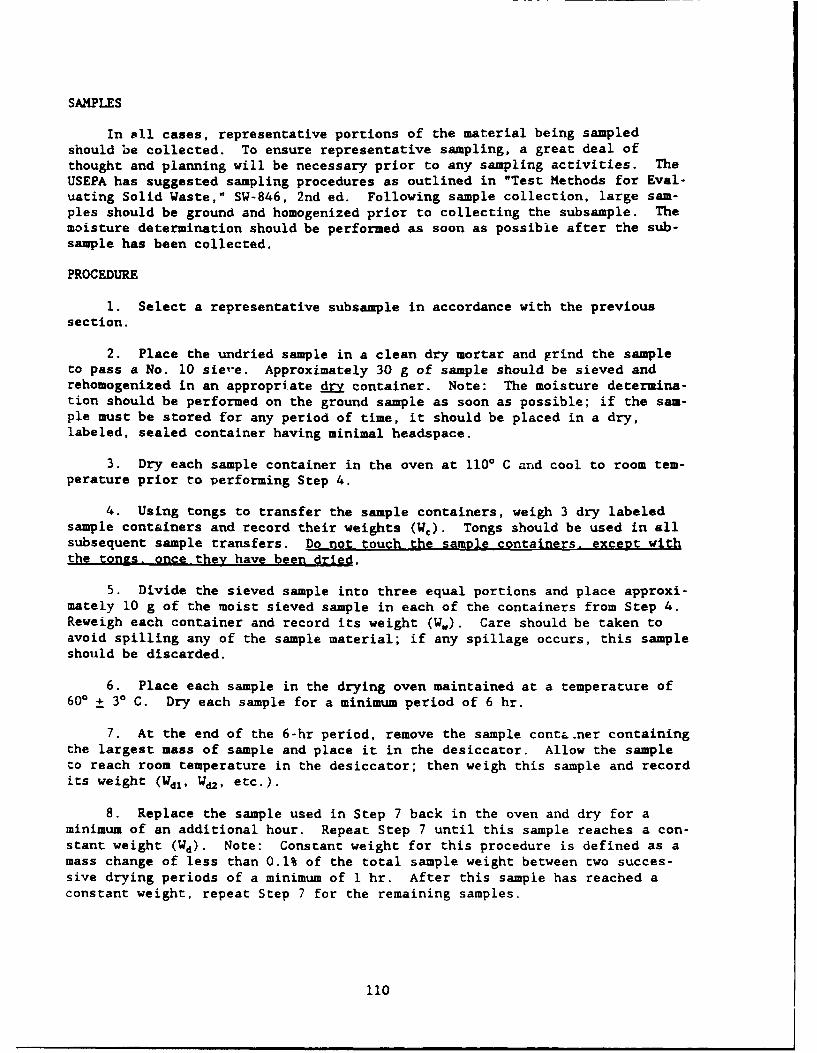
SAMPLES
In all cases, representative portions of the material being sampledshould be collected. To ensure representative sampling, a great deal ofthought and planning will be necessary prior to any sampling activities. TheUSEPA has suggested sampling procedures as outlined in "Test Methods for Eval-uating Solid Waste," SW-846, 2nd ed. Following sample collection, large sam-ples should be ground and homogenized prior to collecting the subsample. Themoisture determination should be performed as soon as possible after the sub-sample has been collected.
PROCEDURE
1. Select a representative subsample in accordance with the previoussection.
2. Place the undried sample in a clean dry mortar and grind the sampleto pass a No. 10 sieve. Approximately 30 g of sample should be sieved andrehomogenized in an appropriate = container. Note: The moisture determina-tion should be performed on the ground sample as soon as possible; if the sam-ple must be stored for any period of time, it should be placed in a dry,labeled, sealed container having minimal headspace.
3. Dry each sample container in the oven at 1100 C and cool to room tem-perature prior to performing Step 4.
4. Using tongs to transfer the sample containers, weigh 3 dry labeledsample containers and record their weights (W,). Tongs should be used in allsubsequent sample transfers. Do not touch the sample containers, except withthe tonzs. once they have been dried.
5. Divide the sieved sample into three equal portions and place approxi-mately 10 g of the moist sieved sample in each of the containers from Step 4.Reweigh each container and record its weight (W.). Care should be taken toavoid spilling any of the sample material; if any spillage occurs, this sampleshould be discarded.
6. Place each sample in the drying oven maintained at a temperature of600 + 30 C. Dry each sample for a minimum period of 6 hr.
7. At the end of the 6-hr period, remove the sample contL.ner containingthe largest mass of sample and place it in the desiccator. Allow the sampleto reach room temperature in the desiccator; then weigh this sample and recordits weight (Wdl, Wd, etc.).
8. Replace the sample used in Step 7 back in the oven and dry for aminimum of an additional hour. Repeat Step 7 until this sample reaches a con-stant weight (Wd). Note: Constant weight for this procedure is defined as amass change of less than 0.1% of the total sample weight between two succes-sive drying periods of a minimum of 1 hr. After this sample has reached aconstant weight, repeat Step 7 for the remaining samples.
110

CALCULATIONS
Calculate the constant weight as follows:
w.. - { •,1. - WdM] / WdD)} * 100 (C-1)
whereW,,t - constant weight of the largest sample expressed as a percentage
(W©,, must be less than 0.11)
Wd(1_,) - weight of the largest sample, one weighing before the finalconstant weight was taken, g
Wd(i) - weight of the largest sample at the final constant weight, g
e W- - Wd] ( (N. - WC] (C-2)
where
Mf - moisture content expressed as a percentage
W. - weight of the undried sample, g
we - weight of the dried sample container, g
M. N- +, .. + M.3)/3 (C-3)
whereMa - average moisture content expressed as a percentage
MF1,If2,0- moisture content of each sample
QUALITY CONTROL/QUALITY ASSURANCE
The following calculation is utilized to calculate the percent deviation(Pd):
Pd "- fI - M,)/M,) * 100
The percent deviation is calculated for each sample. If the percent deviationis greater than 2%, these data are discarded, and a complete moisture analysisis repeated.
REPORT
The report (data sheet) shall include the following:
I. Identification of the sample being tested, by sample number.
ill

2. Water content of the specimen, which is an average of three
specimens.
3. Any unusual characteristic of the sample that should be noted.
4. Any deviation from this protocol.
112
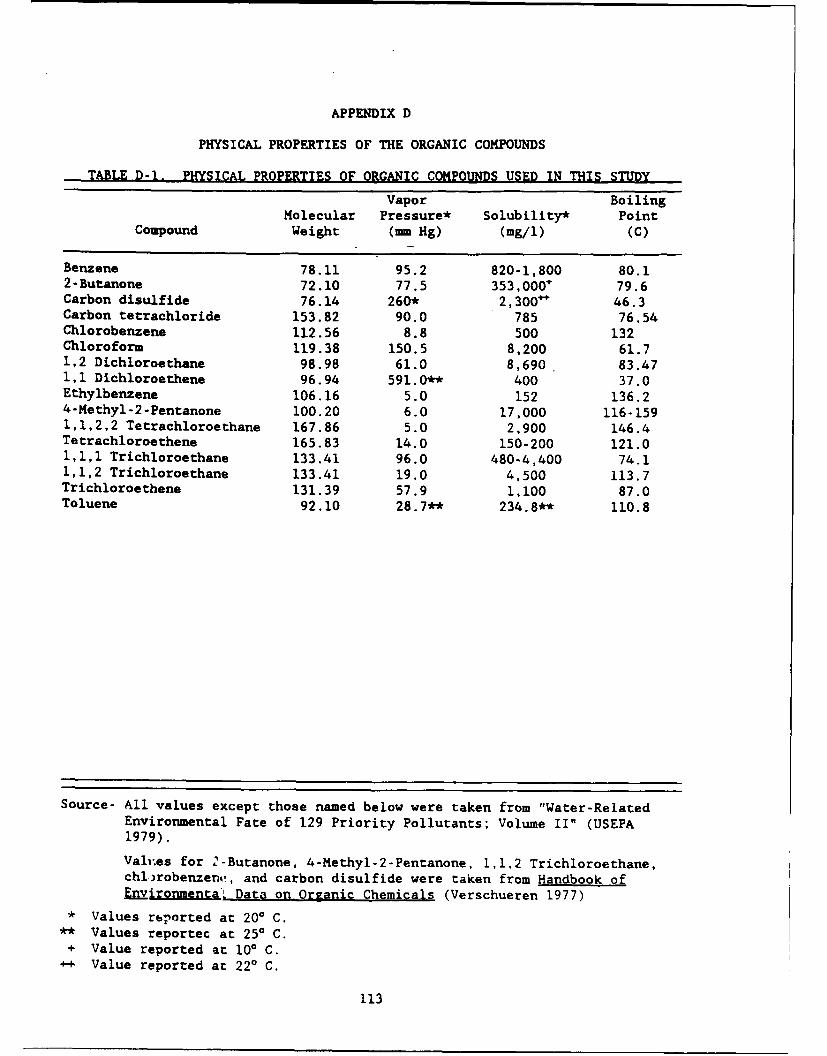
APPENDIX D
PHYSICAL PROPERTIES OF THE ORGANIC COMPOUNDS
TABLE D-1. PHYSICAL PROPERTIES OF ORGANIC COMPOUNDS USED IN THIS STUDY
Vapor BoilingMolecular Pressure* Solubility* Point
Compound Weight (mm Hg) (mg/i) (C)
Benzene 78.11 95.2 820-1,800 80.12-Butanone 72.10 77.5 353,000 79.6Carbon disulfide 76.14 260* 2,300- 46.3Carbon tetrachloride 153.82 90.0 785 76.54Chlorobenzene 112.56 8.8 500 132Chloroform 119.38 150.5 8,200 61.71,2 Dichloroethane 98.98 61.0 8,690 83.471,1 Dichloroethene 96.94 591.0** 400 37.0Ethylbenzene 106.16 5.0 152 136.24 -Methyl-2-Pentanone 100.20 6.0 17,000 116-1591,1,2,2 Tetrachloroethane 167.86 5.0 2,900 146.4Tetrachloroethene 165.83 14.0 150-200 121.01,1,1 Trichloroethane 133.41 96.0 480-4,400 74.11,1,2 Trichloroethane 133.41 19.0 4,500 113.7Trichloroethene 131.39 57.9 1,100 87.0Toluene 92.10 28.7** 234.8** 110.8
Source- All values except those named below were taken from "Water-RelatedEnvironmental Fate of 129 Priority Pollutants; Volume II" (USEPA1979).
Valr.es for 2-Butanone, 4-Methyl-2-Pentanone, 1,1,2 Trichloroethane,chlrobenzeno', and carbon disulfide were taken from Handbook offnmironmenta. Data on Organic Chemicals (Verschueren 1977)
* Values rbported at 200 C.** Values reportec at 250 C.
+ Value reported at 100 C.+-+ Value reported at 220 C.
113

APPENDIX E
STUDY A RAW DATA
TABLE E-1. TCLP AND EP EXTRACT ANALYSIS FOR CADMIUM
Extrac-tion NormalizedFluid*/ Extracted Extraction
Extrac- Acid Concen- Concentra-Interference Interference tion Added tration tion,
Compound Concentration Test Replicate (ml) (mg/i) (mg/kg)
Oil 0% EP R1 400 0.0208 0.000255R2 400 0.0206 0.000252
TCLP RI II 0.0073 0.000089R2 II 0.0015 0.000018
2% EP Ri 400 0.0033 0.000042R2 400 0.0034 0.000041
TCLP RI II 0.0015 0.000018P.2 II 0.0015 0.000018
5% EP RI 400 0.002 0.00002R2 400 0.0015 0.000018
TCLP RI II 0.0188 0.000230R2 II 0.0092 0.00011
8% EP RI 400 0.0031 0.000037R2 400 0.0041 0.000048
TCLP RI II 0.0138 0.000163R2 II 0.0021 0.000025
Crease 0% EP RI 400 <0.0001 0.000001R2 400 0.0171 0.000205
TCLP RI II 0.0002 0.000002R2 II 0.0007 0.000008
2% EP Ri 400 0.004 0.00005R2 400 0.0168 0.000198
TCLP RI II <0.0001 0.000001R2 II <0.0001 0.000001
5% EP RI 400 0.0022 0.000026R2 400 0.0094 0.00011
TCLP RI II <0.0001 0.000001R2 II 0.0003 0.000004
8% EP Ri 400 0.0072 0.000084R2 400 0.0135 0.000157
TCLP R1 II <0.0001 0.000001R2 II <0.0001 0.000001
(Continued)
* II - TCLP extraction fluid 2.
(Sheet 1 of 5)
115
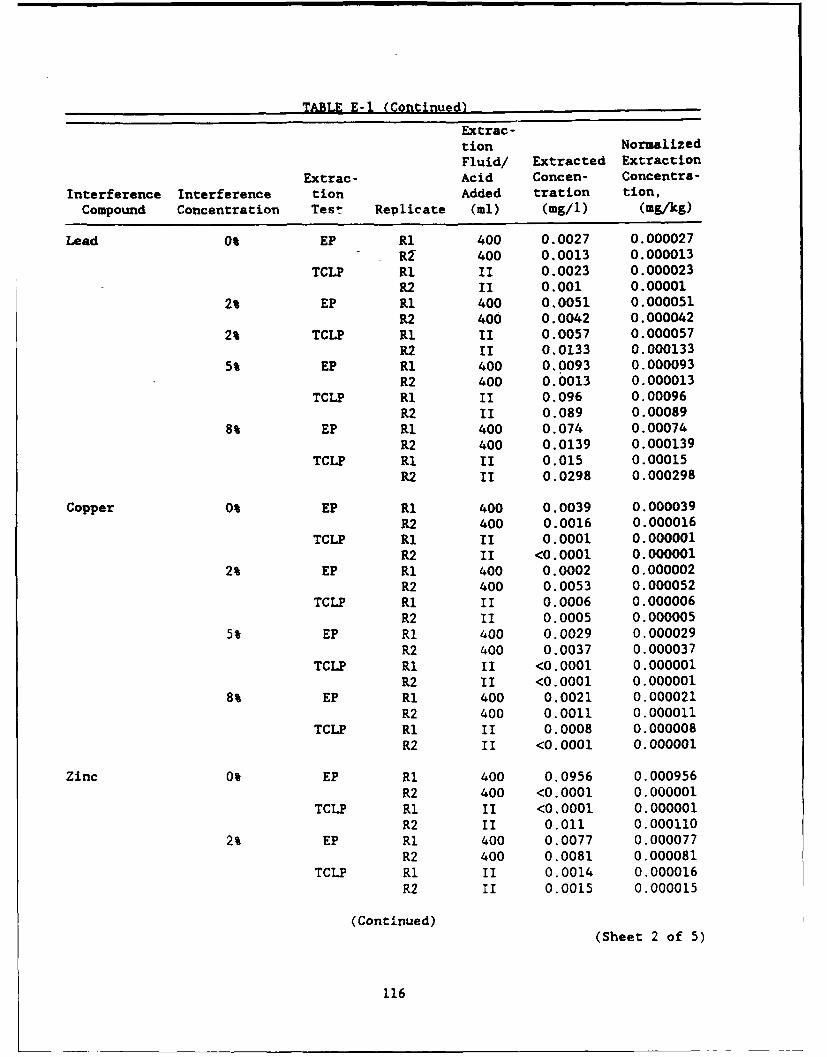
TABLE E-1 (Continued)
Extrac-
tion Normalized
Fluid/ Extracted ExtractionExtrac- Acid Concen- Concentra-
Interference Interference tion Added tration tion,Compound Concentration Tes'- Replicate (ml) (mg/i) (mg/kg)
Lead 01 EP RI 400 0.0027 0.000027- 400 0.0013 0.000013
TCLP R1 II 0.0023 0.000023R2 II 0.001 0.00001
2% EP R1 400 0.0051 0.000051R2 400 0.0042 0.000042
2% TCLP R1 II 0.0057 0.000057R2 II 0.0133 0.000133
5% EP Rl 400 0.0093 0.000093R2 400 0.0013 0.000013
TCLP Ri II 0.096 0.00096R2 II 0.089 0.00089
8% EP Ri 400 0.074 0.00074R2 400 0.0139 0.000139
TCLP RI II 0.015 0.00015R2 II 0.0298 0.000298
Copper 0% EP Ri 400 0.0039 0.000039R2 400 0.0016 0.000016
TCLP Rl II 0.0001 0.000001R2 II <0.0001 0.000001
2% EP Rl 400 0.0002 0.000002R2 400 0.0053 0.000052
TCLP Ri II 0.0006 0.000006R2 II 0.0005 0.000005
5% EP Ri 400 0.0029 0.000029R2 400 0.0037 0.000037
TCLP RI II <0.0001 0.000001R2 II <0.0001 0.000001
8% EP Ri 400 0.0021 0.000021R2 400 0.0011 0.000011
TCLP R1 II 0.0008 0.000008R2 II <0.0001 0.000001
Zinc 0% EP Ri 400 0.0956 0.000956R2 400 <0.0001 0.000001
TCLP R1 II <0.0001 0.000001R2 II 0.011 0.000110
2% EP RI 400 0.0077 0.000077R2 400 0.0081 0.000081
TCLP RI II 0.0014 0.000016R2 II 0.0015 0.000015
(Continued)(Sheet 2 of 5)
116
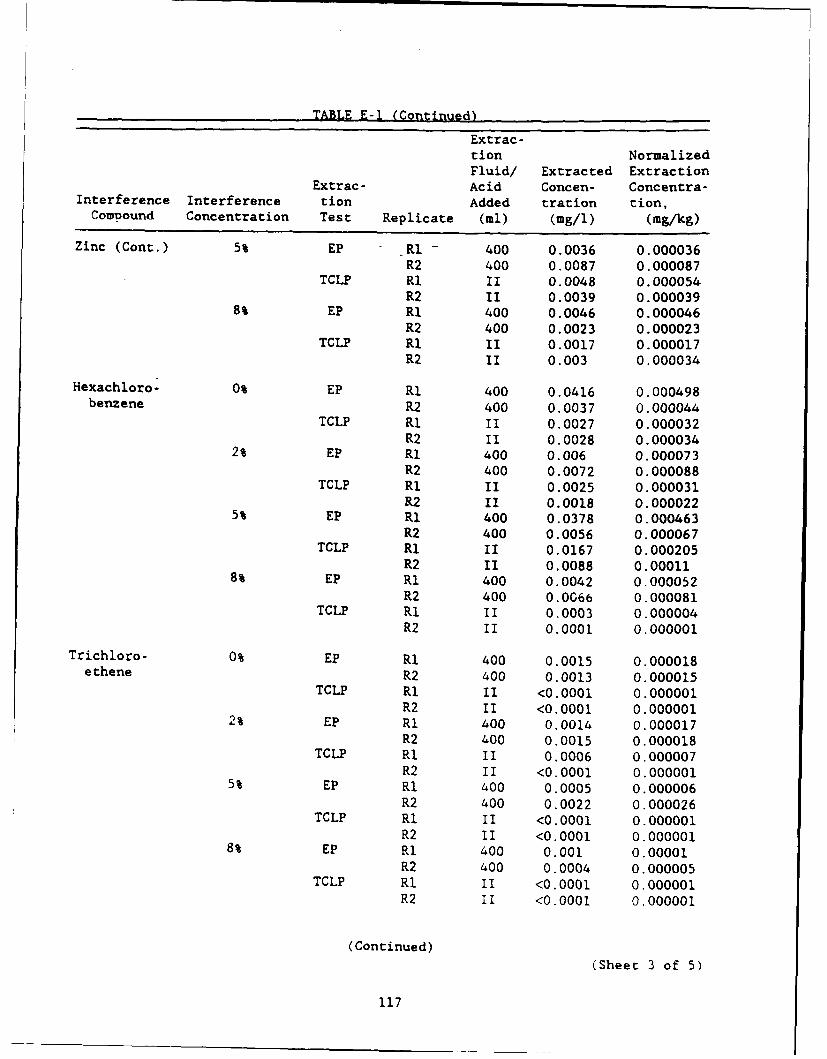
TABLE E-1 (Cotinued)
Extrac-tion NormalizedFluid/ Extracted Extraction
Extrac- Acid Concen- Concentra-Interference Interference tion Added tration tion,ComDound Concentration Test Replicate (ml) (mg/l) (mg/kg)
Zinc (Cont.) 5% EP _RI - 400 0.0036 0.000036R2 400 0.0087 0.000087
TCLP RI II 0.0048 0.000054R2 II 0.0039 0.000039
8% EP RI 400 0.0046 0.000046R2 400 0.0023 0.000023
TCLP RI II 0.0017 0.000017R2 II 0.003 0.000034
Hexachloro- 0% EP RI 400 0.0416 0.000498benzene R2 400 0.0037 0.000044
TCLP RI II 0.0027 0.000032R2 II 0.0028 0.000034
2% EP RI 400 0.006 0.000073R2 400 0.0072 0.000088
TCLP RI II 0.0025 0.000031R2 II 0.0018 0.000022
5% EP RI 400 0.0378 0.000463R2 400 0.0056 0.000067
TCLP RI II 0.0167 0.000205R2 II 0.0088 0.00011
8% EP RI 400 0.0042 0.000052R2 400 0.0066 0.000081
TCLP RI II 0.0003 0.000004R2 II 0.0001 0.000001
Trichloro- 0% EP RI 400 0.0015 0.000018ethene R2 400 0.0013 0.000015
TCLP RI II <0.0001 0.000001R2 II <0.0001 0.000001
2% EP RI 400 0.0014 0.000017R2 400 0.0015 0.000018
TCLP RI II 0.0006 0.000007R2 II <0.0001 0.000001
5% EP RI 400 0.0005 0.000006R2 400 0.0022 0.000026
TCLP RI II <0.0001 0.000001R2 II <0.0001 0.000001
8% EP RI 400 0.001 0.00001R2 400 0.0004 0.000005
TCLP RI II <0.0001 0.000001R2 II <0.0001 0.000001
(Continued)
(Sheet 3 of 5)
117

TABLE E-1 (Continued)
Extrac-tion NormalizedFluid/ Extracted Extraction
Extrac- Acid Concen- Concentra-Interference Interference tion Added tration tion,
Compound Concentration Test Replicate (ml) (mg/i) (mg/kg)
Phenol 0% EP Ri 400 0.0006 0.000007R2 400 0.0024 0.000029
TCLP R1 I1 0.0012 0.000015R2 II 0.0028 0.000034
2% EP R1 400 0.0014 0.000017R2 400 0.0028 0.000035
TCLP RI II 0.0022 0.000027R2 II 0.0061 0.000076
5% EP Ri 400 0.0067 0.000083R2 400 0.0026 0.000032
TCLP R1 II <0.0001 0.000001R2 Ii <0.0001 0.000001
8% EP R1 400 0.0048 0.000059R2 400 0.0026 0.000032
TCLP Ri II <0.0001 0.000001R2 II <0.0001 0.000001
Sodium 0% EP R1 400 0.0071 0.000084sulfate R2 400 0.0058 0.000069
TCLP RI II 0.0008 0.000009R2 II 0.0018 0.000021
2% EP RI 400 0.0057 0.000068R2 400 0.0091 0.00011
TCLP R1 II 0.0009 0.00001R2 II 0.0009 0.00001
5% EP Ri 400 0.002 0.00002R2 400 0.0115 0.000139
TCLP RI II 0.0009 0.00001R2 II 0.0010 0.00001
8% EP Ri 400 0.0106 0.000129R2 400 0.0063 0.000077
TCLP R1 II 0.0015 0.000018R2 II 0.0025 0.000030
Sodium 0Z EP R1 400 <0.0001 0.000001hydroxide R2 400 0.0011 0.000012
TCLP RI II 0.0004 0.000004R2 II <0.0001 0.000001
2% EP RI 400 0.0045 0.000053R2 400 0.0061 0.000071
TCLP R1 II 0.0002 0.000002R2 II 0.0004 0.000005
(Continued)
(Sheet 4 of 5)
118
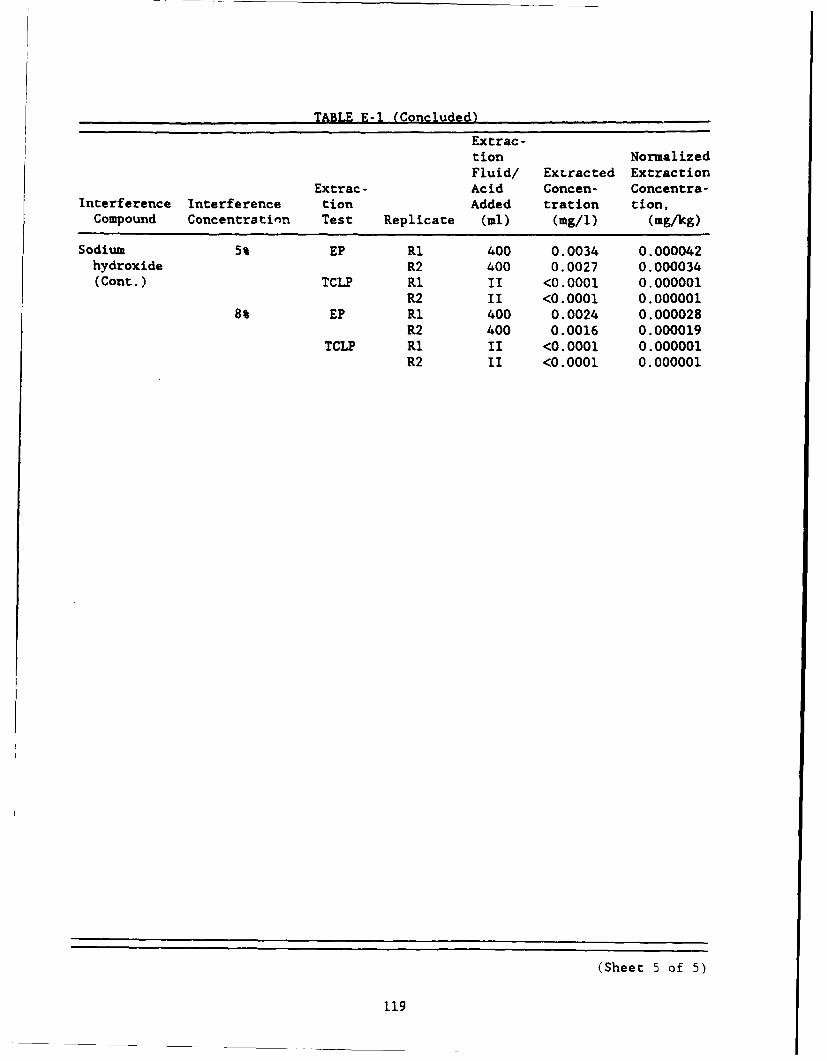
TABLE E-1 (Concluded)
Extrac-tion NormalizedFluid/ Extracted Extraction
Extrac- Acid Concen- Concentra-Interference Interference tion Added tration tion,
Compound Concentration Test Replicate (ml) (mg/i) (mg/kg)
Sodium 5% EP R1 400 0.0034 0.000042hydroxide R2 400 0.0027 0.000034(Cont.) TCLP R1 II <0.0001 0.000001
R2 II <0.0001 0.0000018% EP Ri 400 0.0024 0.000028
R2 400 0.0016 0.000019TCLP Ri II <0.0001 0.000001
R2 II <0.0001 0.000001
(Sheet 5 of 5)
119

TABLE E-2. TCLP AND EP EXTRACT ANALYSIS FOR CHROMIUM
Extrac-tion NormalizedFluid*/ Extracted Extraction
Extrac- Acid Concen- Concentra-Interference Interference tion Added tration tion,
Compound Concentration Test Replicate (ml) (mg/l) (mg/kg)
Oil 0% EP R1 400 0.044 0.00054R2 400 0.036 0.00044
TCLP RI 1I 0.147 0.00180R2 II 0.037 0.00045
2% EP R1 400 0.015 0.00018R2 400 0.019 0.00023
TCLP R1 II 0.007 0.00009R2 II 0.114 0.00141
5% EP R1 400 0.036 0.00044R2 400 0.024 0.00029
TCLP R1 II 0.007 0.00009R2 II 0.030 0.0004
8% EP Ri 400 0.004 0.00004R2 400 0.030 0.0003
TCLP R1 II 0.046 0.00054R2 II 0.044 0.00052
Grease 0% EP Ri 400 0.284 0.00340R2 400 0.209 0.00250
TCLP RI II 0.049 0.00059R2 II 0.039 0.00047
2% EP RI 400 0.061 0.00072R2 400 0.043 0.00051
TCLP R1 II 0.012 0.00014R2 II 0.01 0.0001
5% EP RI 400 0.062 0.00073R2 400 0.034 0.00040
TCLP RI II 0.04 0.0005R2 II 0.017 0.00020
8% EP R1 400 0.03 0.0003R2 400 0.036 0.00042
TCLP RI II 0.014 0.00016R2 II 0.015 0.00017
Lead 0% EP Ri 400 0.033 0.00033R2 400 0.065 0.00065
TCLP R1 II 0.046 0.00046R2 II 0.055 0.00055
2% EP R1 400 0.044 0.00044R2 400 0.029 0.00029
(Continued)
* lI TCLP extraction fluid 2.
(Sheet I of 4)
120

TABLE E-2 (Continued)
Extrac-tion NormalizedFluid/ Extracted Extraction
Extrac- Acid Concen- Concentra-Interference Interference tion Added tration tion,
Compound Concentration Test Replicate (ml) (mg/i) (mg/kg)
Lead (Cont.) 2% TCLP RI II 0.058 0.00058R2 II 0.055 0.00055
5% EP RI 400 0.031 0.00031R2 400 0.029 0.00029
TCLP RI II 0.047 0.00047R2 II 0.04 0.00040
8% EP RI 400 0.03 0.0003R2 400 0.03 0.0003
TCLP RI II 0.038 0.00038R2 II 0.085 0.00085
Copper 0% EP RI 400 0.01 0.0001R2 400 0.009 0.00009
TCLP R1 II 0.038 0.00038R2 II 0.039 0.00039
2% EP Ri 400 0.114 0.00114R2 400 0.061 0.00061
TCLP RI II 0.071 0.00071R2 II 0.065 0.00065
5% EP RI 400 0.038 0.00038R2 400 0.034 0.00034
TCLP RI II 0.048 0.00048R2 II 0.049 0.00049
8% EP R1 400 0.011 0.00011R2 400 0.01 0.0001
TCLP R1 II 0.043 0.00043R2 II 0.049 0.00049
Zinc 0% EP RI 400 0.051 0.00051R2 400 0.019 0.00019
TCLP R1 I1 0.071 0.00080R2 II 0.065 0.00065
2% EP R1 400 0.047 0.00047R2 400 0.044 0.00044
TCLP RI II 0.062 0.00070
R2 II 0.062 0.000625% EP RI 400 0.098 0.00098
R2 400 0.07 0.0007TCLP R1 II 0.1 0.001
R2 II 0.096 0.000968% EP RI 400 0.09 0.0009
R2 400 0.101 0.00101TCLP R1 II 0.095 0.00095
-93 0.0010
(Continued)(Sheet 2 of 4)
121
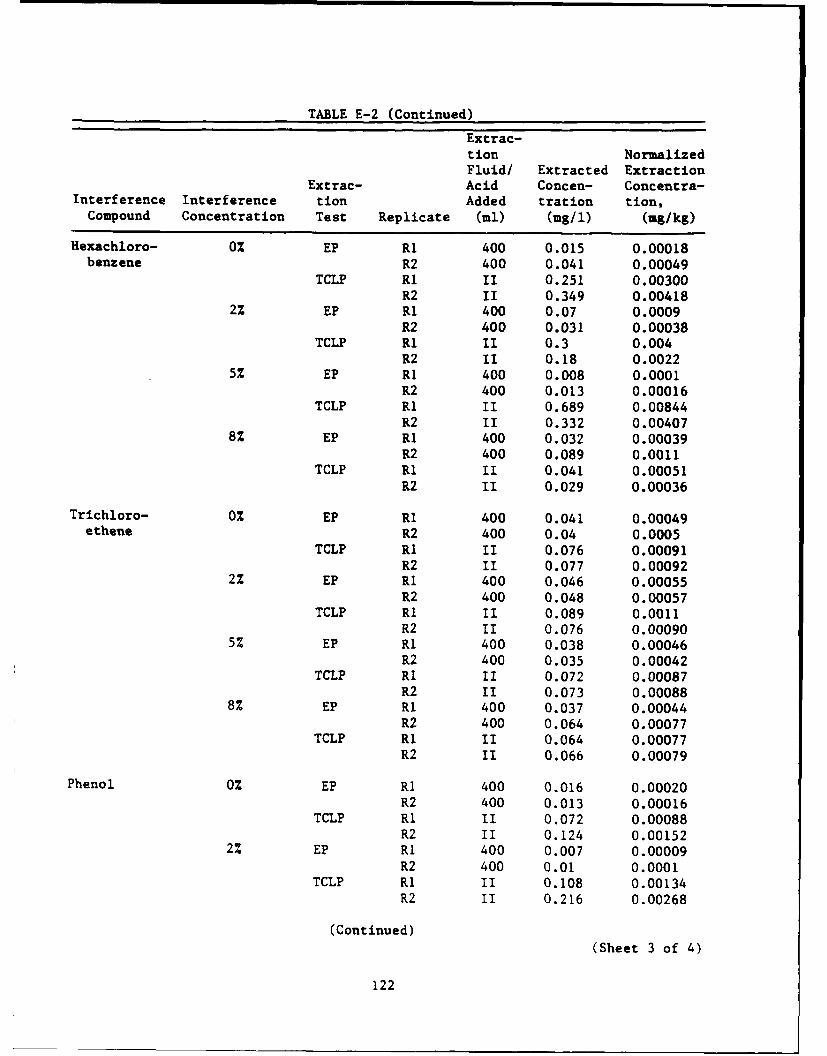
TABLE E-2 (Continued)
Extrac-tion NormalizedFluid/ Extracted Extraction
Extrac- Acid Concen- Concentra-Interference Interference tion Added tration tion,
Compound Concentration Test Replicate (ml) (mg/i) (mg/kg)
Hexachloro- 0% EP R1 400 0.015 0.00018benzene R2 400 0.041 0.00049
TCLP RI II 0.251 0.00300R2 II 0.349 0.00418
2% EP R1 400 0.07 0.0009R2 400 0.031 0.00038
TCLP RI II 0.3 0.004R2 II 0.18 0.0022
5% EP Ri 400 0.008 0.0001R2 400 0.013 0.00016
TCLP R1 II 0.689 0.00844R2 El 0.332 0.00407
8% EP R1 400 0.032 0.00039R2 400 0.089 0.0011
TCLP R1 II 0.041 0.00051R2 II 0.029 0.00036
Trichloro- 0% EP R1 400 0.041 0.00049ethene R2 400 0.04 0.0005
TCLP RI II 0.076 0.00091R2 II 0.077 0.00092
2Z EP Ri 400 0.046 0.00055R2 400 0.048 0.00057
TCLP R1 II 0.089 0.0011R2 II 0.076 0.00090
5% EP Ri 400 0.038 0.00046R2 400 0.035 0.00042
TCLP RI II 0.072 0.00087R2 II 0.073 0.00088
8% EP RI 400 0.037 0.00044R2 400 0.064 0.00077
TCLP RI II 0.064 0.00077R2 II 0.066 0.00079
Phenol 0% EP Ri 400 0.016 0.00020R2 400 0.013 0.00016
TCLP R1 II 0.072 0.00088R2 II 0.124 0.00152
2% EP R1 400 0.007 0.00009R2 400 0.01 0.0001
TCLP RI II 0.108 0.00134R2 II 0.216 0.00268
(Continued)(Sheet 3 of 4)
122
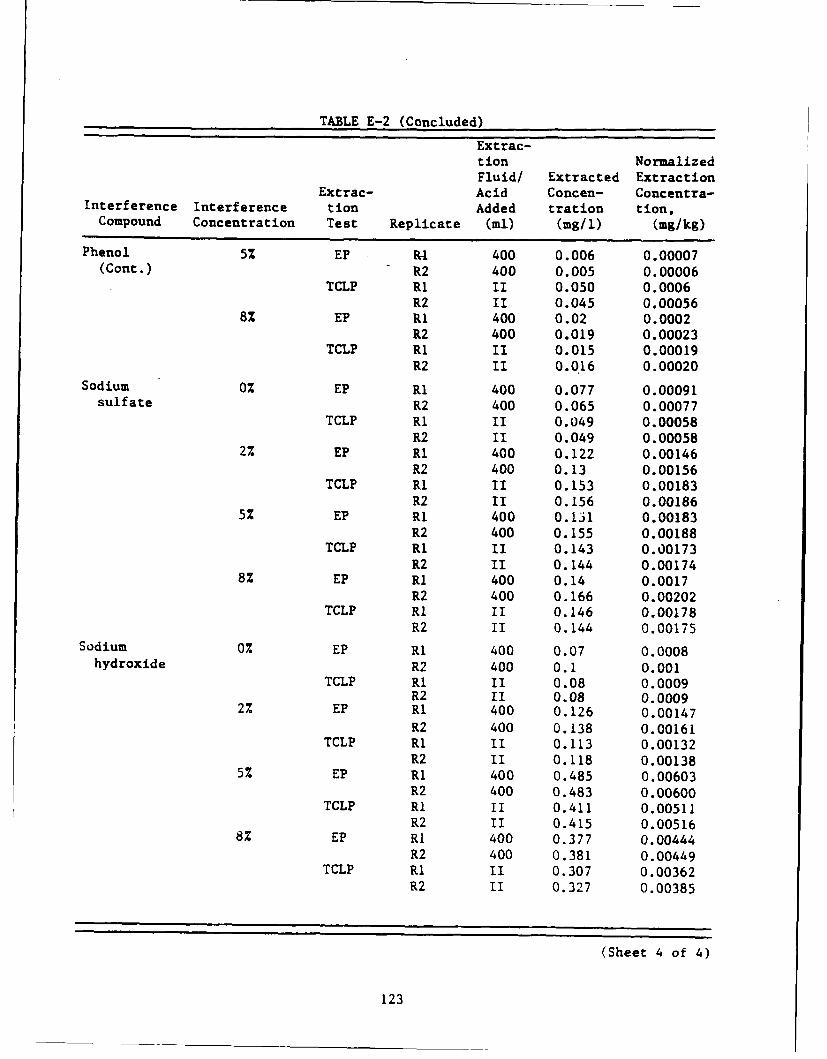
TABLE E-2 (Concluded)
Extrac-tion NormalizedFluid/ Extracted Extraction
Extrac- Acid Concen- Concentra-Interference Interference tion Added tration tion,
Compound Concentration Test Replicate (ml) (mg/i) (mg/kg)
Phenol 5% EP R-1 400 0.006 0.00007(Cont.) R2 400 0.005 0.00006
TCLP R1 I1 0.050 0.0006R2 II 0.045 0.00056
8% EP Ri 400 0.02 0.0002R2 400 0.019 0.00023
TCLP RI II 0.015 0.00019R2 II 0.016 0.00020
Sodium 0% EP RI 400 0.077 0.00091sulfate R2 400 0.065 0.00077
TCLP R1 II 0.049 0.00058R2 II 0.049 0.00058
2% EP R1 400 0.122 0.00146R2 400 0.13 0.00156
TCLP RI II 0.153 0.00183R2 II 0.156 0.00186
5% EP R1 400 0.15i 0.00183R2 400 0.155 0.00188
TCLP RI II 0.143 0.00173R2 II 0.144 0.00174
8% EP RI 400 0.14 0.0017R2 400 0.166 0.00202
TCLP R1 II 0.146 0.00178R2 II 0.144 0.00175
Sodium 0% EP R1 400 0.07 0.0008hydroxide R2 400 0.1 0.001
TCLP RI II 0.08 0.0009R2 II 0.08 0.0009
2% EP R1 400 0.126 0.00147R2 400 0.138 0.00161
TCLP RI II 0.113 0.00132R2 II 0.118 0.00138
5% EP R1 400 0.485 0.00603R2 400 0.483 0.00600
TCLP RI II 0.411 0.00511R2 1l 0.415 0.00516
8% EP RI 400 0.377 0.00444R2 400 0.381 0.00449
TCLP RI II 0.307 0.00362R2 II 0.327 0.00385
(Sheer 4 of 4)
123
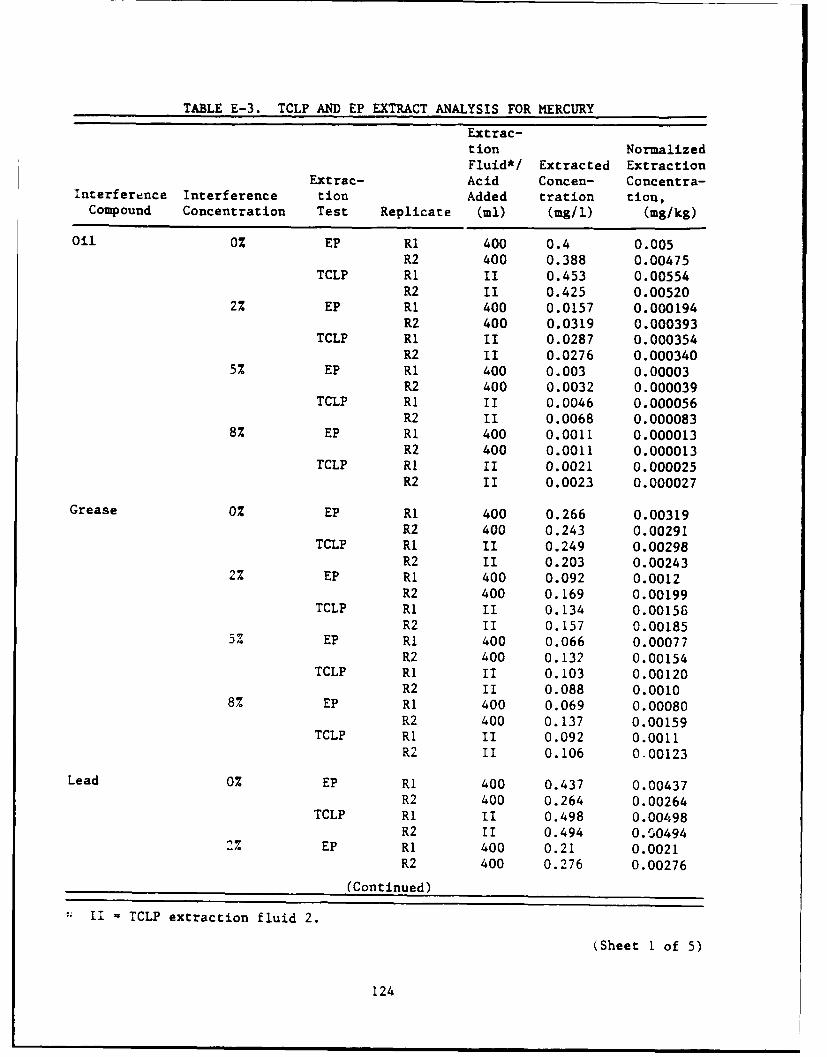
TABLE E-3. TCLP AND EP EXTRACT ANALYSIS FOR MERCURY
Extrac-tion NormalizedFluid*/ Extracted Extraction
Extrac- Acid Concen- Concentra-Interference Interference tion Added tration tion,
Compound Concentration Test Replicate (ml) (mg/i) (mg/kg)
Oil 0% EP RI 400 0.4 0.005R2 400 0.388 0.00475
TCLP R1 II 0.453 0.00554R2 II 0.425 0.00520
2% EP R1 400 0.0157 0.000194R2 400 0.0319 0.000393
TCLP R1 II 0.0287 0.000354R2 II 0.0276 0.000340
5% EP R1 400 0.003 0.00003R2 400 0.0032 0.000039
TCLP RI II 0.0046 0.000056R2 El 0.0068 0.000083
8% EP RI 400 0.0011 0.000013R2 400 0.0011 0.000013
TCLP RI II 0.0021 0.000025R2 II 0.0023 0.000027
Grease 0% EP R1 400 0.266 0.00319R2 400 0.243 0.00291
TCLP RI II 0.249 0.00298R2 II 0.203 0.00243
2% EP R1 400 0.092 0.0012R2 400 0.169 0.00199
TCLP RI II 0.134 0.00158R2 II 0.157 0.00185
5% EP RI 400 0.066 0.00077R2 400 0.132 0.00154
TCLP R1 II 0.103 0.00120R2 II 0.088 0.0010
8% EP R1 400 0.069 0.00080R2 400 0.137 0.00159
TCLP Ri II 0.092 0.0011R2 II 0.106 0.00123
Lead 0% EP RI 400 0.437 0.00437R2 400 0.264 0.00264
TCLP R1 II 0.498 0.00498R2 II 0.494 0.00494
2% EP R1 400 0.21 0.0021R2 400 0.276 0.00276
(Continued)
"U I =TCLP extraction fluid 2.
(Sheet 1 of 5)
124
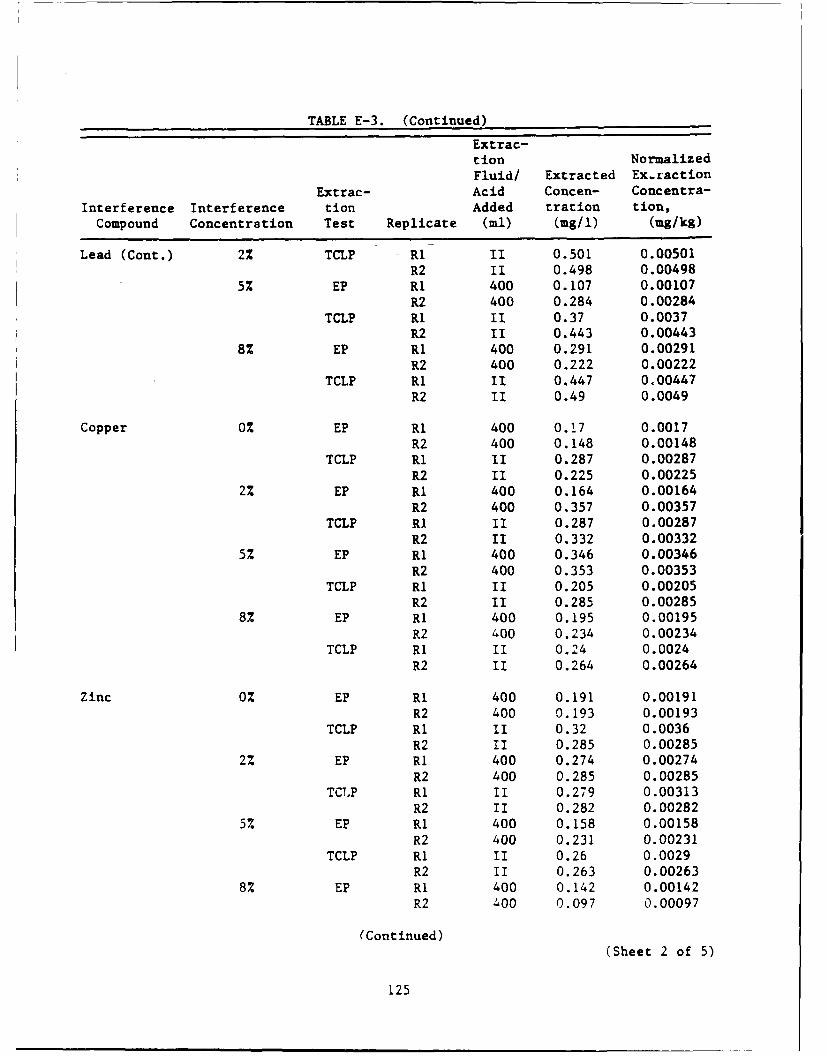
TABLE E-3. (Continued)
Extrac-tion NormalizedFluid/ Extracted Ex.raction
Extrac- Acid Concen- Concentra-Interference Interference tion Added tration tion,
Compound Concentration Test Replicate (ml) (mg/i) (mg/kg)
Lead (Cont.) 2% TCLP RI II 0.501 0.00501R2 II 0.498 0.00498
5% EP Ri 400 0.107 0.00107R2 400 0.284 0.00284
TCLP RI II 0.37 0.0037R2 II 0.443 0.00443
8% EP Ri 400 0.291 0.00291R2 400 0.222 0.00222
TCLP Ri II 0.447 0.00447R2 II 0.49 0.0049
Copper 0% EP Ri 400 0.!7 0.0017R2 400 0.148 0.00148
TCLP RI II 0.287 0.00287R2 II 0.225 0.00225
2% EP RI 400 0.164 0.00164
R2 400 0.357 0.00357TCLP RI II 0.287 0.00287
R2 II 0.332 0.003325% EP Ri 400 0.346 0.00346
R2 400 0.353 0.00353TCLP RI II 0.205 0.00205
R2 II 0.285 0.002858% EP R1 400 0.195 0.00195
R2 400 0.234 0.00234TCLP R1 II 0.24 0.0024
R2 II 0.264 0.00264
Zinc 0% EP Ri 400 0.191 0.00191R2 400 0.193 0.00193
TCLP RI II 0.32 0.0036R2 II 0.285 0.00285
2% EP R1 400 0.274 0.00274
R2 400 0.285 0.00285TCLP RI II 0.279 0.00313
R2 II 0.282 0.002825% EP R1 400 0.158 0.00158
R2 400 0.231 0.00231TCLP R1 II 0.26 0.0029
R2 II 0.263 0.002638% EP Ri 400 0.142 0.00142
R2 400 0.097 0.00097
(Continued)(Sheet 2 of 5)
125
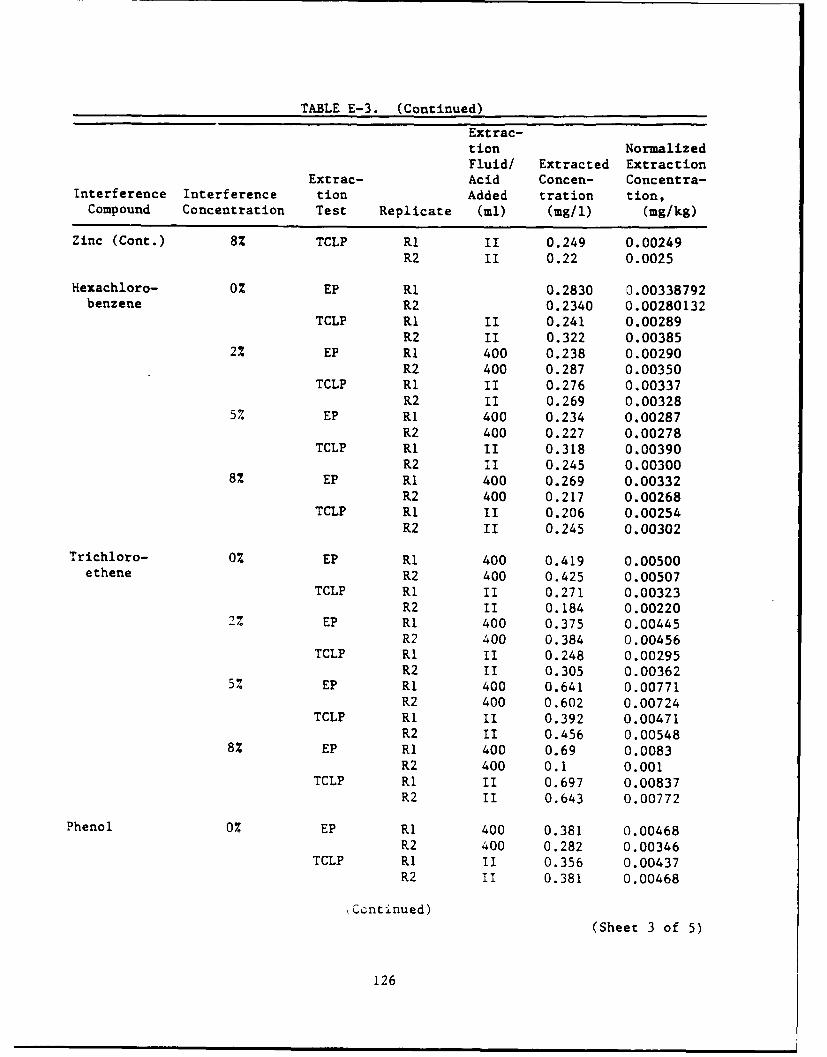
TABLE E-3. (Continued)
Extrac-tion NormalizedFluid/ Extracted Extraction
Extrac- Acid Concen- Concentra-Interference Interference tion Added tration tion,
Compound Concentration Test Replicate (ml) (mg/i) (mg/kg)
Zinc (Cont.) 8% TCLP R1 II 0.249 0.00249R2 II 0.22 0.0025
Hexachloro- 0% EP RI 0.2830 0.00338792benzene R2 0.2340 0.00280132
TCLP R1 1I 0.241 0.00289R2 II 0.322 0.00385
2% EP RI 400 0.238 0.00290R2 400 0.287 0.00350
TCLP RI II 0.276 0.00337R2 II 0.269 0.00328
5% EP RI 400 0.234 0.00287R2 400 0.227 0.00278
TCLP Ri II 0.318 0.00390R2 II 0.245 0.00300
8% EP Ri 400 0.269 0.00332R2 400 0.217 0.00268
TCLP Rl II 0.206 0.00254R2 II 0.245 0.00302
Trichloro- 0% EP RI 400 0.419 0.00500ethene R2 400 0.425 0.00507
TCLP Ri II 0.271 0.00323R2 II 0.184 0.00220
2% EP Ri 400 0.375 0.00445R2 400 0.384 0.00456
TCLP Ri II 0.248 0.00295R2 II 0.305 0.00362
5% EP Ri 400 0.641 0.00771R2 400 0.602 0.00724
TCLP RI II 0.392 0.00471R2 II 0.456 0.00548
8% EP Ri 400 0.69 0.0083R2 400 0.1 0.001
TCLP RI II 0.697 0.00837R2 II 0.643 0.00772
Phenol 0% EP Ri 400 0.381 0.00468R2 400 0.282 0.00346
TCLP Ri II 0.356 0.00437R2 II 0.381 0.00468
Ccntinued)(Sheet 3 of 5)
126
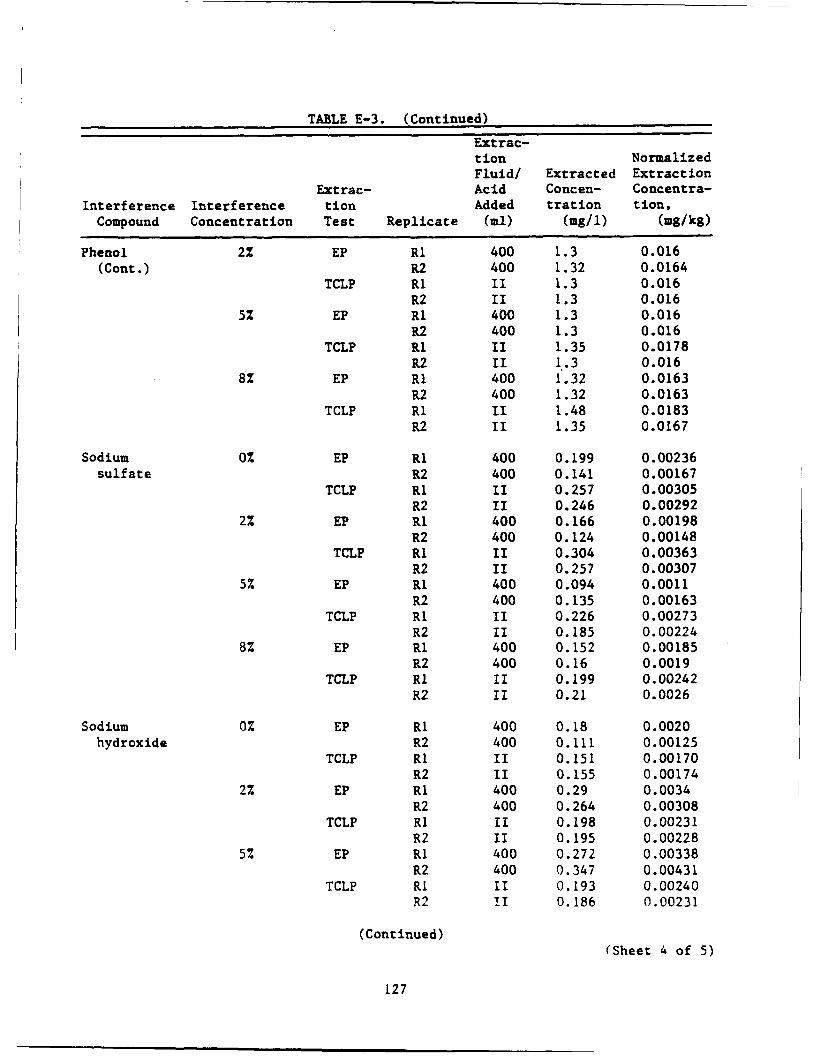
TABLE E-3. (Continued)
Extrac-tion NormalizedFluid/ Extracted Extraction
Extrac- Acid Concen- Concentra-Interference Interference tion Added tration tion,
Compound Concentration Test Replicate (ml) (mg/i) (mg/kg)
Phenol 2% EP RI 400 1.3 0.016(Cont.) R2 400 1.32 0.0164
TCLP RI II 1.3 0.016R2 II 1.3 0.016
5% EP RI 400 1.3 0.016R2 400 1.3 0.016
TCLP RI II 1.35 0.0178R2 II 1.3 0.016
8% EP RI 400 1.32 0.0163R2 400 1.32 0.0163
TCLP RI II 1.48 0.0183R2 II 1.35 0.0167
Sodium 0% EP R1 400 0.199 0.00236sulfate R2 400 0.141 0.00167
TCLP RI II 0.257 0.00305R2 II 0.246 0.00292
2% EP RI 400 0.166 0.00198R2 400 0.124 0.00148
TCLP RI II 0.304 0.00363R2 II 0.257 0.00307
5% EP Ri 400 0.094 0.0011R2 400 0.135 0.00163
TCLP R1 II 0.226 0.00273R2 II 0.185 0.00224
8% EP Ri 400 0.152 0.00185R2 400 0.16 0.0019
TCLP RI II 0.199 0.00242R2 II 0.21 0.0026
Sodium 0% EP R1 400 0.18 0.0020hydroxide R2 400 0.111 0.00125
TCLP RI II 0.151 0.00170R2 II 0.155 0.00174
2% EP R1 400 0.29 0.0034R2 400 0.264 0.00308
TCLP RI II 0.198 0.00231R2 II 0.195 0.00228
5% EP RI 400 0.272 0.00338R2 400 0.347 0.00431
TCLP RI II 0.193 0.00240R2 II 0.186 0.00231
(Continued)
(Sheet 4 of 5)
127
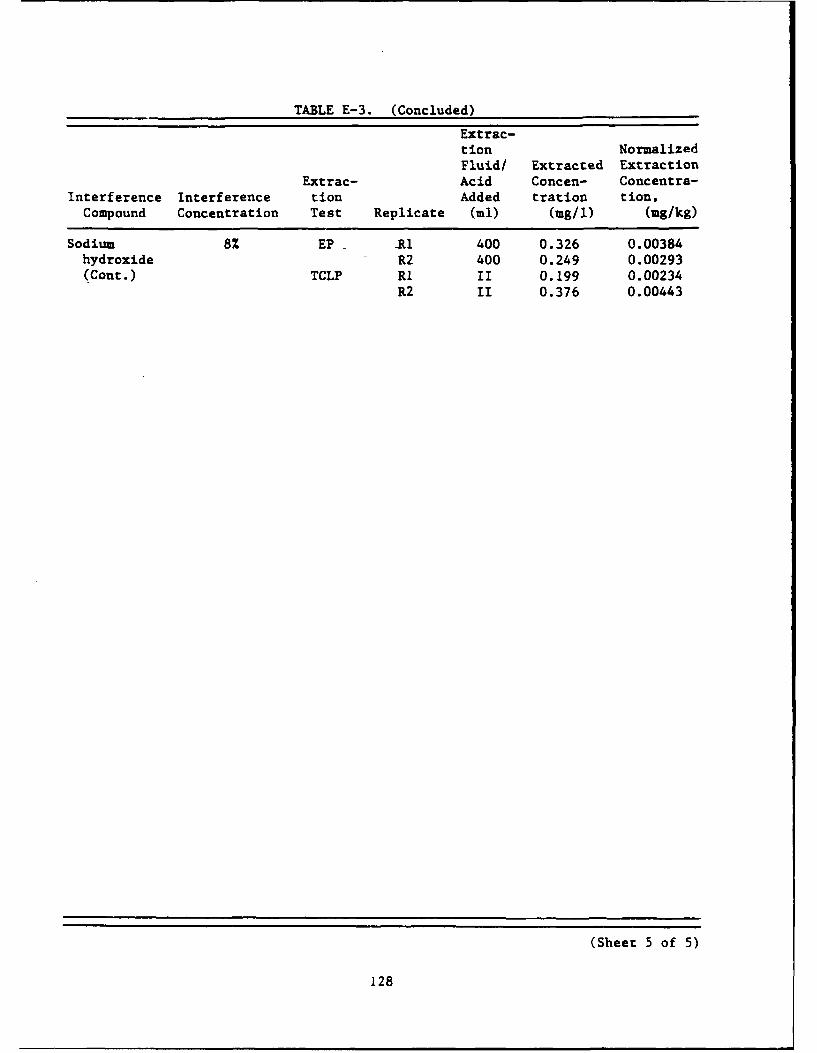
TABLE E-3. (Concluded)
Extrac-tion NormalizedFluid/ Extracted Extraction
Extrac- Acid Concen- Concentra-Interference Interference tion Added tration tion,
Compound Concentration Test Replicate (ml) (mg/i) (mg/kg)
Sodium 8% EP R1 400 0.326 0.00384hydroxide R2 400 0.249 0.00293(Cont.) TCLP RI II 0.199 0.00234
R2 II 0.376 0.00443
(Sheet 5 of 5)
128
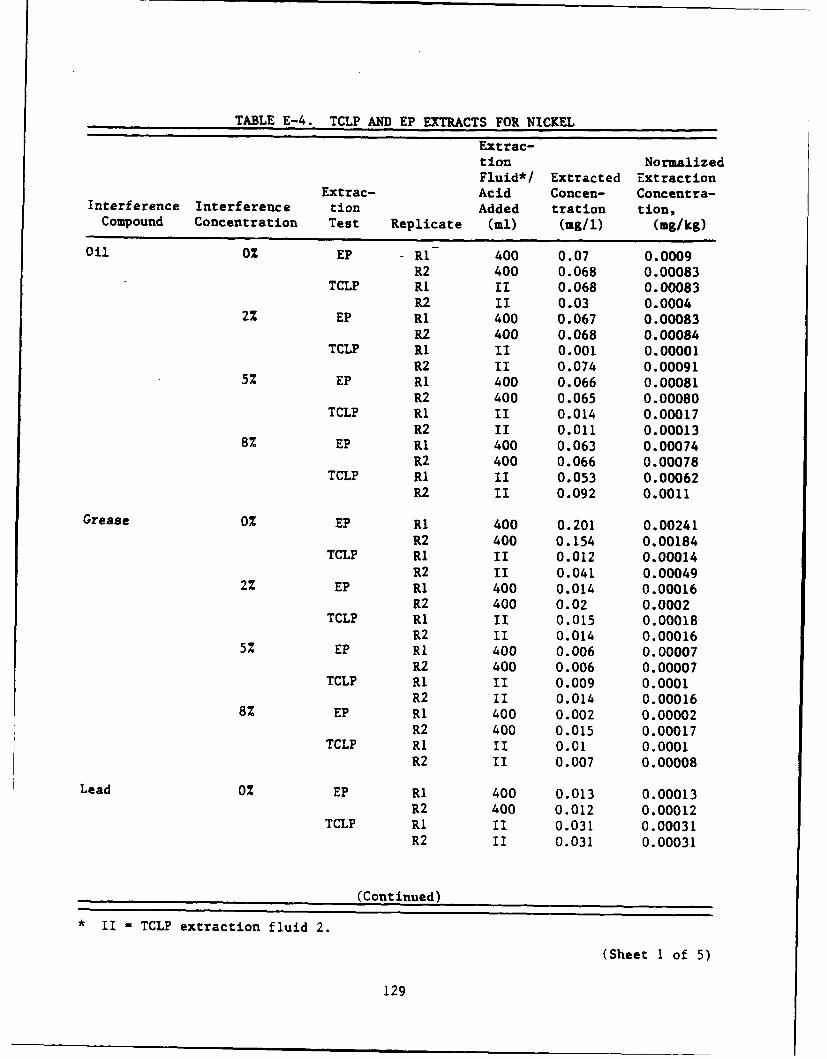
TABLE E-4. TCLP AND EP EXTRACTS FOR NICKEL
Extrac-tion NormalizedFluid*/ Extracted Extraction
Extrac- Acid Concen- Concentra-Interference Interference tion Added tration tion,
Compound Concentration Test Replicate (ml) (mg/1) (mg/kg)
Oil 0% EP RI 400 0.07 0.0009R2 400 0.068 0.00083
TCLP RI II 0.068 0.00083R2 I1 0.03 0.0004
2% EP RI 400 0.067 0.00083
R2 400 0.068 0.00084TCLP RI II 0.001 0.00001
R2 II 0.074 0.000915% EP RI 400 0.066 0.00081
R2 400 0.065 0.00080TCLP R1 II 0.014 0.00017
R2 II 0.011 0.000138% EP Ri 400 0.063 0.00074
R2 400 0.066 0.00078TCLP RI II 0.053 0.00062
R2 II 0.092 0.0011
Grease 0% EP Ri 400 0.201 0.00241
R2 400 0.154 0.00184TCLP RI II 0.012 0.00014
R2 II 0.041 0.000492% EP R1 400 0.014 0.00016
R2 400 0.02 0.0002TCLP RI II 0.015 0.00018
R2 1I 0.014 0.000165% EP R1 400 0.006 0.00007
R2 400 0.006 0.00007TCLP R1 II 0.009 0.0001
R2 II 0.014 0.000168% EP Ri 400 0.002 0.00002
R2 400 0.015 0.00017TCLP RI II 0.01 0.0001
R2 II 0.007 0.00008
Lead 0% EP Ri 400 0.013 0.00013R2 400 0.012 0.00012
TCLP RI II 0.031 0.00031R2 II 0.031 0.00031
(Continued)
* II - TCLP extraction fluid 2.
(Sheet i of 5)
129

TABLE E-4. (Continued)
Extrac-tion NormalizedFluid/ Extracted Extraction
Extrac- Acid Concen- Concentra-Interference Interference tion Added tration tion,
Compound Concentration Test Replicate (ml) (mg/i) (mg/kg)
Lead (Cont.) 2% EP RI 400 0.005 0.00005R2 400 0.012 0.00012
TCLP Ri II 0.015 0.00015R2 II 0.015 0.00015
5% EP RI 400 0.009 0.00009R2 400 0.006 0.00006
TCLP RI II 0.052 0.00052R2 II 0.043 0.00043
8% EP RI 400 0.026 0.00026R2 400 0.024 0.00024
TCLP RI II 0.073 0.00073R2 II 0.117 0.00117
Copper 0% EP Ri 400 0.012 0.00012R2 400 0.022 0.00022
TCLP RI II 0.03 0.00030R2 II 0.013 0.00013
2% EP Ri 400 0.014 0.00014R2 400 0.033 0.00033
TCLP RI II 0.035 0.00035R2 II 0.022 0.00022
5% EP Ri 400 0.011 0.00011R2 400 0.018 0.00018
TCLP RI II 0.044 0.00044R2 II 0.012 0.00012
8% EP Ri 400 0.018 0.00018R2 400 0.017 0.00017
TCLP RI II 0.079 0.00079R2 II 0.024 0.00024
Zinc 0% EP R1 400 0.066 0.00066R2 400 0.064 0.00064
TCLP R1 II 0.036 0.00040R2 EI 0.03 0.00030
2% EP R1 400 0.084 0.00084R2 400 0.098 0.00098
TCLP RI II 0.0006 0.000007R2 II 0.006 0.00006
5% EP R1 400 0.089 0.00089R2 400 0.095 0.00095
TCLP R1 II 0.011 0.00012R2 II 0.011 0.00011
(Continued)(Sheet 2 of 5)
130
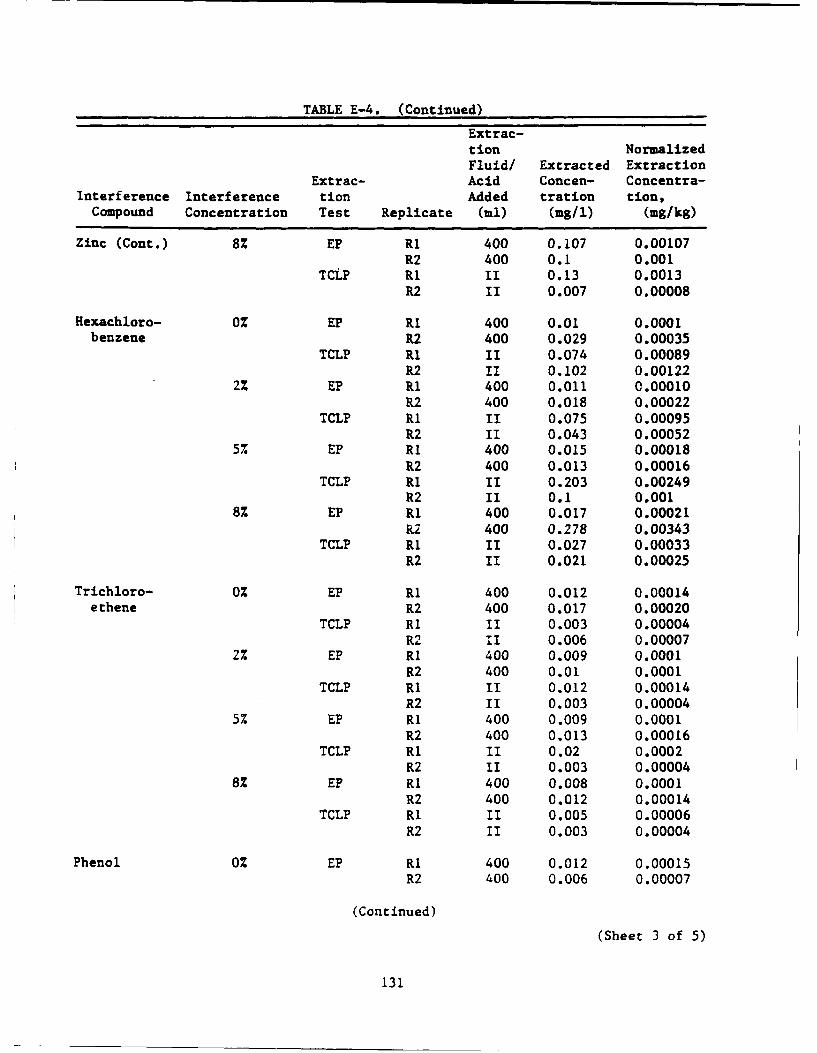
TABLE E-4. (Continued)
Extrac-tion NormalizedFluid/ Extracted Extraction
Extrac- Acid Concen- Concentra-Interference Interference tion Added tration tion,
Compound Concentration Test Replicate (ml) (mg/1) (mg/kg)
Zinc (Cont.) 8% EP RI 400 0.107 0.00107R2 400 0.1 0.001
TCLP R1 II 0.13 0.0013R2 II 0.007 0.00008
Hexachloro- 0% EP RI 400 0.01 0.0001benzene R2 400 0.029 0.00035
TCLP RI II 0.074 0.00089R2 II 0.102 0.00122
2% EP RI 400 0.011 0.00010R2 400 0.018 0.00022
TCLP RI II 0.075 0.00095R2 II 0.043 0.00052
5% EP Ri 400 0.015 0.00018R2 400 0.013 0.00016
TCLP RI II 0.203 0.00249R2 II 0.1 0.001
8% EP R1 400 0.017 0.00021R2 400 0.278 0.00343
TCLP RI I1 0.027 0.00033R2 II 0.021 0.00025
Trichloro- 0% EP Ri 400 0.012 0.00014ethene R2 400 0.017 0.00020
TCLP RI I1 0.003 0.00004R2 II 0.006 0.00007
2% EP Ri 400 0.009 0.0001R2 400 0.01 0.0001
TCLP RI II 0.012 0.00014R2 II 0.003 0.00004
5% EP Ri 400 0.009 0.0001R2 400 0.013 0.00016
TCLP RI II 0.02 0.0002R2 II 0.003 0.00004
8% EP Ri 400 0.008 0.0001R2 400 0.012 0.00014
TCLP R1 II 0.005 0.00006R2 II 0.003 0.00004
Phenol 0% EP RI 400 0.012 0.00015R2 400 0.006 0.00007
(Continued)
(Sheet 3 of 5)
131
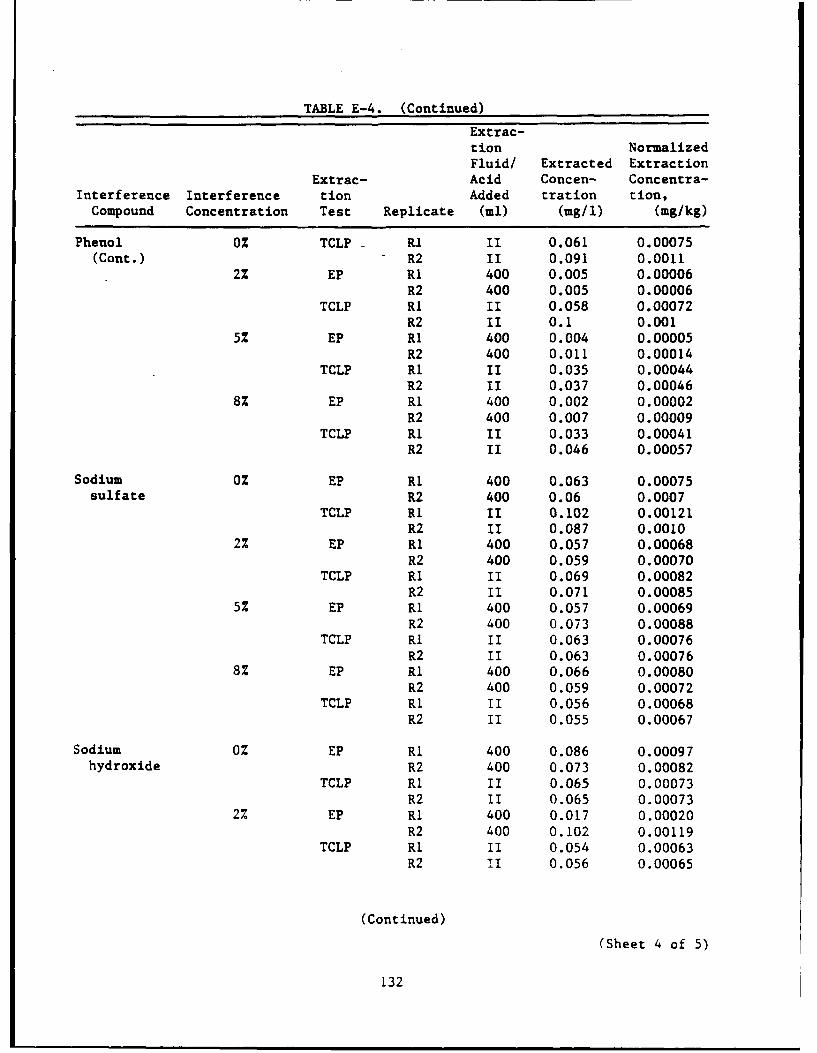
TABLE E-4. (Continued)
Extrac-tion NormalizedFluid/ Extracted Extraction
Extrac- Acid Concen- Concentra-Interference Interference tion Added tration tion,
Compound Concentration Test Replicate (ml) (mg/i) (mg/kg)
Phenol 0% TCLP RI II 0.061 0.00075(Cont.) R2 II 0.091 0.0011
2% EP Ri 400 0.005 0.00006R2 400 0.005 0.00006
TCLP RI II 0.058 0.00072R2 II 0.1 0.001
5% EP RI 400 0.004 0.00005R2 400 0.011 0.00014
TCLP RI II 0.035 0.00044R2 II 0.037 0.00046
8% EP RI 400 0.002 0.00002R2 400 0.007 0.00009
TCLP RI II 0.033 0.00041R2 II 0.046 0.00057
Sodium 0% EP R1 400 0.063 0.00075sulfate R2 400 0.06 0.0007
TCLP R1 II 0.102 0.00121R2 II 0.087 0.0010
2% EP R1 400 0.057 0.00068R2 400 0.059 0.00070
TCLP RI El 0.069 0.00082R2 1I 0.071 0.00085
5% EP R1 400 0.057 0.00069R2 400 0.073 0.00088
TCLP R1 II 0.063 0.00076R2 II 0.063 0.00076
8% EP Ri 400 0.066 0.00080R2 400 0.059 0.00072
TCLP RI 1I 0.056 0.00068R2 1I 0.055 0.00067
Sodium 0% EP R1 400 0.086 0.00097hydroxide R2 400 0.073 0.00082
TCLP RI II 0.065 0.00073R2 II 0.065 0.00073
2% EP RI 400 0.017 0.00020R2 400 0.102 0.00119
TCLP RI II 0.054 0.00063R2 Ii 0.056 0.00065
(Continued)
(Sheet 4 of 5)
132

TABLE E-4. (Concluded)
Extrac-tion NormalizedFluid/ Extracted Extraction
Extrac- Acid Concen- Concentra-Interference Interference tion Added tration tion,
Compound Concentration Test Replicate (ml) (mg/1) (mg/kg)
Sodium 5% EP -R1 400 0.008 0.0001hydroxide R2 400 0.006 0.00007(Cont.) TCLP R1 II 0.07 0.0009
R2 II 0.064 0.000808% EP R1 400 0.003 0.00004
R2 400 0.001 0.00001TCLP RI II 0.04 0.0004
R2 II 0.033 0.00039
(Sheet 5 of 5)
133

APPENDIX F
GRAPHICAL REPRESENTATION OF THE RESULTSOF TCLP AND EP EXTRACTIONS FOR
STUDY A METALS
Figures Fl-F4 are graphical representations of the TCLP and EP extrac-tions for each metal contaminant of Study A. In these figures the normalizedEP extract concentrations are plotted versus the normalized TCLP extract con-centrations. A line with a slope of 1.0 is plotted on each graph. Pointswhich lie on this line indicate that the extract concentrations for the EP andTCLP are equal. Points above this line indicate that the TCLP producedextracts with higher concentrations of the contaminant, and points below thisline indicate that the EP resulted in extracts containing higher concentra-tions of the contaminants. Based on this information, the mercury data (Fig-ure F-4) indicate that the TCLP was the more aggressive extraction methodbecause more than 70 percent of the mercury data points lie above the line.
In order to compare Figures F-1 through F-4, the difference in scalesmust be considered. The scales for the chromium and mercury data, presentedin Figures F-2 and F-4, are equivalent. However, scales for the cadmium andnickel data, presented in Figures F-1 and F-3, cannot be adjusted to match thescales of Figures F-2 and F-4 and still maintain any reasonable resolution.Therefore, the scale for nickel is 2.8 times smaller and the scale for thecadmium data is 17 times smaller than those used in the other figures.
The data presented in Figures F-1 and F-3 are closely grouped near theline, indicating equal EP and TCLP extract concentrations. Comparison of Fig-ures F-1 and F-3 to Figure F-4 illustrates that the results for the EP andTCLP extracts for mercury differ and that the EP and TCLP extracts for cadmiumand nickel do not. Similar observations for the chromium are more difficultto decipher.
135
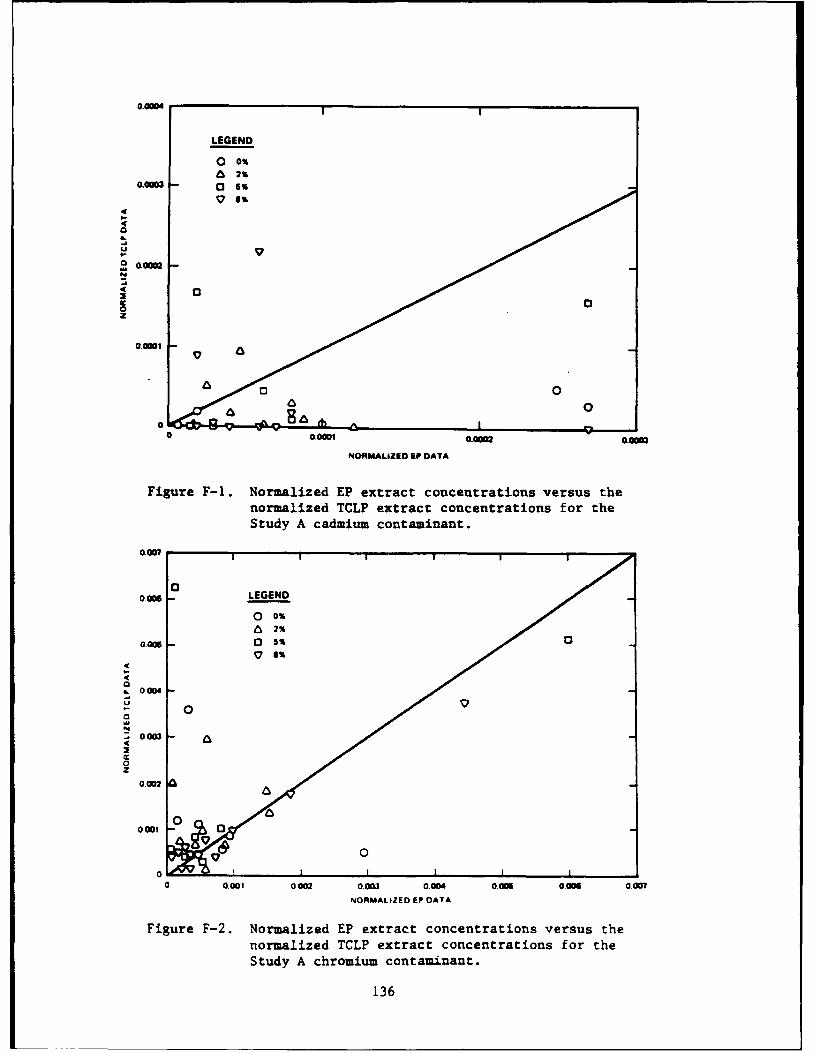
0.004I
LEGEND
0 0%A 2%
oooo03 0 5%<a
• 1
0
C.Ow
,,J
U0
0 0.00o 0.0010 .000IN
NORMlALIZED EF DATA
Figure F-1. Normalized EP extract concentrations versus thenormalized TCLP extract concentrations for theStudy A cadmium contaminant.
0.007 i
I
0
0.00 - LEGEND
0 0%
a 2
0.00 , 0 5.
0
"0001 00
0 0o0
0oo.00 5 0002 0.003 0.004 0.006 0.006 0.007
NORMALIZED EP DATA
Figure F-2. Normalized EP extract concentrations versus thenormalized TCLP extract concentrations for theStudy A chromium contaminant.
136

0.00 II "
LEGEND
*AMn 0 0%
0 S%
4 0 0.00I-
t4a0
0Q s
00
VP
0 A I I
0 0.006 0.0010 0.001o 0.0020 0.002S
NORMALIZED EP OATA
Figure F-3. Normalized EP extract concentrations versus thenormalized TCLP extract concentrations for theStudy A nickel contaminant.
0.= II
_001 - LEGEND
o- 0a 2% V
0.0o5 - 0 o
o~oos l
0.0
0.o o00 o' o3 oo, ooo o o
0Z 000
S0.003
0
0 .W0 0,002 0003 0.004 0.005 000 7 W
NOR~MALIZED EP OATA
Figure F-4. Normalized EP extract concentrations versus thenormalized TCLP extract concentrations for theStudy A mercury contaminant.
137
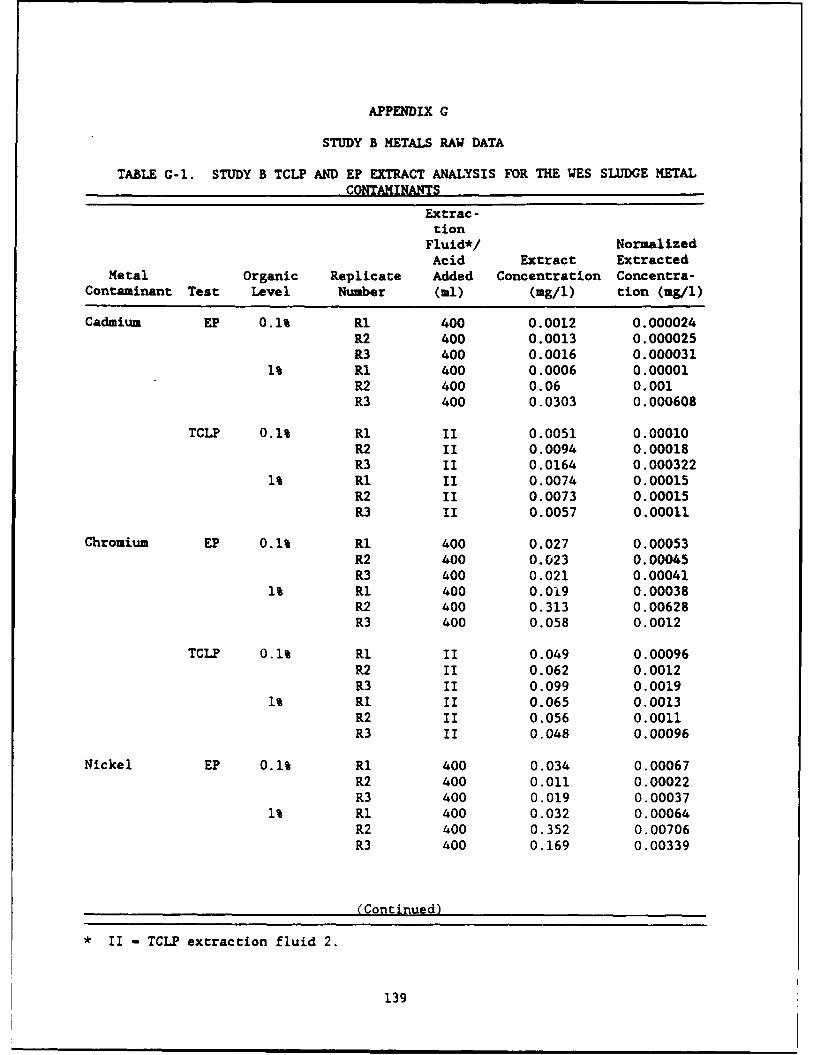
APPENDIX G
STUDY B METALS RAW DATA
TABLE G-1. STUDY B TCLP AND EP EXTRACT ANALYSIS FOR THE WES SLUDGE METALCONTAMINANTS
Extrac-tion
Fluid*/ NormalizedAcid Extract Extracted
Metal Organic Replicate Added Concentration Concentra-Contaminant Test Level Number (ml) (mg/1) tion (mg/i)
Cadmium EP 0.1% Rl 400 0.0012 0.000024R2 400 0.0013 0.000025R3 400 0.0016 0.000031
1% R1 400 0.0006 0.00001R2 400 0.06 0.001R3 400 0.0303 0.000608
TCLP 0.1% Rl II 0.0051 0.00010R2 II 0.0094 0.00018R3 II 0.0164 0.000322
1% Rl II 0.0074 0.00015R2 II 0.0073 0.00015R3 II 0.0057 0.00011
Chromium EP 0.1% Ri 400 0.027 0.00053R2 400 0.023 0.00045R3 400 0.021 0.00041
1% Ri 400 0.0i9 0.00038R2 400 0.313 0.00628R3 400 0.058 0.0012
TCLP 0.1% RI II 0.049 0.00096R2 II 0.062 0.0012R3 II 0.099 0.0019
1% Rl II 0.065 0.0013R2 II 0.056 0.0011R3 II 0.048 0.00096
Nickel EP 0.1% RI 400 0.034 0.00067R2 400 0.011 0.00022R3 400 0.019 0.00037
1% Rl 400 0.032 0.00064R2 400 0.352 0.00706R3 400 0.169 0.00339
(Continued)
* II - TCLP extraction fluid 2.
139

TABLE G-1 (Concluded)
Extrac-tion
Fluid/ Normalized
Acid Extract Extracted
Metal Organic Replicate Added Concentration Concentra-Contaminant Test Level Number (ml) (mg/l) tion (mg/l)
Nickel TCLP 0.1% RI II 0.11 0.0022(Cont.) R2 II 0.154 0.00302
R3 II 0.096 0.00191% RI II 0.235 0.00471
R2 II 0.214 0.00429R3 II 0.169 0.00335
Mercury EP 0.1% Ri 400 8.48 0.166R2 400 7.57 0.148R3 400 7 82 0.153
1% Ri 400 0.01 0.0004R2 400 0.02 0.0004R3 400 0.01 0.0003
TCLP 0.1% RI II 7.9 0.16R2 II 7.9 0.15R3 II 7.6 0.15
1% Ri II 8.5 0.17R2 II 8.3 0.17R3 II 7.9 0.16
140
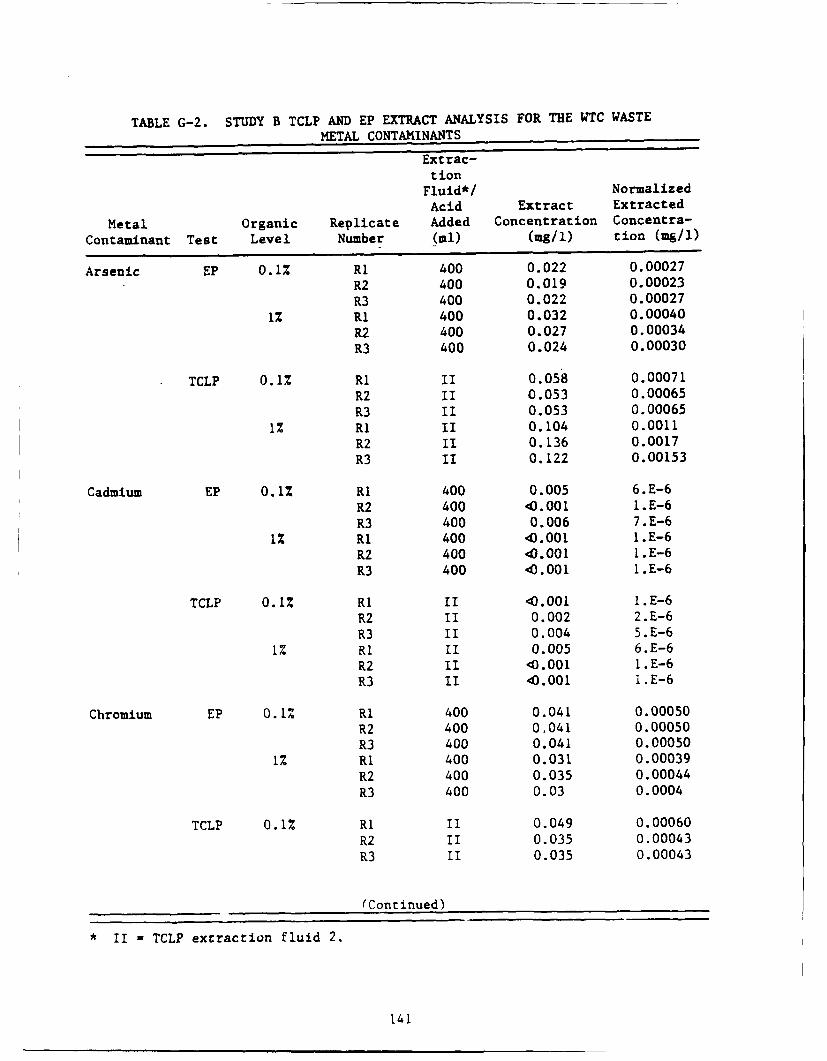
TABLE G-2. STUDY B TCLP AND EP EXTRACT ANALYSIS FOR THE WTC WASTEMETAL CONTAMINANTS
Extrac-tion
Fluid*/ NormalizedAcid Extract Extracted
Metal Organic Replicate Added Concentration Concentra-Contaminant Test Level Number (ml) (mg/i) tion (mg/l)
Arsenic EP 0.1% RI 400 0.022 0.00027R2 400 0.019 0.00023R3 400 0.022 0.00027
1% Ri 400 0.032 0.00040
R2 400 0.027 0.00034
R3 400 0.024 0.00030
TCLP 0.1% R1 II 0.058 0.00071R2 II 0.053 0.00065R3 II 0.053 0.00065
1% R1 IX 0.104 0.0011R2 II 0.136 0.0017R3 II 0.122 0.00153
Cadmium EP 0.1% R1 400 0.005 6.E-6R2 400 <0.001 I.E-6
R3 400 0.006 7.E-61% R1 400 Q3.001 1.E-6
R2 400 ,0.001 I.E-6R3 400 'C.001 1.E-6
TCLP 0.1% RI II CO.001 I.E-6R2 II 0.002 2.E-6R3 II 0.004 5.E-6
1% R1 II 0.005 6.E-6R2 II 43.001 1.E-6R3 II <0.001 I.E-6
Chromium EP 0.1% Ri 400 0.041 0.00050R2 400 0,041 0.00050R3 400 0.041 0.00050
1% R1 400 0.031 0.00039R2 400 0.035 0.00044R3 400 0.03 0.0004
TCLP 0.1% Ri II 0.049 0.00060R2 II 0.035 0.00043R3 II 0.035 0.00043
(Continued)
*II TCLP extraction fluid 2.
141
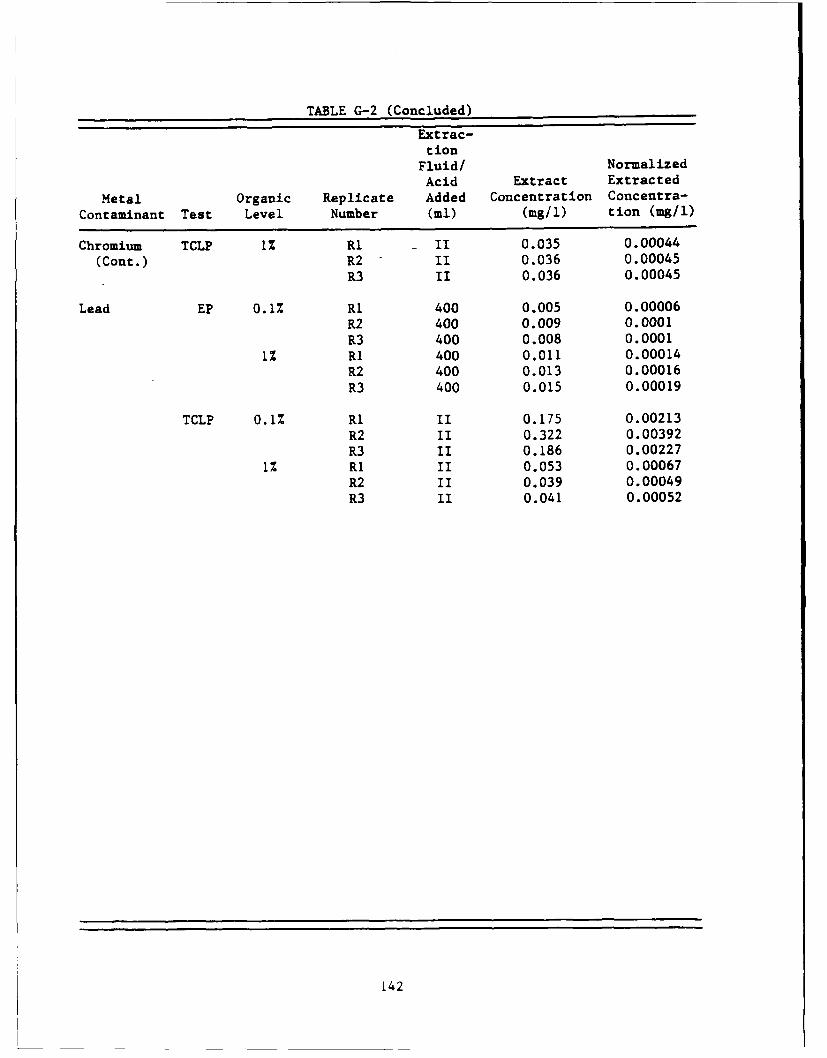
TABLE G-2 (Concluded)
Extrac-tion
Fluid/ NormalizedAcid Extract Extracted
Metal Organic Replicate Added Concentration Concentra-Contaminant Test Level Number (ml) (mg/1) tion (mg/1)
Chromium TCLP 1% RI - II 0.035 0.00044(Cont.) R2 II 0.036 0.00045
R3 II 0.036 0.00045
Lead EP 0.1% RI 400 0.005 0.00006R2 400 0.009 0.0001R3 400 0.008 0.0001
1% RI 400 0.011 0.00014R2 400 0.013 0.00016R3 400 0.015 0.00019
TCLP 0.1% R1 II 0.175 0.00213R2 II 0.322 0.00392R3 II 0.186 0.00227
1% R1 II 0.053 0.00067R2 II 0.039 0.00049R3 II 0.041 0.00052
142
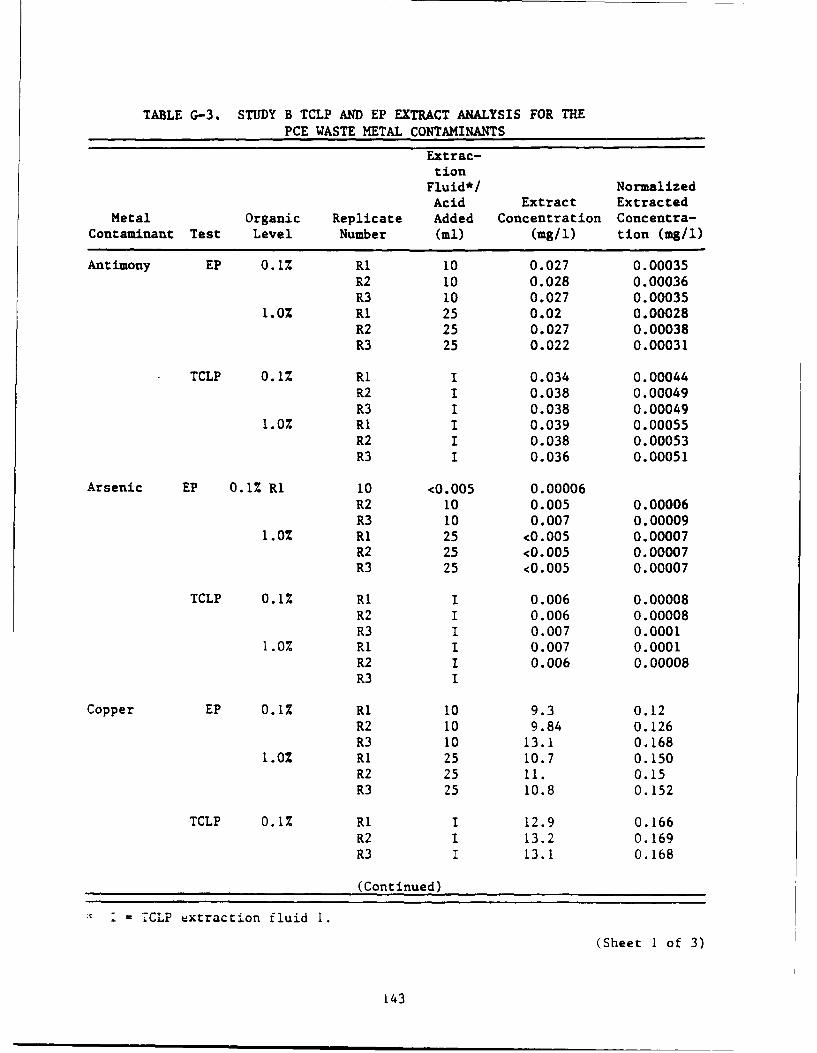
TABLE G-3. STUDY B TCLP AND EP EXTRACT ANALYSIS FOR THEPCE WASTE METAL CONTAMINANTS
Extrac-tion
Fluid*/ NormalizedAcid Extract Extracted
Metal Organic Replicate Added Concentration Concentra-Contaminant Test Level Number (ml) (mg/i) tion (mg/i)
Antimony EP 0.1% R1 10 0.027 0.00035R2 10 0.028 0.00036R3 10 0.027 0.00035
1.0% Ri 25 0.02 0.00028R2 25 0.027 0.00038R3 25 0.022 0.00031
TCLP 0.1% Ri I 0.034 0.00044R2 I 0.038 0.00049R3 I 0.038 0.00049
1.0% R1 I 0.039 0.00055R2 I 0.038 0.00053R3 I 0.036 0.00051
Arsenic EP 0.1% R1 10 <0.005 0.00006R2 10 0.005 0.00006R3 10 0.007 0.00009
1.0% Ri 25 <0.005 0.00007R2 25 <0.005 0.00007R3 25 <0.005 0.00007
TCLP 0.1% R1 I 0.006 0.00008R2 I 0.006 0.00008R3 I 0.007 0.0001
1.0% RI I 0.007 0.0001R2 I 0.006 0.00008R3 I
Copper EP 0.1% RI 10 9.3 0.12R2 10 9.84 0.126R3 10 13.1 0.168
1.0% R1 25 10.7 0.150R2 25 11. 0.15R3 25 10.8 0.152
TCLP 0.1% RI I 12.9 0.166R2 I 13.2 0.169R3 1 13.1 0.168
(Continued)
=CLP extraction fluid 1.
(Sheet I of 3)
143
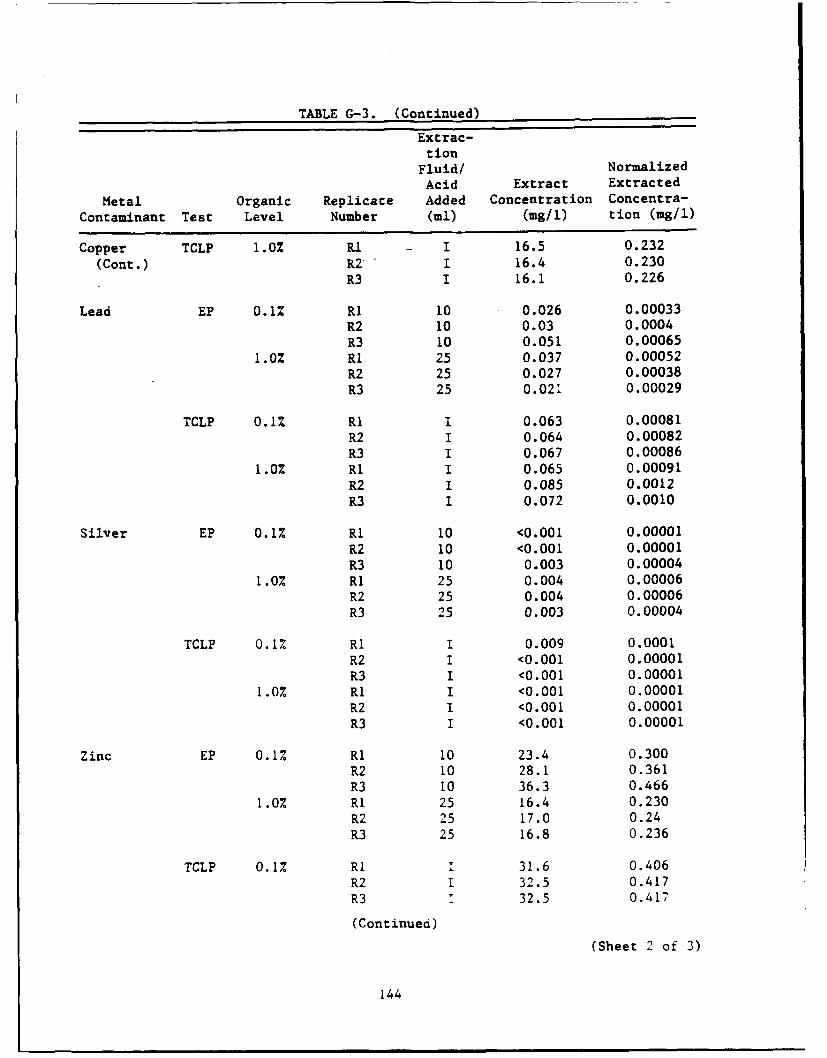
TABLE G-3. (Continued)
Extrac-tion
Fluid/ NormalizedAcid Extract Extracted
Metal Organic Replicate Added Concentration Concentra-Contaminant Test Level Number (ml) (mg/i) tion (mg/l)
Copper TCLP 1.0% RI I 16.5 0.232(Cont.) R2 - I 16.4 0.230
R3 I 16.1 0.226
Lead EP 0.1% Ri 10 0.026 0.00033R2 10 0.03 0.0004R3 10 0.051 0.00065
1.0% RI 25 0.037 0.00052R2 25 0.027 0.00038R3 25 0.021 0.00029
TCLP 0.1% RI I 0.063 0.00081R2 I 0.064 0.00082R3 I 0.067 0.00086
1.0% R1 I 0.065 0.00091R2 I 0.085 0.0012R3 I 0.072 0.0010
Silver EP 0.1% Ri 10 <0.001 0.00001R2 10 <0.001 0.00001R3 10 0.003 0.00004
1.0% Ri 25 0.004 0.00006R2 25 0.004 0.00006R3 25 0.003 0.00004
TCLP 0.1% RI 1 0.009 0.0001R2 I <0.001 0.00001R3 I <0.001 0.00001
1.0% R1 I <0.001 0.00001R2 I <0.001 0.00001R3 I <0.001 0.00001
Zinc EP 0.1% RI 10 23.4 0.300R2 10 28.1 0.361R3 10 36.3 0.466
1.0% RI 25 16.4 0.230R2 25 17.0 0.24R3 25 16.8 0.236
TCLP 0.1% RI I 31.6 0.406R2 I 32.5 0.417R3 1 32.5 0.417
(Continued)
(Sheet 2 of 3)
144

TABLE G-3. (Concluded)
Extrac-tion
Fluid/ NormalizedAcid Extract Extracted
Metal Organic Replicate Added Concentration Concentra-Contaminant Test Level Number (ml) (mg/l) tion (mg/1)
Zinc TCLP 1.0% RI - I 33.1 0.465(Cont.) R2 I 32.3 0.454
R3 I 33.4 0.469
Barium EP 0.1% Ri 10 0.315 0.00404R2 10 0.388 0.00498R3 10 0.442 0.00567
1.0% R1 25 0.321 0.00451R2 25 0.362 0.00508R3 25 0.321 0.00451
TCLP 0.1% Ri I 0.428 0.00549R2 I 0.433 0.00556R3 I 0.517 0.00664
1.0% R1 I 0.578 0.00812R2 I 0.564 0.00792R3 I 0.541 0.00760
145

APPENDIX H
GRAPHICAL REPRESENTATION OF THE RESULTSOF TCLP AND EP EXTRACTIONS
FOR STUDY B METALS
Figures H-i through H-7 are graphical representations of the TCLP and EPextractions for each metal contaminant of Study B. In these figures the nor-malized EP concentrations are plotted versus the normalized TCLP extract con-centrations. A line with a slope of 1.0 is plotted on each graph. Pointswhich lie on this line indicate that the extract concentrations for the EP andTCLP are equal. Points above this line indicate that the TCLP producedextracts with higher concentrations of the contaminant, and points below thisline indicate that the EP resulted in extracts containing higher concentra-tions of the contaminants.
Figure H-5 illustrates that the lead contaminant was more aggressivelyextracted by the TCLP for each extraction that was performed. Figure H-6illustrates that the WES-1.0%-mercury data plot on the y-axis. These mercurydata points deviate from the majority of the average population and are sus-pect. Figures H-2, H-4, and H-7, which present the cadmium, chromium, andnickel data for the WES sludge, illustrate that analyses of the extracts fromthe WES sludge produced data with more scatter than was observed in theextracts of the other sludges.
147

0.0007
0.0006
LEGENO A
z_ .0�o ~ 0 PC& 0.1% I(bI AP- A PCs 1.0% ISbI
13 PCEs 0.1% IAg0V YCs I.04%6AI1
0.000 -
o 0.0002
R,0.000 -
I-
0.•
o 0.0oo 0.00 0.0003 0.0004
NORMALIZED E!) CO•NCENTRqATION
Figure H-1. Normalized EP extract concentrations versus thenormalized TCLP extract concentrations for theStudy B antimony and silver contaminants.
402
0.0020 - LEGEND
_ 0 WTC O. 1%0a WTC 1.0%1SO.O01l -13 PCE 0.1•
7 POE 1.0% a
U
zooe
0,02
U000 0-
Z
0.0004
0
0 0,0 00 0 2 0.0003 0.0004 0.0006 0.000
NORMALIZED EP CONCENTRATION
Figure H-2. Normalized EP extract concentrations versus thenormalized TCLP extract concentrations for theStudy B arsenic contaminant.
148

o 00001
0.0007LEGEND
0 WES O.11Z a.0m A Wes 1.0%- 0 WTC0o.1
V WTC 1.0%
0.000o
0
0L0.0002
o~a o
0A
0.00010
00.00123 0.0005 0.0009 0.OM1 0.0010NORMALIZED EP CONCENTRATION
Figure H-3. Normalized EP extract concentrations versus thenormalized TCLP extract concentrations for theStudy B cadmium contaminant.
0.003
LEGEND
o WESOI%- Q W1CO 0%
0.002 V WTCI1.0- 0Z
oAU
0 0
P40RUALIZEO EP CONCENTRATION
Figure H-4. Normalized EP extract concentrations versusthe normalized TCLP extract concentrationsfor the Study B chromium contaminant.
149
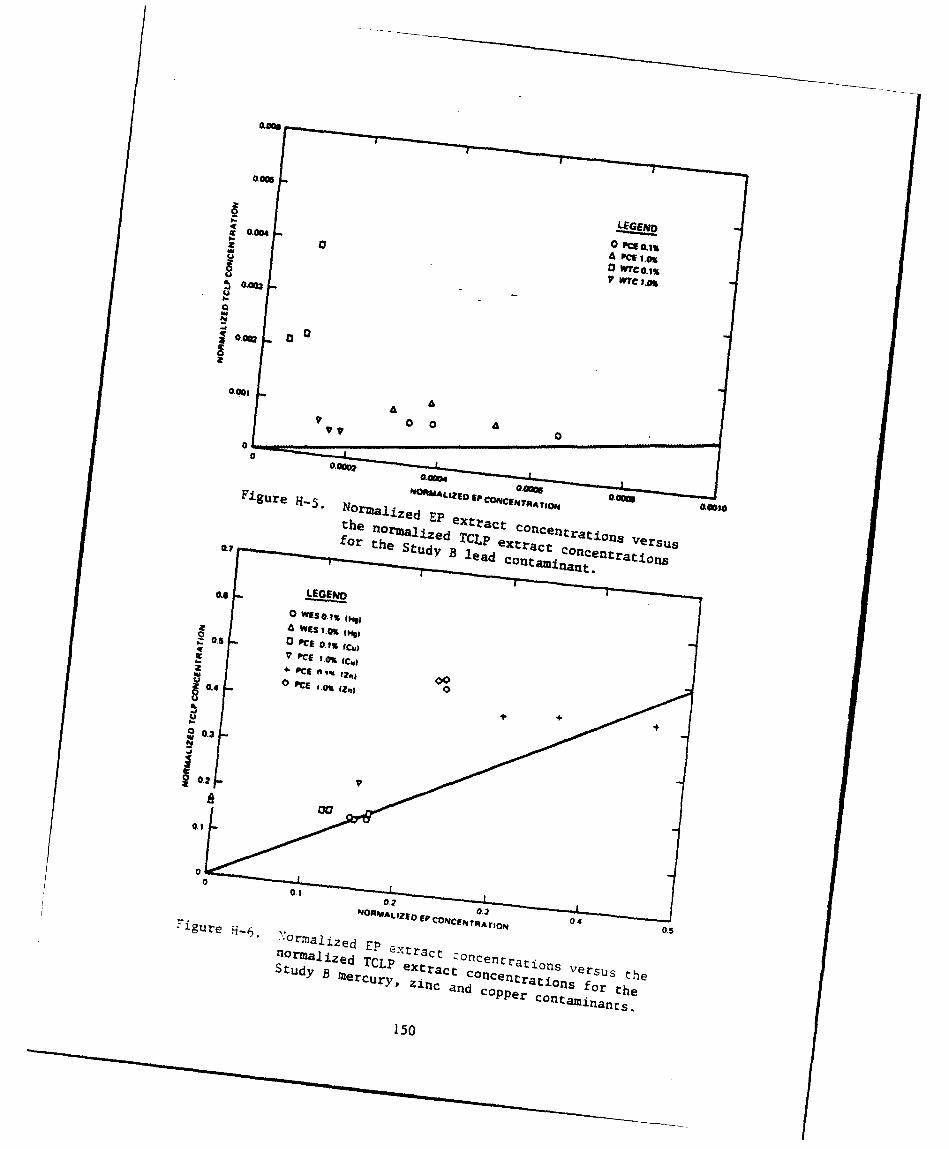
N00
0-04
V 0 0 A
0
00
Figure H-5. omma, lie I CoftC6NwN~Arft AOSi'Zed EP extIact
vruth nrmliedTCtP exctrat conntaton0.7 for the Study B lead c~ac Concentratiosvru
0~0.6 LEGENVO. C,
0 WE..zp.-ft
0. 5PE .is C,
0.
00.1
zIgure LJ-6. LP vt 2
ncnt.orai~zed TCp e~xtract oncentratin versu the
Study B M~ercury, zinc an Coppe C~t ath
150
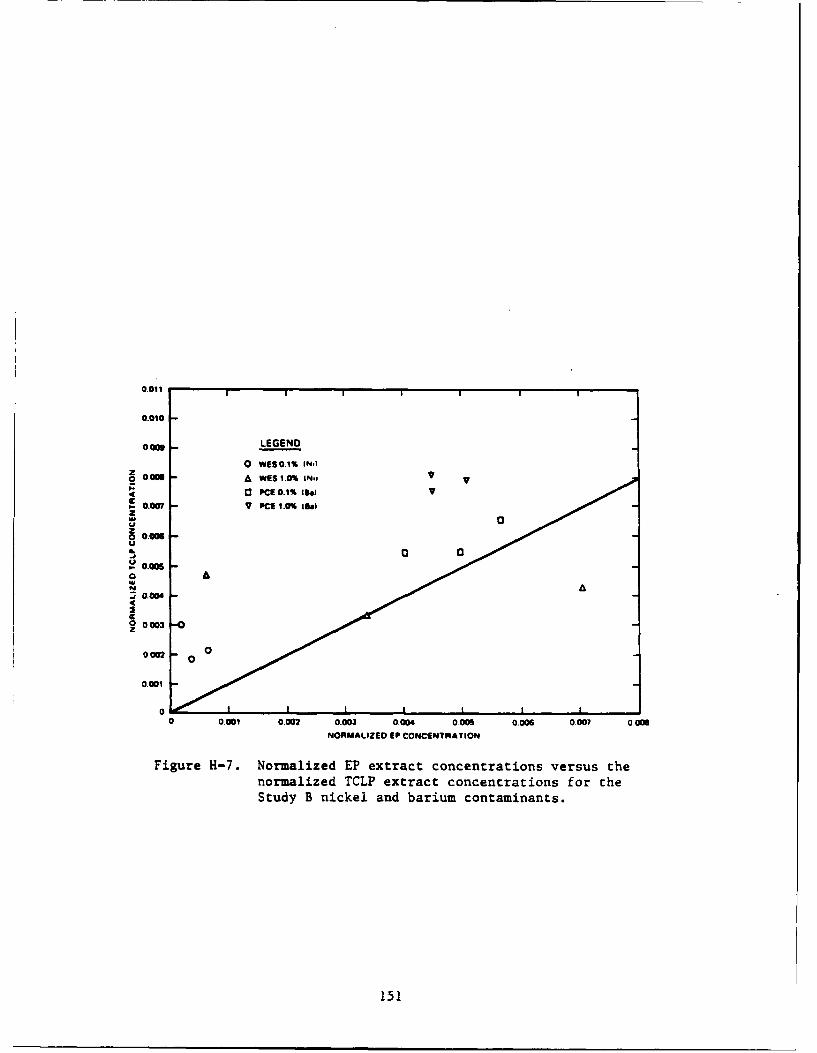
0,011o.oio I_
0.010
a4m9 LEGEND
0 WES0.1% IN.IZ2 0a08 A WES 1.0% IN.1 V
0 PCE .1% Ilea
C.,.- 0.007 •-V PCIE 1.0% lea)
2
0.00 -U
"0.0 1 A
0
o.0oi 0.002 0.003 0.004 o000 0.o06 00007 0.028
NORMALIZED EP CONCENTRATION
Figure H-7. Normalized EP extract concentrations versus thenormalized TCLP extract concentrations for theStudy B nickel and barium contaminants.
151

APPENDIX I
STUDY B ORGANICS RAW DATA
TABLE I-1. STUDY B TCLP AND EP EXTRACT ANALYSES FOR CARBON TETRACHLORIDE
NormalizedExtract Extraction
Extraction Organic Replicate Concentration ConcentrationSludge Test Level Number - (mg/I) (mg/kg)
WES EP 0.1% RI 0.51 0.04R2 0.5 0.04R3 <0.25 0.02
1% RI 2.4 0.19R2 5. 0.4R3 4.4 0.35
WES TCLP 0.1% RI 1.4 0.11R2 0.66 0.052R3 0.61 0.048
1% Ri <5. 0.4R2 11. 0.88R3 6.8 0.55
PCE EP 0.1% Ri <0.5 0.03R2 0.11 0.0056R3 0.087 0.0045
1% RI 10. 0.6R2 <10. 0.6R3 <10. 0.6
PCE TCLP 0.1% Ri <0.5 0.03R2 <0.5 0.03R3 <0.5 0.03
1% Ri <10. 0.6R2 <10. 0.6R3 <10. 0.6
WTC EP 0.1% RI <0.1 0.005R2 <0.1 0.005R3 <0.1 0.005
1% Ri <5. 0.3R2 5. 0.3R3 <5. 0.3
WTC TCLP 0.1% Ri <0.2 0.01R2 <0.2 0.01R3 <0.2 0.01
1% Ri <5. 0.3R2 <5. 0.3R3 <5. 0.3
153

TABLE 1-2. STUDY B TCLP AND EP EXTRACT ANALYSES FOR CHLOROFORM
NormalizedExtract Extraction
Extraction Organic Replicate Concentration ConcentrationSludge Test Level Number (mg/I) (mg/kg)
WES EP 0.1% Ri 0.67 0.053R2 1. 0.08R3 - 0.96 0.075
1% RI 13.5 1.08R2 13.3 1.07R3 15.1 1.21
WES TCLP 0.1% R1 1.8 0.14R2 0.9 0.07R3 1.5 0.12
1% Ri 38.8 3.11R2 18. 1.4R3 25. 2.0
PCE EP 0.1% R1 0.97 0.05
R2 1.06 0.0544R3 1.01 0.0519
1% RI 20.5 1.15R2 23.6 1.33R3 27.2 1.53
PCE TCLP 0.1% R1 1.5 0.077
R2 1.55 0.0796R3 1.62 0.0832
1% R1 32.5 1.83R2 35.4 1.99R3 30.2 1.70
WTC EP 0.1% R1 0.237 0.0116
R2 0.22 0.011R3 0.221 0.0108
1% Ri 8.16 0.410R2 9.48 0.477R3 9.29 0.467
WTC TCLP 0.1% R1 <0.2 0.01
R2 <0.2 0.01R3 <0.2 0.01
1% R1 10. 0.5R2 8.32 0.419R3 9.08 0.457
154

TABLE 1-3. STUDY B TCLP AND EP EXTRACT ANALYSES FOR 1,2-DICHLOROETHANE
NormalizedExtract Extraction
Extraction Organic Replicate Concentration ConcentrationSludge Test Level Number (mg/i) (mg/kg)
WES EP 0.1% R1 1.5 0.12R2 1.7 0.13R3 1.5 0.12
1% RI 36.8 2.95R2 35.7 2.86R3 43.6 3.50
WES TCLP 0.1% RI 1.7 0.13R2 1. 0.08R3 i.1 0.086
1% R1 89.1 7.15R2 50. 4.R3 45. 3.6
PCE EP 0.1% RI 3.57 0.183R2 3.66 0.188R3 3.59 0.184
1% RI 53.4 3.00R2 57.6 3.24R3 60.9 3.42
PCE TCLP 0.1% RI 4. 0.2R2 4.26 0.219R3 4.43 0.227
1% Ri 70.4 3.95R2 73.8 4.15R3 70. 4.
WTC EP 0.1% RI 0.81 0.039R2 0.735 0.0358R3 0.735 0.0358
1% R1 45.5 2.29R2 43.6 2.19R3 46. 2.3
WTC TCLP 0.1% Ri 0.633 0.0308R2 0.442 0.0215R3 0.392 0.0191
1% RI 47.2 2.37R2 43.2 2.17R3 42.3 2.13
155

TABLE 1-4. STUDY B TCLP AND EP EXTRACT ANALYSES FOR1,1,1 -TRICHLOROETHANE
NormalizedExtract Extraction
Extraction Organic Replicate Concentration ConcentrationSludge Test Level Number (mg/i) (mg/kg)
WES EP 0.1% RI 0.92 0.072
R2 1.1 0.086R3 0.87 0.068
1% R1 16.9 1.36R2 18.4 1.48R3 19.7 1.58
WES TCLP 0.1% Ri 2.7 0.21R2 1.4 0.11R3 1.7 0.13
1% Ri 58.4 4.68R2 39. 3.1R3 43. 3.4
PCE EP 0.1% Ri 0.45 0.023
R2 0.62 0.032R3 0.59 0.030
1% RI 12. 0.67R2 14.2 0.798R3 19. 1.1
PCE TCLP 0.1% RI 1..2 0.062R2 L.22 0.0626R3 1.18 0.0Fi6
1% Ri 24.6 1.3bR2 25.8 1.45R3 24.8 1.39
WTC EP 0.1% RI 0.306 0.0149R2 0.287 0.0140R3 0.286 0.0139
1% RI 13.4 0.674R2 16.5 0.830R3 15.3 0.770
WTC TCLP 0.1% RI 0.563 0.0274R2 0.457 0.0223R3 0.34 0.017
1% Ri 29.5 1.484R2 22.9 1.15R3 22.1 1.11
156
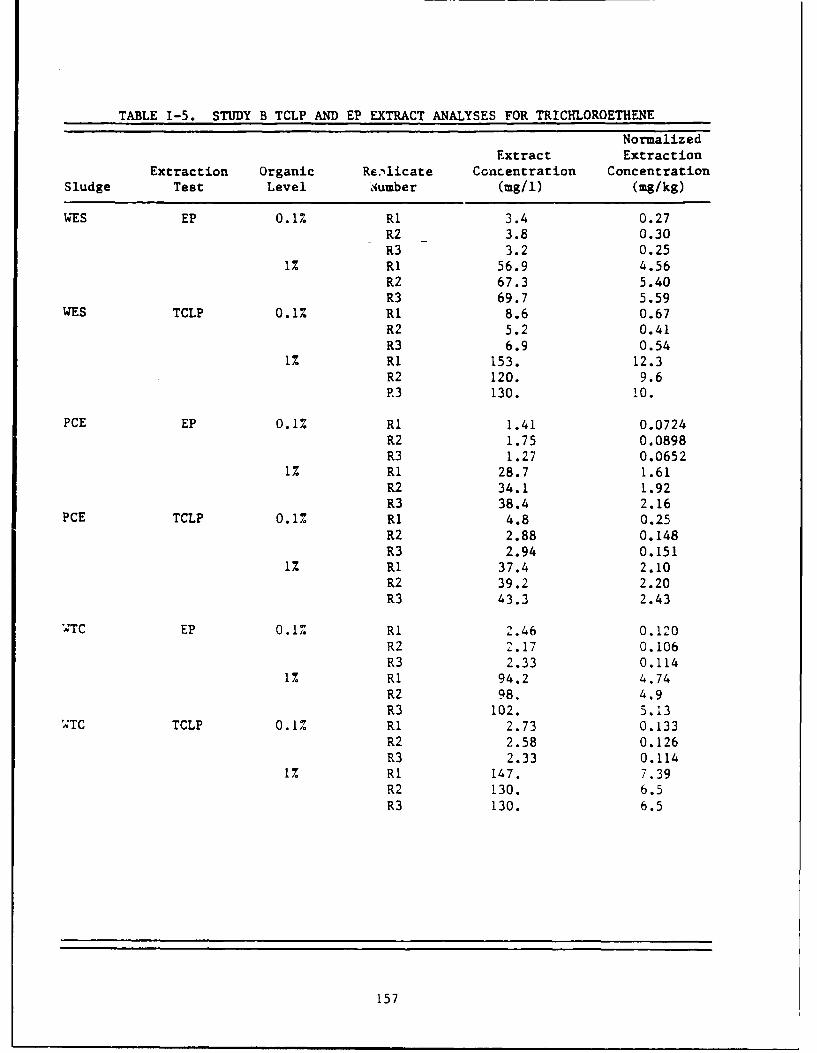
TABLE 1-5. STUDY B TCLP AND EP EXTRACT ANALYSES FOR TRICHLOROETHENE
NormalizedExtract Extraction
Extraction Organic Re.'licate Concentration ConcentrationSludge Test Level lumber (mg/i) (mg/kg)
WES EP 0.1% Ri 3.4 0.27R2 3.8 0.30R3 3.2 0.25
1% R1 56.9 4.56R2 67.3 5.40R3 69.7 5.59
WES TCLP 0.1% RI 8.6 0.67R2 5.2 0.41R3 6.9 0.54
1% Ri 153. 12.3R2 120. 9.6R3 130. !0.
PCE EP 0.1% R1 1.41 0.0724R2 1.75 0.0898R3 1.27 0.0652
1% RI 28.7 1.61R2 34.1 1.92R3 38.4 2.16
PCE TCLP 0.1% R1 4.8 0.25R2 2.88 0.148R3 2.94 0.151
1% R1 37.4 2.10R2 39.2 2.20R3 43.3 2.43
;TC EP 0.1% Ri 2.46 0.120R2 2.17 0.106R3 2.33 0.114
1% Ri 94.2 4.74R2 98. 4.9
R3 102. 5.13WTC TCLP 0.1% Ri 2.73 0.133
R2 2.58 0.126R3 2.33 0.114
1% R1 147. 7.39R2 130. 6.5R3 130. 6.5
157
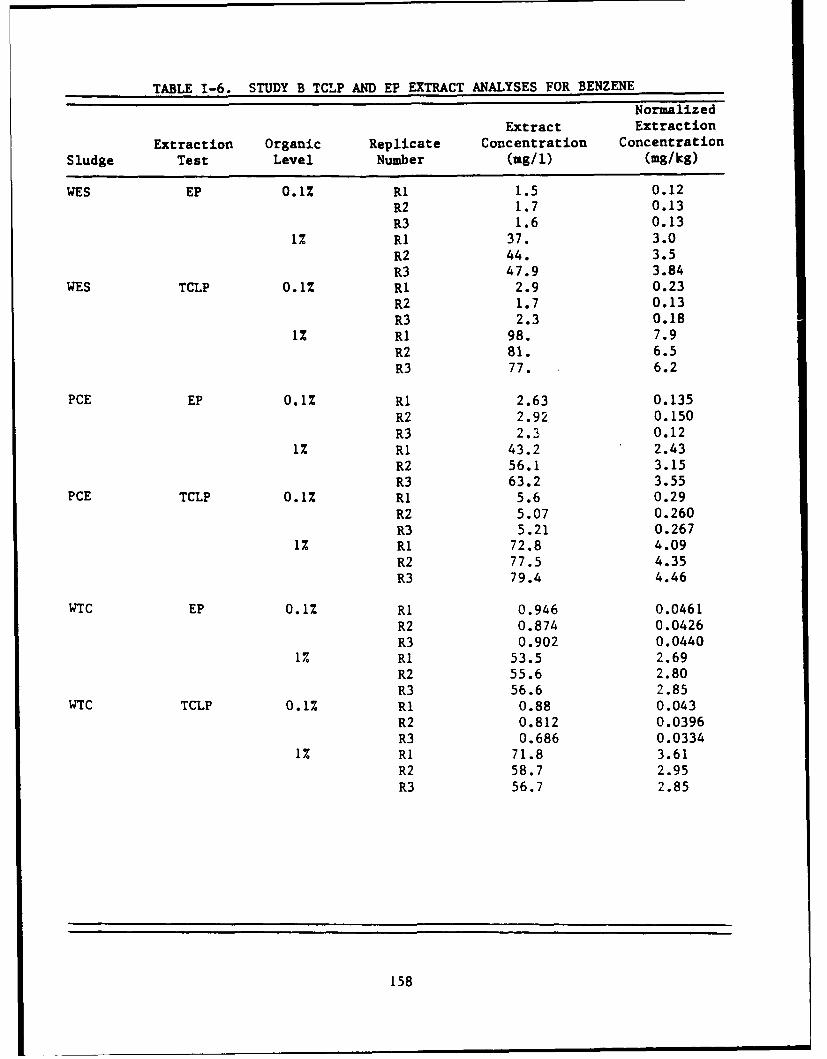
TABLE 1-6. STUDY B TCLP AND EP EXTRACT ANALYSES FOR BENZENE
NormalizedExtract Extraction
Extraction Organic Replicate Concentration ConcentrationSludge Test Level Number (migi) (mg/kg)
WES EP 0.1% Ri 1.5 0.12R2 1.7 0.13R3 1.6 0.13
1% RI 37. 3.0
R2 44. 3.5R3 47.9 3.84
WES TCLP 0.1% RI 2.9 0.23
R2 1.7 0.13R3 2.3 0.18
1% RI 98. 7.9R2 81. 6.5R3 77. 6.2
PCE EP 0.1% RI 2.63 0.135
R2 2.92 0.150R3 2.3 0.12
1% RI 43.2 2.43R2 56.1 3.15R3 63.2 3.55
PCE TCLP 0.1% Ri 5.6 0.29R2 5.07 0.260R3 5.21 0.267
1% RI 72.8 4.09R2 77.5 4.35R3 79.4 4.46
WTC EP 0.1% Ri 0.946 0.0461
R2 0.874 0.0426R3 0.902 0.0440
1% Ri 53.5 2.69R2 55.6 2.80
R3 56.6 2.85WTC TCLP 0.1% RI 0.88 0.043
R2 0.812 0.0396R3 0.686 0.0334
1% Ri 71.8 3.61R2 58.7 2.95R3 56.7 2.85
158
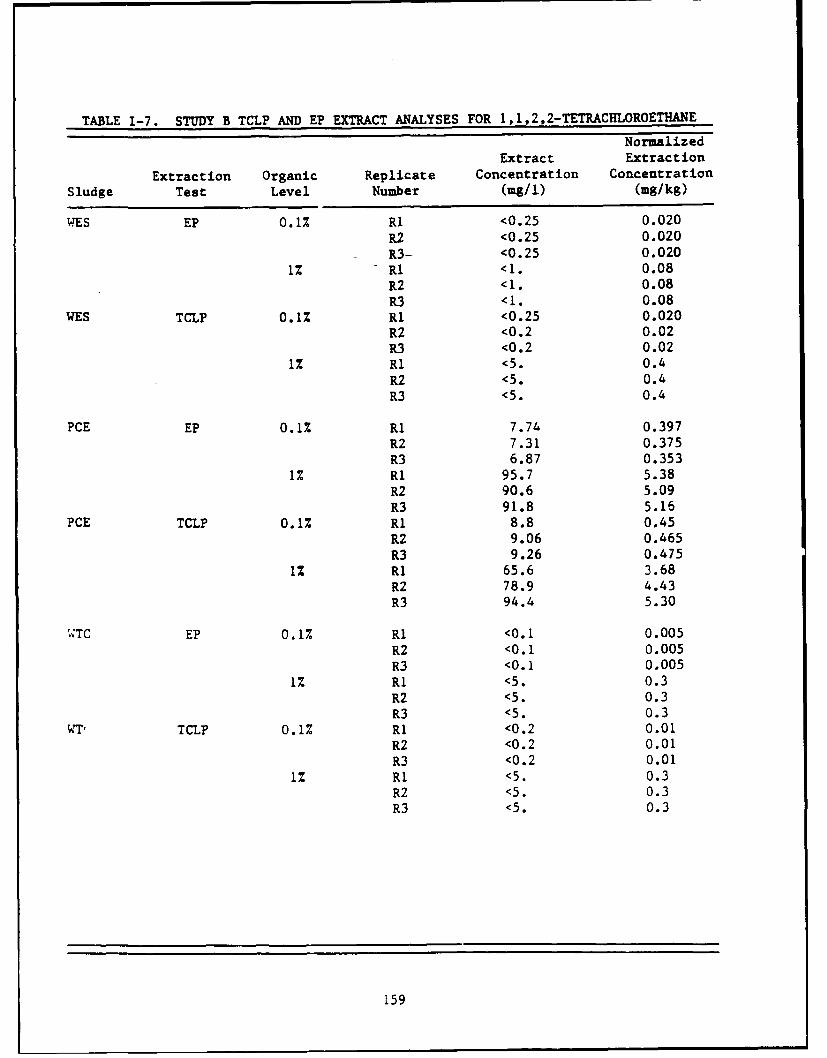
TABLE 1-7. STUDY B TCLP AND EP EXTRACT ANALYSES FOR 1,1,2,2-TETRACHLOROETHANE
NormalizedExtract Extraction
Extraction Organic Replicate Concentration ConcentrationSludge Test Level Number (mg/1) (mg/kg)
WES EP 0.1% RI <0.25 0.020
R2 <0.25 0.020R3- <0.25 0.020
1% RI <1. 0.08R2 <1. 0.08R3 <1. 0.08
WES TCLP 0.1% RI <0.25 0.020R2 <0.2 0.02R3 <0.2 0.02
1% R1 <5. 0.4R2 <5. 0.4R3 <5. 0.4
PCE EP 0.1% RI 7.74 0.397R2 7.31 0.375R3 6.87 0.353
1% Ri 95.7 5.38R2 90.6 5.09R3 91.8 5.16
PCE TCLP 0.1% Ri 8.8 0.45R2 9.06 0.465R3 9.26 0.475
1% R1 65.6 3.68R2 78.9 4.43R3 94.4 5.30
WTC EP 0.1% Ri <0.1 0.005
R2 <0.1 0.005R3 <0.1 0.005
1% R1 <5. 0.3R2 <5. 0.3R3 <5. 0.3
WT'7 TCLP 0.1% RI <0.2 0.01
R2 <0.2 0.01R3 <0.2 0.01
1% Ri <5. 0.3R2 <5. 0.3R3 <5. 0.3
159
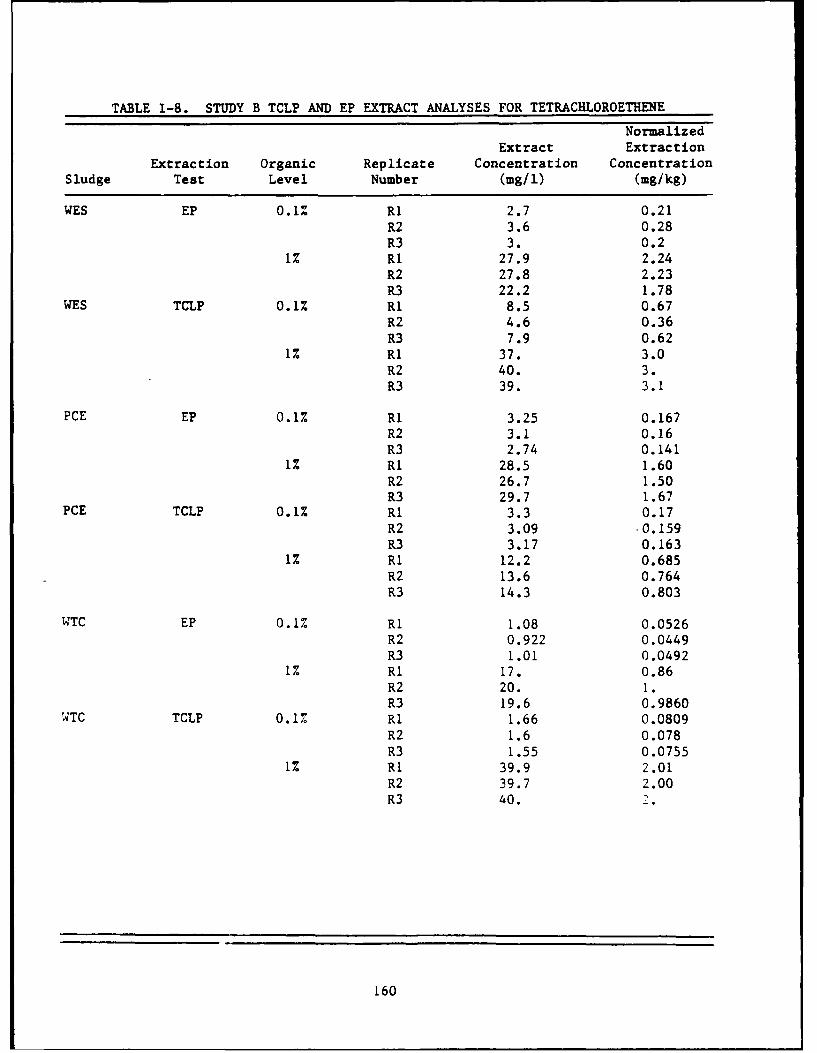
TABLE 1-8. STUDY B TCLP AND EP EXTRACT ANALYSES FOR TETRACHLOROETHENE
NormalizedExtract Extraction
Extraction Organic Replicate Concentration ConcentrationSludge Test Level Number (mg/i) (mg/kg)
WES EP 0.1% R1 2.7 0.21R2 3.6 0.28R3 3. 0.2
1% RI 27.9 2.24R2 27.8 2.23R3 22.2 1.78
WES TCLP 0.1% Ri 8.5 0.67R2 4.6 0.36R3 7.9 0.62
1% RI 37. 3.0R2 40. 3.R3 39. 3.1
PCE EP 0.1% RI 3.25 0.167R2 3.1 0.16R3 2.74 0.141
1% R1 28.5 1.60R2 26.7 1.50R3 29.7 1.67
PCE TCLP 0.1% R1 3.3 0.17R2 3.09 .0.159R3 3.17 0.163
1% R1 12.2 0.685R2 13.6 0.764R3 14.3 0.803
WTC EP 0.1% R1 1.08 0.0526R2 0.922 0.0449R3 1.01 0.0492
1% R1 17. 0.86R2 20. 1.R3 19.6 0.9860
WTC TCLP 0.1% RI 1.66 0.0809R2 1.6 0.078R3 1.55 0.0755
1% R1 39.9 2.01R2 39.7 2.00R3 40.
160
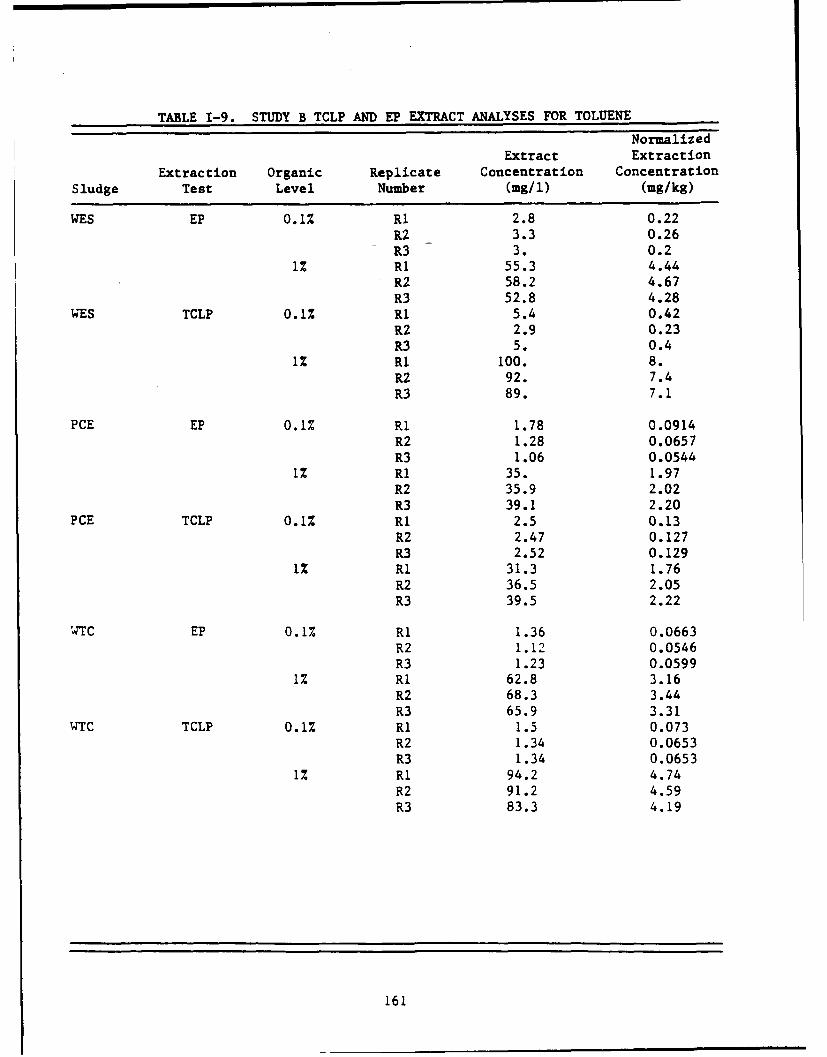
TABLE 1-9. STUDY B TCLP AND EP EXTRACT ANALYSES FOR TOLUENE
NormalizedExtract Extraction
Extraction Organic Replicate Concentration ConcentrationSludge Test Level Number (mg/i) (mg/kg)
WES EP 0.1% Ri 2.8 0.22R2 3.3 0.26R3 3. 0.2
1% RI 55.3 4.44R2 58.2 4.67R3 52.8 4.28
WES TCLP 0.1% RI 5.4 0.42RZ 2.9 0.23R3 5. 0.4
1% RI 100. 8.R2 92. 7.4R3 89. 7.1
PCE EP 0.1% RI 1.78 0.0914R2 1.28 0.0657R3 1.06 0.0544
1% R1 35. 1.97R2 35.9 2.02R3 39.1 2.20
PCE TCLP 0.1% Ri 2.5 0.13R2 2.47 0.127R3 2.52 0.129
1% R1 31.3 1.76R2 36.5 2.05R3 39.5 2.22
14TC EP 0.1% Ri 1.36 0.0663
R2 1.12 0.0546R3 1.23 0.0599
1% RI 62.8 3.16R2 68.3 3.44R3 65.9 3.31
WTC TCLP 0.1% R1 1.5 0.073R2 1.34 0.0653R3 1.34 0.0653
1% R1 94.2 4.74R2 91.2 4.59R3 83.3 4.19
161

TABLE I-10. STUDY B TCLP AND EP EXTRACT ANALYSES FOR ETHYLBENZENE
NormalizedExtract Extraction
Extraction Organic Replicate Concentration ConcentrationSludge Test Level Number (mg/1) (mg/kg)
WES EP 0.1% RI 4.6 0.36R2 5.5 0.43R3- 5.7 0.45
1% R1 35. 2.8R2 33.6 2.70R3 32.9 2.64
WES TCLP 0.1% Ri 11. 0.86R2 16. 1.3R3 25. 2.0
1% Ri 46. 3.7R2 52. 4.2R3 44. 3.5
PCE EP 0.1% R1 2.09 0.107R2 2.24 0.115R3 1.77 0.0909
1% RI 35.4 1.99R2 33.5 1.88R3 34.7 1.95
PCE TCLP 0.1% RI 2.3 0.12
R2 2.37 0.122R3 2.32 0.119
1% R1 20.9 1.17R2 20.6 1.16R3 21.3 1.20
WTC EP 0.1i% R1 3.17 0.154R2 2.7 0.13R3 2.92 0.142
1% R1 35. 1.8R2 36.1 1.82R3 37.2 1.87
TCLP 0.1% R1 3.74 0.182R2 3.85 0.188R3 4.24 0.207
1% Ri 80.7 4.06R2 127. 6.39R3 79.1 3.98
162
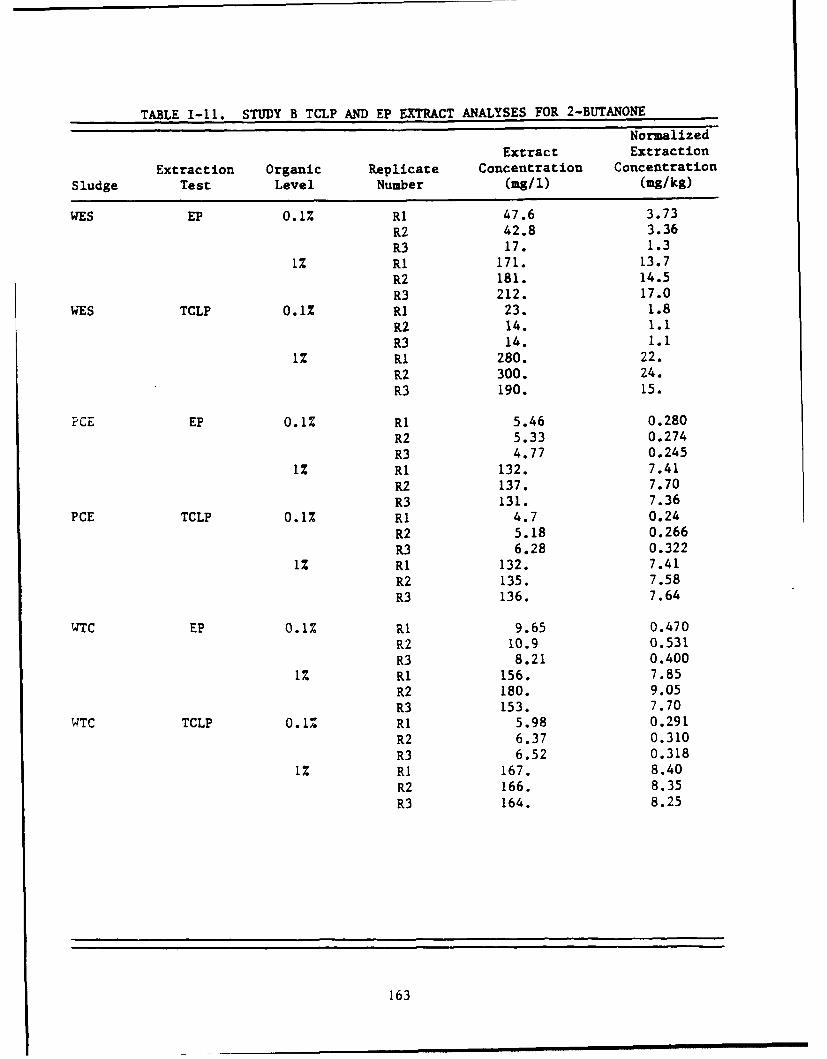
TABLEt 1-11. STUDY B TCLP AND EP EXTRACT ANALYSES FOR 2-BUTANONE
NormalizedExtract Extraction
Extraction Organic Replicate Concentration ConcentrationSludge Test Level Number (mg/1) (mg/kg)
WES EP 0.1% RI 47.6 3.73
R2 42.8 3.36
R3 17. 1.31% Ri 171. 13.7
R2 181. 14.5R3 212. 17.0
WES TCLP 0.1% RI 23. 1.8R2 14. 1.1
R3 14. 1.11% RI 280. 22.
R2 300. 24.R3 190. 15.
PCE EP 0.1% RI 5.46 0.280
R2 5.33 0.274R3 4.77 0.245
1% RI 132. 7.41R2 137. 7.70R3 131. 7.36
PCE TCLP 0.1% R1 4.7 0.24
R2 5.18 0.266R3 6.28 0.322
1% Ri 132. 7.41R2 135. 7.58R3 136. 7.64
WTC EP 0.1% Ri 9.65 0.470
R2 10.9 0.531R3 8.21 0.400
1% Ri 156. 7.85R2 180. 9.05R3 153. 7.70
WTC TCLP 0.1% R1 5.98 0.291R2 6.37 0.310R3 6.52 0.318
1% RI 167. 8.40R2 166. 8.35R3 164. 8.25
163

TABLE 1-12. STUDY B TCLP AND EP EXTRACT ANALYSES FOR4-METHYL- 2-PENTANONE
NormalizedExtract Extraction
Extraction Organic Replicate Concentration ConcentrationSludge Test Level Number (mg/i) (mg/kg)
WES EP 0.1% RI 60. 5.R2 50. 4.R3 14. 1.1
1% RI 175. 14.0R2 193. 15.5R3 210. 17.
WES TCLP 0.1% R1 17. 1.3R2 II. 0.86
R3 12. 0.941% Ri 350. 28.
R2 290. 23.R3 300. 24.
PCE EP 0.1% RI 12.5 0.W42R2 12.4 0.637R3 10. 0.51
1% R1 236. 13.3R2 227. 12.8R3 236. 13.3
PCE TCLP 0.1% R1 I1. 0.56R2 10.3 0.529R3 10.6 0.544
1% Ri 220. 12.R2 263. 14.8R3 258. 14.5
WTC EP 0.1% Ri 7.66 0.373R2 8.3 0.40R3 7.06 0.344
1% Ri 315. 15.8R2 278. 14.0R3 301. 15.1
WTC TCLP 0.1% Ri 4.64 0.226
R2 5.17 0.252R3 4.84 0.236
1% RI 297. 14.9R2 333. 16.8R3 288. 14.5
164

APPENDIX J
GRAPHICAL REPRESENTATION OF THE RESULTS OFTCLP AND EP EXTRACTIONS FOR
STUDY B ORGANICS
Figures J-1 through J-12 are graphical representations of the TCLP and EPextractions for each organic contaminant of Study B. In these figures thenormalized EP extract concentrations are plotted versus the normalized TCLPextract concentrations. A line with a-slope of 1.0 is plotted on each graph.Points which lie on this line indicate that the extract concentrations for theEP and TCLP are equal. Points above this line indicate that the TCLP producedextracts with higher concentrations of the contaminant, and points below thisline indicate that the EP resulted in extracts containing higher concentra-tions of the contaminants.
To compare Figures J-1 through J-12, the difference in scales must beconsidered. To maintain reasonable resolution, the scales were not equivalentfor any of the organic contaminants evaluated.
Inspection of Figures J-1 through J-12 illustrates that for most contami-nants with organic concentration level of 0.1%, the EP and TCLP data weregrouped closely around the line near the axis. This indicates that the TCLPand the EP produce extracts of almost equal concentrations. All the contami-nants with organic concentration levels of 1.0%, except 1,1,2,2,-tetrachlorethane (Figure J-6) and tetrachloroethene (Figure J-7), were moreaggressively extracted by the TCLP than the EP.
165
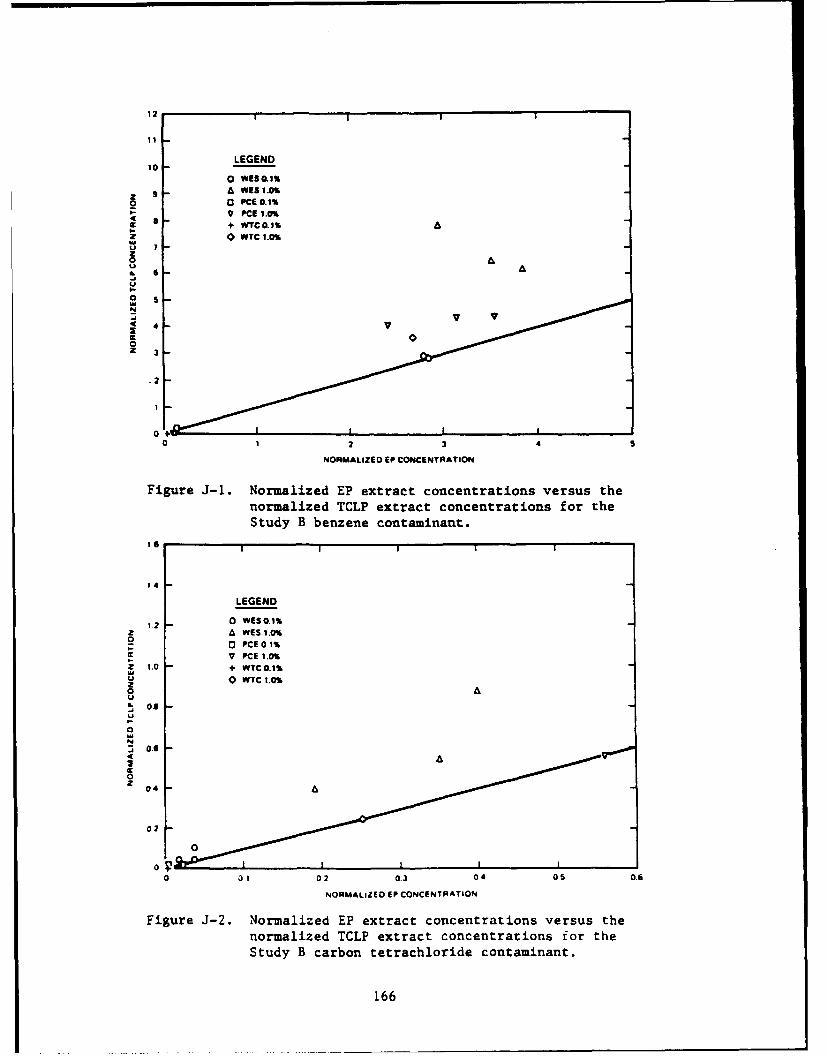
12 I 1 1
11
LEGEND10
0 WES0.1%
9 AWES I.oA%0 o PCE o.1%
9 PCE 1.01+ WTC0.• 6-
z 0 WTCI.01
U 7Z0U
6.
U
Nb .
00Z
-2
0 1 2 3 4 s
NORMALIZED EP CONCENTRATION
Figure J-1. Normalized EP extract concentrations versus thenormalized TCLP extract concentrations for theStudy B benzene contaminant.
1611111
'4 -
LEGEND
1,2 0 WESO.1%z A WES .O%
(0 PCE o 1%9 PCE 1.0%
Z 1.0 + WTC0.1%0 WTC 1.0%
ZA0U
U
0.6
0z 04 a
02
0 01 02 0.3 04 O 0.6
NORMALIZED EP CONCENTRATION
Figure J-2. Normalized EP extract concentrations versus thenormalized TCLP extract concentrations for theStudy B carbon tetrachloride contaminant.
166
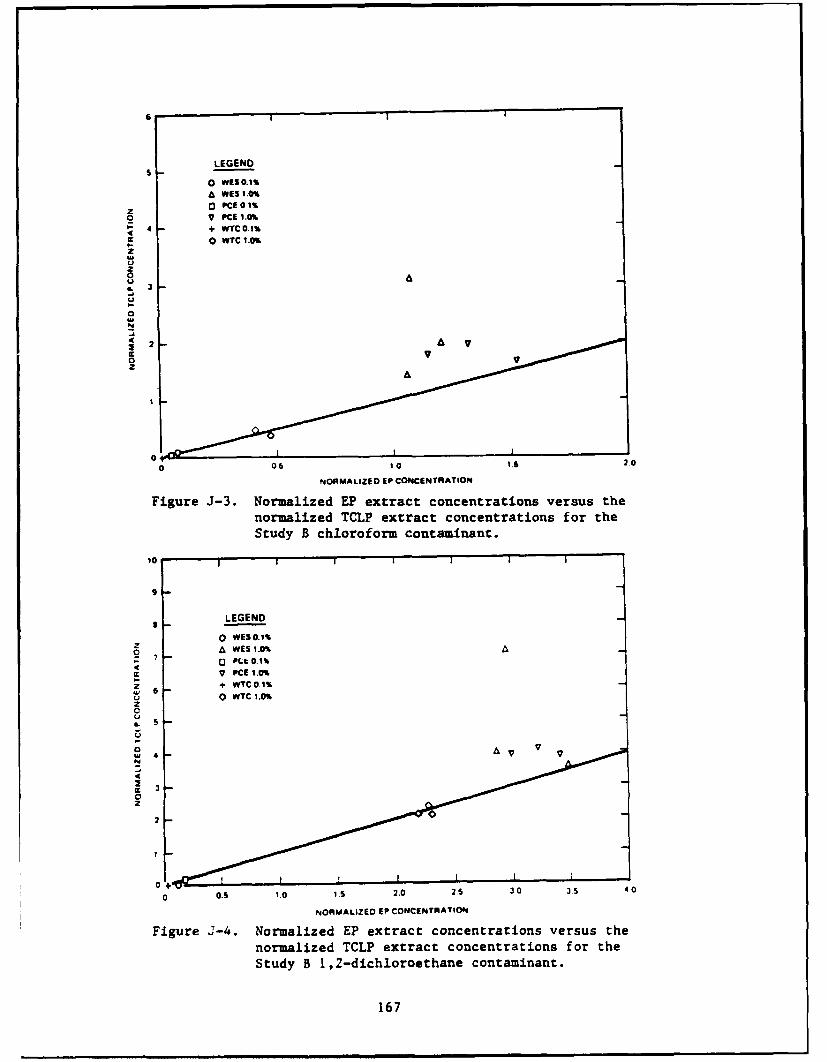
LEGENDS-
0 wFS 0.1%A WES 1.0%[3 PCElo 1%
o V PCE 1.0%"1- 4 -- WTCO.l%
0 WTC 1.0%
Zz
U 2 AU
a
04
0
0 0% 10 t.S 2.0NONMALIZED EP CO#4CENTRATION
Figure J-3. Normalized EP extract concentrations versus the
normalized TCLP extract concentrations for theStudy B chloroform contaminant.
lO
9
$ LEGEND
+0 WC 0.1%oAwESS .0%
Sv lPCE 1.o%
0 6 WTC 1.0%z
L S
w 4-Ni
4
2
0
0 0.5 .0 1,S 2.0 2.S 30 315 40
NORMALIZED EP CONCENTRATION
Figure J-4. Normalized EP extract concentrations versus the
normalized TCLP extract concentrations for the
Study B 1,2-dichloroethane contaminant.
167

to
|a
LEGEND
A WES 1.0%2
0 PCE 0.1%Y PCE 1.0%
£ + WTC0.1-i . 0wrc 1ýot 0U
4 0
9 30
2 0
0
0 1.0 2.0 3.0 4.0 5.0
NORMALIZED EP CONCENTRATION
Figure J-5. Normalized EP extract concentrations versus thenormalized TCLP extract concentrations for theStudy B ethylbenzene contaminant.
7
LEGEND
2 6 0 WESO.1%2 A WES 1.0%
0 PCE 0.1%-4 9 PCE i.0%z +- WTC0A1%wU 0 WTC 1.0%Z 2)0S4L
-JU
0
0 a I I-.0 1 2 3 4
NORMALIZE{) EP CONCENTRATION
Figure J-6. Normalized EP extract concentrations versus thenormalized TCLP extract concentrations for theStudy B 1,I, 2,2-tetrachloroethane contaminant.
168
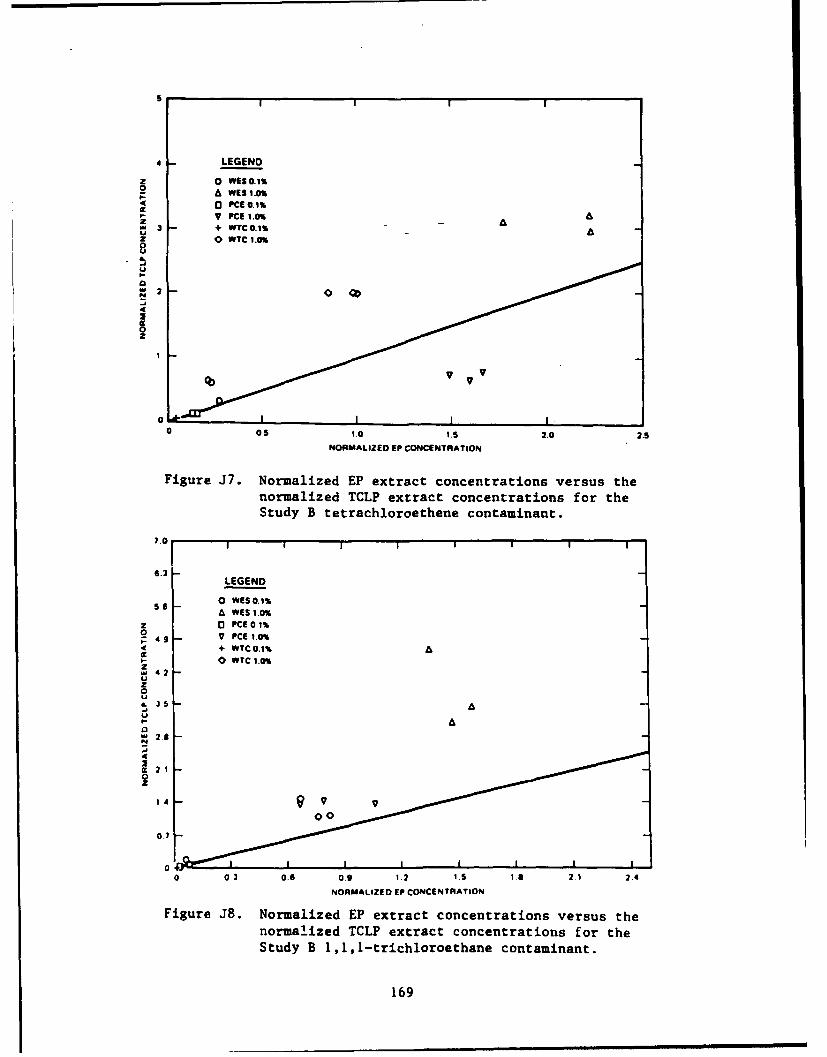
S SI I I
4 LEGEND
Z 0 WESO.I%0I- A WES 1.0%
0 PCE 0.1%V PCE 1.0%Z. 3 - + WTC0.I% -2 +wr-o w - A-0 WTC 1.0%
U
S --
0 O-S 1.0 IS 2.0 2.1
NORMALIZED EP CONCENTRATION
Figure J7. Normalized EP extract concentrations versus thenormalized TCLP extract concentrations for theStudy B tetrachloroethene contaminant.
7.0
.LEGEND
56- 0 WES O.1%S -A W Ut 1.0%&
Z a PCi: 0 1%
SO0 WTC 1.0%I X
S4.2
Z
S2.2
21
N
14
07
0
0 03 0.6 0.1 1 .$ is 2.1 2.4
NORMALIZED EP CONCENTRATION
Figure J8. Normalized EP extract concentrations versus thenormalized TCLP extract concentrations for theStudy B ,ec1-trichloroethane contaminant.
169
LEGEND.mmme em m me m m mm m m
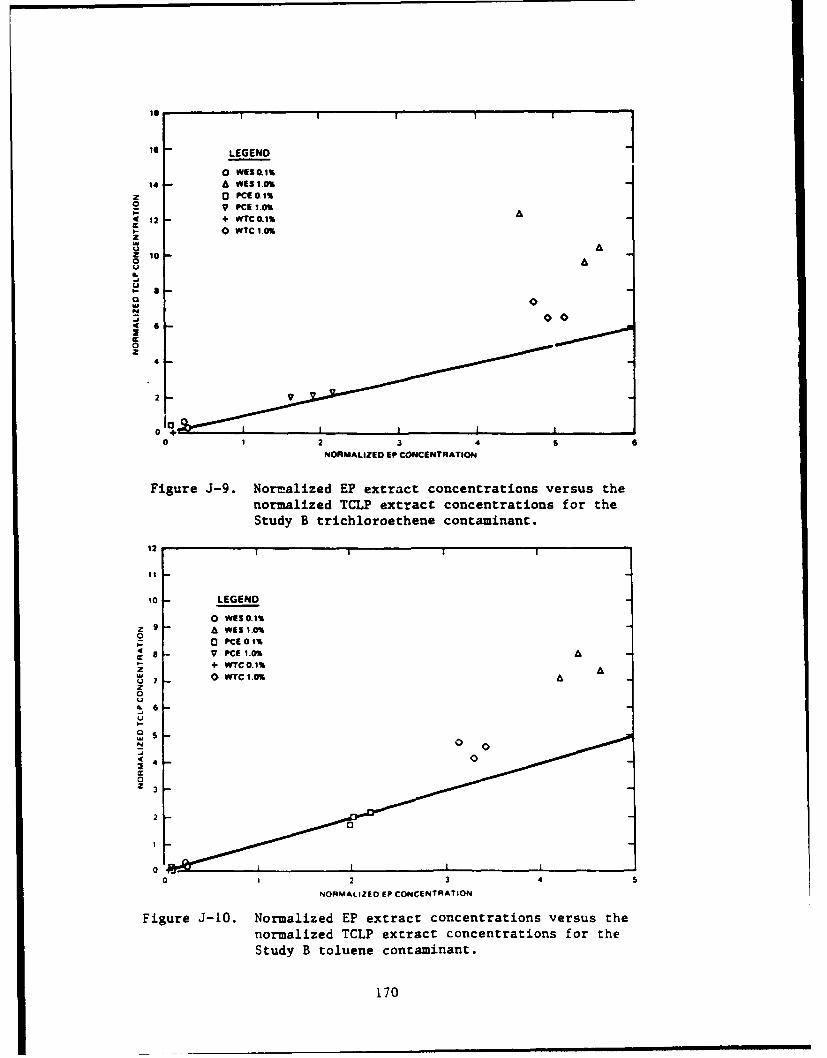
II Ii I I!
LEGEND
0 WESo.I%14 A WES 1.1%
Z 0 PCE 0. I2V ICE 1.0%
A 12 + WTC0.l%w1 0 WTC 1.01
210 0 AZ
40 +
2
I I
00 1
12
10 LEGE3ND5
I . 0ws .I
z 9 A WlES .0•0
0 PCE 0, 1SV PCE 1.0A
S+ WITC 0. 1%
7 0 WTC 1.0%
0U
t6U
0
00
S3
2
00 1 2 3 4
NORMALIZEO EP CONCENTRATION
Figure J-10. Normalized EP extract concentrations versus thenormalized TCLP extract concentrations for the
Study B toluene contaminant.
170

40
3' - LEGEND
0 WESO.1%A WES 1l.
z 30 - 0 PCE 0.1%2 V PCE .O% A
+ WTC 0.1%
z 25- 0 WTC 1.0%
U
0 0N0 V15 -
0
SZ 0
0 10 ii 20
NORMALIZED tP CONCENTRATION
Figure J-11. Normalized EP extract concentrations versus thenormalized TCLP extract concentrations for theStudy B 4-methyl-2-pentanone contaminant.
35
30 LEGEND
0 WES 0 I•%a was I 0%
z2 0 PCE0 1%I PCE 1.02S
+ 4"wIC 0 I%0 WTC 1.0%
ZU200Ua.
10
S
NORMALIZED (P CONCENTAATION
Figure J-12. Normalized EP extract concentrations versus thenormalized TCLP extract concentrations for the
Study B 2-butanone contaminant.
171
Nl tl llli iaii ill U I DII H i

Waterways Experiment Station Cataloging-in-Publication Data
Bricka, R. Mark.A comparative evaluation of two extraction proced ires: the TCLP
and the EP / by R. Mark Bricka, Teresa T. Holmes, M. John Cullinane;prepared for Risk Reduction Engineering Laboratory, U.S. EnvironmentalProtection Agency.
184 p. : ill. ; 28 cm. - (Technical report; EL-92-33)Includes bibliographical references.1. Hazardous waste sites - Leaching. 2. Leachate - Testing.
3. Extraction (Chemistry) 4. Organic water pollutants - Testing.I. Holmes, Teresa T. II. Gullinane, M. John. Ill. Risk Reduction Engi-neering Laboratory (U.S.) IV. U.S. Army Engineer Waterways Exper-ment Station. V. Title. VI. Series: Technical report (U.S. ArmyEngineer Waterways Experiment Station) ; EL-92-33.TA7 W34 no.EL-92-33