ad-a251 187 - apps.dtic.mil · ad-a251 187 office of naval research contract n00014-90-j-1159...
TRANSCRIPT

AD-A251 187
OFFICE OF NAVAL RESEARCH
Contract N00014-90-J-1159R&T Code 413n007
Technical Report No. 9
Class B Sodalites: Nonstoichiometric Silver,Sodium Halosodalites
byDTICA. Stein, G.A. Ozin and G.D. Stucky Q ECT B
Prepared for Publication in g i
Journal of the American Chemical Society
May 15, 1992
Reproduction in whole or in part is permitted for any purpose of the UnitedState Government.
This document has been approved for public release and sale; itsdistribution is unlimited.
This statement should also appear in Item 12 of the Report DocumentationPage, Standard Form 298. Your contract number and R&T Code should bereported in Item 5 of Standard Form 298. Copies of the form are availablefrom your cognizant grant or contract administrator.
92,,I1414
9 2 5 2 7

REPORT DOCUMENTATION PAGE OM O. 070"ov88
a"maao~ tnui nedd 0""Wan a" -e N4h4 lo CW"f rome fff i.W roes fbwamamo iaft's me adw*e t.0=' t9iWo oSjla to~4 %Jhaqtgdl. VGed~ndr msa.~ft coetrf fo "Wra onersoo. and 010at0n% Ills je"Ofta
0000%~ ~ ~ ~ ~ ~ ~ ~ ~ ~ ~~~~ka~a pqmq we1M. V10: *fk~ AdenmM u" -.-- "emProw. WglW41UftWS~q0* OC 2010
1. AGENCY USE ONLY (Leav* Wlait) 2. REPORT DATE 3. REPORT TYPE AND DATES COVERED105-15-92 Technical 06-01-91 to 05-31-92
AL TITLE AND SLUBTITLE S. FUNDING NUMBERSClass B Sodalites: Nonstoichiometric Silver, N00014-90-J-1159Sodium Halosodalites
L. AUTHOR(S)A. Stein, G.A. Ozin, and G.D. Stucky
7. PERFORMING ORGANIZATION NAME(S) AND ADORESS(ES) &. PERFORMING ORGANIZATIONUniversity of California REPORT NUMBER
Department of Chemistry T9Santa Barbara, CA 93106
9. SPONSORING/ MONITORING AGENCY NAME(S) AND ADORESS(ES) 10. SPONSORING/ MONITORING
Office of Naval Research AGENCY REPORT NUMBER
Chemistry Program800 N. Quincy StreetAlexandria, VA 22217
11. SUPPLEMENTARY NOTESPrepared for Publication in the Journal of the American Chemical Society
128. DISTRIBUTION I AVAILABIUTY STATEMENT 12b. DISTRIBUTION CODEApproved for public release;distribution unlimited
13. ABSTRACT (Maximum 200 words)
Nonstoichiometric silver, sodium bromosodalites of the compositions Ms..2nN2 ,,X2.pOHpSOD andMs~.2N2X2i,,..SOD have been synthesized, where M, N = Ag+, Nat; X = Ch- Br, P-; 2n = 0-8; p = 0-2; [0 refers toanion-five cages and SOD = (SiAIO4)66-. These materials allow one to control the filling of both Ag+ and X- ions in asodalite host lattice in a systematic manner, to fabricate Na4.nAgnX semiconductor-component clusters. Combinedresults from powder XRD, Rietveld refinement, 23Na MAS and DOR NMR, far-ill and mid-IR indicate that thesesodalites form a solid solution of Na3-,Agn clusters in anion-free B-cages interspersed with Na4,AgnX. The clusters arestatistically distributed throughout the lattice. However, silver ions are associated preferentially with cavities containinghalide anions. The data also demonstrate that these materials offer the opportunity to manipulate the extent of collectiveelectronic and vibrational interactions between monodispersed Na4_AgnBr clusters in a perfectly crystalline host. Theanion strongly mediates the vibrational coupling. The electronic coupling between clusters increases with Ag+ and X-loading level. Support for this idea comes from extended Hackel molecular orbital calculations. At low Ag+/X-loadings, intrasodalite AgX resembles the gas phase molecule (bond length, optical spectra). Optical absorption bandsbroaden and the absorption edge moves towards that of the bulk semiconductor at higher Ag+/X- loadings.
14. SUBJECT TERMS 15. NUMBER OF PAGES
4516. PRICE CODE
17. SECURITY CLASSIFICATION 18. SECURITY CLASSIFICATION 19. SECURITY CLASSIFICATION 20. LIMITATION OF ABSTRACTOf REPORT OF THIS PAGE OF ABSTRACTUnclassified Unclassified j Unclassified UL
NSN 7sa40O1.280SSOO Standard Form 298 (Rov 2-89)Alcnao W A01 iPStdl 19

Class B Sodalites: Nonstoichiometric Silver, SodiumHalosodalites
Andreas Stein, Geoffrey A. Ozin
Lash Miller Chemical Laboratories, University of Toronto, 80 St. George SL, Toronto,
Ontario, Canada, M5S lA.
Galen D. Stucky
Department of Chemistry, University of California, Santa Barbara, California, U. S. A.,
93106
Abstract
Nonstoichiometric silver, sodium bromosodalites of the compositions M-2uN2nX2-pOHp-SOD and M.p-2nN2nX2-p~p-SOD have been synthesized, where M, N - Ag , Na; X =C1, Br, r; 2n = 0-8; p - 0-2; 0 refers to anion-free cages and SOD - (SiAlO4)6&. Thesematerials allow one to control the filling of both Ag + and X ions in a sodalite host lattice ina systematic manner, to fabricate NanAgnX semiconductor-component clusters. Combinedresults from powder XRD, Rietveld refinement, 23Na MAS and DOR NMR, far-IR andmid-IR indicate that these sodalites form a solid solution of Na3-mAgm clusters in anion-freefl-cages interspersed with Na4.nAgnX clusters. The clusters are statistically distributedthroughout the lattice. However, silver ions are asssociated preferentially with cavities con-taining halide anions. The data also demonstrate that these materials offer the opportunity tomanipulate the extent of collective electronic and vibrational interactions betweenmonodispersed Na4.AgnBr clusters in a perfectly crystalline host. The anion stronglymediates the vibrational coupling. The electronic coupling between clusters increases withAg + and X loading level Suport for this idea comes from extended Hickel molecularorbital calculations. At low Ag /X loadings, intrasodalite AgX resembles the gas phasemolecule (bond length, optical spectra). Optical absorption bands broaden and the absorptionledge moves towards that of the bulk semiconductor at higher Ag '/X- loadings.
To be submitted as a Paper to the Journal of the American Chemical Society.
2
Introduction
Recently we have shown 12 that Class A silver, sodium halosodalites allow the atomically
precise assembly of I-VI semiconductor components in a sodalite lattice. By tuning the silver
concentration it was possible to cover the range from silver bromide exhibiting molecular
behavior at low silver loadings to an expanded silver bromide supralattice at complete silver
exchange1. In this paper a series of novel silver, sodium halo, hydrosodalites of the type
Nas.p-2nAg2aX2-pap-SOD, where SOD - Si6A16024, 0 = an anion free cage, p = 0-2,n =
0-8, will be discussed, which are derived from NagX2.p(OH)p-sodalites3. In these materials
single size Na4-aAgnX (n = 0-4) clusters are dispersed within a perfectly periodic array of
all-space filling P-cages, but in contrast to the previously described sodalites (Class A, Class
C)4'4 they are isolated from each other by sodalite cages containing no anion, forming a ClassB supralattice of non-stoichiometric 5 silver, sodium halosodalite. The anion-free cages arefilled with Na3-nAgn (n = 0-3) triangles, and in the hydrated form, with water molecules.
Denks5 has defined a nonstoichiometric sodalite as a solid-phase solution of NaX-SOD and
Naa-SOD, in which overall f-cavities with sodalitic and zeolitic fillings are statistically
interspersed. Our definition of Class B sodalites also includes sodalites containing non-
stoichiometric amounts of other anions, including the oxalates6 and the halates recentlyprepared by Hund and Geismar (Na&X2.p(OH)p-SOD, X = C1O3, BrO3, C104)7, as well as
their silver derivatives. The endniembers for p = 2, non-basic hydrosodalite (Nao-SOD),
hydroxosodalite (NaOH-SOD, basic hydrosodalite) are considered in this paper as special
cases of Class B sodalites. The other endmembers of the series with p = 0 are really Class Asodalites. The hydrated forms of Class B sodalites contain additional water molecules, e.g.,
zeolite Zh = NaD-SOD, up to four water molecules per fl-cage, and NaOH-SOD one water
molecule per cavity8 (up to two water molecules according to Ernst et aL and Felsche et aL 9110
and up to three according to Denks5 ). As water can pass through the sodalite six-rings, these
framework aluminosilicates can be classified as zeolites5.
For Class A sodalites it has been shown 2, that orbital overlap and electronic/vibrational
communication is possible between clusters in adjacent cages and therefore throughout the
lattice. In Class B sodalites on the other hand, cages lacking an anion break the periodicity
3...
between Ag4X3 ' clusters. This effect can change co-operative effects between clusters, which
require the presence of a halide atom (vibrational) or its orbitals (electronic). For a solid
solution, variations in the halide content, p, are expected to alter the mean distance between
Na4.oAgnX clusters while changes in the silver content, n, and thus the sodium:silver ratio,shift the constituents of the clusters from those of an insulator to a semiconductor type. At
* low halide and silver concentrations isolated AgX molecules may be produced in Class B
materials. Such controlled tunable volume filling and compositional alteration of the contents
of the sodalite P-cages provides an unprecedented opportunity to adjust the extent of
electronic and vibrational coupling between fixed nuclearity Na4.&AgnX dusters. It should
therefore be possible to chemically manipulate the electronic band structure of the materials,
and thus their electronic and optical properties. The synthetic details and structural, vibra-
tional, magnetic resonance and optical properties of the Class B sodalites will be addressed in
this paper.
Synthesis
Synthesis of Sodium Sodalite Precursors
The sodium sodalites were prepared by a low temperature hydrothermal synthesis. The
gel compositions are listed in Table 1 and the reagent sources in Table 2. In a typical synthesis,
solution A contained the sodium salt, sodium hydroxide and silica source and solution B
contained sodium hydroxide and the alumina source. These were prepared as follows. For
solution A, 0.6- z moles of NaOH and w moles of the sodium salt to be occluded in the sodalite
were dissolved in 0.6-v moles of deionized water. An aqueous colloidal silica solution
containing y moles of SiO2 was added to the above solution. The solution was mixed and
heated to 80-950C. Solution B was prepared by dissolving x moles of AI(OH)3 in an aqueous
solution containing 0.4 z moles of the NaOH, again at 80-95 0C. The hot solutions A and Bwere mixed rapidly. A gel formed almost immediately upon mixing. The gel was shaken for
5 minutes and the mixture was heated at 950C for 3 - 9 days in 1000 mL capped teflon (FEP)
bottles. The white, microcrystalline products were filtered through ASTM 10-15 medium pore
glass frits and washed with 2-4 L deionized water. The products were dried in air at ambient
temperature.
4
Soxhlet Extraction
Sodium hydroxosodalites and sodalites containing hydroxide in addition to halide anions
were Soxhlet extracted to remove one NaOH molecule per cage. The hydroxide ion is the only
anion small enough to pass through the sodalite six-rings at room temperature. About .5 g ofsodalite were placed in a thimble and continuously refluxed for 3 days in a Soxhlet extraction
apparatus with 500 mIL deionized water. Concentrated H2SO4 (2 mL) had been added to the
water to prevent foaming and improve the extraction efficiency.
Silver Exchange
Melt Exchange
Silver-containing sodalites were prepared by a melt ion exchange of a mixture containing
the parent sodium sodalite, AgNO3 (Fisher, 99.8%), and, in some cases, NaNO3 (ACS grade)
as diluent. Typically, 1-2 g of sodium sodalite was mixed with silver nitrate (m.p. 2120C) in aporcelain mortar. For complete silver exchange a slight excess of silver nitrate was used, while
for partial exchanges stoichiometric amounts were used. The mixture was heated in the darkto 230 0C for 24 hours (3200C if NaNO3 was used). The products were filtered in the dark
through a 0.8 pm cellulose nitrate filter membrane, washed with ca. 2 L of deionized water,
and dried in air at ambient temperature. Because of their light sensitivity, the white-to-yellow
dry powders were stored in dark simple vials.
Aqueous Exchange
An aqueous ion exchange is possible for even milder exchange temperatures (roomtemperature up to 1000C). Sodium sodalite was added to an aqueous solution containing
stoichiometric amounts of silver nitrate. The mixture was stirred in the dark for 24 hours at
room temperature. The product was filtered, washed in the dark and dried in air. Analysis by
far-infrared spectroscopy showed that replacement of sodium by silver had proceeded to 7
completion, or nearly so. -
IU .
5
Dehydration
The sodium sodalites were dehydrated under vacuum (10 - 10 tofr) by the following
temperature ramps. Room temperature to 1000C in 30 minutes, held at 1000C for one hour,
100 - 450 0C (or 5500C) over 4 hours, and then held isothermally at 4500C (or 5500C) for I
hour. Since Ag + ions are easily reduced, sometimes even after pumping, samples containing
Ag + were heated to 1000C much more slowly, held at that temperature for a longer time and
heated to a lower maximum temperature (ca. 3000C - 4500C) than sodium sodalites. Dehydra-
tion of relatively open sodalite systems (those containing anion-free cages) occurred at
considerably lower temperatures (ca. 1000C lower) than for sodalites in which all cages were
filled with anions. In the latter, all the < 111> channels are blocked by Na + ions, and it is
only after partial removal of the Na + ions from the centers of the 6-membered windows that
it becomes possible for the water molecules to leave5.
The product crystallinity was monitored by powder XRD at each step. The reactions are
summarized in the following scheme:
Na8Br2.p(OH)p-SOD
- pNaOH (Soxhlet)
Nas.pBr2.pap-SOD
+ 2nAg+ (melt)
Nas-p.2nAg2nBr2.pOp-SOD + 2nNa +
Details of the chemical analyses, powder XRD, Rietveld refinement, 2Na MAS and
DOR NMR, far-IR, mid-IR, optical reflectance spectroscopy and extended HfIckel molecular
orbital calculations have been recently described2.
Product Characterization
Chemical Analysis
Samples containing various substoichiometric amounts of halide have been synthesized
with the silver loading varied over the whole range of 2n = 0-8. A chemical analysis (Table
6
3) showed that the products obtained from the bydrothermal synthesis consisted of both
Na4OH and Na4Br occupied cages, and that the amount of halide included in the
hydroxosodalites was generally much lower than the amount added to the reaction vessel The
isotherm for bromosodalite favors the inclusion of bromide over hydroxide or water u .
However, as for most sodalites, excess salt is required to form a product in which all cages are
filled with monovalent anions. Otherwise, the sodalites contain cages with imbibed hydroxide
or water, or completely different phases such as cancrinite can be created11.
The bromide concentrations were virtually identical for a sodalite before and after
Soxhlet extraction. Because of their size (r(Br) = 182 pmn, C.N. 6)12 bromide ions were not
washed out through the sodalite six-rings (r - 1.10 - 1.30 A) ', and their distribution
throughout the sodalite lattice could not change after the hydrothermal synthesis.
The sodium aggregates could be progressively exchanged by silver ions to yield at full
substitution the corresponding mixture of (2-p)Ag4Br and pAgs units. A single sodalite phase
was observed for a given bulk composition by powder XRD in fully hydrated samples after
each reaction step. In a completely silver exchanged sample containing Br in 1 out of 8 cages,
less than 0.9 mol% Na was found by chemical analysis after aqueous exchange.
Powder XRD - Unit Cell Dimensions
Knowledge of the effect of the sodalite composition on the unit cell size and the
interatomic distances is vital to understand the coupling between atoms, and thus the
electronic and optical properties of the materials. The unit cell sizes of the Class B sodalites
studied are listed in Table 4. The edge lengths of the cubic unit cell depended on the silver
and bromide concentrations as well as on the degree of hydration. The response of the sodalite
framework to the gradual addition of Br' anions to the unit cell of Nao-SOD, eventually
yielding NaBr-SOD, is shown for the fully hydrated samples in Figure 1. The interpretation
of the unit cell data requires an appreciation of the role of imbibed water. Neutron diffraction
studies on Naf-SOD nH2O (n = 0, 8)10,14 demonstrate that the water molecules are both
coordinated to the Na + six-ring cations and hydrogen-bonded to the framework oxygens. The
first Br' entering the Na3 cages to form Na4Br clusters, causes the unit cell to expand (partial
loss of structural hydrogen-bonding from #l-cage imbibed H20) while the further influx of Br'
7
up to full loading has a cage contraction effect (electrostatic attraction by Na4Br formation)
as seen by the gradual diminuation of the sodalite unit cell dimension. Upon dehydration the
unit cells of these samples expand, thus providing evidence for the retention of some degree
of structural hydrogen-bonding in the series of hydrated samples, even in the presence of
bromide. A monotonic cage contraction effect with increasing bromide content is observedwithin the dehydrated series.
In the analogous series of hydrated silver sodalites a slight contraction of the unit cell is
observed for higher bromide concentrations (Figure 1). This can again be understood by
invoking electrostatic effects due to an interaction between the halide, cations and framework
oxygens. The difference in cell dimensions between corresponding sodium and silver sodalites
is small, as these cations have nearly identical radii (4-coordinate r(Na + ) = 1.13 A, r(Ag + )
- 1.14 A)12. The exceptional cell expansions after introduction of silver to bromide-free
NaO-SOD may be related to differences in hydrogen bonding for the two cations, water and
framework oxygens. This effect will be discussed later in more detail.
In contrast to the bromo, hydrosodalites, NaBrfJ-SOD, the unit cell of the hydrated
bromo, hydroxosodalites, NaBrOH-SOD increases monotonically as the bromide contentrises. In this case the effect is spatial, the larger bromide ion requiring more room than thehydrated hydroxide ion. In basic sodalite no essential H-bonding exists between framework
oxygens and those of the trapped water/hydroxyl groups, and the unit cell is known to contract
after dehydration'" 6.
Rietveld Refinement
Class B sodalites can be compared to the mineral nosean1"'1 . Nosean has the ideal
composition Nas[Al6Si604]SO4-H20 and contains ordered clusters of the types
[Na4 S04]2 + and [Na4. H20 + in a 1:1 ratio. The ordering has been ascribed to a differencein the net charge and size of these clusters. Antiphase domain boundaries arise from the
ordering of clusters. Each domain belongs to the space group P23, a subgroup of PT3n. The
average space group is PZ3n. The cluster ordering leads to positional modulations of the
framework oxygens, i.e., two well defined framework oxygen atom positions in nosean. Super-

8
structure reflections in sulfatic sodalites generally do not give rise to an integral multiple ceLl19;
their superstructures are thus incommensurate17I 1 *
Rietveld refinements of high resolution powder XRD data were carried out on several
samples of the Na&2a.pAg2nBr2.pOp-SOD series for n - 0, p = 0, 1.7,2 and n = 4, p - 0, 0.8,
1.5, 1.7,2. The crystallographic data are given as Supplementary Material. No superstructure
reflections were observed in the powder patterns, indicating the absence of guest ordering.
Only one average type of framework oxygen was therefore refined. Si-Al ordering in the
framework was indicated by the 29Si MAS NMR spectrum of typical silver exchanged parent
materials which exhibited only one sharp peak (NaAgBrOH-SOD BrLI, 2Ag/u.c., ao =
8.929(2) A, -85.3 ppm verm TMS; AgOH-SOD, ao = 8.786(2) A, -81.3 ppm; compared to e.g.,
NaOH-SOD, -84.3 ppm hydrated, -81.0 ppm dehydrated2°). Most samples refined well
assuming an average space group PZ3n and a solid solution of cages (commensurate) with or
without bromide ions, Figure 2. With the exception of one sample, all R-factors were in the
ranges wRp: 9.8 - 13.5 %, Rp - 73 - 9.9 %, so that good unit cel sizes as well as the locations
and separations between framework and guest atoms could be determined. Table 5 sum-
marizes the results from the refinements and lists structural parameters of related sodalites
from the literature.
One may expect silver to occupy more than one type of position, depending on the
additional guest species present in each cage. Structural refinements were therefore carried
out using one average type of silver (both, isotropic and anisotropic temperature factors), or
two types of silver atoms (corresponding to silver tetrahedra and silver triangles with vertices
situated on the three-fold axes near the sodalite six-rings), Table 6. The Ag-X distance (X = Br
or center of cage) obtained from the isotropic calculations turned out to be the mole-fraction
weighted average of the two distances obtained in the calculation where two silver atoms were
allowed. The two positions were so close (within 0.26 A) that they could not be reliably
resolved by using a scan range to 100029 with Cu-Ka radiation. An EXAFS analysisx t was also
unable to distinguish between two silver sites. Even when anisotropy was invoked, the final
temperature factors refined to nearly spherical symmetry. The R-factors for each calculation
were so similar that a choice between the three alternatives could not be made. Data
corresponding to the average isotropic silver atoms are presented here.

9
Because of the presence of hydrogen bonding in hydrated samples, the cage dimensions
and AI-O-Si angles depend strongly on the water content. For example, in Nao-SOD,
depending c. -he degree of dehydration, ao varies from 8.87 (4 H20/cage) to 9.11 A (no H20)5.
Any ions that interact with water have a significant effect on unit cell parameters. The effect
of hydrogen bonding leads to a much larger range of Al-O-Si angles than in Class A and Class
C sodalites222: 133 - 1560. The increase in range also applies to the x, y and z coordinates of
framework oxygens which are involved in the hydrogen bonding.
In situations where water is not hydrogen bonded (NaOH-SOD) it performs only a
space-filling role. Complete dehydration results in a contraction of the cage 0. However,
whenever hydrogen-bonding via the water occurs, as in Naa-SOD, the water pulls the six-ring
oxygen atoms closer together (distance of framework oxygens to center of six-ring: Nao-
SODhyd < NaBr-SOD < NaBrO-SOD BrLI < < Na-SODdehyd); the concomitanm tilting
causes a cage contraction. In addition, a strong interaction between sodium ions and water
oxygens draws the water molecules towards the sodium ions. The Na-Owaer distance of 2.44
- 2.46 A compared well with the literature distance23 reported for aqueous sodium ions: 2.40
- 2.50 A. With tetrahedral arrangements of cations and water (or pseudotetrahedral for three
cations in four sites), the net pull is toward the center of the cage, resulting in cage contractions
(distance of framework oxygen to center of cage: Nao-SODbyd < NaBr-SOD < NaBrf-SOD
BrLU < < Nao-SODdehyd). In thoie instances, dehydration removes the "ties", yielding a cell10expansion
The present study has shown that addition of a little silver to hydrated Class B sodalites
causes a large unit cell size increase. This effect cannot be spatial as the ionic radii of
four-coordinate Ag + and Na + are virtually equal. It is proposed that the expansion originates
from the different hydration tendencies of Ag + compared to Na +. For low hydration
numbers, gas phase silver ions have been shown to bind to water more strongly than sodium
ions24 . This behavior has been related to the tendency of silver ions to exhibit two-fold
coordination due to mixing of dz2, s and pz orbitals25. In the confinement of the sodalite cage,
however, linear coordination with water is not possible. The refinement data show that silver
ions are less strongly associated with the water molecules than the sodium ions are (longer
cation-water oxygen separation: > 2.8 A, compared to literature values23 of aqueous Ag 4 :
10
2.31 - 2.43 A). The water molecules are not drawn as closely to the silver ions and therefore
move closer to the six-rings. While the six-ring oxgyens are still bridged by water molecules
through hydrogen bonding (d(Oframework - OwNaer) < 3.5 A in all cases0), they are now not
pulled strongly to the cation. In this case a less favorable orbital overlap between silver and
water may lead to a lower binding energy compared to sodium, resulting in the longer
cation-water separations, that were observed in the silver sodalites. As soon as the first silver
ion is added, it breaks the tetrahedral symmetry of the cation cluster. The net force on the
water molecules which pull the framework oxygens is no longer towards the cage center,
although framework distortion may still occur. The result is a drastic framework expansion
even at low silver concentrations (see Figure .
In the hydroxide series a small addition of silver also causes a drastic expansion of the
unit cell. In hydroxosodalites, hydrogen bonding between the framework and guest con-
stituents is not invoked, as the separation between framework oxygens and oxygens in the
complex cation (Na4OH-H20) 3+ exceeds 3.5 A 10. Because of the different hydration
behavior for Na + and Ag +, replacement of Na+ by Ag+ ions may lead to rearrangement of
the complex cation and change its space-filling character, resulting in the observed unit cell
expansion.
Anion Distribution
Spectra obtained by mid- and far-IR, MAS-NMR, and powder XRD showed single sets
of peaks whose positions depended on the sample composition, rather than revealing a
superposition of peaks corresponding to the end members of the series (p = 0, p = 2). These
results point to a 3-D commensurate, compositionally disordered solid-solution model, instead
of one involving ordering (crystallographic superlattice), domains or complete segregation of
M4Br and M3 aggregates (M - Na +, Ag + ). The (2-p)M4Br clusters are randomly organized
in the sodalite lattice of pM3 spectator cationic triangles.
Cation Distribution
In partially silver exchanged Class A sodalites, where every P-cage is filled with only one
type of halide anion, silver is distributed randomly throughout the lattice2. However, for Class
11
B sodalites, both UV-visible reflectance and double rotation (DOR) 23Na-NMR spectroscopy
provided evidence for preferential silver aggregation in halide-containing cages over anion-
free cages at intermediate bromide and silver loadings. Figure 9 shows UV-visible reflectance
spectra for the whole range of bromide concentrations of NaAgBro-SOD with 2 and 8 Ag/unit
cell, respectively. At full silver exchange, but intermediate Br loading, the spectrum shows
features associated with silver in both Br-cages and fl-cages (see below). In only partially silver
exchanged NaAgO-SOD, a strong absorption due to Ag + in the anion-free cages is observed.
However, when bromide is present in partially exchanged samples, absorption features per-
taining to silver in bromide cages predominate in all cases, indicating that siiver aggregates
preferentially in the halide-containing cages, where stronger covalent bonding between Ag-Xis possible.
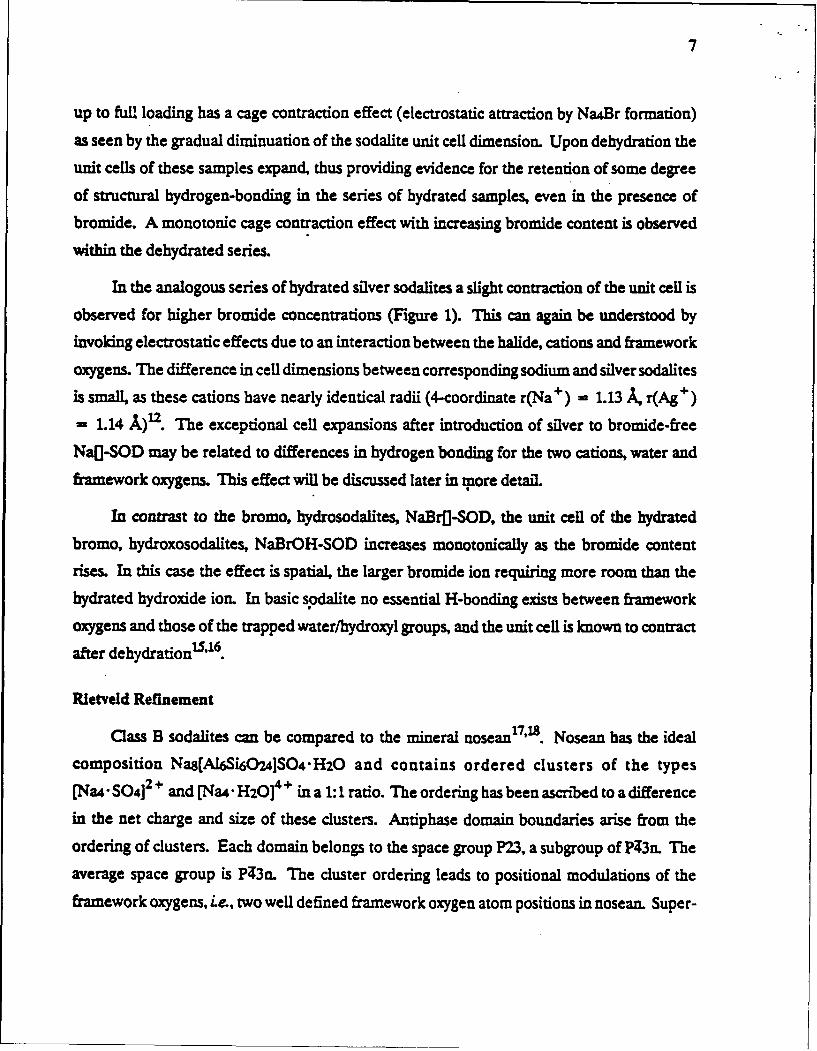
NfR spectroscopy (see below) was utilized to monitor the changes that occurred at
specific cation sites after silver exchange. Figure 4a shows 23Na DOR NMR spectra of
NaAgBro-SOD, BrLlfl (Table 3) containing 2 and I Ag/unit cell and their silver free parent
sodalite. In the parent material, two sodium resonances are observed, at 5.3 ppmvvus a dilute
aqueous NaCI solution (associated with Br-cages) and -4.6 ppm (associated with 0-cages). For
silver exchanged samples, the intensity of the resonance corresponding to the Br-cages is
progressively reduced with increasing silver content. At the same time the second resonance
remains at nearly constant intensity. In samples with lower bromide loading (BrLI) the high
frequency resonance disappeared almost completely after 2 Na + ions per unit cell had been
replaced by silver, Figure 4b. The loss in intensity indicates that the sodium concentration is
reduced in those cages containing bromide before the ones containing no anion. Similar
observations were made in NaAgBrOH-SODs. Extended Hickel molecular orbital calcula-
tions have shown that in NaAgX-SOD a bonding MO interaction exists between Ag-orbitals
and X-orbitals. On the other hand, in NaAgo-SOD no overlap of bonding orbitals of Ag with
any other species develops (water not considered). Because of the strength of the silver-
bromide bond, there is a clear preference for the silver to exchange sodium cations in bromide
cages, rather than exchanging sodium in empty or hydroxide cages. Domains of higher silver
concentration were too small ( 50 - 200 A) to be resolved by powder X-ray diffraction, as they
are controlled by the solid solution model proposed for the anions, above.

12
Cluster Interactions: Vibrational Coupling
A comparison of the trend in atomic separations (Table 5) with the corresponding far-IRspectra reveals a dependence of the vibrational coupling on the bromide content of thesesamples. The far-IR spectra for samples with varying bromide content (Figure 5a) show theeffect of dropping the population of Na4Br clusters from two to zero per unit cell of sodalite.The smoothness of this transformation is demonstrated by the monotonic low frequency shift
of the pore opening framework mode with decreasing halide concentration (Figure 5b). Thesplitting of the Br anion correlation couplet 26 seen at 161 and 68 cm71 decreases as the averageseparation between bromides becomes greater (larger p) (Figure 5c). Its intensity sub-sequently goes to zero. However, the Na + cation correlation couplet observed at 200 (E) and105 cm4 (Ai) remains, and each band broadens, due to an inhomogeneous distribution ofNa4Br/Na3. Even at one Br' every fourth cavity (p = 1.54), the collective vibrational couplingbetween Na4Br clusters has been severely suppressed. The absence of the correlation splittingin NaO-SOD 26 demonstrates the requirement of Br' for effective coupling between the Na +ions of adjacent #-cages.
The correlation splitting between the sodium translational modes decreases slightly asbromide is added to the sodalite. If the coupling depended solely on the separation betweenNa+ ions in adjacent cages one wolld expect the opposite trend, since the Na-Na separationbetween adjacent cages was found to decrease at higher Br loadings. However, the Na-X
separation increases at the same time. This provides further evidence that the anion plays asignificant mediation role in the coupling between Na + ions. Since non-basic hydrosodalite,containing only cationic triangles exhibits no correlation coupling, it is likely that at dilute
bromide concentrations the Na+ coupling occurs predominantly between cages containingsodium tetrahedra. The overall effect is therefore complicated by the extent of connectivitybetween MBr4 clusters throughout the lattice. Similar, but less pronounced effects can bediscerned in the far-IR spectra of the corresponding fully Ag + exchanged Ags-pBr2-p]p-SOD.
The Ag-X distance decreases at higher Br- loadings. One might expect an increase in Ag-Ag
correlation coupling. Unfortunately the correlation couplet Al type partner of the E-type

13
silver translational mode at 91 cm "1 was not observed in'the experimental range down to 50
=7 l and the above idea could not be tested with the silver samples.
Cluster Interactions: Electronic Coupling
Solid State NMR
Evidence for collective electronic interactions stems from both the 23Na NMR spectra
and UV-visible absorption spectra. 23Na MAS NMR spectra of hydrated Class B sodium
sodalites show two components, a sharp band (full width at half height (FWHH): 310 - 380Hz) ca. 1 ppm uptield from solid NaCl and a broad band (FWHH: 1200- 1350 Hz) ca. 17 ppm
upfield from the reference sample, Figure 6. The relative intensity of the sharp to the broad
absorption increases as more bromide is added. In a sample which contains essentially all Br
cages, the band at -17 ppm is virtually absent*. One may therefore assign the broad resonance
to sodium in anion-free cages. A linear correlation between the ratios of sodium in Br and
cages obtained from a chemical analysis and the ratios of the two peak areas confirms the
assignment Rapid chemical exchange between the two cation sites, which has been observed
in other hydrated zeolite samples2 . did not occur, as it would have produced a single Na +
line. Double rotation 23Na MAS NMR spectra2s show the same two features, indicating that
quadrupolar effects can be neglected in the qualitative interpretation of these spectra, Figure
7.
In dehydrated samples only one resonance is observed, which increases in intensity and
shifts downfield with higher Br* loading. This peak is assigned to the 23Na resonance in cages
containing Na4Br. The absence of an observable peak corresponding to Na3 cationic triangles
indicates that intensity loss has occurred through line broadening as a result of greater
localization of cations in the cation sites of the 0-cages 2 , and of locating the bare Na+ ions
in less symmetric environments than hydrated sodium ions °. This greatly increases the
A small remnant is an indicator for some defects: hydroxide or water-containing cages. It may be usedas a gauge to estimate the concentration of such defects.
14
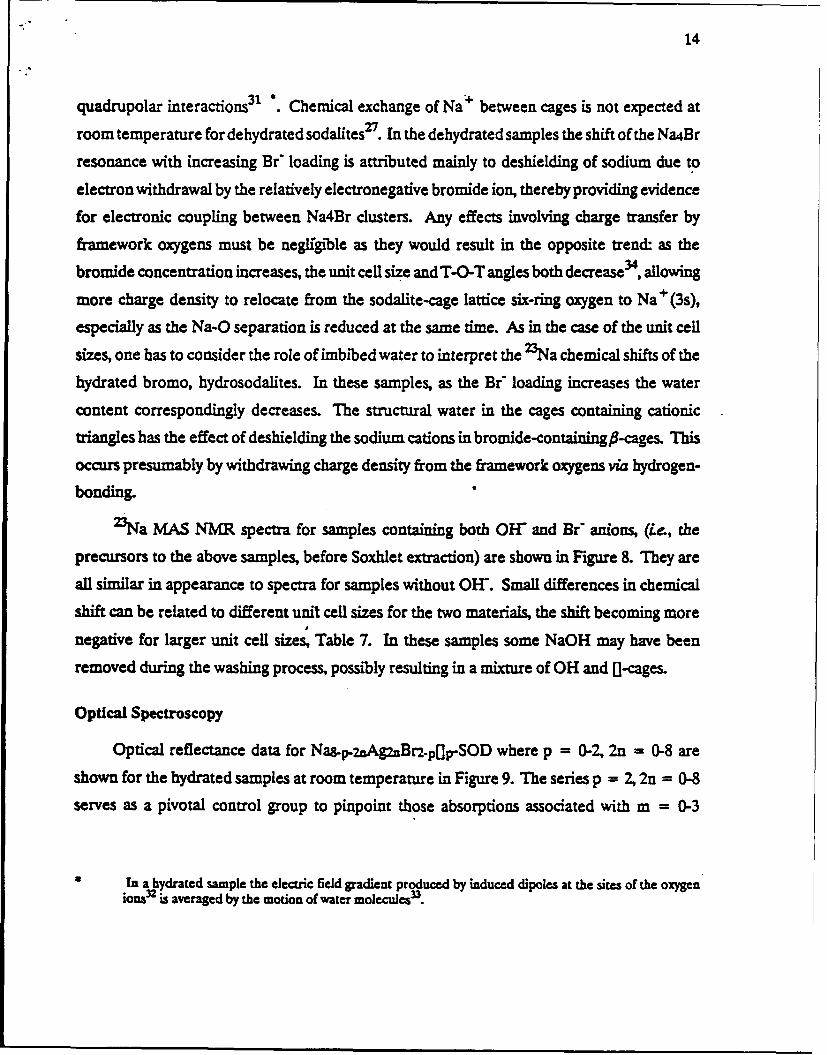
quadrupolar interactions 3 . Chemical exchange of Na between cages is not expected at
room temperature for dehydrated sodalitesV. In the dehydrated samples the shift of the Na4Br
resonance with increasing Br" loading is attributed mainly to deshielding of sodium due to
electron withdrawal by the relatively electronegative bromide ion, thereby providing evidence
for electronic coupling between Na4Br clusters. Any effects involving charge transfer by
framework oxygens must be negligible as they would result in the opposite trend: as the
bromide concentration increases, the unit cell size and T-O-T angles both decrease 4, allowing
more charge density to relocate from the sodalite-cage lattice six-ring oxygen to Na+ (3s),
especially as the Na-O separation is reduced at the same time. As in the case of the unit cell
sizes, one has to consider the role of imbibed water to interpret the 23Na chemical shifts of the
hydrated bromo, hydrosodalites. In these samples, as the Br loading increases the water
content correspondingly decreases. The structural water in the cages containing cationic
triangles has the effect of deshielding the sodium cations in bromide-containing,8-cages. This
occurs presumably by withdrawing charge density from the framework oxygens via hydrogen-
bonding.
23Na MAS NMR spectra for samples containing both OH" and Be anions, (le., the
precursors to the above samples, before Soxhlet extraction) are shown in Figure 8. They are
all similar in appearance to spectra for samples without OW. Small differences in chemical
shift can be related to different unit cell sizes for the two materials, the shift becoming more
negative for larger unit cell sizes, Table 7. In these samples some NaOH may have been
removed during the washing process, possibly resulting in a mixture of OH and 0-cages.
Optical Spectroscopy
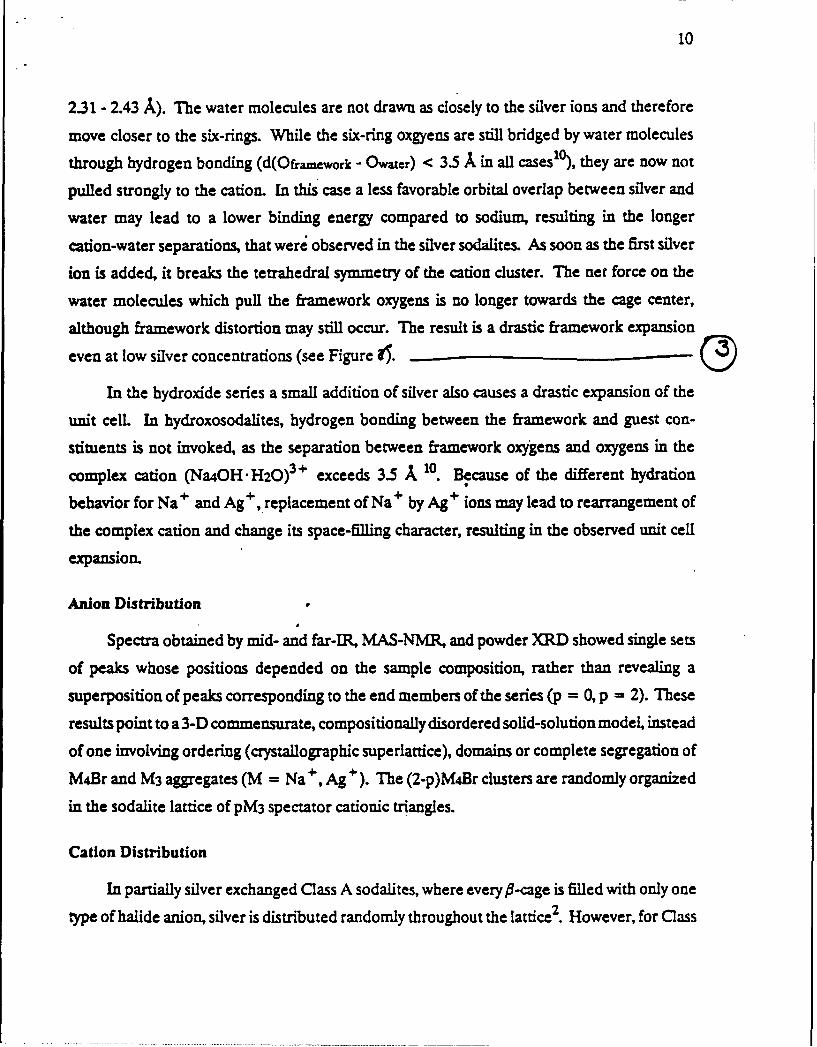
Optical reflectance data for Na&p.-2Ag2nBr2.p0p-SOD where p = 0-2, 2n = 0-8 are
shown for the hydrated samples at room temperature in Figure 9. The series p = 2, 2n = 0-8
serves as a pivotal control group to pinpoint those absorptions associated with m 0-3
In a hydrated sample the electric field gradient produced by induced dipoles at the sites of the oxygenions2 is averaged by the motion of water molecules 33.
15
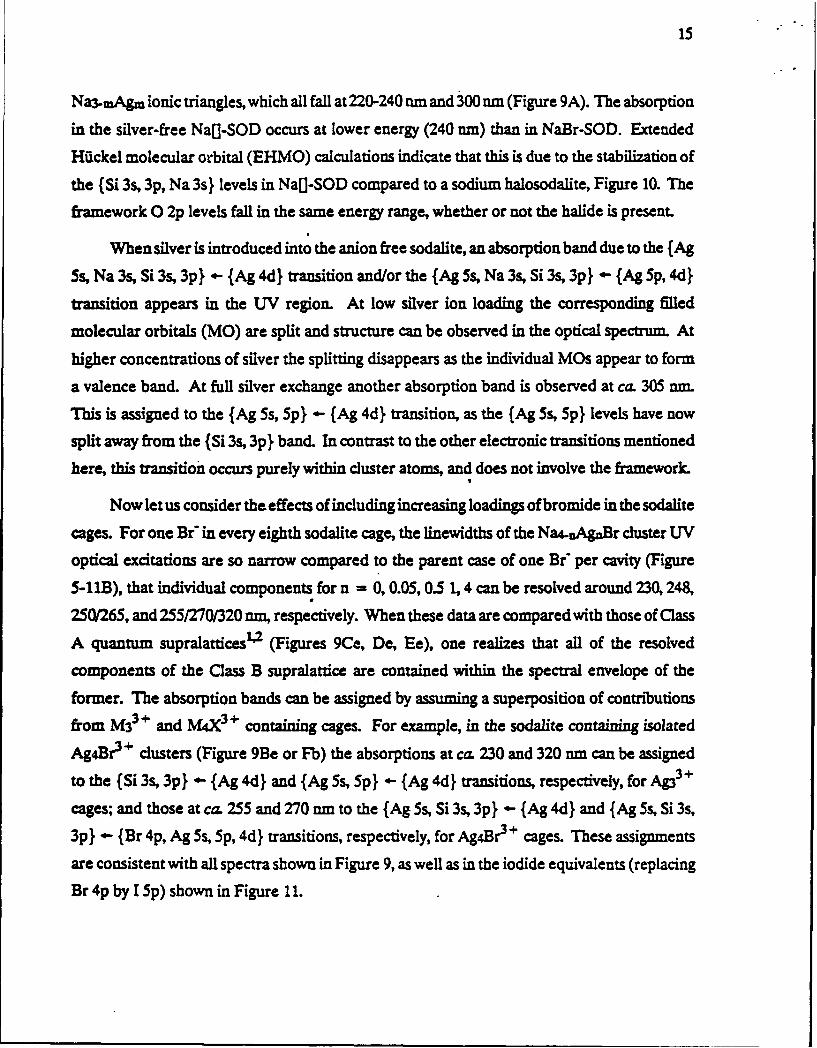
Na-mAgm ionic triangles, which all fall at 220-240 rim and 300 nm (Figure 9A). The absorption
in the silver-free NaD-SOD occurs at lower energy (240 nm) than in NaBr-SOD. Extended
Hickel molecular orbital (EHMO) calculations indicate that this is due to the stabilization of
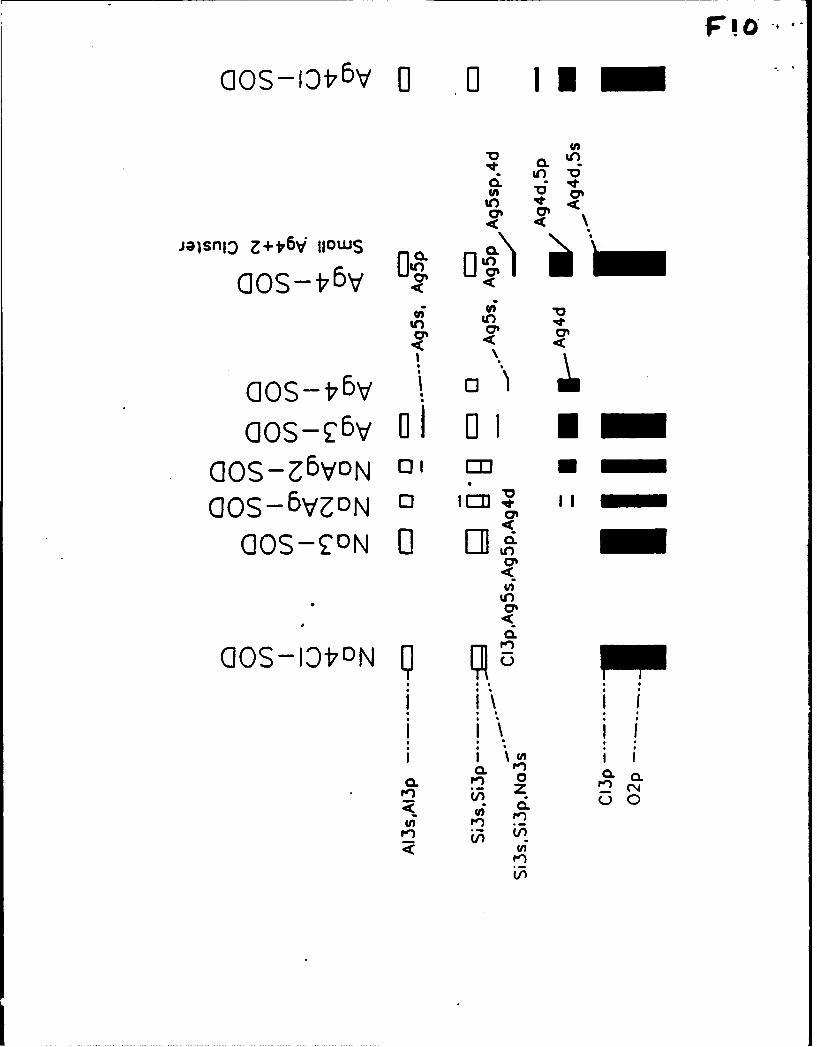
the {Si 3s, 3p, Na 3sI levels in NaD-SOD compared to a sodium halosodalite, Figure 10. The
framework 0 2p levels fall in the same energy range, whether or not the halide is present.
When silver is introduced into the anion free sodalite, an absorption band due to the {Ag
5s, Na 3s, Si 3s, 3p} *- {Ag 4d} transition and/or the {Ag 5s, Na 3s, Si 3s, 3p} *- {Ag 5p, 4d4
transition appears in the TV region. At low silver ion loading the corresponding filled
molecular orbitals (MO) are split and structure can be observed in the optical spectrum. At
higher concentrations of silver the splitting disappears as the individual MOs appear to form
a valence band. At full silver exchange another absorption band is observed at ca. 305 nm.
This is assigned to the {Ag 5s, 5p} - {Ag 4d} transition, as the {Ag 5s, 5p} levels have now
split away from the {Si 3s, 3p} band. In contrast to the other electronic transitions mentioned
here, this transition occurs purely within cluster atoms, and does not involve the framework.I
Now let us consider the effects of including increasing loadings of bromide in the sodalite
cages. For one Br" in every eighth sodalite cage, the linewidths of the Na4-nAgaBr duster UV
optical excitations are so narrow compared to the parent case of one Br per cavity (Figure
5-1B), that individual components for n = 0, 0.05, 0.5 1, 4 can be resolved around 230, 248,
250/265, and 255/270/320 nm, respectively. When these data are compared with those of Class
A quantum supralattices" 2 (Figures 9Ce, De, Ee), one realizes that all of the resolved
components of the Class B supralattice are contained within the spectral envelope of the
former. The absorption bands can be assigned by assuming a superposition of contributions
from M33 + and M4X 3 + containing cages. For example, in the sodalite containing isolated
Ag4Br 3 + clusters (Figure 9Be or Fb) the absorptions at ca. 230 and 320 rm can be assigned
to the {Si 3s, 3p} I- {Ag 4d} and {Ag 5s, 5p} - {Ag 4 transitions, respectively, for Ag3 3+
cages; and those at ca. 255 and 270 nm to the {Ag 5s, Si 3s, 3p} - {Ag 4d} and {Ag 5s, Si 3s,
3p} - {Br 4p, Ag 5s, 5p, 4d} transitions, respectively, for Ag4Br 3 + cages. These assignments
are consistent with all spectra shown in Figure 9, as well as in the iodide equivalents (replacing
Br 4p by I5p) shown in Figure 11.
16
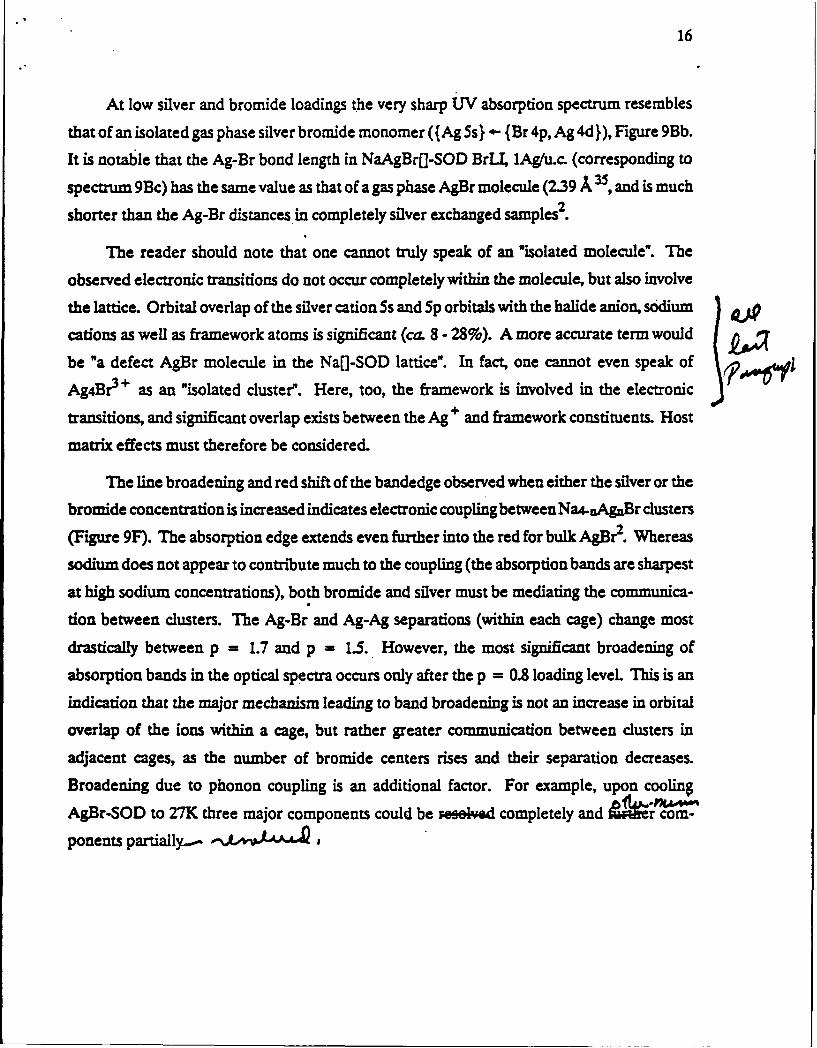
At low silver and bromide loadings the very sharp UV absorption spectrum resembles
that of an isolated gas phase silver bromide monomer ({Ag Ss} -- {Br 4p, Ag 4d}), Figure 9Bb.
It is notable that the Ag-Br bond length in NaAgBr]-SOD BrLL, lAg/u.c. (corresponding to
spectrum 9Bc) has the same value as that of a gas phase AgBr molecule (2.39 A 35, and is much
shorter than the Ag-Br distances in completely silver exchanged samples.
The reader should note that one cannot truly speak of an 'isolated molecule*. The
observed electronic transitions do not occur completely within the molecule, but also involve
the lattice. Orbital overlap of the silver cation Ss and 5p orbitals with the halide anion, sodium
cations as well as framework atoms is significant (ca. 8 - 28%). A more accurate term would
be "a defect AgBr molecule in the Naf-SOD lattice". In fact, one cannot even speak of
Ag4Br 3 + as an "isolated cluster". Here, too, the framework is involved in the electronic !transitions, and significant overlap exists between the Ag + and framework constituents. Host
matrix effects must therefore be considered.
The line broadening and red shift of the bandedge observed when either the silver or the
bromide concentration is increased indicates electronic coupling between Na4-ngaBr clusters
(Figure 9F). The absorption edge extends even further into the red for bulk AgBr2. Whereas
sodium does not appear to contribute much to the coupling (the absorption bands are sharpest
at high sodium concentrations), both bromide and silver must be mediating the communica-
tion between clusters. The Ag-Br and Ag-Ag separations (within each cage) change most
drastically between p = 1.7 and p = 1-5. However, the most significant broadening of
absorption bands in the optical spectra occurs only after the p = 0.8 loading level. This is an
indication that the major mechanism leading to band broadening is not an increase in orbital
overlap of the ions within a cage, but rather greater communication between clusters in
adjacent cages, as the number of bromide centers rises and their separation decreases.
Broadening due to phonon coupling is an additional factor. For example, upon cooling
AgBr-SOD to 27K three major components could be meseked completely and v
ponents partially-..-

17
EHMO Calculations - Development of Bands
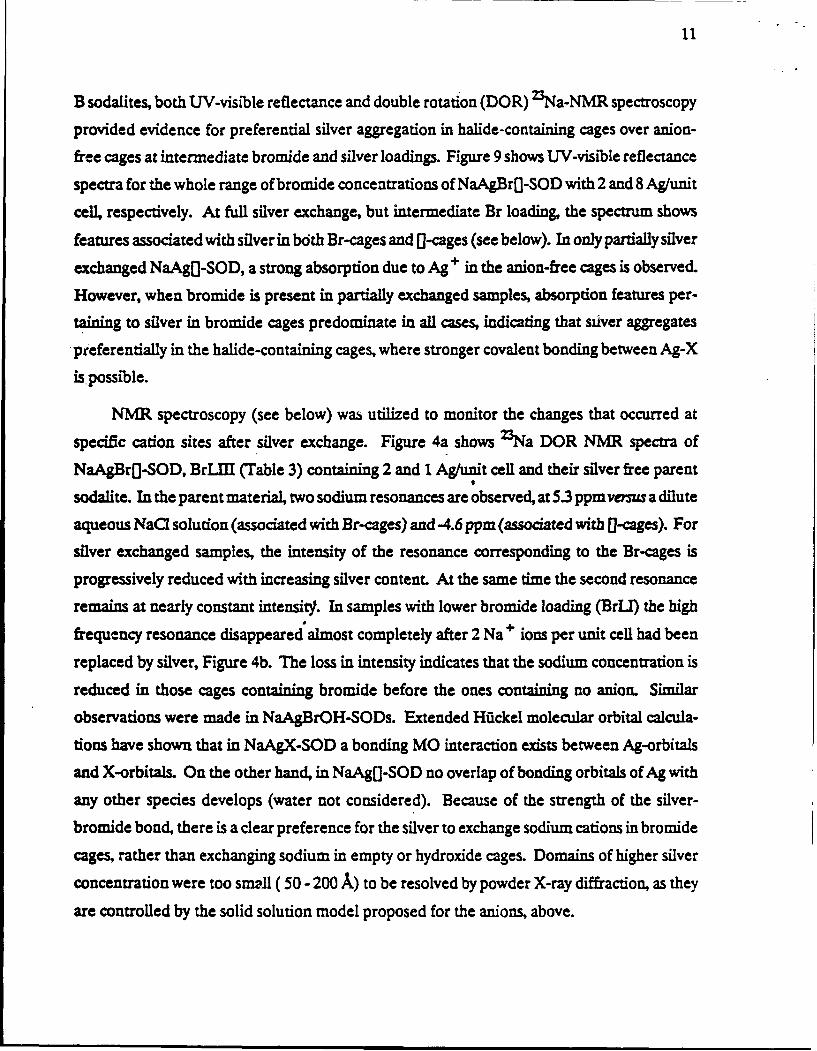
The density of states diagrams for one and ten Ag4Cl clusters (in which the sodalite
framework was not included) show the origin of band broadening as clusters couple (Figure
12). Even at the low aggregation number of ten clusters, the density of states increases. By
extrapolation, continuous band formation becomes possible at approximately Avogadro's
number of clusters. Nevertheless, a simple increase in the density of states does not imply
band formation. For that to happen, the orbitals must overlap significantly. Overlap values
Are proportional to the interaction between atoms 6. An EHMO calculation 7 revealed that
at a separation of 4- 5 A between silver atoms within a cluster and between clusters, the overlap
is up to 19 and 13 %, respectively. Because of the large separation between clusters, the bands
formed by the quantum supralattice are expected to be narrow. However, k-space band
calculations would be required to probe the bandwidth.
The effect of the number of clusters, n, on the frontier orbital levels was studied for
[Ag3 + n clusters, arranged in a space-filling cubic arrangement, as they would be in a cube
of nine sodalite cages, Figure 13. Even though the absolute energies obtained with and without
charge iterations differed greatly, the general trend observed was the same. For aggregations
of [Ag3 +3 n clusters the HOMO-LUMO gap remained nearly constant as n increased. This
is in contrast to [Ag4C1 +3 n clusters, for which the gap was reduced for larger a 2
Class B sodalites contain mixtures of cages with different guest clusters. Figure 14 shows
the trend in frontier orbital energies going from [Ag4C]g to (Ag4CI]8[Ag3], (Ag4CI][Ag3]8 and
finally [Ag3]9 cluster aggregates. By coincidence, the energy gap in the end members is similar
(374 am and 395 m for [Ag4Cl]9 and (Ag3]9, respectively). The LUMO's are composed of
Ag 5s (some Ag 5p) and the HOMO's of CI 3p, Ag 4d, Ag 5s or only Ag 4 of their respective
clusters. It is noteworthy that as soon as one different cluster is added as an "impurity" the gap
becomes narrower and remains nearly unchanged with the relative ratio of the two types of
clusters. The main reason for the constant gap is the fact that the HOMO level always is
associated with an Ag4Cl + 3 cluster and the LUMO with an Ag3 + 3 cluster. Both of these
orbital levels are only weakly dependent on the cluster size. The frontier levels of these clusters
are only slightly perturbed by their neighbors. Atomic charge calculations showed that the
18
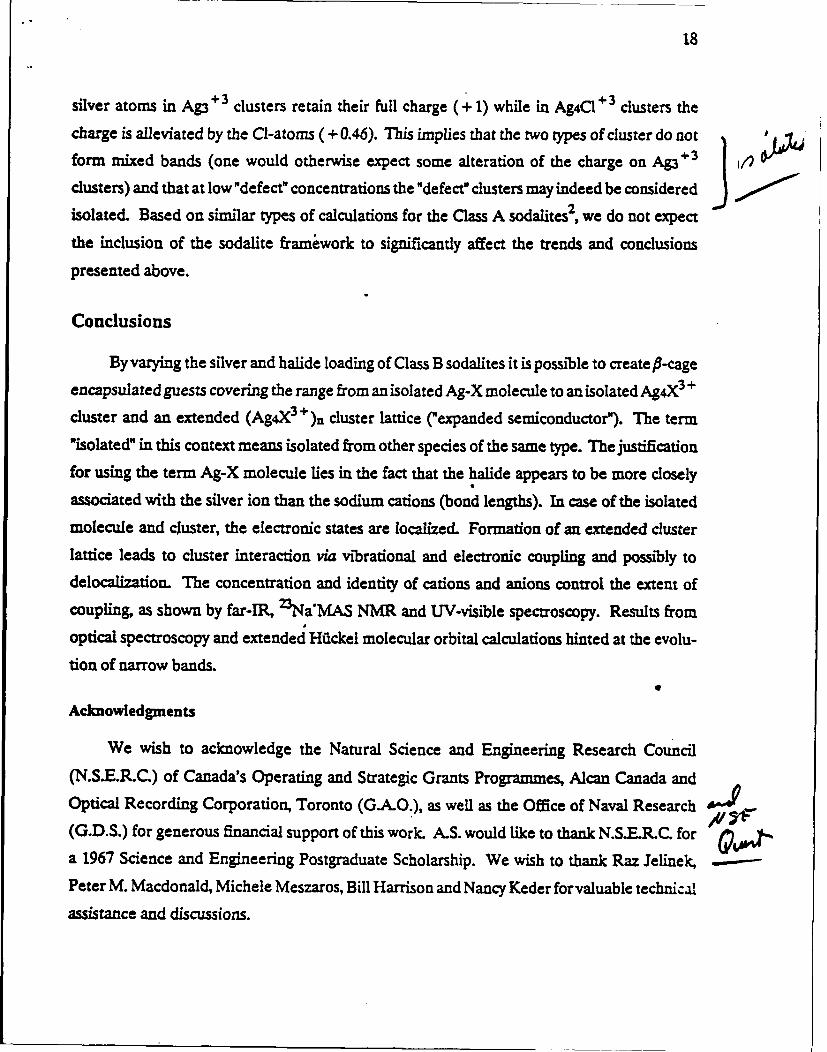
silver atoms in Ag3 +3 clusters retain their full charge (+ 1) while in Ag4CI +3 clusters thecharge is alleviated by the Cl-atoms ( + 0.46). This implies that the two types of cluster do notform mixed bands (one would otherwise expect some alteration of the charge on Ag3
clusters) and that at low "defect" concentrations the "defect" clusters may indeed be consideredisolated. Based on similar types of calculations for the Class A sodalites2 we do not expect
the inclusion of the sodalite framiwork to significantly affect the trends and conclusions
presented above.
Conclusions
By varying the silver and halide loading of Class B sodalites it is possible to create f-cage
encapsulated guests covering the range from an isolated Ag-X molecule to an isolated Ag4X 3 +
cluster and an extended (Ag4X3 +)n duster lattice ("expanded semiconductor"). The term
"isolated" in this context means isolated from other species of the same type. The justification
for using the term Ag-X molecule lies in the fact that the halide appears to be more closely
associated with the silver ion than the sodium cations (bond lengths). In case of the isolatedmolecule and cluster, the electronic states are localized. Formation of an extended clusterlattice leads to cluster interaction via vibrational and electronic coupling and possibly todelocalization. The concentration and identity of cations and anions control the extent ofcoupling, as shown by far-IR, 23Na'MAS NMR and UV-visible spectroscopy. Results fromoptical spectroscopy and extended Hfickel molecular orbital calculations hinted at the evolu-
tion of narrow bands.
Acknowledgments
We wish to acknowledge the Natural Science and Engineering Research Council
(N.S.E.R.C.) of Canada's Operating and Strategic Grants Programmes, Alcan Canada andOptical Recording Corporation, Toronto (G.A.O.), as well as the Office of Naval Research o
(G.D.S.) for generous financial support of this work. A.S. would like to thank N.S.E.R.C. fora 1967 Science and Engineering Postgraduate Scholarship. We wish to thank Raz Jelinek,
Peter M. Macdonald, Michele Meszaros, Bill Harrison and Nancy Keder forvaluable technical
assistance and discussions.

Table 1. Gel compositions for sodaite syntheses.
Product xAl(OE)3 YSi02 zNaOH v920 WNaX Salt
NaOH-SOD BrLO 1 1 5 41 0 -
N&BrOH-SOD BrLI 1 1 5 41 0.070 NaB:
NaBrOR-SOD BrLZI 1 1 5 41 0.0135 NaBr
NaBrO-SOD BrLZZI 1 1 5 41 0.20 NaarNaBrOH-SOD rL 1 1 5 41 0.625 NaBrNaBrON-SOD UrLI 1 1 5 41 0.94 NaB:
Na r-SOD BrLY 1 2 8 100 5 Nar
NaOH-SOD ZLIZ 1 1 5 41 0.070 Nal
Note: All values are given in moles, relative to 1 mole Al(OH)3.
Table 2. List of reagents for sodalite s)nthesis and silver exchange.
AI(OH)38 Fisher, 99.8%SiO2: Ludox 33-30, Ludox 1s-40 (Dupont), Luddy (40%, Alchem)
(colloidal aqueous silica sources%NaOE: Nllinckrodt, 98.7%320: deionizedNAB:: Nallinckrodt, 99.00Mal: BDH, 99.0%Ag03: Fisher, 99.8%N0N3 : Fisher, certified ACS grade
C)

Table 3. Compositions of Class B Sodalites.
Chemical Analysis
Sampli. %Na %Ag %Br %si W~ to* ppm?. Si/AlNa.(]-SOD ErLO 14.73 0.00 0.00 20.25 18.98 46.02 160 1.02Na~r:(-SOD BrLI 14.39 0.00 2.39 19.68 16.42 45.11 130 1.03Va~rCI-SOD BrLUX 14.76 0.00 4.28 19.99 18.60 42.36 110 1.03Na~rOH-SOD BrLI 16.68 .0.00 2.45 16.74 17.87 44.24 160 1.01Ag~r[]-SoD BrLI 0.115 40.84 1.66 11.06 10.87 35.26 4420 0.96383:-SOD BrLF 16.27 0.00 13.70 16.17 15.03 38.83 47 1.03
sample composition Total k /u.c.Na(]-SOD BrLO Na5.40Si6.07A15.931024.2 5.40Na~rj]-SOD 3:1.1 Na4.49Nal104Br0.263i6.08M15.92024.4 5.44NaBr[J-SOD 3:1.11 Na3.66Nal.84Bro.468i6.10A15.90O22.7 5.50Ma~rOff-SOD BrLI Na5.170H?Nal.113r0.28Si6.02A15.98025.0 6.55Ag~r[]-SOD 3:1.1 Ag4.3.Agl.4sr0.35sS.93A16.07033.2 5.70VaBr-SOD BrLY Na7.503Zr1.q2Si6.10Al5.90O25.7 7.50
Samples were dehydrated under vacuum at 500 0ac for 1 hour.
Neutron Activation Results
sample composition Tot. Na/u.c. reed Br/u.c.Na(]-SOD 3:1.0 3a5.73-OD 5.73 0.00Wa~r(]-SoD 3:1.1 Na4.643al.16Br.29-SOD 5.80 0.42NaBr(J-SOD 3:1.11 Na3.953a2.1BrO.53-SOD 6.05 0.81NaBrC 3-SOD 3:1.111 Nal.94Na4.72Br1.18-SOD 6.66 1.2Naar(]-SOD BrLA Nal.17yaS.562rl.3-SOD 6.73 3.6Naar(]-SOD 3:1.5 Nao.j4Na6.52Br163-SOD 7.46 5.6Naar-SOD 5:1.? Na7.36Br1.63-SOD 7.36 7.5NaOH-SOD 3:1.0 384 570H7-SOD 6.57 0.00NaBrou-SOD 3:1.1 NaS.570H?Nal.162r0.29-SOD 6.73 0.42NaB:OH-SOD 3:1.11 N4.660H?3a2.04B:0.51-SOD 6.70 0.61NaBrON-80D 3:1.111 Na2.22OfH?Na5.16Br1.29-SOD 7.38 1.2NaBrOz-SoD BzZA Naj.930ff?Na5.76Brj.44-SOD 7.69 3.6
samples were hydrated. Feed Dr/u.c. is the expected bromide concentrationfrom the feed compoition, assuming all bromide present in the reagentsenters the product.
Sample Water of Hydration (non-surface)Na~r(]-SOD 3:1.1 5.9 %AgarC 1-SOD 3:1.1 4.7 %
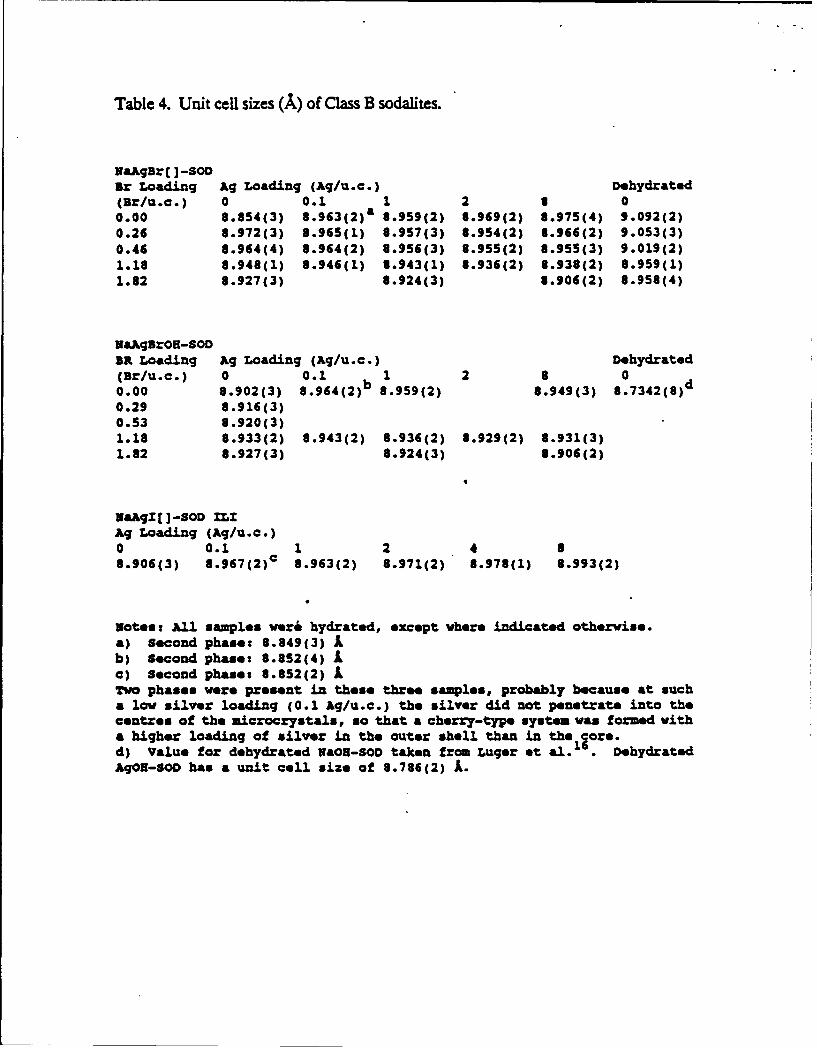
Table 4. Unit cell sizes (A) of Class B sodaites.
YaAgBr (1-SODBr Loading Ag Loading (Agu.c.) Dehydrated(B1/u.c.) 0 0.1 a0.00 6.354(3) 8.963(2)' 8.959(2) 8.969(2) 6.975(4) 9.092(2)0.26 8.972(3) 8.965(1) 8.957(3) 6.954(2) 3.966(2) 9.053(3)0.46 6.964(4) 6.964(2) 8.956(3) 8.955(2) 6.955(3) 9.019(2)1.16 8.948(l) 8.946(l) 8.943(l) 6.936(2) 8.938(2) 6.959(l)1.82 8.927(3) 8.924(3) 6.906(2) 6.958(4)
NaAgBrOH-SODSR Loading Ag Loading (Ag/u.c.) Dehydrated(Br/u.c.) 0 0.1 b1 2 6 0d0.00 8.902(3) 8 .96 4 (2 )b 8.959(2) 8.949(3)8.3280.29 8.916(3)0.53 8.920(3)1.16 6.933(2) 6.943(2) 6.936(2) 8.929(2) 8.931(3)1.62 0.927(3) 8.924(3) 8.906(2)
WaAgZ (IJ-SOD ZLIAg Loading (Ag/U-C-)0 0.1 1 2 86.906(3) 6.967(2) c 6.963(2) 8.971(2) 6.978(1) 6.993(2)
Notes: All samples were hydrated, except where indicated otherwise.a) Second phase: 6.849(3)b) Second phase: 6.852(4)c) Second phase: 8.652(2)Two phases were present in these three samples, probably because at sucha low silver loading (0.1 Ag/u.c.) the silver did not penetrate into thecentres of the iaicrocrystals, so that a cherry-type system was formed witha higher loading of silver in the outer shell than in the1 jore.d) value for dehydrated NaOH-SOD taken from Luger at al. .Dehydrated
AgOH-SOD has a unit cell size of 6.786(2) A
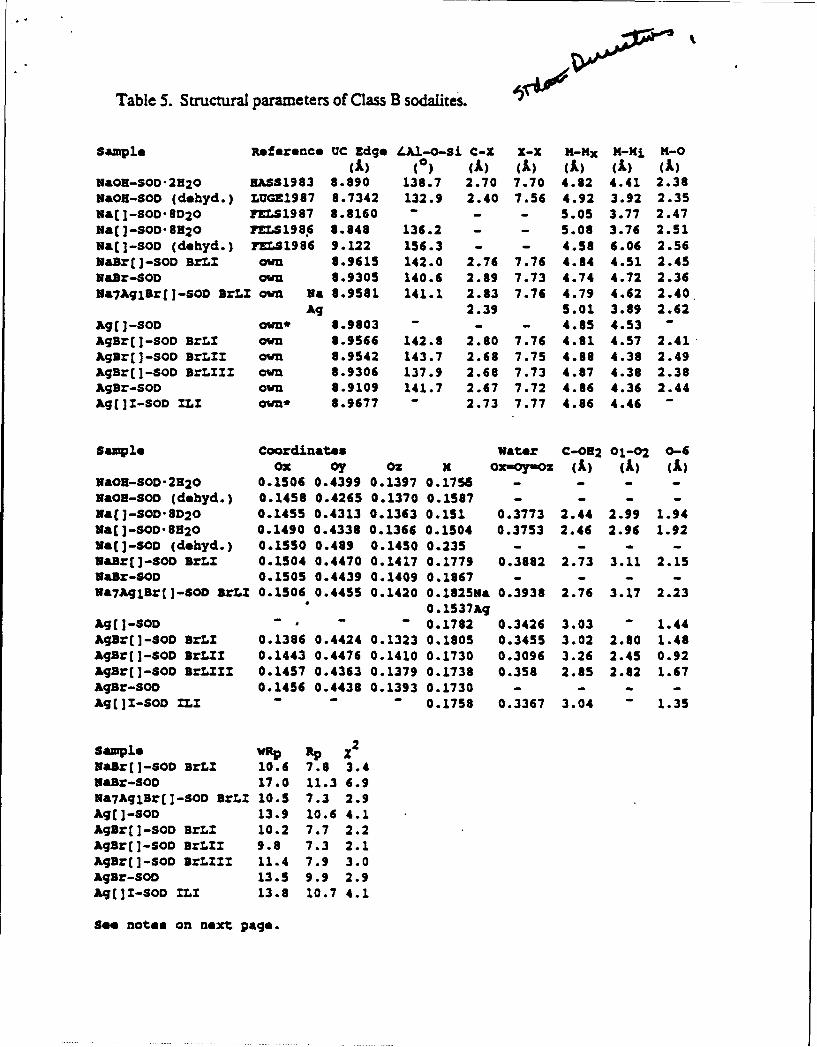
Table 5. Structural parameters of Class B sodalites.
Sample Reference UC Zdge /LAl-O-Si C-X X-X K-x M-N M-0
(A) (0) (A) (A) (A) (A) (A)NaOR-SO-2H20 BAS1983 8.890 138.7 2.70 7.70 4.82 4.41 2.38WaOH-SOD (dehyd.) LUGE1987 8.7342 132.9 2.40 7.56 4.92 3.92 2.35Na(]-SOD.8020 qrS1987 8.8160 - - - 5.05 3.77 2.47Nal -SOD- 8H20 rLS1986 8.848 136.2 - - 5.08 3.76 2.51
Nai-SOD (dehyd.) EZLS1986 9.122 156.3 - - 4.58 6.06 2.56NaB:[]-SOD BrLZ own 8.9615 142.0 2.76 7.76 4.84 4.51 2.45NaBr-SOD own 8.9305 140.6 2.89 7.73 4.74 4.72 2.36Na7AqlBr[]-SOD IrLI own Wa 8.9581 141.1 2.83 7.76 4.79 4.62 2.40
Ag 2.39 5.01 3.89 2.62Ag[]-SOD own* 8.9803 - - - 4.85 4.53 -
AgBr[]-SOD BrLI own 8.9566 142.8 2.80 7.76 4.81 4.57 2.41AgBr[]-SOD BrLZZ own 8.9542 143.7 2.68 7.75 4.88 4.38 2.49AgBr[]-SOD BrLZZZ own 8.9306 137.9 2.68 7.73 4.87 4.38 2.38AgBr-SOD own 8.9109 141.7 2.67 7.72 4.86 4.36 2.44Ag[]I-SOD ZLZ ond- 8.9677 - 2.73 7.77 4.86 4.46 -
Sample Coordinates Water C-082 01-02 0-6Ox oy Oz x Ox-OY-Oz (A) (A) (A)
NaOH-SOD-2320 0.1506 0.4399 0.1397 0.1756 - -
NaOH-SOD (dehyd.) 0.1458 0.4265 0.1370 0.1587 - - - -
Na&I-SOD'8D20 0.1455 0.4313 0.1363 0.151 0.3773 2.44 2.99 1.94
Ua[I-SOD'8H2O 0.1490 0.4338 0.1366 0.1504 0.3753 2.46 2.96 1.92Na~i-SOD (dehyd.) 0.1550 0.489 0.1450 0.235 - - -
NaBz(]-SOD BrLX 0.1504 0.4470 0.1417 0.1779 0.3882 2.73 3.11 2.15NaBr-SOD 0.1505 0.4439 0.1409 0.1867 - - - -
9a7AqcBrE]-SOD BrL 0.1506 0.4455 0.1420 0.1825Na 0.3938 2.76 3.17 2.230 0.1537Ac
Agj[-SOD - - - 0.1782 0.3426 3.03 " 1.44AgBr(]-SOD BrLZ 0.1386 0.4424 0.1323 0.1805 0.3455 3.02 2.80 1.48AgBr([-SOD BrZIZ 0.1443 0.4476 0.1410 0.1730 0.3096 3.26 2.45 0.92AgB=r]-SOD BrL ZI 0.1457 0.4363 0.1379 0.1738 0.358 2.65 2.82 1.67AgBr-SOD 0.1456 0.4438 0.1393 0.1730 - - - -
Ag[ Z-SOD ILI - - 0.1758 0.3367 3.04 " 1.35
Sample p z 2
Xa~r[ ]-SOD BrLI 10.6 7.8 3.4Naar-SOD 17.0 11.3 6.9Wa7Aqlr(]-SOD IrZ.Z 10.5 7.3 2.9Ag[]-SOD 13.9 10.6 4.1Agar[]-SOD BrLI 10.2 7.7 2.2Ag[r(]-SOD BrLI 9.8 7.3 2.1
Agr(]-SOD BrLIZ 11.4 7.9 3.0
Agar-SOD 13.5 9.9 2.9Aq[]Z-SOD ILI 13.8 10.7 4.1
See notes on next page.
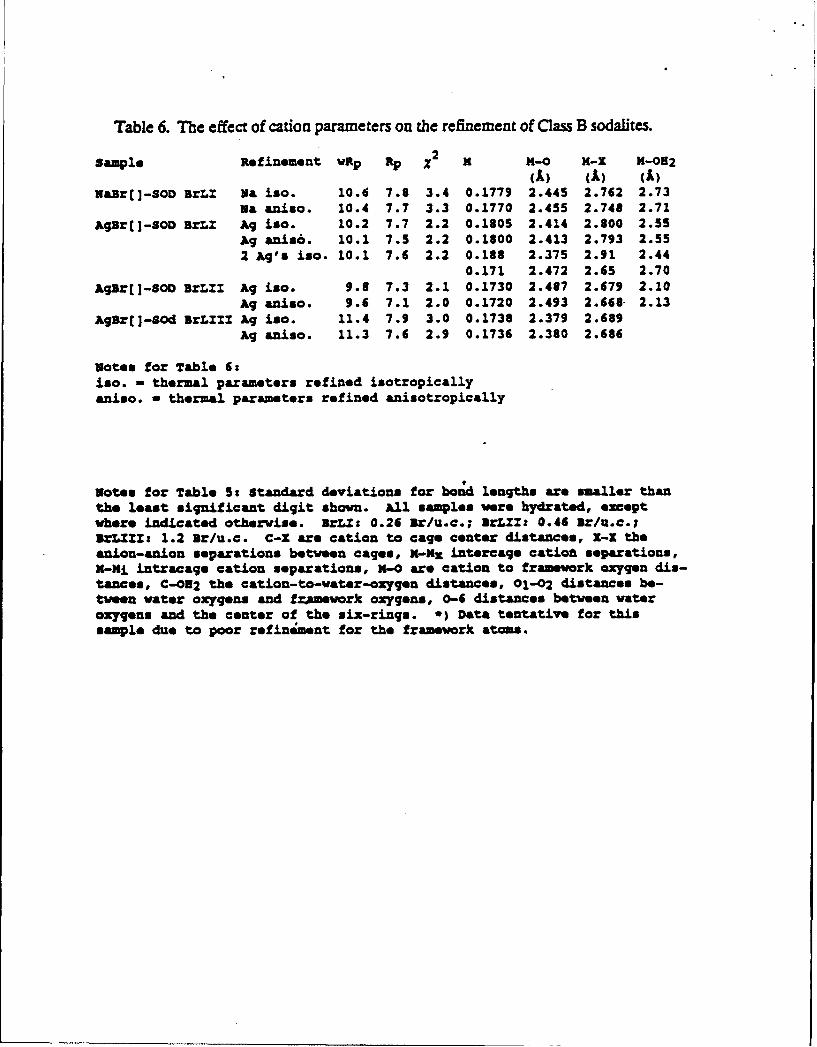
Table 6. The effect of cation parameters on the refinement of Class B sodauites.
sample Refinement VRp Rp X2 X M-0 M-X M-082
(A) (A) (A)NaJr(]-SOD BrLZ Wa iso. 10.6 7.8 3.4 0.1779 2.445 2.762 2.73
Ma aniso. 10.4 7.7 3.3 0.1770 2.455 2.748 2.71AgBr[]-SOD BrLZ Ag iso. 10.2 7.7 2.2 0.1805 2.414 2.800 2.55
Ag anis6. 10.1 7.5 2.2 0.1800 2.413 2.793 2.552 Ag's iso. 10.1 7.6 2.2 0.188 2.375 2.91 2.44
0.171 2.472 2.65 2.70
AgBr[]-SOD BrLIX Ag iso. 9.8 7.3 2.1 0.1730 2.487 2.679 2.10Ag aniso. 9.6 7.1 2.0 0.1720 2.493 2.668 2.13
AgBr[]-Sod BrLZZI Ag iso. 11.4 7.9 3.0 0.1738 2.379 2.689Ag aniso. 11.3 7.6 2.9 0.1736 2.380 2.686
Notes for Table 6:iso. - thermal parameters refined isotropicallyaniso. - thermal parameters refined anisotropically
Notes for Table 5: Standard deviations for botd lengths are smaller thanthe least significant digit shown. All samples were hydrated, exceptwhere indicated otherwise. ArL t 0.26 Br/U.c.; BrLXM 0.46 Br/u.c.;3rLZUZ: 1.2 Br/u.c. C-X are cation to cage center distances, X-X theanion-anion separations between cages, N-Kx intercaqe catiot *sparations,X-Mi intracage cation separations, X-O are cation to framework oxygen dis-tances, C-032 the cation-to-water-oxygen distances, 01-02 distances be-tween water oxygens and framework oxygens, 0-6 distances between wateroxygens and the center of the six-rings. *) Data tentative for thissample due to poor refin ment for the framework atoms.
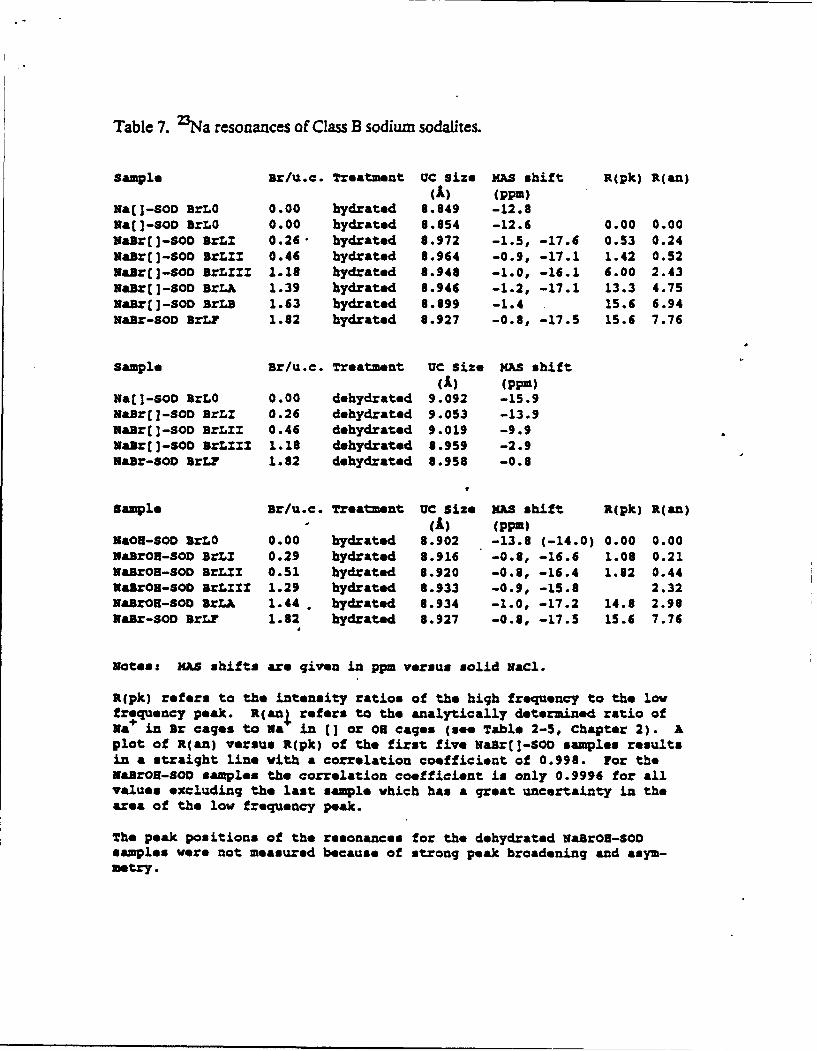
Table 7. 2Na resonances of Class B sodium sodalites.
Sample sr/u.c. Treatment UC size iAS shift R(pk) R(an)(A) (ppm)
Ha[]-sOD BrLo 0.00 hydrated 8.849 -12.8Ma(]-SOD BrLO 0.00 hydrated 8.854 -12.6 0.00 0.00NaBr(]-SOD BrLZ 0.26• hydrated 8.972 -1.5, -17.6 0.53 0.24NaBr[]-SOD BrLZI 0.46 hydrated 8.964 -0.9, -17.1 1.42 0.52Raor(]-SOO BrLxZZ 1.18 hydrated 8.948 -1.0, -16.1 6.00 2.43NaBr(I-SOD BrLA 1.39 hydrated 8.946 -1.2, -17.1 13.3 4.75NaBr(]-SOD BrLB 1.63 hydrated 8.899 -1.4 15.6 6.94Hair-SOD BrLP 1.82 hydrated 8.927 -0.8, -17.5 15.6 7.76
Sample Br/u.c. Treatment UC size mAS shift(A) (ppm)
Na[ -SOD BrLO 0.00 dehydrated 9.092 -15.9HaBr([-SOD BrLZ 0.26 dehydrated 9.053 -13.9XaBrE]-SOD BrLUZ 0.46 dehydrated 9.019 -9.9MaBr(]-SOD BrLZZZ 1.18 dehydrated 8.959 -2.9NaBr-SOD BrLF 1.82 dehydrated 8.958 -0.8
V
Sample Br/u.c. Treatment UC Size MAS shift R(pk) R(an)(A) (ppM)
UaOH-SOD arLo 0.00 hydrated 8.902 -13.8 (-14.0) 0.00 0.00NaBrOR-SOD BrLI 0.29 hydrated 8.916 -0.8, -16.6 1.08 0.21NaBrOH-SOD BrLZI 0.51 hydrated 8.920 -0.8, -16.4 1.62 0.44VaBrOH-SOD BrLZES 1.29 hydrated 8.933 -0.9, -15.8 2.32NaBrOH-SOD BrLA 1.44 . hydrated 8.934 -1.0, -17.2 14.8 2.98Nair-SOD BrLr 1.82 hydrated 8.927 -0.8, -17.5 15.6 7.76
Notes: MAS shifts are given in ppm versus solid MaCl.
R(pk) refers to the intensity ratios of the high frequency to the lowfrequency peak. R(anI refers to the analytically determined ratio ofNa in Br cages to Na in 11 or On cages (see Table 2-5, Chapter 2). Aplot of R(an) versus R(pk) of the first five Nair[]-SOD samples resultsin a straight line with a correlation coefficient of 0.998. For theMairO-SOD samples the correlation coefficient is only 0.9996 for allvalues excluding the last sample which has a great uncertainty in thearea of the low frequency peak.
The peak positions of the resonances for the dehydrated NairON-SODsamples were not measured because of strong peak broadening and asym-metry.
References
1. Stein, A.; Ozin, G. A.; Stucky, G. D. I Am. Chem. Soc. 1990,112, 904-905.
2. Stein, A.; Ozin, G. A.; Macdonald, P. M.; Stucky, G. D.; Jelinek, R.; Pines, A. J. Am
Chem. Soc., submitted.
3. Stein, A.; Macdonald, P. M.; Stucky, G. D.; I Phy Chem. 1990, 94, 6943-6948.
4. Stein, A.; Meszaros, M.; Macdonald, P. M.; Ozin, G. A.; Stucky, G. D.Adv. Mat, in
press.
V5 Denks, V. P. Trudy Instifuta F'zika Akad. Nauc Estonskoi SSR, 1984, 55,14-71.
6. Stein, A.; Ozin, G. A.; Stucky, G. D. J. Soc. Photgr. Sc. TechnoL Japan 1990,53,322-
328.
/7. Hund, F.; Geismar, G. Chem.-Zg. 1990,114, 243-244.
8. Hassan, L; Grundy, IL D.Acta Cyst. 1983, C39, 3-5..
9. Ernst, FL; Pfeifer, H.; Zhdanov, S. P. Zeolite 1983,3,209-213.
10. Felsche, J.; Luger, S. Ber. Bunsn.ge Phys. Chem. 1986, 90, 731.
11. Barrer, R. M. Hydrothermal Chemiwy of Zeoles Academic Press: London, 1982.
12. Shannon, R. D.Acta COysado g. 1976,A32, 751-767.
13. Breck, D. W. Zeolite Molecular Sives, R. E. Kieger Publishing Company: Malabar,
1984.
14. Felsche, J.; Luger, S.; Baerlocher, C. Zeolites 1986,6,367-372.
15. Felsche, J.; Luger, S.; Fischer, P.Acta Cryst. 1987, C43, 809-811.
16. Luger, S.; Felsche, J.; Fischer, P.Aca Cyst. 1987, C43, 1-3.
,.-17. Hassan, L; Grundy, H. D. Can. MmeraL 1989,27, 165-172.
,,A8. Hassan, L; Buseck, P. RAm. MineraL 1989, 74,394-410.
,,19. Taylor, D. ConTib. MineraL PetroL 1967,16, 172-188.

20. Engelhardt, 0.; Luger, S.; BuhiJ. C.; Felsche, J.Zeolites 1989,9, 182-186.
21. Moller, K; Ozin, G. A.; Stein, A., unpublished results.
22. Stein, A. Ph.D. Thesir 1991, University of Toronto, Canada.
23. Burgess, J. Ions in Solution, Ellis Horwood Ltd.: Chichester, 1988.
24. Peterson, K L; Holland, P. M.; Keesee, R. G.; Lee, N.; Mark, T. D.; Castleman, Jr., A.
W. Surf. Sci 1981,106, 136-145.
25. Cotton, F. A.; Wilkinson, G. Advanced Inorganic Chemimty, 4th ed., Wiley, N. Y.,
1980, p. 255, p. 263.
26. Godber, J.; Ozin, G. A. . Phys. Chem. 1988,92,2841-2849,4980-4987.
27. Kundla, E.; Samoson, A.; Lippmaa, E. Chem Phyx. Lem 1981,83,229-232.
28. Jelinek, R.; Chmelkca, B.; Pines, A.; Stein, A.; Ozin, G. A., unpublished results.
29. Welsh, L B.; Lambert, S. L in Bradley, S. A.; Gattus;, M. 3.; Bertolacini, R. J. (eds.)
Characterization and Catayst Development 1989, A.C.S. Symposium Series 411;
American Chemical Society: Washington, D.C., 262-272.
30. Engelhardt, G.; Michel, D. High Resolution Solid-State NMR of Silicates and Zeolite,
John Wiley & Sons, 1987.
31. Tijinc, 0. A. H.; Janssen, R;Veeman, W. S.1. Am. Chem Soc 1987,109, 7301-7304.
32. Lechert, H. in Meier, W. M.; Uytterhoeven, J. B. (eds.), Molecular Sies, A.C.S. Ad-
vances in Chemistry Series 121; American Chemical Society: Washington, D.C.; 1974,
74-86.
33. Klinowsld 1. Prog. NucL Magn. Reson. Specuvmc. 1984,16, 237-309.
34. Weller, M. T.; Wong, G. 1. Chem Soc., Chem Commwz. 1988,1103-1104.
35. Krisher, L C.; Norris, W. G. 1. Chem. Phys. 1966, 44, 974-976.
36. Caizaferri, G.; Forss, L Helv. Chim Acra 1987, 70, 465-479.

37. Calzaferri, G.; Forss, L; Hugentobler, T.; Kamber, L ICONC and INPUTC, Fortran
software for extended Hickel molecular orbital calculations, Institute for Inorganic
and Physical Chemistry, University of Berne, Freiestrasse 3, CH-3009 Bern, 1989.

Figure Captions
Figure 1. Unit cell size versus composition diagram for the series of hydrated sodalites of the
type Na8.p-2zAg2nBr2-pflp-SOD, where p = 0-2, 2n - 0-8.
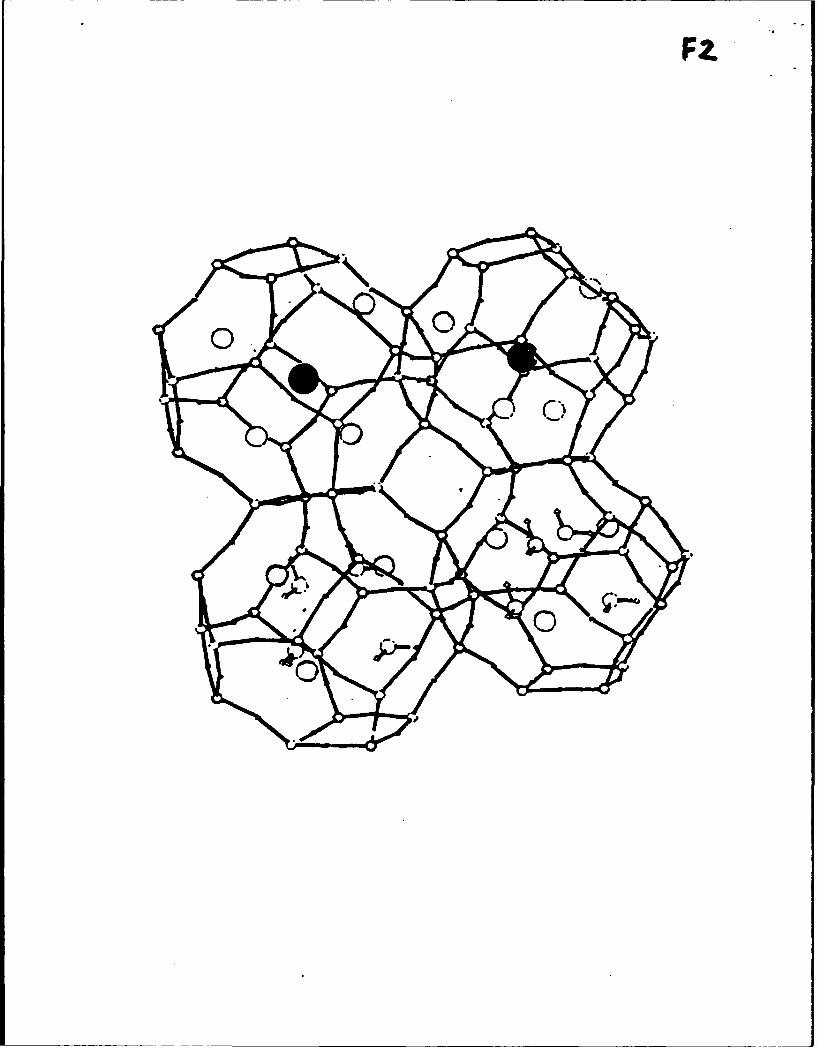
Figure 2. Sodalite cages showing the positions of anions ( * ), cations (0) and water molecules.
Figure 3. Proposed hydrogen-bonding effects in NaAga-SOD. A) When four Na + cations
are present the interaction between an Owamer atom and adjacent cations is equal in all three
directions, leading to a net-force on this oxygen towards the center of the cage. The cage
contracts (small unit cell). B) When one Na4 cation has been replaced by Ag + , the
interaction between an Owater atom and adjacent cations is not equal in all three directions.
The force vectors do not point towards a common intersection. In spite of possible distortions,
the net pull is not towards the center of the cage. The unit cell is therefore larger.
Figure 4. 23Na DOR NMR spectra of A) NaAgBr]-SOD, BrLUfI a) 2 Ag/u.c., b) 1 AgLu.c., c)
0 Ag'u.c. B)NaAgBrfI-SOD, BrL; a) 0 Agtu.c., b) 2 Ag/u.c.
Figure 5. a) Far-IR spectra for the series of dehydrated sodalites of the type Na&pBr2-pflp-
SOD. i) p = 2, ii) p = 1.7, iii) p = 1.5, iv) p = 0.8, v) p = 0. b) Shift in the far-IR pore
opening mode with Br loading. c) Changes in the far-IR correlation splitting between the
high-frequency and low-frequency modes of Na + (A) and Br( * ) with Br loading.
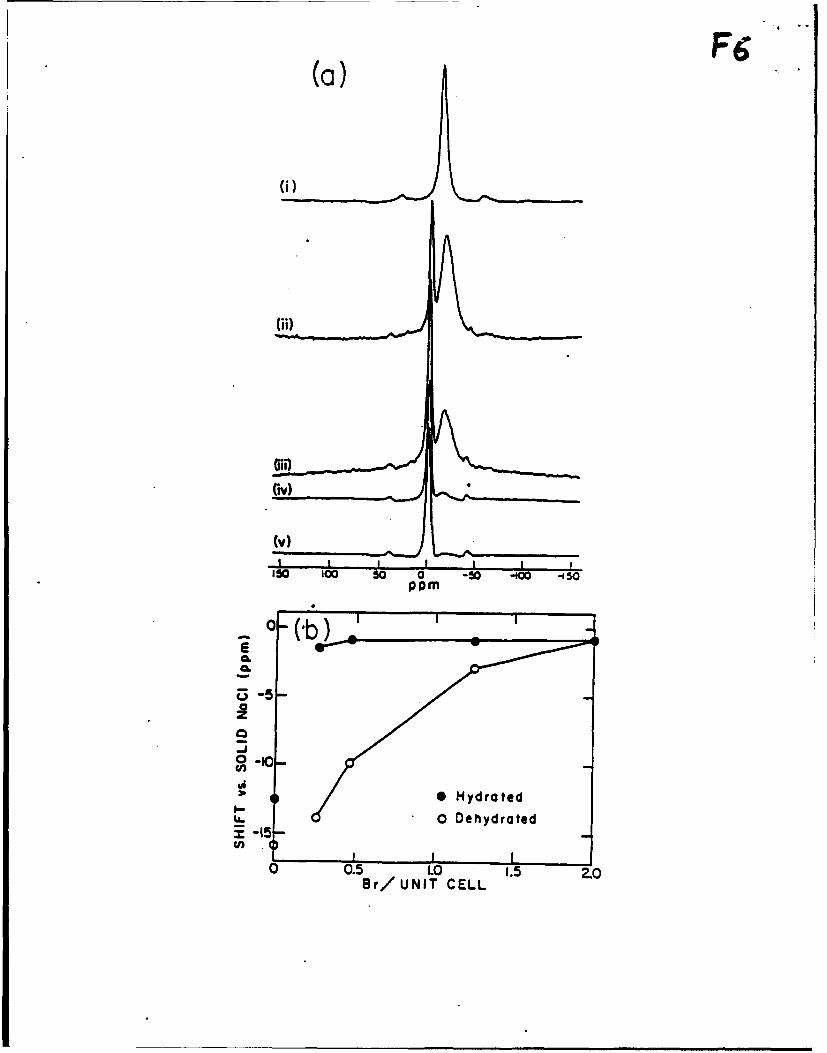
Figure 6. a) 2Na MAS NMR spectra of hydrated Na&.pBr2.p0p-SOD. i) p = 2, ii) p = 1.7,
iii) p = 1.5, iv) p = 0.8, v) p = 0. b) The dependence of the 23Na MAS NMR shifts of the
Na4Br resonance relative to solid NaCi on the Br concentration for hydrated (e) and
dehydrated (0) samples.
Figure 7. 23Na NMR spectra of NaBrfl-SOD, BrLI, showing the similarity between MAS and
DOR results for this type of sample.
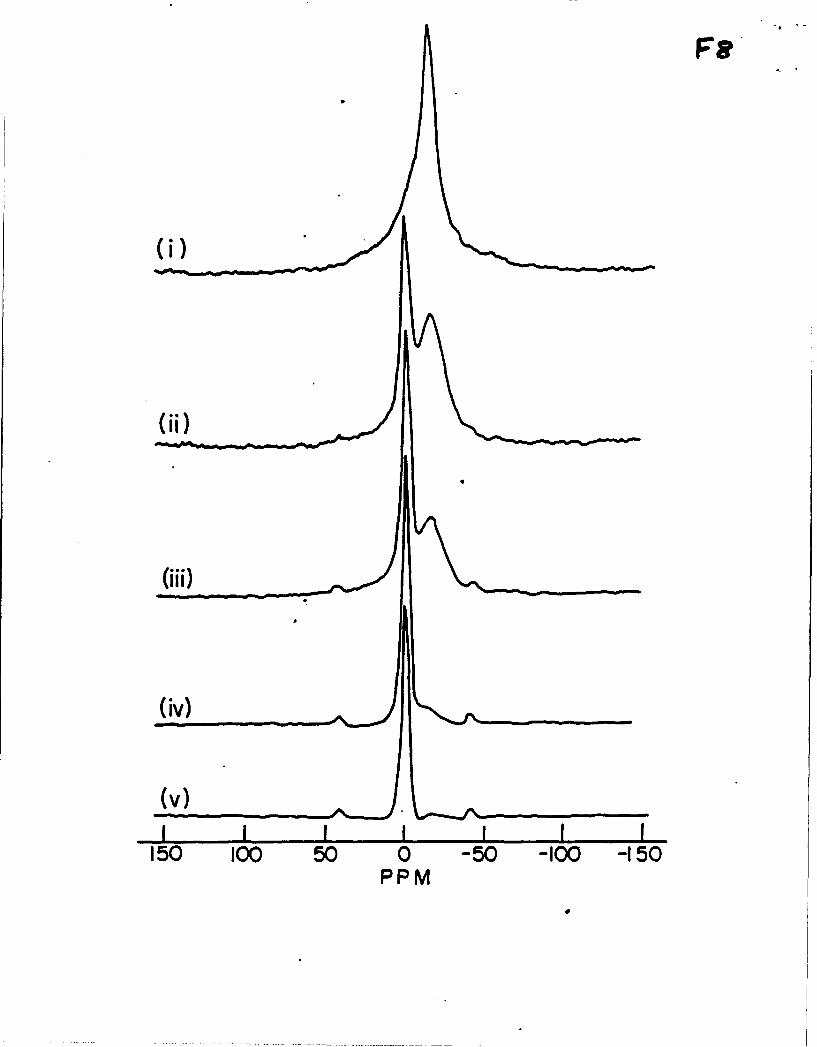
Figure 8. 23Na MAS NMR spectra of hydrated NaSBr2.pOHp-SOD. i) p = 2, ii) p = 1.7, iii)
p - 1.5, iv) p = 0.8, v) p = 0. Note the similarity with the spectra of the Soxhlet-extracted
products of these samples, shown in Figure 6.

Figure 9. Optical reflectance data for some members of the hydrated sodalite series Na8.2n.
pAg2nBr2-pip-SOD. A) p = 2, B) p = 1.7, a) n = 0, b) n = 0.05, c) n = 0.5, d) n = 1, e) n =
4. C) n = 0.5, D) n = 1, E) n = 4, a) p = 2, b) p = 1.7, c) p = 1.5, d) p = 0.8, e) p = 0. F)
Progression of the UV-visible spectra from the sodalite encapsulated isolated AgBr molecule
to the isolated Ag4Br cluster and to the extended (Ag4Br)n quantum supralattice.
Figure 10. Sodalite band diagrams for one cluster of the type indicated, inside a single sodalite
cage.
Figure 11. Optical reflectance data of hydrated sodalites of the type NaAgIIJ-SOD LL, with
various silver loadings. a) 0 Ag/u.c., b) 1 Ag/u.c., c) 2 Ag/u.c., d) 4 Agfu.c., e) 8 Ag/u.c.
Figure 12. Density-of-states diagrams for a) Ag4CI3 + and b) [Ag4C13 +]1o. The graphs show
the number of molecular orbitals per atom within 0.25 eV ranges.
Figure 13. The effect of [Ag3 +]n cluster aggregation on the frontier orbital energies. +:
LUMO (no charge iterations (CI)), 0: HOMO (no CI), A: LUMO (CI), 0: HOMO (CI).
Figure 14. The effect of the Cl:J ratio of Ag4Cl 3 + and Ag3 + cluster aggregates on the frontier
orbital energies. Nine clusters were organized in a body centered cubic arrangement for these
EHMO calculations.

F'
Gi wJ
cd cd w ad (d z
cmi
FZ

F3
711
-V-.4 5

F4.(A)
(b).
(a)I, ! ! !
50 25 0 -25 -50PPM
(B) Na-C I No-( ]
No-Br
(a) (b) J4
I I I * I I I I50 25 0 -25 -0 50 23 0 -25 50
PPM PPMNaBr]-SOO NoAg BrC]-S)O (2 A'/u.c.)

Q QT
0 LU
d -0
Sni 0 cA0'A0
0
30NV8 10S8V
( )
150 00O s0 0 -50 -10 -450
0~ (b)
v ra
1,5co
0 0.5 L ehydrated
Br/ UNIT CELL

0 4
cr-
0C
Cf) 0L
(I)
(ii)
(iii .
(iv)
150 100 50 0 -50 -100 -150PPM

K
43 4-a -4-
3 143
~NYIUOSUW 3~NYU~OSSW
-e~0**
*SS6 £
0 U - - -
3~NVG~OSUY
2~PeYS~O5I V
Eu4~* 06
4 4.. 4 4e.g C C
- U4.- a.
S- C43a K4-.4 434- a4 .4C -
43
.2 a3~MYUWOSUV ~p.,guoSgY
GOS-~i7V U IIo U -0. -
10 <
jaisflI3 z+tBv; ilows 0 l
G]OS-I76V 0
GOS-175V 0 ED1l
GIOS-1VON ~c
COS-5 L CN
GOS-r) El LD'4Z
oCL

w (d)
zm
0
c', (C)
200 300 400- 500 600X (n m)

14
;z a) Ag4I 3 +
0 S4
d2
z I.2
Energy/eV
2.8
02.4 -b) [Ag4CO+ilo2.22.2
>2
cI 1.6 S
1.2
1
0.0.6
0 .0.2Zol0 .20 A 20.
EnergyleV

-0)q
C
CC,
AG/A6Jeu3

Energy/eV
-3b
-a-4
[Ag4C 3 +A3+
0
CD
U,
TECHNICAL REPORT DISTRIBUTION LIST - GENERAL
office of Naval Research (2)* Dr. Richard W. Drisko (1)Chemistry Division, Code 1113 Naval Civil Engineering800 North Quincy Street LaboratoryArlington, Virginia 22217-5000 Code L52
Port Hueneme, CA 93043
Dr. James S. Murday (1)Chemistry Division, Code 6100 Dr. Harold H. Singerman (1)Naval Research Laboratory Naval Surface Warfare CenterWashington, D.C. 20375-5000 Carderock Division Detachment
Annapolis, MD 21402-1198
Dr. Robert Green, Director (1)Chemistry Division, Code 385 Dr. Eugene C. Fischer (1)Naval Air Weapons Center Code 2840
Weapons Division Naval Surface Warfare CenterChina Lake, CA 93555-6001 Carderock Division Detachment
Annapolis, MD 21402-1198
Dr. Elek Lindner (1)Naval Command, Control and Ocean Defense Technical Information
Surveillance Center Center (2)RDT&E Division Building 5, Cameron StationSan Diego, CA 92152-5000 Alexandria, VA 22314
Dr. Bernard E. Douda (1)Crane DivisionNaval Surface Warfare CenterCrane, Indiana 47522-5000
* Number of copies to forward
12