ad-a242 228 envelopes were used to modulate a multitonal complex consisting of tones with...
TRANSCRIPT
val Submarine Medical Research Laboratory
NSMRL Report 1165 10 December 1990
AD-A242 228
41RDICAL Co b
CONTRIBUTIONS OF ENVELOPE INFORMATIONTO CLASSIFICATION OF BRIEF SOUNDS
Thomas E. Hanna jj'T (I
Released by:R. 0. Walter, CAPT, DC, USNCommanding OfficerNaval Submarine Medical Research Laboratory
Approved for public release, distribution unlimited
91-14930
UNCLASSIFIEDSECURITY CLASSIFICATION OF THIS PAGE
f-orrr Approved
REPORT DOCUMENTATION PAGE GM8No 0104 1e8
la REPORT SECURITY CLASSIFIATION lb RESN-tCTVt VA i,
Unclassified N. A.
2a SECURITY CLASSIFICATION AUTHORITY 3 DiSTR RJTO% AVAILAB IT' (- 2p(L'N. A. Approved for public release;
2b DECI ASSIFI(ATION, DOWNGRADING SCHEDULE distribution unlimited.N. A.
4 PERORMiNG ORCANiZAt'ON RI PORY NUMBER(S 5 MONITOAN6 ORiAN/AT ,". ' 1'. .. T
NSMRL Report No. Same
6a NAME OF PERFORMING ORGAN'ZA OC'N " 6L 0!fFICE SYMBOL 7a NAME F I )'To . : 'AT ON
Naval Submarine Medical (if appli(able)
Research Laboratory Office of Naval Research6r ADDRESS (City, State, and ZIP Code) 7b A')1F ,o (City Stat, and /'; Co(ie)
Naval Submarine 3ase-. jkew London 800 N. Quincy Street
B o x 90 0 8 i0 V A 2 2 2 1 7 -5 0 0 0
Groton, CT 06349-59008a NAME OF IIJNDING,'SPONSORING 3b OtF'(E SYMBOL 9 ;O('. VTN iNS' L' D U T', 1 A' I, '.'
ORGANIZA TON (If applicable)
Office of Naval Research Code 1142PS N00014-88-WR240038( ADDRESS (City. State, and ZIP Code) 10( SOjOi O P ", * % %
800 N. Quincy Street ELE M T R A0 I <JA" 7 1, N
Arlington, VA 22217-5000 61153N 421 RR 04209 R0420901 R&T4424207
11 I.:TLE (Include Security Classification)
(U) Contributions of envelope information to classification of brief sounds
12 PERSONAL AUTHOR(S)Thomas E. Hanna
13a TYPE OF REPORT 13b TIME COVERED 14 DAT Of P ' Cr R'0 (Year Month )y) !S, PAGE ()7Technical FROM8O7A0ITO9_qg/9/$ 1990 December 10 16
16 SUP'OEMENTARY NOTATION
17 COSAli ( OD 18 SuBJICt TERMS (Conr,nuc On, 'c o too of no(e'ssar ind ,dentJ b block nurnt)N'
FIELD GRO'JP iSUB GROUP Auditory perception; Aural classification;
Lnvelope features; Sonar signals
19 ABSTRACT (Continue on reverse if necessary and identify by block hurtbr,)
Listeners were trained to classify a set of sounds into eight categories. Classificationwas almost as good in subsequent tasks where listeners classified signal envelopes orsignals created by modulating a tone with the signal envelopes. Classification of signalcreated by modulating a tonal-complex or broadband noise was markedly worse, probably du4to interaction of sidebands from nearby carrier frequencies. These results suggest theimportance of envelope cues for aural classification. Further investigation of envelope
features and aural sensitivity to these features would further our understanding ofaural classification of brief complex sounds.
,?)'o 'T IOIIN A JA1 AF111 IIY 1)1 fo~r(I2 A 'O %i jR "7 .
ASi.r ' l i,' N; l Ei) [1 '.,AML V4E R P Li [o'( Unclassified22a NAMF OF tPE A I INDIVIDAt .'U '- N I for', )"A ," ( ,.. "
.nhn A-I. '-r. (22) A96-4502 Cncip 1142PRDD Form 1473, JUN 86 Previous edot,'ns are obso! .'tc . . .. 1 . "
S/N UNCLASSIFIE)

CONTRIBUTIONS OF ENVELOPE INFORMATIONTO CLASSIFICATION OF BRIEF SOUNDS
Thomas E. Hanna
NAVAL SUBMARINE MEDICAL RESEARCH LABORATORY
NSMRL REPORT 1165
OFFICE OF NAVAL RESEARCHRESEARCH WORK UNIT 61153N - RR4209.001-ONR4424207
Approved and released by
R. G. WALTER CAPT, DC, USN
Commanding Officer
NavSubMedRschLab
Approved for public release; distribution unlimited . .. . . . ..aV ,
a* ', . t ",,tl l
a.

SUMMARY PAGE
THE PROBLEMTo identify the potential relevance of the signal envelope for aural classification.
THE FINDINGSListeners were trained to classify a set of sounds into eight categories. Classification was
almost as good in subsequent tasks where listeners classified signal envelopes or signalscreated by modulating a tone with the signal envelopes. Classification of signals createdby modulating a tonal-complex or broadband noise was markedly worse, probably due tointeraction of sidebands from nearby carrier frequencies.
APPLICATIONThese results indicate that further investigation of envelope features and aural sensitivity
to these features would further our understanding of aural classification of brief complexsounds.
ADMINISTRATIVE INFORMATIONThis investigation was conducted under Office of Naval Research Work Unit 61153N-RR4209.001 -ON R4424207. It was submitted for review on 18 January 1990, approvedfor publication on 10 December 1990, and designated Naval Submarine Medical Re-search Report 1165.
ABSTRACT
Listeners were trained to classify a set of sounds into eight
categories. Classification was almost as good in subsequent tasks where
listeners classified signal envelopes or signals created by modulating a tone
with the signal envelopes. Classification of signals created by modulating a
tonal-complex or broadband noise was markedly worse, probably due to
interaction of sidebands from nearby carrier frequencies. These results
suggest the importance of envelope cues for aural classification. Further
investigation of envelope features and aural sensitivity to these features
would further our understanding of aural classification of brief complexsounds.
iii
Most psychoacoustic research has concentrated on describing the auditorysystem's ability to detect signals or to discriminate small changes in simplestimuli such as tones or bands of noise. More recently, increasing attention
is being paid to the auditory system's ability to classify sounds so that wecan better understand the acoustic features that underlie aural recognition ofcomplex real-world sounds. Many acoustic features are potentially availablewithin the auditory system, but an analysis of some of these features can besimplified by considering one aspect of the acoustic waveform - the amplitudeenvelope. The signal envelope is an amplitude-time function that describesthe signal's amplitude variation distinct from the spectral content. Thus,for example, a two-tone signal consisting of 500 and 504 Hz would produce a"beating" sensation due to its periodic 4 Hz amplitude variation, aswould a two-tone signal consisting of 800 and 804 Hz or any pair of
frequencies separated by 4 Hz.
Using two-tone complexes, Buus (1983) has shown that the auditory systemcan discriminate envelope fluctuations up to at least 640 Hz. Using a noise
carrier modulated by the speech envelope, Van Tassell et al. (1987) have shown
that envelope frequencies less than 200 Hz (and possibly higher) provide theinformation needed for the discrimination of certain speech features. The
present study examines the role of the envelope for the perception ofnonspeech sounds.
METHOD
Signals. Fifty one-second segments were extracted from digitized recordingsof underwater sounds. Each segment contained an event with a duration ranging
from tens to hundreds of milliseconds. Each event was approximately centeredwithin the one-second sample. The recordings had been digitized at a 12.5 kHzsampling rate with 12 bits of linear encoding of amplitude. A preliminaryclassification of the fifty events into eight categories was performed basedon transcripts of the recording sessions and in consultation with twoexperienced sonar operators who listened to the recordings in their original
context (prior to extraction). For each of the eight categories, threeexemplars were chosen that represented good-quality samples with minimalambiguity regarding the accuracy of the classification.
Classification performance was measured using the original set of fiftysignals and four other sets that were derived from the signal envelopes of theoriginal set. Envelopes were extracted from the digitized signals usingthe Interactive Laboratory System (ILS) from Signal Technology Inc. In thefirst of the envelope conditions, the fifty envelopes were used as signals,i.e., the envelope was presented as a time waveform; in the second condition,
the envelopes were used to modulate a multitonal complex consisting of toneswith approximately one-third octave spacing; in the third condition, the
envelopes were used to modulate a broadband noise carrier; and in the fourthcondition, the envelopes were used to modulate a 3-kHz tonal carrier.
Apparatus. For the condition with the original set of signdls and for thefirst of the envelope conditions, the sounds were presented over 16-bitdigital-to-analog converters with a 12.5 kHz sampling rate. Stimuli were
low-pass filtered at 5 kHz. All filters in this experiment had asymptoticrejection rates of 115 dB/octave.
In the modulated-carrier conditions, the envelope was presented over 16-bit digital-to-analog converters and low-pass filtered at 5 kHz (3 kHz for thetonal carrier). The carriers for the three conditions were: 1) a tonal-complex, consisting of 500, 650, 800, 1000, 1250, 1600, 2000, 2500, 3150,4000, and 5000 Hz tones (with arbitrary starting phases), which was presentedover a second digital-to-analog converter, 2) broadband noise, generated froma white-noise generator and filtered from 0.5 to 5.0 kHz, and 3) a 3-kHz tone,generated from an oscillator. The carrier was multiplied by the envelope andfiltered from 0.5 to 5.0 kHz (0 to 6 kHz for the tone carrier).
In all conditions a programmable attenuator was used to adjust theamplitude of each signal to a comfortable listening level. In addition, theprogrammable attenuator was used to randomize stimulus levels over a 15-dBrange to minimize the use of amplitude as a classification cue. An electronicswitch gated the stimuli with 20-ms, sine-squared ramping. Stimuli werepresented to the right earphone of a Sennheiser HD430 headset.
Procedure.
Table I shows the order of the training and testing phases.
Table I
Order of training and testing.
Initial trainingTraining for condition 1 (original signals)Testing for condition 1Training for condition 2 (envelopes)Testing for condition 2Retesting of condition 1 (exemplars only)Training for condition 3 (modulated tone complex)Testing for condition 3Retesting of condition 1 (exemplars only)Training for condition 4 (modulated noise)Testing for condition 4Retesting of condition 1 (exemplars only)Training for condition 5 (modulated tone)Testing for condition 5
Initial training: On each trial, one stimulus was presented and thelistener classified it using the letters A-H to designate the eightcategories. The correct response was displayed after each response. Only theexemplars from categories one through four were presented within half ofthe blocks and only exemplars from categories five through eight werepresented within the other blocks. These reduced sets were used to facilitatethe learning of category labels. Listeners had at least 670 trials for each
2

of these two stimulus sets by which time they had attained stable performance.Following initial training, condition-specific training and testing occurredfor the five conditions sequentially.
Condition-specific training: For each condition, listeners were trainedwith the full set of eight categories. Only the three exemplars from eachcategory were presented during this training, and correct-answer feedback wasgiven on each trial. One day of training, consisting of at least 720 trials,was conducted prior to switching to the test condition.
Testing: Each of the fifty stimuli was presented once within a block offifty trials. If an exemplar was presented, correct-answer feedback wasgiven. However, if the stimulus was one of the twenty-six stimuli that wasnot an exemplar (such stimuli will be called probe stimuli), no feedback wasgiven. Normally thirty-six blocks of fifty trials were administered duringthe test phase. These blocks were run over two days.
All listeners were tested simultaneously which preventedcounterbalancing the conditions across listeners. Conditions were run in thefollowing order: original sonar signals, envelopes, modulated tone-complex,modulated noise, and modulated tone. Before each of the modulated-carrierconditions, listeners were retested on the original set of signals for onesession (approximately 864 trials) to monitor performance in this baselinecondition. Only exemplars were used for retesting.
Listeners. Three paid volunteers and the author (identified as L2 in theTables) served as listeners. Each had normal hearing sensitivity (less than15 dB HL at octave frequencies from 250 to 8000 Hz). The author had beeninvolved in the stimulus preparation and was very familiar with the signalsprior to testing. The other three subjects had never heard these sounds priorto this experiment.
RESULTS
Table II shows percent correct on the original signals. Performance isstable except for a small improvement for Ll. L4's performance is markedlypoorer than the other three listeners -- even after thousands of trials withthese signals L4 only achieved 65% correct while the other three listeners gotmore than 90% correct.
Table II
Percent correct classification on initial and retested conditions using theoriginal signals for each of four listeners. The three retestings were priorto each of the modulated carrier conditions.
ListenersLl L2 L3 L4
Initial test 89.4 99.6 88.4 65.4First retest 95.6 -- 91.1 70.8Second retest 94.6 .. .. 65.4
Third retest 96.6 .- .. 64.1
3
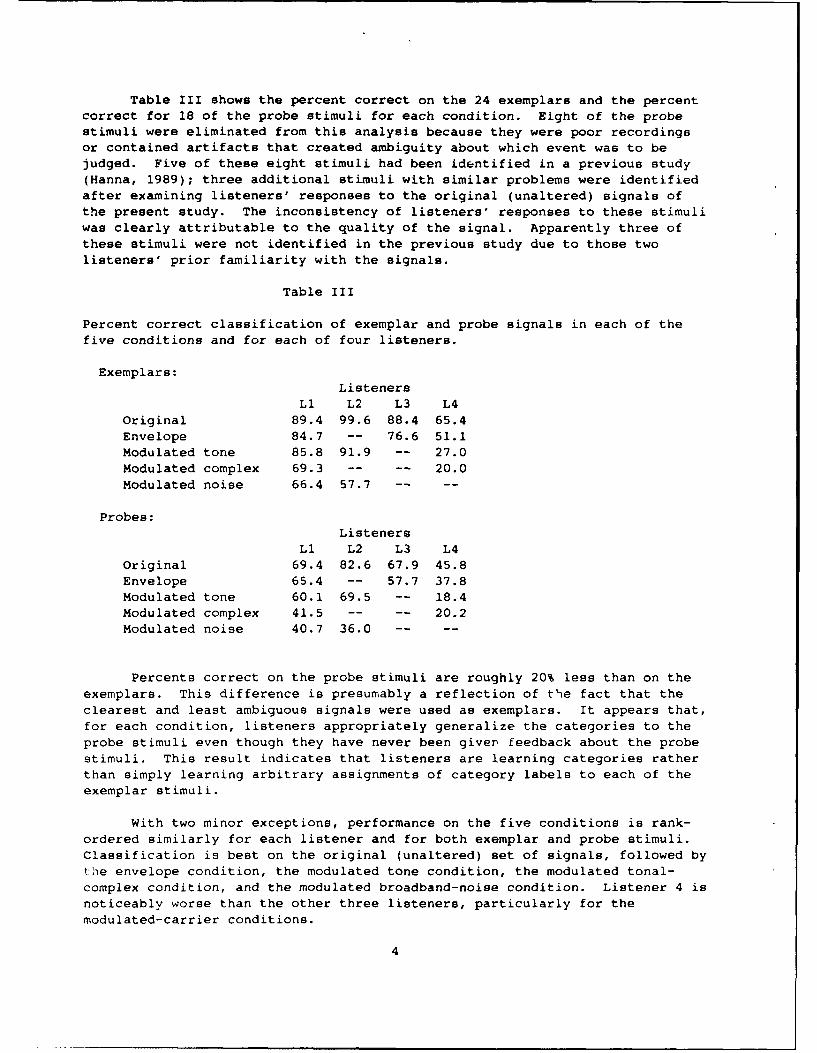
Table III shows the percent correct on the 24 exemplars and the percentcorrect for 18 of the probe stimuli for each condition. Eight of the probestimuli were eliminated from this analysis because they were poor recordingsor contained artifacts that created ambiguity about which event was to bejudged. Five of these eight stimuli had been identified in a previous study(Hanna, 1989); three additional stimuli with similar problems were identifiedafter examining listeners' responses to the original (unaltered) signals ofthe present study. The inconsistency of listeners' responses to these stimuliwas clearly attributable to the quality of the signal. Apparently three ofthese stimuli were not identified in the previous study due to those twolisteners' prior familiarity with the signals.
Table III
Percent correct classification of exemplar and probe signals in each of thefive conditions and for each of four listeners.
Exemplars:Listeners
Li L2 L3 L4Original 89.4 99.6 88.4 65.4Envelope 84.7 -- 76.6 51.1Modulated tone 85.8 91.9 -- 27.0
Modulated complex 69.3 .. .. 20.0Modulated noise 66.4 57.7 .. ..
Probes:Listeners
Li L2 L3 L4Original 69.4 82.6 67.9 45.8Envelope 65.4 -- 57.7 37.8Modulated tone 60.1 69.5 -- 18.4
Modulated complex 41.5 .. .. 20.2
Modulated noise 40.7 36.0 .. ..
Percents correct on the probe stimuli are roughly 20% less than on theexemplars. This difference is presumably a reflection of tie fact that theclearest and least ambiguous signals were used as exemplars. It appears that,for each condition, listeners appropriately generalize the categories to theprobe stimuli even though they have never been giver feedback about the probestimuli. This result indicates that listeners are learning categories ratherthan simply learning arbitrary assignments of category labels to each of theexemplar stimuli.
With two minor exceptions, performance on the five conditions is rank-ordered similarly for each listener and for both exemplar and probe stimuli.Classification is best on the original (unaltered) set of signals, followed bythe envelope condition, the modulated tone condition, the modulated tonal-complex condition, and the modulated broadband-noise condition. Listener 4 isnoticeably worse than the other three listeners, particularly for themodulated-carrier conditions.
4
Performance in the envelope condition was almost as good as for theoriginal signals. Percent correct was only 4-14% worse when the envelope waspresented as the signal. Moreover, the envelope signals sounded remarkablysimilar to the original signals. For two of three listeners for which acomparison is possible, performance on the modulated-tone condition is alsoalmost as good as for the original signals. For these two listeners (LI &L2), percent correct was only 4-13% worse with the modulated tone. The otherlistener (L4) was the one that did poorly (near chance) in all of themodulated-carrier conditions. All listeners showed a marked decrement withthe modulated tonal-complex and the modulated noise carriers. Percent correctwas 20-46% worse in these two conditions than for the original signals.Although performance was noticeably worse for these two conditions it shouldstill be noted that Li & L2 still got 36-69% percent correct with thesesignals (versus chance performance of 12.5%).
Table IV shows the pattern of errors made by Li for whom we have datafor all conditiors. This table shows the percentage of times each responsewas given to the exemplar signals from each of the eight categories. For theenvelope and modulated-tone conditions, categories 3, 6, and 8 are the onesthat show the largest decrements relative to the original signals. Most ofthe increase in errors is attributable to these three categories. Theseresults suggest that the envelope does not contain all of the information bywhich listeners distinguished categories 3, 6, and 8. For the modulatedtonal-complex and modulated noise conditions, decrements are found forcategories 1, 3, 4, 6, 7, and 8. The errors among stimuli from categories 1,3, 6, and 8 are common. These errors include those made in the envelope andmodulated-tone conditions as well as additional errors involving categories 1,4, and 7. Thus, the conditions do not idiosyncratically degrade thesignals--the conditions may be rank-ordered not only by overall level ofperformance but also by the types and amount of information that are affectedin the various conditions. The information lost (or masked) in themodulated-tonal-complex and modulated-noise conditions is in addition to thatlost (or masked) in the envelope and modulated-tone conditions.
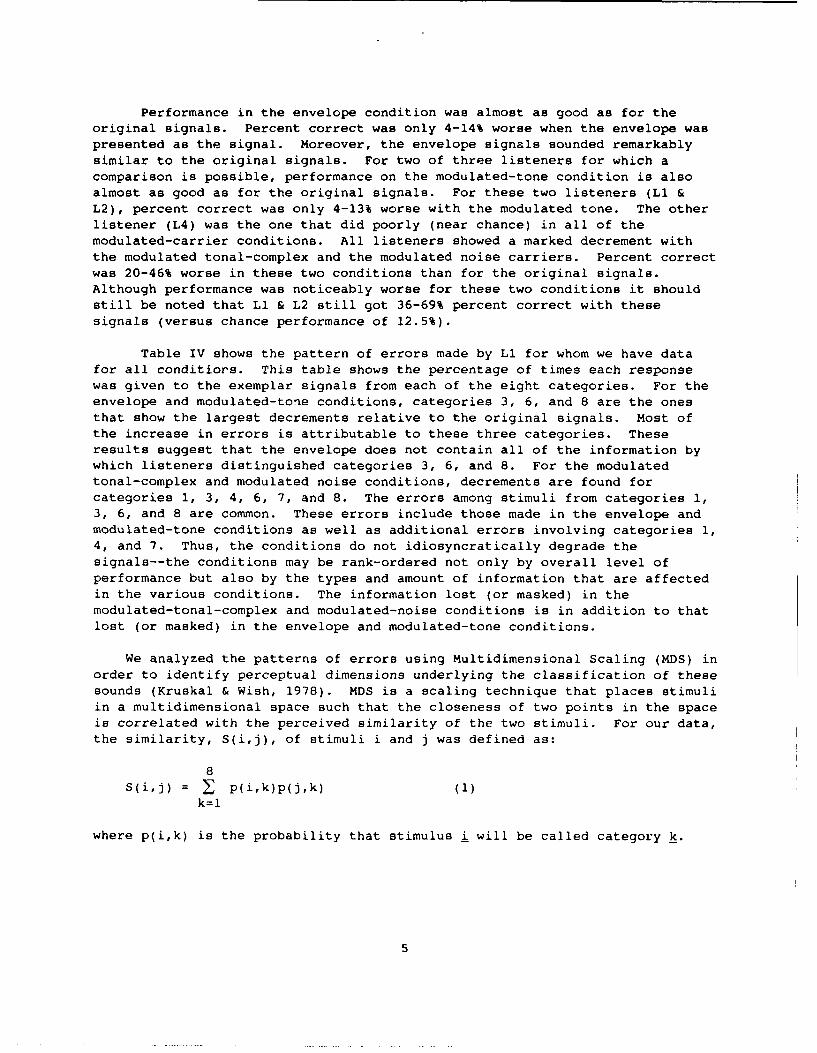
We analyzed the patterns of errors using Multidimensional Scaling (MDS) inorder to identify perceptual dimensions underlying the classification of thesesounds (Kruskal & Wish, 1978). MDS is a scaling technique that places stimuliin a multidimensional space such that the closeness of two points in the spaceis correlated with the perceived similarity of the two stimuli. For our data,the similarity, S(i,j), of stimuli i and j was defined as:
8S(i,j) = Z p(i,k)p(j,k) (1)
k=l
where p(i,k) is the probability that stimulus i will be called category k.
5

Table IV
Confusion matrix for Li for each of the five conditions. Each entry
represents the percentage of times this listener gave a particular response to
exemplar signals from a given category.
Original signals:Response
1 2 3 4 5 6 7 8Signal cat.
1 99 - - - - - - 1
2 1 64 31 1 - - 3 -
3 - 8 80 3 - 1 8 -
4 - - - 96 - - 4 -
5 - - - - 100 - - -
6 - - - 4 1 92 1 3
7 - - - 1 - - 99 -
8 - - 1 3 - 10 - 86
Envelope:Response
1 2 3 4 5 6 7 8
Signal cat.1 94 - - 1 - 4 - 1
2 - 75 20 - - 4 1 1
3 2 19 70 2 - 5 3 -
4 1 - - 98 - - 1 -
5 - - - -100 - - -
6 5 - 1 - - 72 - 23
7 - 2 - - - - 98 -
8 1 - 3 6 - 19 - 72
Modulated tone:Response
1 2 3 4 5 6 7 8Signal cat.
1 96 - 2 - - 2 - -
2 1 87 7 1 - 1 3 -
3 5 13 68 - - 10 1 3
4 - - - 100 - - - -
5 - - - -100 - - -
6 2 2 7 - - 76 4 9
7 - - - - - - 100 -
8 3 15 16 - - 7 - 59
6

Modulated tonal-complex:Response
1 2 3 4 5 6 7 8
Signal cat.
1 67 3 18 - - 1 1 102 4 75 21 - - - - -
3 13 16 44 1 - 4 2 20
4 - - - 92 1 - - 7
5 - - - 4 95 1 - -
6 5 3 14 3 - 44 7 24
7 1 6 13 1 1 1 77 -
8 1 - 3 21 - 11 2 62
Modulated broadband-noise:Response
1 2 3 4 5 6 7 8
Signal cat.
1 61 6 15 - - 11 1 6
2 7 88 1 2 - - 2 -
3 13 10 39 13 - 14 4 6
4 3 - 1 78 2 4 2 105 - - - 1 98 - 1 -
6 10 6 18 5 - 46 4 11
7 6 9 3 - - 1 81 -
8 10 2 4 16 - 22 4 41
7

MDS REPRESENTAION FOR 24 EXEMPLARS
I I I I
0.50CATEGORY
A I
00 2o 0.25- 0 0U) 03z V
o 0.00- /&K0 7
Cf)+ 8
-0.25
I i I i I I-0.25 0.00 0.25 0.50
MDS DIMENSION I
I I 5 I I
0.50-0.50
CATEGORY
')A A I
z 0 2o 0.25 0 3U) 7 4z
* 6o 0.00 0 : 7
V+ 8
-0.25i i I I I
-0.25 0.00 0.25 0.50
MDS DIMENSION 2
Figure 1. SINDSCAL representation for the twenty-four exemplars. Fig. la
plots values on Dimension 4 vs. values on Dimension 1; Fig. lb plots values on
Dimension 3 vs. values on Dimension 2. The different symbols represent theeight different stimulus categories. Three exemplars from each category are
shown.
8
This summed crossproduct corresponds to the probability that the two stimuliwould be given the same category label, assuming independent responses toeach. Similarity matrices defined by Eq. 1 were constructed separately foreach listener and condition. A SINDSCAL MDS analysis (Carroll & Chang, 1970)of these fourteen matrices (corresponding to condition by listener entries inTable III) produces a common perceptual space and a weightings space thatindicates differential weighting of the dimensions for the fourteen similaritymatrices.
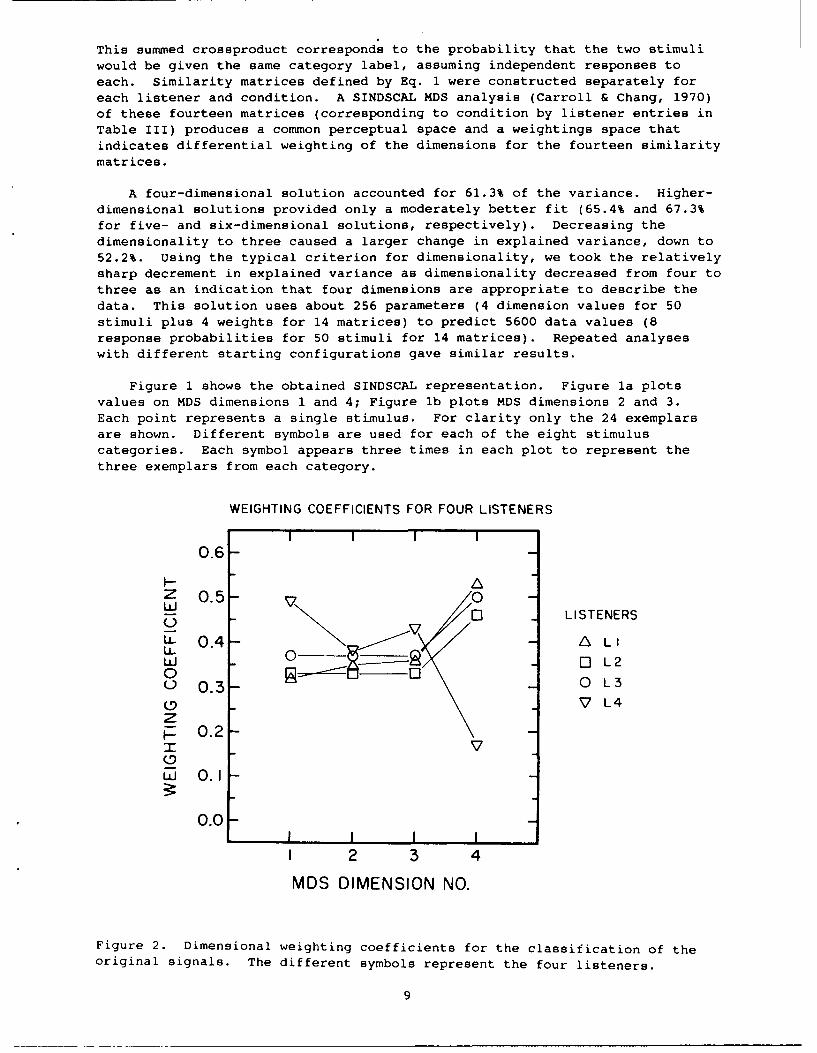
A four-dimensional solution accounted for 61.3% of the variance. Higher-dimensional solutions provided only a moderately better fit (65.4% and 67.3%for five- and six-dimensional solutions, respectively). Decreasing thedimensionality to three caused a larger change in explained variance, down to52.2%. Using the typical criterion for dimensionality, we took the relativelysharp decrement in explained variance as dimensionality decreased from four tothree as an indication that four dimensions are appropriate to describe thedata. This solution uses about 256 parameters (4 dimension values for 50stimuli plus 4 weights for 14 matrices) to predict 5600 data values (8response probabilities for 50 stimuli for 14 matrices). Repeated analyseswith different starting configurations gave similar results.
Figure 1 shows the obtained SINDSCAL representation. Figure la plotsvalues on MDS dimensions 1 and 4; Figure lb plots MDS dimensions 2 and 3.Each point represents a single stimulus. For clarity only the 24 exemplarsare shown. Different symbols are used for each of the eight stimuluscategories. Each symbol appears three times in each plot to represent thethree exemplars from each category.
WEIGHTING COEFFICIENTS FOR FOUR LISTENERS
I I I I0.6-
Z 05-00 LISTENERS
LL 4 LI0L C3-O" [ L 20U0L0 0.3 0 L30V L4z- 0.2
(DUj 0.1
0.0I I I !I 2 3 4
MDS DIMENSION NO.
Figure 2. Dimensional weighting coefficients for the classification of theoriginal signals. The different symbols represent the four listeners.
9
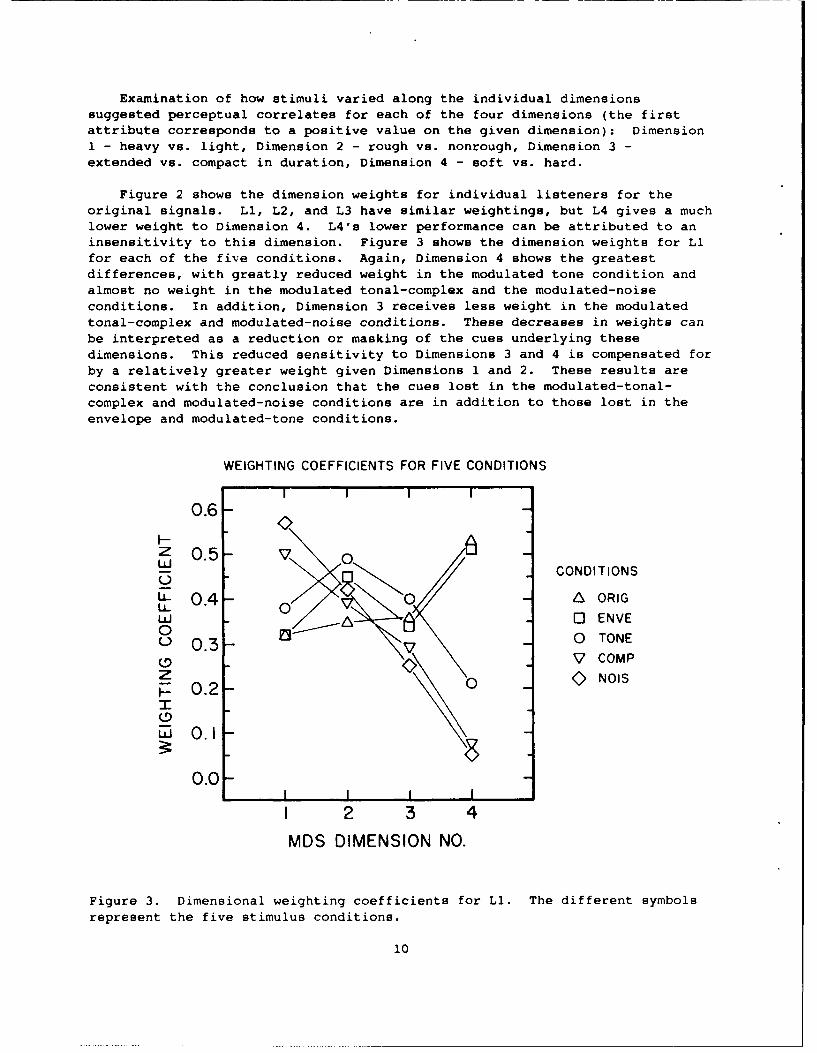
Examination of how stimuli varied along the individual dimensionssuggested perceptual correlates for each of the four dimensions (the firstattribute corresponds to a positive value on the given dimension): Dimension1 - heavy vs. light, Dimension 2 - rough vs. nonrough, Dimension 3 -
extended vs. compact in duration, Dimension 4 - soft vs. hard.
Figure 2 shows the dimension weights for individual listeners for theoriginal signals. Li, L2, and L3 have similar weightings, but L4 gives a muchlower weight to Dimension 4. L4's lower performance can be attributed to aninsensitivity to this dimension. Figure 3 shows the dimension weights for Lifor each of the five conditions. Again, Dimension 4 shows the greatestdifferences, with greatly reduced weight in the modulated tone condition andalmost no weight in the modulated tonal-complex and the modulated-noiseconditions. In addition, Dimension 3 receives less weight in the modulatedtonal-complex and modulated-noise conditions. These decreases in weights canbe interpreted as a reduction or masking of the cues underlying thesedimensions. This reduced sensitivity to Dimensions 3 and 4 is compensated forby a relatively greater weight given Dimensions 1 and 2. These results areconsistent with the conclusion that the cues lost in the modulated-tonal-complex and modulated-noise conditions are in addition to those lost in theenvelope and modulated-tone conditions.
WEIGHTING COEFFICIENTS FOR FIVE CONDITIONS
I I I I0.6-
I--z 05 v\W CONDITIONS
-0.4 0 A ORIG
/ L 0 ENVE0 0.3 0 TONE(0O'7 COMPz 0 NOIS0.2
o.I
0.1
0.0I I I
I 2 3 4
MDS DIMENSION NO.
Figure 3. Dimensional weighting coefficients for Li. The different symbols
represent the five stimulus conditions.
10
DISCUSSION
Although the number of listeners and conditions tested in this currentstudy are limited, the results serve to demonstrate that envelope features mayhave a very significant role for aural classification of brief nonspeechsounds. As indicated by performance in the envelope and modulated-toneconditions, sufficient information exists in the envelope to classify thesebrief nonspeech sounds very well. It would seem that the very low modulationrates, less than 80 Hz, are not critical because listeners could classifysignals in the envelope condition where frequencies less than 80 Hz arerelatively inaudible. However, low modulation rates may still be veryimportant after including auditory processing effects. The auditory systemmay be insensitive to modulation rates of 800 and 820 Hz, but easily hear the20 Hz intermodulation which exists between them. Thus, low frequencymodulation that is not present as a discrete component may be carried by highfrequency modulation rates.
The poorer performance in the modulated tonal-complex and modulatedbroadband-noise conditions is likely due to interaction of sidebands fromnearby carrier frequencies. For low modulation rates, perhaps less than 50Hz, these interactions would probably not interfere much with the coherentmodulation of the carrier frequencies. For larger modulation rates, thesidebands will be distributed widely, producing complex sets ofintermodulations at modulation rates that are lower than the coherentmodulation. The effects of critical band filtering and limited temporalresolution would provide greater emphasis to the intermodulations than thecoherent modulation, resulting in a significantly different modulation patternthan in the original signal. These interactions would also reduce themodulation depth of the envelope and make its lower-frequency components lessdiscernable. Whether the poorer performance with these broadband carriers isdue to the loss of the higher modulation rates or simply the masking of thelower modulation rates remains to be determined.
The SINDSCAL analysis provided four dimensions with perceptual correlatesthat are potentially related to sound source properties, such as hardness orweight. Gibson (1979) suggested that perceptual information is organized
according to its specification of object properties. The current results areconsistent with Gibson's theory. Warren and Verbrugge (1984) and Richards andUllman (1988) also suggest that temporal features can provide informationabout object properties. A psychoacoustic theory of classification wouldspecify the acoustic features by which object properties are auditorilydetermined. Results with the modulated carriers are first steps towardsidentifying acoustic correlates in that the presence of Dimension 3 and 4 cuesare significantly reduced. Apparently the sideband interactions withbroadband carriers affected the cues underlying Dimension 3 and 4 but notthose cues underlying Dimensions 1 & 2.
In summary, four dimensions have been identified for aural classificationof a set of brief underwater signals. Various methods of presenting envelopeinformation aurally suggest that the envelope contains important features foraural classification of these signals. Listeners were insensitive to some ofthese features under certain modulated-carrier conditions, but an acoustic
11

analysis of the important envelope features and modulation rates willrequire further data and reference to auditory models of modulationsensitivity.
12
ACKNOWLEDGMENTS
This research was supported by the Perceptual Sciences Program of theOffice of Naval Research. I thank Dr. Tom Santoro and Lee Shapiro for writingsignal-editing and experimental programs; Sue Carpenter for collecting thedata and assisting with the data analysis; and Drs. Jerry Tobias and PaulWeathersby for comments on drafts of the manuscript.
DISCLAIMER
The views expressed in this article are those of the author and do notnecessarily reflect the official policy or position of the Dept. of the Navy,Dept. of Defense, or the U.S. Government.
13

REFERENCES
Buus, S. (1983) Discrimination of envelope frequency, Journal of the
Acoustical Society of America 74, 1709-1715.
Carroll, J. D., & Chang, J. J. (1970). Analysis of individual differences in
multidimensional scaling via an N-way generalization of 'Eckart-Young"
decomposition, Psychometrika 35, 283-319.
Gibson, J. J. (1979). The ecological approach to visual perception. Boston:
Houghton Mifflin.
Hanna, T. E. (1989). Preliminary report on classification of transient sonar
signals, Naval Submarine Medical Research Laboratory Report No. 1142.
Kruskal, J. B., & Wish, M. (1978). Multidimensional Scaling. Eleventh in the
Series: Quantitative Applications in the Social Sciences (E. M. Uslaner,
Ed.), Sage Publications: Beverly Hills, CA.
Richards, W., & Ullman, S. (1988). Inferences from images: (Final Report
1984-1987) ONR Contract N00014-84-K-0650, pp. 90-100.
Van Tassell, D. J., Soli, S. D., Kirby, V. M., and Widin, G. P. (1987).
Speech waveform envelope cues for consonant recognition, Journal of the
Acoustical Society of America 82, 1152-1161.
Warren, W. H., Jr., and Verbrugge, R. R. (1984). Auditory perception of
breaking and bouncing events: A case study in ecological acoustics.
Journal of Experimental Psychology: Human Perception and Performance
10, 704-712.
14
ONR DISTRIBUTION LISTPerceptual Science Program
OUSDR (A)/R&A(E&LS) Dr. David Castanon Dr. Edgar M. JohnsonPentagon 3D129 Alphatech, Inc. Technical DirectorWashington, DC 20301-3080 111 Middlesex Turnpike US Army Research Institute
Burlington, MA 01803 5001 Eisenhower AvenueDr. Alan D. Baddeley Alexandria, VA 22333-5600Director, Appl. Psychol. Unit Dr. Marvin S. CohenMedical Research Council Dec. Sci. Consortium, Inc. Capt T. E. Jones, MSC, USN15 Chaucer Road 1895 Preston White Drive Aviation Medicine & HumanCambridge CB2 2EF Suite 30 Performance (Code 404)ENGLAND Reston, VA 22091 Naval Medical R & D Cmd
National Capital RegionDr. Bruce Barnes Dr. Stanley C. Collyer Bethesda, MD 21814-5044Program Director, Div. Info Office of Naval TechnologyRobotics, & Intell. Systems Code 222 Dr. Michael Kaplan,National Science Foundation 800 N. Quincy Street Director, Office Basic Res18(W) G Street, N.W. Arlington, VA 22217-5000 US Army Research InstituteWashington, DC 20550 5(101 Eisenhower Avenue
Defense Tech. Info. Center Alexandria, VA 22333-5600Mr. Charles Bates Cameron Station, Bldg 5Director, HE Division Alexandria, VA 22314 Prof. David L. KleinmanUSAF AAMRL/HE (2 copies) Electrical Engineering &WPAFB, OH 45433 Computer Science Dept.
Mr. Dan Greenwood University of ConnecticutMr. Norman Beck Netrologic, Inc. Storrs, CT 06268Naval Underwater Systems 5080 Shoreham PlaceCenter Suite 201 Mr. Keith KramerCombat Control Systems San Diego, CA 92122 Naval Research LaboratoryDepartment Code 221 Code 5532Newport, RI 02840 Jeffrey Grossman Washington, DC 20375-5000
Naval Ocean Systems CenterDr. Kenneth R. Boff Code 4402 Dr. Richard LoutittAAMRL/IIE Bldg. 334 National Science FoundationWPAFB, OH 45433 San Diego, CA 92152 Division ot Behavioral &
Neural SciencesMr. Luiz. Cabral Dr. Steven Hillyard 18(0) G Street, N. W.Naval Underwater Sys. Ctr. Univ of Calif - San Diego Washington, DC 20550Code 2212 Department of NeuroscienceBldg. 1171/1 La Jolla, CA 92093 Capt. William Moroney, USNNewport, RI 02841 Naval Air Development Ctr.
Prof. James H. Hvv!rd, Jr. Code 602Cdr. Robert C. Carter USN Department of Psychology Warminster, PA 18974Naval Research Laboratory Human Performance LabCode 5532 Catholic University Dean of the Academic Dept.Washington, DC 20375-50(X) Washington, DC 2X)64 U. S. Naval Academy
Annapolis, %1D 21402-5018
15
Naval Aerospace Medical Office of Naval Research Mr. Nelson F. SteeleResearch Laboratory Special Asst. for Marine Advanced Res Dev CorpSensory Division Code 23 Corps Matters 9151 Rumsey RoadPensacola, FL 32508 Code OOMC Columbia, MD 21045
800 N. Quincy StreetCommanding Officer Arlington, VA 22217-5000 Dr. John TangneyNaval Air Systems Command AF Office of Sci. Res.Crew Station Design Office of Naval Research Life Sciences DirectorateNAVAIR 5313 Perceptual Science Program Bldg. 410Washington, DC 20361 Code 1142PS Bolling AFB, DC 20332-64.1,8
800 N. Quincy StreetCommanding Officer Arlington, VA 22217-5000 Dr. Ronald J. TusaNaval Biodynamics Lab (3 copies) Johns Hopkins UniversityMichoud Station Neurology DepartmentBox 29407 Dr. W. A. Rizzo 34th & Charles PlaceNew Orleans, LA 70189 Head, Human Factors Div. Baltimore, MD 21218
Naval Training Systems CtrCommanding Officer 12350 Research Parkway Dr. Harold P. Van CottNavy Health Research Ctr. Orlando, FL 32826-3224 Committee on Human FactorsP.O. Box 85122 NAS-National Res. CouncilSan Diego, CA 92138 Prof. James A. Simmons 2101 Constitution Ave, N.W.
Department of Psychology Washington, DC 20418Commanding Officer Brown UniversityNavy Personnel R&D Center Providence, RI 02912 Dr. Charles S. WeaverSan Diego, CA 92152-6800 MAXIM Technologies, Inc.
Dr. H. Wallace Sinaiko 30(X) Patrick Henry DriveDirector Manpower Research & Santa Clara, CA 95054Technical Information Div. Advisory ServicesCode 2627 Smithsonian Institution Dr. John WeiszNaval Research Laboratory 801 N. Pitt St. Suite 120 Technical DirectorWashington, DC 20375-5000 Alexandria, VA 22314-1713 US Army Human Engineenng
LaboratoryUS Naval Test Center LCdr. Timothy Singer, USN Aberdeen P. G., MD 21003Aircrew Systems Branch Naval Air Development Ctr.Systems Engineering Test Human Factors Engrg. Div. Dr. Milton A. WhitcombDirectorate Warminster, PA 18974 NAS-National Res. CouncilPatuxent River, MD 20670 CHABA
Mr. James G. Smith 2101 Constitution Ave., N.W.Commanding Officer Office of Naval Research Washington, DC 20418Naval Weapons Center Code 121Human Factors Branch 800 N. Quincy Street Prof. Christopher D. WickensCode 3152 Arlington, VA 22217-5000 Departnr nt of PsychologyChina Lake, CA 91355 University of Illinois
Cdr. S. Snyder ('1-,ampaign, IL 61801Dr. Michael Letsky Office of Naval TechnologyOffice of the Chief of Code 222 Dr. Wayne ZacharyNaval Operations 8N0 N. Quincy Street CHI Systems, Inc.OP-01B7 Arlington, VA 22217-5000 Gwynedd Plaza IIIWashington, DC 20350 Bethlehem Pike
Dr. George Sperling Spring House, PA 19477Office of the Chief of Department of PsychologyNaval Operations 6 Washington PlaceOP-933D3 New York, NY 10003Washington, DC 20350-2000
16