ad 4 4 4 2 5 4 - dticichar urciau ' lieutenant usaf project oificer john w. taley( richard a....
TRANSCRIPT

UNCLASSIFIED
AD 4 4 4 2 5 4
DEFENSE DOCUMENTATION CENTERFOR
SCIENTIFIC AND TECHNICAL INFORMATION
CAMERON STATION. ALEXANDRIA. VIRGINIA
UNCLASSIFIED

q* WL
W WL-TDR-64-15 TDR
a464-15 -
RE-ENTRY BURN-UP MODEL FOR A
HYDRIDED ZIRCONIUM-URANIUM FUEL ELEMENT
TECHNICAL DOCUMENTARY REPORT NO. WL-TDR-64-15
Final Report
.June 1964
LU1
CD
Research and Technology DivisionAIR FORCE WEAPONS LABORATORY
Air Force Systems CommandKirtland Air Force Base
New Mexico
Project No. 1831, Task No. 183101
(Prepared under Contract AF Z9(60l)-5907by H. M. Childers, L. C. McCandless.and H. S. Jacobs, General TechnologiesCorporation, 708 North West Street,Alexandria, Virginia)
5LWA '..TS
Research and Technology DivisionAir Force Systems Command
AIR FORCE WEAPONS LABORATORYKirtland Air Force Base
New Mexico
When Government drawings, specifications, or other data are used forany purpose other than in connection with a definitely related Governmentprocurement operation, the United States Government thereby incurs noresponsibility nor any obligation whatsoever; and the fact that the Governmentmay have formulated, furnished, or in any way supplied the said drawings,specifications, or other data, is not to be regarded by implication or other-wise as in any manner licensing the holder or any other person or corporation,or conveying any rights or permission to manufacture, use, o- sell anypatented invention that may in any way be related thereto.
This report is made available for study upon the understanding that theGovernment's proprietary interests in and relating thereto shall not be im-paired. In case of apparent conflict between the Government's proprietaryinterests and those of others, notify the Staff Judge Advocate, Air ForceSystems Command, Andrews AF Base, Washington 25, DC.
This report is published for the exchange and stimulation of ideas; it doesnot necessarily express the intent or policy of any higher headquarters.
Qualified requesters may obtain copies of this report from DDC. Orderswill be expedited if placed through the librarian or other staff memberdesignated to request and receive documents from DDC.

FOREWORD
The authors feel obligated to acknowledge the assistance of several organizations
and individuals without which the successful complet'on of the program could not have
been accomplished.
First, we would like to thank the staff of the AFWL Research and Technology
Division's Nuclear Power Branch for sponsoring and inviting us to participate in a series
of contractors' conferences on the subject of nuclear auxiliary power system re-entry
problems. This kept us abreast of the results of other researchers in this particular area.
We're especially grateful to 1/Lt. Richard A. Pourciau for his attentive interest in and
comments on the work performed throughout the durat'on of the program. We are indebted
to Dr. Charles E. Wittliff of Cornell Aeronautical Laboratories, Inc. for supplying data
and guidance to reports on similar problems; to Drs. R. K. Lobb and K. Enkenhus for in-
valuable support in deriving the heat transfer relations and in reviewing the mathematical
re-entry model; to Dr. R. Elliott of the Armour Research Foundation for providing us with
his original data on the oxidation behavior of the fuel element material in question; and
to Drs. Mary Aldridge of American University, F. E. Littman of Astropower, Inc., and
B. M. Leadon of the General Dynamics Corporation for many helpful discussions on the
various problem areas that were associated w*-th the program.
WL-TDR-64-15
ABSTRACT
The problem of describing the re-entry behavior of a hydrided zirconium-
uranium fuel element of the SNAP 2 and 10A variety in an analytical form
suitable for computer application is studied with special emphasis placed on
the chemical interactions of the fuel with the re-entry environment. General
re-entry equations are presented. The trajectory and angular-motion equa-
tions are written in a form that includes effects from transpiration cooling,
heats of tusion, evaporation, dissociation, recombination, chemical reactions,
and mass accretion (or loss). All pertinent parameters are evaluated insofar
as available data will permit. The rate of hydrogen transpiration, the heat
energy added to the fuel element due to recombination of the transpired
hydrogen, and the vapor pressure of molten fuel material could not be determined
with reasonable accuracy from the available data. It is recommended that these
three parameters be determined through laboratory experiments and used in the
model described to determine whether or not the fuel elements will burn up during
re-entry.
PUBLICATION REVIEW
This report has been reviewed and is approved.
ICHAR URCIAU' Lieutenant USAF
Project Oificer
JOHN W. TALEY( RICHARD A. HOUSELt Colonel USAF Colonel USAFChief, Nuclear Power Branch Chief, Development Division
iii

CONTENTS
I INTRODUCTION I11 EQUATIONS OF MOTION AND RE-ENTRY 3
A. RE-ENTRY EQUATIONS 3B. ANGULAR MOTION EQUATIONS 8C. ABLATION EQUATIONS 10
III. EVALUATION OF PARAMETERS 15A. VALIDITY OF ASSUMPTION 6, AND DETERMINATION
OF C AND Tw 151. emperature of Rod 162. Determination of Tw 183. Determination of Cp, B, and B 20
B. DRAG COEFFICIENT AND VARIATION WITH ANGLE OF ATTACK 22C. EVALUATION OF HEAT TRANSFER COEFFICIENT CH 26
1. Definition of Heat Transfer Coefficient 262. Stagnation Line Heat Transfer Coefficient 273, Heat Transfer Distribution Around the Circumference of
a Cylinder 284. Heat Transfer Rate to a Pitching Cylinder 325. Heat Transfer to Afterbody 356. Heat Transfer to Ends of Cyl;nder 38
D. EVALUATION OF e 40E. EVALUATION OF Hch, Hch, AND d- 40
1 Evaluation of dW 40.9 tlich
2, Evaluation of Hch. 443. Determination of Hch 45
F. DETERMINATION OF G(Tw) 45G. DETERMINATION OF Hf, Hv, Twf, Fc, Fv, HdeG, AND Hc,deG 48
1. Heat of Fusion, Hf, and Heat of Hydration, HdeG 482. Heat of Vaporization, Hv and Twf 493. Heat of Combustion or Recombination, Hc,deG and Fe 50
IV. SUMMARY STATEMENT 52V. REMAINING RESEARCH TO BE ACCOMPLISHED 55
APPENDIX 1. CHEMICAL ANALYSIS 56APPENDIX II. ANALYSIS OF CHEMICAL REACTIONS OF A
HYDRIDED FUEL ELEMENT DURING RE-ENTRY 75REFERENCES 88
DISTRIBUTION 91
V

LIST OF FIGURES
Figure 1. Diagram showing the relationship between coordinates and parametersa' a point on a re-entry trajectory. 5
Figure 2. Diagrams showing the relationships between coordinates and vectors. 7
Figure 3. Cylinder drag coefficient. 24
Figure 4. Heat transfer to a yawed cylinder. 29
Figure 5. Circumferential heat transfer distribution on a yawed cylinder. 30
Figure 6. Variation of heat flux with 1. 33
Figure 7. Effect of temperature on the oxidation of zirconium-uranium hydridein 100% air. 42
Figure 8. Variation with temperature of reaction rate constant for oxidationof zirconium-uranium hydride. 43
vi

LIST OF TABLES
Table 1. Components and Total Drag Coefficients of a Cylinder with ,/d 10 25
Table 2. Tabulation of Equation 26 25
Table 3. X-Ray Diffraction Results 61
Table 4. Vacuum Fusion Analysis of Samples 63
Table 5. Tabulation of Samples 64
v
Ivtii

LIST OF SYMBOLS
a = hydrogen diffusion coefficient in ZrOg(grams/cm'-min, see eq. 84)
A = cross secti onalI area of vehi c Is td (fW)
Ad area of end of cylindrical rod =Trd/4 (W)
a = local velocity of sound = Ty Rg9T*' (ft/sec)
As pre-factor in the Arrhenius, equation (grams 2/cm'4-mi n)
b = arguments for the Bessel function
bn = positive roots of the first order Bessel function JL (6) =0
B1,B9= constants defined by eq. (23)
C = 2.27 x10-'
=* P*T*/tCT0 (see eq. 31)
C* (0) = * *(0)TD4wcT* (0) (see eq. 39)
CD = drag coefficient
CDd = drag coefficient for end face of rod
Cf = local skin friction coefficient
Cf = mean value of skin friction coefficient
CH = heat transfer coefficient
CHab = heat transfer coefficient for ofterbody
CHs heat transfer coefficient at stagnation point
CL - lift coefficient
CP specific heat capacity of constant pressure (Stu/slug-0OR)
Cpa =specific heat capacity of air -, 7.73 Btu/slug-alR
=p average specific heat capacity of rod material (Btu/slug-OR)
Cv - specific heat capacity at constant volume"(Stu/slug-OR)
D - dragl force - j Q~VCDA (slug-ft/see')
Viii

d = diameter of vehicle (ft)
ds : elementary segment of arc (ds' = dx 4 dy')
d = elementary angle subtended at the center of curvature of the trajectory bythe elementary arc length of trajectory ds
da = elementary angle subtended by ds as viewed from the center of the earth
F = function defined by eqs. (6a) and (7)
Fc = fraction of heat energy released by combustion or recombination of transpiringgas that is transferred to the fuel rod
Fv fraction of fused material that is vaporized
g = acceleration of gravity = 32.2 ft/sec"
G(Tw) functional relationship between Tw and dehydriding rate of fuel element
heat energy released in the combustion or recombination of the transpiredcdeG= gas (Btu/slug)
Hch = heat of chemical reaction, e.g. HZrO9, HZrN (Btu/gram-mole)
Hch = rate of chemical heat energy release (Btu/ft2 -sec)
HdeG = heat energy required to release one slug of gas (Btu/slug)
he = enthalpy content of the gas at the outer edge of the boundary layer (Btu/slug)
Hf = heat of fusion (Btu/slug)
hr = recovery enthalpy (see eq. 49) (Btu/slug)
hrod = total enthalpy of rod (Btu)
hs = stagnation enthalpy (Btu/slug)
Hv = heat of vaporization (Btu/slug)
hw = enthalpy of gas at wall temperature (Btu/slug)
hwf = enthalpy of gas at temperature Twf (Btu/slug)
hwg = enthalpy of gas at wall temperature Twg (Btu/slug)
hw : enthalpy of gas at wall temperature 300R
ix
- reference enthalpy (see eq. 40)
H' - 272,234 Btu/slug (=8465 Btu/16)
- dummy index number
- moment of inertia (slug-ft)
J - mechanical equivalent of heat = 778 ft-lbs/Btu
K' correlation parameter = Rem/YcOMOC* (see eq. 30)
K 2 (o) ReD/YOOMaC*(0) Isin 0 1(see eq. 38)
K )pper boundary condition on K2(O)
K MY constant (see eq. 52)
kmn thermal conduct%#ity of rod material (Btu/sec-ft-olR)
ksrote constant for parabolic oxidation law (grame/cm'-min or lbs/ft-secas appropriate)
J. length of vehicle. (ft)
ft for ce I. P CCLA (slugs-ft/sec')
M = molecular weight of gas (grams/mole)
m,.h molecular mass of chemical reactant or produce, e.g. MZrOS (slugs/mole)
1AdoG gram molecular weight of transpiring gas (grams/mole)
MM0 1,ydrogen mass per u-iit surface area (grams/cm 8)
MHr =mass of hydrogen released per unit area In a time;t (grams/cm'?)
m= loccl MAach number at 'edge of boundary layer
14 - m nclec rr -, oss of rod moterial (slugs/wale)
M * reve strrccm Mnch number
Am. cbhange ;n mass (grams/cm2 or lbs/ft* as appropriate)
Am -~mass of hydrogen in rod per unit area (grams/1cm')
n dummy index number and order of Jacabian
XC

Pe = local Pitot pressure at outer edge of boundary layer (Iba/ft2 )
Pv = vapor pressure (mm Hg)
P = normal shock recovery pressure (lbs/ft)
Pr = Prandtl number = 4Y/(9Y - 5)
Ps = stagnation pressure (lbs/ft)
Poc = free stream pressure (lbs/fto)
= heat flux (Btu/ft'-sec)
qa = average value of radial heat flux to cylinder = 0.31 4s (Btu/ft2 -sec)
Cab = heat flux to afterbody of cylinder (Btu/ft2 -sec)
lo = radial heat flux without transpiration cooling (Btu/ftm -sec)
A = radial heat flux at stagnation point (Btu/ft2 -sec)
Ctr = radial Neat flux with transpiration cooling (Btu/ft2 -sec)
€4 = radial heat flux into rod (Btu/ft 3 -sec)
41 = normal heat flux through surface of fuel rod during i th time interval (Btu/ft'-sec)
r = distance between centers of gravity of earth and vehicle (ft)
rc = radius of curvature of vehicle trajectory (ft)
Re = Reynolds number
= local value of Reynolds number = Pe Ve/w e
ReO = PoVod/2pao (applicable to end of cylinder)
Rg = universal gas constant = 1715 ft-lbs/slug°R
rg = radius of gyration (ft)
r = radius of earth (or reference sphere whose radius is the average value of the
earth's radius) (ft)
ro vector from center of gravity of earth to center of gravity of vehicle
s - arc length, dummy Index or refers to stagnation value as appropriate
xi

Qs reaction energy divided by R9 (OR)
S = area of vehicle, and initially S = rd 2 /2 + Td, (fta)
S* = constant = 198,6
St = f Pr-/2
T = absolute temperature (OR)
t = time (seconds or minutes, as required)
Te = local temperature at outer edge of boundary layer (OR)
To initial temperature of rod (OR)
Ts = stagnation temperature = V20/2JCpO (OR)
T = average temperature of the rod, e.g. hrod = C Tr (OR)p
= average temperature of the rod during the time interval Ats (OR)
Tw = wall temperature (OR)
Twf - wall temperature at time of fusion (OR)
Twg = wall temperature at time of gas transpiration (OR)
T* = reference temperature (see eqs. 32, 40)
At$ = short time interval, s = 0, 1, 2 ...
Tm = free stream temperature (OR)
V = velocity (ft/sec)
Ve = local stream velocity at outer edge of boundary layer = a.Me (ft/sec)
Vo free stream velocity, hence vehicle velocity relative to stationary atmosphere(ft/sec)
W local time weight of vehicle (Ibs)
Wweight gained or lost per unit atea (lbs/ft'or grams/cm" as appropriate)
x - position coordinate of vehicle along surface of sphere whose radius is yE-t ro (ft)
xli

x e = position coordinate along surface of red (distance reckoned from stagnationpoint in end-on flow condition) (ft)
x = radial distance from cylindrical axis of rod (ft)
y = altitude of vehicle (or distance above reference sphere) (ft)
YE altitude of vehicle (fuel element) at beginning of re-entry trajectory (ft)
Greek Symbols
a 0.715
= 1/(24,800 ft)
y = specific heat capacity ratio = Cp/C v
Yoo = free stream spec;fic heat capacity ratio
At = short time interval , 1 to 3 seconds, i = 0, 1, 2, 3... (sec)
= optical emittance of vehicle surface
* = density ratio across normal shock
C = (du/dx)s = stagnation point velocity gradient (see eq. 63)
Cn = Newtonian value of C (see eq. 64)
= transpiration coefficient = 0.60 (29/M)0'3
e = trajectory angle above horizon of sphere of radius y + ro
= angle around cylinder, reckoned so that 1"= 0 at stagnation point in thecross-flow position
OE = initial re-entry angle
X = proportionality constant for linear hydrogen loss rate (in "1 )
= viscosity of air
= local viscosity of air at outer edge of boundary layer
xdii

P- = viscosity of air calculated at the reference enthalpy (see eq. 33)
4co free steam viscosity of air (see eq. 31)
P = density of a;r (;lugs/ft3 )
eP -- local dens-ty of air at the outer edge of the boundary layer (slugs/ft)e
P = density of fuel rod material (slugs/fta)
0 sea level density of air (slugs/ft3 )
stagnation point density (slugs/ft8 )
P free stream air density (slugs/ft3 )
= density evaluated at the reference enthalpy (slugsft4)
a = Stefan-Boltzman constant (Btu/ft2-sec-°R4)
0 = pitch angle (angle cylindrical axis makes with direction of flow, O= 0 in
end-on flow condition)
U = angular velocity (radians/second)
Company Identification by Letters
Al - Atomics International (Division of North American Aviation, Inc.)
ARF - Armour Research Foundation, presently known as Illinois Institute of TechnologyResearch Institute
CAL - Cornell Aeronautical Laboraories
GTC - General Technologies Corporation
IITRI - Illinois Institute of Technology Research Institute
NAAI - North American Aviation, Incorporated
SRI - Stanford Research Institute
Xiv

I. INTRODUCTION
One of the problems attendant with the use of fuel-rod-carrying nuclear reactors
in satellite applications is the possibility that these fuel rods will re-enter the earth's
atmosphere without burning up entirely and reach the earth wholly or partially intact,
thereby producing radiation hazards in populated areas. The purpose of the present pro-
gram is to establish a mathematical model whereby various fuel element re-entry conditions
can be simulated on a computer to determine if such fuel elements will indeed burn up at
sufficiently high altitudes to render earth surface level hazards negligible.
Several previous studies on the fuel element materials have been made, as is evi-
dent from the bibliography in this report. These data, together with samples of fuel elemeilt
material that had been subjected to simulated re-entry tests, formed the basis of the present
study.
The problem of describing the re-entry behavior of nuclear fuel material may be
divided into three general areas:
(1) Establishing the system of re-entry equations;
(2) Delineating the parameters that must be known in order to solve thissystem of equations; and
(3) Through chemical analysis on the samples and mathematical analysis ofthe available data, determining the values of these parameters. Thoseparameters that are not constant throughout the re-entry regime must bedescribed in analytical form for simultaneous solution with the re-entryequations.
The system of equations has been established for the limited case of re-entry of cy-
lindrical fuel rods, Gilthough the analysis may be applied to the more general case of re-
entry of material of arbitrary shape. The assumptions used in deriving this system of equations
|1

are: stationary planet atmosphere; planar trajectory; negligible effect of net lifting forces
on the trajectory; and uniform wall temperature due to the rod spinning about its zylindri-
cal axis. The parameters required for the solution of this set of simultaneous differential
equations have been defined and their values determined as accurately as the existing data
will allow.
The primary limitations on this study are due to the inadequacy of the available data.
Some of those inadequacies are discussed at the end of the report and possible measures to
overcome their shortcomings are suggested.
2

II. EQUATIONS OF MOTION AND RE-ENTRY
In this section, the trajectory and angular motion equations will be formulated to-
gether with the effects of ablation and accretion on these equations. The evaluation of
the various parameters involved in these equations is the subject of the following section.
A. RE-ENTRY EQUATIONS
F i ve assumptions are employed in deriving the equations of motion of a re-entering
vehicle. The first two of these are:
Assumption 1. The planet atmosphere is stationary.
Assumption 2. The re-entry trajectory is planar.
The following notation i3 employed:
ro = radius of earth. (This can be considered as the distance from the centerof gravity to the surface of a reference sphere having the average radiusof the earth.)
y = altitude above earth's surface (can be considered as altitude above thesurface of the reference sphere).
x = co-ordinate along the surface of a sphere from the point of re-entry,
i.e., (x,y) = (0, YE) at the point of re-entry.
r = distance from center of gravity of vehicle to center of gravity of earth.
rc = radius of curvature of trajectory.
8 = trajectory angle above horizon of sphere of radius (ro - y).
ds = distance along trajectory (ds = dy + dx').
V = velocity of vehicle relative to stationary atmosphere.
p = density of atmosphere.
A = cross sectional area of vehicle (4d), 4, = length, d = diameter of thevehicle.
3

W weight of vehicle (at earth's surface), and
g = acceleration cF gravity (at earth's surface), so that
W/g = mass of veh!cle.
LI = lift of vehicle = i- OV2ACL.
CL = lift coefficient.
D = drag of vehicle = I- PV3ACD.
CD = drag coefficient.
t = tme (taken as zero at point of re-entry, i .e. (x, y, t) = (0, YE, 0) atpoir't of re-entry). E is a subscript denoting conditions at the point ofre-entry.
Other symbols will be defined as they are brought into use.
Note that dE -_raneE
Now, it is appropriate to derive a relationship between ro and rc . To do this, refer
to Figure 1. From the geometry, it follows that
ds = rcdY, ds- roseceda, and -d =dY-da,
where dy is the elementary angle subtended by the elementary arc-length, ds, along the ve-
hicle trajectory, and do is the elementary angle subtended by ds, as viewed from a point at
the center of gravity of the earth. Therefore,
d@ - dY do_ 1 Cosds 2 ds rc ro
Thus, the following identities hold:
c o 8 - d P o - do forsmall e, andrc r 5 ~ 0
4

rr 0
Z Center of earth
Center of curvature
Figure 1. Diagram showing the relatinship between co~xdiates and parareters
at a point on a re-entry trajectory.
5

d9 I deT-v T'"
Hence,I cose 1 de
For forces normal to the flight trajectory, Figure 2 shows that
L[c W V9S=s g rc
Assumption 3. Since the net effect of lift forces on the fuel element in question (a
cylinder whose length is approximately ten times its diameter) only changes the length of the
trajectory by a small fraction, they will be assumed to be negligible; hence,
ro]2 W V2 w Cse _ I e]-W r cos= -- -- 9 t
orde = Vcos 1 (1)
For forces along the flight path, Figure 2 shows that
4"[ ° ]Tsi n e d [ .- ['"V].
Making use of the definition of the drag, D, and performing the indicated differentiation,
this last expression becomes
p V2ACD +WF sln = d --W si. (2)i ~L-rJ'g T g dt
By definition of coordinates and 0, it follows that
dx =-Vcos (3)
t Vsine. (4)
6

(rO)2W "'*-Line perpendicular to-r.
V
w
r
Figure 2. Diagrams showing the relationships between coordinatesand vectors.
7

D
(rO)\ "-- Line perpendicular to-r,
-'r) Wcsw
Fiw.2.D~grmsshwngth rlaioshp btwencordnae
and vctors
7-o, snP

These four equations (eqs. 1, 2, 3, and 4) specify the re-entry motion of the fuel elements
in terms of the initial conditions and
de dV dx d
The quantities V, r, W, and e can be calculated from the foregoing equations if the
quantities p, CD, A, and dW/dt can be specified independently.
The value of p can be determined either from atmospheric tables or from the approxi-
mation.
p = 0 Poe _Y
whereapo = sea level density (slugs/ft3 ),
= 0.715, and
= 1/(24,800 ft).
The values of A and CD must be determined from the angular motion of the rod, since
they depend on the orientation of the fuel element for their specific values during any instant
of time (t, t + dt). The dynamics of a re-entering rod are fairly well understood. (See, for
example: Raymond and Garber, 1 Davey and Grigsby, 2 and others.)
B. ANGULAR MOTION EQUATIONS
The general angular motion (for a rod tumbling in the plane of the trajectory) should
be governed by an equation of the form" *
dT" OlW) = F(0, A, d, o, VCo), (6a)
U= do (6b)
Raymond assumes the static restoring and damping forces are respectively proportional to
sin 20 and cos0 AVCO's calculation3 indicates that this is not far frow correct.
8

wheres
F = is a function to be defined in eq. (8).
co = subscript denoting free stream conditions.
w = angular velocity of rod.
¢ = angle of cylindrical axis of rod with respect to end-flow position.(0 = n/2 at cross-flow; 0 = 0 for end-on flow condition.) 0 istermed the pitch angle.
= _ r2 = moment of inertia, with rg = radius of gyration.g
, = length of rod (feet).
d = diameter of rod (feet).
A= td.
free stream density (slugs/ft3 ).
Performing the irJicated differentiation in eq. (6a), making use of eq. (6c), and sub-
stituting an analytical fit to AVCO's3 calculations on the static restoring and damping coeffi-
cients for F, the angular equation of motion becomes*
.iW a.+W ] -1.40 %VO Adsin20[ +2.l7sin2 20] -71 POVAdI sinOl (7)
Assumption 4. It has been assumed that rg is constant in deriving eq. (7). When
weight losses and/or dimensional changes are such that rg cannot be considered constant, the
term (2wW r9 /g) d rg/dt must be added to the left-hand side of eq. (7).
The two additional parameters dw/dt and d0/dt, introduced by eq. (7), can be deter-
mined by the simultaneous solution of equations (6b) and (7) with equations (1) through (5),
provided that the initial conditions on 0 and w are specified. Due to the relatively small
*Note, AVCO's curve (Fig. B-1-8 in ref. 3) could be read point for point Into a computer
program and used in place of the right-hand side of eq. (7). The overall accuracy of thisanalytical fit to AVCO's curve is within 5%.
9
thermal expansion of the fuel element material considered in this report, the effect of this
expansion on rg can be neglected for practical purposes. It should be emphasized that
eq. (7) is valid only for cylindrical vehicles. If other vehicle shapes are to be used, the
right-hand side of this relation has to be evaluated for the particular shape in question.
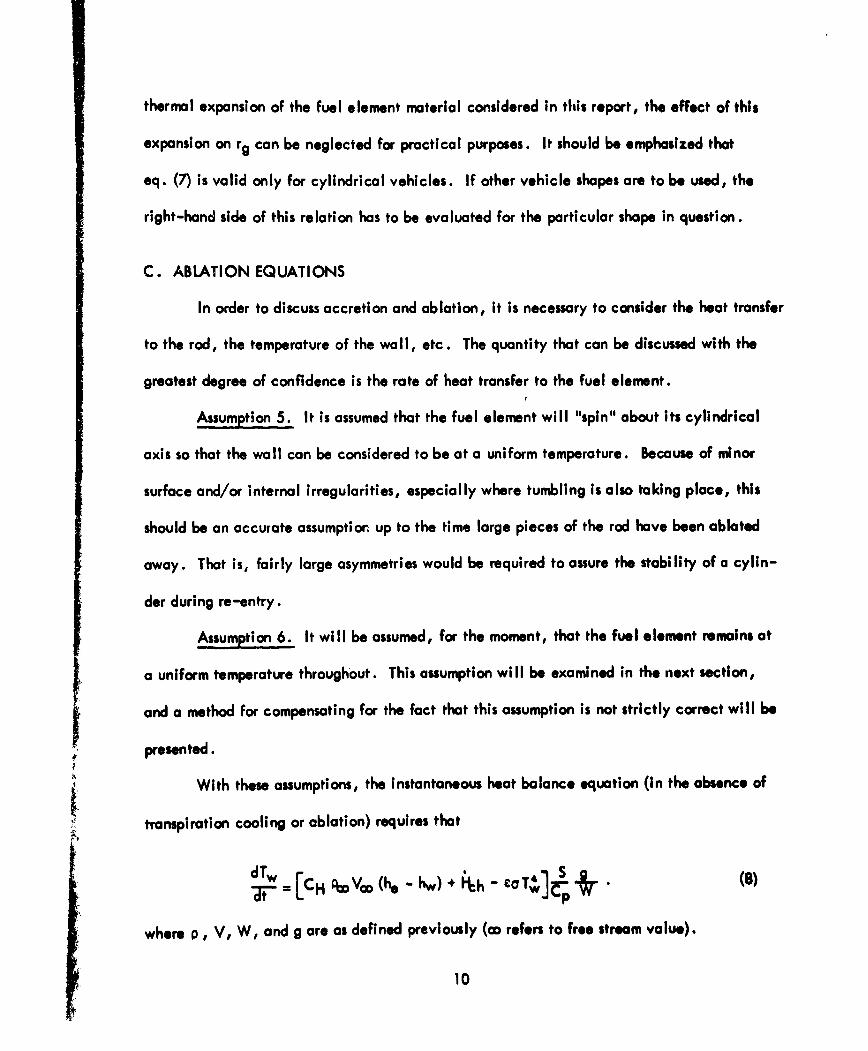
C. ABLATION EQUATIONS
In order to discuss accretion and ablation, it is necessary to consider the heat transfer
to the rod, the temperature of the wall, etc. The quantity that can be discussed with the
greatest degree of confidence is the rate of heat transfer to the fuel element.
Assumption 5. It is assumed that the fuel element will "spin" about its cylindrical
axis so that the wall can be considered to be at a uniform temperature. Because of minor
surface and/or internal irregularities, especially where tumbling is also taking place, this
should be an accurate assumption up to the time large pieces of the rod have been ablated
away. That is, fairly large asymmetries would be required to assure the stability of a cylin-
der during re-entry.
Assumption 6. It will be assumed, for the moment, that the fuel element remains at
a uniform temperature throughout. This assumption will be examined in the next section,
and a method for compensating for the fact that this assumption is not strictly correct will be
presented.
With these assumptions, the instantaneous heat balance equation (in the absence of
transpiration cooling or ablation) requires that
-di-~~[ : H P- , -C (hw)-€
where P, V, W, and g are as defined previously (cc refers to free stream value).
10

Tw = temperature of wall (OR).
CH = average heat transfer coefficient (averaged over one cycle of"1spli") - dimensionless.
he = stagnation enthalpy at outer edge of boundary layer (Btu/slug).
hw = enthalpy of air at the wall temperature (Btu/slug).
C = emittance of the wall material - dimensionless.
a = Stefan-Boltzmann constant = 4.8 x 10⁻¹³ Btu/ft2-secOR'.
Hch = rate of chemical heat input to rod due to chemical reactions(Btu/fta -sec).
S = surface area of rod (ft2)
Cp = average specific heat capacity of rod (Btu/slug - OP), and maybe a function of its temperature history.
The heat transfer coefficient, CH, which depends on the re-entry conditions and geome-
try of the vehicle in question, can be obtained from published literature, ostensibly from papers
by: R. J. Vidal and C. E. Wittliff;4 and J. C. Fay and F. R. Riddell. 5 The value of Tw is
obtained from the initial conditions and eq. (8), solved simultaneously with the preceding
seven equations. The emittance, C, and the average heat capacity, Cp, must be known for
every value of Tw. The quantity Hch must be calculated from the environmental conditions and
the chemical interaction of the rod material with the environment.
The change in weight rate, dW/dt, may be subdivided into three categories: the decrease
in mass due to outgassing of the rod, the decrease in weight due to fusion (melting) and evapora-
tion, and the increase in weight due to chemical interactions.
In the outgassing category (dehydriding), first assume that no outgassing takes place un-
til a certain wall temperature, Twg, is reached, and that Tw = Twg until all the gas has escaped.
Then the heat balance equation for transpiration cooling requires that
!. 1I

1 dWI [CH PV.(h. - hw) - - aT'w] S- gt deG, Twg HdeG + r (he - hwg) - Fc Hc, deG (9)
where
I dWI = rate of change in mass of the rod, in slugs/second,g dt eG, Twg due to outgassing.
Twg = the outgassing temperature.
HdeG = energy required to release one slug of gas (Btu/slug).
Hc, deG = heat energy released in the combustion or re-combination
of the transpired gas (Btu/slug).
T = transpiration coefficient (dimensionless).
Fc = fraction of the combustion energy, Hc deG, that isabsorbed by the fuel rod (dimensionless)
hwg = entholpy of air at the temperature Twg.
Equation (9) neglects the rate of increase (or decrease) of weight due to Ich. This
will be treated separately. The last term in the denominator of eq. (9) accounts for the effects
due to possible changes in the state of an absorbed gas after it has been released from fuel rods
such as the combustion or re-combination of the hydrogen as it is released. This relation is
valid so long as the denominator is positive.
The value of 'n has been studied by Rose and Allenhartze and by Georgiev.' It is given
by F 29 O° G
= 0.60L'MdeGJ , (10)
where MAdeG is the molecular weight of the outgassed material. This will be discused In more
detail in the following pages. In case more than one molecular weight is involved, MdeG Is
the average molecular weight, i .e., the weight, in grams, of a mole of the transpiring gas
mixture.
12

In the case where the temperature does not remain constant during the blowing of the
outgassing material, the situation becomes more awkward to treat mathematically. It can be
handled in a formal manner when rod integrity (shape) is maintained. According to the theory
of transpiration cooling,' 7 the heat flux through the wall, Ctr, with transpiration is less than
the value, 4o, without transpiration cooling by the factor i(h e - hw)dm/dt. The quantity
dn/dt is just the rate of mass loss per unit area; hence,
ltr = Co -l(h e - hw)I I ldieG
where dW is the magnitude of the weight loss rate per unit area due to the evolutionwhere g _eG
of the transpiring gas. Now the heat balance condition requires that
1dW + WC dTw
qtr + i ch = (Hf+lHv)g It " i -at- + coTa .
Here, Hf and Hv are respectively the heats of fusion and vaporization of the material that is
producing the evolving gas (Btu/slug). Eliminating 4tr from these two equations and noting
that 4o = ProVcoCH(he - hw), the expression for the rate of change in the total vehicle mass,
due to transpiration, is
[%aVoCH(he - hw)+ Hch ca T W. d' w SSdW] _ gS dt
g dGH v + Hf+ , (he - hw)( )
This equation is to be used in place of eq. (9) when Tw is not constant during outgauing.
There may be an accretion of mass associated with the chemical reactions whose heat
release (or absorption) rate is Hch. If Mr and Mt h ore respectively the masses of the rod ma-
terial and the accreted compound in slugs/gram-mole, then, clearly,*
SchJ M h)S, S(12a)[Hch
*Hch is negative for exothermic reactions, but kIch always has the opposite sign of Hch.
13

where Hch is the heat of the reaction Mr + 0 + N -4 Mch in Btu/gram-mole. (The 0 and
N may be molecular, partially ionized or atomic in this reaction.) If there are %veral re-
actions taking place, a summation over Ich, Hch, and Mch must be employed. When eq. (12a)
is added to eq. (11), the net rate of mass loss (or gain) is obtained. These equations are valid
so long as the accreted products remain on the rod. When (or if) the accreted products start to
flake off of the rod, a different treatment is required.
In view of the fact that both dW I and dTw appear in eq. (11), an equation similarTt IdeG _T
to eq. (12a) must be deduced for separating these two parameters. For the present, this independ-
ent relationship will be written ao
1ldW
- ' deG G(Tw) (12b)
Finally, the case of fusion and evaporation of the rod will be considered. This process
is considered to take place at the fusion temperature, Twf, and a certain fraction, Fv, of the
material is assumed to evaporate and produce transpiration cooling. By similarity with eq. (9),
this vehicle mass change rate is obviously given by
- 1 dW [CH I Vca (he - hwf) + Ich - ea T4f] S
vap-Twf Hf + Fv[Hv + f(h - hwfl(
It should be noted that eqs. (11) and (12) are to be solved simultaneously with eqs.(1)
through (8). In a case where eqs. (9) and (13) are applicable, the first eight equations are
followed until the respective wall temperatures reach Twg and Twf, and the temperature is
then held constant (at Twg or Twf) until the process is completed. The use of eqs. (8) through
(13) requires a knowledge of Cp, Ich, Hch, MdeG, Mch, Hv, Hf, Twg, and Twf.
14

Ill. EVALUATION OF PARAMETERS
The foregoing equations are sufficient to accurately describe the re-entry behavior
of the fuel rod up to the point where the rod starts to break apart. They are still valid after
the break-up begins, provided the various parameters associated with the imperfectly shaped
remnants of the rod can be calculated or otherwise evaluated. The Assumptions 1 through 5
are, to within the present state of the art, quite satisfactory. Consequently, the only items
that require a detailed analysis are:
CD, CH, Cp,S
Hc deG, HdeG , Hth , Hch, Hf, Hv,
Tw, Twg, Twf, C, G(Tw),
MdeG, Mr, Mch , Fc, Fv, and
Assumption 6.
It is not necessarily true that all of these parameters will be required in a particular re-entry
computation since the phenomena are, in some ways, related and may interfere with one
another. For example, the formation of an oxide layer on the surface of the rod may prevent
the transpiration of the hydrogen. Each of these parameters will now be analyzed.
A. VALIDITY OF ASSUMPTION 6, AND DETERMINATION OF Cp AND Tw
It will now be shown that Assumption 6 is quite convenient and permits one to write
the equations of heating (eqs. 9, 11, 12, and 13) In forms which are readily manageable. By
writing Tw and Cp in functional forms, the need for assuming a uniform temperature through-
out the rod can be circumvented, as will be shown presently.
15
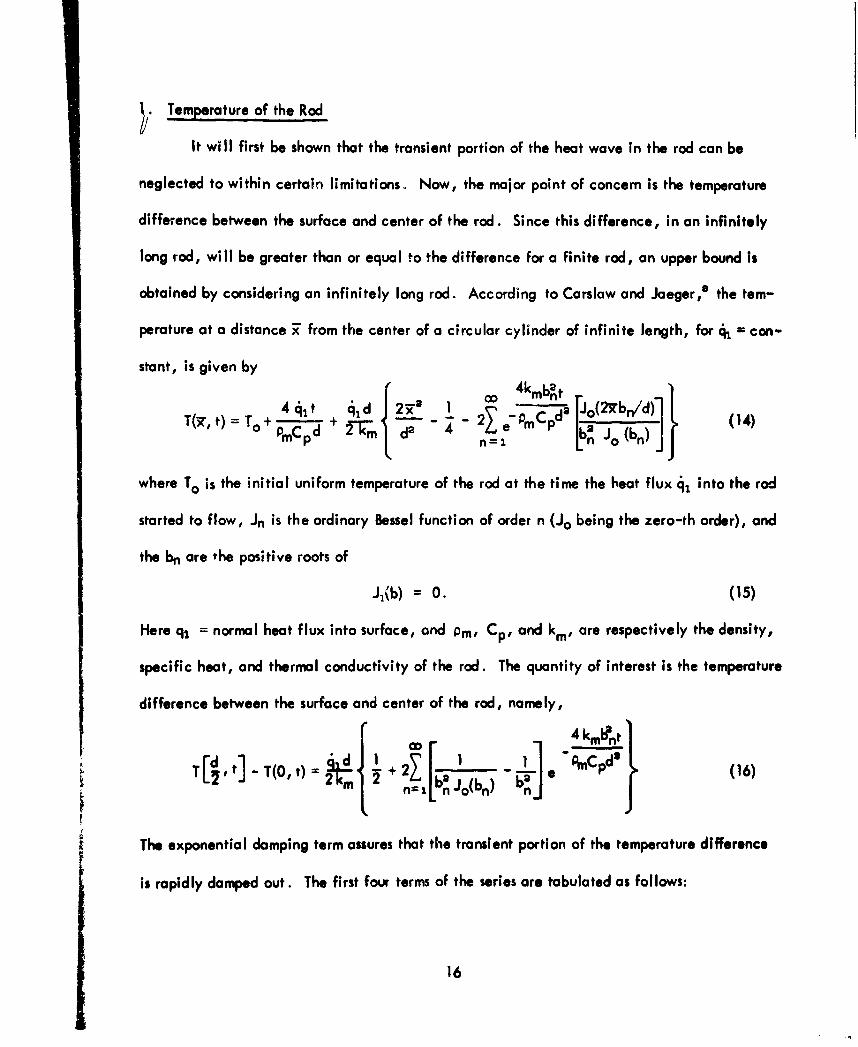
Temperature of the Rod
It will first be shown that the transient portion of the heat wave in the rod can be
neglected to within certain limitations. Now, the major point of concern is the temperature
difference between the surface and center of the rod. Since this difference, in an infinitely
long rod, will be greater than or equal to the difference for a finite rod, an upper bound is
obtained by considering an infinitely long rod. According to Carslaw and Jaeger e the tem-
perature at a distance V" from the center of a circular cylinder of infinite length, for 1 = con-
stant, is given byj 2O 4kmbrt i
4 ht cld t) =_ 2Z '-Ppda [Jo(2 d)14)
0 d d2 4 Lem ba J (b~)(4
where To is the initial uniform temperature of the rod at the time the heat flux j, into the rod
started to flow, Jn is the ordinary Bessel function of order n (Jo being the zero-th order), and
the bn are the positive roots of
J,(b) = 0. (15)
Here q, = normal heat flux into surface, and Pm, CP, and km, are respectively the density,
specific heat, and thermal conductivity of the rod. The quantity of interest is the temperature
difference between the surface and center of the rod, namely,
00m [ 4 km! n t
[dt oI Y 1 mpdT- T•,t 2 n (16)
2. n= Ln Jo(bn 2]
The exponential damping term assures that the transient portion of the temperature difference
is rapidly damped out. The first four terms of the series are tabulated as follows:
16

- - 1 4k~bt,
n ~ ~ ~ ~ LnbnJ~b);I 2IOnI bn J2 b-Ib Jo(bn) K Jo(bn) -...]
1 3.832 -5.906 -.758 -1 .516 "p -2.45t
2 7.016 +14.77 +.047 + .094 exp [-8.22t]
3 10.173 -25.81 -. 0484 -. 0968 exp [-17.28t]
4 13.324 +38.72 +.0206 +.0412 exp [-29.65t
where
d= .011 fto, km s .007 Btu/ft-sec-OR,* Pmft 380 lbs/fta , Cp O. 1 Btu/Ib -R.
From this table, it is seen that
d 1 1 d3 1 f 1T t] -' -(, t) = 1 o r second,
2kmL 2 JT~d, TOf ) =!h- [ -0.01 .Jfor t =2 seconds,
and T[. , t]-T(o, t) = d[ . o.oo,] for = 3secds.
From this it is apparent that the temperature difference is a minimum at the time q1 is "turned
on" and reaches an approximately equilibrium value in a few (say 3) seconds. It is quite
important to the present problem that the transient temperature effect dies out quickly. For
high altitude fuel element release ()250,000 ft.), no large changes in 4 over a period oi
three seconds or less will be experienced by the re-entering rod." It is apparent from the
above tabulation that the temperature difference between the surface and center of the rod is
given, for practical purposes, by
T [ - T(O) = 1d 7.4 4h OR (17)
*Actually, km varies from about 0.005 Btu/ft-sec-R at 830oR to .009 tu/ft-sec-R at 3170ORaccording to ARF data. 17

where 4, is the not heat flux (Btu/ftm-sec) into the sample, that is, €l = CH(he "h w +
lch - £a T~ averaged over the surface of the rod.
In view of eq. (17) and the fact that 41 is not expected to exceed about 100 Btu/ft8 -
sec for fuel rod release altitudes of 250,000 ft. or greater, even with chemical reactions, it
is reasonable to assume that the temperature variation within the rod will not exceed 7400R.
At higher temperatures (where km is larger than .007), this temperature difference will be less.
It will be shown in the following treatment of Tw that either considerably shorter time incre-
ments than three seconds or greater average heat fluxes than 100 Btu/ft2 -sec will not introduce
excessive errors in the calculation of Tw .
2. Detirmination of Tw
In order to use eq. (14) with varying C3 , some means must be devised for accounting
for the temperature distribution at the beginning of each time increment. In view of the fact
that the transient part of eq. (14) will die out in three seconds, it is convenient to divide the
heat flux pulse into a series of consecutive heat pulses, chi, which appear as inputs to the fuel
element at successive intervals that are three seconds or greater apart. Thus, in accordance
with eq. (14), the wall temperature during the first time Interval, (Ato), Is
Tw(A to) = To+ 44mdAto . k-d (18)
OmC pd 8Bkm
Note that Ato can be varied continuously from three seconds onward but should be set at three
seconds up to the time Ato = 3 seconds in calculating T. during the first three seconds. After
the time Ato has elapsed, a new heat flux pqlse 445 replaces Cho. This second heat pulse
sees a different value of the rod temperature than the original To. The average Increase in
temperature of the rod during the first heat pulse Is obtained from the enthalpy of the rod at the
end of this pulse. If it is assumed that the heat capacity of the rod remains constant over the
18

temperature range present in the rod, the enthalpy of the rod is
(hrod)totaI = 2Tr pm Cpt. Cod T(-)cdl'.
Substituting eq. (14) for T(x) into this expression, holding t and Cp constant, and integrating
gives, ird(hrod)total - t mCpTo + rrd. -t4t = (hrod)o + Ahrod,
where Ahrod is the increase in rod enthalpy due to the input 4 for the time t. Since
(hrod)total = mn pT" .ffd in terms of the average rod temperature, T, and average specific4
heat capacity, Cp, it follows that the average temperature of the rod at the end of the first time
interval, Ato, is44ho A to
PmCZpd
The value of Ts,+ can be written immediately as
S
4 , =T o +- q (19)
Here T$+. Is the average temperature of the rod, based on constant 'p, at the beginning of
the time interval Ats. Equation (18) may also be written in general form as
4 4js 4t5 41sdTw(Ats) = Ts 4+, + + - (20)
qmCpd 8km
Now, it must be noted that Cp varies with temperature. To take this into account, it must be
considered in calculating i4,. The value of Cp at a particular temperature can be written as
B. + BT. If this functional form is substituted Into eq. (20), the result Is
Tw(a ts) = Ts + I. + 4. 4 4, Ats 1
8 km Pmo(kI4 STs4 ,)d (21)
19

The appropriate value of T+ for use in eq. (21) is obtained by substitution of + BTS+
into eq. (19) and solving for Ts + . The result is
Ts = ' 0 B a BI +To + 116 +I "q t]2 (22)I 21F Bd 'o
When this value of T. +I is substituted into eq. (21), the wall temperature is given. This value
of Tw is used in equations (8) and (11). It is apparent from eq. (22) that the last time increment
in the series (Ats) has a very small effect upon Ts+,, or on Tw(Ats), provided that s is large
(say 10 or more).
3. Determination of Cp, B and B,
In accordance with the averaging process represented by eq. (22), it is clear that the
effective value of Cp is
C'p= B +BTs 1 (23)
This is valid providing that 6ts is kept sufficiently small and that the average value of Cp can
be considered constant during the time interval Ats. Now, it has been pointed out that the
transient effect due to increasing Ch from 4 -(, to qzs has a small effect on Ts for large values
of s, that is, when the transient heat pulse is superimposed upon a high enthalpy rod, the tran-
sient part of the heat pulse only contributes a small amount to the total enthalpy. Consequently,
one can use quite small values of 6ts , certainly on the order of one second, for the large values
of s near the peak heating portion of the trajectory.
Because of the large mass of the fuel element relative to the mass of the oxide formed
thereon, the change in heat capacity due to the conversion of some of the fuel element to
oxides and/or nitrides can be neglected to a good approximation. Hedge, et aol°(ARF data)
20

give the values of Cp without the coating layer of ZrO and/or ZrN, and Wicks and Block
give the heat capacities (as a function of temperature) for ZrO2 and ZrN.
It should be noted that Hedge, et al, M found that during the oxidizing of a sample
of the fuel element material at the temperature 19300R, no hydrogen was released. It took
the sample about 160 seconds to come to an essentially equilibrium temperature in this particu-
lar case. This indicates that the hydrogen does not evolve up to temperatures of 19300R. Their
data on the oxidation in a 10% air, 90% argon atmosphere at 3010PR clearly show an initial
decrease in mass which is consistent with the loss of most of the hydrogen in the specimen. The
sample reached equilibrium in about 70 seconds in this case, and the center temperature reached
1930OR in about 20 seconds. Samples of fuel element material were exposed to a simulated re-
entry trajectory (by varying the rate of heat erergy input simultaneously with atmospheric pres-
sure) by Littman31 at SRI (Stanford Research Institute). He observed that water vapor appeared
during these tests. The GTC chemical and metallographical analyses of the SRI samples confirm
the loss of hydrogen from the samples that underwent the simulated re-entry te4ts. Except for
the very low heating trajectory (SRI Trajectory IA) simulated by SRI, essentially all of the hy-
drogen escaped, and even on this low heating trajectory, about 75% of the hydrogen escaped.
These data represent the only experimental data available with which to determine the rate at
which the hydrogen escapes through the surface. Although ARF tried to establish the diffusion
rate of hydrogen through an oxide coating on a sample specimen of fuel element material, the
experiments failed because of loss of oxide through structural fait ures. This will be discussed
in more detail in the next subsection under G(Tw).
There are two ways of handling the specific heat capacity of the fuel element material.
The oxides and/or nitrides, if shown to be significant, can be handled separately. The ARF
data show that the heat capacity of the hydrided material is higher than that of the dehydrided
21

material at temperatures above about 700OR and equal to it at high temperatures (20400R).
It is here assumed that no hydrogen is lost during re-entry at temperatures below 20400R.
The above mentioned data, as well as the analytical evaluation of such data (see Appendix II)
support this position. Thus, at high temperatures, it can be shown from the ARF data that the
heat capacity of the dehydrided material is
Cp Zr:U = 0.0433 + 1.33 x 10"T Btu/ib - aR for T " 20400R. (24)
Hence, B, = .0433, and B. = 1 .33 x 10"in this temperature range. This will be slightly in
error in the vicinity of the transition point (c to 8 phase at 20400R) but will be accurate at
the high temperatures. Similarly, the heat capacity of the hydrided material is
CpI = 0.108 + 2.65 x 10-51 Btu/Ib - OR for 700 <T<2040°R. (25)
Hence, B1 = 0.108, and B = 2.65 x 10- r in this temperature range.
Since the value of Cp does not change markedly in going from eq. (24) to (25), it is a
fair approximation to use either of these values in eqs. (21) and (22). For temperature very near
to 204 00R, eq. (14) can be used to establish what portion of the fuel rod should be treated as
having a heat capacity given by eq. (24), with the remainder being treated as having a heat
capacity given by eq. (25).
B. DRAG COEFFICIENT AND VARIATION WITH ANGLE OF ATTACK
The drag of the fuel element rod can be calculated from the "modified" Newtonian
theory. For this calculation, it is convenient to break the total drag down Into two parts; that
is, the part due to the radial cylindrical surface and the part due to the ends.
Raymond's drag curvee is of little value In the present application since the 4/d ratio
Is quite different from that for the fuel element rod. Fortunately, Penland"1 has the Newtonian
22

CD curve for an infinite cylinder. This curve is plotted in Figure 3. For a finite cylinder with
flat or hemispherical ends, the values must be modified to allow for the end effects. The local
pressure on the end face of the rod, which !s now treated as a flat disc, is equal to PO' cosO,
where P, is the normal shock recovery pressure. Thus, the normal force = Fo cosoeAd, where
Ad is the area of the disc. The CDd for the disc, based on the area of the disc, is given by
Pod cosd0 cosoAd_ Po' coo 0CDd- P 0Ad
Here V- 0 is the free stream dynamic pressure. The drag coefficient, based on the broad-
side area A of the cylinder is given by the relation
pC odC0 - ~o 3 Ad
CDd = P d
CDd =~ x~ PO' oe 0rr
CDd= .l6 Wos0 ,
d4where '
Table 1 shows how the total drag coefficient depends on the pitch angle, 0. The drag
coefficient for the end disc is also plotted in Figure 3. Finally, the total drag coefficient Is
shown in Figure 3. A good analytical fit to this total drag curve is given by the following
e xpression: CD total = •146 Cos3 0 + 1.2 sin90 - .175 sine(20). (26)
This function is tabulated in Table 2 and plotted in Figure 3.
23

0
0
00
00
00 CV)
424

Table 1. Components and Total Drag Coefficients of a Cylinder with t/d - 10
0 cos c00 CD Disc CD Cylinder CD Total
00 1 1 .146 0 .14610 .9848 .94 .137 .01 .1420 .9397 .82 .120 .05 .17030 .8660 .643 .0938 .155 .24940 .7660 .446 .0652 .34 .4150 .6428 .263 .0384 .54 .5860 .5000 .125 .0183 .78 .8070 .3420 .0400 .00584 1.0 1.080 .1736 .0052 .00076 1.15 1.1590 0 0 0 1.2 1.2
Table 2. Tabulation of Equation 26
0 .146 cos'0 1.2 sn' 0 .175 sins(20 CD Total
0 .146 0 0 .14610 .137 .036 .0205 .152520 .120 .14 .0723 .187730 .0938 .30 .131 .262840 .0652 .496 .169 .392250 .0384 .704 .169 .573460 .0183 .90 .131 .787370 .00584 1.058 .0723 .99280 .00076 1.16 .0205 1.1490 0 1.20 0 1.20
If the rod has hemispherical ends, then the ends have a constant drag coefficient. At
hypersonic speeds, this value, according to Kuehn,4 Is CD - 0.94 if based on cross s ctlimal
area of the sphere. It should be noted that if the cylinder broadside area is used, then a dif-
ferent area from that used in the last analysis should be selected. The now area would simply
be (, - d)d + -i. The drag coefficient for this case is obtained by multiplying numbers In
the fifth column of Table 1 by the ratio [ - d)d + " J/4d. This modifies eq. (26) toread
25

CD total 0.069 1.17 sin' - 0.171 sin*(20). (27)|pherical
caps
Thus, if or when the edges of the fuel element burn away, eq. (27) Is more appropriate than
eq. (26).
C. EVALUATION OF HEAT TRANSFER COEFFICIENT CH
In the re-entry regime of interest for the fuel element rod (altitudes of 300,000 feet or
less), the heat transfer can be considered to be due to laminar aerodynamic heating. The heat
transfer coefficient for the "no-blowing" case can be derived from the report of Vidal and
Wittliff. 4 Th6 effects of blowing are then handled in accordance with eqs. (9) through (13).
The empirical expressions derived closely approximate the experimental results obtained in the
Cornell Aeronautical Laboratorys Six Foot Hypersonic Shock Tunnel. These tests were carried
out at Mach number from 17.13 to 23.46 at stagnation temperatures varying from 18000 K to
5100°K for a wide range of Reynolds numbers. These Reynolds numbers cover those appropriate
to the fuel element over the altitude range 150,000 feet to 300,000 feet. The experimental
data Include both the real gas effects and the hypersonic interaction effects which will be en-
countered by the re-entering fuel element. The chemical effects of reaction heating, trans-
piration cooling, etc., will have to be handled Independently. The determination of the
aerodynamic heating effects is established in the following six subparagraphs.
I. Definition of Heat Transfer Coefficient
The laminar heat transfer coefficient Is defined as*
CHKv, , )- V ) (28)
26
This empirical expression was derived by fitting a cubic equation to the data. Equation (35)
is quite valid in the range 0.1 A- K' 4 100. It agrees with the viscous shock layer theory of
Cheng as well as that of Cohen and Reshotko.'
It should be noted that for IK-0.1, one gets into the transition and free molecular
flow regimes, and eq. (35) is not applicable. Also, for very large values of K', eq. (35) fails.
It is actually theoretically correct for the conditions: Ts;>Tw, Pr = 0.71, and c* = 0.10;
where & is the density ratio across the normal shock, and Pr is the Prandtl number. However,
it does fit the experimental data quite well, as indicated by Figure 4.
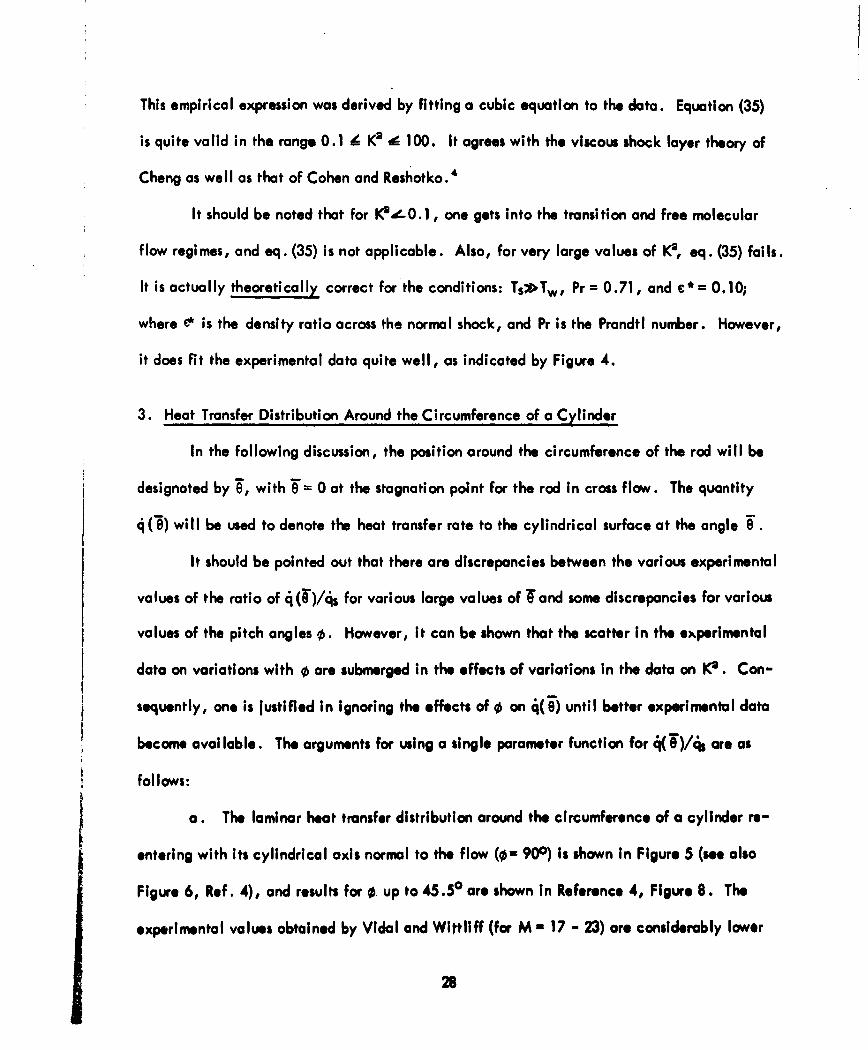
3. Heat Transfer Distribution Around the Circumference of a Cylinder
In the following discussion, the position around the circumference of the rod will be
designated by e, with 16= 0 at the stagnation point for the rod in cross flow. The quantity
4(g) will be used to denote the heat transfer rate to the cylindrical surface at the angle e6.
It should be pointed out that there are discrepancies between the various experimental
values of the ratio of Cl(')/Cs for various large values of W and some discrepancies for various
values of the pitch angles o. However, it can be shown that the scatter in the experimental
data on variations with o are submerged in the effects of variations in the data on K'. Con-
sequently, one is justified in ignoring the effects of 0 on 4(i) until better experimental data
become available. The arguments for using a single parameter function for 4(6)/4s are as
follows:
a. The laminar heat transfer distribution around the circumference of a cylinder re-
entering with its cylindrical axis normal to the flow (0- 900) Is shown in Figure 5 (see also
Figure 6, Ref. 4), and results for 0 up to 45.5° are shown in Reference 4, Figure 8. The
experimental values obtained by Vidal and Wittliff (for M - 17 - 23) are considerably lower
28

C! 6
08
00 LU
.000
K 'z
cINS
6) C1IH
4) * ~4 29

Tewfik &Giedt 0 goo0
10-1
45 ~ Experiment (CAL,*(Vidal &Wittliff)
0.8< K2<5-2 450< 0<90oo
10
log [O
10~0 30 60 90 120 150 180
-6 (Deg)
Figure 5. Circumferential heat transfer distribution on a yawedcylinder.
30

than those obtained by Tewfik and Giedt.' This is particularly true far the back side of the
rod, i.e., for 90°( Z 1800.
b. For 0< F< 900, the Vidal and Wittliff data agree well with the theoretical distribu-
tion derived by Beckwith" for laminar boundary heating of a cylinder. (See Ref. 4 for detailed
comparison.)
c. Laminar separation on the back side of the cylinder is evidenced by the dependence
of 4(-) on KO (see Fig. 5). That is, laminar separation is affected by the Reynolds number.
Fortunately, the effect of laminar separation is only pronounced for 6> 120" for which
l(T)/s .03, i.e., less than 3% of the stagnation value. Thus, one is justified in fitting an
average curve through alI of the experimental data points for various values of Ka
d. Although the theory of Beckwith predicts a dependence of €(l-) on o, the data of
Vidal and Wittliff (see Figure 5) shows that if there is such a dependence, it is submerged by
the influence of laminar separation. The spread in data is represented by the fact that for
0 = 900 and 45.5°1 observed values of C( -C4ls are essentially the same for values of K = 2
and 5, whereas at o = 600 and K2 = 1 .6, the observed value is quite different. Hence, it
may be concluded that variations in 1(0/8ls with 0 are not justifiable on the basis of experi-
mental data.
e. Finally, in view of arguments (c) and (d), it is concluded that a single parameter
curve of Cl( s versus F is all that can be justifiably employed. A curve that fits the data
presented by Vidal and Wittliff" is
10g 10[(1)/4s] - 3[cos -1] .(36)
This relation is compared with the aforementioned experimental results in Fig. 5. It is een
that the empirical equation agrees quite woll with the experimental data for the forward
31
portion of the fuel rod and is in fair agreement on the back side where the heat transfer is
quite small compared to ql.
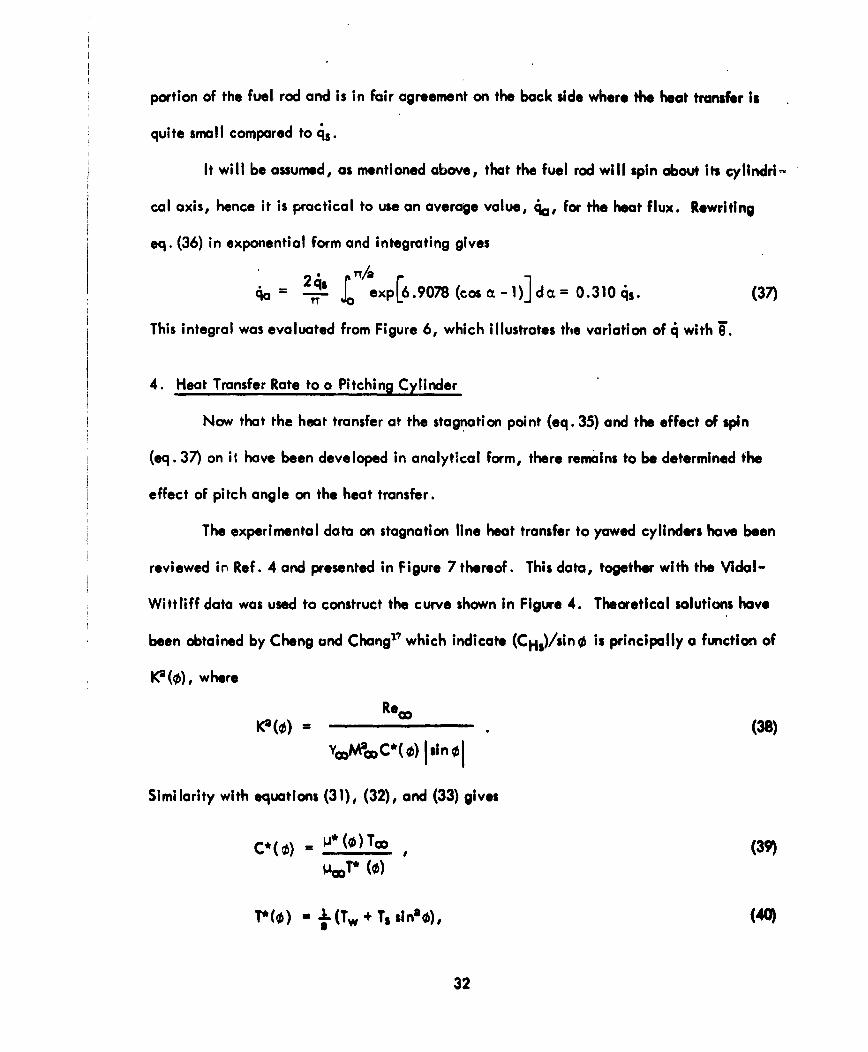
It will be assumed, as mentioned above, that the fuel rod will spin about its cylindri-
cal axis, hence it is practical to use an average value, €., for the heat flux. Rewriting
eq. (36) in exponential form and integrating gives
2s TT/ r
4a = ! o exp[6.9078 (cos a - ) d a 0.310 is. (37)
This integral was evaluated from Figure 6, which illustrates the variation of A with .
4. Heat Transfer Rate to a Pitching Cylinder
Now that the heat transfer at the stagnation point (eq. 35) and the effect of spin
(eq. 37) on it have been developed in analytical form, there remains to be determined the
effect of pitch angle on the heat transfer.
The experimental data on stagnation line heat transfer to yawed cylinders have been
reviewed in Ref. 4 and presented in Figure 7 thereof. This data, together with the Vidal-
Wittliff data was used to construct the curve shown in Figure 4. Theoretical solutions have
been obtained by Cheng and Chang '1 which indicate (CHs)/sino is principally a function of
K2(o), where
Reco(0) = . (38)
Similarity with equations (31), (32), and (33) gives
C*(O) =* (0) Too (39)110T* (o)
T(o) " +(Tw + Ts sin" ), (40)
32

1 .0
.8
" - -0 .3 10
g( 0)qs
.4
.2
0 .. .0 .40 80 120 160
8 Degrees
Figure 6. Variation of heat flux with ,
23

and p*(O) is to be evaluated at the reference temperature, T*(O). The sin' 0 term arises from
viscous shock wave theory,) In terms of more conventional parameters, eq. (38) may be
written as
pcDVmd [Tw+Tssin'o
4( y 4Mp*(O)IT. Isin 01 for 0.1 -- KO (¢) g 100. (41)
The absolute value is used on the sin in order that 0 may vary from 0 to 2rr. The limits
(0.1 to 100) for the range of K'(0) are in good agreement with the experimental data of Vidal
and Wittliff. The curve must be extrapolated beyond the upper limit to Ka(0) = 100.
Although Cheng and Chang found that CH./sino is weakly dependent upon 0, both
theory and the experimentai results of Vidal and Wittliff indicate that it is small enough to be
neglected. This is referred to as the "yaw - independence principle." In view of this principle,
eq. (35) still holds when K2 ( 0) and C HS/sin 0 are substituted for C Hs and Ka, that is
1og16(CHS/sin 0) =-.337 - .4063 log,, K(0)- .1235[lioglo Ka(O)T+ .04283[,ogio KO(o)]1
for 0.1 e K2(o) .. 100K'3 (o). (42)
For values of K(0) >100, the following equation should be used.
Iog1 (CHS/sin 0) = -0.5 log KO(o) - 0.30. (43)
This equation is illustrated by the section of the curve in Figure 4 that lies between K'(0) =
100and 1000. For K(0)<0.1, the value of CH. calculated at K3(O)= 0.1 by eq. (42)
should be used, i.e.,
CHs(K , 0) = CHs(0.1, 0). (44)
Equation (44) is not needed for altitudes below 300,000 ft.
34

5. Heat Transfer to Afterbody
For values of K2(0) greater than some value *9*(0), CHs is equal to the afterbo4
heat transfer coefficient (neglecting ends of cylinder) of the cylinder In the end-on flow
position. (The heat transfer to the ends of the cylinder will be treated in the following sec-
tion.) This is a little more involved and requires some detailed discussion. Based on Blasius
incompressible flow skin friction, modified for application to comrwesble flow by evaluating
pp at the reference enthalpy of Eckert." together with Colburn's version of the Reynold's
analogy,20
St = Pr_ / ,
ob = CH PeVe(hr hw). (45)
Here 61a b = heat flux to afterbody,
p = viscosity of air,
Pr = Prndtl number = 4y9Y - 5),
Cf = local skin friction coefficient (Cf = mean value of Cf), and
hr = recovery enthalpy (defined below).
The value of CH is given by Hayes and Probstein as
0.664 - / *p(46CHob =JR)
The asterisk refers to quantities evaluated at the reference enthalpy, the subscript e refers to
local values at the outer edge of the boundary layer, and
(Re), = Oee'• (47)
The reference enthalpy of Eckert is used, i.e.,
35

h*= (h 4 hw) + 0. 2 2 (hr-he), (48)
and
hr = he +(h s -h e ), ' (49)
Cohen"0 gives the value of (pp)*/( p )e as
(_ I1 - 1.0213[1 - (h./h') ' a'z ' V9] (50)
1 - 1.0213[1 -
The value of h' is 272,234 Btu/slug (8465 Btu/Ib).
Now the values of P*, Ve, pe, and he (local flow on the afterbody) must be found.
This can be accomplished as follows: For present purposes, perfect gas theory will be used,2'
and the pressure, Ps, behind the shock wave (edge of boundary layer in front of stagnation
point) will be calculated from the Rayleigh-Pitot tube formula, which gives
Ps [6 ]7 [ (51)P[,
The value of P, the local Pitot pressure at the outer edge of the boundary layer, can be deter-
mined from the graph presented by Chernyi ,2 which Is based on hypersonic flow. An analytical
fit to this graph is
C = K'(y) ,d/xe)C D (52)
Here x. is the distance along the surface of the cylinder from the stagnation point. The quantity
K'(y) = 0.095 for y = 1.4; 0.080 for y 1 .2; and =0.066for y- 11.. Areasonrbleap-
proximation is to take d/x - .2 (the average value), y - 1 .2, and CD = 1.84 (see ref. 43),
36
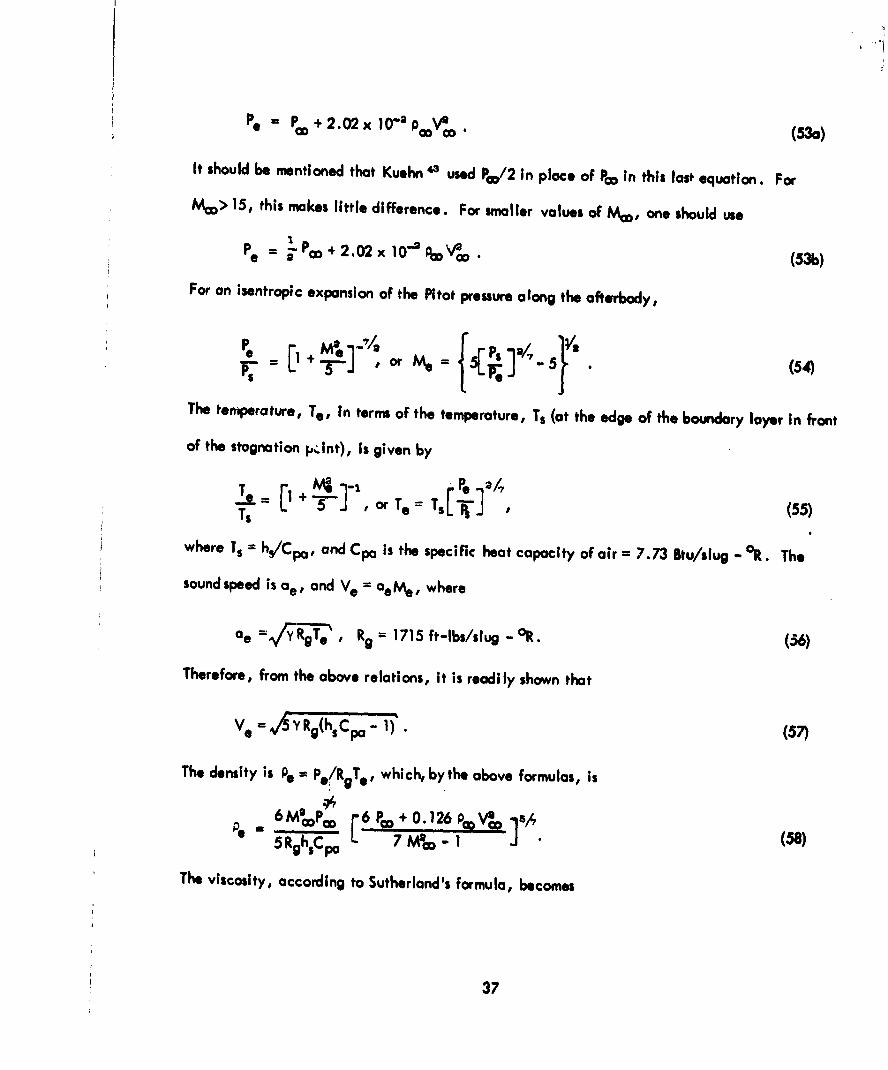
P. - P, 02.02xi0" v . (53a)
It should be mentioned that Kuehn ' used PW/2 in place of Pa, In this last equation. For
MAo> 15, this makes little difference. For smaller values of M,, one should use
ep Po + 2.02 x 10⁻² PaW V~c (53b)For an isentropic expansion of the Pitot pressure along the afterbody,
1 3 T- or Ms 1 '. -5 (54)
The temperature, Te, in terms of the temperature, Ts (at the edge of the boundary layer in front
of the stagnation ,Jnt), Is given by
T = 5[ + ,orTe=Ts ] (55)Ts 5 orT.)
where T. = h/Cpa, and Cpa is the specific heat capacity of air = 7.73 Btu/slug - OR. The
sound speed is a., and Ve = aeM, where
ae =,V'7R.T, RO = 1715 ft-lbs/slug - OR. (36)
Therefore, from the above relations, it is readily shown that
Ve = Y Rg(hsCpa - 1). (57)
The density is Pe = Pe/RgTe , which, bythe above formulas, is6M Pa, 6P m + ' 2
=6 M2oPO P4o o (58)
The viscosity, according to Sutherland's formula, becomes
37

- 2.27 x10⁻⁸ [""- A][L. L .(59)5hC [Po +.021 PWV]/7r7M. - 15+ 198.6
Here, the values of C and S* have been taken from Reference 21 (see eq. 33). The value of
he is taken as he = TeCpa, that is
he: 5 h5C [Pao+ .021 pVe. ]I 6 [ 7M si" (60)
When equations (57) through (60) are substituted into (46) through (50), all of the parameters
in eq. (45) are given in terms involving conditions in front of the shock wave and at the stag-
nation point enthalpy. This latter quantity is simply
h .0- CpaT, . (61)
Note, now, that CHab must be used in place of the value of CHs, as calculated from eq. (33),
when the latter becomes small. That is, use CHob when
CHab L-' 0.310 CHs . (62)
6. Heat Transfer to Ends of Cylinder
The heat transfer rate to the end face of a cylinder in end-on flow Is nearly constant
according to Kemp, Rose, and Detra (see Fig. 5 of Ref. 23). According to Detra and Hidalgo, 3 '
the heating rate is
end o ((4/2)/ [1 aV 0 [ [(e nd-on flow). (63)
Here (du/dx)s - stagnation point velocity gradient,
Cn - Newtonian value of C, and
hwx0o a wall gas enthalpy at Tw = 3000 K (5400R), hence, hw30o - CpaT a 7.73x 540*
4175 Stu/slug.
38
This equation is accurate to within 10% for 6000A V04 26,000 ft/sec and for 8 x 10"4i
=- 1.
2 7P--~ 2 (64)I42 s Go_ (4
For large values of M, Probstein" shows that the correct value of C Is
C V00 Z I 7(65)y+1"
Hence,
C =0.60 11 (66)Cn
Since the heat transfer rate is expected to be proportional to P., and the pressure distribution
on the end of the cylinder varies as cosO 0 (see Weinstein'2 for experimental verification),
the heating rate becomes, upon substitution of eqs. (64), (65), and (66) Into (63),
4(0 ) = 6. 70 x10 10-6 PCV3 i[ -h IE( 1)Y34Coe2 0. (67)
The appropriate values of y have been tabulated by Wittliff and Curtis;2e however, y - 1 .2
would not lead to gross error in the high heating part of the re-entry trajectory.
Summarizing, the values of CH to be used in equations (8), (9), and (11) are:
a.- 0. 1 6- K2 (0)& I OD<W'.
Take the sum of the value obtained by using eq. (42) (multiplied by 0.310)
and the value 4end(o)/PcVCO(hs -hw), where 4knd(O) Is calculated from
eq. (67).
b. K2(0)<O.1.
Take the value obtained when KO(O) = 0. 1 is substituted Into eq. (42), multi-
ply by 0.310, add the value of ,end(0)/pOV(hs - K.) obtained from eq.(67).
39
C. 10 (0)2 100 and CHab< 0. 3 10CH$.
Multiply the value of CHs obtained from eq. (43) by 0.310, and add it to
qend( )P V. (hs - hw)
d. CHa b k_ 0 .310 CHs.
Take the value of CHob obtained from eq. (46) and add it to
qend(0)/PD Vco (hs - hw).
D. EVALUATION OF e
The data on the emittance from Hedge, et al can be represented to within about 1%
by the equation 1 ac -0.08+ - 2 x 10 +3500T-T . (68)
E. EVALUATION OF Hch, lch , AND - ch
In this category, there are three major considerations, that of the heat input due to
the oxidation and/or nitridation of the fuel rod material, the rate of weight accretion due to
these reactions, and the heat input (or loss) due to the dehydriding and combustion of hydrogen
contained in the fuel element material. The available data have been analyzed in Appendix II.
I. Evaluation of 7t ch
The data10 on the oxidation and/or nitridation of the fuel element material shows that
the weight gain rate during oxidation follows the parabolic law, except during dehydriding,
within the accuracy of the experiments. (See Appendix II for a detailed analysis of the avail-
able data.) That is,
(A kst (69)
40

where Am. is the weight gain per unit area in a time t, and ks is a temperature dependent
parameter (reaction constant) which obeys the Arrhenius relation
ks - Ase " T (70)
The oxidation data of reference 10, after correcting for sample shape and size, are plotted
in Figure 7. The straight line represents the parabolic curve, and the points represent the
experimental data. The values of As and Qs were determined by plotting log k versus 1/T as
shown in Figure 8. This figure shows that the pre-factor, As, and the activation energy, Q.
(actually RgQs), change at the phase change of the fuel material, i.e., at about 20400R.
For t in minutes and Ams in grams per square centimeter, the numerical values of A. and Q.
are
As = 0.356 gn/cm4-min, and Q. = 2.59 x 10⁴°R for T 2040R, (71a)
As = 92.5 grn/cm4 - min, and Qs =3.79 x 10°R for T it 20400R. (71b)
To convert A ms to pounds per sq. ft., one first divides As by sixty to obtain grams"/
cm -stc and then multiplies by 2.04 to convert to lbs/ft4 - sec. Thus, eq. (69) becomes
Ams = 3.4x 10" (kst)' / lbs/ft', for t in seconds. (72)
Differentiation of eq. (72) gives the rate of weight gain due to the parabolic oxidation and/or
nitridatlon accretion, as
d(a ms) 1-tc =1.7x 10"*(/t)1 . (73)
This expression is to be multiplied by the surface area and then substituted into the re-entry
equations for the accretion component of dW/dt, i .e., equations (2), (7), and (12a).
41

Data points from ARF Report, Ref. 10.5 for100% air.
-curves drown with calculated valuesof parabolic rate constants.
Breakaway~ oxidation
.05
001
E .0 051
301R
E
.001
.0005 19O
00 01 1 1 1 i.. 1 1a a I i .A I I A
1 5 10 50 100 500t (ninutes)
Figure 7. Effect of temperature on the oxidation of zirconium-uranium hydride in 100% air.
42

3000°R 2000OR 1500OR 1300OR
10-
10- NN
-Phase Change
10-6
OE
C
2
• 10"
2 3 4 5 6 7 8
1- x 10 (T in degrees Rankine)
Figure 8. Variation with temperature of reaction rate constant for oxidation of zirconium-uranlum hydride.
43
2. Evaluation of Hch
For the reaction Zr + 20 -~ZrO, the heat energy released Is, according to
Wicks and Black,' for T in degrees Kelvin, given by the following equations.
HZrc. 262,960 -2.65T + 1.6 x i0'-4 -2.09 x I f1 ccl/mole of Zr0
for 2980K 11 T 1&If135 0K. (74)
HZrO2= 264,360 -2.21 T -4 x10⁻⁴ T*-2.96x I1PTT', 1,135K -T -61,4780K. (75)
HZr%= 262,400 -3.37T+ 5.0x10'-'T+4.0x10 4T-1, 1, 478OK eT 42, 10OOK. (76)
Wicks and Block also give the following relations for the heat released in the reaction
Zr+N -4 ZrN.
HZrN = 87,870-O0.94T -2.5 x10'T* -8.5 x10⁴T-1 1 2980 K-eT -11350 K. (77)
HZrN = 89,110 -0.40T -5.8 x 10⁻⁴T 2 I.72x)CPT-', 1, 13e 0K t--T 41700K. (78)
These values are in calories per mole, with T in 0 K. The equivalent increase in weight due to
the formation of a mole of ZrO, over that due to the formation of a mote of ZrN is 32/14=
2.28. When this last expression is multiplied by 2.28, the result is
2 .2 8 HZrN = 203, 000 -0.915 T - 1.33 x10' T - 3.93 x I10T'
These relations show that the heat energy Input to the fuel rod per unit weight gain is not
t markedly different for the formation of ZrOs and ZrN. Further, the heat of formation of
U0, is almost identical with that of ZrO9. Therefore, it makes little difference which re-
action is responsible for the weigl~t gain insofar as Hch is concerned. The ratio of the heat
energies released per unit weight gain by the fuel element, that is, (HZro/ 2 .2S HZrN) for
T =300, 600, 900, 1200, 1500, andl17000 K, am, respectively, 1.32, 1.32, 1.32, 1.31,

1 .31, and 1 .31. Further, chemical analysis on samples of fuel element material (see
Appendices I and II show that, at most, a few percent of the weight gain can be attributed
to ZrN. Thus, the use of on!, the heats of reaction of ZrO3 will result in errors of less than
a percent or so. That is, if all of the reactions are considered to lead to the formation of
ZrOl, the error would be less than about 1%.
3. Determination of Hch
The value of Hch is determined by eq. (12a), together with the values of Hchi Mr,
and Mch. That is,
S ch dW7 Ich g(M. - Mch) dt "ch" (79)
The value of Mr is simply the molecular mass in slugs of Zr, i.e., 91.22/454 x 32.2 = 6x 10⁷.
slugs/mole, while the appropriate value of Mch is MZrQ. , or 123.33/454 x 32.2 = 8.45 x l0
slugs/mole. The value of dt J is given by eq. (73), and Hch is given by eqs. (74), (75), anda ch
(76).
F. DETERMINATION OF G(Tw)
This parameter, which constitutes the rate of loss of hydrogen from the fuel element,
represents one of the weakest theoretical links in the re-entry model in that the data available
were insufficient to evaluate the parameters in G(Tw) with any high degree of confidence.
An insight into the magnitude of the effects due to transpiration cooling can be gained as fol-
lows. If all of t&,. hydrogen is presumed to transpire during the peak heating portion of the re-
entry trajectory, then the calculated net heat input to the rod would be less than that in the
actual re-entry case, whereas, if one presumes that no hydrogen is released during the re-entry,
45

the calculated net heat Input to the rod 'would he greater than that in an actual re-entry case.
An elementary calculation, based on eq. (9) and the dynamic heating curves for a fuel element
presented In the North American Aviation Corporation's report (ref. 33) shows that these two
bounJs differ markedly. That is, If the entire hydrogen content of the fuel element were to
transpire during the peak heating portion of the re-entry trajectory, the maximum temperature
of the fuel element would be about 3000PR, whereas, without hydrogen transpiration, the fuel
element is expected to reach its melting temperature (calculations based on re-entry from
300,000 feet, 1000R initial fuel rod temperature, re-entry angle of -0.25 degrees, and a
re-entry velocity of 24,200 ft/sec). Now that the possible magnitude of this effect has been
put in proper perspective, the mathematical representation for the rate of hydrogen loss will
be presented.
The process of hydrogen loss is considered to be the following one: The hydrogen is
released from the fuel material in accordance with a linear rate constant X which depends
upon the temperature of the material. The amount of hydrogen released per unit area of fuel
element surface in a time t is
MHr = MHo[1-e " 'Xt] (80)
where MHo is the Initial hydrogen mass per unit area of fuel element material. (See Appendix II
for a complete formulation of this problem.) The ARF data provides a means whereby X can be
evaluated. These data show that
M 1.1x 10-T -1 .92, for T > 1900°R, and t In minutes. (81)
The value of X Is taken as zero for T -1900PR. In the meantime, an oxide (and/or nitride)
layer has been building up on the surface of the rod, and the hydrogen must diffuse through this
46

layer in order to escape. This gives rise to a build-up of released hydrogen concentratim,
MHr - AmH(t), within the boundaries of the oxide layer. Here, AmH(t) Is the mass of the
hydrogen (per unit area of surface) that has escaped through the surface. Since the concen-
tration of hydrogen outs;de of the oxide loyer can be considered as being essentially zero, the
rate of hydrogen diffusion through the oxide layer is expected to be (for a diffusion process)
proportional to [MHr - A mH(t)]/A ms. Substituting the right-hand side of eq. (80) for MHr into
this expression gives
dW _ dr fAm H (t) { - "eHO' t grams- -'= tAmtl -a ()/--G(Tw)cmf7.l 8a
-9T X JLAm H (01 (ks t) 1/2 m, n O (82a)
where a is the constant of proportionality, or what might be termed the diffusion constant.
Here ks 's taken from eq. (70), using the values of As and Qs given in eq. (71). To convert
eq. (82a) into units suitable for use in eq. (12b), it must be multiplied by 1.06 x 10⁻³ to con-
vert to slugs/ft2 --sec and by the area of the fuel element to obtain G(Tw) in slugs/sec, i.e.
G(Tw) = 1.06 x 10⁻³ S-d [6 mH(t)] . (82b)
Equation (82a) must be integrated to obtain AmH(t). This integration gives (see Appendix II)
A mH(t)- p (2o exp (
2a
7" ['1 + exp (-202 AXks)]
+ 2(t/ 4a/X k,/3)[+exp(-2a/Xks)]Cxp(-Xt+2av47-')
+ .2/ exp(-a/ks) lerf(' + a//X' ) -erf(a//'k )J . (83)
47

The va!ue of a must be determined from experimental date. Using sample fuel element speci-
mens (provided by ARF and SRI) that had been exposed to oxidation and simulated re-entry
tests, values of AmH(t) were determined by chemical analysis (See Appendix I). With the re-
ported values of MHo and these measured values, eq. (83) was used to determine a. Because
t was very large for the oxidation data that were available, '%mH was nearly equti to/MHo.
Thus, the scatter in the data on MHo casts considerable doubt on the values of a so determined.
The value of a. based upon this limited data, was estimated to be
a = 0. 10 e- 1 .84 x 10 /T grams/cm2 - min. (84)
Although this expression may not be very accurate in general, the effects involved are so impor-
tant that it should be used until more accurate data are available. It would not be difficult to
determine an accurate value of a by resorting to experimental methods, e.g., weight gain
measurements in an oxidizing atmosphere.
The value of MHo is determined by dividing the fuel element area by the mass of the
total hydrogen contained in the fuel element.
G. DETERMINATION OF Hf, Hv, Twf, Fc, Fv, HdeG, AND Hc, deG
1. Heat of Fusion, Hf, and Heat of Hydration, HdG
These quantities can be taken directly from the report by Elliott.a According to this
report, the fuel element material melts at 3825OR, and the heat of fusion is
Hf = 90Btu/Ib = 2.9 x 10CBtu/slug. (85)
Also, the report gives the hydrogen release energy as
HdeG = -61018tu/lb of Zr'U'H = 1.13 x 10eBtu/slug. (86)
48

2. Heat of Vaporization, Hy and Twf
Although there is some question as to where the data originated, the heat of vaparl-
zation, according to a NAAI report, is
Hv = 180 Btu/Ib = 5.8 x 10P Btu/slug. (87)
This report implies that the vaporization takes place at a temperature of 44600R, hence, the
appropriate value of Twf would be
Twf = 4460°F. (88)
A calculation would then have to be made to see if, in accordance with eq. (11), the fuel
element temperature would remain constant. If it would, then the fraction of the muterial
that is vaporized is
Fv = 1. (89)
If, under these conditions, the fuel element temperature drops, as determined by eq. (11),
then the vapor pressure of the melted material will have to be known unless it can be shown
that the fuel element breaks up at a temperature that is less than Twf. All presently known
data indicate that the fuel element material will remain intact until the metal at the oxide
layer-metal interface melts. For this reason, the thermal expansion of the fuel element mate-
rial has not been considered in the foregoing treatment.
It can readily be shown from kinetic theory that the particle flux, leaving a surface
whose vapor pressure is Pv In millimeters of Hg, is given by the relation
Flux = .119Pv[ eG] ' Ibs/ft-ec (90)• 9Tw
where Md.G is the gram molecular weight of the evaporating material, in the case of zirconium,
49

91.22. Equation (90) can be multiplied by S and divided by g and then substituted Into
the left-hand side of eq. (11) or (13), as appropriate, to keep track of the transpiration
cooling effect on dTw/dt and hence on Tw . That is,
1 dW =0.119s [A0a . soc. (9 b)
Equation (90) can also be employed to show that there will be no dearth of oxygen
present in the boundary layer for oxidation purposes during re-entry simply by setting
Md.G = 32, the molecular mass of oxygen, and using the local boundary layer pressure for
Pv. Such a calculation shows that the flux available (at altitudes below 300,000 ft) is cer-
tainly much greater than can be used in the oxidizing process.
3. Heat of Combustion or Recombination, Hc, deG, and Fc
There is a possibility that the evolved hydrogen atoms will recombine and then bum
with the oxygen in the boundary layer. If the hydrogen recombines, the energy release is
approximately 3 x 10 Btu/slug (- 104 k cal/mole of H9 ). This number is to be used as
Hc, deG for the hydrogen recombination. If the hydrogen, after recombination, reacts with
the oxygen in the boundary layer, the net energy release will be approximately 3.5 x U0P
Btu/slug of of He (120 k cal/mole of Hg). Since the activation energy for the formation of
H9 from H atoms is zero, it follows that the net heat energy release would be the sum of
these last two energies (i.e., approx. 6.5 x 10⁶ Btu/slug of hydrogen used) if the, reaction
went straight through to form water without the hydrogen recombination step.
In view of the facts that the burning rate of hydrogen in oxygen is less than Mach 1,
the boundary layer is very thin, and the activation energy for H90 production is 104 k cal/
mole of HSO, it is reasonable to assume that the hydrogen will diffuse well into the boundary
50

layer before any appreciable portion of it goes into the production of water. Thus, the
addition of the combustion energy of hydrogen to the total energy content of the boundary
layer is expected to make only a small contribution to this total energy content. Cons-
quently, it seems reasonable to assume that Fc can be considered to be very small for the
combustion of H2 and that the Hacombustion will make a negligible contribution to the total
heat flux into the fuel rod during re-entry.
The case for neglecting the effects due to the heat of recombination of hydrogen during
the re-entry of the fuel element is not nearly so clear cut as is the case for neglecting the
combustion of the hydrogen. None of the data available to the authors provides information
from which Fc for hydrogen recombination can be estimated. In view of the fact that the re-
combination energy of the total quantity of hyd;ogen contained in the fuel element is about
5, 500 Btu's (based on the formula ZrH,.,,- U.01, 3 2), it is almost as large as the total aero-
dynamic heat energy available to the fuel rod during re-entry. The latter quantity is only
some 6,006 Btu's
There is the possibility that some of the evolved hydrogen would combie at grain
boundaries or in cracks within the fuel element, and some of it might combine beneath the
oxide layer. Again, some of it might be evolved before the stainless steel cladding on the
fuel element has burned off and, thus, recombine between the fuel material and the cladding.
However, this latter possibility seems remote because the stainless steel cladding is insulated
from the fuel material by a ceramic which is a poor heat conductor.
It is clear from the foregoing discussion that additional research is required before an
understanding of what happens to the hydrogen in the fuel element can be realized.
51
IV. SUMMARY STATEMENT
Although the effect of the fuel element cladding has not been considered here, it is
obvious that the same treatment is applicable. The treatment of this part of the problem that
was presented by NAAI' should not prove grossly in error when used with the foregoing re-entry
heating equations.
If the effects due to the recombination and combustion of the hydrogen c.ontent of the
fuel element can be neglected (it seems likely that the effects due to combustion, at least, can),
then bounds of the upper temperature that the fuel element will attain during re-entry can be
calculated with a high degree of confidence for the following three cases: 1) no transpiration
cooling; 2) all hydrogen transpires at the phase change temperature (approx. 2040°R); 3) all
hydrogen transpires during the peak heating portion of the re-entry trajectory.
In the case where no hydrogen transpires, a hand calculation, using the NAAI' data,
indicates that the entire fuel element will be melted by re-entry heating. If the hydrogen is all
evolved at a fuel rod temperature of 2040°R (phase change temperature), the estimated peak
tempercture of the fuel element is, based on hand calculations, approximately 40000 R. If it
all evolves during the peak heating portion of the re-entry trajectory (starting at about 28000R),
hand calculations indicate that the peak temperature of tke rod will be approximately 30000R.
The incident hqat flux used in these calculations was taken from curves presented in ref. 33 for
re-entry from an altitude of 300,000 feet at 24,200 ft/sec and an initial trajectory angle of
-0.25 degrees. The continuous transpiration theory derived in the foregoing analysis does not
lend itself readily to a hand calculation and was not attempted by the authors.
Exclusive of the behavior of evolved hydrogen, the values of the various parameters In
the re-entry equations, as given above, are quite good. Although one hesitates to place
52
accuracy limits on the entire mathematical model, it seems unlikely that the cumulative error
resulting from errors in the values of the parameters given above would exceed 10% for tem-
peratures up to the melting point of the fuel material.
The hydrogen transpiration data presented above is quite susceptible to error because
of the poor quality of the initial data that was available to GTC. This is not meunt to reflect
poor quality work on the part of other researchers who produced this initial data, because the
experiments and tasks they performed on the sample materials supplied to GTC for analysis were
not designed to produce the type of data that GTC's analysis showed to be required.
At the present time, the.e is no data available, to the authors' knowledge, from which
infcrmation on the magnitudes of possible effects due to hydrogen recombination can be deduced.
Also, the vapor pressure data on the zirconium-uranium alloy could not be uncovered. Thus,
the value of the parameters Fc and Fv are undetermined at this time.
It should be borne in mi-d that the chemical reactions deduced in this study will not
necessarily obey the same laws once the metal becomes molten under the oxide layer. At this
point, the metal cations may diffuse to the surface while the oxide is diffusing to the molten
material. As has been shown by Littman, the oxide forms a solution with the metal when the
metal is in a molten state.' 4 If there is no cation diffusion through the oxide, then the con-
tinued oxidation of the molten metal would surely disrupt the oxide surface layer because the
density ratio" of Zr to ZrOg is approximately 2. If the oxide layer is thus broken off, the
portion of the rod material that is in a molten state will blow off in drop or droplet form, in
which case the theory of Opik'5 determines the maximum size of the particles. The portion of
the rod that is in a molten state at any time can be calculated from the system of re-entry
equations derived above and eq. (14). Whether or not further droplets will be released after
this initial release, should such an Initial release occur, will depend on the vapor pressure,
53

the surface tension, the viscosity, etc. of the molten material. It seems likely that the zir-
conium does diffuse to the surface to relieve the internal pressure bul It up by the absorbed
oxide, because Uttman found th,-3t when cubes of the fuel element material have an oxide layer
on their surface, they retain their sOape when inductively heated even though the metal inside
is in a molten state. If this is the case, then the fuel element will re-enter intact unless break-
away oxidation or angular acceleration forces due to tumbling and spinning cause the oxide
layer to break off. Although this report shows the point of breakaway oxidation for anion diffu-
sion, this value is not expected to be valid when both anion and cation diffusion take place
simultaneously. The accelerating forces can be calculated from the foregoing equations of
angular motion. Should it turn out that the material below the oxide layer becomes molten,
that the oxide layer is thin, and that the angular acceleration forces are large, the oxide layer
could be broken to expose the molten surface to viscous drag shearing forces which will produce
molten drops. All this will remain speculative until the actual calculations are performed.
54

V. REMAINING RESEARCH TO BE ACCOMPLISHED
At this point in the entire SNAP fuel element re-entry program, it is quite clear
what remains to be done to ascertain whether or not the fuel elements will burn up during
re-entry, This could be accomplished in steps as follows:
First, the research necessary to determine Fc and Fv, together with a better value of
a would be carried out. Then, using the foregoing analytical, mathematical model, a machine
colculation would be performed to determine if any substantial portion of the fuel element will
reach the melting point. If it wiIl not, then the fuel element will not burn up during re-entry.
It is apparent that the upper bound heat input case (transpiration cooling plus hydrogen recom-
bination) should be employed in the first calculation. Thus, if this calculation were to show
that the fuel element would burn up, there is strong evidence that it could be made to burn up
dJing ,e-entry.
The F nal stop would be to try to find out hov much of the fuel element would be ablated
away, Th's would require a detailed knowledge of the amount of material that blows off in
droplet form and from which part of the fuel rod this material is released so that the aerodynamic
parameter changes could be accounted for. This assumes that Fv * I. Should research show that
Fv 1, then the foregoing calculation would be conclusive. In this latter case, a good approxi-
mation to the degree of burn-up could be obtained by assuming that the material evaporates uni-
formly from the surface of the rod and by using the same set of equations given above with
dimnishing diameter. The result of this calculation would be the minimum size of the fuel rod
that could survive the re-entry. If this is zero, then there is little to worry about from a safety
point of v;ew. It it is not zero, then the degree of hazard associated with the remaining material
could be specified by safety personnel.
55

APPENDIX I
CHEMICAL ANALYSIS
This appendix contains a general discussion of the behavior of zirconium and
zirconium-uranium alloys in various gases. The chemical analyses and results obtained
by GTC are also presented. A description of the samples of fuel element materials which
GTC received during the contract is presented in tabular form.
A. REVIEW OF PREVIOUS STUDIES ON OXIDATION OF ZIRCONIUM AND THE EFFECTSOF 0., N2, Ho ON ZIRCONIUM
Since preliminary X-ray data indicated that, on the oxidation specimens provided to
GTC by the Armour Research Foundation, only ZrO2 was present in the outer layer of the
specimen, the decision was made to survey previous investigations on the kinetics of the oxi-
daot-n ot zirconium.
The reaction of zirconium with oxygen at various temperatures has been studied by
several investigators. A comparison of the results shows discrepancies concerning the order
of the rate low (cubic, parabolic, or linear) which best fits the oxidation curves. Hayes and
Roberson34 undertook a qualitative study of this subject by heating panels of Zr in various
gases. They found that above 800°C, oxygen diffuses into the grain structure of the metal
when heated in an oxygen atmosphere at I atm pressure. It appears probable that the oxygen
penetration into the grain boundaries takes place at 862°C, when the close-packed hexagonal
alpha phase transforms to the body centered cubic beta form. The two percent volume change
and phase transformation certainly provides the opportunity for intergrunular oxygen diffusion.
They also found that heating to 9000C in moist air (percentage of water vapor not given) pro-
duced a 15 to 18 percent volume Increase of the specimen, which they attributed to the oxide
56
formation. However, heating in dry air or oxygen showed no perceptible change in size.
Also, heating to temperatures above 10000C in nitrogen produced a nitride film, and nitro-
gen diffused into the metal, but the nitride film formed was permeable to oxygen at 1000°C.
Hayes and Roberson came to the conclusion, that when heated in air, Zr undergoes
simultaneous attack by both oxygen and nitrogen. The nitride was found to be unstable in the
presence of oxygen, and decomposed to a voluminous oxide.
Gulbransen and Andrew3' studied the reaction on zirconium foil specimens between
2000C and 425 0C. They reported that a modified parabolic rate law fits the data. The tem-
perature dependence of the oxidation rate as a function of film th;,Ckness showed a constant
relationship. This fact suggests that one mechanism is controlling the rate over a wide thick-
ness range.
In another study, Gulbransen and Andrew " found that between 4000 and 8000C, thp
method of surface preparation influenced the reaction kinetics. Mechanically polished foils
obeyed the cubic rate law and reacted faster than chemically polished foils, which obeyed
the parabolic rate law.
A later study by Charles, Barnartt, and Gulbransen,"on the prolonged oxidation of
zirconium foils up to times of 500 hours and temperatures of 3500 to 4500C, confirmed the
cubic rote law for mechanically polished specimens. However, there is sufficient reason to
suspect that the size and shape of the zirconium samples may influence the reaction kinetics.
Belle and Mallett"' studied the oxidation reaction on machined cylindrical specimens 4cm
long by 0.7cm, and 5 cm long by 1 .4cm. They found that a cubic rate law fit the data
taken from 5750C to 9500C at one atmosphere of pure oxygen, while on foil specimens In
approximately the same temperature range, several other Investigators observed a parabolic
rate low fit.
57

There Is also evidence that the particular rate law which the reaction follows de-
pends on the temperature range. In a recent study by Kofstad,"' zirconium was oxidized
under conditions of linearly increasing temperature. It was shown that between 6500 and
9500C, the cubic rate law was obeyed, and between 9500 and 1100OC, the parabolic rate
law fit the data. This is in close agreement with the analysis cf the ARF data presented in
the text of this report.
Some investigation has also been done on the effect of pressure on the oxidation of
zirconium. Gulbransen and Andrew, among others, came to the conclusion that pressure has
little or no effect on the reaction of zirconium with oxygen.
The reaction of zirconium with nitrogen has been shown to proceed at a much slower
rate than has been found for the reaction with oxygen. Several studies have been made (see
references 34 and 35), and most investigators agree that the parabolic rate law is consistent
with the data at the higher temperatures. The product of the reaction in nitrogen at all tem-
peratures has been identified as ZrN. Gulbransen and Andrew " noticed that small amounts
of oxygen in the nitrogen noticeably accelerate the rate of the reaction. Drounieks"' found
that at temperatures from 8620 to 10439C, the nitrogen diffuses Into the metal as well as pre-
cipitates a nitride film on the surface.
Some work has also been done on the reaction of zirconium and zirconium alloys with
air. In general, the reaction rate is more rapid in air than in either oxygen or nitrogen alone.
In this case, tho solubilities of oxygen and nitrogen in the metal wili form solid solutions of
the gases in the metal phase as well as phase formation of ZrOC and ZrN. According to
Gulbransen, for the zirconium oxygen reaction, the overall rate of oxygen abiorption still
remains parabolic, if the rates of both the penetration of the gas into the metal and the growth
58

of the oxide layer are diffusion controlled, and the 4;ffusion constants remain constant.
The some type of reasoning can be applied to the nitrogen reactions.
Gulbransen and Andrew' also studied the rate of hydrogen diffusion into zirconium
at 300°C. They found that at constant tenperature the reaction rate could be expressed as
dW
where p is the pressure of the hydrogen atmosphere and A is a constant. According to theory,
this rate-pressure relation is an indication of activated diTtusion with dissociation. Therefore,
the correlation shows that the diffusion of hydrogen into zirconium is mainly by atoms of hydro-
gen. Additional information on the disociation rates of hydrogen can be derived from the data
presented by Atkins ..4 These data show that the equilibrium concentration of hydrogen in
Zr:H U is very nearly independent of the external hydrogen pressure, varying from the one-
eighth to the one-fourteenth power of the pressure.
The crystal structure of ZrOs has been studied by several investigators. Zirconium
dioxide has been shown to exist in three crystalline modifications - monoclinic, cubic, and
tetragonal .' The monoclinic form which has been found by most investigators is a close0
packed arrangement with oxygen spacings of 2.6 to 2.7 A. A consideration of the ionic radii
of Zr+4 , 0.90 A, and 0 " , 1 .36A, shows that the oxygen ions could occupy interstitial
positions in the ZrOi lattice. Thus, the oxidation rate is expected to be controlled by the
rPate of diffusion through the oxide layer.
B. RESULTS OF CHEMICAL AND PHYSICAL ANALYSES
The problem was approached by using various techniques of chemical and physical
analysis to obtain data from certain selected ablation and oxidation samples, for the purpose
59

of formalizing and substantiating a burn-up model of the zirconlum-uranium-hydride fuel
element.
The samples were provided to GTC by Air Force contractors, namely, Vidya Division
of the Itek Corporation, Astropower, Inc. # Stanford Research Institute, Battelle Memorial
Institute, and the Armour Research Foundation. As the samples were received by GTC, they
were tabulated along with the simulated conditions under which they were tested (see Table 5).
All samples which had been prepared for metallographic study were examined under a microscope
for the presence of cracks, voids, oxidation layers, disrupted grain boundaries and grain struc-
ture.
The samples to be subjected to X-ray and chemical analysis 0ere chosen on the basis
of the test conditions to which they were exposed. A selection was made of twenty samples
to be chemically analyzed, and five samples were used for X-ray analysis.
For the determination of compounds produced by the effects of ablation and oxidizing
conditions, a determination of crystal structures was made by X-ray diffraction. Although
this method is IVmited to qualitative results, the identity of the major compounds which are in-
volved in the process was establishec'.
The X-ray data were taken on a Siemens X-ray diffraction unit, using a 30 kilovolt
source with 20 ma K-ca Cu radiation. The patterns were scanned at 0.5 0 per minute from 150
to 1100 with a 2% statistical error. The peaks were checked against the 1962 NBS card data
fle for the following compounds:
1. Both mand 0 phase zirconium dioxide (ZrO)2 Uranium metal (U)3. Uranium nitride (UN)4. A Uranium metal (eU)5. Diuranium pentaoxide (Ui)6. Three phases of tri uranium octaoxide (U 06)
60

7. aL and 0 uranium dioxide (UOS)8. Uranium trioxide (UO 3 )9. Uranium-zirconium (U-Zn)
10. Zirconium nitride (ZrN)
The results of this analysis are given in Table 3.
TABLE 3
X-RAY DIFFRACTION RESULTS
Air-ArgonTest Temp. Atmosphere
GTC Nr. Material (0c) (% Air) Sample Condition Compounds Identified
26 Zr-U-H 1100 50 Powdered outer layer Zrq, possibly uraniummetal
20 Zr-U-H 800 50 Surface film Results cannot be identi-fied, possibly becauseof interference due tosubstrate layer
25 Zr-U 1100 50 Su.foce f"Im Results cannot be positivelyidentified, but ZrOMindicated
28 Zr-U-H 1100 100 Surface film ZrO9 only
32 Zr-U-H 1400 50 Powdered outer layer Very strongly ZrO2(24 peaks matched)
The chemical analysis of the samples was made by a vacuum fusion technique. This type
of analysis gives the weight percentages of oxygen, nitrogen, and hydrogen remaining in the
samples after testing under simulated ablation conditions. Because the samples are all inorganic
substances with high melting points and a quantitative measure of the combined and absorbed
gases is necessary to supply data for the reaction constants and hydrogen evolution rate, thehigh
temperature vacuum technique is about the only method by which the small amounts of samples
can be analyzed.
61
Where possible, certain samples were analyzed In two parts. One part consisted of
the surface layer, composed mainly of ZrO2 and the other part was the center core of the sam-
ple minus the surface layer. This technique provided information on the amount of oxygen and
nitrogen which had diffused into the center section of the fuel element.
The results of the vacuum fusion analysis for the twenty samples appear in Table 4.
Since S .R.I. ran samples under constantly changing conditions comparable to re-entry
trajectories, only generalizations can be made about the results. It appears that up to 30000 R,a
significant amount of hydrogen is retained by the sample. It also is apparent that the build-up
of an oxidation layer on the surface presents a definite barrier to the evolution of hydrogen,
even up to 35000 R. Furthermore, it is apparent from 1.I.T.R.I. samples that the hydrogen is
retained in i he samples up to 1 1000C regardless of the amount of oxide formation on the surface
of the sample. In most cases, at temperatures of 1100 C and upward, a large amount of oxygen
is present in the surface layer, and some of the oxygen has managed to diffuse into the center
core of the sample. Judging from the increases in the nitrogen content of some of the samples
nitrogen combination or absorption plays some role in the chemical kinetics of the ablation pro-
cess, although its role is not nearly as significant as that of oxidation reactions. Unfortunately,
no conclusions can be derived concerning the effects or probability of a hydrogen-oxygen re-
action from the data presented. In certain cases, the loss of hydrogen may be responsible for a
decrease in oxidation, while in other cases it may promote oxidation.
An Interprrtation of the analytical results in terms of specific reactions Is Jifficult be-
cause the effects are of an Integrated nature and therefore difficult to separate experimentally.
However., the data were most helpful in determining reaction rate constants, In establishing the
order of the oxidation rate law, and in determining the diffusion coefficient for the hydrogen loss.
62

TABLE 4
VACUUM FUSION ANALYSIS OF SAMPLES
Gas Analysis (Wt.%)GTC No. Material Test Temp. Atmosphere Sample Condition Oxygen Nitrogen Hydrogen
Blank (A.l. Material)
0 (blank) Zr-U-H None None Chunk .064 .019 1.64
Stanford Research Samples
51-H Zr-U-H 35000 R Air Pyramid .139 .028 .07353-H Zr-U-H 3840OR Air Pyramid .420 .169 .02056-H Zr-U 3590oR Air Half-Pyramid 2.800 .800 .00356-H Zr-U-H 3550OR Air Half-Pyramid 3.980 070 .14840-H Z, -U-H 2940OR Air Pyramid .065 .012 476
1. I. T .R. I. (Formerly Armour Research) Samples
12 Zr-U-H 5000C Ar- 10% Air 1/2 Disk .289 .017 1.07816 Zr-U-H 5000C 100% Air 1/2 Disk .386 .109 1.00018 Zr-U-H 8000C Ar - 10% Air 1/2 Disk 1.022 .067 .93021 Zr -U 8000C 100% Air Fragments .146 .002 .00522 Zr-U-H 8000C 100% Air Fragments .231 .002 1.13024(o) Zr-U-1'1 11 0°0C Ar -10%Air 1/2 Center core 1.050 .082 .00824(b) Zr-U-H 1100 C Ar -10%Air Surface layer 4.028 .508 .01427(a) Zr-U 1000C 100% Air Fragments of
center core .048 .009 .00227(b) Zr-U 1 100 0C 100% Air Surface layer .638 .613 .01428 Zr-U-H 1100°C 100% Air Fragments .613 .025 .99530(a) Zr-U-H 14000C Ar- 10%Air Core 3.160 .127 .02730(b) Zr-U-H 14000C Ar -10%Air Surface layer 11.992 2.202 .01533(0) Zr-U 14000C 100% Air Core fragments 1.350 .025 .00833(b) Zr-U 14000C 100% Air Surface layer 8.930 .006 .010
Vidya Sample
5 Zr-U-H Unknown Air Surface layer from 3.695 .354 .035exposed surfaceof cylinder
63

TABLE 5TABULATION OF SAMPLES
A. Vidya Samples
All models were one inch diameter cylinders of hydrided fuel rod material.Atmosphere; dry air.
Avg. cold Stagnation Stagnation ModelSample No. wall heat enthalpy pressure at weight Run
ratea Hst model surface change durationG. T. C. Vidya (BTU/ft -sec) (BTU/Ib) Pst (psia) (grams) (seconds)
1 538 104 6380 14.7 0.000 60
la 544b 845 3770 16.2 -64.49 59.5
2 539 605 2280 19.0 -. 350 60
3 550 868 3180 19.9 -59.40 60
4 551 163 4930 14.7 +.016 121
5 552 582 3980 16.0 +.262 62.3
6 553 93 7080 14.7 +.020 121.3
7 554 574 3810 16.0 -49.187 92
8 555 453 4680 15.5 -.062 61
9 556 876 3230 19.0 +.341 70.4
10 557 435 4630 15.5 +.228 120.2
Notes: a. Heat rate averaged over the surface of a flat face or hemispherical surfaceof a cooled copper calorimeter of the same size and geometry as the testmodel.
b. Rerun of run 538 with nitrogen as test fluid.
64

TABLE 5 (Continued)
B. Illinois Institute of Technology Research Institute Samples
In each case, the time of run was 3 hours, at I atmosphere pressure.
G.T.C. Sample Air-Argon Heat flux
No. Composition Atmosphere (%Air) or temp.(°C) Comments
11 Zr-U 10 500 Grey outside, thin layer
12 ZrH-U 10 500 1 mil thick outside layer
i3 Zr-U 50 500 Grey outside layer
14 ZrH-U 50 500 Small cracks around edges
15 Zr-U 100 500 Needle-like grain structurebut no oxide formation
16 ZrH-U 100 500 Shows distovted grain boundari*
17 Zr-U 10 800 Grey-white outside layer
18 ZrH-U 10 800 Definite oxide layer, distortedgrain boundary near edges
19 Zr-U 50 800 Grey-white outside layer
20 ZrH-U 50 800 1-1/ 2 mil thick outside Icyer,disruption of grain boundaries
21 Zr-U 100 800 Grey-white outside layer
22 ZrH-U 100 800 Random grain structure nearedges showing surface reaction
23 Zr-U 10 1100 Oxide layer 1/32 inch deep
24 ZrH-U 10 1100 Material flakes off surface
25 Zr-U 50 1100 Thin white oxide coat, greybeneath
26 ZrH-U 50 1100 Si Iver-greyoxide layer, goldflocked beneath
6

TAr.E 5 (Continued)B. Illinois Institute of Technology Research Institute Samples (Continued)
G. T. C. Sample Air-Argon Heat fluxNo. Composition Atmosphere (% Air) or temp. (°C) Comments
27 Zr-U 100 1100 White oxide layer on surface
28 ZrH-U 100 1100 Black pittedsurface, cut andpol lished on one side
29 Zr-U 10 1400 Heavy oxide coating
30 ZrH-U 10 1400 Heavy oxide coating
31 Zr-U 50 1400 Heavy oxide coating(powdery)
32 ZrH-U 50 1400 Oxidized all the way through
33 Zr-U 100 1400 Oxidized all the way through
34 ZrH-U 100 1400 Cracked and spoiling
66

TABLE 5 (Continued)C. Stanford Research Institute Samples
Air Atmosphere
Meat I- lux
Sample No. N Ws Temp. System TimeG.T.C. S. R.I. Comp. Avg. 2 Actual (OR) Pressure (sec.) Comments
Trajectory (BTU/ft -sec) (in. of Hg.)
37 a-1 alloy - - - - - Not tested
38 la- 2 alloy 110 165 2350 0.1 100 Grey-white layer,150 225 2560 0.2 100 cracked on oneo dge.265 395 2960 0.6 100365 545 3140 2.0 50215 120 2780 4.0 5045 25 2240 2.6 50
39 la-4 hydride 110 165 2290 0.1 100 Grey coating, eroded150 225 2380 0.2 100 on edges.265 395 2830 0.6 100365 545 3120 2.0 50215 120 2890 4.0 5045 25 2260 2.6 50
40 la-9 hydride 110 165 2260 0.1 100 Greycoating, eroded150 225 2350 0.2 100 on edges.265 395 2740 0.6 100365 545 2940 2.0 50215 120 2600 4.0 5045 25 2220 2.6 50
41 2a-6 alloy 365 545 3100 0.8 50 Grey-white coating,360 540 2995 1.0 50 no erosion.265 395 2650 1.9 50
100 150 2260 3.7 5010 15 2095 1.6 50
42 2a-9 hydride 365 545 2840 0.8 50 Grey coating, edges360 540 2350 1.0 50 eroded.265 395 2610 1.9 50100 150 2260 3.7 5010 15 2130 1.6 50
43 3a-1 alloy 700 900 3480 4.5 20 Grey-white surface340 510 3360 4.0 20 layer.160 240 2470 4.4 2040 60 2400 3.9 20
67

TABLE 5 (Continued)C. Stanford Research Institute Samples
Air Atmosphere (Continued)
Heat FtuxSample No. " s "s Temp. System Time
G. T.C. S. R. I. Comp. Avg. ActuaI ( Pressure (sec.) CommentsTrajectory (BTU/ft -sec) (in. of Hg.)
44 2b-1 alloy 245 360 2565 1.2 50 All white oxide450 675 3280 8.8 50 covered, ends and720 900 3515 36.8 50 edgessplit.400 600 3190 62.0 50
45 3b-1 alloy 250 375 2470 10.4 35 Greyish-white,ends400 600 3300 44.0 35 andedges splitopen.240 360 2470 50.4 35
46a a-4 alloy 45 68 2200 * 300 Sectioned and potted,90 145 2350 .04 100 shows small amount of
200 300 2710 .24 100 surface reaction.340 510 3090 1.40 100140 210 2560 2.40 100
46h a-" hydride A5 68 2190 * 300 Sectioned and potted,90 145 2280 .04 100 shows small amount of
200 300 2440 .24 100 surface reaction.340 510 2930 1.40 100140 210 2490 2.40 100
47a a-7 alloy 45 68 2330 * 300 Sectioned and potted,90 145 2090 .04 100 shows layer of surface200 300 3190 .24 100 reaction.340 510 3500 1.40 100140 210 2800 2.40 100
47h a-9 hydride 45 68 2200 * 300 Sectioned and potted,90 145 2240 .04 100 shows layer of surface
200 300 2510 .24 100 reaction.340 510 3010 1.40 100140 210 2320 2.40 100
48a la-3 alloy 110 165 2550 0.1 100 Sectioned and potted,150 225 2670 0.2 100 grain boundariesdis-205 395 2980 0.6 100 rupted near outer305 545 3120 2.0 50 surface.215 120 2750 4.0 50
45 25 2210 2.6 50*no data
68

TABLE 5 (Continued)C. Stanford Research Institute Samples
Air Atmosphere (Continued)
Heat FluxSample No. "j s Temp. System Time
G.T.C. S. R.I. Comp. Avg. Actual (OR) Pressure (sec.) CommentsTrajectory (BTU/ft -sec) (in. of Hg.)
48h la-I hydride 110 165 2330 0.1 100 Sectioned and potted,150 225 2350 0.2 100 grainboundar*esdis-205 395 2820 0.6 100 rupted near outer305 545 3120 2.0 50 surface.215 120 2890 4.0 5045 25 2260 2.6 50
49a 2a-7 alloy 365 545 2970 0.8 50 Sectioned and pcted.360 540 3010 1.0 50265 395 2670 1.9 50100 150 2240 3.7 5010 15 2095 1.6 50
49h 2a-8 hydride 365 545 2830 0.8 50 Hydride 4 cacked360 540 2850 1.0 50 along back edge.265 395 2615 1.9 50 Sectioned and potted.100 150 2260 3.7 5010 15 2132 1.6 50
50a 3a-2 alloy 700 900 3500 4.5 20 Sectioned and po'ted.340 510 3320 4.0 20160 240 2545 4.4 2040 60 2420 3.9 20
50h 3a-3 hydride 700 900 3140 4.5 20 Hydride cracked340 510 3010 4.0 20 along back edge.160 240 2400 4.4 2040 60 2310 3.9 20
51a 4a-5 alloy 480 720 3715 20.8 20 Sectioned and potted,140 210 2330 4.4 20 alloy has surface re-48 72 2110 2.4 20 action.
51h 4a-8 hydride 480 720 3500 20.8 20 Sectioned and potted,140 210 2185 4.4 20 hydride is cracked.48 72 2110 2.4 20
69

TABLE 5 (Continued)C. Stanford Research Institute Samples
Air Atmosphere (Continued)
Heat FluxSample No. s " Temp. System Time
G. T.C. S. R.I. Camp. Avg. ,ctual (OR) Pressure (sec.) CommentsTrajectory (BTU/ft -see) (in.of Hg)
52a b-3 alloy 60 90 2470 0.2 400 Sectioned and potted,130 195 2600 0.4 200 cracked.320 480 3000 2.4 200640 900 2650 18.4 100320 480 3020 66.0 100
52h b-4 hydride 60 90 2470 0.2 400 Sectioned and potted,130 195 2550 0.4 200 cracked.320 480 2980 2.4 200.640 900 2650 18.4 100320 480 2990 66.0 100
53a b-6 alloy 60 90 2510 0.2 400 Sectioned and potted,130 195 2650 0.4 200 reaction layer around320 480 3155 2.4 200 edges of specimen.640 900 3695 18.4 100320 480 3155 66.0 100
53h b-8 hydride 60 90 2470 0.2 400 Sectioned and potted,130 195 2615 0.4 200 reaction layer around320 480 3245 2.4 200 edges of specimen.640 900 3840 18.4 100320 480 3140 66.0 100
54a lb-3 alloy 65 100 2310 0.2 300 Sectioned and potted,215 325 2490 1.2 100 definite layer around415 625 3120 4.8 100 edges of sample.670 900 3640 30.0 100240 360 2565 30.0 100
54h lb-4 hydride 65 100 2350 0.2 300 Sectioned and potted,215 325 2435 1.2 100 definite layer around415 625 3210 4.8 100 edges of sample.670 900 3720 30.0 100240 360 2760 30.0 100
70

TABLE 5 (Continued)C. Stanford Research Institute Samples
Air Atmosphere (Continued)
Heat FluxSample No. w x Temp. System Time
G.T.C. S.R.I. Comp. Avg. Pctual (OR) Pressure (sec.) CommentsTrajectory (BTU/ft -sec) (in. of Hg.)
55a lb-5 alloy 65 100 2110 0.2 300, Sectioned and potted.215 325 2760 1.2 100415 625 3660 4.8 100670 900 3800 30.0 100240 360 2740 30.0 100
55h lb-4 hydride 65 100 2145 0.2 300 Sectioned and p-tted.215 325 2185 1.2 100415 625 3280 4.8 100670 900 3680 30.0 100240 360 2650 30.0 100
56a 2b-2 al loy 245 360 2510 1.2 50 Sectioned and potted.450 675 3320 8.8 40720 900 3590 36.8 50400 600 3210 62.0 50
56h 2b-4 hydride 245 360 2290 1.2 50 Sectioned and potted,450 675 2940 8.8 40 hydride cracked, re-720 900 3550 36.8 50 action layer around400 600 3110 62.0 50 edges.
57a 3b-2 alloy 250 375 2580 10.4 35 Sectioned and potted,400 600 3190 44.0 35 slight recovery zone240 360 2435 50.4 35 on surface.
57h 3b-4 hydride 250 375 2330 10.4 35 Sectioned and potted,400 600 3010 44.0 35 slight recovery zone240 360 2330 50.4 35 on surface.
71

TABLE 5 (Continued)D. Armour Research Foundation
Tested at I Atm. Pressure
Sample No. Type of test Atmos- Temp.G. T.C. Composition performed phere (OR) Comments
58 ZrH-U Loss of fuel Argon 3350 5 pieces showing zones ofrod integrity reaction.
59 ZrH-U Linear thermal Hydrogen 2790 Long, rod-shaped piece.expansion
60 Zr-U Linear thermal Argon 2790 Long, rod-shaped piece.expansion
61 ZrH-U Thermal Hydrogen 2710 1" rods, material flakesconductivity off.
62 Zr-U Thermal Argon 2750 1" rods, material flakesconductivity off.
63 ZrH-U Emissivity Air 2500 Round disks about 1.343"64 ZrH-U Emissivity Hydrogen 2800 diameter, material flakes65 ZrH-U Emissivity Argon 2800 off.
66 Zr-U Specific heat Argon 2770 Rod-shaped pieces, sur-
67 2 samples ZrH-U Specific heat Hydrogen 2700 face reaction.
68 Zr-U Heat of fusion Argon 3430 Encapsulated in graphite.
69 ZrH-U Tensile test Air Room Broken at gauge mark.temp.
70 ZrH-U Tensile test Air Room Broken in two places.temp.
71 Zr-U Tensile test Air Room Broken inside gauge mark.temp.
72 Zr-U Tensile test Argon 2600 Not broken but partiallymelted at one spot.
72

TABLE 5 (Continued)E. Batte lle Institute Samples
All samples subjected to rocket exhaustSample No. Comfrosition test in 02, H2, and H2 0 atmosphere at Comments
G. T.C. 350bPR. and 0.25 atm. pressure unlessotherwise noted
73 ZrH-1OU (A. I.,. material) Melted on face of cylinder.74 1-ZrH-1OUJ-2Ba Sectioned and potted.75 2-ZrH-IOUJ-2Nb Sectioned and potted.76 3-ZrH-1OU-5Sn Sectioned and potted.77 4-ZrH-IOU-2Cu Sectioned and potted.-78 5-ZrH-1OUJ-2V Sectioned and potted.79 6-ZrH-1OU-2Ca Sectioned and potted.80 7-ZrH-1OU-2Nb-2Ba Sectioned and potted.81 8-ZrH-IOU-2Sn-2Nb Sectioned and potted.82 9-ZrH-1OU-5Cr Sectioned and potted.83 1O-ZrH-10U Sectioned and potted.84 1 1-ZrH-IOU-Ba Sectioned and potted.85 12-ZrH-IOOU-2W Sectioned and potted.86 13-ZrH-IOOU-2Ta Sectioned and potted.87 14-ZrH-1OUJ-2AI Sectioned and potted.
88 15-ZrH-JOU-2Bi Sectioned and potted.89 16-ZrH-JOU-5Sb Sectioned and potted.90 17-ZrH-IOU (A. 1 . material) Exposed to rocket 5 seconds,
sectioned and potted.91 I8-ZrH2 -U0 2 Exposed to rocket 5 seconds,
92 1-ZrHsectioned and potted.92U Exposed to rocket 5 seconds,
sectioned and potted.93 20-ZrH2 -UN Exposed to rocket 5 seconds,
sectioned and potted.94 21-ZrH-1OU-2Sr Exposed to rocket 5 seconds,
sectioned and potted.95 22-ZrH-IOU-5Nb Exposed to rocket 5 seconds,
sectioned and potted.96 23-ZrH-JOU-5Th Exposed to rocket 5 seconds,
sectioned and potted.97 24-ZrH-1OU-2Ni Exposed to rocket 5 seconds,
sectioned and potted.98 25-ZrH-IOU-2Si Exposed to rocket 5 seconds,
99 2-Zr-1OU2Crsectioned and potted.99 2-ZrHIOLJ2CrExposed to rocket 5 seconds,
sectioned and potted.100 27-ZrHIU (A. 1. material) Exposed to rocket 2.5 seconds,
sectioned and potted.101 ZrH-IOU-5Sn Not tested.
73

TABLE 5 (Continued)E. Battelle Institute Samples (Continued)
All samples subjected to rocket exhaustSample No. test in 02, Hf, and H2 0 atmosphere at
G. T.C. Composition 35000 R. and T.25 atm. pressure unless Commentsotherwise noted.
102 ZrH-1OU-2AI Exposed to rocket for 8 seconds,cylinder ablated on one end.
103 ZrH-1OU-2W Exposed to rocket for 8 seconds,cylinder ablated on one end half-way back.
104 ZrH-1OU-2V Exposed to rocket for 8 seconds,cylinder ablated on one end.
105 ZrH-IOU-2Si Not tested.106 Unidentified alloy section Specimen found down stream after
test.107 ZrH-UN Section of isostatically compacted
specimens found down stream.108 ZrH-UC Section of isostatically compacted
specimens found down stream.109 Probably ZrH-U0 2 Section of isostatically compacted
specimens found down stream.110 Probably ZrH-UO 2 Section of isostatically compacted
specimens found down stream.111 Suspected to be ZrH-UN Section of isostatically compacted
specimens found down stream.112 Suspected to be ZrH-UN Section of isostatically compacted
specimens found down stream.
74

TABLE 5 (Continued)F. Astropower, Inc. Samples
All Testing Performed in Arc Plasma Facility
Sample No. Partial Pressures of Plasma GasesG. T.C. Astropower Composition Argon(atm.) Qxygen(atm.) Nltrogen(atm.) Comments
113 64 Zr-U 1.000 0 0 Mounted particles.114 65 Zr-U .667 0 .333 Mounted particles.115 66 Zr-U .667 .333 0 Mounted particles.116(a) 29 Zr-U .667 .333 0 Mounted particles.116(b) 55 Zr-U .705 0 0 Mounted particles.117(a) 64 Zr-U 1.000 0 0 Mounted particles.117(b) 65 Zr-U .667 0 .333 Mounted particles.117(c) 66 Zr-U .667 .333 0 Mounted particles.117(d) HI ZrH-U 4.400* 0 0 Mounted particles.117(e) H2 ZrH-U 4.384* 0. 016* 0 Mounted particles.117(f) H3 ZrH-U 9. 800* 4.900* 0 Mounted particles.
*Pressures measured in psia instead of atms.
75
APPENDIX II
ANALYSIS OF CHEMICAL REACTIONS OF A HYDRIDEDFUEL ELEMENT DURING RE-ENTRY
An analysis of the behavior of a zirconium-uranium alloy in a high temperature, air
atmosphere environment shows that it oxidizes according to the parabolic rate law and absorbs
both nitrogen and oxygen into it." 3 4 ' The oxide formed, which is ZrO0, also absorbs oxy-
gen and nitrogen, as is evidenced by the phase diagrams. "* Initially, it is assumed that small
alloy additions of uranium (say up to 4 atomic percent) do not change the fundamental be-
havior of zirconium in an oxidizing atmosphere.. The data will be shown to be in essential
agreement with this assumption.
A. FACTUAL INFORMATION
The data available for analysis consist, of the following known items.
I. Weight gain measurement, continuous in time, on sample fuel element
material specimens for:
a. 100%, 50%, and 10% air atmosphere environment at one atmosphere
of pressure. The dearth of air pressure in the 10% and 50% air cases
was made up by the addition of argon gas. The argon is known not to
react with the fuel element material.
b. 5000C, 8000C, 11000C, and 14000C temperature environments were
used with each of the atmospheres listed in a.
2. The starting compounds and reaction product for each of the weight gain
experiments are known. These include:
76

a. Initial composition or weight percent of hydrogen, zirconium,
and uranium.
b. The final composition, hydrogen, nitrogen, oxygen, zirconium,
and uranium.
c. The coat'ng formed on the sample specimen surfaces, i.e. ZrO3 .
3. The length of time required for the fuel elements to reach an essentially
uniform temperature under the environmental conditions described in Ib
above is known.
4. The rate of hydrogen evolution from the Zr-H-U material as a function of
the temperature for the range given in lb above, when heated in an
argon atmosphere, is known.
5. The quantity of hydrogen that the fuel element material will maintain in
an activated absorption state is essentially independent of the external
hydrogen pressure, 41 varying roughly from the one-eighth to the one-
fourteenth power of the external pressure at a given temperature.
6. The rate of oxidation is essentially independent of the exter ial oxygen
pressure, so long as oxygen is supplied at the outer surface of the oxide-
nitride layer (which is formed on the material), as fast as it is used up at
the interface between this layer and the fuel element proper.2"
7. Phase diagrams for the activated absorption of oxygen in zirconium and
zirconia are available .6
8. Insofar as the heat energy released due to the chemical reactions of oxygen
and nitrogen with the fuel element material is concerned, the energy pro-
duced per unit weight gain of the fuel element material is essentially the
77

same for the two reactions, Zr 0 -ZrO and 2Zr + N@ -- 12ZrN.
These are the principal reactions to be considered." An X-ray analysis
of the surface material produced on the fuel element material under simu-
lated re-entry conditions31 and during the weight gain experiments ° shows
that the surface material is ZrO. .
9. Zirconium and dilute binary alloys of Zr with other metals will oxidize much
more rapidly in an atmosphere containing a few percent water vapor than in
a dry atmosphere .
10. When the fuel element material is exposed to a heating environment similar
to that that it would experience during re-entry, but containing an excess of
water vapor, 47,r" the sample fuel elements being tested partially melted and
ablated away during the tests.
11. Samples of fuel element materials, when subjected to varying arc-image
heating rates and atmospheric pressures that simulate those that would be
experienced by a fuel element along a variety of re-entry trajectories, do
not lose their geometrical integrity.3 1 However, they do lose hydrogen and
do have coatings of ZrO2 formed on their surfaces.
12. The solubilities of oxygen in Zr and ZrO are approximately equal.
13. When heated in an air atmosphere for long periods of time, the fuel element
material exhibits "break-away" oxidation. Due to the large thicknesss of
the oxide involved, this is not attributed to a mismatch in thermal expansion
coefficients between the alloy and the oxide.
14. It can be shown analytically that the most rapid possible rate of oxidation
(or other chemical reaction) In an Ion diffusion controlled process is thatrate
described by the parabolic oxidation law.
78
B. MATHEMATICAL MODEL FOR CHEMICAL REACTIONS
1. Correction Factors for Weight Gain Measurements
The weight gain measurements made by ARF, described In Item 1 above, were made
on short cylindrical samples (0.585 cm long, 1 .905 cm diameter). Because the oxide layers
formed on the surface of these test samples were thick, and because the oxidation rate laws
are based on weight gains per unit area, it is necessary to correct the weight gain data for
the fact that the surface area of the unreacted material decreases as the weight (thickness of
the oxide layer) of the sample increases. By making use of the geometry of a cylinder, it can
be shown that the area of the sample, A(t), that remains at the time, t, and hence is available
for oxidation is simply given by
A(t) = 2 rr(R-S) (R-S) + 2(L-S)] (91)
where R = initia! cylinder radius,
L = one-half of the initial length of the cylinder, and
S = thickness of the metal that has been converted to a coating (i .e. , anoxide and/or nitride).
It can also be shown in an analytical manner that if f(t) is the fractional weight gain of the
sample at the time, t, and K is the weight of the reacted compound containing one gram of
the metal, then the value of S is the solution to the following relation:
R2 L f(t) (92)S 3 -(L+2R) S 2 t(R 3 +2RL)S-- - 1 -= O. 2
The total weight ot the sample at time, t, is the initial weight, Wo , plus the weight Wof(t).
The data on weight gain measurements were taken on a strip-chart which showed the Integral
weight gain as a function of ti.e. Because the relative magnitudes of the possible reactions
that took place during the data-gathering time interval, these data must be reduced to finite
79

difference form for the proper interpretation of the results. The weight gain per unit area
during the i th time interval, a ti, can readily be shown to be given by
=Af(A ti) WoAms (A ti) = (93)
A(t')
where Af(Lti) is the change in the fractional weight of the sample during the time interval, At i ,
and t'= t -. at i . It is clear that2
E Atk = t, (9 4a)k=I
Z4 m(kAtk) tLms(t), and (94b)k=1
i
E kf(A) - f(t). (94c)k=1
These equations are applicable to any cylinder that is undergoing a weight gain due to a surface
reaction that forms a coating of products on the surface thereof. The quantity f(t) is interpreted
as the weight gain (or loss) due to the formation (or decomposition) of the surface coating.
2. Description of Reactions
The weight gain (or lass) of the element is due to oxidation and/or nitridation (Ams),
to nitrogen and oxygen absorption (6ma), and to dehydriding (AmH), so that the total weight
change at a given time is
Am(t) = Am s + Am - AmH. (95)
The weight gain data, when corrected in accordance with eqs. (93) and (94), lead one to sus-
pect that at first there is some lass of hydrogen and absorption of nitrogen and oxygen, together
with oxidation. After some time has lapsed, the process follows a true parabolic law, and,
finally, for the very thick coatings, exhibits breakaway oxidation. In view of the fact that
80

i
oxygen and nitrogen have almost identical atomic sizes and masses, no distinction will be
made between them insofar as mass increases due to their absorption into the sample material
during weight measurements are concerned. With this simplification, and in view of Item 8
above, eq. (95) can be written asSmT,,, FA,]-Q/T V.-E/T
Am(Ttp)L= [As+ p te - 6mH(T, t). (96)
Here, RgQ and RgE are activation energies, when Rg is the universal gas constant, As and
Aa are constants, and p is the partial pressure of the component of the gas being absorbed.
The first right-hand side term in this relation represents the parabolic chemical reaction law
and the second the activated absorption law.3
a. Determination of activated absorption constants.--The values of A. and E are
determined as follows. Holding T and t constant and letting p vary for two sets of t and T,
eq. (96) shows that
Am(T 1 , t, P) - Am(T 1, tj, pa) = Aa tj e P - P (97a)
and
Am(T., t3 , pl) - Am(Ta, t2, Pa) = Aa t, eE/T2 pN Y2 P2 - (97b)
These two equations determine the values of A. and E. The values of t to be used must be suf-
ficiently small to assure that the absorption process is not seriously inhibited by the oxide coat-
ing that is being built up on the surface of the sample. Examination of the weight gain data
show that Ama is only a few percent of Ams, being less than 1 .7% weight gain in all cases.
Its values are essentially masked by errors in the data and hence can be considered as negligible
insofar as the present analysis is concerned. The oxygen and nitrogen absorption effects would
be even less under actual re-entry conditions because of the low pressure in the boundary layer
about the fuel element during the initial stages of oxidation.
81
b. Determination of hydrogen loss rate.--By heating the fuel element material in an
argon atmosphere and noting the rate of hydrogen loss, it is immediately apparent that the loss
rate is an exponentially decreasing one. This suggests the following differential equation:
d MHr
dt (MHo - MHr) X,
where MHr is the amount of hydrogen that has been released per unit area from the sample speci-
ment, MHo is the amount of hydrogen that was initially available for release (per unit area) at
the temperature in question, and X is a temperature dependent parameter. Integrating this ex-
pression and evaluating the constant of integration by making use of the boundar, condition
MHr = 0 at t = 0 gives
MHr MHo 0 - t ) (98)
Making use of the dehydriding rates reported in reference 10, a plot of Xversus T can be
obtained. This plot is a straight line whose equation is
X = 1.01 x 10 3 T - 1.92. (99)
This relationship is valid for T > 19000R. Below this temperature, the loss rate can be considered
to be zero for the practical problem at hand.
The hydrogen that is released diffuses through the oxide layer that is being formed on the
surface of the fuel element material. The rate of loss through the oxide layer per unit area is
governed by a diffusion equation of the form
d-MK a grad C H , (100)
dt
where M?.I is the amount of hydrogen that has diffused through the oxide layer and escaped into
82
the surrounding environment, CH is the hydrogen concentration, and a is the diffusion con-
stant multiplied by thedensity of the oxide film. Since the concentration just outside the oxide
surface is essentially zero, it follows that
grad CH = MHr - MH " (101)Ams
Substituting eqs. (98) and (101) into (100) gives, upon rearrangement,
dMK aMH 0 aMHo(1 -e -Xt (102)dt /;S102)ks~__
where ks is the parabolic rate constant, i.e.
-Q/Tks = A. e (103)
This, then, is the differential equation describing the rate of hydrogen loss (per unit area) through
the surface of the oxide coating.
To so!ve eq. (102), note that it is of the form
+ f(xy = g(x) (104a)dx
The complimentary solution (solution to homogeneous equation) is simply
y = C Jf(x) dx, C = constant. (104b)
Letting C = C(x), and using the method of variation of parameters, gives, upon differentia-
tion and substituting into (104a),
C Wx) f Fg(x) e ]~)dxIdx + (I104c)
where A is the constant of integration. Substituting eq.(104c) into (104b) gives
y(x) =exp[-.f(x)dx { A + fg(x) exp[ j'f(x) dx] dx}. (I04d)
83
Substituting eq. (102) into this general solution gives
AmH = MK= exF r.2ALI + a MHo(1 -xt) exp [ 't IL "'1 (105)
Now, {(aA/'i;t) dt is readily integrated to give 2a(t/ks)%, thus, (105) becomes
2a/ /is' aMHo 2a Iiisx e -(Xt+t2at -)e (106)1mH-Ae - e e dt - dt
The lost integral in eq. (106) is readily integrated, that is,
Se-2a _dt= /k -2a r (I07a)IT9 a
If q = tY/ 2 is substituted into the first integral in eq. (106), it becomes
e-(Xt + 2al-/s) 2 fe-(Xq+ 2a q/s)dq.
Then, let u = Xq2 + 2aq/-jks, to obtain
2feu du
Integration by parts gives
2 •-u a u - 2 e-u a 2+ d du. (107b)2e L- xks' X
Now, change variables by letting v8 = -12 + in the integral of eq. (107b) to obtain
j, /[ a 8 u a a9/kks .xv- 2- u" . + -x du = - 2 e a v(2vdv).
Integrating this expression by parts gives
84

The bracketed expression is simply erf(v,/'). Substituting this into (107b) and changing
variables back to t gives, upon simplification,
2(t/+ a/k s') e-(Xt + 2a! f't'k + e 2a2/Xks] 2.& ea/kserf(Xt + a//F'T) (107c)
Substituting eqs. (107a) and (107c) into eq. (106) gives the complete primitive of eq. (102) as
6mH Ae + a MHO e2 aI ' 2(tl/ 2 + a/e ks • 2a [k +
2/ _S + k' - t (108)
-2a 2/k 12 T e*a2/Xks erf(/%~' + a//X- 1k /~ 2 ~~~ 18
e a
The constant A can be evaluated by making use of the boundary condition that amH 0 at
t = 0. Thisgives
A---a MHo 2a%]{( ( e 2a /Xks)257r e_ a/.ks ra/ks-+ji/oHO , -{ 2a/XI)(l+ -2,/2Xkerf(aI ,/-"ks/a)> (109),/, J
Substitution of this value of A into eq. (108) gives the amount of hydrogen lost per unit area
in a time t as
a M HO 2afti7-k r -2a + -2 o/Xkk5 - - 2 k s f(/ % 'AmH(t) = 0 •( + 2 12 TT ef(/
+ a. /,/X s ). rf (a/,/=Xk] + I .(I . - 2 a )t/-
+ 2(f ' + a/ ') (1 + -2aU/ks) -(Xt + 2aI7')} (110)
85

The diffusion paameter must be determined experimentally. This is accomplished by
measuring the quantity of hydrogen left in the sample specimens after they have been exposed
to the weight gain tests. There was quite a spread in the initial weight percentages, MHo, of
the test sample specimens, varying from approximately 1 .4 weight percent to 1 .7 weight per-
cent. Because of this nonuniformity among the various specimens tested, the mean value of
MHo = 1.55 weight percent was taken for determining a. Various sample specimens that had
been exposed to the weight gain tests were analyzed for hydrogen content by vacuum fusion
analyses. This results in a corresponding spread in the values of a. The value of a so deter-
mined is
a = AH e- Q H/ T, whereAH=0.10, andQH = 1.84x 10'. (111)
Substituting these values and eq. (99) into eq. (102) gives the rate of hydrogen loss per unit area
a- AmH(t) - aMHo - exp (1.92- 1.01 x 10-T) . (112)
The value of AmH(t) is given by eq. (112), and the value of MHo has to be known. For the par-
ticular samples used in the weight gain tests,
MHo = 1.55 x 10⁻² WO = 1.69 x 10"2grams/cm2.A(o)
The values of As and Qs are to be taken from eq. (116) below.
c. Determination of the parabolic rate constant.--When the weight gain dnta, as
modified by eq. (93), are plotted on log-log paper, the result is a family of parallel, straight
lines for t greater than about 15 to 20 minutes, one line for each temperature (see Fig. 7) It
is readily determined that the process involved is parabolic in nature, that is, each of the lines
car. easily be fitted by an equation of the form
86

Ams (T, t) = k(T)t + C(t). (113)
By holding T constant and varying t, one can calculate the value of k(T), i.e.
m M(T, tj) - Ams(T, t9) = k(T) (t, - t2). (114)
Here, it has been assumed that C(t), which arises from Ama and AmH is actually constant for
large values of t, say t>20 minutes. The fact that the family of lines are truly parabolic
supports this position. That is, if there are changes in Ama and AmH for large values of t, they
are overshadowed by Ams to within the limits of the accuracy of the data.
The reaction rate constant is known to obey Arrhenius' equation, 28 that is,
k(T) = A eQ/T (115)
The value of k is determined from eq. (114), using the temperatures 13900R, 1930°R, 2470R,
and 3010"R. There is a phase change in the fuel element material at approximately 20400R.
This phase change changes the value of k. If log k is plotted versus I/T for the 1390°R and
1930°R points and for the 2470°R and 1930°R points, the pair of straight lines connecting these
two pairs of points cross ct the phase change temperature (see Fig. 8). This is the result ex-
pected, and it lends even greater confidence to the values of A and Q so determined. They are
As = 0.356 (gms/cm4-min), Q. = 2.59 x 10⁴, for T - 2040OR, (116a)
As = 92.5 (gms-/cmk-min), Qs = 3 .79 x 104, for T- 2040°R. (116b)
With these parameters determined, the mass increase at any time can now be determined by
eq. (95) for any combination of the sets of variables (T, t). Also, the rate of hydrogen evolution
is determined by using the results of eq. (116) in eq. (112).
87

REFERENCES
1. J. L. Raymond and T. B. Gaber, "On the Stability of a Circular Cylinder at Hyper-sonic Speeds," RAND Paper D-723 (Jun. 9, 1956).
2. W. T. Davey and C. E. Gribsby, "Stability Characteristics of Cones and Cylinders atLarge Angles of Attack at Mach Number 2.87," Aeronutronics Report No. U-540(Aug.59).
3. "Investigation of Re-Entry Destruction of Nuclear Auxiliary Power Plant, " AFSWC-TR-61-69.
4. R. J. Vidal and C. E. Wittliff, Third Int. Rarefied Gas Dynamics Symposium, Vol. 2,Academic Press, N. Y., (1963), pp. 343-378.
5. J. A. Fay and F. R. Riddell, J. Aero, Sci., Vol. 25, pp. 73-85 (Feb. 1958).
6. P. H. Rose and Affenhartz, AVCO Res. Rept. No. 114 (Aug. 1959).
7. S. Georgiev, "Hypersonic Ablation and Interpretation of Test Results," AVCO Res. Rept.No. 99 (Oct. 1960).
8. H. S. Carstaw and J. C. Jaeger, Conduction of Heat in Solids, P. 203, Oxford at theClarendon Press (1959).
9. J. L. Raymond, "The Rotational Motion of a Rod Entering the Earth's Atmosphere,"RAND RM-2629 (Oct. 1, 1960).
10. J. C. Hedge, J. I. Lang, E. Howe, and R. Elliott, "High Temperature Property Studyfor Re-entering NAP Systems," AFSWC-TDR 63-17 (June 1963).
11. J. A. Penland, "Aerodynamic Characteristics of a Circular Cylinder at Mach Number6.86 and Angles of Attack up to 900,. " NACA Tech. Note 3861, (June 1957).
12. N. Am. Aviation, Inc., Report, "Flight Test Criteria for Re-entering NAP Systems,"AFSWC-TDR-62-83.
13. H. K. Cheng, CAL Rept. No. AF-1285-A-7 (1961).
14. C. B. Cohen and E. Reshotko, "Similar Solutions for the Compressible Laminar BoundaryLayers with Heat Transfer and Pressure Gradient," NACA TN 3325 (1955).
15. 0. K. Tewfik and W. H. Giedt, J. A. S., Vol. 27, pp. 721-729 (1960).
16. I. Beckwith, NACA RM 55F09 (1955).
17. H. K. Cheng and A. Chang, CAL Rept. No. AF-1515-A-1 (1962).
88

18. E. R. G. Eckert, J. Aeronaut. Sci., Vol. 22, pp. 585-587 (Aug. 1955).
19. W. D. Hayes and K. F. Probstein, Hypersonic Flow Theory, Academic Press, N. Y.,p. 296 (1959).
20. N. B. Cohen, "Correlation Formulas and Tables of Density and Some Transport Proper-
ties of Equilibrium Dissociating Air For Use in Solutions of the Boundary-Layer Equa-tions, " NASA TN D-194 (1960).
21. "Equations, Tables, and Charts for Compressible Flow, " Ames Staff, NACA Rept. 1135(1953).
22. G. G. Chernyi, Introduction to Hypersonic Flow, p. 214, Acad. Press, N. Y. (1961).
23. N. H. Kemp, P. H. Rose, and R. W. Detra, "Laminar Heat Transfer Around BluntBodies in Dissociated Air," AVCO Research Report No. 15 (1958).
24. R. W. Detra and H. Hidalgo, "Generalized Heat Transfer Formulae and Graphs," AVCOResearch Report No. 72 (1958).
25. K. F. Probstein, "Invicid Flow in the Stagnation Region of Very Blunt Nosed Bodies atHypersonic Flight Speeds," WADC TN 56-395 (Sept. 1956).
26. C. E. Wittliff and J. T. Curtis, "Normal Shockwave Parameters in Equilibrium A'r,CAL Rept. No. CAL-1Il (Nov. 1961).
27. 0. Kubaschewski and B. E. Hopkins, Oxidation of Metals and Alloys, Academic Press,
Inc., Lc.adon (1953).
28. J. S. Dunn, Proc. Roy. Soc. A 11, p. 203 (1926).
29. E. A. Gulbransen and K. F. Andrew, "Oxidation of Zirconium Betwoen 400 and 8000C., " J. of Metals, pp. 394-400 (Apr. 1957).
30. C. E. Wicks and F. E. Block, "Thermodynamic Properties of 65 Elements, Their Oxides,Halides, Carbides, and Nitrides," Bulletin 605, BuMines (1963).
31. Fred E. Littman, "Zirconium-Uranium Combustion Study, " SWC TDR 63-15 (Dec. 1962).
32. R. D. Elliott, "Aerospace Safety Re-entry Analytical and Experimental Program SNAP 2and 10A, " (Interim Report), NAA-SR-8303 (Sept. 1963).
33. North American Aviation Final Report, SWC TDR 63-14 (April 1963). (See p. 73 andpp. 202,203.)
34. E. T. Hayes and A. H. Roberson, "Some Effects of Heating Zirconium in Air, Oxygen,
and Nitrogen," Trans. of the Electrochemical Society, Vol. 96, p. 1212 (1949).
89

35. E. A. Gdbransen and K. F. Andrew, J. Metals Transactions, Vol. 185, p. 515 (1949).
36. E. A. Gulbransen and K. F. Andrew, Trans AIME Journal of Metals, Vol. 9, p. 394(1957).
37. R. G. Charles, S. Barnartt, and E. A. Gulbransen, Trans. Am. Inst. Mining Met.Engrs, Vol. 212, 101 (1958).
38. J. Belle and M. W. Mallett, Jour. of the Electrochemical Soc., Vol. 101, p. 339 (1954).
39. P. Kofstad, Acta. Chem. Scand., Vol. 12, 701 (1958).
40. A. Drounieks, Am. Chem. Soc. Jour., Vol. 72, 3568 (1950).
41. D. F. Atkins, "Dissociation Pressures of Hydrided Zirconium-Uranium Alloys," NAA-SR-4245, c. 16A.
42. Irving Weinstein, "Heat Transfer and Pressure Distributions on a Hemisphere-Cylinderand a Biuff-Afterbody Model in Methane-Air Combustion Products and in Air" (See Figs.11 and 12), NASA TN D-1503 (December 1962).
43. Donald M. Kuehn, "Experimental and Theoretical Pressures on Blunt Cylinders for Equi-librium and Non-equilibrium Air at Hypersonic Speeds " NASA TN D-1979 (Nov. 1963).
44. Fred E. Littman, Paper presented at the AFWL Contractor's Meeting at Kirtland AFB,N. M., on Jan. 21, 1964.
45. E. J. Opik, P.rics of Meteor Flight in the Atmosphere, Interscience Publishers, Inc.,N. Y. (1958).
46. R. F. Domagalo and D. J. McPherson, "Phase Diagrams of Zirconium-Base Binary Al-loys, The Zirconium-Oxygen System," USAEC Contr. No. AT(1 1-1)-149, Rept. No.10, ARF of Ill. Inst. of Tech., 1953.
47. Ellis L. Foster, Jr., "Burn-Up Enhancement for Re-entering NAP Systems," RTD-TDR-63-3054 (Oct. 1963).
48. W. J. Fleming, Jr. and R. A. Rindal, "The Response of Nuclear Auxiliary Power UnitFuel Rods to Simulated Re-entry Heating," AFSWC-TDR-63-52 (May 1963).
1 90

WL-TDR-64-15
DISTRIBUTION
HEADQUARTERS USAF
1 Hq USAF (AFCOA). Wash, DC 20330
1 USAF Dep, The Inspector General (AFIDI), Norton AFB, Calif92409
1 USAF Directorate of Nuclear Safety (AFINS), Kirtland AFB, NM87117
MAJOR AIR CCIbAMANDS
1 AFSC (SCCP), Andrews AFB, Wash, DC 20331
1 AUL, Maxwell AFB, Ala 36112
AFSC ORGANIZATIONS
1 Systems Engineering Group, Research & Technology Division,AFSC, ATTN: SEPRR, Wright-Patterson AFB, Ohio 45433
1 RTD (RTN-W, Lt Col Munyon), Bolling AFB, Wash, DC 20332
SSD, AF Unit Post Office, Loa Angeles 45, Calif 90045
1 (SSTRE)
1 (SSZMS)
KIRTLAND AFB ORGANIZATIONS
1 AFSWC (SWEH), Kirtland AFB, NM 87117
AFWL, Kirtland AFB, NM 87117
10 (WLIL)
1 (WLRP)
1 (WLAS) (ATTN: Lt R. W. Obermeyer)
3 (WLDN)
OTHER AIR FORCE AGENCIES
3 Director, USAF Project RAND, via: Air Force Liaison Office,The RAND Corporation, ATTN: Miss Mary Romig, 1700 MainStreet, Santa Monica, Calif 90406
NAVY ACTIVITIES
1 US Naval Weapons Evaluation Facility (NWEF) (Code 404),Kirtland AFB, NM 87117
OTHER DOD ACTIVITIES
Director of Defense Research & Engineering, The Pentagon,Wash, DC 20330
2 (Lt Col Roy C. Weidler)
2 (James E. Blower)
91

WL- TDR-64-15
DISTRIBUTION (cont'd)
zo Hq Defense Documentation Center for Scientific and TechnicalInformation (DDC), Bldg 5, Cameron Sta, Alexandria, Va 22314
AEC ACTIVITIES
US Atomic Ehergy Commission, Mail Station G-017, Wash, DCZ0545
4 (DRD/Asst Director for Compact Reactor Systems)
4 (DRD/Asst Director for Nuclear Safety)
6 Sandia Corporation (Information Distribution Division), SandiaBase, NM 87115
1 US Atomic Energy Commission, Canoga Park Area Office,ATTN: Manager, CPAO/Mr. J. Levy, Canoga Park, Calif
OTHER
1 OTS, Department of Commerce. Wash Z5, DC
3 General Technologies Corp., ATTN: Mr. J. D. Graves,230Z Willowood Lane, Alexandria, Va
1 Official Record Copy (Lt Pourciau, WLDN)
9z