acute health effects of the enbridge oil spill - … · on monday july 26, 2010, enbridge energy...
TRANSCRIPT

Acute Health Effects of the
Enbridge Oil Spill November 2010
(Minor revisions 12/20/2010)
Acute Health Effects of the Enbridge Oil Spill
November 2010 (Minor revisions December 20, 2010)
Martha Stanbury,1 MSPH, Kim Hekman, MPH,1 Eden Wells, MD, MPH,1 Corinne Miller, DDS, PhD,1 Susan Smolinske, PharmD,2 James Rutherford, RS, MPA 3 Address correspondence to: Martha Stanbury, MSPH Division of Environmental Health Michigan Department of Community Health PO Box 30195, Lansing, MI 48909 [email protected] 517-335-8364. 1. Michigan Department of Community Health, Lansing, MI 2. Poison Control Center, Children’s Hospital of Michigan, Detroit, MI 3. Calhoun County Public Health Department, Battle Creek, MI
1

Acute health effects of the Enbridge Oil Spill
Table of contents
Executive Summary ………………………………………………………3 I. Background………………………………………………………...4 II. Methods and Results……………………………………………...5
A. Health care provider reporting………………………………...5 B. Community and workplace surveys…………………………..9 C. Calls to the poison center from the public…………………...14 D. Syndromic surveillance………………………………………..16
III. Discussion…………………………………………………………..17 IV Conclusions…………………………………………………………20 Appendix…………………………………………………………………….22 References………………………………………………………………….23
2

Executive Summary
On Monday July 26, 2010, Enbridge Energy Partners, L.P., reported the burst of a 30-inch pipeline near Marshall, Michigan, in Calhoun County. In response to concerns about acute health effects from exposure to spilled oil in this major disaster, state and local public health in Michigan quickly set up a multi-faceted public health surveillance system that included health care provider reporting, community surveys, calls from the public to the Poison Control Center, and analysis of data submitted to the state’s syndromic surveillance system. The surveillance system received 147 health care provider reports on 145 patients, identified 320 (58%) of 550 individuals with adverse health effects from four community surveys along the impacted waterways, identified one small worksite symptomatic employees, and tracked 41 calls that were placed to the poison center by the public. Headache, nausea, and respiratory symptoms were the predominant symptoms reported by exposed individuals in all reporting systems. These symptoms are consistent with the published literature regarding potential health effects associated with acute exposure to crude oil.
3
I. Background On Monday July 26, 2010, Enbridge Energy Partners, L.P., reported the burst of a 30-inch pipeline near Marshall, Michigan, in Calhoun County. The spill started at least a day earlier based on 911 calls and other reports of strong odors starting July 25. Approximately 800,000 gallons of crude oil spilled into the Talmadge Creek, a waterway that feeds the Kalamazoo River. The contamination ultimately affected 25 miles of the creek and river. While the greatest impact was in Calhoun County, the spill also affected an area of Kalamazoo County encompassing five miles of the river downstream from the border of Calhoun County to a dam just upstream from the city of Kalamazoo (See map in the appendix). The U.S. Environmental Protection Agency (EPA), Calhoun County Public Health Department (CCPHD), Calhoun County Emergency Management, the Michigan Department of Community Health (MDCH) and many other agencies and organizations quickly became involved with public health and environmental response to this massive spill. Beginning July 26, when the spill was reported to authorities, individuals near Talmadge Creek and the Kalamazoo River began complaining of strong, noxious odors and associated health symptoms in calls to CCPHD and the Michigan PCC. Subsequently, once it had been established, citizen concerns and complaints were routed to a phone hotline developed by Enbridge. Callers reported respiratory, gastrointestinal, and neurological symptoms, predominantly headache and nausea. To adequately characterize the impact of the oil spill on the public’s health, CCPHD, MDCH, and the Kalamazoo County Health and Community Services Department (KCHCS) developed and implemented a public health surveillance system to collect data on individuals with adverse health outcomes secondary to exposure to spilled oil and its vapors. The goal of this surveillance was to describe the magnitude and distribution of human health impacts due to exposure to the spilled oil, so that decision-makers could make informed decisions about actions needed to protect the public. The surveillance system included four components: (1) active solicitation of health care provider reports, under legal authority of the Public Health Code, and (2) door-to-door health surveys in selected communities self-identified as particularly impacted by the spill, (3) monitoring daily counts of self-reported illnesses based on calls to the PCC, and (4) utilization of MDCH’s syndromic surveillance system. In order to protect personal confidential medical information, MDCH obtained a “Medical Research Designation”.1 This designation legally protected individual identifying information from disclosure by the participating public health authorities to other parties, including those situations in which the information
4

could be requested under the Michigan Freedom of Information Act or by subpoena. This report describes the methods and results of the public health surveillance system established to measure and monitor health impacts from the Enbridge oil spill. Information about environmental sampling, clean-up efforts and other aspects of the spill response are available elsewhere.2 II. Methods and Results A. Health care provider reporting Methods Initially, contacts were made at the two hospitals in the area, and they were asked to provide a daily count of the number of patients seen in the Emergency Department (ED) or admitted with oil exposure-related complaints. Then, on August 5, the CCPHD and the KCHHS sent out “blast faxes” to all health care providers in their respective counties requesting that clinicians and healthcare facilities formally report any patients seen due to illness or symptoms associated with oil spill exposure. Providers were advised that this reporting is required under the Michigan Public Health Code (R 325.71-75), and they were provided reporting information and forms.3 To gather data on patients who were seen at the local ED prior to establishment of this healthcare reporting system, medical records of patients identified as exposed to the oil or its vapors were abstracted by the MDCH medical epidemiologist. The Michigan PCC was authorized as a legal agent of the state to receive the reports from health care providers for the purposes of this investigation. This allowed for 24/7 reporting, and allowed for PCC medical toxicologists to provide consultation to health care providers regarding oil spill-related patient diagnosis or treatment. Patient information collected included name, contact information and demographics, medical encounter date, clinical effects, laboratory test results, diagnosis, treatment, and contact information for the reporting provider. Reported information was entered into Toxicall®, the electronic case management system used by the Michigan PCC. Each case was given a “medical outcome” classification based on information about reported clinical effects as follows: no effect (no symptoms due to exposure); minor effect (some minimally troublesome symptoms); moderate effect (more pronounced, prolonged symptoms); major effect (symptoms that are life-threatening or cause significant disability or disfigurement); death; not followed, judged as nontoxic exposure (clinical effects not expected); not followed, minimal clinical effects possible (no more than minor effect possible); unable to follow, judged as a potentially toxic exposure; unrelated effect, the exposure was probably not responsible for the effect(s); or, confirmed non-exposure.
5

Daily summary reports were provided by the PCC to MDCH, CCPHD, and KCHHS on numbers of reports and severity of illness (i.e. “medical outcome”). A spreadsheet of all case information was provided to MDCH for data analysis. Analysis was performed using SAS® version 9.2 (SAS Institute, Cary, NC).4 Results Between July 26 and September 4, 2010, one hundred forty-seven health care visits for 145 individuals were reported by health care providers. (Two individuals were reported twice, by different providers, for separate visits.) One hundred seventeen (80.7%) of the 145 individuals lived and/or worked in areas near the affected waterways, 24 (16.5%) were oil-spill response workers, and four (2.7%) were transients/visitors. The average age of these 145 individuals was 38. There were slightly more females (77/53.1%) than males (68/46.9%) reported. Adults age 18 to 64 predominated (100/69%), with the remainder being children under age 18 (36/24.8%), and a small number of adults over age 65 (9/6.2%). The date of the reported visit to the health care provider is shown in Figure 1. (The two individuals reported twice are counted for date of their first visit.) The frequency of reported health care provider visits peaked in the second week after the spill, coinciding with the week providers were notified of the new reporting requirements. These visits included outpatient (N=77; 53%), hospital emergency department (N=64; 44%), hospital inpatient (N=1; 0.6%), and 3 (2%) where type of facility was unknown.
6
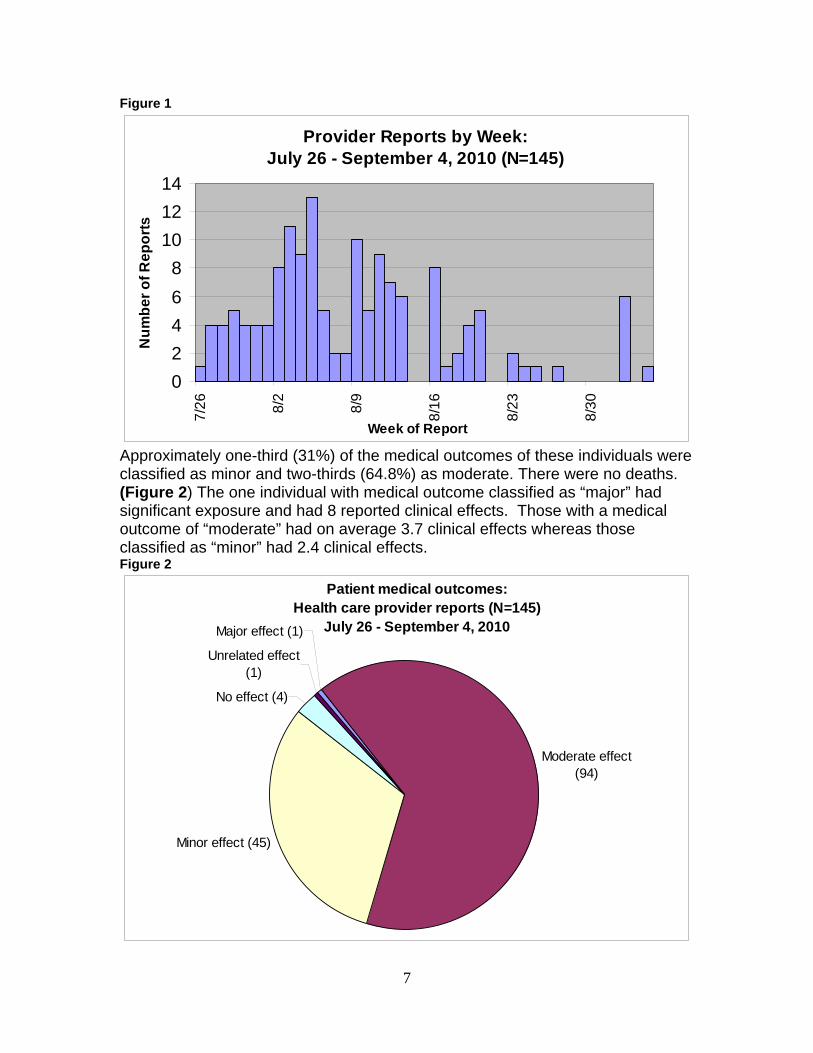
Figure 1
Provider Reports by Week: July 26 - September 4, 2010 (N=145)
0
2
4
6
8
10
12
147
/26
8/2
8/9
8/1
6
8/2
3
8/3
0
Week of Report
Nu
mb
er
of
Re
po
rts
Approximately one-third (31%) of the medical outcomes of these individuals were classified as minor and two-thirds (64.8%) as moderate. There were no deaths. (Figure 2) The one individual with medical outcome classified as “major” had significant exposure and had 8 reported clinical effects. Those with a medical outcome of “moderate” had on average 3.7 clinical effects whereas those classified as “minor” had 2.4 clinical effects. Figure 2
Patient medical outcomes:Health care provider reports (N=145)
July 26 - September 4, 2010Major effect (1)
Moderate effect (94)
Minor effect (45)
No effect (4)
Unrelated effect (1)
7
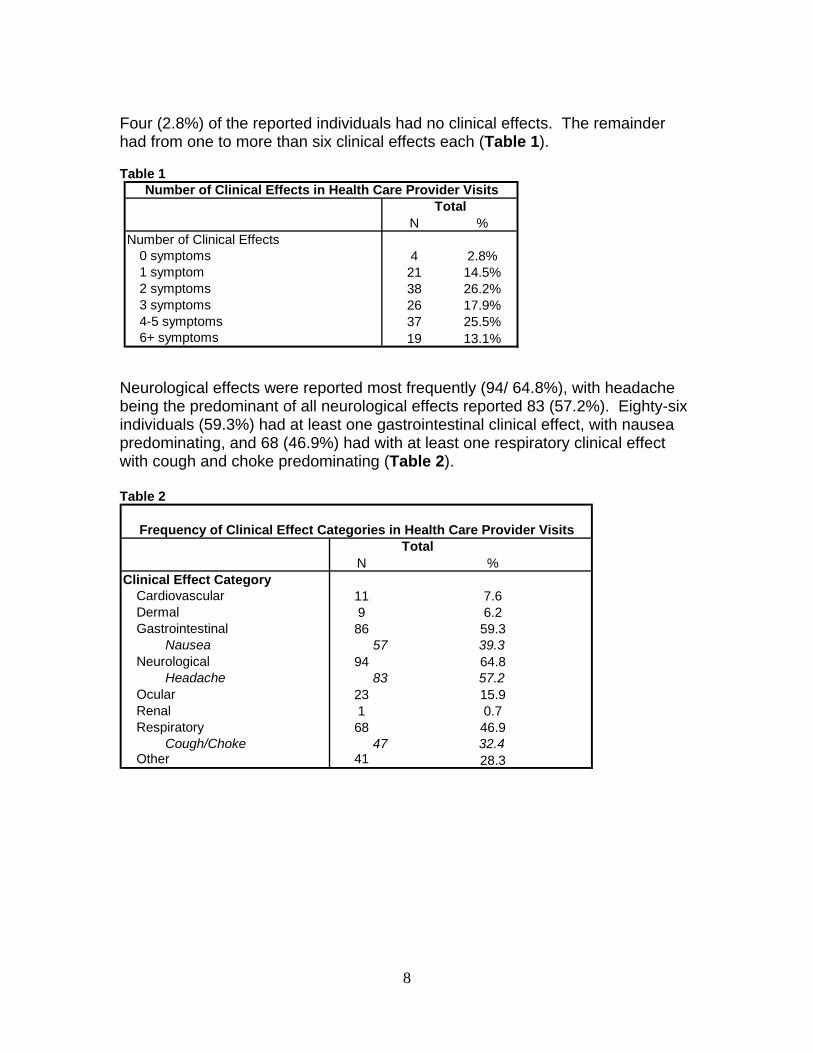
Four (2.8%) of the reported individuals had no clinical effects. The remainder had from one to more than six clinical effects each (Table 1). Table 1
N %Number of Clinical Effects
0 symptoms 4 2.8%1 symptom 21 14.5%2 symptoms 38 26.2%3 symptoms 26 17.9%4-5 symptoms 37 25.5%6+ symptoms 19 13.1%
Number of Clinical Effects in Health Care Provider VisitsTotal
Neurological effects were reported most frequently (94/ 64.8%), with headache being the predominant of all neurological effects reported 83 (57.2%). Eighty-six individuals (59.3%) had at least one gastrointestinal clinical effect, with nausea predominating, and 68 (46.9%) had with at least one respiratory clinical effect with cough and choke predominating (Table 2). Table 2
N %Clinical Effect Category
Cardiovascular 11 7.6Dermal 9 6.2Gastrointestinal 86 59.3
Nausea 57 39.3Neurological 94 64.8
Headache 83 57.2Ocular 23 15.9Renal 1 0.7Respiratory 68 46.9
Cough/Choke 47 32.4Other 41 28.3
Frequency of Clinical Effect Categories in Health Care Provider Visits Total
8

B. Community and Workplace Surveys Methods: Four communities along the Talmadge Creek and Kalamazoo River and one small workplace were identified (from calls to the toll-free number and the CCPHD) as having multiple reports of adverse health effects and concerns about oil spill impacts. A door-to-door health survey was conducted by MDCH and the CCPHD in each community. The community survey obtained information on whether the household had, or were planning to, relocate because of the spill; observations about the intensity and duration of the odor since July 25; and, for all members of the household, information about chronic/pre-existing health conditions that made them sensitive to fumes or odors. They were also asked about new or exacerbated health symptoms after the spill event. After the first survey, a question was added to assess whether those who had symptoms had seen a physician for their symptoms. For the most part, answers were provided by the person answering the door for all household members. Answers were provided in an open-ended format. Where no one was home, information was left at the door; in the second, third, and fourth communities, including a fact sheet from EPA on the oil spill and a cover letter that invited someone in the household to call a toll-free number at MDCH to answer the survey questions by telephone. In order to have an approximate measure of socio-economic status for each of these communities, a local realtor was asked to provide his estimate of the range of home prices that could be expected in each community. The first health survey was conducted on August 6, 11 days after the spill was reported, in a neighborhood approximately 14 miles downstream from the spill origin and immediately adjacent to an area of wetland fed by the Kalamazoo River. Previously, on August 2, the CCPHD had visited the neighborhood to assess the need for temporary relocation of individuals concerned about the odors and their health, and to give information about how Enbridge would cover the costs of that relocation. However, information about health symptoms was not requested at that initial visit. Home prices in the neighborhood, which is referred to as “Neighborhood” in the tables, are estimated to range from $500 to $15,000. The second community survey was conducted 16 days after the spill in a subdivision approximately two miles downstream. Home prices in the “Subdivision” are estimated to range from $120,000 to $325,000. The third community, referred to as “Spill Site” in the tables, was surveyed in two parts, 22 and 24 days after the spill. This community included the homes surrounding the immediate area on the Creek where the pipeline burst. It was the only community where a voluntary evacuation notice had been issued, due to air sampling indicating elevated levels of benzene– a potential concern for long-term health. Each of these two surveys took place within 24 hours after the
9

evacuation notice was lifted for that area. A environmental contractor accompanied the survey team and offered air monitoring outside and inside homes to each of the interviewees, using a real-time monitoring instrument. Home values in this community are estimated to range from $75,000 to $350,000. The fourth survey occurred 23 days after the spill in a small village of approximately 80 homes, situated directly on the river about five miles downstream from the spill’s origin. Home values in the “Village” are estimated to range from $10,000 to $125,000. For comparison purposes, a door-to-door survey was conducted 25 days after the spill in a community approximately fifteen miles stream upstream of the spill, in order to obtain information on the occurrence of health symptoms in the previous four weeks. The six neighborhoods surveyed in this community were on the Kalamazoo River; they were similar to the exposed communities in demographics and the range of home prices, encompassed homes valued from $5,000 to $225,000. All 12 workers at the small workplace located a little less than one mile northeast of the confluence of Talmadge Creek and the Kalamazoo River were interviewed using the same open-ended format as the community surveys. Results Community Surveys Table 3 shows the survey completion rates by community and in the Comparison community. Overall, 201 (59.6%) of the 337 homes visited provided information for a total of 550 household members in the exposed communities, and 51 (27.9%) of the 183 homes surveyed in the Comparison community provided information on 137 individuals. The average number of household members ranged from 2.5 to 3.1 in the exposed communities and was 2.7 in the Comparison community. Table 3
Neighborhood Subdivision Spill Site Village Total Comparison
Total Number of Homes Visited 78 121 55 83 337 183
Number of Homes that Completed Survey 45 75 37 44 201 51
Number of Homes that Refused Survey 0 0 0 1 1 18
Number of Homes with No One Home 33 46 18 38 135 114
Percentage of Homes Surveyed 57.7% 62.0% 67.3% 53.0% 59.6% 27.9%
Number of Individuals with Survey Information 117 233 92 108 550 137
Average Number of Individuals per Household 2.6 3.1 2.5 2.5 2.7 2.7
Survey Completion by Community
In terms of race/ethnicity, all communities were almost entirely white. There were some differences between communities in other demographics. The community at
10

the spill site was on average older, had fewer children, and was over 50% male, in contrast to the other three exposed communities and the Comparison group. Smoking prevalence, which was asked in all surveys except at the Neighborhood, was notably different, with the two communities with more expensive homes reporting much lower smoking rates in adults (Spill site: 5.1%; Subdivision: 6.0%) than the other one (Village) at 20.7%. Smoking prevalence in the Comparison community was 19.8% (Table 4).
Table 4
Neighborhood Subdivision Spill Site Village Total Comparison
Gender (%)
Male 47.8% 44.2% 53.3% 46.3% 46.9% 45.3%
Female 52.2% 55.8% 46.7% 53.7% 53.1% 54.7%
Average Age (yrs) 32.1 35.8 48.9 41.9 38.4 39.1
Age Distribution (%)
0-7 yrs 13.9% 12.2% 2.2% 5.7% 9.6% 9.0%
8-17 yrs 15.6% 21.8% 13.0% 16.2% 17.9% 14.3%
18-30 yrs 20.0% 6.5% 6.5% 9.5% 9.95% 10.5%
31-50 yrs 28.7% 31.3% 16.3% 29.5% 27.85% 34.6%
51-65 yrs 18.3% 17.8% 43.5% 26.7% 24.0% 19.6%
66+ yrs 3.5% 10.4% 18.5% 12.4% 10.7% 12.0%
Missing (n) 2 3 0 3 8 4
Smoker (age 18 and older) not asked 6.0% 5.1% 20.7% 19.8%
Demographics and Smoking Profile by Community
The percent of residents that reported symptoms according to smoking status is shown in Table 5. A higher proportion of non-smokers reported no symptoms (39.6%) compared to smokers (25.0%). Similarly, a higher proportion of smoker reported 1 symptom and 4+ symptoms (39.3%, 10.7%), compared to non-smokers (26.8%, 5.4%). The proportion of residents that report 2-3 symptoms was very similar between smokers and non-smokers. Table 5
Yes No
Percent with Symptom 0 symptoms 25.0% 39.6% 1 symptom 39.3% 26.8% 2-3 symptoms 25.0% 28.2% 4+ symptoms 10.7% 5.4%
SmokerSymptoms by Smoking Status among Adults
Nearly all of the households in each of the four exposed communities reported noticing an odor since July 25, 2010 (Neighborhood: 100%, Subdivision: 97.3%, Spill Site: 97.2%, Village: 100%). In comparison, only a small minority of households in the Comparison community reported smelling an odor at any time after July 25 (15.7%).
11

Overall, 320 (58.2%) of the 550 individuals reported at least one new or exacerbated symptom after July 25 in contrast to 4.4% in the Comparison community. The frequency of symptoms varied by community. The Subdivision, which has homes more widely spread out from the river than any of the others, reported the lowest frequency (42.5%), and the Village had the highest (75.7%). By contrast, only 6 (4.4%) of the 131 individuals in the Comparison community reported any new or worsened symptoms in the timeframe following the spill (Figure 3). Figure 3
Percent of Individuals with Symptoms by Community
0.0%
10.0%
20.0%
30.0%
40.0%
50.0%
60.0%
70.0%
80.0%
Neighborhood Subdivision Spill Site Village Total Comparison
Community
Pe
rce
nt
Of the 320 individuals in the exposed communities who reported symptoms, 42.8% reported only one symptom, 44.7% reported 2-3 symptoms, and 12.5% reported 4 or more symptoms (Table 6). The proportion of exposed residents reporting symptoms was significantly greater than the proportion in the comparison community (p < .0001). Table 6
N % N % N % N % N % N %
Number/percent without any Symptoms 38 32.5% 134 57.5% 31 33.7% 27 25.0% 230 41.8% 131 95.6%
Number/percent with any Symptom 79 67.5% 99 42.5% 61 66.3% 81 75.0% 320 58.2% 6 4.4%
1 symptom 27 34.2% 49 49.5% 27 44.3% 34 42.0% 137 42.8% 5 83.3%
2-3 symptoms 37 46.8% 44 44.4% 28 45.9% 34 42.0% 143 44.7% 1 16.7%
4+ symptoms 15 19.0% 6 6.1% 6 9.8% 13 16.0% 40 12.5% 0 0.0%
Neighborhood Subdivision Spill Site Village Total Comparison
Frequency of Symptoms by Community
Headache was the most frequently reported symptom (34.5%) in all exposed communities, ranging from 25.3% in the Subdivision to 42.6% in the Village. This was followed by respiratory symptoms (e.g., breathing difficulty, cough) at 29.6% and gastrointestinal complaints (e.g., nausea and vomiting), 21.6% (Table 7). In the Comparison community, only 1 resident reported headache symptoms and
12
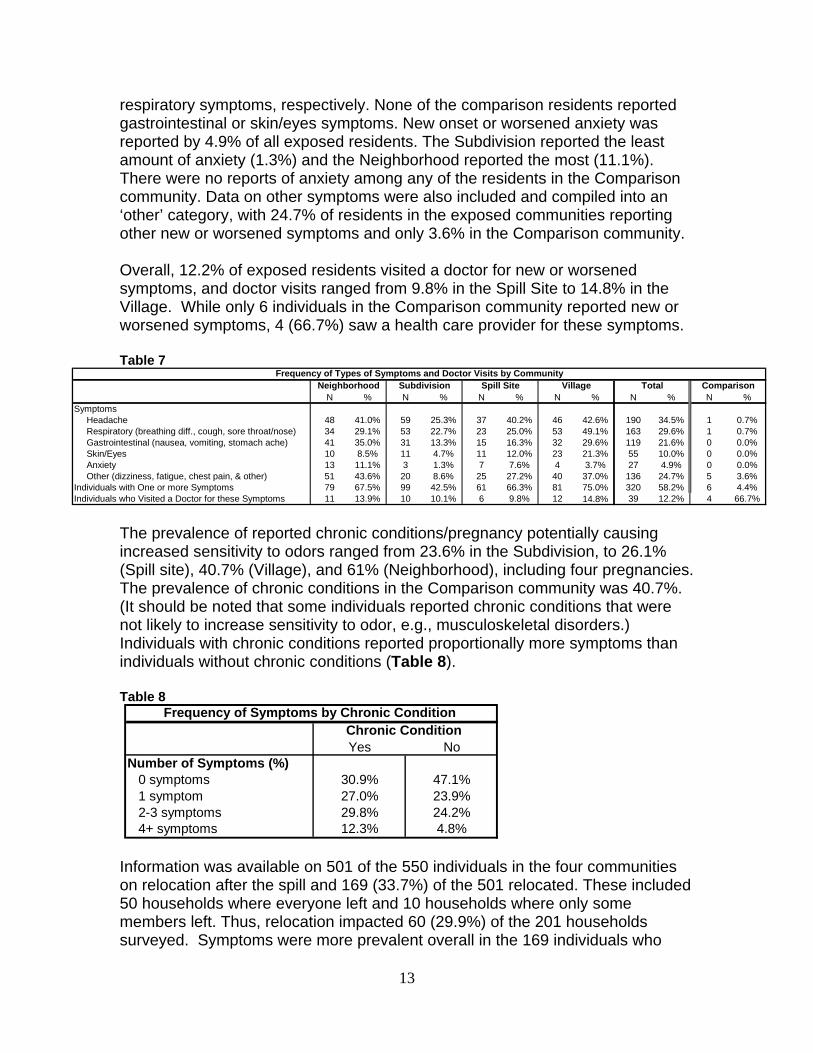
respiratory symptoms, respectively. None of the comparison residents reported gastrointestinal or skin/eyes symptoms. New onset or worsened anxiety was reported by 4.9% of all exposed residents. The Subdivision reported the least amount of anxiety (1.3%) and the Neighborhood reported the most (11.1%). There were no reports of anxiety among any of the residents in the Comparison community. Data on other symptoms were also included and compiled into an ‘other’ category, with 24.7% of residents in the exposed communities reporting other new or worsened symptoms and only 3.6% in the Comparison community. Overall, 12.2% of exposed residents visited a doctor for new or worsened symptoms, and doctor visits ranged from 9.8% in the Spill Site to 14.8% in the Village. While only 6 individuals in the Comparison community reported new or worsened symptoms, 4 (66.7%) saw a health care provider for these symptoms. Table 7
N % N % N % N % N % N %Symptoms Headache 48 41.0% 59 25.3% 37 40.2% 46 42.6% 190 34.5% 1 0.7% Respiratory (breathing diff., cough, sore throat/nose) 34 29.1% 53 22.7% 23 25.0% 53 49.1% 163 29.6% 1 0.7% Gastrointestinal (nausea, vomiting, stomach ache) 41 35.0% 31 13.3% 15 16.3% 32 29.6% 119 21.6% 0 0.0% Skin/Eyes 10 8.5% 11 4.7% 11 12.0% 23 21.3% 55 10.0% 0 0.0% Anxiety 13 11.1% 3 1.3% 7 7.6% 4 3.7% 27 4.9% 0 0.0% Other (dizziness, fatigue, chest pain, & other) 51 43.6% 20 8.6% 25 27.2% 40 37.0% 136 24.7% 5 3.6%Individuals with One or more Symptoms 79 67.5% 99 42.5% 61 66.3% 81 75.0% 320 58.2% 6 4.4%Individuals who Visited a Doctor for these Symptoms 11 13.9% 10 10.1% 6 9.8% 12 14.8% 39 12.2% 4 66.7%
Frequency of Types of Symptoms and Doctor Visits by CommunityNeighborhood Subdivision Spill Site Village Total Comparison
The prevalence of reported chronic conditions/pregnancy potentially causing increased sensitivity to odors ranged from 23.6% in the Subdivision, to 26.1% (Spill site), 40.7% (Village), and 61% (Neighborhood), including four pregnancies. The prevalence of chronic conditions in the Comparison community was 40.7%. (It should be noted that some individuals reported chronic conditions that were not likely to increase sensitivity to odor, e.g., musculoskeletal disorders.) Individuals with chronic conditions reported proportionally more symptoms than individuals without chronic conditions (Table 8). Table 8
Yes NoNumber of Symptoms (%) 0 symptoms 30.9% 47.1% 1 symptom 27.0% 23.9% 2-3 symptoms 29.8% 24.2% 4+ symptoms 12.3% 4.8%
Frequency of Symptoms by Chronic Condition Chronic Condition
Information was available on 501 of the 550 individuals in the four communities on relocation after the spill and 169 (33.7%) of the 501 relocated. These included 50 households where everyone left and 10 households where only some members left. Thus, relocation impacted 60 (29.9%) of the 201 households surveyed. Symptoms were more prevalent overall in the 169 individuals who
13
relocated (71.6%) than the 332 individuals who did not (50.9%). A greater percent of those with symptoms who relocated saw a physician (11.8%) than those who did not relocate (5.1%) (Table 9). Table 9
Number/percent without Symptoms 48 28.4% 163 49.1%
Number/percent with any Symptom 121 71.6% 169 50.9%
1 symptom 44 26.0% 77 23.2%
2-3 symptoms 58 34.3% 72 21.7%
4+ symptoms 19 11.2% 20 6.0%
Number/percent that Visited Doctor/ED 20 11.8% 17 5.1%
Relocated (n=169) Didn't Relocate (n=332)
Symptoms by Relocation Status
Workplace survey At the small worksite where the symptom survey was conducted, 100%* of the workers noted the odor. Eighty-three percent noted that the worst days for odor were early in the first week following the oil release (the week of July 26). The others did not identify the worst days.
92% said they still smelled the odor when they were interviewed, which was three weeks after the spill.
33% noted that they had pre-existing chronic health conditions that made them sensitive to fumes or odors.
92% noted a variety of new onset or worsened symptoms after the release, including: headache (92%), respiratory symptoms (33%); dizziness (50%); gastrointestinal symptoms (33%); fatigue (33%); eye, nose, throat irritation (75%); and anxiety (42%).
17% noted that they were planning to see a physician for these symptoms. C. Calls to the PCC from the public Methods As noted above, within a few days of the spill, individuals began making calls to the PCC with concerns about the oil spill, using the nationwide poison control toll- free number. Although the PCC toll-free number and its services were not publicized to the public in Calhoun and Kalamazoo Counties during the spill event, these calls were consistent with the understanding among the general public that poison centers are available to answer questions about chemicals, poisonings, and toxic exposures. All calls were logged according to PCC standard operating procedures. They were coded so that they could be identified
* Because of the small number of employees, numbers are not presented.
14

as related to the Enbridge spill event. Daily summaries of citizen calls were provided by the Michigan PCC to MDCH, in conjunction with the daily summaries of health care provider reports. Results Between July 26 and August 26, 41 calls were received by the PCC from individuals reporting health effects from exposure to the oil spill. No calls were received after August 26. Figure 4 shows the number of calls by day of call. Over half (51%) of the calls (21 of 41) were received in the first week of the spill; July 27 was the day with the greatest number of calls (N= 12; 29%). Figure 4
Calls from the Public to the Poison Control Center by Week, July 26 – August 26, 2010 (N=41)
0
2
4
6
8
10
12
14
7/26
7/30 8/3
8/7
8/11
8/15
8/19
8/23
Week of Call
Nu
mb
er
of
Ca
lls
The ages of the individuals for whom a call was made ranged from 1 month to 60 years, with a mean of 26 years. Twenty-three (57.5%) of the 40 reports that documented gender were female. The medical outcome classification assigned by the PCC for these calls included 39% with minor outcomes; 19.5% had possible minimal effects and 14.6% were classified with moderate effects (Figure 5). Nine (22%) individuals noted that they had seen a health care provider for their clinical effects, but no health care provider reports were received about these individuals.
15

Figure 5
Medical Outcomes: Calls from the Public to the Poison Control Center (N=41)
Moderate effect (6)
Minor effect (16)Minimal effect
(8)
Potentially toxic exposure (8)
Non-toxic exposure (1)
No effect (2)
D. Syndromic surveillance Methods The MDCH maintains a syndromic surveillance system designed to facilitate early and rapid detection and response to outbreaks that may be the result of bioterrorism, natural and/or emerging infectious disease, or other public health threats and emergencies. Real-time detection of significant increases in patients presenting with similar symptoms at designated Michigan hospital EDs is done through the use of statistical algorithms; these are applied to data obtained from hourly electronic searches through patient “chief complaints” in the electronic medical records. AAnn ““aalleerrtt”” iiss ttrriiggggeerreedd wwhheenn tthhee pprrooppoorrttiioonn ooff vviissiittss ffoorr ddeeffiinneedd ssyynnddrroommeess oorr ggeeooggrraapphhiicc aarreeaass eexxcceeeeddss tthhrreeee ssttaannddaarrdd ddeevviiaattiioonnss aabboovvee pprreeddiicctteedd vvaalluueess,, wwhhiicchh aarree bbaasseedd oonn hhiissttoorriiccaall ddaattaa.. MDCH identified those potentially associated with oil exposure, which included rash, neurological, respiratory, and gastrointestinal syndromes. In addition, MDCH added an ad hoc query in order to detect chief complaints in the ED that contained “oil” and/or “spill”. A limitation of this method, however, is that not all hospitals in the impacted communities participate in the MDCH ED syndromic surveillance system. MDCH also monitors over-the counter pharmaceutical sales from several hundred retail pharmacies throughout the state, using computer algorithms to detect statistically significant increases in daily sales of: anti-diarrheal and anti-fever medications, cough syrup and other respiratory medications; child
16
electrolytes; and thermometers; and related products. This system was continually monitored with attention to the communities within the area of the Enbridge oil spill. Results One “alert” was recorded in Kalamazoo County for rash several days after the spill. Otherwise there were no notable changes in the frequencies of syndromes of interest in the area compared to overall daily rolling averages and yearly comparisons. There were no notable increases in sales of over-the-counter pharmaceutical products; numbers of sales remained within typical levels for the season. III. Discussion MDCH and the impacted local health departments quickly established a multi-component public health surveillance system to assess and measure the health impacts associated with exposure to crude oil, its vapors, and/or its odors resulting from the Enbridge pipeline spill in July 2010. The surveillance system received 147 health care provider reports on 145 patients; identified 320 (58%) of 550 individuals with adverse health effects from four community surveys along the impacted waterways, and tracked forty-one calls that were placed to the poison center by the public. Headache, nausea, and respiratory symptoms were the predominant symptoms reported by exposed individuals in all reporting systems. These symptoms are consistent with the published literature and the Enbridge Material Safety Data Sheet regarding potential health effects associated with acute exposure to crude oil.5,6 A number of epidemiologic studies performed in the weeks or months following major oil spills have reported similar types of symptoms to those identified in our community surveys. Studies of acute health effects from an oil spill in Shetland, Scotland and Wales documented significant differences in similar sets of self-reported symptoms between exposed residents and control groups.7,8 The post-spill prevalence of headache in the exposed for these two studies was similar to our that in our community surveys (Shetland: 32%; Wales: 38%; Enbridge communities: 34.5%) but higher in their control groups than our Comparison group (Shetland: 8%; Wales: 14.1%; Enbridge: 0.7%). This pattern was similar for other symptoms. In a study of a spill near Karachi Pakistan, the frequency of one or more symptoms was markedly higher in both the exposed and the control groups (96% in exposed and 70% in controls) than in our populations.9 In a comprehensive review of all studies regarding the impact of oil exposure on human health, Aguilera et al. concluded that most studies “…provide evidence on the relationship between exposure and the appearance of acute physical, psychological, genotoxic and endocrine effects in the exposed individuals.”10
17

Symptom prevalence as determined by our community surveys was significantly greater overall in the exposed communities than in the comparison community upstream from the spill. At the same time, there were some differences between the four communities regarding symptom prevalence. These differences may be associated with differences in geographical proximity to the river or health risk factors, including prevalence of chronic health conditions and smoking, both of which are inversely associated with socio-economic status. Symptom prevalence was lowest in the community (the Subdivision) with the lowest smoking and chronic disease prevalence, and the highest home values; and it was highest in the “Neighborhood”, which had the highest chronic disease prevalence as well as the lowest home values. There are a number of potential biases and limitations to the data obtained using this surveillance system. Regarding health care provider reporting, it is very likely that there was a significant amount of under-reporting by clinicians, a common problem with public health surveillance systems based on health care provider reporting. Reasons for under-reporting may include: not making a diagnosis that associates the oil exposure (either to the oil itself or to odors from the spill) to the symptoms, lack of understanding of reporting requirements, or lack of compliance because of barriers (e.g., time, office staffing, or concerns about patient confidentiality). In the community surveys, there may have been response biases in the exposed communities associated with exaggerated reporting of symptoms, due to the considerable publicity surrounding the event and attendant legal issues. At the same time, there could have been underreporting of symptoms given the possibility that most affected individuals and households had relocated and were not at home when the door-to-door surveys were completed. Additionally, underreporting could have occurred because the respondents at the households were not completely familiar with the range of symptoms experienced by other household members about whom they provided information during the survey. The lower completion rates in the Village and Comparison communities may have been because the survey teams started earlier in the evening than at the other sites, and thus missed people not yet home from work. It is unknown how this might have affected results. However, the very low refusal rate in the exposed communities suggested that these individuals understood why they were being interviewed and that it may have been in their best interest to participate. There was a much higher refusal rate in the Comparison community than the exposed communities (15% vs. 0.5%). We did not determine the reasons for refusing and therefore we do not know how this would have biased results from the comparison community survey. It could have reflected that there was no self-motivation for individuals in the Comparison community to participate other than general concern and good will, and thus some people were not willing
18
to take the time to talk with the interviewers, but there could have been a variety of reasons. The survey of the workers in the one small worksite should be interpreted with caution. Results are subject to the instability of small numbers and there are no comparison data by which to judge the significance of the findings. Additionally, like the community surveys, there are a number of factors that could have contributed to recall bias, resulting in over- or under-reporting of symptoms. Because these individuals worked closely together, individual responses could have been influenced by prior discussions and concerns about the release. Further, overstated reporting of symptoms could have resulted from the considerable publicity surrounding the event and attendant legal issues. On the other hand, the open-ended format of the questions, rather than a structured list of possible responses, could have resulted in individuals being less likely to remember and report on specific types of symptoms. A number of studies of the health effects of previous oil spills have focused on acute and chronic health effects to responders.11,12,13 Current surveillance of response workers in the Deepwater Horizon spill in the Gulf of Mexico is tracking all injuries and illnesses of response workers, not just illnesses associated with oil exposure.14 Our surveillance system, which was established to provide rapid detection of and response to acute health effects of oil exposure, was not designed to evaluate all injuries and illnesses, short or long term, in response workers. Other systems were in place within the Unified Command structure of the response to track all illnesses, injuries and “near-misses” among the response workers. Nevertheless, approximately 18% of the health care provider reports were of response workers experiencing health effects apparently associated with exposure to the oil. Mental health effects of disasters, including anxiety, post-traumatic stress disorder, and depression have been an area of particular concern. Studies following the Exxon-Valdes oil spill in Alaska15 and the Sea Empress in Wales6 found that post-spill prevalence of a number of psychiatric disorders was significantly higher in exposed populations than unexposed individuals. Likewise, there was a greater proportion of individuals with self-reported psychiatric symptoms in our exposed communities than our Comparison community (4.7% vs. 0%), but overall prevalence was much lower than other studies. Unlike some other studies, which used validated mental health survey methodologies, our survey included only an open-ended question about symptoms, thus psychological symptoms were captured only if volunteered. Therefore, our assessment may have not fully captured the mental health effects of the spill. Use of the PCC as the surveillance data center was an effective and responsive approach to the need for a rapidly functioning data collection and analysis system. Daily reports of numbers and types of reports were thus able to be provided by the PCC to the Command Center from where the spill response was
19
coordinated. The ED syndromic surveillance system was not notably sensitive, but this was not surprising because the hospital ED closest to the spill site does not participate in the system. Beyond the significance of the health data itself for documenting the health impacts of the spill, the value of the face-to-face encounters between public health officials and the families coping with feelings of ill health, plummeting home values, and anxieties about their safety should be noted. These personal encounters provided some assurance to families that their needs and concerns were being heard and provided public health with an in-depth understanding of the situation. Combining a rapid community needs assessment and a health assessment is an approach that is being used more and more frequently during disasters.16 Currently, the Centers for Disease Control and Prevention and the Council of State and Territorial Epidemiologists are organizing a series of trainings and workshops in “disaster epidemiology.”17 Results of these efforts will help inform future responses in Michigan to disasters. IV. Conclusion In response to concerns about acute health effects from exposure to spilled oil in this major disaster, state and local public health in Michigan quickly set up a multi-faceted public health surveillance system that included health care provider reporting, community surveys, calls from the public to the poison control center, and analysis of data submitted to the state’s syndromic surveillance system. In spite of the limitations noted above, these data appear to provide a reasonable picture of the oil spill’s acute health impacts, and these findings are consistent with other studies of oil spills. A number of aspects to the public health surveillance response are noteworthy for consideration by public health agencies that are refining their non-infectious disease surveillance emergency response plans. A multi-component surveillance system was necessary to support the
response. Chemical poisoning reporting regulations, which Michigan had put in place in
2007, were essential to support mandated health care provider reporting of oil-spill related illnesses.
Use of the poison center as the data repository for reports by health care providers was an innovation that was effective and efficient. Daily summaries from the poison center provided the responders and public health agencies with sufficient information to understand the magnitude of the actual on-going health impacts of the spill, rather than relying on rumors or anecdotes.
Epidemiologic competencies necessary for a quick response included survey design, data management, and analytic skills in descriptive epidemiology.
Having the surveillance response take place in the oil-spill’s Command Center, rather than public health offices at the state or county level, was
20
critical for ensuring that surveillance activities supported the daily needs of the Unified Command.
Acknowledgements: We thank the following individuals for their epidemiologic guidance and advice, interviewing, and data collection and management: Michigan Department of Community Health: Lana Ashley Jennifer Beggs, Michelle Bruneau, Lorraine Cameron, Jim Collins, Katy Gonzales, Ed Hartwick, Tiffany Henderson, Karen Krzanowski, Kim Kutzko, Tom Largo, Susan Manente, Monica Reeves, Abby Schwartz, David Wade, Robert Wahl, Calhoun County Public Health Department: Paul Makoski, Regina Crooks, Brigette Reichenbaugh, Karen Fulcher, Ryan Tetrault, Tim Wanner, Mick Shubert, Sandy Van Dorsten, Sue Hauxwell, Ophelia Garza, Lucia Yi, Rosiland Taylor, Dave Treat Kalamazoo County Health and Community Services Department: Richard Tooker (retired), Annie Wendt Michigan Poison Control Center: Cynthia Aaron, Bram Dolcourt Michigan State University: Joanna Kica We also thank Matthew Davis of Rosemary Davis Realtors, Marshall MI for providing home price estimates.
21

Appendix: Map of the oil spill in Michigan (source: EPA18)
22

23
References
1 Michigan Compiled Laws (MCL) 333.2631-2635 2 http://www.epa.gov/enbridgespill/index.html 3 Materials related to this notification are available at
. Accessed 8/24/2010. http://www.michigan.gov/mdch/0,1607,7-132-54783_54784-241680--,00.html
4 SAS Institute Inc. see . Accessed 11/18/2010 www.sas.com/software/sas95 Solomon GA, Janssen S. Health effects of the gulf oil spill. JAMA 2010; 10:1118-9. 2010doi:10:10.1001/jama.2010.1254.E1-2. 6 Enbridge Material Data Safety Sheet: Crude Oil. Available at http://www.calhouncountymi.org/ReferenceDesk/Forms/CCPHD_MSDS_Heavy_Crude.pdf. Accessed 9/20/2010. 7 Campbell D, Cox D, Crum J, Foster K, Christie P, Brewster D. Initial effects of the grounding of the tanker Braer on health in Shetland. BMJ 1993; 307:1251-5. 8 Lyona E, Mek J, Temple F, et al. Acute health effects of the Sea Empress oil spill. J Epidemiolog Community Health 1999;53:306-310. 9 Janjua NZ, Kasi PM, Hawaz H, et al. Acute health effects of the Tasman Spirit oil spill on residents of Karachi, Pakistan. BMC Public Health 2006. 6:84 doi:10.1 186/1471-2458-6-84. 10 Aguilera F, Mendez J, Pasaro E, Laffon B. Review on the effects of exposure to spilled oils on human health. J Appl Toxicol 2010. 30:291-301. 11 Morita A, Kusaka Y, Deguchi Y, et al. Acute health problems among the people engaged in the clean-up of the Nakhodka oil spill. Envir Res 1999.81:185-194. 12 Zock JP, Rodriquez-Trigo G, Pozo-Rodrigues F et al. Prolonged respiratory symptoms in clean-up workers of the Prestige oil spill. Am J Resp Crit Care 2007. 176:610-616. 13 Savits D, Engel LS. Lessons for study of the health effects of oil spills. Ann Intern Med. Ann Intern Med 2010; 153:540-541. 14 See http://www.cdc.gov/niosh/topics/oilspillresponse. 15 Palinkas LA, Petterson JS, Russeel J, downs MA Community patterns of psychiatric-disorders after the Exxon-Valdes oil-spill. Am J Psychiat 1993. 150:157-1523. 16 See http://www.bt.cdc.gov/disasters/surveillance/ 17 See http://www.cste.org/dnn/ProgramsandActivities/DisasterEpiWorkshop/tabid/404/Default.aspx 18 http://www.epa.gov/enbridgespill/images/enbridge_overview_map_20100806.pdf