acute cardiac decompensation: the role of mv massimo antonelli, md dept. of intensive care &...
TRANSCRIPT

Acute cardiac decompensation: the role of MV
Massimo Antonelli, MD
Dept. of Intensive Care & Anesthesiology
Università Cattolica del Sacro Cuore,
Rome-Italy

Effects of different ventilatory mode on cardiopulmonary performance
SPONT. PARTIAL ASSIST. TOTAL ASSIST. SPONT. PARTIAL ASSIST. TOTAL ASSIST. Mofied from Synder 1984
Mofied from Synder 1984

Effects PEEP on venous return
Fessler 1992Fessler 1992
PEEPPEEP
Basal conditionBasal condition

Interrelationship between the venous return and cardiac function
Pinsky R 1987 Pinsky R 1987
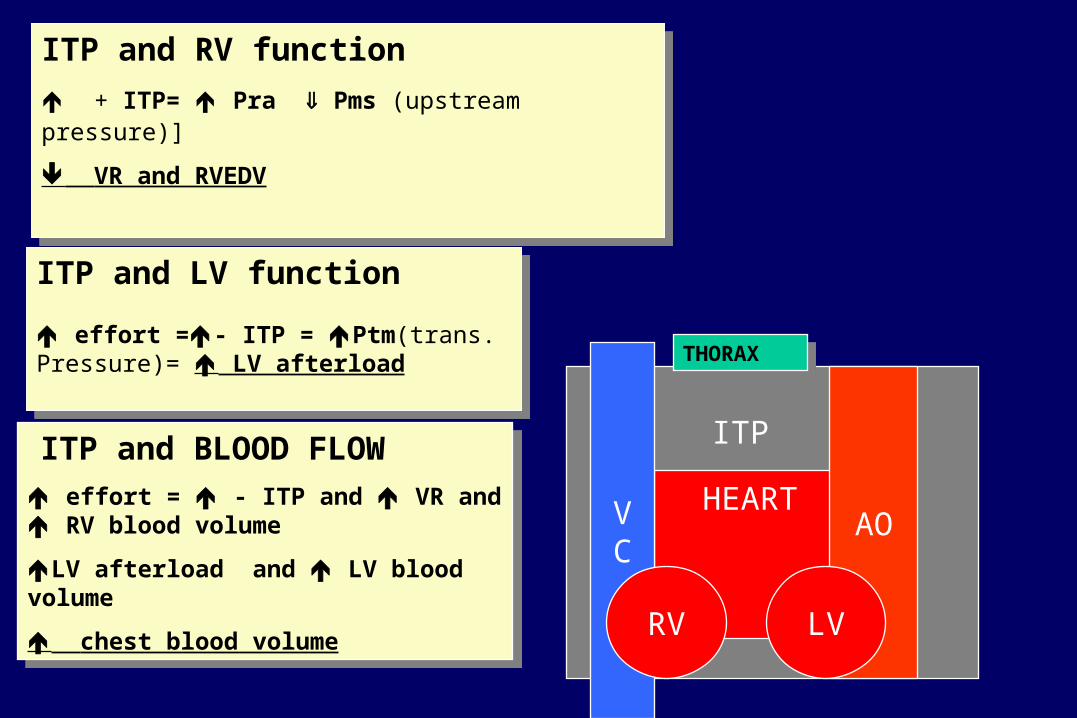
HEART
ITP ITP and BLOOD FLOW
effort = - ITP and VR and RV blood volume
LV afterload and LV blood volume
chest blood volume
ITP and BLOOD FLOW
effort = - ITP and VR and RV blood volume
LV afterload and LV blood volume
chest blood volume
THORAXTHORAX
VC
ITP and LV function
effort =- ITP = Ptm(trans. Pressure)= LV afterload
ITP and LV function
effort =- ITP = Ptm(trans. Pressure)= LV afterload
ITP and RV function
+ ITP= Pra Pms (upstream pressure)]
VR and RVEDV
ITP and RV function
+ ITP= Pra Pms (upstream pressure)]
VR and RVEDV
AO
RV LV

CARDIOVASCULAR EFFECTS of MV
ITP during CHF
pre-load due to the decrease of the venous returrn
Ptransm LV e afterload of LV
CI, SVi when PCWP > 12 mm Hg
Buda AJ NEJM 1979; Farden F NEJM 1981; T.D.Bradley et al. Am.Rev.Respir.Dis. 1992; 145: 377 M.T.Naughton e al. Circulation 1995; 91: 1725 F. Lenique 1994

Effect of ITP on CO in CHF patients
Pinsky 1987Pinsky 1987

Vt and (Vd/Vt) Va inspiratory effort load imposed by spontaneous
ventilation VCO 2
PaC02
Vt Va/Q inspiratory effort
V02
Pa02
PaC02 KVCO2
Va
PaC02 KVCO2
Va
How does ABG improve ?How does ABG improve ?

Effects of MV during CPE

TRATTAMENTO
CPAP/IPPVCPAP/IPPV
Net filtration =LpS x [(Pcap - Pif) - s(cap - if)]

LV failureLV failure
Pulmonaryedema
Pulmonaryedema
Pulmonary compliance
Pulmonary compliance
Airwayresistance
Airwayresistance
NegativeIntrathoracic
Pressure Swing
NegativeIntrathoracic
Pressure Swing
Work of
breathing
Work of
breathing
CO CO
PaO2 PaO2
Respiratory muscle fatigue
Respiratory muscle fatigue
DaO2 DaO2

LV failureLV failure
Pulmonaryedema
Pulmonaryedema
Pulmonary compliance
Pulmonary compliance
Airwayresistance
Airwayresistance
NegativeIntrathoracic
Pressure Swing
NegativeIntrathoracic
Pressure Swing
LV transmural pressure
LV transmural pressure
O2Cost of breathing
O2Cost of breathing
LV afterload LV afterload
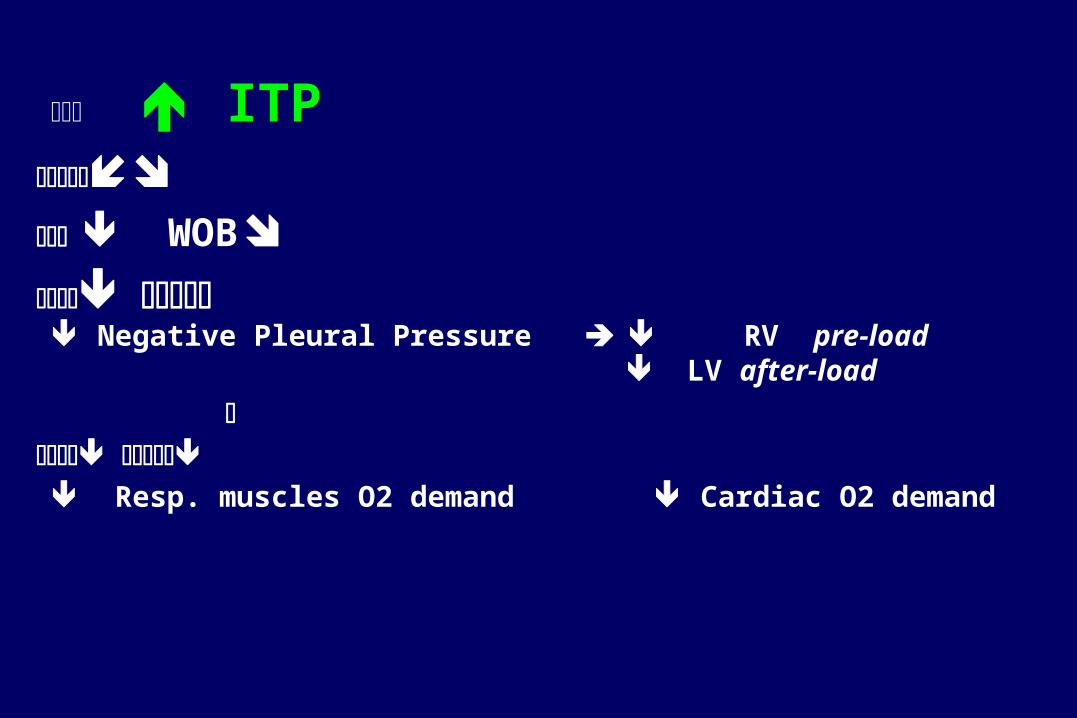
ITP WOB
Negative Pleural Pressure RV pre-load
LV after-load
Resp. muscles O2 demand Cardiac O2 demand

R esolution T im e*30(IQ R 15-53) m in
1(5% ) ET I
19 P ts. N IPSV (FM)
R esolution T im e*105(IQ R 50-230) m in
6(33% ) ET I
18 P ts S ta nda rd MT
P<0.037
Masip, Lancet, 2000;356:212640 patients with CPE 3 patients withdrawn
P<0.002
*Time needed for SAT >96% and RR<30b/min

NPPV plus SMT
• One randomized controlled trials• Case Series and Case Reports (1989-1996)
22 patients. 8 (36.3%) required intubation

NPPV plus SMT vs SMT Hoffmann B* 1999 (29 pts) vs. Rusterholtz T °1999 study (26 pts)
• *PSV 12 to 24 (mean 16,6)* plus Peep 2 to 8 (mean 5.5) cmH20 vs. °PSV 20.54.7° cmH20 plus Peep 3.5 2.3 cmH20
• Sa02 73.8 11* vs 8412°; PaC02 6218.5* vs 54.2 15°; pH 7.22 0.1° vs 7.25 0.11*
• 1 pts reqired intubation ( 3.4%)*• 5 pts required intubation (19.2%)°

NIPPV vs SMT compared to NIPPV vs CPAP
Hoffmann and Rusterholtz studies (55pts)* vs Metha study (27 pts)°
• 6 pts were intubated (11%)*
• 2 pts were intubated (7%)°

NIPPV plus SMT vs CPAP and SMT
Mehta SJ, Gregory D, Woolard RH, et al. Randomized prospective trial of bilevel versus continuous positive airway pressure in acute pulmonary edema.
Crit.Care Med.1997; 25(4):620-28.
Pang D Chest 1998Pang D Chest 1998

NPPV plus SMT vs CPAP plus SMT
Mehta S et al. Crit. Care Med. 1997
• no differences between CPAP and NPPV in the need for intubation and mortality
• MI 71% (NIPPV) vs il 31% (CPAP)

CPAP vs BiPAP
BiPAP CPAP
• FC
• FR
• Ph
• PaCO2
• Dyspnea score (30 min)(p<0.05)
Mehta S et al. Crit. Care Med. 1997, 25, 4
• FR
CPAP plus SMT vs NIPPV plus SMTMehtaMehta S et al. S et al. Crit Crit. Care. Care Med Med. 1997. 1997
NIPPV (14pts)* CPAP (13pts)
FC
FR
FR
Ph
PaCO2
Dyspnea score (30 min) (p<0.05)
FR
Pang D Chest 1998Pang D Chest 1998

CPAP plus SMT vs NIPPV plus SMT Mehta S et al. Crit. Care Med. 1997
• no differences between CPAP and NIPPV in the need for intubation and mortality
• MI occurred in 71% (NIPPV) vs il 31% (CPAP) even though baseline differences showed a trend toward more patients with chest pain in the NIPPV group vs CPAP group.
Pang Chest 1998Pang Chest 1998

Randomized Studies: Hypoxiemic ARF timingEarly=to prevent (1) and established=to treat (2)
Hypox.ARF
Yr
Timing
Level of Evidence
Interf Type
Mode of MV
No.
NPPV
Outcome Measure
Wysocki et al., Chest
1995 1 I F PSV + PEEP 21 ETI, surv
Antonelli et al., NEJM
1998 2 I F PSV + PEEP 32 ABG, ETI, LOS, surv
Confalonieri et al.,AJRRCCM
1999 1 I F PSV + PEEP 28 ABG, ETI, LOS, surv
Antonelli et al., JAMA
2000 1 I F PSV + PEEP 20 ABG, ETI, LOS, surv
Martin et al., AJRCCM
2000 1 I N IPAP +EPAP 14 ETI, surv
Hilbert et al., NEJM
2001 1 I F PSV + PEEP 26 ABG, ETI, LOS, surv
Auriant et Al CCM
2001 4 I N IPAP+EPAP 24 ABG, ETI, LOS, surv
Antonelli et Al CCM
2002 1/2 II H/F PSV+PEEP 99
ABG, ETI, LOS, surv
Antonelli et Al Int Care Med
2002 1/2 II F PSV+PEEP 354
ABG, ETI, LOS, surv
Carlucci et Al AJRCCM
2001 1 II F PSV+PEEP 15
ABG, ETI, LOS, surv
Girault et Al CCM
2003 1/2 II F Psv+peep 37
ABG, ETI, LOS, surv

Studies: Hypoxiemic ARF a total of 176 pts randomized to NIV
Level of evidence
No. of patients
Physiological improvement
Mortality ETI or failure criteria
Complications
Wysocki I
21 vs. 20 Only if
PaCO2 > 45
Antonelli I 32 vs. 32 Yes
Confalonieri I 28 vs. 28 Yes
Antonelli I 20 vs. 20 Yes
Martin I 14 vs. 11 Yes
Hilbert I 26 vs. 26 Yes
Auriant I 24 vs 24 Yes Antonelli II 255 Yes na Antonelli II 99 Yes na Carlucci II 15 of 108 Yes na na Girault II 37 of 124 Yes na na

Noninvasive vs Conv. Mechanical Ventilation: an epidemiologic survey: hypoxemic, hypercapnic ARF and CPE
Carlucci at al. (SRLF collaborative group), AJRCCM 2001;163:874-80 (prospective survey 3 wk, 42 ICU)
Mortality22%
NP11(10%)
LoS in ICU5.1(5.7) days
Duration of MV8(6.3) days
NIVN=108 (16%)
Mortality41%
NP72(19%)
LoS in ICU7.8(9.8) days
Duration of MV13.9(14.5) days
ETIN=581
P<0.002
P= 0.03
P<0.001
P<0.04
SAPSII 36(20) SAPSII 47(21)*
*P<0.001
689 pts MV689 pts MV
NIVNIV14% pts Hypoxemic ARF14% pts Hypoxemic ARF27% pts CPE27% pts CPE50% Pts HypercapnicARF50% Pts HypercapnicARF

0
20
40
60
80
100
120
CP
E (
n=
99)
Pu
lm c
on
t (n
=72
)
Inh
PN
(n
=8)
Ate
lect
. (n
=28
)
NP
(n
=18
)
AR
DS
p (
n=
27)
CA
P (
n=
38)
AR
DS
exp
(n
=59
)
Pu
lm f
ibr/
PE
(n
=5)
No
. o
f p
ati
en
ts
0
10
20
30
40
50
60
70
80
90
100
pe
rce
nta
ge
of
failu
res
N° patients % failures • 354 consecutive patients with hypoxemic ARF
• in 7 Centers (Europe and USA): • PaO2/FiO2 < 200 breathing O2 (Venturi)• RR>30, AC accessory muscles or paradoxical
abd. Mot.• COPD excluded
86 ARDS (P/F < 200, bil. Pulm.infiltrates, absence
of LVF)
• 108 (30%) failure• 264 (70%) success.
Antonelli et Al.
Intensive Care Med
2001;27:1718-28