activity manager reporting - ffrtraining.com manager reporting table of contents 1 ... report...
TRANSCRIPT

Activity Manager Reporting
Table of Contents 1 (May 2008)
Activity Manager Reporting
GETTING STARTED WITH SAP .................................................................................... 3
Logging on ................................................................................................................................................................. 3 Rules for Passwords ................................................................................................................................................... 5 Logging Off ............................................................................................................................................................... 7 Set up Maintenance ................................................................................................................................................... 8 Setting Expert Mode .................................................................................................................................................. 9 Open command window .......................................................................................................................................... 13 Navigating SAP ....................................................................................................................................................... 14 Using Easy Access Menu to select a task ................................................................................................................ 14 Using Transactions Codes to select a task ............................................................................................................... 15 Stop a Transaction ................................................................................................................................................... 15 SAP Icons ................................................................................................................................................................ 16
MANAGING YOUR FAVORITES.................................................................................. 18
Adding Favorites ..................................................................................................................................................... 18 Change Favorite Text .............................................................................................................................................. 24 Inserting Web pages ................................................................................................................................................ 27 Adding Files ............................................................................................................................................................ 29
THE BUSINESS WORKPLACE ................................................................................... 31
Purpose .................................................................................................................................................................... 31
INTRODUCTION ........................................................................................................... 37
WHAT IS CONTROLLING? .......................................................................................... 38
STANDARD MONTH-END REPORTS ......................................................................... 45
Executive Summary ................................................................................................................................................. 45 Self Sufficiency Summary ....................................................................................................................................... 50 Summary Operations Statement .............................................................................................................................. 51 Budget Performance Activity – New ....................................................................................................................... 53 UFM APF Support Expense Report ........................................................................................................................ 54 UFM APF Offset Report ......................................................................................................................................... 55
ANALYTICAL REPORTS (FIELD) ............................................................................... 56
Executive Summary Rolling 12 months .................................................................................................................. 56 Detailed Executive Summary Rolling 12 Months ................................................................................................... 57 Self-Sufficiency Summary (CCtr Grp) .................................................................................................................... 59 Actuals Self-Sufficiency UFM Report .................................................................................................................... 60 COGS ...................................................................................................................................................................... 60 Cashier Overage/Shortage ....................................................................................................................................... 62 Outstanding Purchase Orders .................................................................................................................................. 64 Purchase order with goods receipt, but no invoice .................................................................................................. 65
HR ADHOC QUERY ..................................................................................................... 67
BUDGETING REPORTS .............................................................................................. 69
Fixed Asset Depreciation ......................................................................................................................................... 69 NAF Budget by Category 12 months ...................................................................................................................... 74

Activity Manager Reporting (CO)
(May 2008) 2 Table of Contents
NAF Budget Current & Prior Yrs Plan .................................................................................................................... 75 12 Month Actual to Plan (Budget) ........................................................................................................................... 76 Self Sufficiency Budget ........................................................................................................................................... 77 Plan Self-Sufficiency UFM Report .......................................................................................................................... 78
INTERNAL ORDER REPORTS .................................................................................... 79
ASSET REPORTS ........................................................................................................ 86
Assets Under Construction (AUC) (using Flexible Asset Listing) .......................................................................... 86 Compare to Restricted Cash ................................................................................................................................ 87 Compare projects to budget ................................................................................................................................. 89
Unposted Asset Shells ............................................................................................................................................. 90
OTHER ACCOUNTING TOOLS ................................................................................... 93
SAP TERMS ................................................................................................................. 94
REPORTING AIDS ....................................................................................................... 96
Navigation on/off ..................................................................................................................................................... 96 Report Drilldown ..................................................................................................................................................... 96 Header Information .................................................................................................................................................. 98 Overview Vendor Invoice ...................................................................................................................................... 100 Export report to Excel ............................................................................................................................................ 106 Reports via E-Mail ................................................................................................................................................. 107
DOCUMENT TYPES ................................................................................................... 111
POSTING KEYS ......................................................................................................... 112
SAP LIST VIEWER (ALV) .......................................................................................... 113
Overview ............................................................................................................................................................... 113 Classic ALV vs. ALV Grid ................................................................................................................................... 113 Reports and ALV ................................................................................................................................................... 115 Line Item Displays and ALV ................................................................................................................................. 123 The Balance Sheet and ALV ................................................................................................................................. 139

Activity Manager Reporting
Getting Started with SAP 3 (May 2008)
Getting Started with SAP The user is required to log in and out of SAP with a unique ID and password. The first time the
user logs into the system, the password will be a generic password that the administrator will
provide. Depending on the connectivity, some users will need to access SAP via Citrix. If a
user needs to use Citrix, a separate user ID and password will need to be requested and created.
Please contact the region technical department to see which access is required.
Logging on
Double click the SAP Icon on the computer desktop. This will open a display window to
select the target system. Double click the icon for Production, see below.

Activity Manager Reporting (CO)
(May 2008) 4 Getting Started with SAP
The SAP logon screen will appear as shown below.
During the SAP logon process the TAB key is the quickest and most efficient way to toggle
between fields. When the TAB key is pressed, the cursor moves to the beginning of the next
field.
Logging on for the first time:
The system administrator will provide an ID and initial password. Enter the following
information into the logon screen:
FIELD DESCRIPTION
Client Should always be 100
User Enter user ID provided by administrator
Password Enter initial password provided by administrator

Activity Manager Reporting
Getting Started with SAP 5 (May 2008)
Note: While typing the password, asterisks display in the field as the cursor moves.
As a security measure, the system does not display what is typed.
The system will prompt the new user to create a new password. The new password dialog box is
displayed below.
Enter a new password using the rules that follow. Once the new password is entered, click the
green check mark or press “ENTER” on the keyboard.
Rules for Passwords
1. Passwords must have at least 8 characters.
2. Passwords ARE case sensitive.
3. Passwords must contain an upper case letter, a lower case letter, a special character, and at
least one number. Any combination of alphanumeric characters may be used.
4. Do NOT begin a password with any of the following: a question mark, an exclamation point
or a blank space.
5. Do NOT begin a password with three identical characters (for example, bbbat)
6. Do NOT begin a password with any sequence of three characters that is contained in the User
ID (for example, “smi”, if User ID is “sea_dsmi”
7. Do NOT use “password” for password
8. Do NOT use any of the last five passwords used (does not apply for first time log on)
THE USER WILL BE PROMPTED TO CHANGE THE PASSWORD EVERY 90 DAYS.
DO NOT USE A PREVIOUSLY USED PASSWORD WHEN PROMPTED TO CHANGE
THE PASSWORD TO A NEW ONE.

Activity Manager Reporting (CO)
(May 2008) 6 Getting Started with SAP
NOTE: SAP passwords ARE case-sensitive.
After logging on the SAP Easy Access Menu Screen will be displayed.

Activity Manager Reporting
Getting Started with SAP 7 (May 2008)
Logging Off
To log off SAP, follow these steps:
1. From the menu bar, choose System Log Off or click the in the upper right corner of
the window.
2. The Log Off dialog box appears (as shown here) informing the user that any data not saved
will be lost.
3. If the user is certain there is no data to save, click Yes. All the SAP sessions will close and
the system will return to the desktop Windows environment. The user is successfully logged
off the system.

Activity Manager Reporting (CO)
(May 2008) 8 Getting Started with SAP
Set up Maintenance
For first time users the initial SAP screen displays a picture that can be removed.
Go to menu path ExtrasSettings on the top toolbar. A box will display similar to the
following. Check the following boxes:
• Do not display picture (personal choice)
• Display technical names (adds the t-codes to the main menu).
Once the boxes have been checked, click the green checkmark , or press the enter key on
the keyboard.

Activity Manager Reporting
Getting Started with SAP 9 (May 2008)
Setting Expert Mode
To allow for more flexibility to change the layout of reports, the user must have the Expert Mode
active. This is a one-time setup.
Using T-code KSBB, open any report. The example uses the Budget Performance Activity
Report-New, which is under the Standard Month-end Reports node.
From the selection criteria screen use drop down menu EnvironmentOptions to set the user
report options.
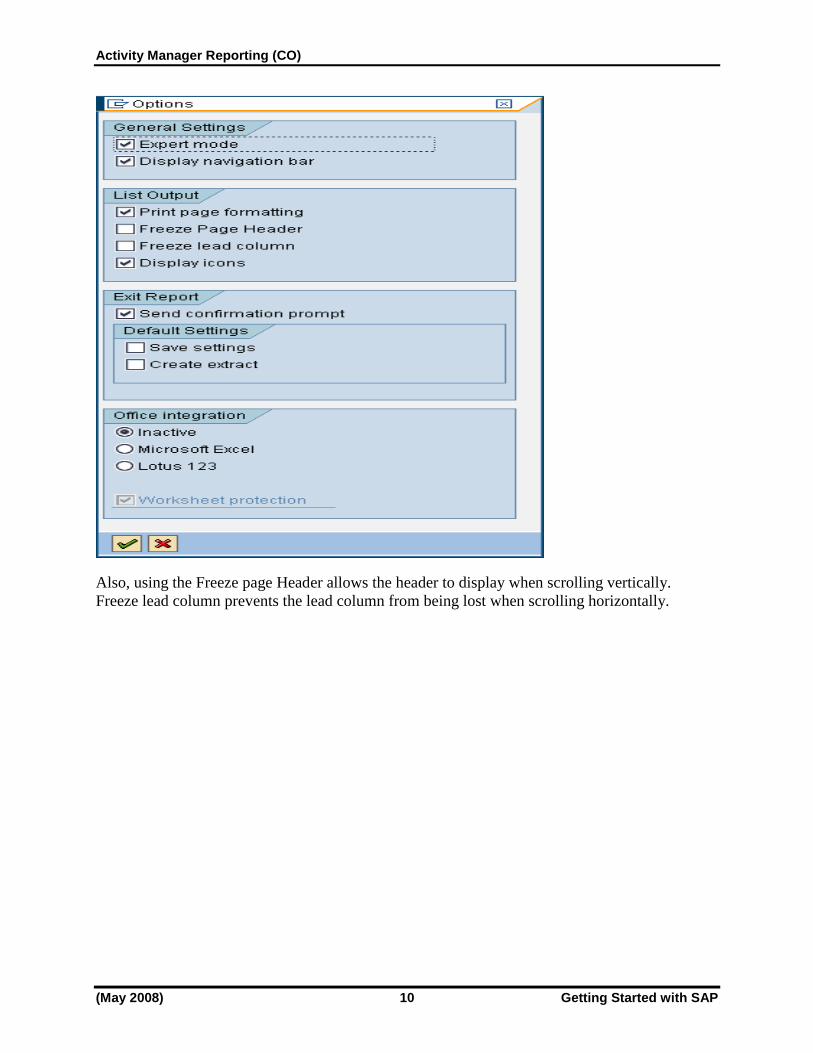
Once “Options” is clicked the following box will appear. Click the button to activate Expert
Mode. Always check the Print Page Formatting box to allow for the proper page breaks in the
printed report.
Activity Manager Reporting (CO)
(May 2008) 10 Getting Started with SAP
Also, using the Freeze page Header allows the header to display when scrolling vertically.
Freeze lead column prevents the lead column from being lost when scrolling horizontally.

Activity Manager Reporting
Getting Started with SAP 11 (May 2008)
This option is also available after the report processes by using the Options icon at the top of the
Report screen.
When complete, click the green check mark . This is a one-time setup and all reports will
display according to the fields chosen. Changes can be made as necessary using these same
steps on future reports.
The system will return to the selection criteria screen. Choose the report: Budget Performance
Activity-New under the Standard Month End Reports node.
This report displays the Budget (labeled Plan within SAP), the actual amount, the variance
between the two, the percentage of variance and the prior year amount. This is at least a three-
page report depending on the selection variables.

Activity Manager Reporting (CO)
(May 2008) 12 Getting Started with SAP
Once the specific report has been selected for viewing and after double clicking on the report line
description, the selection criteria screen will appear. Each report‟s selection criteria screen will
vary depending on which report the user wishes to view.
Enter the cost center group as defined by the program represented by the user or a single cost
center in the second option. Choose either a Cost Center Group or a Single Cost Center.
Values cannot be entered in both fields! Once the fiscal year, period and cost center group has
been entered, click the execute button . The system will post messages on the bottom tool
bar as the report is being generated. Once the report generates, the screen will display similar to
the following.
NOTE: Ranges of cost centers may also be entered in the Single Values, but
all cost centers in the group will be included. Cost centers within a
range can not be omitted. Multiple single values can be entered (not
in a range, by using the arrow facing right .
Change
defaults if
necessary
Enter highest
hierarchy
level

Activity Manager Reporting
Getting Started with SAP 13 (May 2008)
Open command window
The command window can be opened or closed by clicking the icon on the upper left
of the screen.
Once the command window is open the display will change to the following. The user can enter
the t-code in this box for the transaction to be used.
Activity Manager Reporting (CO)
(May 2008) 14 Getting Started with SAP
Navigating SAP
Within the SAP system, there is usually more than one way to perform a task:
1. The user can select the task from a series of menus and functions. With menus, the user can
easily find the application by opening folders on the Easy Access Menu without having to
memorize any special codes.
2. The user can enter a transaction code (T-code) in the command field. With transaction
codes, the user can go directly to a task without having to travel through several different
layers of menus.
3. Favorites menu, the user can create or combine functions into a custom user menu. A
custom menu allows the user to quickly find and choose a function/transaction, without
having to navigate through multiple levels of menus.
Using Easy Access Menu to select a task
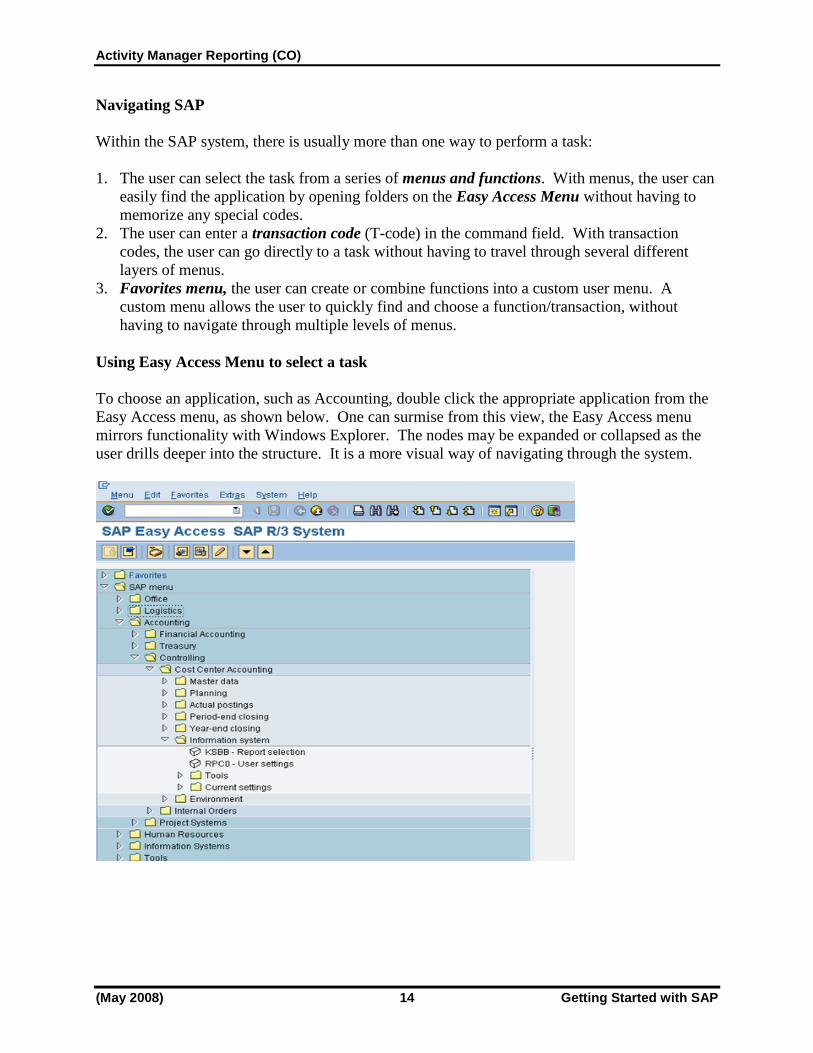
To choose an application, such as Accounting, double click the appropriate application from the
Easy Access menu, as shown below. One can surmise from this view, the Easy Access menu
mirrors functionality with Windows Explorer. The nodes may be expanded or collapsed as the
user drills deeper into the structure. It is a more visual way of navigating through the system.

Activity Manager Reporting
Getting Started with SAP 15 (May 2008)
Using Transactions Codes to select a task
A transaction code is a variable length character code that takes the user directly to the screen for
the task to perform. For example, when requesting a report from SAP CO, the user can put
transaction code KSBB – the transaction code for management reports, directly into the
command field and go to that transaction with one click on the green check mark
Transaction codes can be used to access tasks in other applications simultaneously while
remaining in the current transaction code. By using valid transaction codes, the user can go from
task 1 in management reports application to task 2 in general ledger accounts application.
Each function in SAP has a transaction code associated with it. A transaction code consists of
letters, numbers, or both. “KSBB” and “FBL3N” are both valid transaction codes. Enter
transaction codes in the command field.
Note: If the system is not at the Easy Access Menu, the transaction code will have to
be preceeded by /n (For example, the user is already in t-code FBL3N and
wants to change to KSBB. Simply enter /NKSBB in the command field.)
Stop a Transaction
Often when running a report, the system seems to grind and grind with no response. SAP has
provided an exit for those occasions. If the system seems to be non responsive after the execute
button has been clicked, go to the upper left corner of the screen and click to open the icon
illustrated in the diagrams below.
Command Field

Activity Manager Reporting (CO)
(May 2008) 16 Getting Started with SAP
Choose Stop Transaction.
By using this exit strategy the system will stop the executed transaction and return to the Easy
Access Menu.
SAP Icons
Depending on the task being performed, certain buttons will be available in the standard toolbar
and in the application toolbar. These buttons have various functions such as Save, Display, Enter
or Exit. The typical SAP application toolbar is shown below.
To choose a function with one of these buttons, simply click on the appropriate button.
Standard Toolbar
Application Toolbar

Activity Manager Reporting
Icon Identifiers 17 (May 2008)
Icon Identifiers
Enter
Back one Screen
Cancel
Exit
Execute
Overview
Previous and Next Pages
Save/Post
Header Information
Start new Session
Export Report
Help Icon
SAP Options Icon

Activity Manager Reporting (CO)
(May 2008) 18 Managing Your Favorites
Managing Your Favorites Adding Favorites
One of the more productive ways of working within SAP is to use the Favorites procedure.
Generally a user processes the same T-codes over and over. SAP has a built-in method of
gathering all of these procedures into one area labeled Favorites. This allows the user to find
their T-code easily without looking for it in the menus or memorizing it.
There are different methods on adding favorites to a user ID. The user can choose which method
they feel comfortable using.
1) Insert Transaction
On the main menu in SAP click on Favorites>Insert Transaction

Activity Manager Reporting
Managing Your Favorites 19 (May 2008)
Enter the T-code and then click on the green check.
Continue with this process to add more T-codes.
For Activity Managers, the following T-codes are recommended:
KSBB -Cost Center Reports
KS03 -Display Cost Center
KSH3 -Display Cost Center Group
KP06 -Budget Changes
ART0 –Asset Accounting Reports
AS03 –Display Asset
FBL3N-G/L Account Line Item Display
FB03 -Display Document
F.99 -Accounts Receivable Reports
F.98 -Accounts Payable Reports
ME2N-Purchasing Documents by Document Number
Enter the T-
code
Click on the
green check
mark

Activity Manager Reporting (CO)
(May 2008) 20 Managing Your Favorites
2) Drag and Drop
If the user finds a T-code in a menu, it can be added by dragging and dropping it under the
Favorites folder.

Activity Manager Reporting
Managing Your Favorites 21 (May 2008)
3) Add Manually
If the user finds a T-code in the menu, it can be added by right mouse clicking and clicking on
„Add to Favorites‟.
Highlight the favorite and
right mouse click. Click on
„Add to Favorites‟.

Activity Manager Reporting (CO)
(May 2008) 22 Managing Your Favorites
Once your favorites have been added, the user will be able to access the T-codes easily. The
favorites can be saved as a raw list like below, or folders can be added to organize the favorites.

Activity Manager Reporting
Managing Your Favorites 23 (May 2008)
Inserting Folders
If a user has several T-codes, folders can be added to organize. This is up to the user. Folders do
not have to be created. To add a folder, click on Favorites>Insert folder. The user can then drag
and drop the T-codes into the appropriate folders.
Make sure your cursor
is highlighting what
you want the folder to
be placed under.
Click on Favorites>Insert folder.
Enter a folder name and click on
the green check mark.
Activity Manager Reporting (CO)
(May 2008) 24 Managing Your Favorites
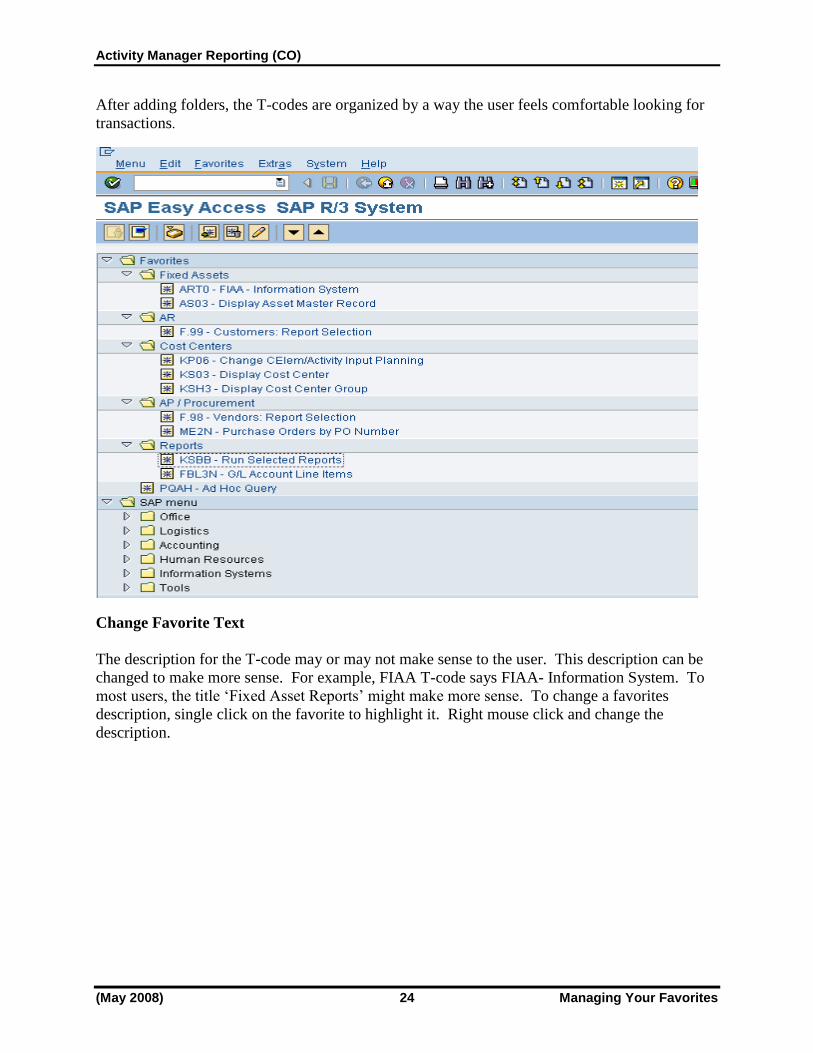
After adding folders, the T-codes are organized by a way the user feels comfortable looking for
transactions.
Change Favorite Text
The description for the T-code may or may not make sense to the user. This description can be
changed to make more sense. For example, FIAA T-code says FIAA- Information System. To
most users, the title „Fixed Asset Reports‟ might make more sense. To change a favorites
description, single click on the favorite to highlight it. Right mouse click and change the
description.

Activity Manager Reporting
Managing Your Favorites 25 (May 2008)
Enter a text that is more meaningful.
Enter a description and then click
on the green check mark.

Activity Manager Reporting (CO)
(May 2008) 26 Managing Your Favorites
The text will change.
The text was
changed

Activity Manager Reporting
Managing Your Favorites 27 (May 2008)
Inserting Web pages
There are several web pages that users have to refer to while conducting their job. SAP allows
URL addresses to be added as favorites. Highlight the folder that the URL address should go
under and click on Favorites>Add other objects.
Double click on Web address or file.
Click on
„Web address
or file‟
Activity Manager Reporting (CO)
(May 2008) 28 Managing Your Favorites
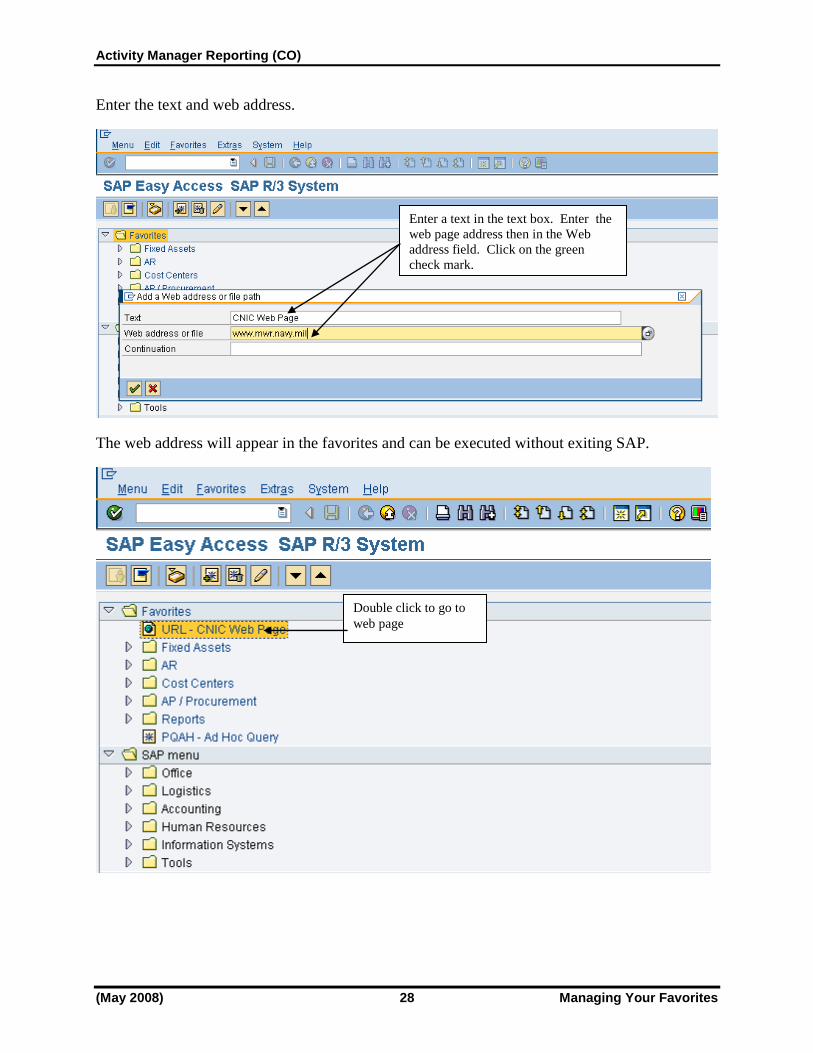
Enter the text and web address.
The web address will appear in the favorites and can be executed without exiting SAP.
Enter a text in the text box. Enter the
web page address then in the Web
address field. Click on the green
check mark.
Double click to go to
web page
Activity Manager Reporting
Managing Your Favorites 29 (May 2008)
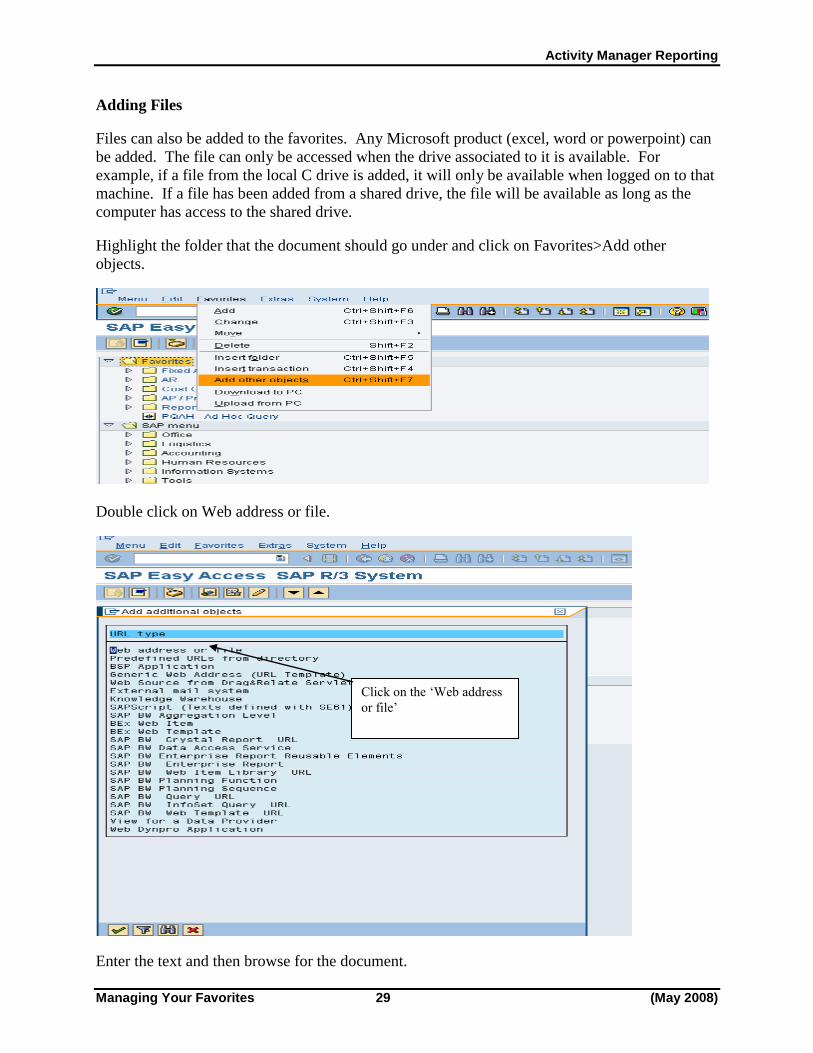
Adding Files
Files can also be added to the favorites. Any Microsoft product (excel, word or powerpoint) can
be added. The file can only be accessed when the drive associated to it is available. For
example, if a file from the local C drive is added, it will only be available when logged on to that
machine. If a file has been added from a shared drive, the file will be available as long as the
computer has access to the shared drive.
Highlight the folder that the document should go under and click on Favorites>Add other
objects.
Double click on Web address or file.
Enter the text and then browse for the document.
Click on the „Web address
or file‟

Activity Manager Reporting (CO)
(May 2008) 30 Managing Your Favorites
The document is now available under the Favorites folder.
Enter a text and then use
the browse functionality to
search for the document.
Click on the green check
mark.
Double click on
the document to
launch it.

Activity Manager Reporting
The Business Workplace 31 (May 2008)
The Business Workplace Purpose
One of the many features of the SAP environment is The Business Workplace in which every
user can carry out their share of the business and communication processes in the enterprise. It is
here where the user is able to create, edit and send and receive messages and documents. This
process is enabled from entirely within the SAP environment without the necessity of going
outside the system. This part of The Business Workplace is called SAP Mail and is, in fact, an
internal e-mail system.
The Business Workplace has six working environments for processing documents and messages.
The working environments are as follows and are flagged with symbols.
Working Environment Description
Inbox Under Documents, you find all the documents sent
to you and their resubmissions. Under Unread
Documents, you will find only those documents
which you have not yet read. (they are, however,
displayed in the lower right preview window).
Outbox Under Documents, you will find an overview and
other information about the documents sent to you.
Resubmissions Under Documents, you will find the documents that
are to be resubmitted to the user‟s inbox at a later
date.
Private Folders Folder structure that you create yourself to manage
documents, lists, messages, etc.
Shared Folders Folder structure for publishing and/or managing
information on an enterprise or group-specific basis.
Subscribed Folders The folders that you subscribe to are listed here.
HQ does not support this function at the present
time.
Trash Folder Deleted folders, documents, lists and messages are
stored here temporarily and you have the option of
reversing the deletion.

Activity Manager Reporting (CO)
(May 2008) 32 The Business Workplace
The entry into any personal workplace is through opening SAP Easy Access Menu Tree as
shown below:
SAP Menu>Office>SBWPWorkplace
The individual working environments are shown after expanding the Workplace tree.
Further expansion of the tree shows the individual factors that make up the Inbox, for example.

Activity Manager Reporting
The Business Workplace 33 (May 2008)

Activity Manager Reporting (CO)
(May 2008) 34 The Business Workplace
At the present time, the Workflow procedures are not enabled. The Business Workplace is being
used to rapidly communicate with those users who have a need to know specific process steps,
updates and other information pertaining to their roles within the SAP system.
The previous screen shot shows the Business Workplace. The menu tree on the left allows quick
and immediate access to the documents. The upper right window is a listing of the documents
and the lower right is a preview window of the document that has the focus in the window above.
By double-clicking on the document title, the entire document is opened and any attachments
made available to the user.

Activity Manager Reporting
The Business Workplace 35 (May 2008)
To create a document to be sent through the SAP mail system, click on the new message icon on
the application toolbar.
Clicking on this icon opens a window that allows the user to create, edit and attach documents to
the message they wish to send within the SAP mail system.
Activity Manager Reporting (CO)
(May 2008) 36 The Business Workplace
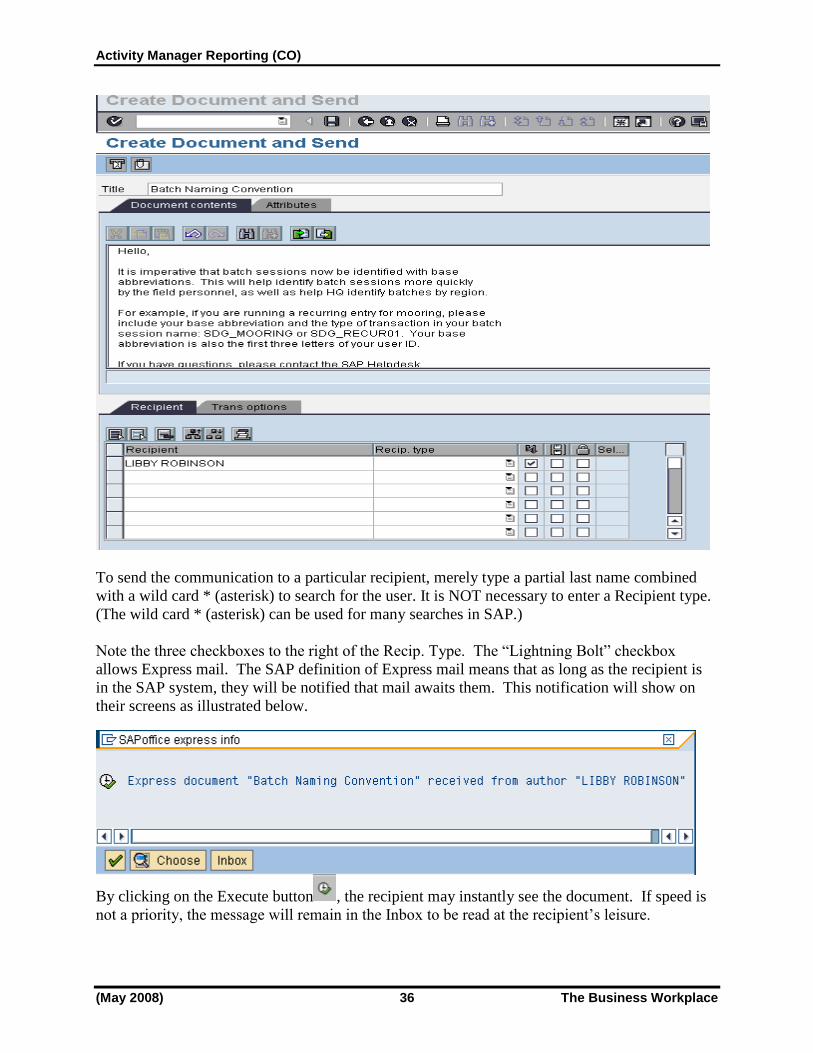
To send the communication to a particular recipient, merely type a partial last name combined
with a wild card * (asterisk) to search for the user. It is NOT necessary to enter a Recipient type.
(The wild card * (asterisk) can be used for many searches in SAP.)
Note the three checkboxes to the right of the Recip. Type. The “Lightning Bolt” checkbox
allows Express mail. The SAP definition of Express mail means that as long as the recipient is
in the SAP system, they will be notified that mail awaits them. This notification will show on
their screens as illustrated below.
By clicking on the Execute button , the recipient may instantly see the document. If speed is
not a priority, the message will remain in the Inbox to be read at the recipient‟s leisure.

Activity Manager Reporting
Introduction 37 (May 2008)
Introduction This manual is designed to give the Activity Manager a general overview of basic navigating
within SAP as well as how to execute financial reports in SAP. The Controlling Reports display
in a standard, functional format; but are quite flexible and user friendly. Users are encouraged to
try different criteria to obtain reports that meet requirements as needed. Users are also
encouraged to run reports as often as needed, not just at the end of the month.
If a report is not discussed in this manual, please contact the SAP HelpDesk for assistance, if
necessary.

Activity Manager Reporting (CO)
(May 2008) 38 What is Controlling?
What is Controlling? The Controlling module (CO) in SAP deals with the responsibility aspect of financial
accounting. No actual postings are made in Controlling, instead all transaction information flows
to Controlling through the other modules of SAP. The Controlling module provides the most
flexible business income and expense reporting for program managers.
At the core of Controlling is the cost center, which represents a location where revenues and
expenses originate. Cost centers are then grouped in various ways, via hierarchies, to facilitate
management review.
Financial Accounting
Assets Liabilities Revenues
Expenses
Cost Elements
Controlling
Activity Manager Reporting
What is Controlling? 39 (May 2008)
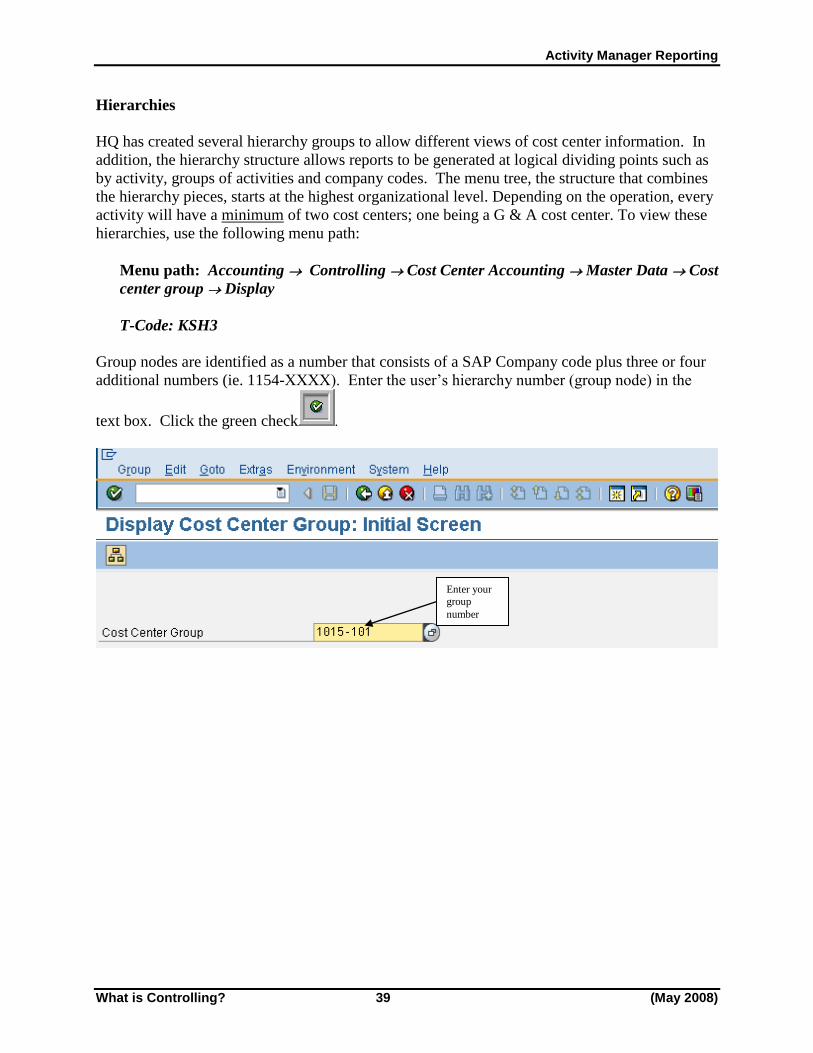
Hierarchies
HQ has created several hierarchy groups to allow different views of cost center information. In
addition, the hierarchy structure allows reports to be generated at logical dividing points such as
by activity, groups of activities and company codes. The menu tree, the structure that combines
the hierarchy pieces, starts at the highest organizational level. Depending on the operation, every
activity will have a minimum of two cost centers; one being a G & A cost center. To view these
hierarchies, use the following menu path:
Menu path: Accounting Controlling Cost Center Accounting Master Data Cost
center group Display
T-Code: KSH3
Group nodes are identified as a number that consists of a SAP Company code plus three or four
additional numbers (ie. 1154-XXXX). Enter the user‟s hierarchy number (group node) in the
text box. Click the green check .
Enter your
group
number

Activity Manager Reporting (CO)
(May 2008) 40 What is Controlling?
The system will display the hierarchy requested as seen in the following display.
Use the Expand and Collapse buttons to provide more/less details of the hierarchy.
Click on any desired folder to expand or collapse that region of the hierarchy and to view cost
centers.
The different nodes represent different levels in the organizational chart. Each node is a
reporting node that will offer summary level or detailed level financial information for all
subordinate nodes or cost centers. The cost centers are identified as the four or five digit
numbers at the lowest level of the hierarchy (ie. 3657).
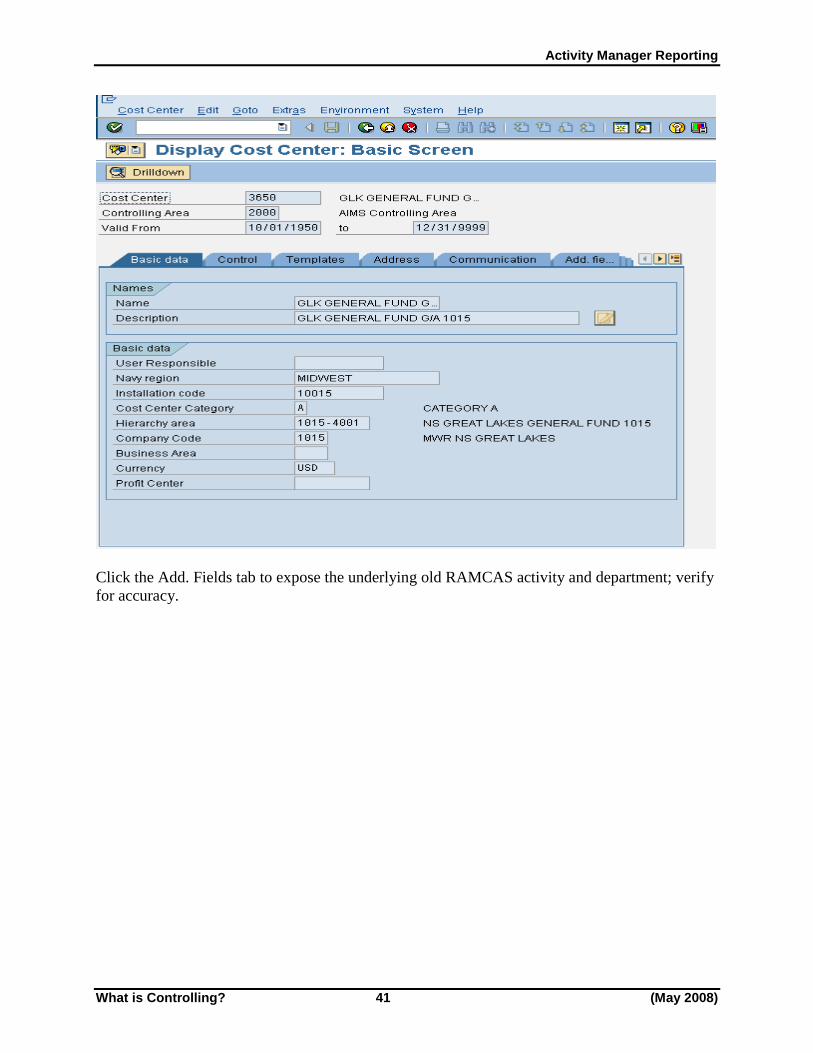
To display the underlying master data information about the cost center, double click on the cost
center NUMBER. The following screen will display. Fields need to be verified for accuracy,
description, category and additional fields.
Cost
Center Group
Cost Center
Activity Manager Reporting
What is Controlling? 41 (May 2008)
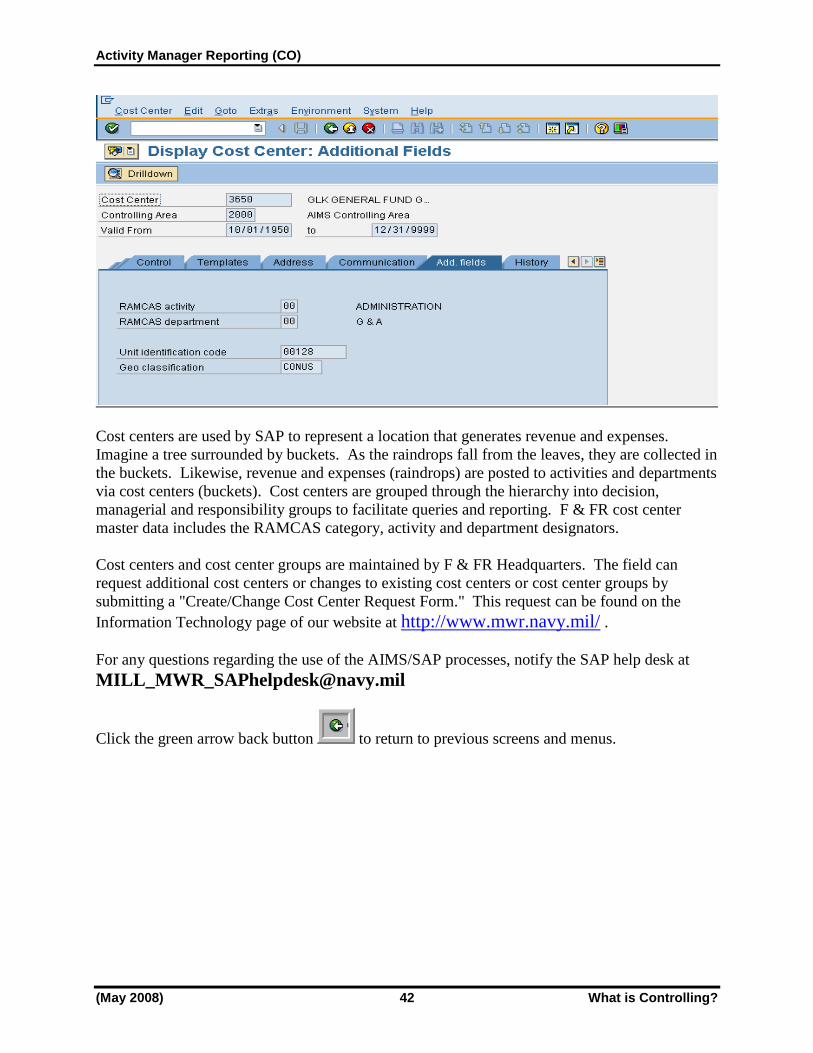
Click the Add. Fields tab to expose the underlying old RAMCAS activity and department; verify
for accuracy.
Activity Manager Reporting (CO)
(May 2008) 42 What is Controlling?
Cost centers are used by SAP to represent a location that generates revenue and expenses.
Imagine a tree surrounded by buckets. As the raindrops fall from the leaves, they are collected in
the buckets. Likewise, revenue and expenses (raindrops) are posted to activities and departments
via cost centers (buckets). Cost centers are grouped through the hierarchy into decision,
managerial and responsibility groups to facilitate queries and reporting. F & FR cost center
master data includes the RAMCAS category, activity and department designators.
Cost centers and cost center groups are maintained by F & FR Headquarters. The field can
request additional cost centers or changes to existing cost centers or cost center groups by
submitting a "Create/Change Cost Center Request Form." This request can be found on the
Information Technology page of our website at http://www.mwr.navy.mil/ .
For any questions regarding the use of the AIMS/SAP processes, notify the SAP help desk at
Click the green arrow back button to return to previous screens and menus.

Activity Manager Reporting
What is Controlling? 43 (May 2008)
As mentioned earlier, the Controlling module provides the most flexible reporting for business
income and expenses. For a detailed breakdown of cost center and cost center groups, reporting
must be done in the Controlling module.
The SAP Controlling reports can be found through the following menu path:
Menu Path: Accounting Controlling Cost Center Accounting Information system
Report selection.
(T-Code: KSBB)
The following report tree will be displayed
Open the folder for Standard Month-end reports by clicking once on the folder. Select the
desired report by double clicking on the report line description. The screen will look similar to
the following screen.

Activity Manager Reporting (CO)
(May 2008) 44 What is Controlling?
Single click here
Double click
here
Note: While this category of report is called Month-End reports, restricting these to the end of the month is no longer the case. You now have the ability to run these reports from your desk-top at any time during the month. Remember however, Headquarters enters certain items such as payroll and depreciation only at certain times during the month.

Activity Manager Reporting
Standard Month-End Reports 45 (May 2008)
Standard Month-end Reports Executive Summary
The Executive Summary is a summarized presentation of the current month‟s and year-to-date
income and expense amounts for the entire fund. It includes plan (budget), actual, prior fiscal
year (if available) and variances for both current month and year to date. The bottom line on this
report matches the bottom line on the Summary Operations Statement for the total fund. Several
accounts are summarized in the line description. Once the specific report has been selected for
viewing and after double clicking on the report line description, the selection criteria screen will
appear. Selection criteria screens will vary depending on which report the user wishes to view.
Enter the cost center group OR cost center value in the designated field and click the execute
button . The system will post messages on the bottom tool bar as the report is being
generated.

Activity Manager Reporting (CO)
(May 2008) 46 Standard Month-End Reports
Once the report generates, the screen will display similar to the following.
Notice the left side of the report displays the company hierarchy, which can be expanded to
reveal the cost centers. To close the hierarchy box click the navigation on/off button. .
Once the hierarchy has been closed the report will appear as follows.

Activity Manager Reporting
Standard Month-End Reports 47 (May 2008)
Report Drilldown
Select a line from the revenue or expense categories (example: Program Revenue $873,823);
double click on the number in the current month actual column to receive detailed postings.
Note: If the user double clicks on the month total the detail will correspond to month, however if the user double clicks anywhere else on the selected line, the corresponding detail will be year to date.
The following box will display. Select “Cost Center: Actual Line Items”.
The detail general ledger for the account will display.

Activity Manager Reporting (CO)
(May 2008) 48 Standard Month-End Reports
Sort and Sum report detail
Notice that this detail brings in document type SK which is a POS DARS. There are two
additional buttons that help in sorting the data for analysis. Select a column by clicking once in
the heading of the column, ex. posting date, and click the ascending or descending sort
button . The system will sort the data by posting date.
If the user wishes to sum the information by date by cost center the information can be sorted
and summed by selecting the columns to sort and sum using the control key to highlight multiple
columns and click the subtotals button . The information will return to the screen sorted
and summed similar to the following.

Activity Manager Reporting
Standard Month-End Reports 49 (May 2008)
To return to the previous screen, use the green arrow back button click again to return to
the original report.

Activity Manager Reporting (CO)
(May 2008) 50 Standard Month-End Reports
The following box will display, click the yes button and continue.
SAP will return to the Executive Summary Report.
Self Sufficiency Summary
The selection screen for reports is almost always the same; enter the Fiscal Year, the Accounting
period, and either a cost center group or individual cost center(s).
The Self Sufficiency Summary provides the self sufficiency percentages derived from dividing
revenue by expenses. This report has both a current month and year to date section and is
displayed by categories. Use the scroll bar at the bottom of the screen to see the remainder of the
data.

Activity Manager Reporting
Standard Month-End Reports 51 (May 2008)
Summary Operations Statement
The Summary Operations Statement has been a standard report in the legacy system (RAMCAS)
for many years. The selection screen follows.
The example is a three-page document. The screenshots displayed show the header portion of
page one and the bottom part of page three. It has Expansion and Collapse buttons on the left
side as well.

Activity Manager Reporting (CO)
(May 2008) 52 Standard Month-End Reports
And, the bottom of the last page would look like this.
This is a very complete report that can be executed for a cost center group or an individual cost
center.

Activity Manager Reporting
Standard Month-End Reports 53 (May 2008)
Budget Performance Activity – New
This report compares actual to budget for the current month/year with variance amounts and
percentages. This is a comparison for current month to the same month for the previous year.
Enter the Fiscal Year, the Accounting period, and the Cost Center Group or individual cost
center (s).

Activity Manager Reporting (CO)
(May 2008) 54 Standard Month-End Reports
UFM APF Support Expense Report
This shows the Expense elements (all UFM offset accounts) broken down by Categories. Again,
by clicking the Expand and Collapse buttons additional data can be displayed.
Enter data in the Fiscal Year, Period, and Cost center group fields.
.

Activity Manager Reporting
Standard Month-End Reports 55 (May 2008)
UFM APF Offset Report
The breakdown between UFM Labor and Non-Labor is displayed on this report.
This report is similar to others with Expand and Collapse buttons down the left edge of the
window.

Activity Manager Reporting (CO)
(May 2008) 56 Analytical Reports (Field)
Analytical Reports (Field)
Executive Summary Rolling 12 months
One of the more useful new reports is the Executive Summary Rolling 12 months. Facilities on
the SAP system for less than 12 months will not see a full comparison on this report until after
the first year. Enter the fiscal year, period and cost center group.
This report shows pertinent data from Executive Summaries for the previous twelve months,
which depending on when the report is run could include parts of two fiscal years. All of the
functions, including drilldowns are available with this report as well as most of the others. As a
facility/Activity manager, experiment with all of the reports and decide which will be useful.
Activity Manager Reporting
Analytical Reports (Field) 57 (May 2008)
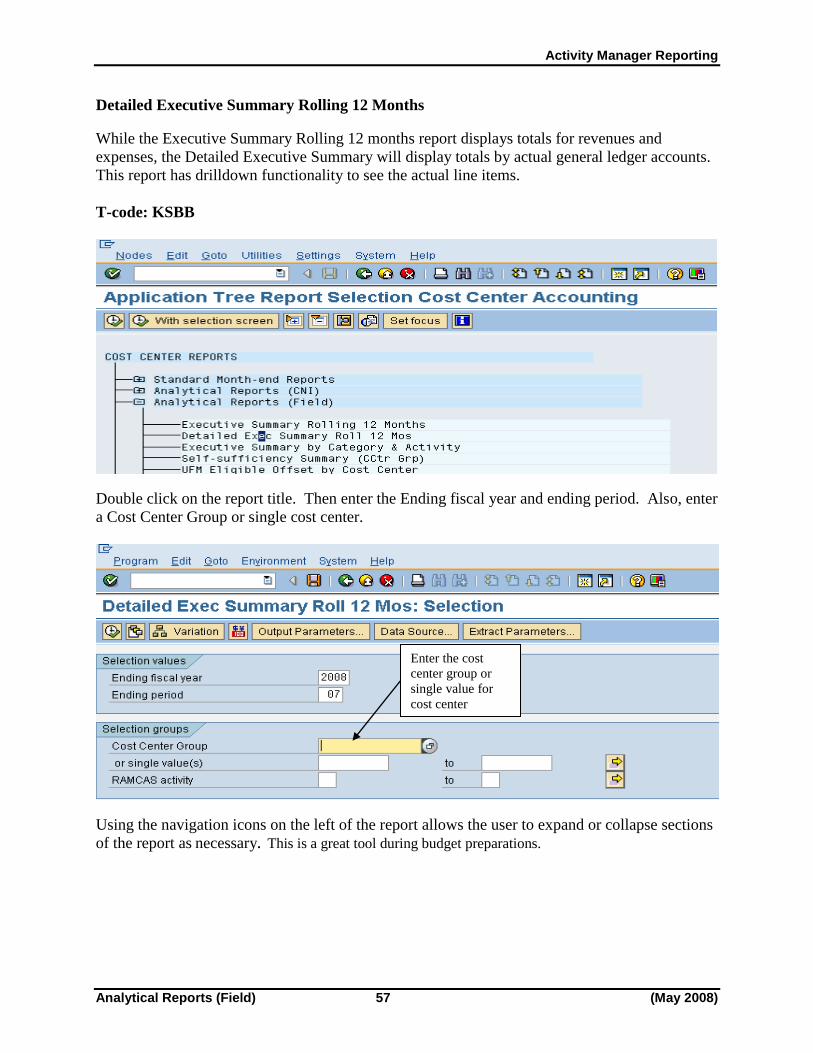
Detailed Executive Summary Rolling 12 Months
While the Executive Summary Rolling 12 months report displays totals for revenues and
expenses, the Detailed Executive Summary will display totals by actual general ledger accounts.
This report has drilldown functionality to see the actual line items.
T-code: KSBB
Double click on the report title. Then enter the Ending fiscal year and ending period. Also, enter
a Cost Center Group or single cost center.
Using the navigation icons on the left of the report allows the user to expand or collapse sections
of the report as necessary. This is a great tool during budget preparations.
Enter the cost
center group or
single value for
cost center

Activity Manager Reporting (CO)
(May 2008) 58 Analytical Reports (Field)

Activity Manager Reporting
Analytical Reports (Field) 59 (May 2008)
Self-Sufficiency Summary (CCtr Grp)
This report displays the revenues, expenses, profit and loss, and the self-sufficiency percentages
by cost center. The Selection window requires entries in the Fiscal Year, Period, and Cost
Center Group fields.
Notice the Expand and Collapse buttons on the left edge in the screenshot below. By clicking the
expand buttons, the system displays the individual cost centers that make up the group and all the
related data including the separate self-sufficiency percentages.
Activity Manager Reporting (CO)
(May 2008) 60 Analytical Reports (Field)
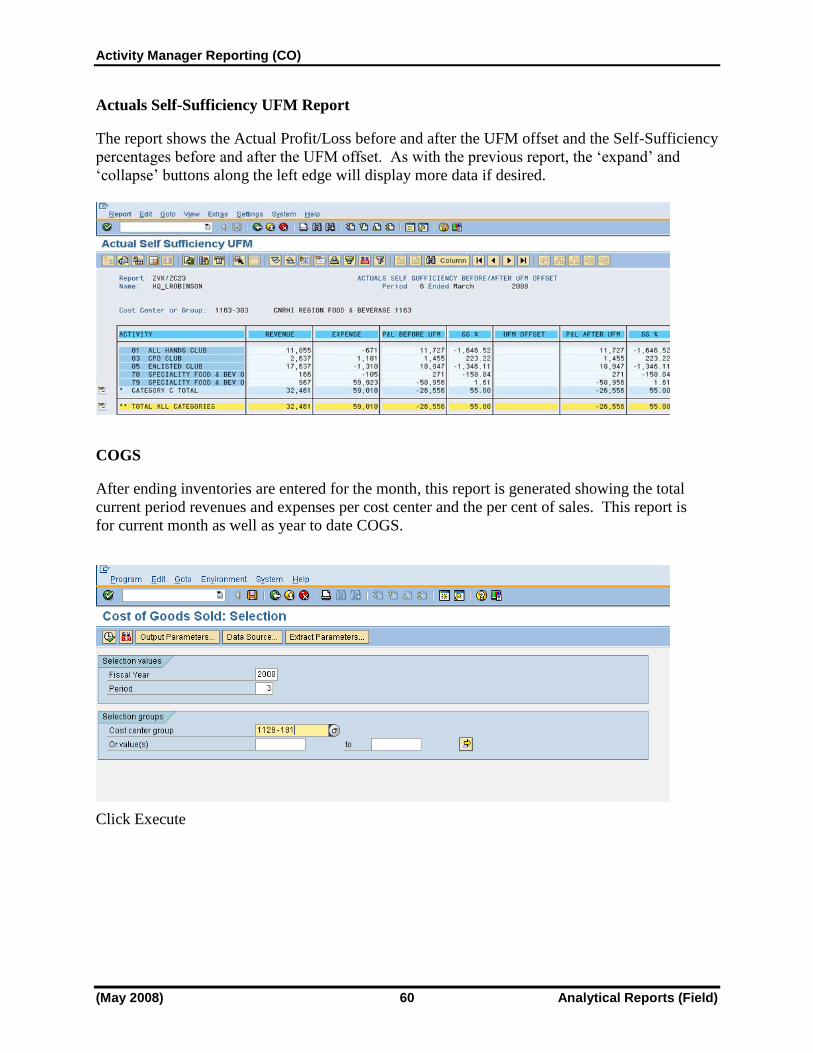
Actuals Self-Sufficiency UFM Report
The report shows the Actual Profit/Loss before and after the UFM offset and the Self-Sufficiency
percentages before and after the UFM offset. As with the previous report, the „expand‟ and
„collapse‟ buttons along the left edge will display more data if desired.
COGS
After ending inventories are entered for the month, this report is generated showing the total
current period revenues and expenses per cost center and the per cent of sales. This report is
for current month as well as year to date COGS.
Click Execute
Enter company code, closed period
and cost center
group

Activity Manager Reporting
Analytical Reports (Field) 61 (May 2008)
Click on a column and sort. The above report was sorted on YTD % of sales.
This report can be used to compare current COGS to the recommended COGS in the financial
standards 1710.11 appendix G.
Subtotaled
by YTD %
NOTE: Non-retail activities cannot use the drilldown function in the COGS columns.

Activity Manager Reporting (CO)
(May 2008) 62 Analytical Reports (Field)
Cashier Overage/Shortage
A g/l line item display report can be run to review the overages/shortages. Execute this report
monthly and investigate any large amounts. Take necessary steps to reduce these occurrences.
FBL3N GL Display Line item
Enter both the overage and shortage account. Looking at one account without the other could be
misleading.
Click Execute.
Enter a date
range
Enter
company code
Enter both
812000 and
912000

Activity Manager Reporting
Analytical Reports (Field) 63 (May 2008)
Select AIMS21 layout to see a summary for the quarter by cost center.
This report can be subtotaled by assignment which is the location or by text which is the
cashier‟s name.
Choose
AIMS21
layout.
Activity Manager Reporting (CO)
(May 2008) 64 Analytical Reports (Field)
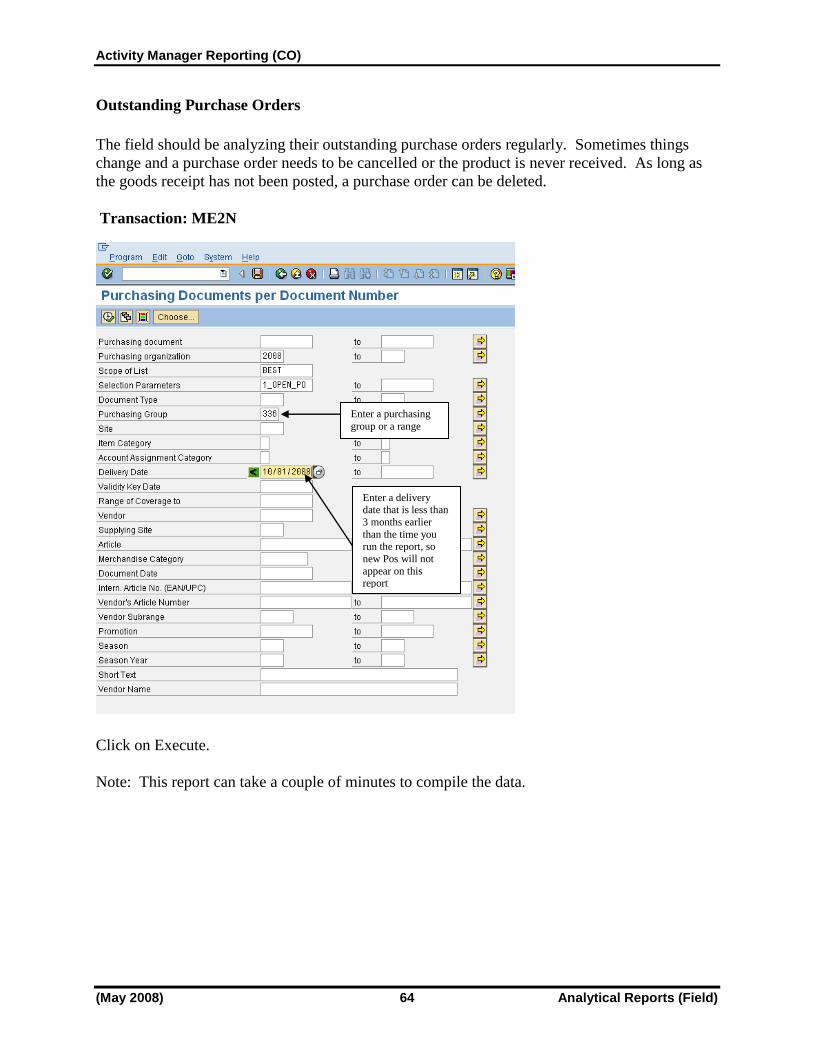
Outstanding Purchase Orders
The field should be analyzing their outstanding purchase orders regularly. Sometimes things
change and a purchase order needs to be cancelled or the product is never received. As long as
the goods receipt has not been posted, a purchase order can be deleted.
Transaction: ME2N
Click on Execute.
Note: This report can take a couple of minutes to compile the data.
Enter a purchasing
group or a range
Enter a delivery date that is less than
3 months earlier
than the time you
run the report, so
new Pos will not
appear on this report

Activity Manager Reporting
Analytical Reports (Field) 65 (May 2008)
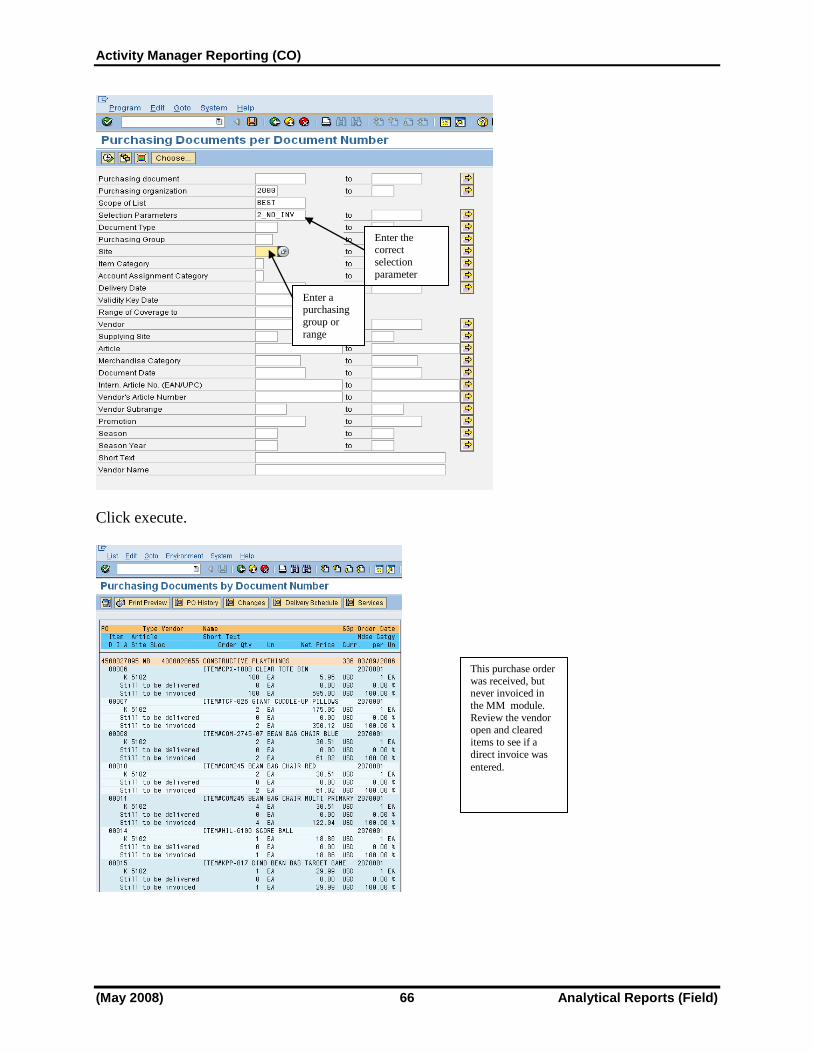
Purchase order with goods receipt, but no invoice
As explained in the g/l line item section, there is a chance that a direct invoice (AP) was entered
instead of invoice verification (MM) resulting in double expensing. There is a transaction to
check to see if goods have been received, but no invoice entered.
Transaction: ME2N
This report was executed Feb 2008.
The purchase orders
listed need to be investigated. The
expected delivery
dates are very old.
Double click on the orange line to drill down
to the purchase order for
more details.
Activity Manager Reporting (CO)
(May 2008) 66 Analytical Reports (Field)
Click execute.
Enter the correct
selection
parameter
Enter a purchasing
group or
range
This purchase order
was received, but never invoiced in
the MM module.
Review the vendor open and cleared
items to see if a
direct invoice was
entered.
Activity Manager Reporting
HR ADHOC Query 67 (May 2008)
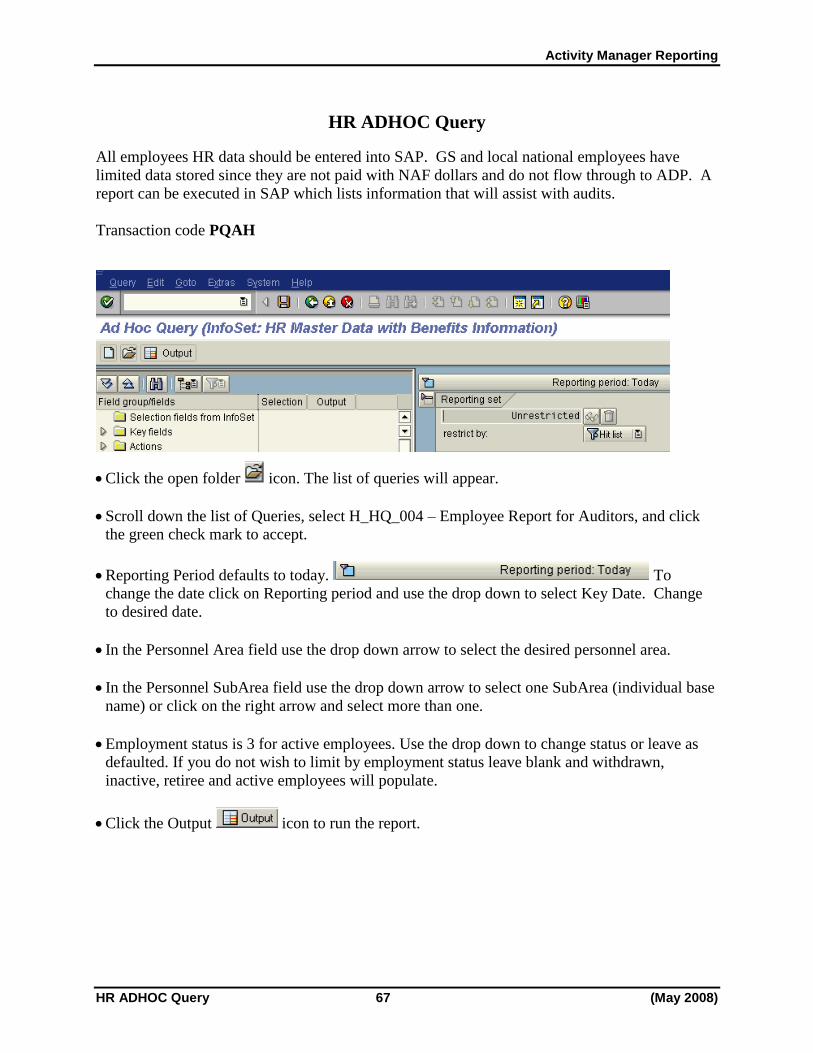
HR ADHOC Query
All employees HR data should be entered into SAP. GS and local national employees have
limited data stored since they are not paid with NAF dollars and do not flow through to ADP. A
report can be executed in SAP which lists information that will assist with audits.
Transaction code PQAH
Click the open folder icon. The list of queries will appear.
Scroll down the list of Queries, select H_HQ_004 – Employee Report for Auditors, and click
the green check mark to accept.
Reporting Period defaults to today. To
change the date click on Reporting period and use the drop down to select Key Date. Change
to desired date.
In the Personnel Area field use the drop down arrow to select the desired personnel area.
In the Personnel SubArea field use the drop down arrow to select one SubArea (individual base
name) or click on the right arrow and select more than one.
Employment status is 3 for active employees. Use the drop down to change status or leave as
defaulted. If you do not wish to limit by employment status leave blank and withdrawn,
inactive, retiree and active employees will populate.
Click the Output icon to run the report.

Activity Manager Reporting (CO)
(May 2008) 68 HR ADHOC Query
Query results will be listed.
Downloading Query Data to Excel
Click the Excel icon to transfer report to an Excel spreadsheet or the local file icon will
save spreadsheet to a specific drive.
Click the local file icon.
Select the radio button for spreadsheet.
Directory - Click the drop down menu to choose where the report will be saved.
Click Replace to save the report.
Report has been transferred to desired location

Activity Manager Reporting
Budgeting Reports 69 (May 2008)
Budgeting Reports
There are several reports that can be run before and after entering the new budget to assist and
check the new budget projection.
Fixed Asset Depreciation
The SAP Fixed Asset Balance Report can be executed to help the manager determine the budget
year‟s depreciation. The report will have to be executed twice. The difference between the
reports will be the next year‟s budget depreciation amount. SAP will take into account any
assets that will be fully depreciated in the year the reports are executed. The manager will need
to manually add any planned additions and manually deduct any retirements to both reports.
ART0>AIMS Asset Accounting reports>Asset Balances
Since the budget call is usually done in May, execute the report leaving the default date. This
will show the fixed assets net book value as of the end of the current fiscal year. In this example,
the current fiscal year is 2008. The budget year is 2009.

Activity Manager Reporting (CO)
(May 2008) 70 Budgeting Reports
The report will show totals by cost center by asset class. The accumulated depreciation is the
projected accumulated depreciation up to September 30 of the current year.
Enter the
company
code
Click on the
icon for „or
group totals
only
Leave the default report
date which should be the
last day of the current
fiscal year
Enter the sort
version Z099
Enter the cost
center

Activity Manager Reporting
Budgeting Reports 71 (May 2008)
Create another session and execute the same report, but advance the date of September 30 to the
year of the budget call. In this example, the budget year is 2009.

Activity Manager Reporting (CO)
(May 2008) 72 Budgeting Reports
The report will show the same fixed assets. The total accumulated depreciation will be what the
accumulated depreciation will be as of the end of the next fiscal year (the budget year) assuming
no increases or decreases. The difference between the two numbers is the projected depreciation
Enter
09/30/XXXX with
XXXX = the
budget year
Click on the
icon for „or
group totals
only
Enter Z099
for the sort
version
Enter the
company
code

Activity Manager Reporting
Budgeting Reports 73 (May 2008)
expense for the budget year. Again, the depreciation expense derived from these two reports
does not include any new acquisitions or retirements for the current year (in this example 2008)
or any acquisitions or retirements for the budget year (in this example 2009). It will only give
the starting point.
These reports can be downloaded into excel, so if the user is comfortable using excel, down load
the figures and let excel calculate the depreciation expense.
Activity Manager Reporting (CO)
(May 2008) 74 Budgeting Reports
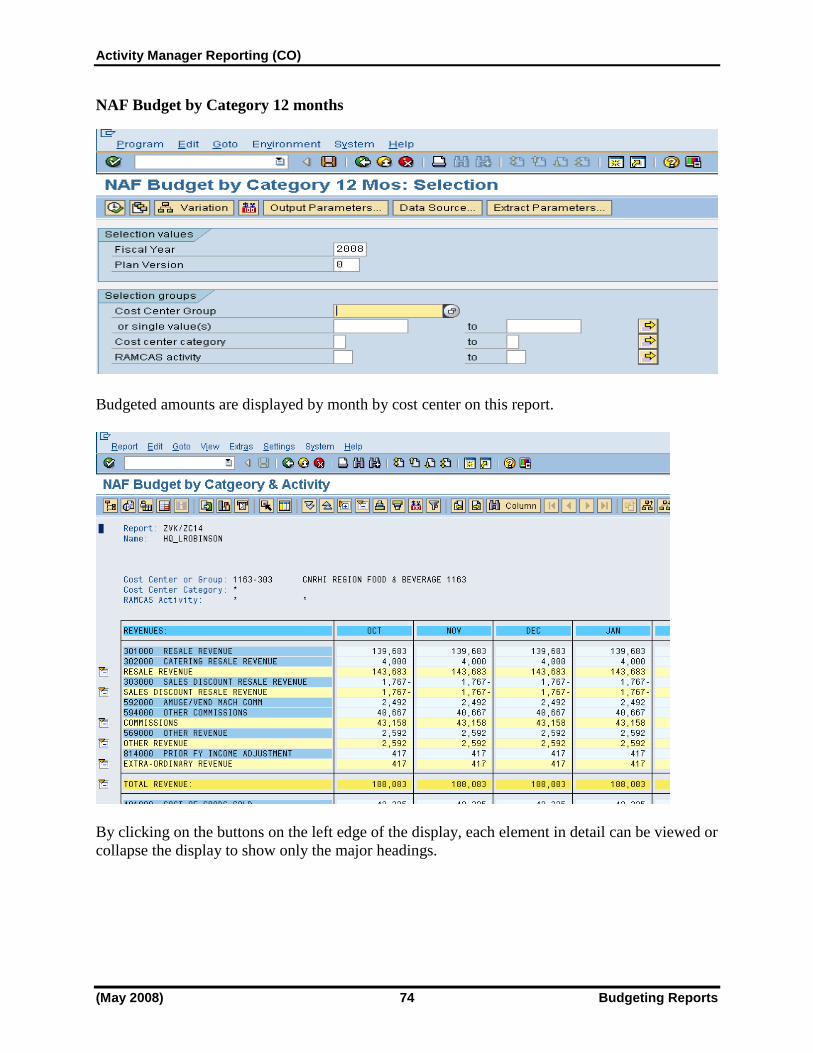
NAF Budget by Category 12 months
Budgeted amounts are displayed by month by cost center on this report.
By clicking on the buttons on the left edge of the display, each element in detail can be viewed or
collapse the display to show only the major headings.

Activity Manager Reporting
Budgeting Reports 75 (May 2008)
NAF Budget Current & Prior Yrs Plan
This report displays comparisons between what is budgeted for the current fiscal year and what
was budgeted last year. The variance between current FY and previous FY is also displayed.
This report should be run after the new budget has been entered. Large variances should be
questioned to make sure an error has not occurred.
And, here is the bottom portion of the report.

Activity Manager Reporting (CO)
(May 2008) 76 Budgeting Reports
12 Month Actual to Plan (Budget)
This report divides the fiscal year into two groups; months 1 to 6 of the current fiscal year and
months 7 to 12 from the prior year. This report is used for preparing the future budget when all
the data from the current year is not available. It shows the actual data from the last 12 months
at the time of the budget call. Expand and collapse the headings to provide more or less data
being seen.
Run this report after the new budget has been entered. Check the large variances to make sure
they can be explained.
New Budget
Activity Manager Reporting
Budgeting Reports 77 (May 2008)
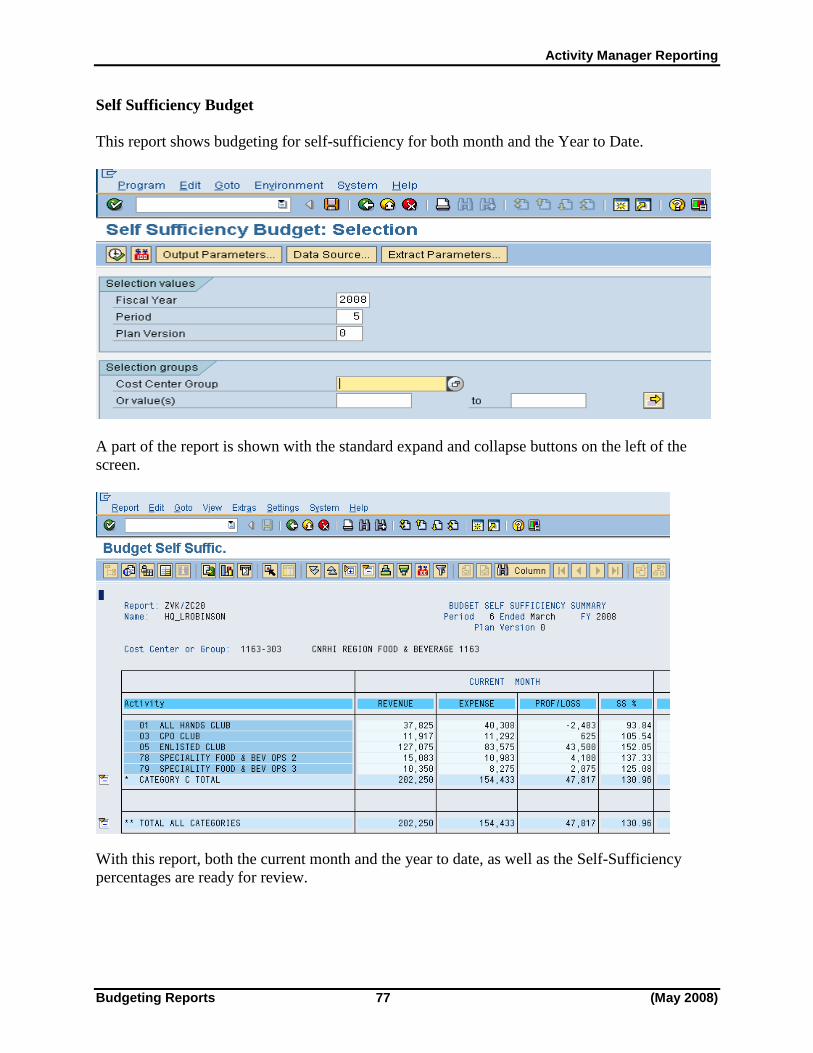
Self Sufficiency Budget
This report shows budgeting for self-sufficiency for both month and the Year to Date.
A part of the report is shown with the standard expand and collapse buttons on the left of the
screen.
With this report, both the current month and the year to date, as well as the Self-Sufficiency
percentages are ready for review.

Activity Manager Reporting (CO)
(May 2008) 78 Budgeting Reports
Plan Self-Sufficiency UFM Report
The following partial view of this report shows the budgeted self-sufficiency both before and
after the UFM offset. Managers can also check actual UFM/Non-UFM performance in the
“Actual Self Sufficiency UFM Report “ in the Analytical Reports (Field) section of this manual.
Expand and collapse the titles to show more or less data as needed.

Activity Manager Reporting
Internal Order Reports 79 (May 2008)
Internal Order Reports
For those activities using Internal Orders, reports for revenue and expenses associated with those
orders can be found under KSBB. There are reports available to analyze the revenues and
expenses posted to an internal order, as well as, reports that display postings to Special Events
cost centers that are not posted to individual internal orders.
T-Code: KSBB
Enter the Internal order number or use the dropdown to find the order number by company code.
The following report displays actual postings to this particular Internal Order.

Activity Manager Reporting (CO)
(May 2008) 80 Internal Order Reports
Drilldown on the actual items by double clicking on the amount and a popup screen will appear.
Choose Orders: Actual Line Items. Then, click the green check mark.
These are the actual line items that make up the total revenues and expenses for this Internal
Order.

Activity Manager Reporting
Internal Order Reports 81 (May 2008)
In the event that an internal order number is overlooked on an invoice or DAR, a report can be
run that displays postings to a Special Events cost center not associated with an internal order
number.

Activity Manager Reporting (CO)
(May 2008) 82 Internal Order Reports
T-code: KSBB
Double click on Cost Centers: Actual Line Items. On the next screen enter the Special Events
cost center, a posting date range, and always use the /AIMS08 layout. Click on execute.
The following report containing all items posted to this cost center, with and without internal
order numbers, is generated.

Activity Manager Reporting
Internal Order Reports 83 (May 2008)
Using the filter icon , the report can be adjusted to display only those postings without an
internal order number attached. Click on the column heading “Stat. internal order” and then
click on the filter icon. The following popup box will be generated.
On the Maintain Selections screen, choose “= Single Value” and choose the green check mark to
continue.
Double click
in this box

Activity Manager Reporting (CO)
(May 2008) 84 Internal Order Reports
Notice that the screen now has the = sign highlighted in green. Do not enter a value in the box
and click the green check mark to continue.
The resulting report now contains only those items posted to the cost center without internal
order numbers attached. These items can be sorted and subtotaled by general ledger account.

Activity Manager Reporting
Internal Order Reports 85 (May 2008)
Simply click on the “cost element” column heading and use the subtotal icon.

Activity Manager Reporting (CO)
(May 2008) 86 Asset Reports
Asset Reports
Assets Under Construction (AUC) (using Flexible Asset Listing)
There are two types of assets under construction. The first one is when the field is buying the
items for the project. The second type is when HQ funds the project and then transfers it to the
field.
If the field purchases the items for the project, they will create an asset shell in SAP using asset
class 179000. All invoices and expenses will be posted to the fixed asset. Once the asset is
complete, the field will transfer the asset from the asset 179XXXXX to a depreciating asset. The
SAP manual instructs the field to use the asset transfer t-code (ABUMN) in SAP and not a
general ledger journal. If they use the proper t-code, the original asset number in the new
depreciating asset will have the AUC asset number in the „original asset‟ field. You can also
determine the history of any asset by looking at the transactions using t-code AS03 (Asset
Values).
ART0 > AIMS > Flexible Asset Listing (No APF / Other) > Abbrev. Asset List (Site)
Click on Execute.
There are several things to look for:
1) Make sure that the original value field has a value. This is a tool for the field to use to
ensure that they do not spend over budget. Since there is no budget control on an asset
(SAP will not stop you from posting over budget), the field is instructed to look at the
Select „only
active assets‟
Enter the asset class
179000 for MWR and 179001 for VQ

Activity Manager Reporting
Asset Reports 87 (May 2008)
current asset value + outstanding purchase orders and compare it to the value entered in
the „original value‟ field. If the two combined amounts plus the new purchase are less
than the amount in the „original value‟ field, the base can make the purchase.
2) Make sure there is a Net Book Value. If this is zero two things could have happened.
This is a new asset that has not had purchases yet or this asset was transferred with partial
retirement. The last transfer needs to be a full retirement for SAP to automatically put in
the deactivation date. If they do a partial as the last transfer, they need to manually enter
the deactivation date. Once the asset has a deactivation date, it will no longer be
considered „active‟.
3) Make sure the accumulated depreciation is zero. If it has a value then they transferred the
asset to a depreciating asset and then transferred it back. If they did not select the correct
dates, the asset will have a balance in the accumulated depreciation field.
4) Do not worry about the quantity. SAP adds to the quantity each time there is a purchase.
Projects have several purchases before the asset is complete. The field needs to change
the quantity to the correct quantity prior to transferring the asset.
Compare to Restricted Cash
Not all projects have restricted cash and not all restricted cash entries have a project yet, but it
would be a good thing to check.
SAP has two restricted cash accounts:
102000 Capital Outlays
103000 Local Nationals (OCONUS)
Both accounts are posted in US Dollars only.
In order to make the bank general ledger accounts balance to the bank reconciliations, an offset
account was created. Each time cash is restricted or unrestricted, both the restricted and offset
account must be posted to. The two accounts combined in every company code should always
net to zero.
Restrict cash
Add the field Original Acq. Value to show the approved
budget for this project
Sort by
Acquisition Cost

Activity Manager Reporting (CO)
(May 2008) 88 Asset Reports
DR Restricted Cash 102000 $ 10,000
CR Restricted Cash Offset 101002 $ 10,000
The field is instructed to enter the project number in the assignment field. Several bases are
using the SAP 179 asset number and year as the project number. This allows you to trace back
to the asset in SAP. Other bases have their own internal project numbering system.
To view the restricted cash g/l account, use the g/l line item display t-code (FBL3N).
Accounting > Financial Accounting > General Ledger > Account > Display Line Items
Click on execute.
Enter g/l account and company code

Activity Manager Reporting
Asset Reports 89 (May 2008)
Compare projects to budget
The amount in the original value should be the approved budget amount. You should always
review the budget when analyzing restricted cash and AUCs. A project‟s life may go over
several years, so consider that when reviewing the budget. Refer to RAMCAS section C.
Although SAP does have the capability to budget balance sheet accounts, a decision was made
not to enter this budget in SAP. The review of the budget for projects has to be done manually
outside of SAP. Refer to RAMCAS section D.
Subtotal by assignment
field. This should give
you a total by project.

Activity Manager Reporting (CO)
(May 2008) 90 Asset Reports
Unposted Asset Shells
This report is used to determine which asset shells have been created, but not posted to
financially (no value to the asset). Usually this means that the asset has not been received.
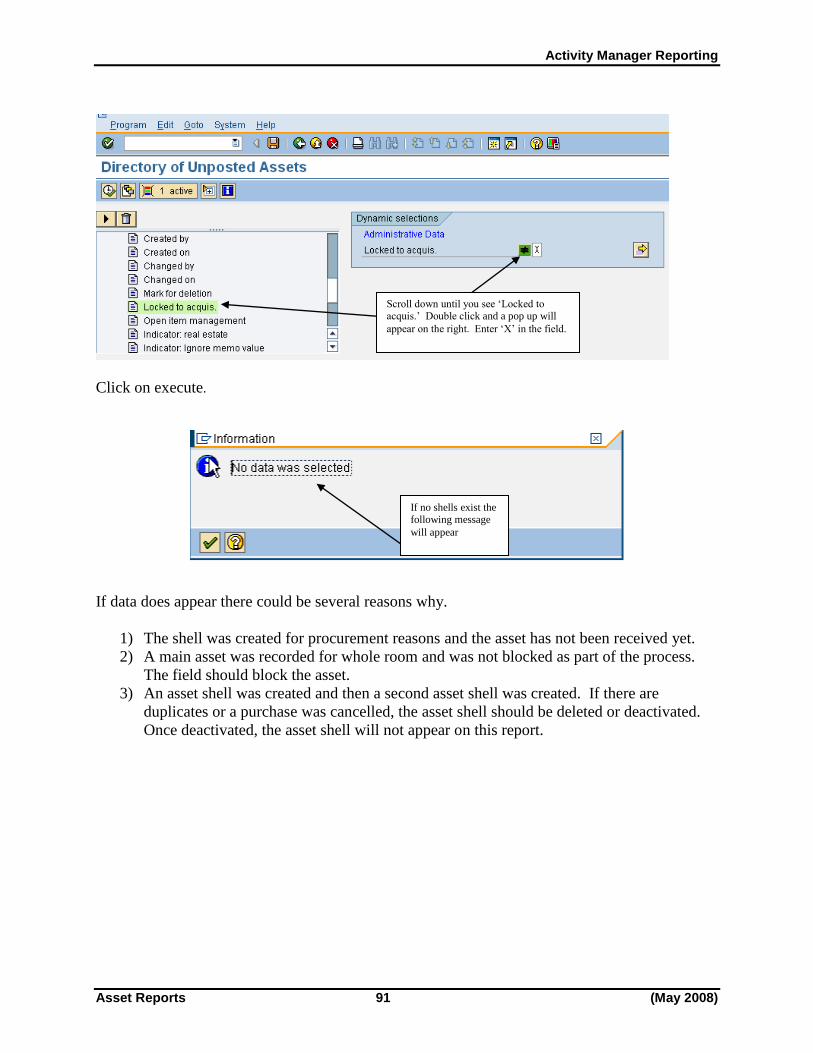
ART0 > AIMS > Directory of Unposted Assets > AIMS Unposted Asset Shells
Click on the dynamic selections icon.
VQ only: Scroll until you see the folder
Administrative data and then open that folder.
This variant will
exclude APF and
OTHER asset classes since these
assets are just shells
and never have a value
Activity Manager Reporting
Asset Reports 91 (May 2008)
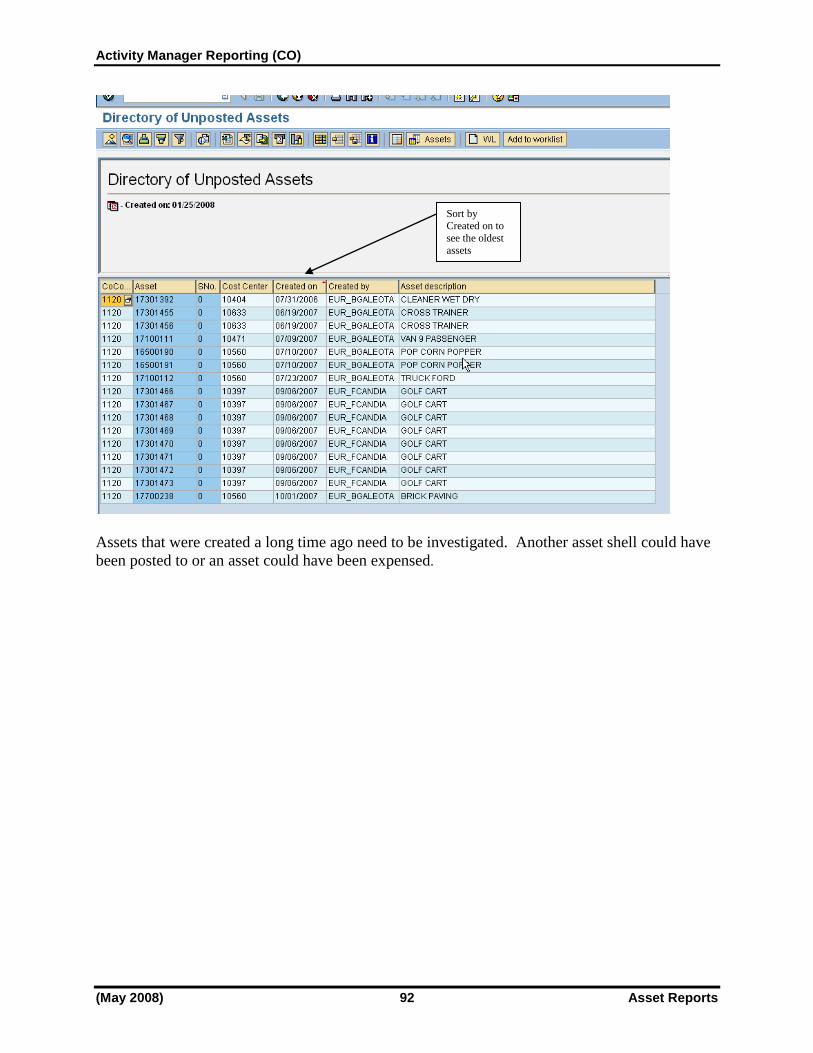
Click on execute.
If data does appear there could be several reasons why.
1) The shell was created for procurement reasons and the asset has not been received yet.
2) A main asset was recorded for whole room and was not blocked as part of the process.
The field should block the asset.
3) An asset shell was created and then a second asset shell was created. If there are
duplicates or a purchase was cancelled, the asset shell should be deleted or deactivated.
Once deactivated, the asset shell will not appear on this report.
Scroll down until you see „Locked to acquis.‟ Double click and a pop up will
appear on the right. Enter „X‟ in the field.
If no shells exist the following message
will appear
Activity Manager Reporting (CO)
(May 2008) 92 Asset Reports
Assets that were created a long time ago need to be investigated. Another asset shell could have
been posted to or an asset could have been expensed.
Sort by Created on to
see the oldest
assets

Activity Manager Reporting
Other Accounting Tools 93 (Mar 2008)
Other Accounting Tools Display GL account:
Menu Path: Accounting Financial AccountingGeneral
LedgerAccountDisplay/Change Line Items
T-code: FBL3N
Display Vendor:
Menu Path: AccountingFinancial AccountingAccounts
PayableAccountDisplay/Change Line items
T-code: FBL1N
Display Asset:
Menu Path: Accounting Financial AccountingFixed
AssetsInformation SystemReport Selection
T-code: ART0

Activity Manager Reporting (CO)
(May 2008) 94 SAP Terms
SAP TERMS Company code
For all F & FR entities, the company code replaces the RAMCAS Fund number. SAP
refers to company code as an independent accounting entity. Each company code has its
own complete chart of accounts. Balance Sheets can be produced at the Company Code
level. In general, regions are represented by Company Codes
Controlling area
This is the highest organizational level for which costs and revenues are calculated. This
designator helps to control posting periods across company codes. All F & FR company
codes belong to controlling area 2000.
Cost centers
This unit is used by SAP to represent a location of cost (and revenue) origination. Cost
centers are grouped into decision, managerial and responsibility groups to facilitate query
and reporting. F & FR cost centers include category, activity and department designators.
The Cost Center name is used by SAP to represent a location to account for Revenue and
Expenses. It is a „bucket‟ to collect this data. F & FR cost center master data includes
category, hierarchical area, Company code and the legacy (RAMCAS) activity and
department designators.
Cost center groups
Cost centers are assigned to groups to combine like entities or reporting groups. Cost
center groupings can be found as nodes on the standard hierarchy.
Cost elements
Chart of account elements that depict costs and revenues. All F & FR revenue and
expense accounts are considered cost elements in SAP. Cost elements are used to ensure
comprehensive reporting (tracking costs and revenue) and detailed planning (budgeting).
Document Date/Posting Date
The document date is the actual date of the transaction. The posting date determines the
accounting period that should include the transaction. This would usually be the next day
but the end of the month or other factors might cause a variance in the date the
transaction was posted into SAP.
FICO
FInancial and COntrolling are the two SAP modules that form the basis for our AIMS
Accounting Information Management System

Activity Manager Reporting
SAP Terms 95 (May 2008)
Internal Orders
Internal Orders are statistical “buckets‟ only. They provide a method of collecting data,
both revenue and expense, to account for a specific event outside of the regular
accounting functions. A good example of using an Internal Order is keeping track of all
data pertaining to a base-wide special event. The data is still accounted for using cost
centers but it is also tracked using an Internal Order.
“Moon Over Miami”
This is the title given to the Overview icon that allows the user to check whether a
document is in balance. It also gives the overview look at the entire document. Other
names include: “Moon Over Ranier” and “Moon Over Diamondhead”, etc.

Activity Manager Reporting (CO)
(May 2008) 96 Reporting Aids
Reporting Aids
There are several additional functions in SAP to customize and navigate reports easily. Reports
can be exported from SAP into Excel spreadsheets and attached to e-mail. The following
functions and examples were taken from the Cost Center Reports using T-code: KSBB.
Navigation on/off
Notice the left side of the report displays the company hierarchy, which can be expanded to
reveal the cost centers. To close the hierarchy box click the navigation on/off button
. Once the hierarchy has been closed the report will appear as follows.
To explain, the Budget Performance Activity report is segmented into three parts. The first
section to the left is current month actual, plan (budget), variance and prior year if available. The
center section consists of general ledger accounts and descriptions. The third section to the right
is year to date actual, plan (budget), variance and prior year if available. This report is widely
used to compare budget to actual by month and year to date.
Report Drilldown
Select a number from the current month actual column; double click on the number in the current
month actual column to receive detailed postings.
Note: If the user double clicks on the month total the detail will correspond to
month, however if the user double clicks anywhere else on the selected line, the corresponding detail will be year to date.
Activity Manager Reporting
Reporting Aids 97 (May 2008)
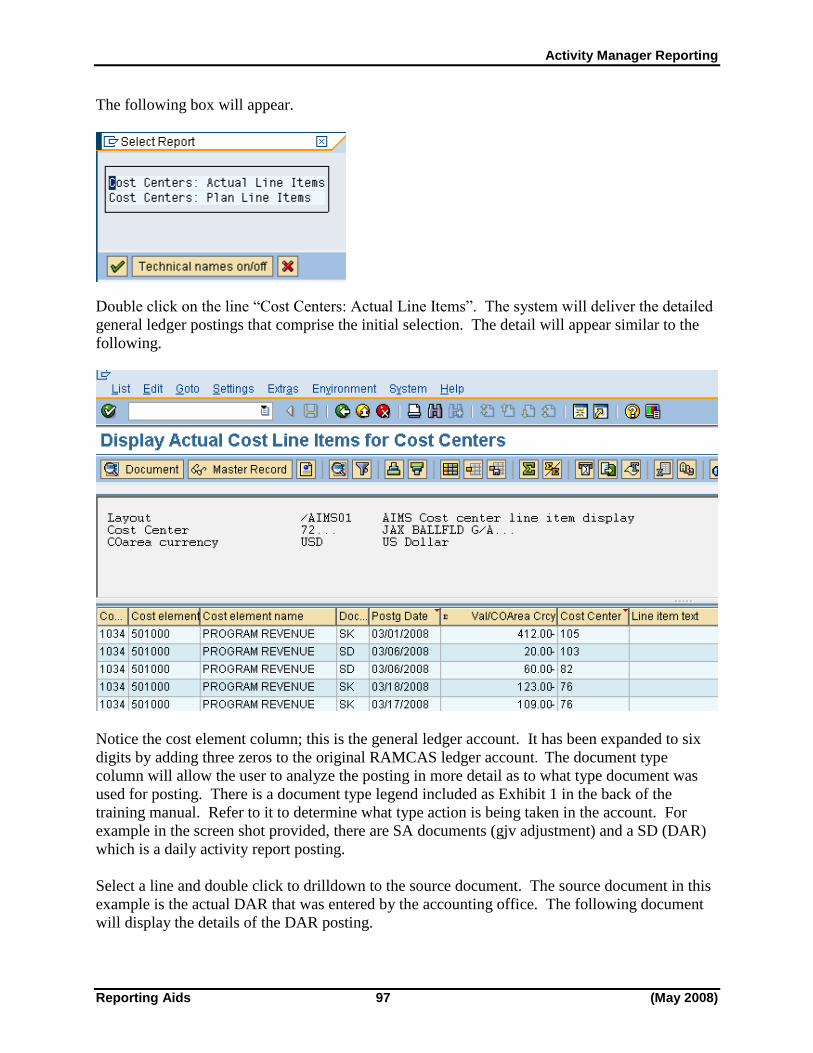
The following box will appear.
Double click on the line “Cost Centers: Actual Line Items”. The system will deliver the detailed
general ledger postings that comprise the initial selection. The detail will appear similar to the
following.
Notice the cost element column; this is the general ledger account. It has been expanded to six
digits by adding three zeros to the original RAMCAS ledger account. The document type
column will allow the user to analyze the posting in more detail as to what type document was
used for posting. There is a document type legend included as Exhibit 1 in the back of the
training manual. Refer to it to determine what type action is being taken in the account. For
example in the screen shot provided, there are SA documents (gjv adjustment) and a SD (DAR)
which is a daily activity report posting.
Select a line and double click to drilldown to the source document. The source document in this
example is the actual DAR that was entered by the accounting office. The following document
will display the details of the DAR posting.

Activity Manager Reporting (CO)
(May 2008) 98 Reporting Aids
Header Information
If there are questions about the posting after reviewing the document, click the header
information button . This will reveal the exact time the document was posted and the
accounting person responsible for posting. If there is a question or error, contact the user listed
in the header box. See the following display.
Activity Manager Reporting
Reporting Aids 99 (May 2008)
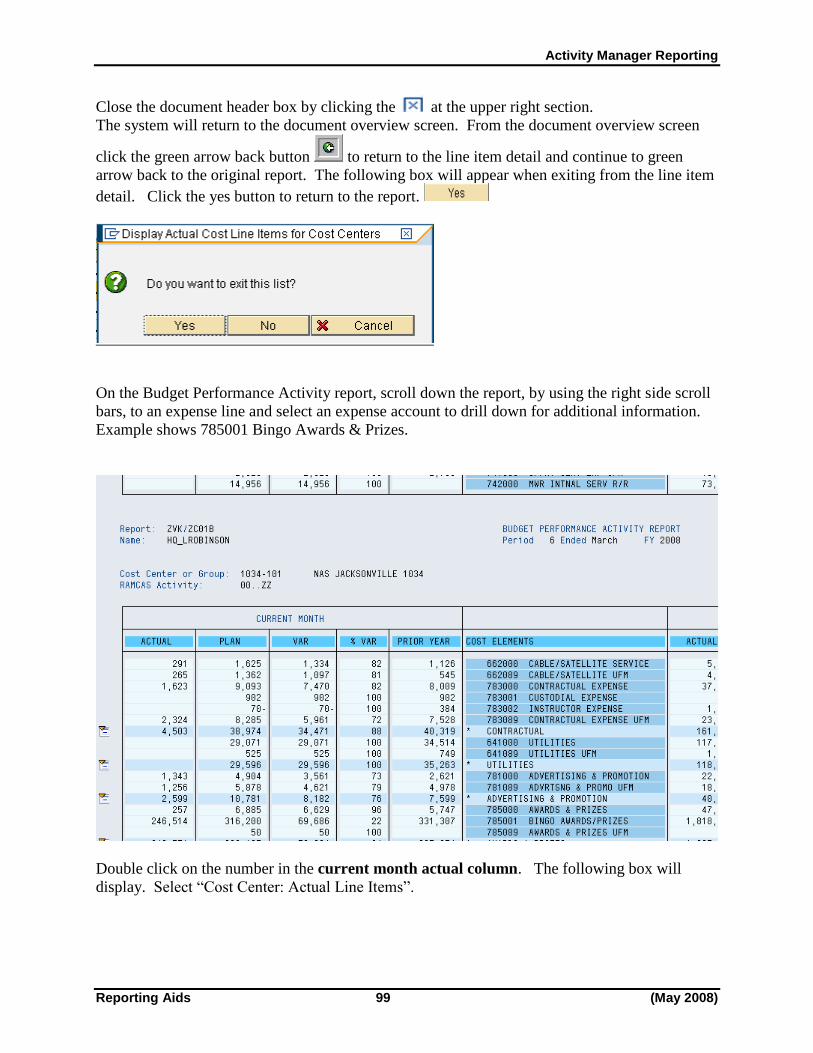
Close the document header box by clicking the at the upper right section.
The system will return to the document overview screen. From the document overview screen
click the green arrow back button to return to the line item detail and continue to green
arrow back to the original report. The following box will appear when exiting from the line item
detail. Click the yes button to return to the report.
On the Budget Performance Activity report, scroll down the report, by using the right side scroll
bars, to an expense line and select an expense account to drill down for additional information.
Example shows 785001 Bingo Awards & Prizes.
Double click on the number in the current month actual column. The following box will
display. Select “Cost Center: Actual Line Items”.

Activity Manager Reporting (CO)
(May 2008) 100 Reporting Aids
The detail general ledger for the account will follow.
Overview Vendor Invoice
Select an item with a KR (vendor invoice) document type and double click on the line. The
example is using $4500.00 to drill on. The system will display the source document as a vendor
invoice. Notice the Vendor account.

Activity Manager Reporting
Reporting Aids 101 (May 2008)
Each vendor has a unique vendor number in SAP. In this example if there were any questions
about this charge, the user could identify the vendor to help recall the expenditure. Note in the
text field there is additional useful information.
To return to the previous screen, use the green arrow back button click again to return to
the original report. The following box will display, click the yes button.
Use the green arrow back to exit the report. The following box will display, click the yes button
to return to the report tree.
In addition to being able to drilldown on the payment, the user may also drilldown for the
documentation that backs up the payment. This would include the purchase order and goods
receipt for purchases of supplies. Using KSBB, display an Executive Summary. Double click
on the current month amount for Supplies.
Activity Manager Reporting (CO)
(May 2008) 102 Reporting Aids
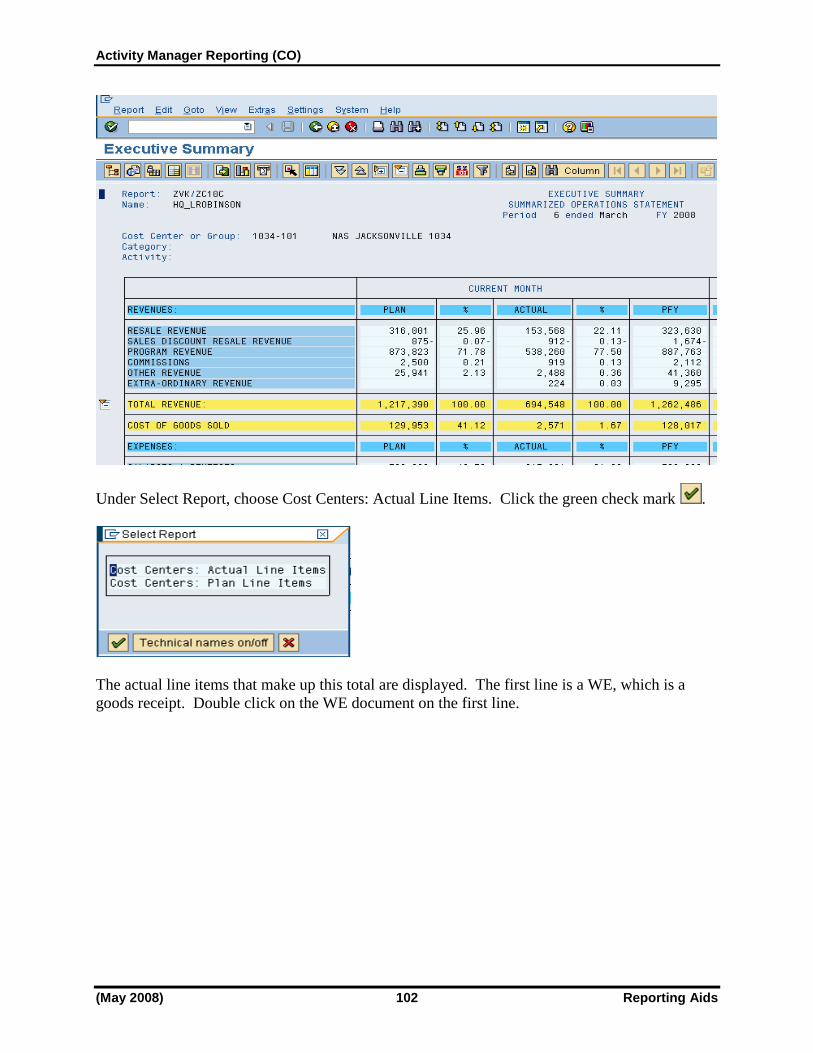
Under Select Report, choose Cost Centers: Actual Line Items. Click the green check mark .
The actual line items that make up this total are displayed. The first line is a WE, which is a
goods receipt. Double click on the WE document on the first line.

Activity Manager Reporting
Reporting Aids 103 (May 2008)
The next screen displays the Goods Receipt document. This is the second part of the three-way
match process.

Activity Manager Reporting (CO)
(May 2008) 104 Reporting Aids
From the General tab, all details about the goods received is displayed. The Vendor tab displays
the vendor number, name, zip code and city. The third tab provides the purchasing group and the
name of person ordering. The Doc. Info tab details the posting date, time, and person‟s name
entering the goods receipt into the system. Also, from this tab, click on the FI Documents button
to display the actual accounting documents for this goods receipt.
Use the red X to close the window when finished reviewing the Accounting documents.
Additionally, the user can review the purchase order from this screen. Click on the Purchase
Order Data tab in the bottom section of the screen.

Activity Manager Reporting
Reporting Aids 105 (May 2008)
In order to see the complete details for the purchase order, click on the Purchase Order document
number. If necessary, the user can display any of the information on the purchase order by
clicking on the tabs or using any of the buttons in the toolbar. Green arrow back after
reviewing the purchase order.
To see the PO History, click on the scroll to the right of the Purchase Order Document number.
Activity Manager Reporting (CO)
(May 2008) 106 Reporting Aids
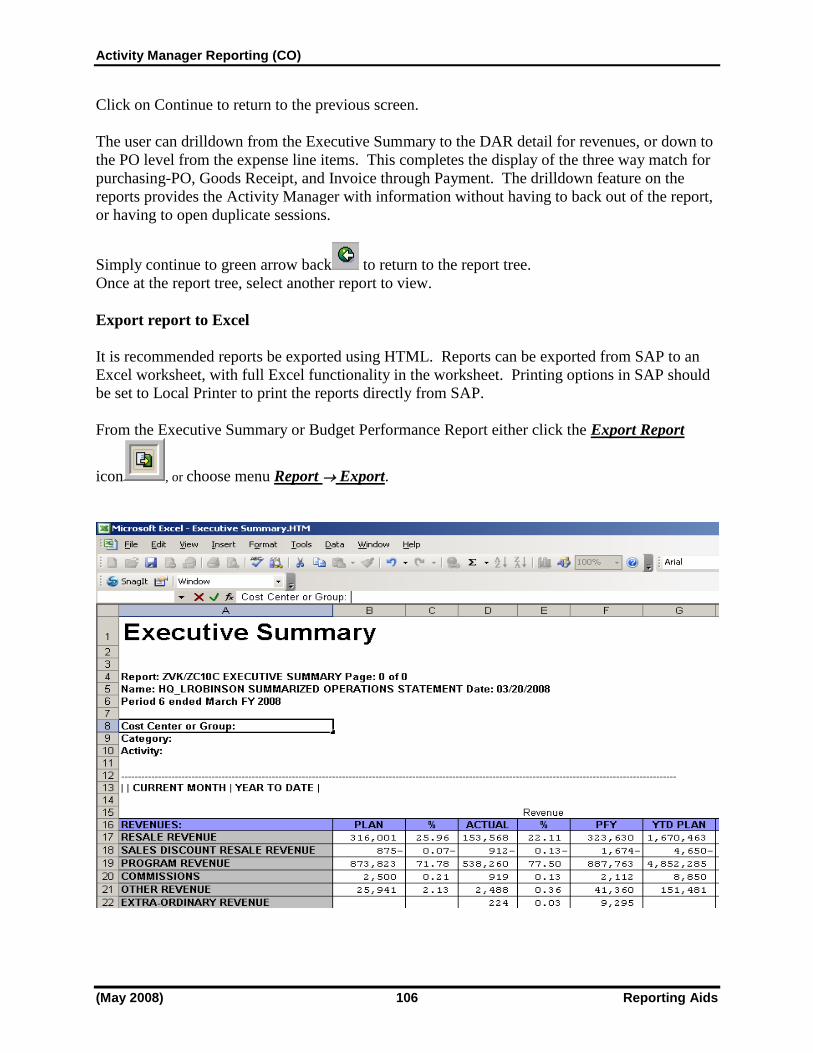
Click on Continue to return to the previous screen.
The user can drilldown from the Executive Summary to the DAR detail for revenues, or down to
the PO level from the expense line items. This completes the display of the three way match for
purchasing-PO, Goods Receipt, and Invoice through Payment. The drilldown feature on the
reports provides the Activity Manager with information without having to back out of the report,
or having to open duplicate sessions.
Simply continue to green arrow back to return to the report tree.
Once at the report tree, select another report to view.
Export report to Excel
It is recommended reports be exported using HTML. Reports can be exported from SAP to an
Excel worksheet, with full Excel functionality in the worksheet. Printing options in SAP should
be set to Local Printer to print the reports directly from SAP.
From the Executive Summary or Budget Performance Report either click the Export Report
icon , or choose menu Report Export.

Activity Manager Reporting
Reporting Aids 107 (May 2008)
Reports via E-Mail
One of the new features that have been added to the report functions is the ability to send a copy
of the complete report via email to the user or another recipient as a PDF file. This is a very
simple procedure as illustrated below.
With the report showing on the screen, click the printer button on the top menu bar
The following Print Variation Reports window will be shown. Make sure the Current Report
radio button is checked. Checking the second selection button will not only slow all printer
functions but also would probably crash your email server.
Just click the Green Checkmark on the window to continue.
NOTE: Until a user’s email address is recorded in the SAP system, the
described function will not operate. It is recommended that user’s
periodically review the e-mail address on file in SAP. Please send
updated information to the helpdesk so that this very valuable
function is available to you.

Activity Manager Reporting (CO)
(May 2008) 108 Reporting Aids
The Print Report window has several choices. Click the „Print all pages’ radio button. This tells
the system that to produce all pages of the current report, not all the variations. Again, click the
green check mark to continue.
Type “MAIL” in the Output Device text box as shown above. Then click “Continue” on the
bottom of this window.

Activity Manager Reporting
Reporting Aids 109 (May 2008)
A pop-up window or message at the bottom of the screen shows the results.
After email processing is complete, a message will appear in the user‟s Email (Outlook, not SAP
Workplace) that the report has been received. The subject line should look very similar to the
one shown here.
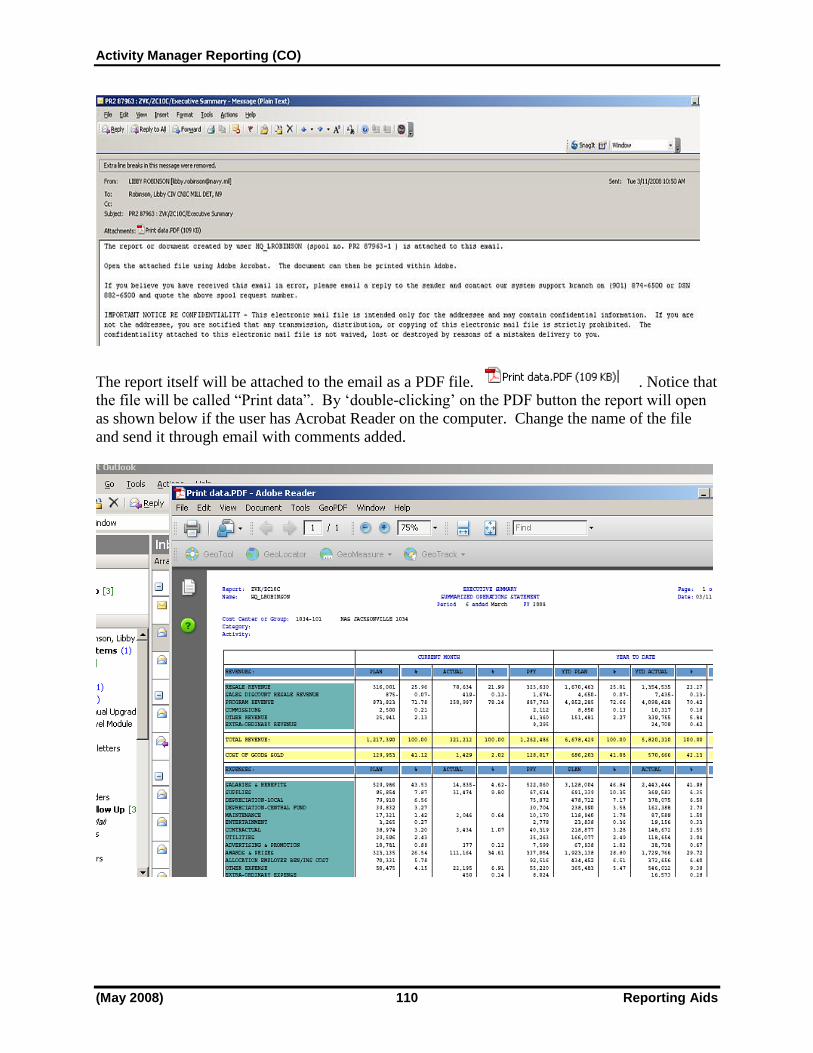
Activity Manager Reporting (CO)
(May 2008) 110 Reporting Aids
The report itself will be attached to the email as a PDF file. . Notice that
the file will be called “Print data”. By „double-clicking‟ on the PDF button the report will open
as shown below if the user has Acrobat Reader on the computer. Change the name of the file
and send it through email with comments added.
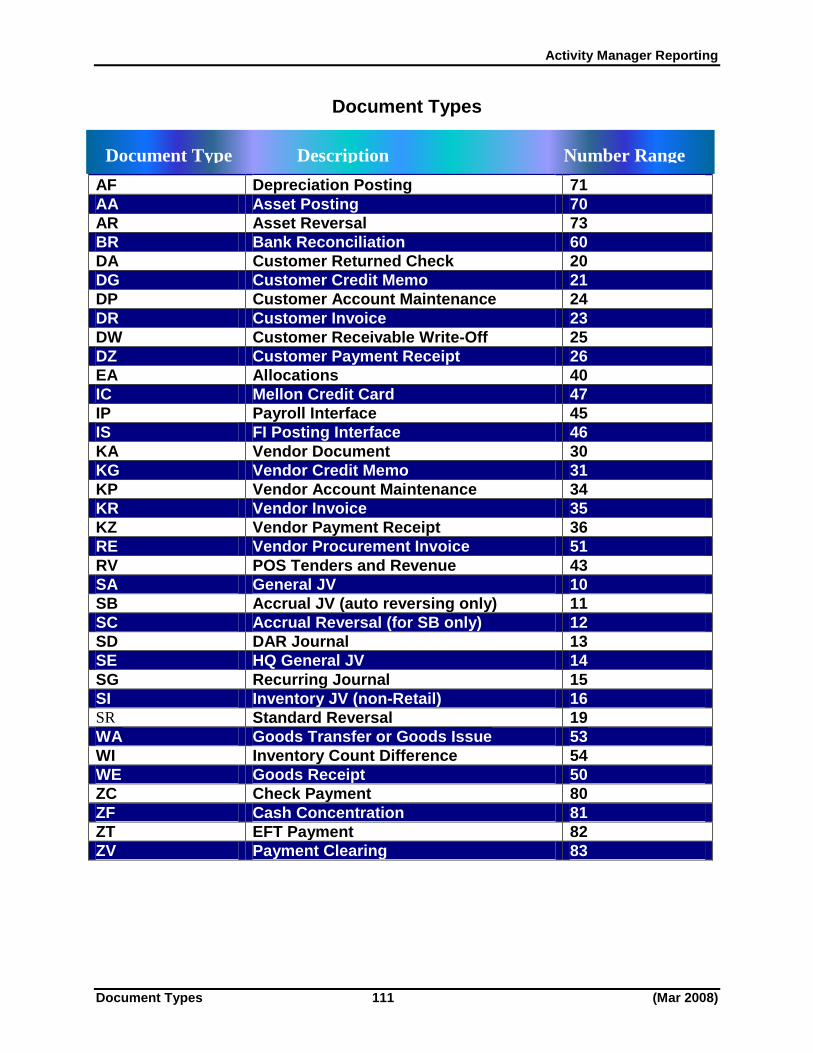
Activity Manager Reporting
Document Types 111 (Mar 2008)
Document Types
AF Depreciation Posting 71
AA Asset Posting 70
AR Asset Reversal 73
BR Bank Reconciliation 60
DA Customer Returned Check 20
DG Customer Credit Memo 21
DP Customer Account Maintenance 24
DR Customer Invoice 23
DW Customer Receivable Write-Off 25
DZ Customer Payment Receipt 26
EA Allocations 40
IC Mellon Credit Card 47
IP Payroll Interface 45
IS FI Posting Interface 46
KA Vendor Document 30
KG Vendor Credit Memo 31
KP Vendor Account Maintenance 34
KR Vendor Invoice 35
KZ Vendor Payment Receipt 36
RE Vendor Procurement Invoice 51
RV POS Tenders and Revenue 43
SA General JV 10
SB Accrual JV (auto reversing only) 11
SC Accrual Reversal (for SB only) 12
SD DAR Journal 13
SE HQ General JV 14
SG Recurring Journal 15
SI Inventory JV (non-Retail) 16 SR Standard Reversal 19
WA Goods Transfer or Goods Issue 53
WI Inventory Count Difference 54
WE Goods Receipt 50
ZC Check Payment 80
ZF Cash Concentration 81
ZT EFT Payment 82
ZV Payment Clearing 83
Document Type Description Number Range
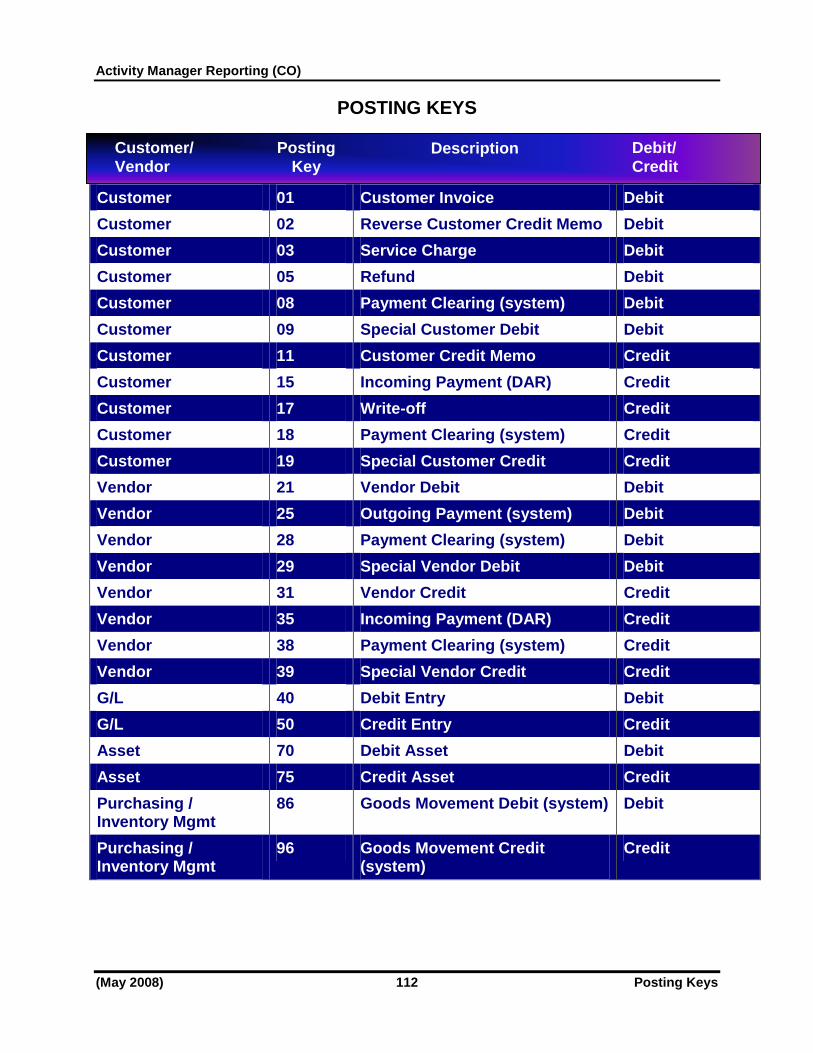
Activity Manager Reporting (CO)
(May 2008) 112 Posting Keys
POSTING KEYS
Customer 01 Customer Invoice Debit
Customer 02 Reverse Customer Credit Memo Debit
Customer 03 Service Charge Debit
Customer 05 Refund Debit
Customer 08 Payment Clearing (system) Debit
Customer 09 Special Customer Debit Debit
Customer 11 Customer Credit Memo Credit
Customer 15 Incoming Payment (DAR) Credit
Customer 17 Write-off Credit
Customer 18 Payment Clearing (system) Credit
Customer 19 Special Customer Credit Credit
Vendor 21 Vendor Debit Debit
Vendor 25 Outgoing Payment (system) Debit
Vendor 28 Payment Clearing (system) Debit
Vendor 29 Special Vendor Debit Debit
Vendor 31 Vendor Credit Credit
Vendor 35 Incoming Payment (DAR) Credit
Vendor 38 Payment Clearing (system) Credit
Vendor 39 Special Vendor Credit Credit
G/L 40 Debit Entry Debit
G/L 50 Credit Entry Credit
Asset 70 Debit Asset Debit
Asset 75 Credit Asset Credit
Purchasing / Inventory Mgmt
86 Goods Movement Debit (system) Debit
Purchasing / Inventory Mgmt
96 Goods Movement Credit (system)
Credit
Customer/
Vendor
Posting
Key Description Debit/
Credit

Activity Manager Reporting (CO)
SAP List Viewer (ALV) 113 (May 2008)
SAP List Viewer (ALV) Overview
The SAP List Viewer (ALV) functionality unifies and simplifies the use of lists in the SAP ERP
system. ALV presents a uniform and generally consistent look-and-feel to all of the reports
using it. Common ALV functionality buttons include selecting, filtering, sorting, displaying,
summarizing, sub-totaling, drill-down, emailing, and downloading to a file.
The functionality also permits users to customize the entire layout of a report from changing the
column order and adding new columns to enabling filters and sorting criteria. The user layouts
can be saved for future use.
ALV provides standardized functions for many reports, such as:
● Sort data by any column
● Sub-total data by any column
● Column display layouts are user-definable through the use of display layouts (also
known as display variants)
Many reports use ALV functionality, such as:
● GL, vendor and customer account line item displays
● Customer aging reports
● GL, vendor and customer account balances
● Check Register Report
There are common ALV function icons for both reports and line item displays. Line item
display reports and some other specialized reports have additional buttons.
Classic ALV vs. ALV Grid
There are two different presentation methods used by the SAP List Viewer technology: Classic
ALV and ALV Grid. The Classic ALV method renders reports as text-based, whereas the ALV
Grid method is more graphical in nature.
NOTE: Not all reports are available in both Classic ALV view and ALV Grid view at this time.
Future SAP enhancements will slowly phase out the Classic ALV view, and leave the ALV Grid
view as the default display.

Activity Manager Reporting (CO)
(May 2008) 114 SAP List Viewer (ALV)
Balance Sheet in Classical List Display:
Balance Sheet in ALV Grid Display:
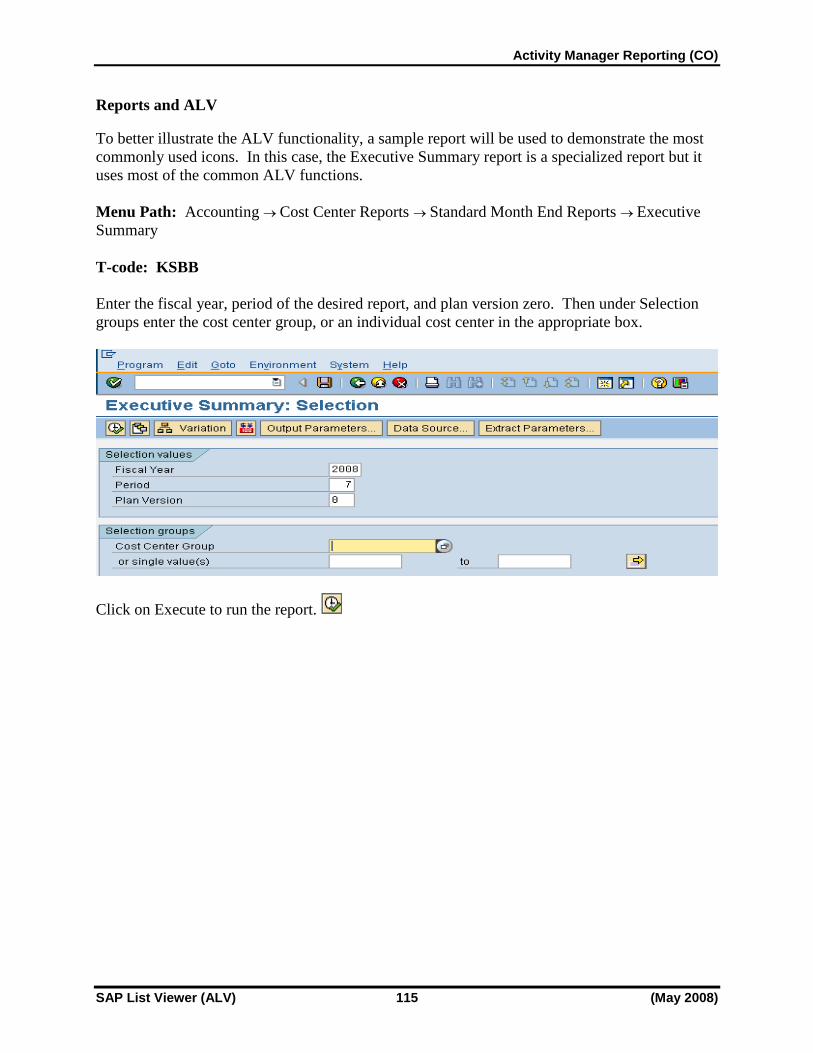
Activity Manager Reporting (CO)
SAP List Viewer (ALV) 115 (May 2008)
Reports and ALV
To better illustrate the ALV functionality, a sample report will be used to demonstrate the most
commonly used icons. In this case, the Executive Summary report is a specialized report but it
uses most of the common ALV functions.
Menu Path: Accounting Cost Center Reports Standard Month End Reports Executive
Summary
T-code: KSBB
Enter the fiscal year, period of the desired report, and plan version zero. Then under Selection
groups enter the cost center group, or an individual cost center in the appropriate box.
Click on Execute to run the report.
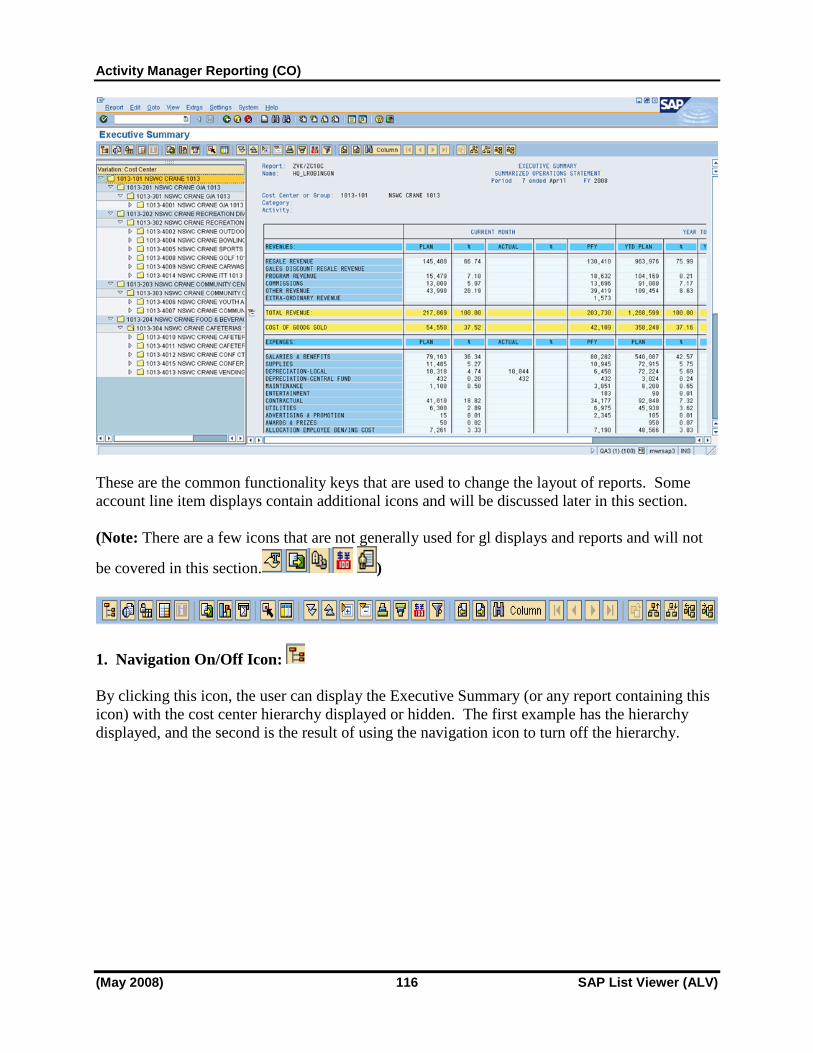
Activity Manager Reporting (CO)
(May 2008) 116 SAP List Viewer (ALV)
These are the common functionality keys that are used to change the layout of reports. Some
account line item displays contain additional icons and will be discussed later in this section.
(Note: There are a few icons that are not generally used for gl displays and reports and will not
be covered in this section. )
1. Navigation On/Off Icon:
By clicking this icon, the user can display the Executive Summary (or any report containing this
icon) with the cost center hierarchy displayed or hidden. The first example has the hierarchy
displayed, and the second is the result of using the navigation icon to turn off the hierarchy.

Activity Manager Reporting (CO)
SAP List Viewer (ALV) 117 (May 2008)
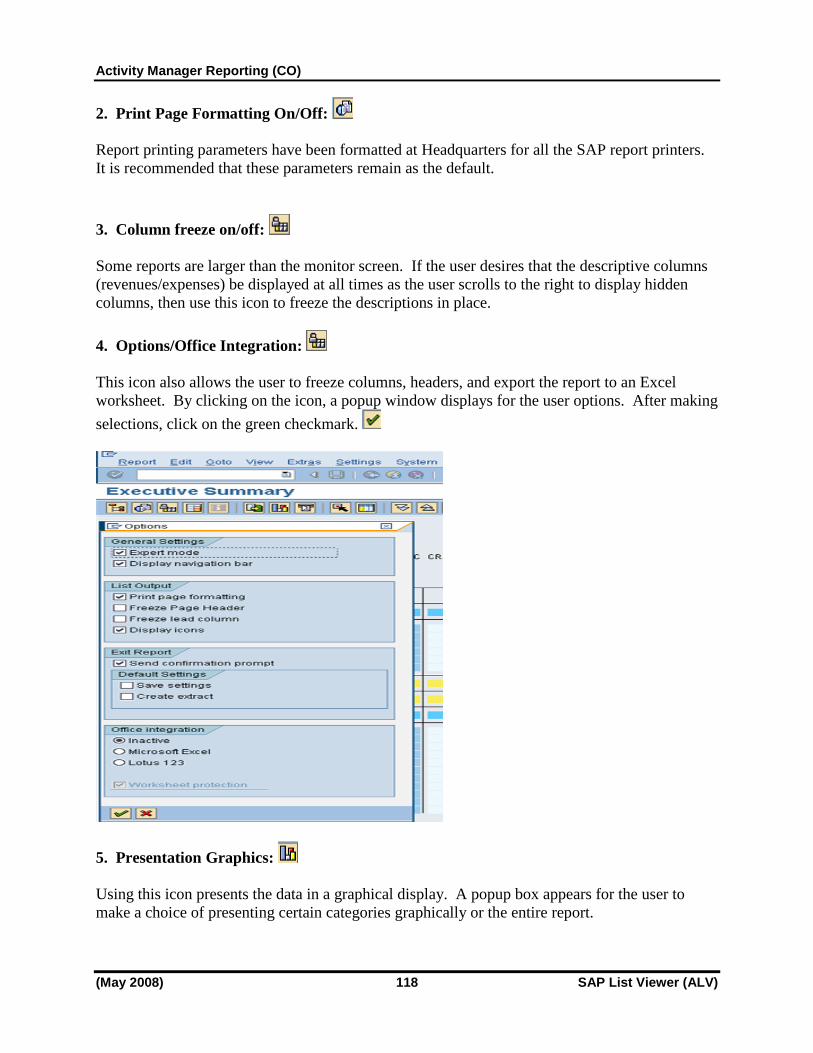
Activity Manager Reporting (CO)
(May 2008) 118 SAP List Viewer (ALV)
2. Print Page Formatting On/Off:
Report printing parameters have been formatted at Headquarters for all the SAP report printers.
It is recommended that these parameters remain as the default.
3. Column freeze on/off:
Some reports are larger than the monitor screen. If the user desires that the descriptive columns
(revenues/expenses) be displayed at all times as the user scrolls to the right to display hidden
columns, then use this icon to freeze the descriptions in place.
4. Options/Office Integration:
This icon also allows the user to freeze columns, headers, and export the report to an Excel
worksheet. By clicking on the icon, a popup window displays for the user options. After making
selections, click on the green checkmark.
5. Presentation Graphics:
Using this icon presents the data in a graphical display. A popup box appears for the user to
make a choice of presenting certain categories graphically or the entire report.

Activity Manager Reporting (CO)
SAP List Viewer (ALV) 119 (May 2008)
Executive Summary was chosen for this example and then click on the green arrow.
6. Mail Recipient
The icon automatically transfers the user to the SAP Workplace and into an outgoing e-mail.
The subject/title is automatically defaulted into the SAP mail and the report is automatically
attached.
Additional text can be added to the body of the email and the recipients can be either internet
email addresses or internal SAPmail addresses. The email subject line can also be changed.

Activity Manager Reporting (CO)
(May 2008) 120 SAP List Viewer (ALV)
7. Call up Report:
To view the details that make up the amounts in the Executive Summary, use this icon to pull up
line item details for budgeted or actual line items. User will make a choice via a popup box.
8. Expand/Collapse Report Fully:
These icons can be used to toggle between a fully expanded report as in all the previous
examples or one that only has totals by category (for this example, expenses cannot be collapsed
any further).

Activity Manager Reporting (CO)
SAP List Viewer (ALV) 121 (May 2008)
9. Expand/Collapse Section:
Sometimes, the user may want sections of a report expanded and other sections collapsed. These
icons allow that function. In the following example, Total Revenue is still collapsed, while the
UFM offset section has been expanded.

Activity Manager Reporting (CO)
(May 2008) 122 SAP List Viewer (ALV)
10. Previous section/Next section:
These icons allow the user to scroll vertically on the report.
11. Sort in Ascending/Descending Order
By clicking on the header of any column and then clicking either of these icons, ,the line
item display or report can be sorted by the data in that column. For the example, we can sort in
ascending or descending order based on the amounts in the current month revenue. The
following list has been sorted in descending order based on the amount. That icon will appear in
the column to let the user know the report has been sorted.
12. Find Column:
Due to the width of some reports, all columns may not display at the same time. This icon
provides a dropdown box so that the user can select a column to display.

Activity Manager Reporting (CO)
SAP List Viewer (ALV) 123 (May 2008)
Line Item Displays and ALV
The following report is a line item display (FBL3N) in the ALV grid format. Below this report
is the same general ledger account display in the classic view. The ALV function icons are the
same except that the classic view has additional icons to scroll left or right across the screen.
ALV Grid View:
ALV Classic View:

Activity Manager Reporting (CO)
(May 2008) 124 SAP List Viewer (ALV)
T-code: FBL3N
The following icons appear in the FBL3N transaction code for general ledger line item displays.
1. Scrolling
These four icons allow the user to move the screen left or right to view columns
that may be outside the parameters of monitor.
2. Display Document:
By clicking on any line item in the line item display, and then clicking this icon, the actual
document for this posting is displayed. (Click on any cell or the blue box to the left of the line
item.)
Double click on any line item or click the
blue box to the left of the item.

Activity Manager Reporting (CO)
SAP List Viewer (ALV) 125 (May 2008)
The first line item of the document will be displayed.
To see the entire document, then click the Document Overview button.

Activity Manager Reporting (CO)
(May 2008) 126 SAP List Viewer (ALV)
3. Change Document:
Use this icon to change assignment and text on documents. These are the only two fields that
can be changed on a document.
Header information can be changed from this view by clicking on the Header icon.
Only the Doc. Header Text and Reference can be changed.

Activity Manager Reporting (CO)
SAP List Viewer (ALV) 127 (May 2008)
4. Mass Change
NOTE: Please call the SAP HelpDesk before attempting to use this icon. Check the items
that need to be changed in the boxes to the far left of the screen.
Click on the Mass Change icon , you can change certain fields in numerous documents
simultaneously. Enter the data. This data will apply to all documents highlighted and will
replace any existing data already in those fields! Be sure you want all the data overwritten
on the documents chosen.
Check items to be
changed
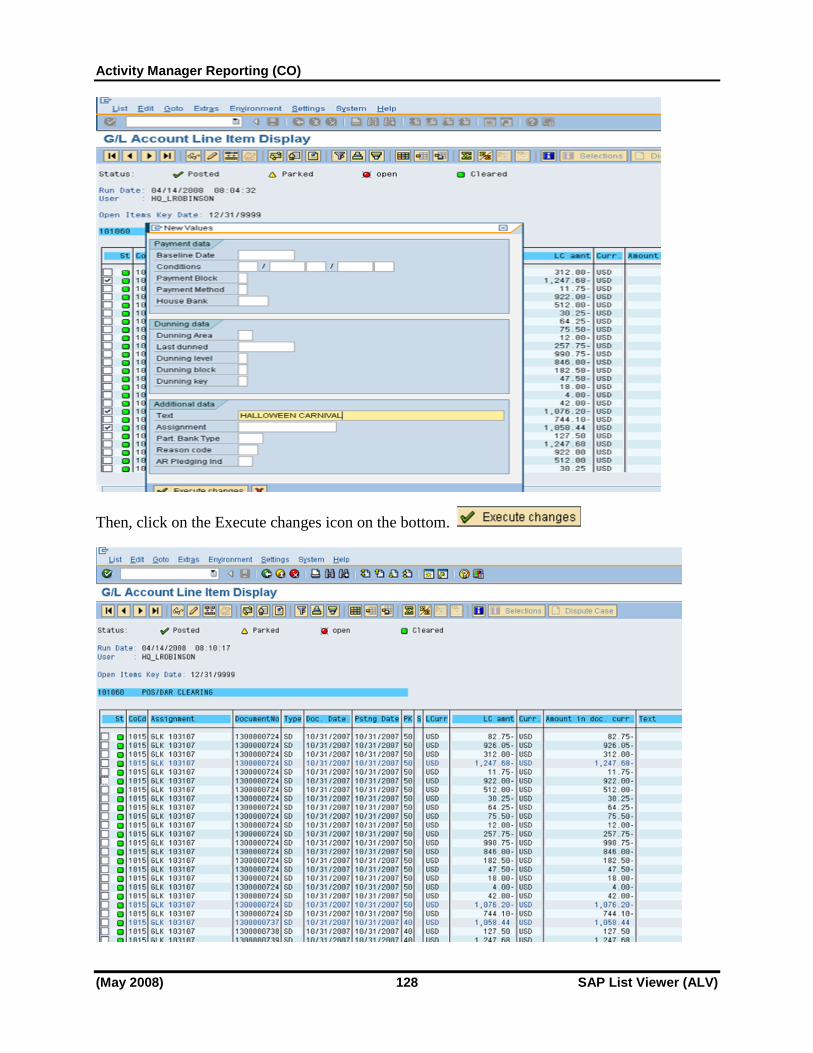
Activity Manager Reporting (CO)
(May 2008) 128 SAP List Viewer (ALV)
Then, click on the Execute changes icon on the bottom.

Activity Manager Reporting (CO)
SAP List Viewer (ALV) 129 (May 2008)
The line items display screen returns with those line items shaded. To see the effect of your
changes, click on List>Refresh.
5. Set Filter
If you only want to see limited information from this report, you can click on the column heading
and then click the filter icon. The user may only want to see the DARS from a certain
posting date. Choose posting date, click the left arrow, and then the green arrow.
Enter only the dates needed: From 01/07/2008 to 01/07/2008. Click the green check mark at the
bottom .
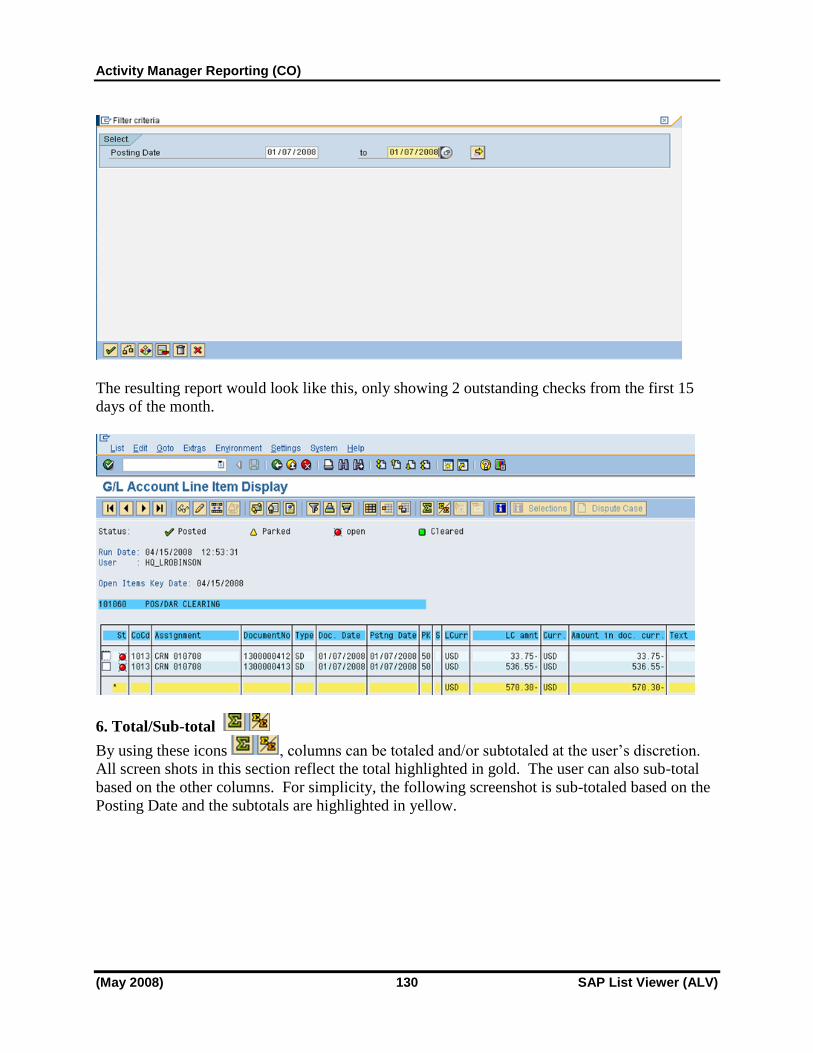
Activity Manager Reporting (CO)
(May 2008) 130 SAP List Viewer (ALV)
The resulting report would look like this, only showing 2 outstanding checks from the first 15
days of the month.
6. Total/Sub-total
By using these icons , columns can be totaled and/or subtotaled at the user‟s discretion.
All screen shots in this section reflect the total highlighted in gold. The user can also sub-total
based on the other columns. For simplicity, the following screenshot is sub-totaled based on the
Posting Date and the subtotals are highlighted in yellow.

Activity Manager Reporting (CO)
SAP List Viewer (ALV) 131 (May 2008)
7. List Status:
The list status ( ) simply identifies the most recent functions used on any report. For this
example, the data is listed in ascending order by posting date and sub-totaled by posting date.
There are a total of ten (10) records in the report with seven (7) sub-totals/totals.
NOTE: On certain reports and line item displays in other modules, this pushbutton will send the
user to SAP online help.

Activity Manager Reporting (CO)
(May 2008) 132 SAP List Viewer (ALV)
8a. Spreadsheet-Method 1 (New)
The screens shown below have recently changed and are quite different from the previous
editions. The example used for this report is under the T-code KSBB>Line Item Reports>Cost
Centers: Actual Line Items. By using this icon , the user can export the report to an Excel
spreadsheet.
Leave the default setting and click on the green check mark .
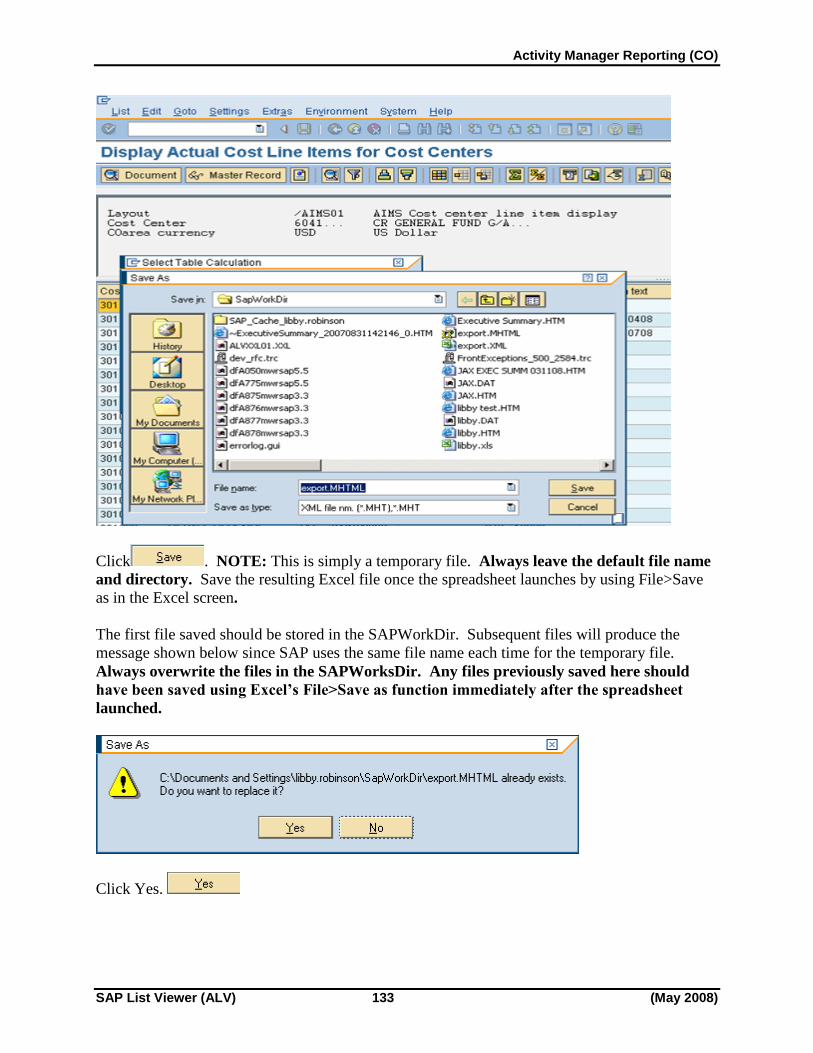
Activity Manager Reporting (CO)
SAP List Viewer (ALV) 133 (May 2008)
Click . NOTE: This is simply a temporary file. Always leave the default file name
and directory. Save the resulting Excel file once the spreadsheet launches by using File>Save
as in the Excel screen.
The first file saved should be stored in the SAPWorkDir. Subsequent files will produce the
message shown below since SAP uses the same file name each time for the temporary file.
Always overwrite the files in the SAPWorksDir. Any files previously saved here should
have been saved using Excel’s File>Save as function immediately after the spreadsheet
launched.
Click Yes.

Activity Manager Reporting (CO)
(May 2008) 134 SAP List Viewer (ALV)
Data is transferred to an Excel spreadsheet with full functionality in Excel. Use the File>SaveAs
on the top toolbar to save the spreadsheet on the Desktop or other location. All of the
summation, sorting, subtotaling and filter criteria completed in SAP are passed to Excel. This is a tremendous improvement over the previous SAP Excel integration and is the
recommended choice.
8b. Spreadsheet-Method 2 (Classic)
Another option for the spreadsheet is to click on the Spreadsheet icon , use the dropdown box,
and choose Excel in Existing XXL format. This is the same as the standard SAP-Excel
integration on previous versions of AIMS/SAP.
Note: This is merely a snapshot of the data stored in SAP. There is no active or dynamic link back to SAP. Any changes made to the data in
the EXCEL spreadsheet will not transfer to SAP.
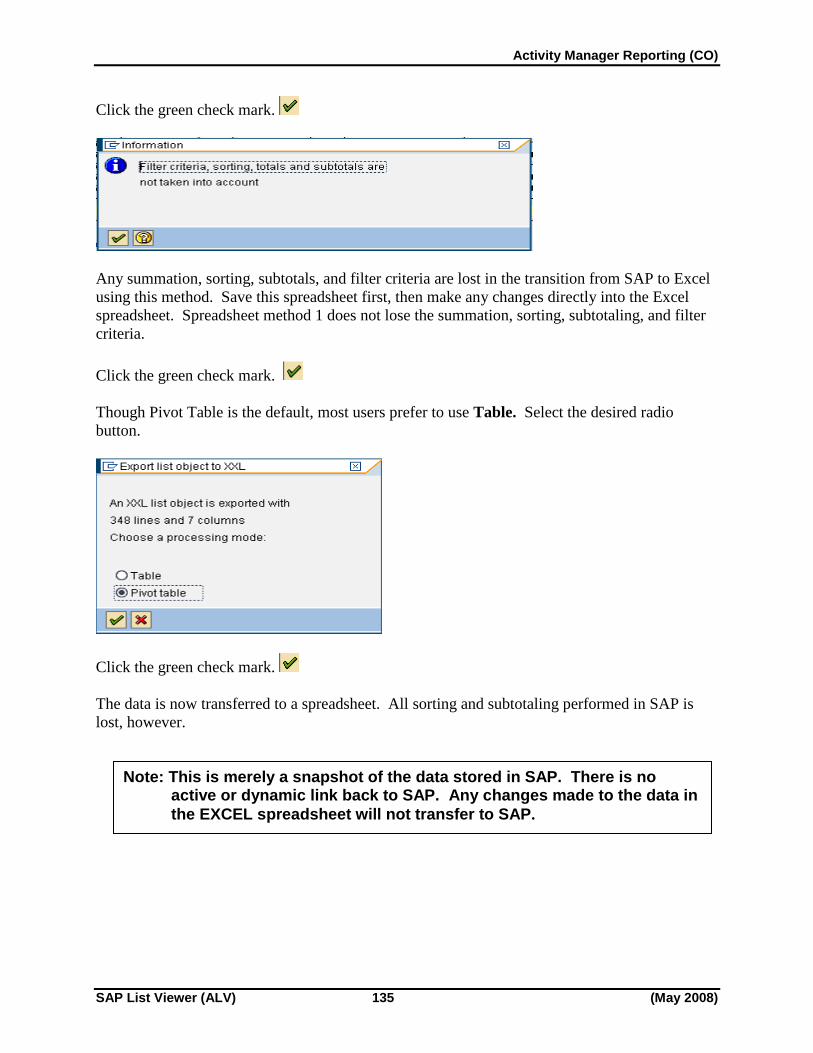
Activity Manager Reporting (CO)
SAP List Viewer (ALV) 135 (May 2008)
Click the green check mark.
Any summation, sorting, subtotals, and filter criteria are lost in the transition from SAP to Excel
using this method. Save this spreadsheet first, then make any changes directly into the Excel
spreadsheet. Spreadsheet method 1 does not lose the summation, sorting, subtotaling, and filter
criteria.
Click the green check mark.
Though Pivot Table is the default, most users prefer to use Table. Select the desired radio
button.
Click the green check mark.
The data is now transferred to a spreadsheet. All sorting and subtotaling performed in SAP is
lost, however.
Note: This is merely a snapshot of the data stored in SAP. There is no active or dynamic link back to SAP. Any changes made to the data in
the EXCEL spreadsheet will not transfer to SAP.

Activity Manager Reporting (CO)
(May 2008) 136 SAP List Viewer (ALV)
9. Expand/Collapse
Sometimes the user may want to view information with all the line items, but then have a quick
view of totals based on specific criteria. For instance, using T-code FBL3N will display all the
open items for this account on the current day by default. Subtotaling by cost center will display
the total debits/credits for a specific date for that cost center. Scrolling to the bottom of the
screen and clicking on the total, and clicking on the Collapse icon will display the total of all
open items by cost center. This can be an exceptionally handy tool when preparing a specialized
report.
The Collapse function can also be reached by clicking on Settings>Summation Levels>Define
Breakdown>Account. To return to the full line items display click Settings> Summation
Levels>Breakdown>Non-total Lines.
This screen is FBL3N for the 151000 account in company code 1146 including all open items for
the current day 02/14/2007:

Activity Manager Reporting (CO)
SAP List Viewer (ALV) 137 (May 2008)
Account 151000 subtotaled based on the cost center:

Activity Manager Reporting (CO)
(May 2008) 138 SAP List Viewer (ALV)
Finally, scroll to the bottom of the screen, place the cursor on the total cell, and then click on the
Collapse icon.
Returning to the previous screen with all the line items displayed and subtotaled by cost center is
easily accomplished by clicking on the total box again and then clicking the Expand icon.
Accounts with large amounts of line items can be collapsed to only display the total by scrolling
to the bottom and clicking on the total box and then clicking the Collapse icon. This is
especially helpful when displaying a range of accounts. Each total has to be collapsed, but the
amount of scrolling is greatly reduced, if only totals are needed.

Activity Manager Reporting (CO)
SAP List Viewer (ALV) 139 (May 2008)
The Balance Sheet and ALV
There are some slight variations on the ALV icons with the Balance Sheet. (Most of the icons
have been discussed previously.) There are no ALV icons in the Classic View, only in the ALV
Grid view.

Activity Manager Reporting (CO)
(May 2008) 140 SAP List Viewer (ALV)
1. Details Icon:
Click on any line item in the report and then click the details icon. In this case, all the details
for the 101002 account are displayed.
2. Delete Filter:
Simply reverses any filters that have been placed.
3. Select Layout
All the screenshots in this section have been in the /AIMS01 standard layout. Other layout
options can be chosen using the “Select layout” icon.
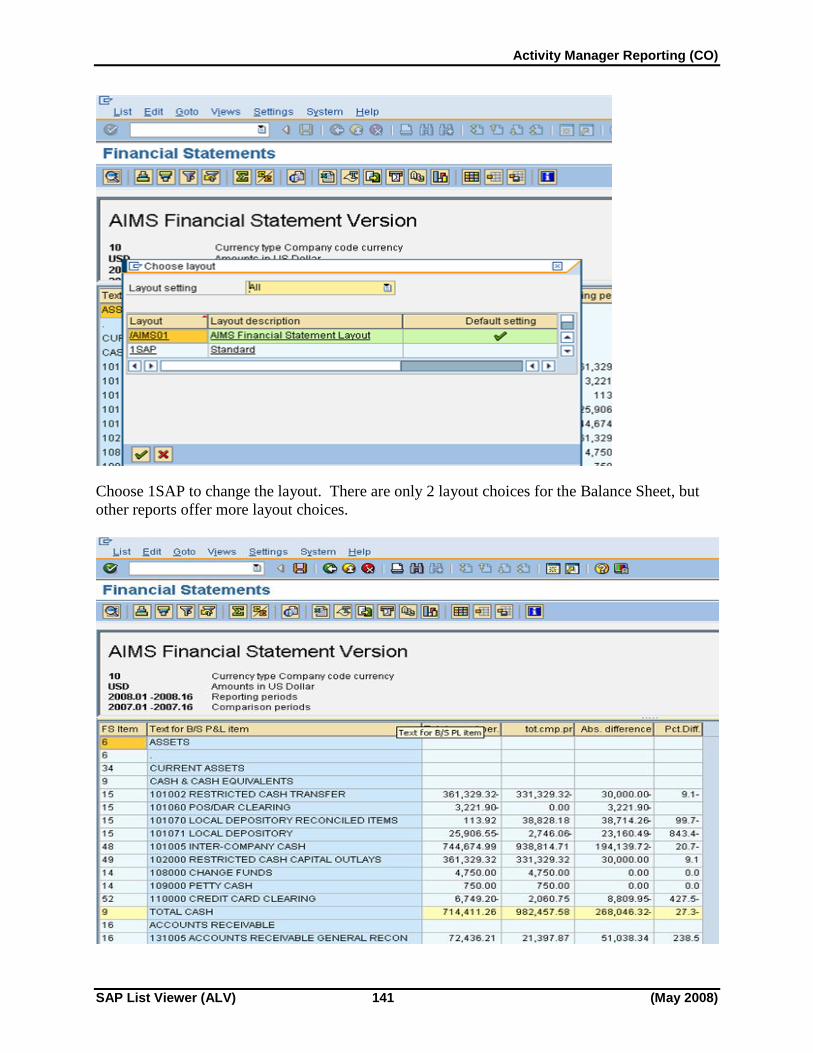
Activity Manager Reporting (CO)
SAP List Viewer (ALV) 141 (May 2008)
Choose 1SAP to change the layout. There are only 2 layout choices for the Balance Sheet, but
other reports offer more layout choices.
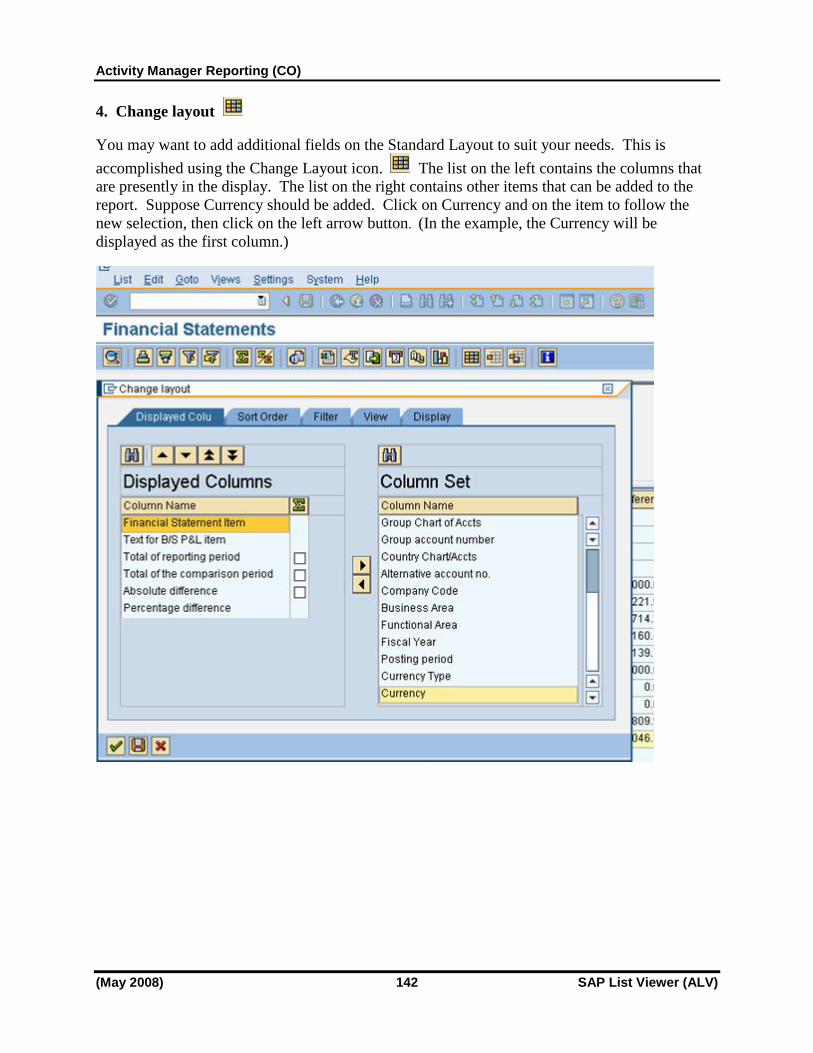
Activity Manager Reporting (CO)
(May 2008) 142 SAP List Viewer (ALV)
4. Change layout
You may want to add additional fields on the Standard Layout to suit your needs. This is
accomplished using the Change Layout icon. The list on the left contains the columns that
are presently in the display. The list on the right contains other items that can be added to the
report. Suppose Currency should be added. Click on Currency and on the item to follow the
new selection, then click on the left arrow button. (In the example, the Currency will be
displayed as the first column.)

Activity Manager Reporting (CO)
SAP List Viewer (ALV) 143 (May 2008)
Click on the copy button at the bottom, and generate the new report. The new column
“Currency” is now displayed as the first column in the newly generated report.

Activity Manager Reporting (CO)
(May 2008) 144 SAP List Viewer (ALV)
5. Save the layout
Now, suppose you want to save this particular version for future use. By clicking on the “Save
the layout” icon , you can save this as a User-Specific Display Layout.
The Layout: Save as… box reflects any filters, sorts, etc. that are active before you save the
variant. If you are satisfied with the layout, then click the SAVE button.
IMPORTANT: Please follow these rules for naming a User-Specific Display Layout. 1. Personal display variants must be assigned a name beginning with a letter (A-Z). 2. Be sure to flag the User-Specific indicator to make this a personal display variant. 3. Please do not start your personal display variants with “/”
character or over-write existing /AIMSxx display variants.
ALWAYS FLAG
THIS BOX.