activity: bioretention gip 01 - nashville · activity: bioretention gip ... a pretreatment cell,...
TRANSCRIPT

General Application
Activity: Bioretention GIP‐01
Volume 5 – Green Infrastructure Practices February 2016 1
Bioretention Description: Bioretention cells are vegetated, shallow depressions. Captured runoff is treated by filtration through an engineered soil medium, and is then either infiltrated into the subsoil or exfiltrated through an underdrain. Variations: Constructed without underdrain in soils with measured infiltration rates greater than 0.5 inch per hour, and with an underdrain in less permeable soils.
Advantages/Benefits: Reduced runoff volume
Reduced peak discharge rate
Reduced Total Suspended Solids (TSS)
Reduced pollutant loading
Reduced runoff temperature
Groundwater recharge (if soils are sufficiently permeable)
Habitat creation
Enhanced site aesthetics
Reduced heat island effect
Disadvantages/Limitations: Problems with installation can lead to failure
Minimum 2 foot separation from groundwater is required
Suitable for pollution hotspots only with underdrain and liner
Design Considerations: Maximum contributing impervious drainage area of 2.5 acres
Slope of drainage area = 1 – 5% or terraced to slow flow
Building Setbacks
For 0 to 0.5 acre drainage area: 10 feet if down‐gradient from building or level; 50 feet if up‐gradient.
0.5 to 2.5 acre drainage area: 25 feet if down‐gradient from building or level; 100 feet if up‐gradient.
Right of Way Applications Used in medians and right of way
Stormwater can be conveyed by sheet flow or grass channels
Pretreatment is especially important in roadway applications where sediment loads may be high
Design as a series of cells running parallel to roadway
See GIP‐02 Urban Bioretention for additional information
Maintenance: Regular maintenance of landscaping to
maintain healthy vegetative cover
Irrigation when necessary during first growing season
Periodic trash removal
Maintenance Burden L = Low M = Moderate H = High
M
Selection Criteria:
Level 1 – 40% Runoff Reduction Credit
Level 2 – 80% Runoff Reduction Credit
Land Use Considerations:
Residential Commercial Industrial (with MWS approval)
X
X
X

General Application
Activity: Bioretention GIP‐01
Volume 5 – Green Infrastructure Practices February 2016 2
SECTION 1: DESCRIPTION
Individual bioretention areas can serve impervious drainage areas of 2.5 acres or less; though several cells may be designed adjacent to each other to accommodate larger areas. Surface runoff is directed into a shallow landscaped depression that incorporates many of the pollutant removal mechanisms that operate in forested ecosystems. The primary component of a bioretention practice is the filter bed, which has a mixture of sand, soil and organic material as the filtering media typically with a surface mulch layer. During storms, runoff temporarily ponds up to 12 inches above the mulch layer and then rapidly filters through the bed. If the subsoil infiltration rate is 0.5 inches per hour or less, the filtered runoff is collected in an underdrain and returned to the storm drain system. The underdrain consists of a perforated pipe in a gravel layer installed along the bottom of the filter bed. Underdrains can also be installed beneath a portion of the filter bed, above a stone “sump” layer, or eliminated altogether, thereby increasing stormwater infiltration.
Bioretention can also be designed to infiltrate runoff into native soils. This can be done if the soil infiltration rate is greater than 0.5 inches per hour, the groundwater table is low, and the risk of groundwater contamination is low.
SECTION 2: PERFORMANCE
The overall runoff reduction capabilities of bioretention in terms of the Runoff Reduction Method are summarized in Table 1.1. Bioretention creates a good environment for runoff reduction, filtration, biological uptake, and microbial activity, and provides high pollutant removal. Bioretention can become an attractive landscaping feature with high amenity value and community acceptance.
Table 1.1. Runoff Volume Reduction Provided by Bioretention Basins
Stormwater Function Level 1 Design Level 2 Design
Runoff Volume Reduction (RR) 40% 80%
Sources: CSN (2008) and CWP (2007)

General Application
Activity: Bioretention GIP‐01
Volume 5 – Green Infrastructure Practices February 2016 3
SECTION 3: DESIGN TABLE
1 Storage depth is the sum of the porosity (n) of the soil media and gravel layers multiplied by their respective depths, plus the surface ponding depth. Refer to Section 6.1.
2A ponding depth of 6 inches is preferred. Ponding depths greater than 6 inches will require a specific planting plan to ensure appropriate plant selection (Section 6.8).
3Surface area coverage in reference to planting is the percentage of vegetative cover in a planting area.
Table 1.2. Bioretention Design Criteria
Level 1 Design (RR 40) Level 2 Design (RR: 80)
Sizing (Section 6.1) Sizing (Section 6.1)
Surface Area (sq. ft.) = (Tv – the volume reduced by
an upstream SCM) / Storage Depth 1
Surface Area (sq. ft.) = [(1.25)(Tv) – the volume
reduced by an upstream SCM] /Storage Depth 1
Recommended maximum contributing impervious drainage area = 2.5 acres Maximum Ponding Depth 12 inches2
Filter Media Depth minimum = 24 inches; recommended maximum = 6 feet
Filter Media Depth minimum = 36 inches; recommended maximum = 6 feet
Media & Surface Cover (Section 6.6) = supplied by vendor; the final composition should be: 70%‐85% sand; 10%‐20% Silt + Clay, with no more than 10% Clay; 5% to 10% organic matter
Sub‐soil Testing (Section 6.2): not needed if an underdrain is used; Min infiltration rate > 0.5 inch/hour in order to remove the underdrain requirement.
Sub‐soil Testing (Section 6.2): not needed if an underdrain is used; Min infiltration rate > 0.5 inch/hour in order to remove the underdrain requirement.
Underdrain (Section 6.7) = PVC or Corrugated HDPE with clean‐outs OR, none, if soil infiltration requirements are met (Section 6.2)
Underdrain & Underground Storage Layer (Section 6.7) = PVC or Corrugated HDPE with clean outs, and a minimum 12‐inch stone sump below the invert; OR, none, if soil infiltration requirements are met (Section 6.2)
Inflow: sheet flow, curb cuts, trench drains, concentrated flow, or the equivalent
Geometry (Section 6.3): Length of shortest flow path/Overall length = 0.3; OR, other design methods used to prevent short‐ circuiting; a one‐cell design (not including the pre‐ treatment cell).
Geometry (Section 6.3): Length of shortest flow path/Overall length = 0.8; OR, other design methods used to prevent short‐circuiting; a two‐cell design (not including the pretreatment cell).
Pre‐treatment (Section 6.4): a pretreatment cell,grass filter strip, gravel diaphragm, gravel flow spreader, or another approved (manufactured) pre‐treatment structure.
Pre‐treatment (Section 6.4): a pretreatment cell plus one of the following: a grass filter strip, gravel diaphragm, gravel flow spreader, or another approved (manufactured) pre‐treatment structure.
Conveyance & Overflow (Section 6.5) Conveyance & Overflow (Section 6.5)
Planting Plan (Section 6.8): a planting template to include perennials, grasses, sedges or shrubs to achieve a surface area coverage3 of at least 75% within 2 years by using the recommended spacing in Tables 1.3 – 1.8
Planting Plan (Section 6.8): a planting template to include perennials, grasses, sedges, and shrubs to achieve surface area coverage of at least 75% within 2 years by using the recommended spacing in Tables 1.3 – 1.8. MUST also include trees planted at 1 tree/400 s.f.
Suggested Building Setbacks (Section 5):
0 to 0.5 acre CDA = 10 feet if down‐gradient from building or level; 50 feet if up‐gradient. 0.5 to 2.5 acre CDA = 25 feet if down‐gradient from building or level; 100 feet if up‐
gradient. (Refer to additional setback criteria in Section 5)
Long Term Maintenance Requirements (Section 10)

General Application
Activity: Bioretention GIP‐01
Volume 5 – Green Infrastructure Practices February 2016 4
The most important design factor to consider when applying bioretention to development sites is the scale at which it will be applied, as follows:
Rain Gardens. These are small, distributed practices designed to treat runoff from small areas, such as individual rooftops, driveways and other on-lot features in single-family detached residential developments. Inflow is typically sheet flow, or can be concentrated flow with energy dissipation, when located at downspouts. Rain gardens do not currently count toward a runoff reduction credit. Please see www.raingardensfornashville.com for more information on residential rain garden construction.
Bioretention Basins. These are structures treating parking lots and/or commercial rooftops, usually in commercial or institutional areas. Throughout this GIP bioretention basins are simply referred to as Bioretention. Inflow can be either sheet flow or concentrated flow. Bioretention basins may also be distributed throughout a residential subdivision, but they should be located in common areas and within drainage easements, to treat a combination of roadway and lot runoff.
The major design goal for bioretention is to maximize runoff volume reduction and pollutant removal. To this end, designers may choose to go with the baseline design (Level 1) or choose an enhanced design (Level 2) that maximizes pollutant and runoff reduction. If soil conditions require an underdrain, bioretention areas can still qualify for the Level 2 design if they contain a stone storage layer beneath the invert of the underdrain.
Table 1.2 outlines the Level 1 and 2 bioretention design guidelines. Local simulation modeling supports these runoff reduction credits for the mentioned contributing drainage area (CDA) to surface area ratios.
Figure 1.1. A Typical Bioretention Basin treating a parking lot.

General Application
Activity: Bioretention GIP‐01
Volume 5 – Green Infrastructure Practices February 2016 5
SECTION 4: TYPICAL DETAILS
Figures 1.2 through 1.11 provide some typical details for several bioretention configurations. Additional details are provided in Appendix 1-B of this design specification.
Figure 1.2. Typical Detail of Bioretention with Additional Surface Ponding (source: VADCR, 2010)

General Application
Activity: Bioretention GIP‐01
Volume 5 – Green Infrastructure Practices February 2016 6
Figure 1.3. Typical Detail of a Bioretention Basin within the Upper Shelf of an ED Pond (source: VADCR, 2010)

Volum
Acti
me 5 – Green Infr
Fi
ivity: Bior
rastructure Prac
Figure 1
igure 1.5. Ty
retention
ctices
1.4. Typical
ypical Bioret
Bioretentio
tention Basi
February 2016
n Basin Leve
in Level 2: In
el 1 (source:
nfiltration (s
: VADCR, 20
source: VAD
Gen
013)
DCR, 2013)
neral Applicat
GIP‐
7
tion
‐01
7

Volum
Acti
me 5 – Green Infr
Figur
Figure 1
ivity: Bior
rastructure Prac
re 1.6. Typic
1.7. Typical B
retention
ctices
cal Bioretent
Bioretention
tion Basin Le
n Basin Leve(source
February 2016
evel 2: Infilt
el 2: Infiltrat: VADCR, 20
tration Sump
tion Sump w013)
p (source: V
with Internal
Gen
VADCR, 2013
l Water Stor
neral Applicat
GIP‐
8
3)
rage
tion
‐01
8

Volum
Acti
me 5 – Green Infr
Figu
ivity: Bior
rastructure Prac
Figure 1.8.
ure 1.9 ‐ Pre
retention
ctices
Bioretentio
etreatment O
on with Inter
Option ‐ Gra
February 2016
rnal Water S
ass Filter for
Storage (sou
Sheet Flow
urce: Brown
(source: VA
Gen
n, 2009)
ADCR, 2010)
neral Applicat
GIP‐
9
tion
‐01
9

General Application
Activity: Bioretention GIP‐01
Volume 5 – Green Infrastructure Practices February 2016 10
Figure 1.10 ‐ Pretreatment Option – Gravel Diaphragm for Sheet (source: VADCR, 2010)
Figure 1.11: Pre‐Treatment Option – Gravel Flow Spreader for Concentrated Flow Outside of ROW (source: VADCR, 2010)

General Application
Activity: Bioretention GIP‐01
Volume 5 – Green Infrastructure Practices February 2016 11
SECTION 5: PHYSICAL FEASIBILITY & DESIGN APPLICATIONS
5.1 Physical Feasibility
Bioretention can be applied in most soils or topography, since runoff simply percolates through an engineered soil bed and can be returned to the stormwater system if the infiltration rate of the underlying soils is low. Key constraints with bioretention include the following:
Available Space. Planners and designers can assess the feasibility of using bioretention facilities based on a simple relationship between the contributing drainage area and the corresponding required surface area. The bioretention surface area will be approximately 3% to 10% of the contributing drainage area, depending on the imperviousness of the contributing drainage area (CDA), the subsoil infiltration rate, and the desired bioretention design level.
Site Topography. Bioretention is best applied when the grade of contributing slopes is greater than 1% and less than 5%. Terracing or other inlet controls may be used to slow runoff velocities entering the facility.
Available Hydraulic Head. Bioretention is fundamentally constrained by the invert elevation of the existing conveyance system to which the practice discharges (i.e., the bottom elevation needed to tie the underdrain from the bioretention area into the storm drain system). In general, 3 feet of elevation above this invert is needed to create the hydraulic head needed to drive stormwater through a proposed bioretention filter bed. Less hydraulic head is needed if the underlying soils are permeable enough to dispense with the underdrain. Water Table. Bioretention should always be separated from the water table to ensure that groundwater does not intersect the filter bed. Mixing can lead to possible groundwater contamination or failure of the bioretention facility. A separation distance of 2 feet is recommended between the bottom of the excavated bioretention area and the seasonally high ground water table. Utilities. Designers should ensure that future tree canopy growth in the bioretention area will not interfere with existing overhead utility lines. Interference with underground utilities should also be avoided, particularly water and sewer lines. Local utility design guidance should be consulted in order to determine the horizontal and vertical clearance required between stormwater infrastructure and other dry and wet utility lines. Soils. Soil conditions do not constrain the use of bioretention, although they determine whether an underdrain is needed. Impermeable soils in Hydrologic Soil Group (HSG) C or D usually require an underdrain, whereas HSG A soils and most HSG B soils generally do not. Initially, soil infiltration rates can be estimated from NRCS soil data, but they must be confirmed by an on-site infiltration evaluation (See Appendix 1-A). Contributing Drainage Area. Bioretention works best with smaller contributing drainage areas, where it is easier to achieve flow distribution over the filter bed without experiencing erosive velocities and excessive ponding times. Typical drainage area size can range from 0.1 to 2.5 acres of impervious cover due to limitations on the ability of bioretention to effectively manage large volumes and peak rates of runoff. However, if hydraulic considerations are adequately addressed to manage the potentially large peak inflow of larger drainage areas (such as off-line or low-flow diversions, forebays, etc.), there may be case-by-case instances where MWS may allow these recommended maximums to be adjusted. In such cases, the bioretention facility should be located within the drainage area so as to capture the Treatment Volume (Tv) equally from the entire contributing area, and not fill the entire volume from the immediately adjacent area, thereby bypassing the runoff from the more remote portions of the site. Hotspot Land Uses. Runoff from hotspot land uses should not be treated with infiltrating bioretention (i.e., constructed without an underdrain). For a list of potential stormwater hotspots, please consult Section 11.1. An impermeable bottom liner and an underdrain system may be employed, with MWS approval, when bioretention is used to receive and treat hotspot runoff.

General Application
Activity: Bioretention GIP‐01
Volume 5 – Green Infrastructure Practices February 2016 12
Floodplains. Bioretention areas should be constructed outside the limits of the 100-year floodplain. No Irrigation or Baseflow. The planned bioretention area should not receive baseflow, irrigation water, chlorinated wash-water or other such non-stormwater flows that are not stormwater runoff, except for irrigation as necessary for the survival of plantings within the bioretention area. Setbacks. To avoid the risk of seepage, follow prescribed setbacks which attempt to prevent bioretention area infiltration from flow towards structure foundations or pavement. Setbacks to structures and roads vary, based on the scale of the bioretention design (see Table 1.2 above). At a minimum, bioretention basins should be located a horizontal distance of 100 feet from any water supply well, 50 feet from septic systems, and at least 5 feet from down-gradient wet utility lines. Dry utility lines such as electric, cable and telephone may cross under bioretention areas if they are double-cased. These are recommendations for simple building foundations. If an in-ground basement or other special conditions exist, the design should be reviewed by a licensed engineer. Also, a special footing or drainage design may be used to justify a reduction of the setbacks noted above. Bioretention basins can be constructed closer to structures and roads if an impermeable barrier is placed between the basin and the structure or roadway. Please see GIP-02 for additional information on ROW applications. 5.2 Potential Bioretention Applications
Bioretention can be used wherever water can be conveyed to a surface area. Bioretention has been used at commercial, institutional and residential sites in spaces that are traditionally pervious and landscaped. It should be noted that special care must be taken to provide adequate pre-treatment for bioretention cells in space-constrained high traffic areas. Typical locations for bioretention include the following:
Parking lot islands. The parking lot grading is designed for sheet flow towards linear landscaping areas and parking islands between rows of spaces. Curb-less pavement edges can be used to convey water into a depressed island landscaping area. Curb cuts can also be used for this purpose, but they are more prone to blockage, clogging and erosion. Curb openings shall be at least 18 inches wide to minimize clogging.
Parking lot edge. Small parking lots can be graded so that flows reach a curb-less pavement edge or curb cut before reaching catch basins or storm drain inlets. The turf at the edge of the parking lot functions as a filter strip to provide pre-treatment for the bioretention practice. The depression for bioretention is located in the pervious area adjacent to the parking lot.
Right of Way or commercial setback. A linear configuration can be used to convey runoff in sheet flow from the roadway, or a grass channel or pipe may convey flows to the bioretention practice.
Courtyards. Runoff collected in a storm drain system or roof leaders can be directed to courtyards or other pervious areas on site where bioretention can be installed.
Unused pervious areas on a site. Storm flows can be redirected from a storm drain pipe to discharge into a bioretention area.
Dry Extended Detention (ED) basin. A bioretention cell can be located on an upper shelf of an extended detention basin, after the sediment forebay, in order to boost treatment. Depending on the ED basin design, the designer may choose to locate the bioretention cell in the bottom of the basin. However, the design must carefully account for the potentially deeper ponding depths (greater than 6 or 12 inches) associated with extended detention.
Retrofitting. Numerous options are available to retrofit bioretention in the urban landscape. Some are described in GIP-02, Urban Bioretention.

General Application
Activity: Bioretention GIP‐01
Volume 5 – Green Infrastructure Practices February 2016 13
SECTION 6: DESIGN CRITERIA
6.1 Sizing of Bioretention Practices
6.1.1 Stormwater Quality
Sizing of the surface area (SA) for bioretention practices is based on the computed Treatment Volume (Tv) of the contributing drainage area and the storage provided in the facility. The required surface area (in square feet) is computed as the Treatment Volume (in cubic feet) divided by the equivalent storage depth (in feet). The equivalent storage depth is computed as the depth of media, gravel, or surface ponding (in feet) multiplied by the accepted porosity.
The accepted porosities (n) are (see Figure 1.12 below):
Bioretention Soil Media (See Section 6.6) n = 0..25
Gravel n = 0.40
Surface Storage n = 1.0
The equivalent storage depth for Level 1 with a 6-inch surface ponding depth is therefore computed as:
Equation 1.1. Bioretention Level 1 Design Storage Depth
EquivalentStorageDepth D n D n D ⋯
DE = (2 ft. x 0..25) + (0.5 x 1.0) = 1.0 ft.
Where n1 and D1 are for the first layer, etc.
And the equivalent storage depth for Level 2 with 3 ft of media, a 6-inch surface ponding depth and a 12-inch gravel layer is computed as:
Equation 1.2. Bioretention Level 2 Design Storage Depth
DE = (3 ft. x 0.25) + (1 ft. x 0.40) + (0.5 x 1.0) = 1.65 ft
While this method is simplistic, simulation modeling has proven that it yields a total storage volume somewhat equivalent to 80% total average rainfall volume removal for infiltration rates from 0.5 in/hr through 1.2 in/hr. If the designer can show a measured subsurface infiltration rate above this value size decreases may be requested on a case-by-case basis.

General Application
Activity: Bioretention GIP‐01
Volume 5 – Green Infrastructure Practices February 2016 14
Figure 1.12. Typical Level 2 Bioretention Section with Porosities for Volume Computations
Therefore, the Level 1 Bioretention Surface Area (SA) is computed as:
Equation 1.3. Bioretention Level 1 Design Surface Area
SA (sq. ft.) = (Tv – the volume reduced by an upstream SCM) / DE
And the Level 2 Bioretention Surface Area is computed as:
Equation 1.4. Bioretention Level 2 Design Surface Area
SA (sq. ft.) = [(1.25 * Tv) – the volume reduced by an upstream SCM] / DE
Where: SA = Minimum surface area of bioretention filter (sq. ft.) DE = Equivalent Storage Depth (ft.) Tv = Treatment Volume (cu. ft.) = [(1.0 in.)(Rv)(A)*3630] Where: A = Area in acres
(NOTE: Rv = the composite runoff coefficient from the RR Method. A table of RV values and the equation for calculating a composite Rv is located in Volume 5 Chapter 3.2)
Equations 1.1 through 1.4 should be modified if the storage depths of the soil media (Max. 2–6 ft), gravel layer, or ponded water (Max. 0.5 ft.) vary in the actual design or with the addition of any surface or subsurface storage components (e.g., additional area of surface ponding, subsurface storage chambers, etc.).
6.1.2 Stormwater Quantity
Designers may be able to create additional surface storage by expanding the surface ponding footprint in order to accommodate a greater quantity credit for channel and/or flood protection, without necessarily increasing the soil media footprint. In other words, the engineered soil media would only underlay part of the surface area of the bioretention (see Figure 1.2). In this regard, the ponding footprint can be increased as follows to allow for additional storage:
50% surface area increase if the ponding depth is 6 inches or less. 25% surface area increase if the ponding depth is between 6 and 12 inches.
n = 0.25

General Application
Activity: Bioretention GIP‐01
Volume 5 – Green Infrastructure Practices February 2016 15
These values may be modified as additional data on the long term permeability of bioretention filters becomes available. The removal of volume by bioretention changes the runoff depth entering downstream flood control facilities. An approximate approach to accounting for this in reducing the size of peak flow detention facilities is to calculate an “effective SCS curve number” (CNadj), which is less than the actual curve number (CN). CNadj can then be used in hydrologic calculations and in routing. The method can also be used for other hydrologic methods in which a reduction in runoff volume is possible. This method is detailed in Volume 5 Section 3.2.5.
6.2 Soil Infiltration Rate Testing
In order to determine if an underdrain will be needed, one must measure the infiltration rate of subsoils at the invert elevation of the bioretention area The infiltration rate of subsoils must exceed 0.5 inch per hour for bioretention basins. On-site soil infiltration rate testing procedures are outlined in Appendix 1-A. The number of soil tests varies base on the size of the bioretention area:
< 1,000 ft2 = 2 tests 1,000 – 10,000 ft2 = 4 tests >10,000 ft2 = 4 tests + 1 test for every additional 5,000 ft2
Soil testing is not needed for Level 1 bioretention areas where an underdrain is used. If an underdrain with a gravel sump is used for Level 2, the bottom of the sump must be at least two feet above bedrock and the seasonally high groundwater table.
6.3 SCM Geometry
Bioretention basins must be designed with internal flow path geometry such that the treatment mechanisms provided by the bioretention are not bypassed or short-circuited. Examples of short-circuiting include inlets or curb cuts that are very close to outlet structures (see Figure 1.13), or incoming flow that is diverted immediately to the underdrain through stone layers. Short-circuiting can be particularly problematic when there are multiple curb cuts or inlets.
Figure 1.13. Examples of Short‐Circuiting at Bioretention Facilities (source: VADCR, 2010)
In order for these bioretention areas to have an acceptable internal geometry, the “travel time” from each inlet to the outlet should be maximized, and incoming flow must be distributed as evenly as possible across the filter surface area.

General Application
Activity: Bioretention GIP‐01
Volume 5 – Green Infrastructure Practices February 2016 16
One important characteristic is the length of the shortest flow path compared to the overall length, as shown in Figure 1.14 below. In this figure, the ratio of the shortest flow path to the overall length is represented as:
Equation 1.5. Ratio of Shortest Flow Path to Overall Length
SFP / L Where:
SFP = length of the shortest flow path L = length from the most distant inlet to the outlet
Figure 1.14. Diagram showing shortest flow path as part of SCM geometry (source: VADCR, 2010)
For Level 1 designs, the SFP/L ratio must be 0.3 or greater; the ratio must be 0.8 or greater for Level 2 designs. In some cases, due to site geometry, some inlets may not be able to meet these ratios. However, the drainage area served by such inlets should constitute no more than 20% of the contributing drainage area. Alternately, the designer may incorporate other design features that prevent short-circuiting, including features that help spread and distribute runoff as evenly as possible across the filter surface.
Field experience has shown that soil media immediately around a raised outlet structure is prone to scouring and erosion, thus, short-circuiting of the treatment mechanism. For example, water can flow straight down through scour holes or sinkholes to the underdrain system (Hirschman et al., 2009). Design options should be used to prevent this type of scouring. The designer should ensure that incoming flow is spread as evenly as possible across the filter surface to maximize the treatment potential. One example is shown in Figure 1.15.

General Application
Activity: Bioretention GIP‐01
Volume 5 – Green Infrastructure Practices February 2016 17
Figure 1.15. Typical Detail of how to prevent bypass or short‐circuiting around the overflow structure (source: VADCR, 2010)
6.4 Pre‐treatment
Pre-treatment of runoff entering bioretention areas is necessary to trap coarse sediment particles before they reach and prematurely clog the filter bed. Pre-treatment measures must be designed to evenly spread runoff across the entire width of the bioretention area. Several pre-treatment measures are feasible, depending on the scale of the bioretention practice and whether it receives sheet flow, shallow concentrated flow or deeper concentrated flows. The following are appropriate pretreatment options:
For Bioretention Basins:
Pre-treatment Cells (channel flow): Similar to a forebay, this cell is located at piped inlets or curb cuts leading to the bioretention area and consists of an energy dissipater sized for the expected rates of discharge. It has a storage volume equivalent to at least 15% of the total Treatment Volume (inclusive) with a 2:1 length-to-width ratio. The cell may be formed by a wooden or stone check dam or an earthen or rock berm. Pretreatment cells do not need underlying engineered soil media, in contrast to the main bioretention cell.
Grass Filter Strips (sheet flow): Grass filter strips extend from the edge of pavement to the bottom of the bioretention basin at a 5:1 slope or flatter. Alternatively, provide a combined 5 feet of grass filter strip at a maximum 5% (20:1) slope and 3:1 or flatter side slopes on the bioretention basin. (See Figure 1.9)
Gravel or Stone Diaphragms (sheet flow). A gravel diaphragm located at the edge of the pavement should be oriented perpendicular to the flow path to pre-treat lateral runoff, with a 2 to 4 inch drop. The stone must be sized according to the expected rate of discharge. (See Figure 1.10)
Gravel or Stone Flow Spreaders (concentrated flow). The gravel flow spreader is located at curb cuts, downspouts, or other concentrated inflow points, and should have a 2 to 4 inch elevation drop from a hard-edged surface into a gravel or stone diaphragm. The gravel should extend the entire width of the opening and create a level stone weir at the bottom or treatment elevation of the basin. (See Figure 1.11)

General Application
Activity: Bioretention GIP‐01
Volume 5 – Green Infrastructure Practices February 2016 18
Innovative or Proprietary Structure: An approved proprietary structure with demonstrated capability of reducing sediment and hydrocarbons may be used to provide pre-treatment.
6.5 Conveyance and Overflow
For On-line bioretention: An overflow structure should always be incorporated into on-line designs to safely convey larger storms through the bioretention area. The following criteria apply to overflow structures:
The overflow associated with the 2 and 10 year design storms should be controlled so that velocities are non-erosive at the outlet point (i.e., to prevent downstream erosion).
Common overflow systems within bioretention practices consist of an inlet structure, where the top of the structure is placed at the maximum water surface elevation of the bioretention area, which is typically 6 inches above the surface of the filter bed.
The overflow capture device (typically a yard inlet) should be scaled to the application – this may be a landscape grate inlet or a commercial-type structure.
The filter bed surface should generally be flat so the bioretention area fills up like a bathtub.
Off-line bioretention: Off-line designs are preferred (see Figure 1.16 for an example). One common approach is to create an alternate flow path at the inflow point into the structure such that when the maximum ponding depth is reached, the incoming flow is diverted past the facility. In this case, the higher flows do not pass over the filter bed and through the facility, and additional flow is able to enter as the ponding water filtrates through the soil media.

General Application
Activity: Bioretention GIP‐01
Volume 5 – Green Infrastructure Practices February 2016 19
Figure 1.16. Typical Details for Off‐Line Bioretention (source: VADCR, 2010)

General Application
Activity: Bioretention GIP‐01
Volume 5 – Green Infrastructure Practices February 2016 20
Another option is to utilize a low-flow diversion or flow splitter at the inlet to allow only the Treatment Volume to enter the facility. This may be achieved with a weir or curb opening sized for the target flow, in combination with a bypass channel. Using a weir or curb opening helps minimize clogging and reduces the maintenance frequency.
6.6 Filter Media and Surface Cover
The filter media and surface cover are the two most important elements of a bioretention facility in terms of long-term performance. The following are key factors to consider in determining an acceptable soil media mixture.
General Filter Media Composition. The recommended bioretention soil mixture is generally classified as a sandy loam on the USDA Texture Triangle, with the following composition by volume:
Sand 70% to 85%;
Silt + Clay 10% to 20%, with no more than 10% clay; and
5% to 10% organic matter
Cation Exchange Capacity (CEC). The CEC of a soil refers to the total amount of positively charged elements that a soil can hold; it is expressed in milliequivalents per 100 grams (meq/100g) of soil. For agricultural purposes, these elements are the basic cations of calcium (Ca2+), magnesium (Mg2+), potassium (K+) and sodium (Na+) and the acidic cations of hydrogen (H+) and aluminum (Al+). The CEC of the soil is determined in part by the amount of clay and/or humus or organic matter present. Soils with CECs exceeding 10 meq/100g are preferred for pollutant removal. Increasing the organic matter content of any soil will help to increase the CEC, since it also holds cations like the clays.
Infiltration Rate. The bioretention soil media should have a minimum infiltration rate of 1 to 2 inches per hour (a proper soil mix will have an initial infiltration rate that is significantly higher).
Depth. The standard minimum filter bed depth ranges from 24 and 36 inches for Level 1 and Level 2 designs, respectively. If trees are included in the bioretention planting plan, tree planting holes in the filter bed should be deeper to provide enough soil volume for the root structure of mature trees. Use turf, perennials or shrubs instead of trees to landscape shallower filter beds.
Filter Media for Tree Planting Areas. A more organic filter media is recommended within the planting holes for trees, with a ratio of 50% sand, 30% topsoil, and 20%acceptable leaf compost.
Mulch. A 3 inch layer of mulch on the surface of the filter bed enhances plant survival, suppresses weed growth, and pre-treats runoff before it reaches the filter media. Shredded, aged hardwood mulch or hardwood bark mulch makes a very good surface cover, as they retains a significant amount of nitrogen and typically will not float away.
Alternative to Mulch Cover. In some situations, designers may consider alternative surface covers such as turf, native groundcover, erosion control matting (coir or jute matting), river stone, or pea gravel. The decision regarding the type of surface cover to use should be based on function, cost and maintenance.

General Application
Activity: Bioretention GIP‐01
Volume 5 – Green Infrastructure Practices February 2016 21
6.7 Underdrain and Underground Storage Layer
Level 1 designs require an underdrain surrounded by a jacket of 1 inch stone unless the infiltration rate of the surrounding soils is greater than 0.5 inches per hour. Some Level 2 designs will not use an underdrain (where soil infiltration rates meet minimum standards; see Section 6.2 and Table 1.2). For Level 2 designs with an underdrain, an underground storage layer of 12 inches should be incorporated below the invert of the underdrain. The depth of the storage layer will depend on the target treatment and storage volumes needed to meet water quality criteria. However, the bottom of the storage layer must be at least 2 feet above the seasonally high water table and bedrock. The storage layer should consist of clean, washed #57 stone or an approved infiltration module.
The infiltration sump can consist of a 12-inch stone layer underneath the perforated underdrain pipe. The infiltration sump can also be created with an internal water storage zone (IWS) configuration of the underdrain. An IWS can increase nitrogen removal and infiltration in bioretention areas. IWS can also reduce the cost of construction since the bioretention areas can be shallower in some instances and the invert of the outlet is not as deep. The IWS configuration places the perforated underdrain at the bottom of the stone reservoir layer, with the outlet elevated to the same elevation as the top of the sump / IWS. The IWS should be at least 12 inches from the top of the bioretention media. Figures 1.7 and 1.8 illustrate this design variant. The IWS will dewater by percolating into the native soils. A minimum field-verified infiltration rate of 0.5 inches per hour is required in order to count the stone reservoir as storage volume.
The IWS can be created by the addition of an elbow in the underdrain piping at a 90 angle vertically perpendicular to the horizontal underdrain. In another IWS configuration, the underdrain transitions to a solid wall pipe prior to exiting the stone reservoir layer and is directed towards an outlet manhole or other structure. (This run of pipe should be straight, or include cleanouts at 45 degree (maximum) horizontal bends, and be set at a minimal grade.) In order to create the higher outlet elevation, the outlet manhole is configured with an internal weir wall with the top of the weir set at the same elevation as the top of the stone sump. This design variant can also include a drain orifice in the bottom of the weir to allow the sump to be drained if, over time, the exfiltration into the soil becomes restricted. This orifice should be covered with a plate that is clearly marked to indicate that it remain blocked under normal operating conditions.
All bioretention basins should include observation wells. The observation wells should be tied into any T’s or Y’s in the underdrain system, and should extend upwards to be flush with the surface, with a vented cap. In addition, cleanout pipes should be provided if the contributing drainage area exceeds 1 acre.
6.8 Bioretention Planting Plans
A landscaping plan must be provided for each bioretention area. Minimum plan elements shall include the proposed bioretention template to be used, delineation of planting areas, the planting plan, including the size, the list of planting stock, sources of plant species, and the planting sequence, including post-nursery care and initial maintenance requirements. The planting area is defined as the area disturbed by construction events. The planting plan must address 100% of the planting area. It is highly recommended that the planting plan be prepared by a qualified landscape architect, in order to tailor the planting plan to the site-specific conditions.
Native plant species are preferred over non-native species, but some ornamental species may be used for landscaping effect if they are not aggressive or invasive. Tables 1.4 – 1.8 list native plant species suitable for use in bioretention.
The planting template refers to the form and combination of native trees, shrubs, and perennial ground covers that maintain the appearance and function of the bioretention area. Planting templates may be of the following types:

General Application
Activity: Bioretention GIP‐01
Volume 5 – Green Infrastructure Practices February 2016 22
Ornamental planting. This option includes perennials, sedges, grasses, shrubs and/or trees in a mass bed planting. This template is recommended for commercial sites where visibility is important. This template requires maintenance much like traditional landscape beds.
Meadow. This is a lower maintenance approach that focuses on the herbaceous layer and may resemble a wildflower meadow or prairie. The goal is to establish a more natural look that may be appropriate if the facility is located in a lower maintenance area (e.g., further from buildings and parking lots). Shrubs and trees may be incorporated. Erosion control matting can be used in lieu of the conventional mulch layer.
Reforestation. This option plants a variety of tree seedlings and saplings in which the species distribution is modeled on characteristics of existing local forest ecosystems. Trees are planted in groups with the goal of establishing a mature forest canopy. This template is appropriate for large bioretention areas located at wooded edges or where a wooded buffer is desired. If this template is used, refer directly to Reforestation GIP-10.
The choice of which planting template to use depends on the scale of bioretention, the context of the site in the urban environment, the filter depth, the desired landscape amenities, and the future owner’s capability to maintain the landscape. In general, the vegetative goal is to achieve a surface area coverage of at least 75% in the first two years. For a bioretention area to qualify for Level 2 Design, a minimum of one tree must be planted for every 400 square feet.
6.8.1 Plant Spacing Table 1.3 is for use only when plants are spaced equidistant from each other as shown in Figure 1.17, below.
Figure 1.17 Typical plant spacing where x equals distance on center (O.C.) of plant species.
Table 1.3 Plant Spacing for Perennials, Grasses, Sedges and Shrubs
Spacing (O.C.) Plants per 100 sq.ft.
18” o.c. 51.2
24” o.c. 29
28” o.c. 22
30” o.c. 18.5
36” o.c. 12.8
42” o.c. 10
4’ o.c. 7.23
5’ o.c. 4.61
6’ o.c. 3.2
8’ o.c. 1.8

General Application
Activity: Bioretention GIP‐01
Volume 5 – Green Infrastructure Practices February 2016 23
Table 1.4. Popular Native Perennials for Bioretention – Full Sun
Latin Name Common Name Size Spacing Moisture Color Height Asclepias incarnate Marsh milkweed Plugs –1 gal. 1 plant/24” o.c. Wet Pink 3‐4’
Asclepias Purple milkweed Plugs –1 gal. 1 plant/18” o.c. Moist Purple 3’
Asclepias syriaca Common milkweed Plugs –1 gal. 1 plant/18” o.c. Moist‐dry Orange 2‐5’
Asclepias tuberosa Butterfly milkweed Plugs –1 gal. 1 plant/18” o.c. Dry‐moist Orange 2’
Asclepias verdis Green milkweed Plugs –1 gal. 1 plant/18” o.c. Moist Green 2’
Asclepias verdicillata Whorled milkweed Plugs –1 gal. 1 plant/18” o.c. Moist White 2.5’
Aster laevis Smooth aster Plugs –1 gal. 1 plant/18” o.c. Moist Blue 2‐4’
Aster novae‐angliae New England aster Plugs –1 gal. 1 plant/24” o.c. Wet‐moist Blue 2‐5’
Aster sericeus Silky aster Plugs –1 gal. 1 plant/18” o.c. Dry Purple 1‐2’
Chamaecrista Partridge pea Plugs –1 gal. 1 plant/18” o.c. Dry Yellow 1‐2’
Conoclinium Mist flower Plugs –1 gal. 1 plant/18” o.c. Moist‐dry Blue 1‐2’
Coreopsis lanceolata Lance‐leaf coreopsis Plugs –1 gal. 1 plant/18” o.c. Moist‐dry Yellow 6‐8’
Echinacea pallida Pale purple coneflower Plugs –1 gal. 1 plant/18” o.c. Dry Purple 2‐3’
Echinacea purpurea Purple coneflower Plugs – 1 gal. 1 plant/18” o.c. Moist‐dry Purple 3‐4’
Eupatorium Boneset Plugs –1 gal. 1 plant/24” o.c. Wet White 3‐5’
Eupatorium Sweet Joe‐Pye Weed Plugs –1 gal. 1 plant/24” o.c. Wet‐moist Purple 3‐6’
Iris virginica Flag Iris Plugs –1 gal. 1 plant/18” o.c. Moist‐Wet Blue 2’
Liatris aspera Rough blazingstar Plugs –1 gal. 1 plant/18” o.c. Moist‐dry Purple 2‐5’
Liatris microcephalla Small‐headed Plugs –1 gal. 1 plant/18” o.c. Moist‐dry Purple 3’
Liatris spicata Dense blazingstar Plugs –1 gal. 1 plant/24” o.c. Wet‐moist Purple 1.5’
Liatris squarrulosa Southern blazingstar Plugs –1 gal. 1 plant/18” o.c. Moist‐dry Purple 2‐6’
Lobelia cardinalis Cardinal flower Plugs –1 gal. 1 plant/18” o.c. Wet‐moist Red 2‐4’
Monarda didyma Bee balm Plugs –1 gal. 1 plant/24” o.c. Wet‐moist Red 3’
Monarda fistulosa Wild bergamot Plugs –1 gal 1 plant/18” o.c. Moist Purple 1‐3’
Oenethera fruticosa Sundrops Plugs –1 gal 1 plant/18” o.c. Moist‐dry Yellow
Penstemon digitalis Smooth white Plugs –1 gal 1 plant/24” o.c. Wet White 2‐3’
Penstemon hirsutus Hairy beardtongue Plugs –1 gal 1 plant/18” o.c. Dry White 1‐3’
Penstemon smallii Beardtongue Plugs –1 gal 1 plant/18” o.c. Moist Purple 1‐2’
Pycanthemum Slender mountain mint Plugs –1 gal 1 plant/18” o.c. Moist White 1.5‐2.5’
Ratibida piñata Gray‐headed Plugs –1 gal 1 plant/18” o.c. Moist Yellow 2‐5’
Rudbeckia hirta Black‐eyed Susan Plugs –1 gal 1 plant/18” o.c. Moist‐dry Yellow 3’
Salvia lyrata Lyre‐leaf sage Plugs –1 gal 1 plant/18” o.c. Moist Purple 1‐2’
Solidago nemoralis Gray goldenrod Plugs–1 gal. 1 plant/18” o.c. Dry Yellow 2’
Solidago rugosa Rough‐leaved Plugs–1 gal. 1 plant/18” o.c. Wet Yellow 1‐6’
Veronacastrum Culver’s root Plugs–1 gal. 1 plant/24” o.c. Dry White 3‐6’
Veronia veboracensis Tall ironweed Plugs–1 gal. 1 plant/24” o.c. Wet‐moist Purple 3‐4’
Plant material size and grade to conform to “American Standards for Nursery Stock” American Association of Nurserymen, Inc. latest approved revision, ANSI Z‐60‐1

General Application
Activity: Bioretention GIP‐01
Volume 5 – Green Infrastructure Practices February 2016 24
Table 1.5. Popular Native Perennials for Bioretention – Shade
Latin Name Common Name Size Spacing Moisture Color Height
Aquilegia canadensis Wild columbine Plugs –1 gal. 1 plant/18” o.c. Moist‐dry Pink 1‐2.5’
Athyrium filix‐femina Lady Fern 1 gal. 1 plant/18” o.c. Moist Green 3’
Arisaema triphyllum Jack‐in‐the‐pulpit
Plugs –1 gal. 1 plant/18” o.c. Moist Green 1.5‐2.5’
Arisaema dricontium Green dragon Plugs –1 gal. 1 plant/18” o.c. Wet‐moist
Green 3’
Asarum canadense Wild ginger Plugs –1 gal. 1 plant/18” o.c. Wet‐moist
Red‐brown
0.5‐1’
Aster cardifolius Blue wood aster Plugs –1 gal. 1 plant/18” o.c. Moist‐dry Blue 1‐3’
Aster novae‐angliae New England aster
Plugs –1 gal. 1 plant/24” o.c. Moist‐dry Blue/ purple
3‐4’
Aster oblongifolius Aromatic Aster Plugs –1 gal. 1 plant/24” o.c. Moist‐dry Blue/ purple
1.5‐3’
Coreopsis major Tickseed coreopsis
Plugs –1 gal. 1 plant/18” o.c. Moist‐dry Yellow 3’
Dryopteris marginalis Shield Fern 1 gal. 1 plant/18” o.c. Moist Green 2‐3’
Geranium maculatum
Wild geranium Plugs –1 gal. 1 plant/18” o.c. Moist Pink 2’
Heuchera americana Alumroot Plugs –1 gal. 1 plant/18” o.c. Moist‐dry Purple 1’
Iris cristata Dwarf crested iris
Plugs –1 gal. 1 plant/18” o.c. Moist‐dry Purple 4”
Lobelia siphilicata Great blue lobelia
Plugs –1 gal. 1 plant/18” o.c. Wet‐moist
Blue 1.5‐3’
Lobelia cardinalis Cardinal flower Plugs – 1 gal. 1 plant/18” o.c. Wet‐moist
Red 2‐4’
Mertensia virginica Virginia bluebells Plugs –1 gal. 1 plant/18” o.c. Moist Blue 1.5’
Osmunda cinnamomea
Cinnamon Fern 1 gal. 1 plant/24” o.c. Wet‐moist
Green 3‐4’
Phlox divericata Blue phlox Plugs –1 gal. 1 plant/18” o.c. moist Blue 0.5‐2’
Polemonium reptans Jacob’s ladder Plugs –1 gal. 1 plant/18” o.c. Moist‐dry Blue 15”
Polystichum acrostichoides
Christmas fern Plugs –1 gal. 1 plant/24” o.c. Moist‐dry Evergreen 2’
Stylophoru diphyllum Wood poppy Plugs –1 gal. 1 plant/18” o.c. Wet ‐moist Yellow 1.5’
Plant material size and grade to conform to “American Standards for Nursery Stock” American Association of Nurserymen, Inc. latest approved revision, ANSI Z‐60‐1.
General Application
Activity: Bioretention GIP‐01
Volume 5 – Green Infrastructure Practices February 2016 25
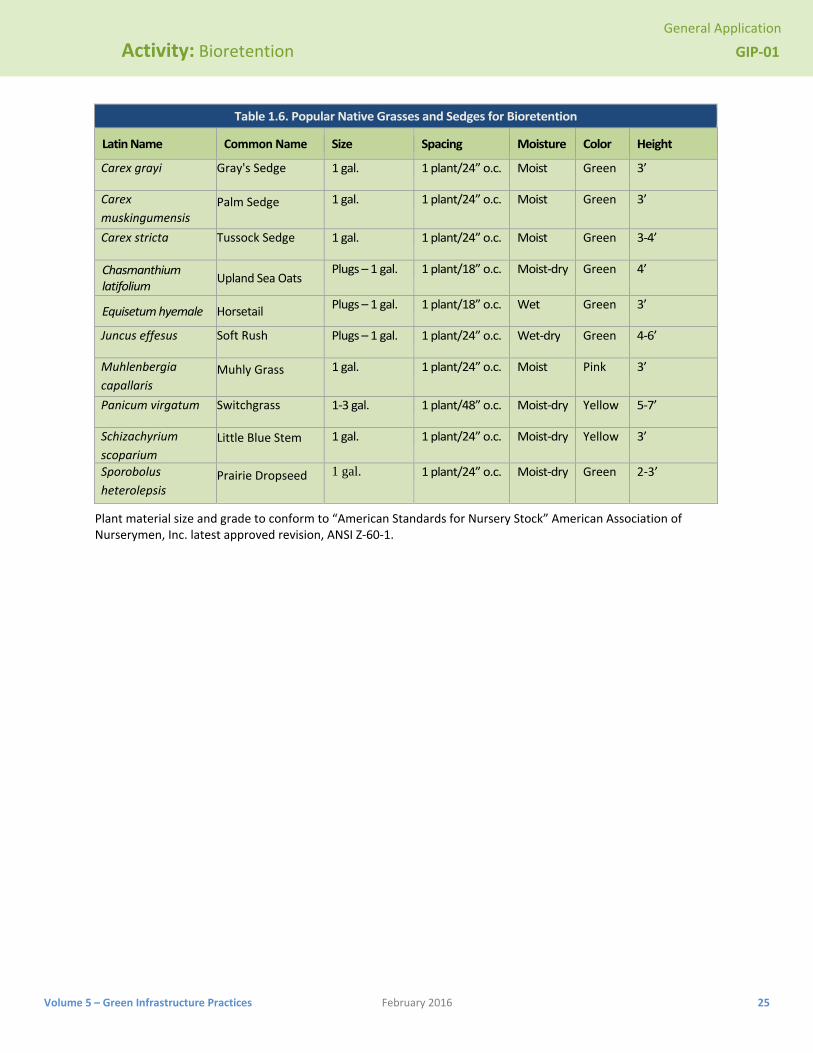
Table 1.6. Popular Native Grasses and Sedges for Bioretention
Latin Name Common Name Size Spacing Moisture Color Height
Carex grayi Gray's Sedge 1 gal. 1 plant/24” o.c. Moist Green 3’
Carex
muskingumensis Palm Sedge 1 gal. 1 plant/24” o.c. Moist Green 3’
Carex stricta Tussock Sedge 1 gal. 1 plant/24” o.c. Moist Green 3‐4’
Chasmanthium latifolium
Upland Sea Oats Plugs –1 gal. 1 plant/18” o.c. Moist‐dry Green 4’
Equisetum hyemale Horsetail Plugs – 1 gal. 1 plant/18” o.c. Wet Green 3’
Juncus effesus Soft Rush Plugs –1 gal. 1 plant/24” o.c. Wet‐dry Green 4‐6’
Muhlenbergia
capallaris Muhly Grass 1 gal. 1 plant/24” o.c. Moist Pink 3’
Panicum virgatum Switchgrass 1‐3 gal. 1 plant/48” o.c. Moist‐dry Yellow 5‐7’
Schizachyrium
scoparium
Little Blue Stem 1 gal. 1 plant/24” o.c. Moist‐dry Yellow 3’
Sporobolus
heterolepsis Prairie Dropseed 1 gal. 1 plant/24” o.c. Moist‐dry Green 2‐3’
Plant material size and grade to conform to “American Standards for Nursery Stock” American Association of Nurserymen, Inc. latest approved revision, ANSI Z‐60‐1.

General Application
Activity: Bioretention GIP‐01
Volume 5 – Green Infrastructure Practices February 2016 26
Table 1.7. Popular Native Trees for Bioretention
Latin Name Common Name
DT‐FT Light Moisture Notes Flower Color
Height
Acer rubrum Red Maple DT‐FT Sun‐shade
Dry‐wet Fall color 50‐70’
Acer saccharum
Sugar Maple Sun‐pt shade
Moist Fall color 50‐75’
Ameleanchier Canadensis
Serviceberry Sun‐pt shade
Moist‐wet Eatable berries White 15‐25’
Asimina triloba
Paw Paw Sun‐pt shade
Moist Eatable fruits Maroon 15‐30’
Betula nigra River Birch FT Sun‐pt shade
Moist‐wet Exfoliating bark 40‐70’
Carpinus caroliniana
Ironwood Sun‐pt shade
Moist White 40‐60’
Carya aquatica
Water Hickory
FT‐DT Sun Moist Fall color 35‐50’
Cercus Canadensis
Redbud DT Sun‐shade
Moist Pea‐like flowers, seed pods
Purple 20‐30’
Chionanthus virginicus
Fringetree Sun‐pt
shade Moist Panicled, fragrant
flowers White 12‐20’
Cladratis lutea
Yellowwood DT Sun Dry‐moist Fall color White 30‐45’
Cornus florida Flowering Dogwood
Part shade
Moist Red fruit, wildlife White 15‐30’
Ilex opaca American Holly
DT Sun‐pt shade
Moist Evergreen White 30‐50’
Liquidambar styraciflua
Sweetgum DT‐FT Sun‐pt shade
Dry‐moist Spiny fruit 60‐100’
Magnolia virginiana
Sweetbay Magnolia
Sun‐pt shade
Moist‐wet Evergreen White 10‐60’
Nyssa sylvatica
Black Gum Sun‐
Shade Moist Fall color 35‐50’
Oxydendrum arboretum
Sourwood Sun‐pt
shade Dry‐moist Wildlife White 20‐40’
Platanus occidentalis
Sycamore FT Sun‐pt shade
Moist White mottled bark
70‐100’
Quercus bicolor
Swamp White Oak
DT Sun‐pt shade
Moist‐wet Acorns 50‐60’
Quercus nuttalli
Nuttall Oak DT Sun Dry‐moist Acorns 40‐60’
Quercus lyrata
Overcup Oak FT Sun Moist Acorns 40‐60’
Quercus shumardii
Shumard Oak
DT Sun Moist Acorns 40‐60’
Rhamnus caroliniana
Carolina Buckthorn
Sun Moist Black fruit 15‐30’
Salix nigra Black Willow FT Sun‐pt
shadeMoist‐wet White catkins Yellow 40‐60’
Ulmus americana
American Elm
DT‐FT Sun‐pt shade
Moist
Salix nigra Black Willow FT Pt shade Moist‐wet White catkins Yellow 40‐60’
Size: min. 2” caliper if not reforestation. DT: Drought Tolerant FT: Flood Tolerant Plant material size and grade to conform to “American Standards for Nursery Stock” American Association of Nurserymen, Inc. latest approved revision, ANSI Z‐60‐1.

General Application
Activity: Bioretention GIP‐01
Volume 5 – Green Infrastructure Practices February 2016 27
Table 1.8. Popular Native Shrubs for Bioretention
Latin Name Common Name
DTFT
Light Moisture Spacing (0 C)
Notes Flower Color
Height
Aronia arbutifolia
Red Chokeberry
FT Sun‐pt shade
Dry‐wet 4’ Red berries, wildlife
White 6‐12’
Buddleia davidii
Butterfly Bush
DT Sun‐pt shade
Dry‐moist 4’ Non‐native Blue 5’
Callicarpa Americana
American Beautyberry
DT Sun‐pt shade
Dry‐wet 5’ Showy purple fruit
Lilac 4‐6’
Cephalanthus occidentalis
Button Bush FT Sun‐shade Moist‐wet 5’ Attracts wildlife White 6‐12’
Clethra alnifolia
Sweet Pepper Bush
Sun‐pt shade
Dry‐moist 3’ Hummingbird White 5‐8’
Cornus amomum
Silky Dogwood
Sun‐shade Moist‐wet 6’ Blue berries, wildlife
White 6‐12’
Corylus americana
American Hazelnut
Sun‐pt shade
Dry‐moist 8’ Eatable nuts, wildlife
Yellow 8‐15’
Hamemelis virginiana
Witch‐hazel Sun‐pt shade
Dry‐moist 8’ Winter bloom Yellow 10’
Hibiscus moscheutos
Swamp Mallow
FT Sun Moist‐wet 30” Cold‐hardy White –red
4‐7’
Hydrangea quercifolia
Oakleaf Hydrangea
DT Pt shade –shade
Moist 4’ Winter texture White 3‐6’
Hypericum frondosum
Golden St. John’s Wort
DT Sun‐pt shade
Dry‐moist 30” Semi‐evergreen Yellow 2‐3’
Hypericum prolificum
Shrubby St. John’s Wort
DT Sun‐pt shade
Dry‐moist 3’ Semi‐evergreen Yellow 3’
Ilex decidua (dwarf var.)
Possumhaw Viburnum
DT Sun‐pt shade
Moist 4‐6’ Red berries 6‐14’
Ilex glabra Inkberry DT Sun‐pt shade
Moist‐wet 3’ Evergreen 4‐8’
Ilex verticillata Winterberry Holly
FT Sun‐pt shade
Moist‐wet 3’ Red berries 10’
Itea virginica Virginia Sweetspire
DTFT
Sun‐shade Moist‐wet 4’ Fall color White 4‐8’
Lindera benzoin
Spicebush DT Pt shade –shade
Moist‐wet 8’ Butterflies, wildlife
Yellow 6‐12’
Viburnum dentatum
Arrowwood Viburnum
Sun‐shade Dry‐wet 6’ Wildlife White 6‐8’
Size: minimum 3 gal. container or equivalent. DT: Drought Tolerant FT: Flood Tolerant This list provides plant species; there are multiple varieties within each species. Plant material size and grade to conform to “American Standards for Nursery Stock” American Association of Nurserymen, Inc. latest approved revision, ANSI Z‐60‐1.

General Application
Activity: Bioretention GIP‐01
Volume 5 – Green Infrastructure Practices February 2016 28
6.9 Bioretention Material Specifications
Table 1.9 outlines the standard material specifications used to construct bioretention areas.
Table 1.9. Bioretention Material Specifications Material Specification Notes
Filter Media Composition
Filter Media to contain
70% ‐ 85% sand;
10%‐20% silt + clay, with clay < 10%; and
5% to 10% organic matter
The volume of filter media based on 110% of the plan volume, to account for settling or compaction.
Filter Media Testing
CEC greater than 10 meq/100g
Mulch Layer Use mulch meeting requirements specified in Section 6.6.
Lay a 3 inch layer on the surface of the filter bed.
Alternative Surface Cover
Use river stone or pea gravel, coir and jute matting.
Use to suppress weed growth & prevent erosion.
Geotextile/Liner Use a non‐woven geotextile fabric with a flow rate of > 110 gal./min./ft2 (e.g., Geotex 351 or equivalent)
Apply only to the sides and above the underdrain. For hotspots and certain karst sites only, use an appropriate liner on bottom.
Choking Layer
Lay a 2 to 4 inch layer of sand over a 2 inch layer of choker stone (typically #8 or #89 washed gravel), which is laid over the underdrain stone.
Stone Jacket for Underdrain
and/or Storage Layer
12 inch layer of 1 inch stone should be double‐washed and clean and free of all fines (e.g., #57 stone).
9 inches of 1 inch stone should cover the underdrain with 3 inches if stone above the top of the pipe; 12 to 18 inches for the stone storage layer (#57 stone), if needed
Underdrains, Cleanouts, and Observation
Wells
Use 6 inch corrugated HDPE or PVC pipe with 3/8‐inch perforations at 6 inches on center; position each underdrain on a 1% or 2% slope located no more than 20 feet from the next pipe.
Lay the perforated pipe under the length of the bioretention cell, and install nonperforated pipe as needed to connect with the storm drain system. Install T’s and Y’s as needed, depending on the underdrain configuration. Extend cleanout pipes to the surface with vented caps at the Ts and Ys.
Plant Materials
Shrubs: Minimum 3 gal or 18‐24" ht at 4' o.c. (or 1plant/15 s.f.).
Grasses, sedges, perennials: Size and max. spacing as called for in Tables 1.4, 1.5 and 1.6 herein.
Trees: Minimum size 2" caliper, maximum spacing for Level 2 design of 1 tree/400 s.f. (NOTE: the 2" cal, minimum allows it to be counted toward landscape ordinance requirements)
Establish plant materials as specified in the landscaping plan and the recommended plant list.
Alternate plant specification: When using the Forest‐type planting template, Reforestation planting densities noted in GIP‐10 may be used to meet these plant material specifications.

General Application
Activity: Bioretention GIP‐01
Volume 5 – Green Infrastructure Practices February 2016 29
SECTION 7: SPECIAL CASE DESIGN ADAPTATIONS
7.1 Shallow Bedrock and Groundwater Connectivity
Many parts of Nashville have shallow bedrock, which can constrain the application of deeper bioretention areas (particularly Level 2 designs). In such settings, the following design adaptations may be helpful:
A linear approach to bioretention, using multiple cells leading to the ditch system, helps conserve hydraulic head.
The minimum depth of the filter bed may be 18 to 24 inches. It is useful to limit surface ponding to 6 to 9 inches and avoid the need for additional depth by establishing a turf cover rather than using mulch. The shallower media depth and the turf cover generally comply with the Water Quality Swale specification, and therefore will be credited with a slightly lower pollutant removal (PTP-05 Water Quality Swales).
It is important to maintain at least a 0.5% slope in the underdrain to ensure positive drainage.
The underdrain should be tied into the ditch or conveyance system.
For more information on bedrock depths download the GIS data set from: http://water.usgs.gov/GIS/metadata/usgswrd/XML/regolith.xml.
For more information on soil types go to: http://websoilsurvey.nrcs.usda.gov/app/ 7.2 Steep Terrain
In steep terrain, land with a slope of up to 15% may drain to a bioretention area, as long as a two cell design is used to dissipate erosive energy prior to filtering. The first cell, between the slope and the filter media, functions as a forebay to dissipate energy and settle any sediment that migrates down the slope. Designers may also want to terrace a series of bioretention cells to manage runoff across or down a slope. The drop in slope between cells should be limited to 1 foot and should be armored with river stone or a suitable equivalent. 7.2 Karst Karst regions are found in much of Middle Tennessee, which complicates both land development and stormwater design. While bioretention areas produce less deep ponding than conventional stormwater practices (e.g., ponds and wetlands), Level 2 bioretention designs (i.e., infiltration) are not recommended in any area with a moderate or high risk of sinkhole formation (Hyland, 2005). On the other hand, Level 1 designs that meet separation distance requirements (3 feet) and possess an impermeable bottom liner and an underdrain should work well. In general, bioretention basins with contributing drainage areas not exceeding 20,000 square feet are preferred (compared to bioretention with larger drainage areas), in order to prevent possible sinkhole formation. However, it may be advisable to increase standard setbacks to buildings. SECTION 8: CONSTRUCTION 8.1 Construction Sequence
Construction Stage Erosion and Sediment Controls. Small-scale bioretention areas should be fully protected by silt fence or construction fencing, particularly if they will rely on infiltration (i.e., have no underdrains.) Ideally, bioretention should remain outside the limit of disturbance during construction to prevent soil compaction by heavy equipment. Bioretention basin locations may be used as small sediment traps or basins during construction. However, these must be accompanied by notes and graphic details on the erosion prevention and sediment control (EPSC) plan specifying that (1) the maximum excavation depth at the construction stage must be at least 1 foot above the post-construction installation, and (2) the facility must

General Application
Activity: Bioretention GIP‐01
Volume 5 – Green Infrastructure Practices February 2016 30
contain an underdrain. The plan must also show the proper procedures for converting the temporary sediment control practice to a permanent bioretention facility, including dewatering, cleanout and stabilization. 8.2 Bioretention Installation
The following is a typical construction sequence to properly install a bioretention basin. These steps may be modified to reflect different bioretention applications or expected site conditions:
Step 1. Construction of the bioretention area should begin after the entire contributing drainage area has been stabilized with vegetation (See Section 8.1). THIS IS THE MOST IMPORTANT FACTOR DETERMINING THE SUCCESS OR FAILURE OF THE BIORETENTION AREA. BIORETENTION AREAS WILL FAIL IF SEDIMENT IS ALLOWED TO FLOW INTO THEM. It may be necessary to block certain curb or other inlets while the bioretention area is being constructed. The proposed site should be checked for existing utilities prior to any excavation. Step 2. The designer and the installer should have a preconstruction meeting, checking the boundaries of the contributing drainage area and the actual inlet elevations to ensure they conform to original design. Since other contractors may be responsible for constructing portions of the site, it is quite common to find subtle differences in site grading, drainage and paving elevations that can produce hydraulically important differences for the proposed bioretention area. The designer should clearly communicate, in writing, any project changes determined during the preconstruction meeting to the installer and the plan review/inspection authority.
Step 3. Temporary EPSC controls are needed during construction of the bioretention area to divert stormwater away from the bioretention area until it is completed. Special protection measures such as erosion control fabrics may be needed to protect vulnerable side slopes from erosion during the construction process.
Step 4. Any pre-treatment cells should be excavated first and then sealed to trap sediments.
Step 5. Excavators or backhoes should work from the sides to excavate the bioretention area to its appropriate design depth and dimensions. Excavating equipment should have scoops with adequate reach so they do not have to sit inside the footprint of the bioretention area. Contractors should use a cell construction approach in larger bioretention basins, whereby the basin is split into 500 to 1,000 sq. ft. temporary cells with a 10-15 foot earth bridge in between, so that cells can be excavated from the side.
Step 6. It may be necessary to rip the bottom soils to a depth of 6 to 12 inches to promote greater infiltration.
Step 7. Place geotextile fabric on the sides of the bioretention area with a 6-inch overlap on the sides. If a stone storage layer will be used, place the appropriate depth of #57 stone on the bottom, install the perforated underdrain pipe, pack #57 stone to 3 inches above the underdrain pipe, and add approximately 3 inches of choker stone as a filter between the underdrain and the soil media layer. If a stone storage layer is used, the pipe may be placed directly above this layer.
Step 8. Deliver or prepare the soil media, and store it on an adjacent impervious area or plastic sheeting. Apply the media in 12-inch lifts until the desired top elevation of the bioretention area is achieved. Wait a few days to check for settlement, and add additional media, as needed, to achieve the design elevation.
Step 9. Prepare planting holes for any trees and shrubs, install the vegetation, and water accordingly. Install any temporary irrigation.
Step 10. Place the surface cover in both cells (mulch, river stone or turf), depending on the design. If coir or jute matting will be used in lieu of mulch, the matting will need to be installed prior to planting (Step 9), and holes or slits will have to be cut in the matting to install the plants.

General Application
Activity: Bioretention GIP‐01
Volume 5 – Green Infrastructure Practices February 2016 31
Step 11. Install the plant materials as shown in the landscaping plan, and water them during weeks of no rain for the first two months.
Step 12. Conduct the final construction inspection (see Section 9). Then log the GPS coordinates for each bioretention facility and submit them to MWS.
8.3 Construction Inspection
A post-construction inspection checklist for bioretention is included in Appendix C of Volume 1 of this manual.
SECTION 9: AS‐BUILT REQUIREMENTS
After the bioretention area has been constructed, the developer must have an as-built certification of the bioretention area conducted by a registered Professional Engineer. The as-built certification verifies that the SCM was installed as designed and approved. The following components are vital to ensure that the bioretention area works properly and they must be addressed in the as-built certification: 1. Pretreatment measures must be verified. 2. The proper media and gravel depths were installed per plan. Photographs taken during phases of
construction should be included to demonstrate. 3. Surrounding drainage areas must be stabilized to prevent sediment from clogging the filter media. 4. Correct ponding depths and infiltration rates must be verified. 5. The landscape plan must be provided.
A mechanism for overflow for large storm events must be provided.
SECTION 10: MAINTENANCE 10.1 Maintenance Document
The requirements for the Maintenance Document are in Appendix C of Volume 1 of the Manual. They include the execution and recording of an Inspection and Maintenance Agreement or a Declaration of Restrictions and Covenants, and the development of a Long Term Maintenance Plan (LTMP) by the design engineer. The LTMP contains a description of the stormwater system components and information on the required inspection and maintenance activities.
10.2 First Year Maintenance Operations
Successful establishment of bioretention areas requires that the following tasks be undertaken in the first year following installation:
Initial inspections. For the first 6 months following construction, the site should be inspected at least twice after storm events that exceed 0.5 inch of rainfall.
Spot Reseeding. Inspectors should look for bare or eroding areas in the contributing drainage area or around the bioretention area, and make sure they are immediately stabilized with grass cover.
Fertilization. One-time, spot fertilization may be needed for initial plantings.
Watering. Depending on rainfall, watering may be necessary once a week during the first 2 months, and then as needed during first growing season (April-October), depending on rainfall.
Remove and replace dead plants. Since up to 10% of the plant stock may die off in the first year, construction contracts should include a care and replacement warranty to ensure that vegetation is properly established and survives during the first growing season following construction. The typical

General Application
Activity: Bioretention GIP‐01
Volume 5 – Green Infrastructure Practices February 2016 32
thresholds below which replacement is required are 85% survival of plant material and 100% survival of trees.
10.3 Maintenance Inspections
It is highly recommended that a spring maintenance inspection and cleanup be conducted at each bioretention area. The following is a list of some of the key maintenance problems to look for:
Check to see if 75% to 90% cover (mulch plus vegetative cover) has been achieved in the bed, and measure the depth of the remaining mulch.
Check for sediment buildup at curb cuts, gravel diaphragms or pavement edges that prevents flow from getting into the bed, and check for other signs of bypassing.
Check for any winter- or salt-killed vegetation, and replace it with hardier species.
Note presence of accumulated sand, sediment and trash in the pre-treatment cell or filter beds, and remove it.
Inspect bioretention side slopes and grass filter strips for evidence of any rill or gully erosion, and repair it.
Check the bioretention bed for evidence of mulch flotation, excessive ponding, dead plants or concentrated flows, and take appropriate remedial action.
Check inflow points for clogging, and remove any sediment.
Look for any bare soil or sediment sources in the contributing drainage area, and stabilize them immediately.
Check for clogged or slow-draining soil media, a crust formed on the top layer, inappropriate soil media, or other causes of insufficient filtering time, and restore proper filtration characteristics.
10.4 Routine and Non‐Routine Maintenance Tasks
Maintenance of bioretention areas should be integrated into routine landscape maintenance tasks. If landscaping contractors will be expected to perform maintenance, their contracts should contain specifics on unique bioretention landscaping needs, such as maintaining elevation differences needed for ponding, proper mulching, sediment and trash removal, and limited use of fertilizers and pesticides. A customized maintenance schedule must be prepared for each bioretention facility, since the maintenance tasks will differ depending on the scale of bioretention, the landscaping template chosen, and the type of surface cover. A generalized summary of common maintenance tasks and their frequency is provided in Table 1.10.
The most common non-routine maintenance problem involves standing water. If water remains on the surface for more than 48 hours after a storm, adjustments to the grading may be needed or underdrain repairs may be needed. The surface of the filter bed should also be checked for accumulated sediment or a fine crust that builds up after the first several storm events. There are several methods that can be used to rehabilitate the filter (try the easiest things first, as listed below):
Open the underdrain observation well or cleanout and pour in water to verify that the underdrains are functioning and not clogged or otherwise in need of repair. The purpose of this check is to see if there is standing water all the way down through the soil. If there is standing water on top, but not in the underdrain, then there is a clogged soil layer. If the underdrain and stand pipe indicates standing water, then the underdrain must be clogged and will need to be snaked.
Remove accumulated sediment and till 2 to 3 inches of sand into the upper 8 to 12 inches of soil.
Install sand wicks from 3 inches below the surface to the underdrain layer. This reduces the average concentration of fines in the media bed and promotes quicker drawdown times. Sand wicks can be installed by excavating or augering (using a tree auger or similar tool) down to the gravel storage zone to create vertical columns which are then filled with a clean open-graded coarse sand material (ASTM C-33

General Application
Activity: Bioretention GIP‐01
Volume 5 – Green Infrastructure Practices February 2016 33
concrete sand or similar approved sand mix for bioretention media). A sufficient number of wick drains of sufficient dimension should be installed to meet the design dewatering time for the facility.
Remove and replace some or all of the soil media
Table 1.10. Suggested Annual Maintenance Activities for Bioretention Maintenance Tasks Frequency
Mowing of grass filter strips and bioretention turf cover At least 4 times a year Spot weeding, erosion repair, trash removal, and mulch raking Twice during growing season Add reinforcement planting to maintain desired vegetation density As needed Remove invasive plants using recommended control methods As needed Stabilize the contributing drainage area to prevent erosion As needed Spring inspection and cleanup Annually Supplement mulch to maintain a 3 inch layer Annually Prune trees and shrubs Annually Remove sediment in pre‐treatment cells and inflow points Once every 2 to 3 years Replace the mulch layer Every 3 years
SECTION 11: COMMUNITY & ENVIRONMENTAL CONCERNS 11.1 Designation of Stormwater Hotspots Stormwater hotspots are operations or activities that are known to produce higher concentrations of stormwater pollutants and/or have a greater risk for spills, leaks or illicit discharges. Table 1.11 presents a list of potential land uses or operations that may be designated as a stormwater hotspot. It should be noted that the actual hotspot generating area may only occupy a portion of the entire proposed use, and that some “clean” areas (such as rooftops) can be diverted away to another infiltration or runoff reduction practice development proposals should be carefully reviewed to determine if any future operation, on all or part of the site, will be designated as a potential stormwater hotspot. Based on this designation, infiltration may be restricted or prohibited.

General Application
Activity: Bioretention GIP‐01
Volume 5 – Green Infrastructure Practices February 2016 34
Table 1.11. Potential Stormwater Hotspot and Site Design Responses
Potential Stormwater Hotspot Operation RestrictedInfiltration
NoInfiltration1
Facilities w/NPDES Industrial permits Public works yard Ports, shipyards and repair facilities Railroads/ equipment storage Auto and metal recyclers/scrap yards Petroleum storage facilities Highway maintenance facilities Wastewater, solid waste and composting facilities Industrial machinery and equipment
Trucks and trailers
Airfields
Aircraft maintenance areas Fleet storage areas Parking lots (40 or more parking spaces)
Gas stations Highways (2500 ADT)
Construction business (paving, heavy equipment storage and maintenance
Retail/wholesale vehicle/ equipment dealers
Convenience stores/fast food restaurants
Vehicle maintenance facilities Car washes Nurseries and garden centers
Golf courses
Note: For a full list of potential stormwater hotspots. Consult Schueler et al (2004) Key: = depends on facility; = criterion applies 1For some facilities, infiltration practices will be permitted for certain areas such as employee parking and roof drainage.
11.2 Other Environmental and Community Issues
The following is a list of several other community and environmental concerns that may also arise when infiltration practices are proposed:
Nuisance Conditions. Poorly designed infiltration practices can create potential nuisance problems such as basement flooding, poor yard drainage and standing water. In most cases, these problems can be minimized through proper adherence to the setback, soil testing and pretreatment requirements outlined in this specification.
Mosquito Risk. Infiltration practices have some potential to create conditions favorable to mosquito breeding, if they clog and have standing water for extended periods. Proper installation and maintenance of the bioretention area will prevent these conditions from occurring.
Groundwater Injection Permits. Groundwater injection permits are required if the infiltration practice is deeper than the longest surface area dimension of the practice. Designers should investigate whether or not a proposed infiltration practice is subject to Tennessee groundwater injection well permit requirements.

General Application
Activity: Bioretention GIP‐01
Volume 5 – Green Infrastructure Practices February 2016 35
SECTION 12: RIGHT OF WAY CONSIDERATIONS
Bioretention can be used in the right of way and is a preferred practice for constrained right of ways when designed as a series of individual on-line or off-line cells. In these situations, the final design closely resembles that of water quality swales. Stormwater can be conveyed to the bioretention area by sheet flow, curb cuts, or grass channels. See GIP-02 Urban Bioretention for additional information.

General Application
Activity: Bioretention GIP‐01
Volume 5 – Green Infrastructure Practices February 2016 36
SECTION 13: REFERENCES
Brown, R.A., Hunt, W.F. and S.G. Kennedy. 2009. “Designing Bioretention with an Internal Water Storage Layer.” North Carolina Cooperative Extension Service Bulletin. Urban Waterways Series. AG-588-19W. North Carolina State University. Raleigh, NC.
Chesapeake Stormwater Network (CSN). 2008. Technical Bulletin 1: Stormwater Design Guidelines for Karst Terrain in the Chesapeake Bay Watershed. Version 1.0. Baltimore, MD. Available online at: http://www.chesapeakestormwater.net/all-things-stormwater/stormwater-guidance-for-karst-terrain-in-the-chesapeake-bay.html
CWP. 2007. National Pollutant Removal Performance Database, Version 3.0. Center for Watershed Protection, Ellicott City, MD.
Hirschman, D., L. Woodworth and S. Drescher. 2009. Technical Report: Stormwater BMPs in Virginia’s James River Basin – An Assessment of Field Conditions and Programs. Center for Watershed Protection. Ellicott City, MD.
Hunt, W.F. III and W.G. Lord. 2006. “Bioretention Performance, Design, Construction, and Maintenance.” North Carolina Cooperative Extension Service Bulletin. Urban Waterways Series. AG-588-5. North Carolina State University. Raleigh, NC.
Hyland, S. 2005. “Analysis of sinkhole susceptibility and karst distribution in the Northern Shenandoah Valley (Virginia): impacts for LID site suitability models.” M.S. Thesis. Virginia Polytechnic Institute and State University. Blacksburg, VA.
Lake County, OH. Bioretention Guidance Manual. Available online at: http://www2.lakecountyohio.org/smd/Forms.htm
LIDC. 2003. Bioretention Specification. The Low Impact Development Center, Inc, Beltsville, MD. Available at: http://www.lowimpactdevelopment.org/epa03/biospec.htm.
Maryland Department of the Environment. 2001. Maryland Stormwater Design Manual. htp:/www.mde.state.md.us/Programs/WaterPrograms/SedimentandStormwater/stormwater design/index.asp
Minnesota Stormwater Steering Committee (MSSC). 2005. The Minnesota Stormwater Manual.
MWS, 2011. Rain Gardens for Nashville. Metro Water Services Stormwater NPDES Department, Nashville, TN.
North Shore City. 2007. Bioretention Design Guidelines. Sinclair, Knight and Merz. Auckland, New Zealand.
Prince George’s Co., MD. Bioretention Manual. Available online at: http://www.goprincegeorgescounty.com/Government/AgencyIndex/DER/ESD/Bioretention/bioret ention.asp?nivel =fold men u(7)
Schueler, T. 2008. Technical Support for the Baywide Runoff Reduction Method. Chesapeake Stormwater Network. Baltimore, MD. www.chesapeakestormwater.net
Schueler et al. 2007. Urban Stormwater Retrofit Practices. Manual 3 in the Urban Subwatershed Restoration Manual Series. Center for Watershed Protection. Ellicott City, MD.
State of Virginia BMP Specification No. 8 – Bioretention (2010).

General Application
Activity: Bioretention GIP‐01
Volume 5 – Green Infrastructure Practices February 2016 37
Virginia Department of Conservation and Recreation (VADCR), 2010. Stormwater Design Specification No. 9: Bioretention, version 1.7. Virginia Department of Conservation and Recreation, Richmond, VA.
Virginia Department of Conservation and Recreation (VADCR), 2013. Stormwater Design Specification No. 9: Bioretention, version 2.0. Virginia Department of Conservation and Recreation, Richmond, VA.
Wisconsin Department of Natural Resources. Stormwater Management Technical Standards. http://www.dnr.state.wi.us/org/water/wm/nps/stormwater/techstds.htm#Post

General Application
Activity: Bioretention GIP‐01
Volume 5 – Green Infrastructure Practices February 2016 38
APPENDIX 1‐A
INFILTRATION SOIL TESTING PROCEDURES
I. Test Pit/Boring Procedures
1. The number of required test pits or standard soil borings is based on proposed infiltration area: < 1,000 ft2 = 2 tests 1,000 – 10,000 ft2 = 4 tests >10,000 ft2 = 4 tests + 1 test for every additional 5,000 ft2
2. The location of each test pit or standard soil boring should correspond to the location of the proposed infiltration area.
3. Excavate each test pit or penetrate each standard soil boring to a depth at least 2 feet below the bottom of the proposed infiltration area.
4. If the groundwater table is located within 2 feet of the bottom of the proposed facility, determine the depth to the groundwater table immediately upon excavation and again 24 hours after excavation is completed.
5. Determine the USDA or Unified Soil Classification system textures at the bottom of the proposed infiltration area and at a depth that is 2 feet below the bottom. All soil horizons should be classified and described.
6. If bedrock is located within 2 feet of the bottom of the proposed infiltration area, determine the depth to the bedrock layer.
7. Test pit/soil boring stakes should be left in the field to identify where soil investigations were performed.
II. Infiltration Testing Procedures
1. The number of required infiltration tests is based on proposed infiltration area: < 1,000 ft2 = 2 tests 1,000 – 10,000 ft2 = 4 tests >10,000 ft2 = 4 tests + 1 test for every additional 5,000 ft2
2. The location of each infiltration test should correspond to the location of the proposed infiltration area.
3. Install a test casing (e.g., a rigid, 4 to 6 inch diameter pipe) to a depth 2 feet below the bottom of the proposed infiltration area.
4. Remove all loose material from the sides of the test casing and any smeared soil material from the bottom of the test casing to provide a natural soil interface into which water may percolate. If desired, a 2-inch layer of coarse sand or fine gravel may be placed at the bottom of the test casing to prevent clogging and scouring of the underlying soils. Fill the test casing with clean water to a depth of 2 feet, and allow the underlying soils to presoak for 24 hours.

General Application
Activity: Bioretention GIP‐01
Volume 5 – Green Infrastructure Practices February 2016 39
5. After 24 hours, refill the test casing with another 2 feet of clean water and measure the drop in water level within the test casing after one hour. Repeat the procedure three (3) additional times by filling the test casing with clean water and measuring the drop in water level after one hour. A total of four (4) observations must be completed. The infiltration rate of the underlying soils may be reported either as the average of all four observations or the value of the last observation. The infiltration rate should be reported in terms of inches per hour.
6. Infiltration testing may be performed within an open test pit or a standard soil boring. After infiltration testing is completed, the test casing should be removed and the test pit or soil boring should be backfilled and restored.

General Application
Activity: Bioretention GIP‐01
Volume 5 – Green Infrastructure Practices February 2016 40
APPENDIX 1‐B
ADDITIONAL DETAILS AND SCHEMATICS
FOR REGULAR BIORETENTION PRACTICES
Figure 1‐B. 1. 4” Cleanout Detail (source: VADCR, 2010)

General Application
Activity: Bioretention GIP‐01
Volume 5 – Green Infrastructure Practices February 2016 41
Figure 1‐B.2. Typical Bioretention Basin Berm (source: VADCR, 2010)

General Application
Activity: Bioretention GIP‐01
Volume 5 – Green Infrastructure Practices February 2016 42
Figure 1‐B.3. Typical Bioretention Basin – Inflow & Outflow – Section (source: VADCR, 2010)