activity-based costing/management
TRANSCRIPT

Environmental sustainability Activity-bAsed costing/mAnAgement b y M a r k L e M o n a n d a n t h o n y P e M b e r
E M E R G I N G I S S U E S P A P E R
A B C / M

2
A BC / M
E n v i r o n m E n t a l s u s t a i n a b i l i t y
What is the issue? Consumers, shareholders, and other stakeholders have become increasingly aware of environmental concerns and are pressuring organizations to consider environmental issues and how they relate to the organization’s bottom line. Accurately quantifying the costs of environmental impacts and remediation efforts is a challenge.
Why is it important? Understanding the costs of addressing environmental issues can help organizations make informed decisions which can minimize these costs and create a competitive advantage.
What can be done? Proven strategic management accounting tools such as activity-based costing/management (ABC/M) can help organizations make better decisions and manage the costs of environmental sustainable business.

3
Activity-based costing / management (ABC/M) is an effective management accounting tool that organizations have used for a number of years to better understand and improve their cost structure. The Consortium for Advanced Management – International (CAM-I) pioneered ABC/M including the CAM-I Cross® (Figure 1), which combines the cost assignment view (vertical view of activity-based costing) and process view (horizontal view of activity-based management). Having both views allows an organization to better assign costs and improve its processes to reduce costs.
Introduction
f i g u r E 1
the CaM-I Cross ® (CaM-I ’s e xPanded abC/ M ModeL)
resourCes
Cost Assignment View
Process View
aCtIvItIesCost drIvers(cause of costs)
PerforManCe Measures
Cost objeCts(products, services,
customers)
Resource Drivers
Activity Drivers

4
Accurately quantifying environmental emissions—inventorying them over time—is not unlike financial accounting. Organizations can therefore track and manage emissions, such as greenhouse gases (GHG), in much the same way (employing financial management tools and techniques). As with financial accounting,
inventory information alone does not provide significant insight into the performance of particular activities. Performance indicators provide information that allow for effective management. In order to make management decisions about resources organizations must understand what drives resources. Organizations achieve this understanding by building models that illustrate how activities drive resources to products and services. These models show how resources are consumed, why they are consumed, and who consumes them.
How to apply ABC/M to environmental sustainability
Numerous papers and articles have highlighted how ABC/M is capable of improving environmental management accounting. The International Federation of Accountants’ (IFAC) international guidance document, “Environmental Management Accounting,” discusses current challenges in environmental management accounting. The article points out that environment-related costs are often “hidden” in overhead accounts. The guidance states:
“Organizations have taken different approaches to resolving the issue of hidden environment-related costs. One common solution is to set up separate cost categories or cost centres for the more obvious and discrete environmental management activities. The less obvious costs that will still appear in other accounts and cost centres can be more clearly labeled as environment related so that they can be traced more easily. An assessment of the relative importance of environment-related costs and cost drivers of different process and product lines, in line with the
Suppliers who have a f irm grasp on their environment-related costs and their GHG footprint are at a distinct advantage when customers become aggressive in their desire to reduce their environmental impact.

5
general practice of activity-based costing (ABC) can help an organization determine whether or not the cost allocation bases being used are appropriate for those costs.”
The “Environmental Management Accounting Procedures and Principles” paper from the United Nations Division for Sustainable Development advocates a similar method:
“Whenever possible, environment-driven costs should be allocated directly to the activity that causes the costs and to the respective cost centres and cost drivers. Consequently, the costs of treating, for example, the toxic waste arising from a product should directly and exclusively be allocated to that product. Many terms are used to describe this correct allocation procedure, such as environmentally enlightened cost accounting, full cost accounting or ABC/M. ABC/M, ‘ is a product costing system...that allocates costs typically allocated to overhead in proportion to the activities associated with a product or product family’”
Simply put, ABC/M can help move GHG costs from the catch-all line item of “overhead” and directly assign them to particular activities and cost objects which can then be analyzed for performance.

6
TradiTional View acTiViT y-Based View
$ Cost PooL $ aCtIvIty $
Electricity 80,000 Electricity for HVAC 20,000 Develop schedule 7,500
Electricity for manufacturing 40,000 Process raw material 15,000
Electricity to run servers 15,000 Manufacture product 60,000
Electricity for lighting 5,000 Ship products 22,500
Natural gas 30,000 Natural gas for manufacturing 25,000 HR management 10,000
Natural gas for HVAC 5,000 Financial management 10,000
Petrol/diesel 25,000 Petrol for vans/forklifts 5,000 IT management 25,000
Diesel for trucks 20,000
Work-related travel 15,000 Work-related air travel 10,000
Work-related train travel 1,000
Work-related motor vehicle travel 4,000
totaL 150,000 totaL 150,000 totaL 150,000
Traditional abc/m models can determine the cost of environmental measures. For example, an organization can use environmental costs as the resource inputs (e.g. electrical bills, building lease energy cost estimates, and energy-related portions of supplier selling prices). The model could also include significant activities that
How ABC/M addresses a firm’s GHG emissions
t a b l E 1
tr adItIonaL and aC tIvIt y-based vIe w of envIronMentaL Costs
consume the resources and the products and services that consumed the activities. Ultimately, such a model would define an organization’s environmental costs in terms of its activities and outputs. The example below shows how an organization can determine the environmental costs of its activities.

7
TradiTional View acTiViT y-Based View
MtCo2e Cost PooL MtCo2e aCtIvIty MtCo2e
Electricity 20,500 Electricity for HVAC 5,000 Develop schedule 3,750
Electricity for manufacturing 10,000 Process raw material 3,750
Electricity to run servers 3,500 Manufacture product 12,750
Electricity for lighting 2,000 Ship products 22,500
Natural gas 3,500 Natural gas for manufacturing 2,500 HR management 13,250
Natural gas for HVAC 1,000 Financial management 9,750
Petrol/diesel 25,000 Petrol for vans/forklifts 5,000 IT management 10,250
Diesel for trucks 20,000
Work-related travel 27,000 Work-related air travel 15,000
Work-related train travel 2,000
Work-related motor vehicle travel 10,000
totaL 76,000 totaL 76,000 totaL 76,000
t a b l E 2
tr adItIonaL and aC tIvIt y-based vIe w of GhG footPrInt[MeTric Tons of carBon dioxide equiValenT (MTco2e)]
Alternatively, instead of quantifying resource inputs in terms of costs (e.g. the cost of electricity, natural gas, fuel, or travel), they can be quantified in terms of an environmental measure that is important to the organization, for example, the carbon dioxide equivalent (CO2e) for each resource. This provides a true picture of the environmental impact of each of the organization’s activities. This activity-based view may look considerably different to the cost view as there is not necessarily a relationship between a resource’s cost and its GHG
footprint. In the example below, “ship products” and “HR management” are big contributors to the organization’s carbon footprint, yet these are not large cost activities compared to “manufacture product” (Table 2). The discrepancy has to do with the type of resource being consumed. In this example, “work-related travel” and “petrol/diesel,” while comparatively inexpensive, have large carbon footprints. And since “ship products” and “HR management” are the biggest consumers of these two resources, they receive the largest proportion of CO2e.

8
This methodology for capturing GHG emissions data differs from many non-ABC/M methodologies in that it truly captures overhead CO2 in a meaningful way. However, the true power of an ABC/M methodology is in its integration of multiple value items. Consider an
TradiTional View acTiViT y-Based View
Cost per MtCo2e Cost PooL Cost per MtCo2e aCtIvIty Cost per MtCo2e
Electricity 3.90 Electricity for HVAC 4.00 Develop schedule 2.00
Electricity for manufacturing 4.00 Process raw material 4.00
Electricity to run servers 4.29 Manufacture product 4.71
Electricity for lighting 2.50 Ship products 1.00
Natural gas 8.57 Natural gas for manufacturing 10.00 HR management 0.75
Natural gas for HVAC 5.00 Financial management 1.03
Petrol/diesel 1.00 Petrol for vans/forklifts 1.00 IT management 2.44
Diesel for trucks 1.00
Work-related travel 0.56 Work-related air travel 0.67
Work-related train travel 0.50
Work-related motor vehicle travel 0.40
t a b l E 3
tr adItIonaL and aC tIvIt y-based vIe w of Cost Per Co 2e
ABC/M model that combines cost, revenue, and GHG emissions as value items. Each of these value items flows through the model such that activities and products/services have a cost, revenue, and GHG footprint.
9
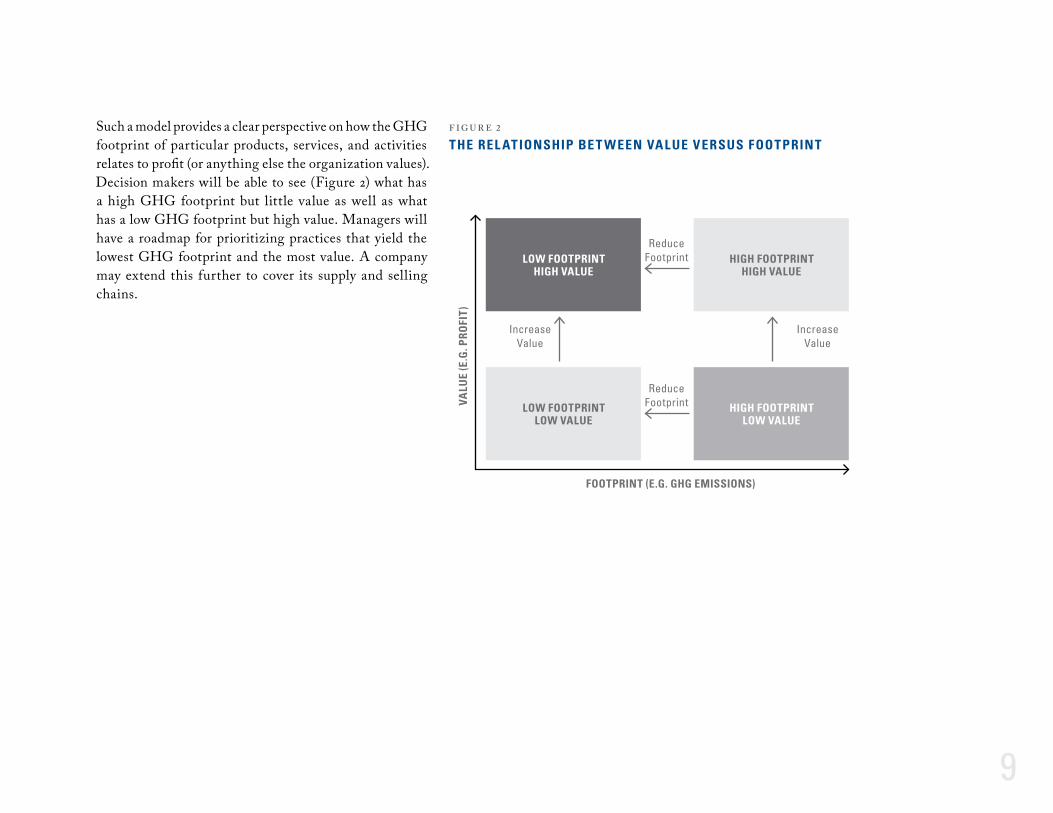
Such a model provides a clear perspective on how the GHG footprint of particular products, services, and activities relates to profit (or anything else the organization values). Decision makers will be able to see (Figure 2) what has a high GHG footprint but little value as well as what has a low GHG footprint but high value. Managers will have a roadmap for prioritizing practices that yield the lowest GHG footprint and the most value. A company may extend this further to cover its supply and selling chains.
Low footPrInthIGh vaLue
Low footPrIntLow vaLue
hIGh footPrInthIGh vaLue
hIGh footPrIntLow vaLue
Reduce Footprint
Increase Value
Increase Value
Reduce Footprint
footPrInt (e.G. GhG eMIssIons)
vaLu
e (e
.G. P
rofI
t)
f i g u r E 2
the reL atIonshIP be t ween vaLue versus footPrInt

10
Using ABC/M to track environment-related costs and measures allows an organization to incorporate sustainability into its ongoing management initiatives. ABC/M, already familiar to management accountants, provides a transparent model for distributing GHG emissions through an organization to the final products/services. It is also an auditable and disciplined modeling approach (rather than an ad-hoc approach) for reporting the true emissions profile of an organization’s individual products or services. ABC/M helps management actively manage its activities or processes to reduce emissions through more efficient techniques, greener sources of energy, or buying or selling emission permits. The benefits of this approach include:
Identifying the GHG footprint of particular products hh
and services;
Providing a detailed understanding of the energy hh
consumption and emissions of particular activities within a company;
Better defining the emissions “boundaries” a company hh
is responsible for;
Understanding how energy and GHG intensity affect hh
cost and how those costs are passed from producer to consumer;
Building a valuable knowledge base to help measure hh
and justify future corporate, environmental, and financial decisions;
Enhancing a company’s ability to evaluate and compare hh
GHG intensity and cost implications of activities, products, and services;
Articulating GHG-related costs, risks, and hh
opportunities to shareholders and other stakeholders;
Engaging staff with targeted energy reduction steps;hh
Setting an example and an expectation for suppliers and hh
contractors to be just as environmentally conscious;
Enhancing the company’s public profile and reputation hh
as a good corporate citizen.

11
Is your organization ready to measure and manage its GHG emissions?
An organization must consider several factors before it begins using ABC/M to monitor and evaluate its GHG emissions. Here are some of those considerations:
quesTions for consideraTion why This quesTion is iMporTanT
saMple responses
"More likely To succeed" "less likely To succeed"
Is there suPPort throuGhout the entIre orGanIzatIon to IMPLeMent thIs InItIatIve?
For a sustainability initiative to have the greatest impact, it must be undertaken by the entire company. If there is “buy-in” from all relevant decision makers, the organization is ready to undertake such an initiative.
This is core to our business strategy, and I give annual status reports to our executive teams.
We feel that making improvements here will ultimately improve our efficiency and our bottom line.
Everyone is on board; it’s part of our culture.
Our organization has traditionally been closed to the idea; however, there seems to be a slow change in our peoples’ perspective.
Right now we’re looking at the landscape and it seems like all of our peers are going this route and we don’t want to be left out.
While this is not part of our culture, I am sure we can convince people to participate.
quesTions for consideraTion why This quesTion is iMporTanT
saMple responses
"More likely To succeed" "less likely To succeed"
do the PeoPLe sPearheadInG the InItIatIve have the ProPer authorIty to Make ChanGe wIthIn theIr orGanIzatIon?
For maximum benefit, a sustainability initiative must be fully integrated into an organization’s decision-making processes. To a large extent, the success of the initiative will be determined by the ability of those in charge to directly influence key decisions.
I’m in charge of facilities and I work very closely with Tom in finance and Bob, who is in charge of fleet management, to implement what we need to hit our CEO’s reduction target. If it makes sense, we can get it done.
My team acts as an advisor to the rest of the organization and delivers important information to the board. Management of energy is just one part of what I do. Much of our fleet management is controlled by a colleague I don’t know very well.

12
quesTions for consideraTion why This quesTion is iMporTanT
saMple responses
"More likely To succeed" "less likely To succeed"
how wILL the InforMatIon be used and who wIthIn the orGanIzatIon wILL use It?
Sustainability information can be used in multiple ways, from reporting GHG emission levels to tracking emission trends and analyzing emission reduction and cost performance. Articulating the purposes for information clarifies an organization’s plans for assessing its sustainability measures and speaks to the level of influence decision makers have in driving the initiative.
Our regional office managers need to know a couple of very important metrics we’ve defined as key to achieving our reduction goals. We also need to provide the leadership of our core business with details on where their emissions are coming from and what they can do to reduce them.
We’ve only just started measuring our footprint, however, it’s unclear how we’re supposed to get there and how exactly we’ll manage performance. Once we start to see the numbers, I think we’ll have a better idea of where we can make improvements.
quesTions for consideraTion why This quesTion is iMporTanT
saMple responses
"More likely To succeed" "less likely To succeed"
does the orGanIzatIon have the CaPaCIty to Get enerGy ConsuMPtIon InforMatIon froM IndIvIduaL resPonsIbILIty Centrese (buILdInGs, vehICLes, etC.) and aCtIvItIes?
The ability to carry out ABC/M is contingent on being able to collect and analyze unit information from individual responsibility centres. Organizations must be able to collect information from each of its responsibility centres to effectively assess the relative emissions, cost, and efficiency of each centre.
Our organization has installed a smart grid system that tracks energy consumption for each individual building at our office park. This allows us to track the consumption and relative efficiency of each building.
Our organization does not utilize smart grid technology but we do have good metrics we can use to approximate energy consumption in each of our buildings/facilities.
To generate our GHG footprint, we get our organization’s total energy consumption from the power company. We do not have the technology to get energy consumption data at the facility level, nor do we have metrics we can use to approximate energy consumption at each of our facilities.

13
quesTions for consideraTion why This quesTion is iMporTanT
saMple responses
"More likely To succeed" "less likely To succeed"
how Many suPPLIers does the CoMPany use?
how ChaLLenGInG wILL It be to Get GhG eMIssIon InforMatIon froM theM?
Tracking and reporting Scope 3 GHG emissions (e.g. those resulting from waste disposal, purchased materials, business travel, fuel usage for transporting outputs, and outsourced activities) requires receiving information from a company’s supply chain. The company must be able to get this information in order to effectively track Scope 3 emissions. It is possible to build a GHG emissions model that does not include Scope 3 emissions, however, eventually it is recommended that any model built include Scope 3 emissions. As such, a “less likely to succeed” answer to this question should not deter an organization from going forward with modeling Scope 1 and Scope 2 emissions.
In reality, this is where we can make our biggest improvements. We have welcomed the emergence of Scope 3 because it gives us a chance to expand the playing field to areas undergoing massive improvement, areas each employee can impact.
We see Scope 3 as important, but the regulations are just now coming together, many of which are still abstract and lack direction. Plus, the data around this is very scarce. We’re having a hard enough time collecting data for Scope 1 and Scope 2.

14
How to move towards a GHG model using ABC/M
How does an organization move from simple GHG compliance reporting (e.g. using a spreadsheet) to managing emissions with an enduring model? Insights from previous ABC/M implementations suggest there are four key steps:
Define the purpose, boundary, and scope of the 1] model;
Find data sources necessary to support the model;2]
Build the model;3]
Document and use the model.4]
S T EP 1
Define the purpose, boundary, and scope of the modelBefore taking steps to build and implement ABC/M to capture GHG emissions, it is important to ensure the model has support throughout the organization. There
Unlike financial accounting, there are no “official” standards for GHG emissions accounting and reporting. However, the World Resources Institute (WRI) is unofficially recognized as the leader in this area and the WRI GHG Protocol— A Corporate Accounting and Reporting Standard (GHG Protocol) is considered by most as the de-facto standard. This document defines organizational boundaries and scopes and is a good starting point for any GHG emissions model.

15
should be a framework for supporting the ABC/M including designated financial and operational points of contacts for each business unit.
It is important for the organization to define the model’s boundary (i.e. what specific entities it will monitor) and scope (i.e. what types of emissions it will monitor). Scope may include monitoring direct, indirect, or supply chain emissions. Once an organization selects an approach for consolidating GHG emissions it must use that approach consistently.
BoundaryThe World Resources Institute’s (WRI) GHG Protocol outlines two distinct approaches organizations can use to define boundaries and consolidate GHG emissions: the equity share approach and control approach. Under the equity share approach, an organization accounts for GHG emissions from operations according to each operation’s share of equity in the operation. Under the control approach, a company accounts for 100 per cent of the GHG emissions based on which operations it has control over. The company does not account for GHG emissions from operations it owns an interest in but has no control over. In a voluntary setting, a company can use either approach as long as it uses that approach consistently. Where a reporting company wholly owns all its operations, its organizational boundary will be the same under both approaches. However, for organizations
with joint operations, the organizational boundary and the resulting emissions may differ between the two approaches.
Another consideration for organizations defining the scope and boundary of an ABC/M model is that many jurisdictions have local and industry-specific standards organizations must follow.
ScopeCarbon emissions have been divided into three scopes:
sCoPe 1hh – direct emissions from within the organization;
sCoPe 2hh – indirect emissions through the use of electricity;
sCoPe 3hh – while not yet completely defined (and not yet required for reporting purposes), Scope 3 emissions stem from organizational activities such as waste disposal, purchased materials, and business travel.

16
scope 1 scope 2 scope 3
eMIssIon tyPe dIreCt Emissions from within
the organization
IndIreCt Emissions from
purchased electricity
eMbodIed Emissions embedded
in inputs
exaMPLes Electricity •generationIndustrial •processesFuel usage for •transporting inputsFugitive emissions•On-site waste•
Electricity •consumption
Waste disposal•Purchased •materialsBusiness travel•Fuel usage for •transporting outputsOutsourced •activities
suPPLy ChaIn Impacted Impacted Impacted
Mandatory rePortInG
Report (if > threshold)
Report (if > threshold)
Voluntary
eMIssIons tradInG
Liable (if > threshold and at point of obligation)
Impacts compensation calculations only
None
dIffICuLty In ModeLInG Easy Easy Difficult
f i g u r E 3
desCrIP tIon of sCoPe 1, 2 and 3 GhG eMIssIonsCurrent best practices indicates an organization start by modeling Scope 1 GHG emissions then add in Scope 2 GHG emissions. As knowledge and maturity in the modeling process increases, Scope 3 emissions can be added. This allows the organization to leverage what has already been built.
S T EP 2
Find data sources necessary to support the modelA model’s supporting data comes from both internal and external sources. Most organizations are in the early stages of environmental management and much of the required data may prove elusive. Therefore any model must be able to account for automated electronic source data collection as well as manual surveys or data entered directly into the model. The latter two are not ideal mechanisms for sourcing data: automated source data population should always be the end goal.
Several types of data are used for calculations in GHG emissions models:
GeneraL LedGer InforMatIonhh (expenses and revenue): This data constitutes the expenses entered into the model. It includes discretionary expenditures, payroll expenses, supplier and raw material expenses, and other costs incurred by the organization.
Source: KPMG Australia, July 2009.

17
huMan resourCes InforMatIon:hh This data is typically used to determine where personnel work, what work they are performing (via job codes), and sometimes the hours they work on specified tasks.
eMIssIons data:hh The measurement of this data, while sometimes achieved directly via sensors in smokestacks or exhaust piping, usually requires two key pieces of information:
eMIssIons faCtors: hh The amount of emissions associated with a given activity (e.g. CO2e per kWh or CO2e per mile for a specific engine type). Emissions factors will vary based on geography and other variables. For example, electricity sourced in the northwest United States, which generates a large amount of hydroelectric power, will generally have lower emissions per kWh than electricity sourced in the mid-west United States, which predominately uses coal to generate electricity. Emissions factors are usually provided by a third party.
resourCe/aCtIvIty MetrIC InforMatIon:hh The volume of “activity” that creates the emissions. For example, the number of miles a truck was driven (Scope 1 emissions) or the amount of electricity an activity consumes (Scope 2 emissions). In an IT organization, metrics would include CPU usage and HDD utilization.
Transactional data (emissions factors and activity metrics) “drives” emissions through an ABC/M model
and serves two primary purposes: it increases automation, which speeds model development, and represents the best reflection of what drives the business. Ideally, automated mechanisms should capture transactional drivers and enter them into the model.
AMEE is an example of a third-party provider of emissions factors. AMEE’s web service allows users to develop local applications that calculate emissions levels for their organization. The user’s application submits data describing their emissions-producing assets and processes and retrieves the calculated emissions. AMEE utilizes its collection of emissions factors to perform these calculations. The AMEE emissions factors are typically incorporated into the ABC/M model as “drivers.” For an introduction to AMEE Discover visit: http://discover.amee.com

18
S T EP 3
Build the modelOnce the purpose, boundary, scope, and data sources of the model have been identified, it is time to build the ABC/M GHG emissions model. While the exact structure of a model can vary, Figure 4 outlines a generic structure and how it functions. An activity-based GHG emissions model will have at least four modules, each of which would be structured to account for factors like organizational hierarchy and geography.
externaL unIts ModuLe: hh Contains all of the model’s emissions factor information;
resourCe ModuLe:hh Contains organizational resource information (e.g. general ledger and human resources data). The scope, boundary and purpose of the model will determine the amount of data in this module and how it is structured. This module consumes the emissions factor information from the external units module;
aCtIvIty ModuLe:hh Contains the activities of the organization, which consume the resources in the Resource Module. A good model intra-modularly allocates overhead activities to the activities that directly produce products/services. Activities can be defined at a variety of organizational levels from high-level strategic to low-level operational. The amount of detail used will depend on many factors including: the
purpose of the model, required granularity and data availability.
Cost objeCt ModuLe:hh Contains the products and/or services of the organization. Cost objects consume the activities performed in the creation of the organization’s products/services.

19
f i g u r E 4
ModuLes of abC/ M GhG eMIssIons
exTernal uniTs Module
eMIssIons faCtor InforMatIon
externaLIty data
cosT oBjecT Module
ProduCts and or servICes deLIvered to CustoMers
Cost objeCts
resource Module
orGanIzatIonaL resourCe InforMatIon
dIreCt resourCes
IndIreCt resourCes
acTiViTy Module
aCtIvItIes that ConsuMe resourCes
externaL aCtIvItIes
InternaL aCtIvItIes
$
$
$ $
sourCes of GhG or by-ProduCts
Co2
Co2 Co2Co2
20
Once these modules have been established, costs or externality data (e.g. emissions data) are assigned to cost objects consistent with modular relationships. These assignments are highly dependent on an organization’s specific criteria (e.g. activities, cost objects, needs, and available data), so there is not a “one size fits all” solution. In most instances, modular relationships “flow” sequentially from left to right; however, in some instances, indirect resources will be allocated to direct resources, which will then be allocated to the next module. In other instances, internal activities will be used to assign resources to external activities, which will then be assigned to the next module. Costs, as suggested by the model in Figure 4, will only arise as a result of resource consumption. Externalities, by definition, will only arise in the external units module.
S T EP 4
Document and use the modelA well-documented system (e.g. documenting the purpose, boundary, scope, data sources, and tools) helps reduce the impact of personnel changes and facilitates a model’s auditability.
The methodology is the cornerstone of a model on which a system is developed because it guides the way activities are defined, the way resources are collected and assigned, and the way product/customer costs are calculated. Creating a methodology manual will help
model users who want to understand the fundamentals of costing results so they can make better use of the data. If an organization wants to make changes to the model, it should refer to the manual to ensure the changes are consistent with the model’s underlying methodology and that the methodology remains coherent.
The first step in transforming the methodology into practice is to derive a set of rules from the methodology, rules that document how model resources, activities, and products are to be treated (e.g. defined, classified, valued, stored, and processed).
Management systems typically fail because they are not used appropriately after they are built. The exact use of an emissions model depends on its defined goals.
A good model will be multidimensional, facilitating reporting and analysis. Each dimension essentially provides a different perspective for viewing the data.
The use of model data will vary depending upon the stakeholder’s perspective and needs. IT departments, for example, will likely be concerned about the energy consumption of its equipment and use a model to monitor this (with the goal of reducing overall consumption). Executive management will likely want the model to supply information required for regulatory reporting. ABC/M can help trace the activities that contributed to a product or service’s large carbon footprint.

21
Understanding an organization’s cost base has always been a critical element of doing business. The rise of environmental awareness is pushing organizations to go beyond simply understanding internal, line item costs. Companies must now understand that many of its behaviors have real environmental impacts and costs.
ABC/M has become an accepted form of cost analysis. Many organizations already have ABC/M models in some form and extending these models to account for non-cost measures is relatively simple. Combining cost measures and environmental measures within a single ABC/M model provides a common “language” for the basis of cost/profit and managing environmental measures. To manage carbon emissions or water usage without considering cost and profit is to manage half the issue. However, more often than not, organizations fail to capture costs in the same “language” as environmental measures, which makes determining the impact of increased environmental stewardship on profit difficult. A well-constructed ABC/M model simplifies the process.
Ultimately an organization must view GHG emissions and impacts the same way it views costs because,
Summary
ultimately, GHG emissions translate into cost. When an organization understands and manages its GHG emissions, it better controls its costs and has a positive environmental impact. ABC/M is just the tool to give organizations these abilities.

About the authorsMark Lemon, MPA, PMP is a senior associate in the global public sector practice at Grant Thornton LLP. He provides consulting services to federal government agencies in managerial cost accounting, activity-based cost modeling, risk analysis, and program management office support. He has experience evaluating the impacts of environmental policy and cost, identifying economically efficient policy solutions, calculating the financial and social impacts of policy regimes, conducting cost-benefit analysis, and conducting greenhouse gas inventories. Mark holds a Master of Public Affairs from Indiana University, Bloomington and a Bachelor of Arts from Kenyon College.
Anthony Pember is the chief executive officer of Pilbara Group, a consulting and software company in Virginia Beach, Virginia. Anthony provides consulting services to both government and non-government clients in the area of cost management and analytical decision support modeling. He has led cost management and performance improvement projects for many clients in the United States, Australia, Mexico, and Great Britain. He’s a respected innovator and thought leader in the area of business performance management and has been working in the cost and performance management arena for over a decade. Anthony is currently serving on the board for the Consortium of Advanced Management – International (CAM-I). Anthony holds a Bachelor of Science from the Australian National University.
No part of this publication may be reproduced, stored in a retrieval system or transmitted, in any form or by any means, without the prior written consent of the publisher or a licence from The Canadian Copyright Licensing Agency (Access Copyright). For an Access Copyright Licence, visit www.accesscopyright.ca or call toll free to 1 800 893-5777.
ISBN: 1-55302-292-0
© 2012 by The society of Management accountants of canada. all rights reserved. ®/™ registered Trade-Marks/Trade-Marks are owned by The society of Management accountants of canada.
cusToMer serVice: 1 877 262 6622fax: 905 949 0888eMail: [email protected]
Mississauga Executive Centre
1 Robert Speck Parkway • Suite 1400Mississauga, Ontario, L4Z 3M3
About CAM-IThe Consortium for Advanced Management – International (CAM-I) is a research organization consisting of companies and academia who collaborate to study and solve cost, process and performance management problems and critical business issues common to the group. For more information, visit: http://www.cam-i.org/
Other contributors Andrea Civichino, CMA Canada; Stathis Gould, International Federation of Accountants (IFAC); James Hendricks, Boeing; David Malone, Weber State University; Keith Renison, SAS Institute; Todd Scaletta, CMA Canada; Scott Wisler, Dresser-Rand.
This publication is one in a series on environmental sustainability. Other
parts of the package are accessible at www.managementaccounting.org.
Click on:
Concept Overviewhh