activity 1-2 sizing up species - illinois dnr · activity 1-2 sizing up species ... a species is a...
TRANSCRIPT
18Illinois Biodiversity Basics
Illinois Department of Natural Resources, Chicago Wilderness, World Wildlife Fund
Did you know that a single tree in a rain forest can behome to more than 1,000 different kinds of insects? Orthat a coral reef can support as many as 3,000 varieties offish and other organisms? Or that the deep ocean floor maybe home to more than 10,000 species of living things? Thesheer number of organisms living on earth is extraordi-nary. So far, scientists have identified about 1.7 millionspecies worldwide, but there are actually many more.Estimates range from 3 million to more than 100 million.
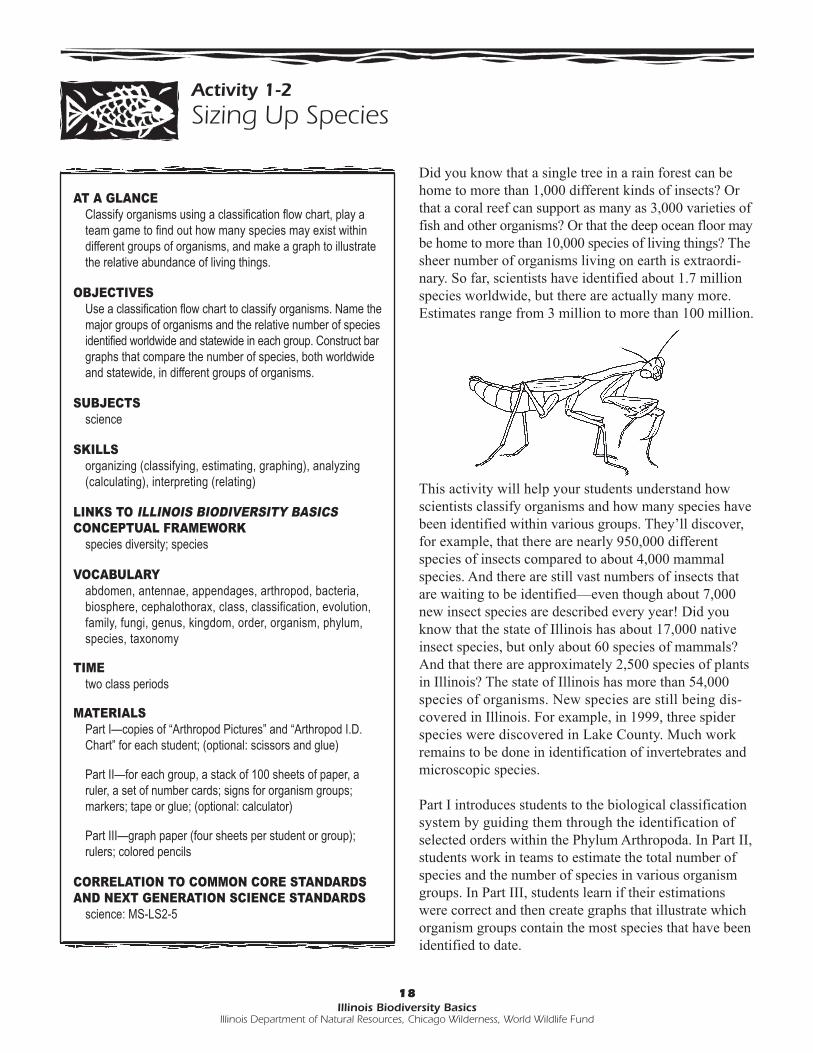
This activity will help your students understand howscientists classify organisms and how many species havebeen identified within various groups. They’ll discover,for example, that there are nearly 950,000 differentspecies of insects compared to about 4,000 mammalspecies. And there are still vast numbers of insects thatare waiting to be identified—even though about 7,000new insect species are described every year! Did youknow that the state of Illinois has about 17,000 nativeinsect species, but only about 60 species of mammals?And that there are approximately 2,500 species of plantsin Illinois? The state of Illinois has more than 54,000species of organisms. New species are still being dis-covered in Illinois. For example, in 1999, three spiderspecies were discovered in Lake County. Much workremains to be done in identification of invertebrates andmicroscopic species.
Part I introduces students to the biological classificationsystem by guiding them through the identification ofselected orders within the Phylum Arthropoda. In Part II,students work in teams to estimate the total number ofspecies and the number of species in various organismgroups. In Part III, students learn if their estimationswere correct and then create graphs that illustrate whichorganism groups contain the most species that have beenidentified to date.
Activity 1-2
Sizing Up Species
AT A GLANCE Classify organisms using a classification flow chart, play ateam game to find out how many species may exist withindifferent groups of organisms, and make a graph to illustratethe relative abundance of living things.
OBJECTIVESUse a classification flow chart to classify organisms. Name themajor groups of organisms and the relative number of speciesidentified worldwide and statewide in each group. Construct bargraphs that compare the number of species, both worldwideand statewide, in different groups of organisms.
SUBJECTSscience
SKILLSorganizing (classifying, estimating, graphing), analyzing(calculating), interpreting (relating)
LINKS TO ILLINOIS BIODIVERSITY BASICSCONCEPTUAL FRAMEWORK
species diversity; species
VOCABULARYabdomen, antennae, appendages, arthropod, bacteria,biosphere, cephalothorax, class, classification, evolution,family, fungi, genus, kingdom, order, organism, phylum,species, taxonomy
TIME two class periods
MATERIALS Part I—copies of “Arthropod Pictures” and “Arthropod I.D.Chart” for each student; (optional: scissors and glue)
Part II—for each group, a stack of 100 sheets of paper, aruler, a set of number cards; signs for organism groups;markers; tape or glue; (optional: calculator)
Part III—graph paper (four sheets per student or group);rulers; colored pencils
CORRELATION TO COMMON CORE STANDARDSAND NEXT GENERATION SCIENCE STANDARDS
science: MS-LS2-5

BEFORE YOU BEGIN! PART I
Make a copy of the “Arthropod Pictures” and the“Arthropod I.D. Chart” for each student. Depending onyour students’ choices, you may also need scissors andglue.
WHAT TO DO! PART I1. Introduce classification.
Begin by explaining to your students that scientistsclassify living things into various groups. The systemthey use classifies organisms into ever more closelyrelated groups and gives scientists from all over theworld a common way to refer to particular organisms.To give the students a sense of how this classificationsystem works, use the following information tocompare the classification of a house cat with a dog(see “Classification Chart”). The students should noticethat the cat and the dog share many classificationgroupings. Cats and dogs are in the same kingdom,phylum, class and order, but they belong to differentfamilies. You might also ask the students to nameother species that would be in the same family as ahouse cat (lynx, bobcat, lion, tiger, cougar and othercats) as well as other species that would be in the samefamily as a dog (wolf, fox, coyote, jackal and so on).You can also have the students name nonmammalchordates (animals with a backbone like fishes,amphibians, reptiles and birds) or noncat and nondogcarnivores (bears, raccoons, weasels, mongooses andso on).
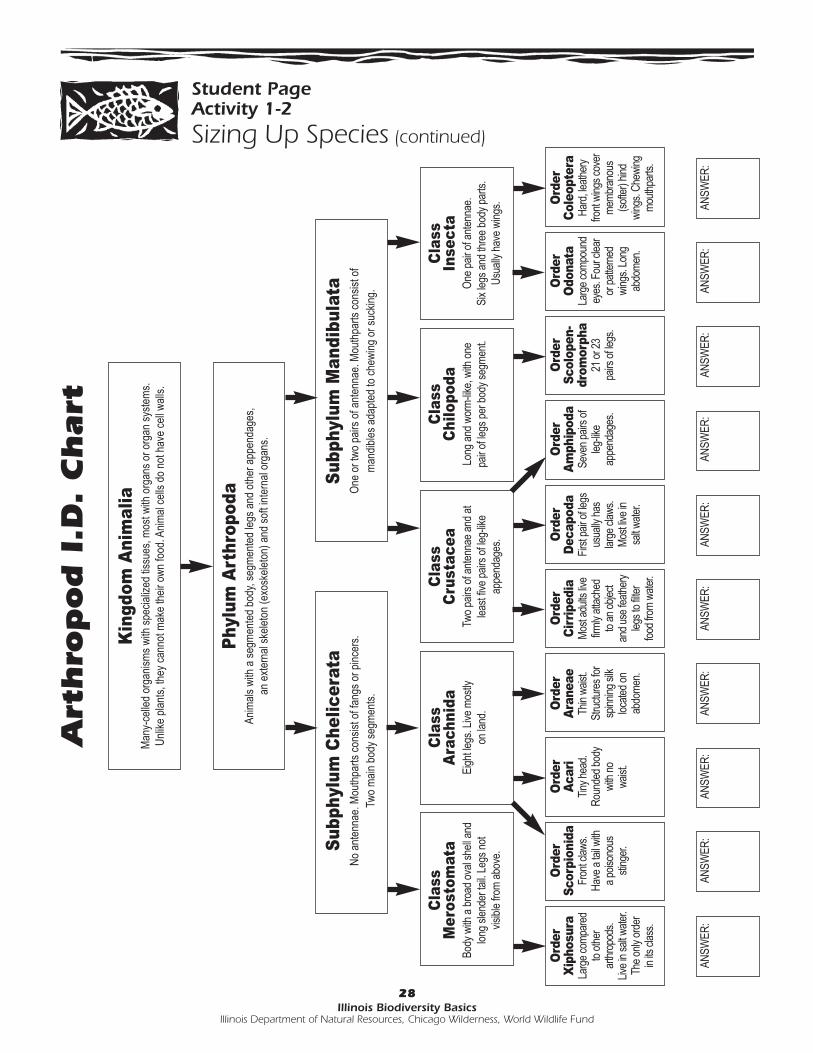
2. Use the “Arthropod I.D. Chart” to introduce theprocess of classifying organisms. Hand out a copy of the “Arthropod Pictures.”(Please note that this is a simplified chart and that allclasses and orders in the Phylum Arthropoda are notrepresented.) Start by writing the names of the sixkingdoms on the board or overhead (see page 29).Ask your students if they can describe some of thecharacteristics of organisms that would be classifiedin each kingdom. Ask them if they can name whichkingdom includes humans. Then ask them whichkingdom they think the organisms included in the“Arthropod Pictures” belong to (Animalia). Ask themto look carefully at the drawings and try to determinewhat characteristics all these organisms share.Students may notice that all the organisms picturedhave jointed legs, antennae and other appendages.They may also know that all the organisms have ahard outer shell (exoskeleton). These commoncharacteristics help organize them into a group, orphylum, within the Kingdom Animalia calledArthropoda. Arthropoda means “jointed feet.”
Hand out the “Arthropod I.D. Chart” and explainthat the organisms in the Phylum Arthropoda canthen be classified into different subgroups includingsubphyla and classes, which share more specificcharacteristics. For example, arthropods that aremembers of the class Insecta have six legs and abody that is divided into three major parts—head,thorax and abdomen. Scientists use keys such as thisto identify unknown organisms and relate them toother more familiar species. Write the followingvocabulary definitions on the board to help yourstudents when using the chart.
appendage any body part that extends outward from the mainbody, or trunk, of an animal, such as a leg, claw orantenna
antenna (singular), antennae (plural) sensory appendage located on the head orcephalothorax of some arthropods
19Illinois Biodiversity Basics
Illinois Department of Natural Resources, Chicago Wilderness, World Wildlife Fund
Activity 1-2
Sizing Up Species (continued)
Classification Chart
House Cat DogKingdom: Animalia AnimaliaPhylum: Chordata ChordataClass: Mammalia MammaliaOrder: Carnivora CarnivoraFamily: Felidae CanidaeGenus: Felis CanisSpecies: Felis catus Canis familiaris
20Illinois Biodiversity Basics
Illinois Department of Natural Resources, Chicago Wilderness, World Wildlife Fund
Naming ThingsThe work of classifying organisms is done by scientistscalled taxonomists. Taxonomists divide organisms into ahierarchical series of more and more specific groupings.The most general division of life is into six kingdoms:Eubacteria, Archaebacteria, Protista, Fungi, Plantae andAnimalia. (See page 29 for a description of each kingdom.)Within each kingdom, there are groups of increasingspecificity, each one containing fewer species of increas-ingly close evolutionary relationships to each other.These groups are phylum, class, order, family, genus andspecies (see page 21). This hierarchy enables taxonomiststo group organisms based on their characteristics andevolutionary relationships. Species in any given order aremore closely related to each other than to species in anyother order; species in any given family are more closelyrelated to each other than to species in any other family;and so on.
What’s in a Name?Most organisms have more than one common name. Forexample, what some people call a woodchuck might becalled a groundhog by other people. And a tree might becalled downy serviceberry, shadbush or downy Juneberry,all for the same species. Or a bird might be called ahouse sparrow or an English sparrow, depending on whois talking about it. Common names can be very confusing!Taxonomists use Latin words to give scientific names toorganisms. Not only does this clear up the confusion overcommon names in any one language, but it also allowsscientists who speak different languages to clearly identifyany particular organism or group of organisms.
When scientists refer to a particular organism by itsscientific name, they are using a combination of thegenus (plural: genera) and species (singular and plural)to which the organism belongs. For example, a coyote isreferred to as Canis latrans (Canis is the genus nameand latrans is the species name). The gray wolf, a closelyrelated species, is Canis lupus. The genus and speciesnames are always italicized or underlined. The genusname is capitalized, but the species name is not.
Keeping Relationships StraightFiguring out just where an organism belongs—how itshould be classified—is not always easy. Scientists lookfor structural and genetic similarities among organismsthat they classify together. But differences and similaritiesamong living things are not always clear cut. Taxonomistssometimes disagree about where organisms should beclassified, how genera should be arranged within families,and so on. As new information becomes available, tax-onomists often revise where an organism is placed withinthe classification system. For example, giant pandas,which share some characteristics with raccoons andsome with bears, have long been classified, along withred pandas, in their own group. However, genetic analysishas confirmed that giant pandas are actually true bears,and taxonomists are revising the species’ classificationbased on those findings.
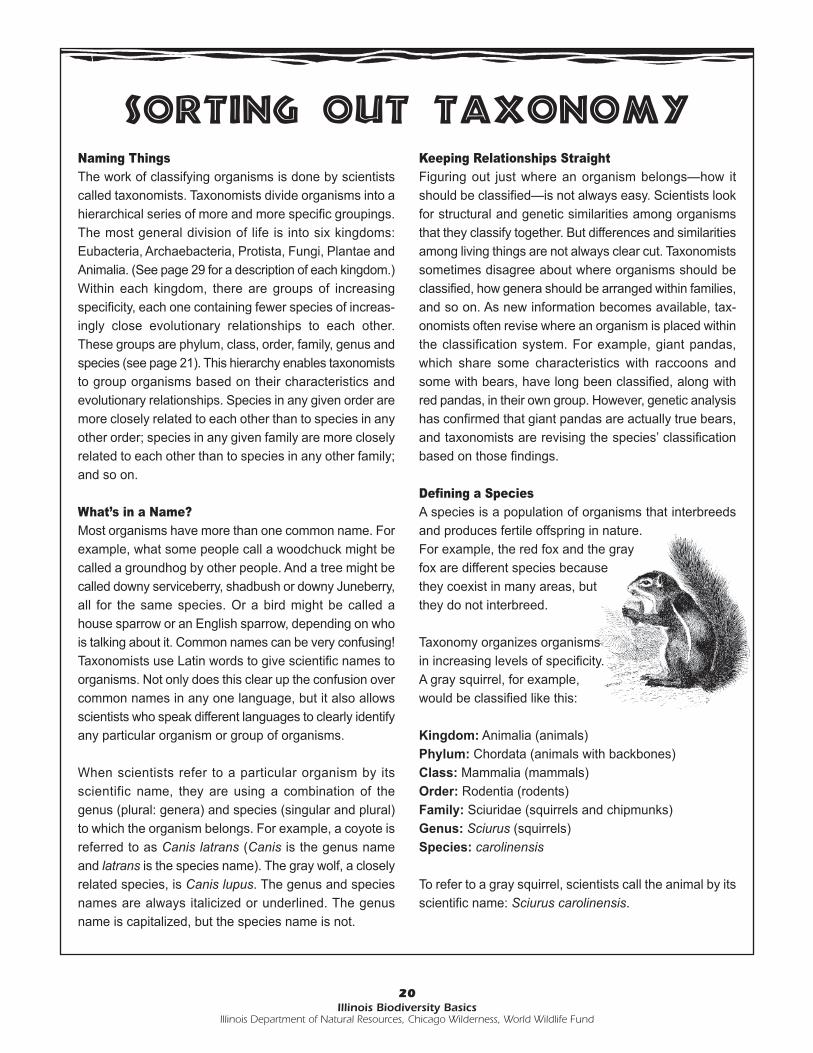
Defining a SpeciesA species is a population of organisms that interbreedsand produces fertile offspring in nature.For example, the red fox and the grayfox are different species becausethey coexist in many areas, butthey do not interbreed.
Taxonomy organizes organismsin increasing levels of specificity.A gray squirrel, for example,would be classified like this:
Kingdom: Animalia (animals)Phylum: Chordata (animals with backbones)Class: Mammalia (mammals)Order: Rodentia (rodents)Family: Sciuridae (squirrels and chipmunks)Genus: Sciurus (squirrels)Species: carolinensis
To refer to a gray squirrel, scientists call the animal by itsscientific name: Sciurus carolinensis.
Sorting Out Taxonomy
21Illinois Biodiversity Basics
Illinois Department of Natural Resources, Chicago Wilderness, World Wildlife Fund
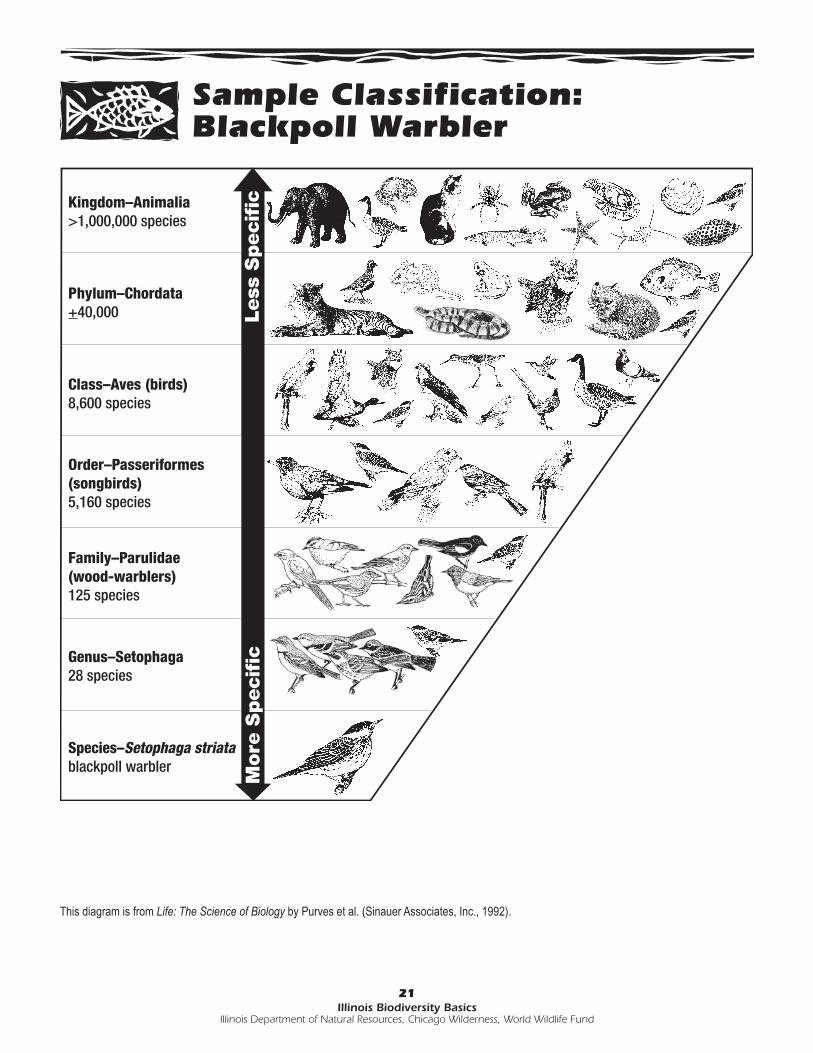
Sample Classification:Blackpoll Warbler
Kingdom–Animalia>1,000,000 species
Phylum–Chordata+40,000
Class–Aves (birds)8,600 species
Order–Passeriformes(songbirds)5,160 species
Family–Parulidae(wood-warblers)125 species
Genus–Setophaga28 species
Species–Setophaga striatablackpoll warbler
This diagram is from Life: The Science of Biology by Purves et al. (Sinauer Associates, Inc., 1992).

22Illinois Biodiversity Basics
Illinois Department of Natural Resources, Chicago Wilderness, World Wildlife Fund
3. Use the “Arthropod I.D. Chart” to classifyscorpions, spiders, centipedes and other arthropods.Explain to your students that they will be using theidentification chart to identify each of the organismson the “Arthropod Pictures” page. Remind them thatall of the organisms are in the Kingdom Animaliaand the Phylum Arthropoda. Their job is to find outwhich class and order each organism belongs to.
Go over one example with the whole class to familiar-ize your students with the key. For example, hold upa picture of organism A, then ask the students to readthe descriptions for each of the two subphyla on theI.D. chart and decide which subphylum organism Abelongs to (Mandibulata).
Next have the students read the descriptions of eachof the classes beneath Mandibulata and decidewhich class it belongs to (Insecta). Continue toorder (Coleoptera). Once your students figure out ananimal’s place on the chart, have them write the letterthat corresponds to it under the order it belongs to.
Now have your students work individually or in pairsto classify each of the organisms on the “ArthropodPictures” page. Remind the students that they need tostart at the top of the chart each time. If they’d like,they can cut out the organisms and glue the picturesto the proper places on the bottom of the chart.
Answers: A = Coleoptera B = Cirripedia C = Scolopendromorpha D = Odonata E = Amphipoda F = Acari G = Decapoda H = Xiphosura I = Araneae J = Scorpionida
BEFORE YOU BEGIN! PART IIYour students will be working in groups of three to five.For the math problem, each group will need a ruler and astack of 100 sheets of paper. Calculators are optional.
You’ll also need to make a set of number cards for eachgroup using a thick marker. To make each set of cards,you’ll need six small pieces of paper (about 4 inches x 6inches). Write the following numbers on separate cards:4,000; 9,000; 19,000; 72,000; 270,000; 950,000. Makeanother set of cards with the following numbers: 60; 400;200; 20,000; 2,500; 17,000. (Make the numbers largeenough so they can be seen from a distance.) You maywant to make each set of cards a different color. (Thefirst set relates to species worldwide, while the secondset is the number of species found in Illinois.)
Next make six signs using poster-sized or butcher paper.Write one of the following words on each sheet of paper:insects; plants; mammals; birds; fungi; and fishes. Hangthe signs on the walls in your classroom. Have smallpieces of tape or a glue stick handy for attaching thenumber cards to each large piece of paper.
WHAT TO DO! PART II 1. Discuss how many organisms there are on earth.
Ask your students to estimate how many differentkinds of organisms (species) they think there are inthe biosphere, both worldwide and statewide. You mayfirst need to explain that a species is an interbreedingpopulation of organisms that can produce fertile,healthy offspring.
Discourage students from simply guessing a totalnumber of species. Instead encourage them to reflecton prior knowledge and observations. Allow studentsto discuss their reasoning. Have each student makean estimate and explain how he or she arrived at thatnumber. If estimates are low, ask students if theyconsidered organisms of all sizes, including micro-scopic organisms.
Activity 1-2
Sizing Up Species (continued)
Finally, reveal to the students that so far scientistshave identified approximately 1.7 million differentorganisms in the biosphere and about 54,000 speciesthroughout the state of Illinois. But they predict thatthere may be an additional two to 100 millionspecies that haven’t been identified yet worldwide.
Help students gain an appreciation for how many 1.7million is. Group the students into small teams (threeto five students per team). Provide them with a rulerand a stack of 100 sheets of paper. Ask them to worktogether to solve this problem: If you were to writethe name of every known living species (1.7 million)on a different sheet of paper and then stack up all thesheets, how tall would the stack be?
A number of different approaches may be used tosolve the problem. One possible solution is to measurethe height, in inches, of 100 pages, and use thismeasurement to calculate the height of 1,700,000pages. Answers will vary depending on the thicknessof the paper. See the “Number Crunching” box foran example.
Compare your answer to a football field, whichmeasures 300 feet long; the Statue of Liberty, whichmeasures 302 feet high; and the Willis Tower inChicago that is 1,730 feet high to the top of itsantenna.
Now that students have a better feel for 1.7 million,challenge them to determine how tall the stack ofpaper would be if they had a sheet of paper for eachspecies that scientists predict exists but hasn’t yet beendiscovered—1.6 to 100 million. Have the students usethe same procedure to arrive at a range representing1.6 to 100 million. Using the same type of paper, wecalculated a height of 333 feet to 20,833 feet (that’smore than one to almost 70 football fields tall, ormore than one to 69 Statues of Liberty tall or about0.19 to 12 times the height of the Willis Tower).
In order to help students grasp the concept of 54,000
species in Illinois, repeat the above activity, butsubstitute 54,000 for 1.7 million (11.25 feet). Inaddition, have the students calculate what percentage54,000 is of 1.7 million (3.18 percent).
2. Decide how many species are in each group oforganisms.Hand out a set of number cards (representing theworldwide numbers, see “Before You Begin”) to eachteam, and explain that each card represents the numberof species worldwide that scientists have identifiedin a particular group of organisms. Hold up a numbercard (for example, 19,000) and explain that 19,000refers to the number of bird, plant, mammal, insect,fish or fungi species that scientists have identified.(Remind your students that this number is not thenumber of individuals but the number of species—
23Illinois Biodiversity Basics
Illinois Department of Natural Resources, Chicago Wilderness, World Wildlife Fund
Activity 1-2
Sizing Up Species (continued)
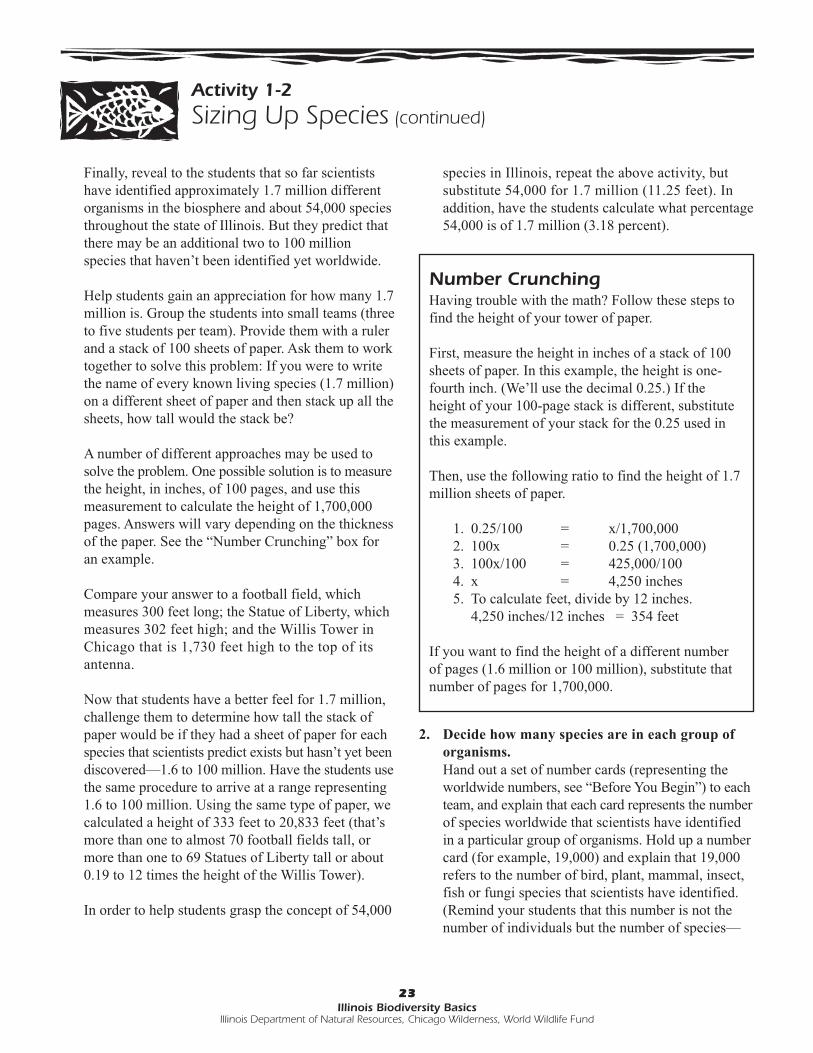
Number CrunchingHaving trouble with the math? Follow these steps tofind the height of your tower of paper.
First, measure the height in inches of a stack of 100sheets of paper. In this example, the height is one-fourth inch. (We’ll use the decimal 0.25.) If theheight of your 100-page stack is different, substitutethe measurement of your stack for the 0.25 used inthis example.
Then, use the following ratio to find the height of 1.7million sheets of paper.
1. 0.25/100 = x/1,700,000 2. 100x = 0.25 (1,700,000) 3. 100x/100 = 425,000/100 4. x = 4,250 inches 5. To calculate feet, divide by 12 inches. 4,250 inches/12 inches = 354 feet
If you want to find the height of a different numberof pages (1.6 million or 100 million), substitute thatnumber of pages for 1,700,000.
24Illinois Biodiversity Basics
Illinois Department of Natural Resources, Chicago Wilderness, World Wildlife Fund
there may be millions or billions of individuals.)Now explain that each team has to work together todecide which group of organisms listed on the signsposted around the room this number refers to. Oncetheir decisions have been made, the teams shouldtape their number cards on or below the appropriatesigns on the wall. Teams should record their choicesso they will remember them. Leave the cards on thesigns. Repeat the process for the set of Illinois cards.
3. Discuss the students’ decision-making process.Ask your students to share the methods they used formaking decisions. Did they guess or reason? Manyteams may start with what they believe are the groupswith the highest and lowest number of species. Somemay start with the number they are most certain about
and then use a process of elimination. Other teamsmay base their guesses on experience and observation.
4. Reveal the actual numbers.Go to each sign and tell your students the correctanswers. Then have your students discuss theirreactions. Did any of the answers surprise them?
WORLDWIDE: STATEWIDE:Insects...............950,000 Insects...............17,000Plants ................270,000 Plants ................2,500Fungi ................72,000 Fungi ................20,000Fishes ...............19,000 Fishes ...............200Birds .................9,000 Birds .................400Mammals..........4,000 Mammals..........60
Activity 1-2
Sizing Up Species (continued)
BEFORE YOU BEGIN! PART III Each student or group will need four sheets of graphpaper, rulers and colored pencils.
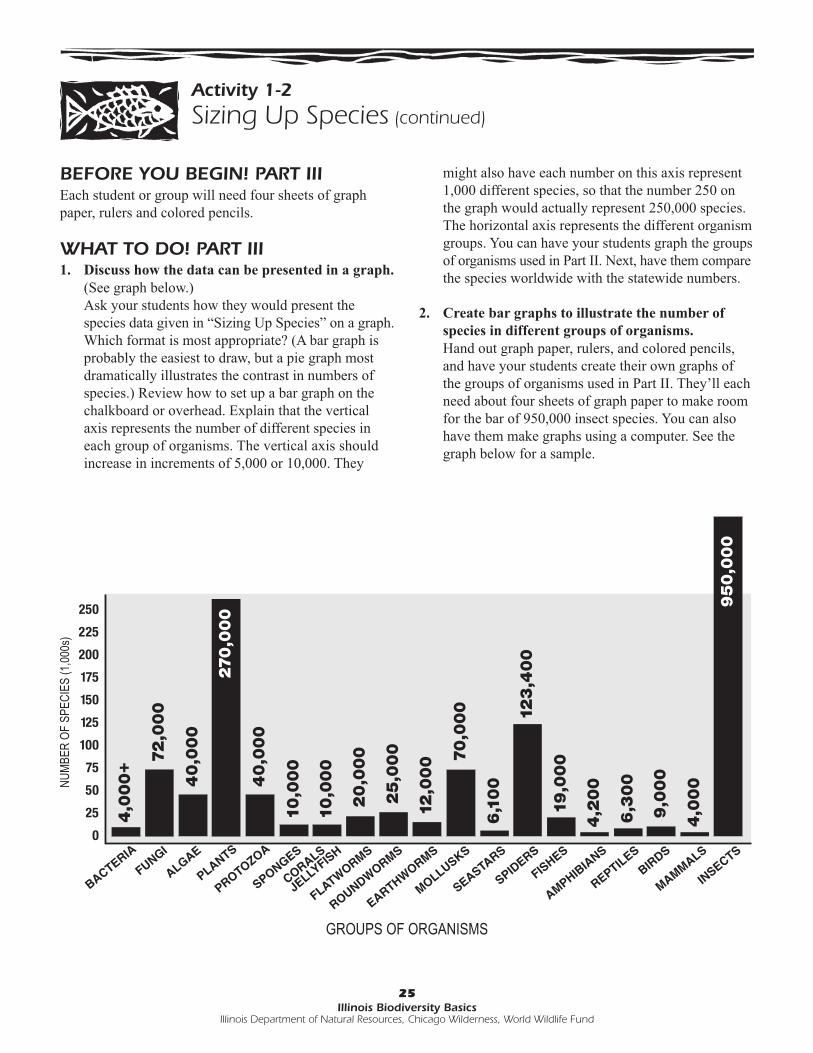
WHAT TO DO! PART III 1. Discuss how the data can be presented in a graph.
(See graph below.)Ask your students how they would present thespecies data given in “Sizing Up Species” on a graph.Which format is most appropriate? (A bar graph isprobably the easiest to draw, but a pie graph mostdramatically illustrates the contrast in numbers ofspecies.) Review how to set up a bar graph on thechalkboard or overhead. Explain that the verticalaxis represents the number of different species ineach group of organisms. The vertical axis shouldincrease in increments of 5,000 or 10,000. They
might also have each number on this axis represent1,000 different species, so that the number 250 onthe graph would actually represent 250,000 species.The horizontal axis represents the different organismgroups. You can have your students graph the groupsof organisms used in Part II. Next, have them comparethe species worldwide with the statewide numbers.
2. Create bar graphs to illustrate the number ofspecies in different groups of organisms.Hand out graph paper, rulers, and colored pencils,and have your students create their own graphs ofthe groups of organisms used in Part II. They’ll eachneed about four sheets of graph paper to make roomfor the bar of 950,000 insect species. You can alsohave them make graphs using a computer. See thegraph below for a sample.
25Illinois Biodiversity Basics
Illinois Department of Natural Resources, Chicago Wilderness, World Wildlife Fund
Activity 1-2
Sizing Up Species (continued)
NUMB
ER O
F SP
ECIE
S (1
,000s
)
GROUPS OF ORGANISMS

26Illinois Biodiversity Basics
Illinois Department of Natural Resources, Chicago Wilderness, World Wildlife Fund
WRAPPING IT UPAssessment1. Use both the classification activity and the graphing
activity as bases for assessment. Have the studentswrite an explanation of how the “Arthropod I.D.Chart” works. On the graph, have the students writethe educated guesses the class discussed and howthe data on the graph either do or do not supporteach guess.
2. Select 10 wild species that live in Illinois. Usespecies from a variety of taxonomic categories(mammals, birds, reptiles, amphibians, fishes, in-sects, crustaceans, mollusks, spiders, plants, etc.).Working in groups or as individuals, have the stu-dents research the organisms and find their classifi-cation information. Have them develop their ownidentification chart for the organisms.
3. Have students make a collage that includes thedifferent classifications of species or have studentschoose a classification, such as mammals, and makea collage of just that classification.
4. Write a short magazine article that discusses theamazing diversity of life on earth. Include illustrationsand captions.
Portfolio1. Graphs can be part of the portfolio. The collage
could also be added to the portfolio.
Extensions1. Survey the species diversity of your school grounds
or a nearby park or reserve. Your students don’t needto identify the species by name; they just need to beable to tell that one species is different from another.Afterward, find out if the ratios of species in differentorganism groups are similar to the ratios illustratedon the graphs your students made.
2. Have students research a class (or order) of organismswithin the Phylum Chordata. Tell them to find outwhat characteristics the animals within the classshare, examples of species within the class, and the
approximate number of species that have been iden-tified to date. Have each student write a paragraph tosummarize that information. Then pool the data forthe group and have each student create a bar graph(on graph paper or using a computer program) thatillustrates the relative numbers of species in eachgroup. (Note: Separate the classes and orders whencreating the bar graphs.)
Here are some suggested classes: Osteichthyes (bonyfishes); Amphibia; Reptilia; Aves (birds); Mammalia.Here are some suggested orders: within the ClassReptilia, Testudines (turtles), Squamata (snakes,lizards); within the Class Mammalia, Soricomorpha(moles, shrews), Rodentia (rats, mice), Carnivora(cats, dogs, weasels, raccoons), Artiodactyla (even-toed ungulates such as deer, camels, hippos).
ResourcesIllinois Department of Natural Resources. 1999.
Biodiversity of Illinois, volume I: aquatic habitats.Illinois Department of Natural Resources,Springfield, Illinois. CD-ROM.
Illinois Department of Natural Resources. 2000.Biodiversity of Illinois, volume II: woodlandhabitats. Illinois Department of Natural Resources,Springfield, Illinois. CD-ROM.
Illinois Department of Natural Resources. 2001.Biodiversity of Illinois, volume III: prairie and edgehabitats. Illinois Department of Natural Resources,Springfield, Illinois. CD-ROM.
May, R. M. 1992. How many species inhabit the earth?Scientific American (267): 42-48.
Wilson, E. O. 1987. The little things that run the world.Conservation Biology 1(4): 344-346.
Wilson, E. O. 1988. Biodiversity. National AcademyPress, Washington D.C., 538 pp.
World Wildlife Fund. 1994. WOW!—A biodiversityprimer. Quad/Graphics, Pewaukee, Wisconsin. 67 pp.
Activity 1-2
Sizing Up Species (continued)

Arthropod PicturesEach of the following creatures represents a general group of arthropods. First identifyall 10, then write the letter of each one in the correct place on the Arthropod I.D. Chart.
27Illinois Biodiversity Basics
Illinois Department of Natural Resources, Chicago Wilderness, World Wildlife Fund
Student PageActivity 1-2
Sizing Up Species (continued)
28Illinois Biodiversity Basics
Illinois Department of Natural Resources, Chicago Wilderness, World Wildlife Fund
Student PageActivity 1-2
Sizing Up Species (continued)
Arthropod I.D. Chart
Kin
gdom
Ani
mal
iaMa
ny-ce
lled o
rgan
isms w
ith sp
ecial
ized t
issue
s, mo
st wi
th or
gans
or or
gan s
ystem
s.Un
like p
lants,
they
cann
ot ma
ke th
eir ow
n foo
d. An
imal
cells
do no
t hav
e cell
wall
s.
Phyl
um A
rthr
opod
aAn
imals
with
a se
gmen
ted bo
dy, s
egme
nted l
egs a
nd ot
her a
ppen
dage
s,an
exter
nal s
kelet
on (e
xosk
eleton
) and
soft i
ntern
al or
gans
.
Sub
phyl
um C
helic
erat
a
S
ubph
ylum
Man
dibu
lata
No a
ntenn
ae. M
outhp
arts
cons
ist of
fang
s or p
incer
s.
O
ne or
two p
airs o
f ante
nnae
. Mou
thpar
ts co
nsist
of
Tw
o main
body
segm
ents.
man
dibles
adap
ted to
chew
ing or
suck
ing.
C
lass
Cla
ss
C
lass
Cla
ss
C
lass
M
eros
tom
ata
A
rach
nida
Crus
tace
a
Ch
ilopo
da
Inse
cta
Bod
y with
a br
oad o
val s
hell a
nd
E
ight le
gs. L
ive m
ostly
Tw
o pair
s of a
ntenn
ae an
d at
Lo
ng an
d wor
m-lik
e, wi
th on
e
O
ne pa
ir of a
ntenn
ae.
long s
lende
r tail.
Legs
not
on la
nd.
leas
t five
pairs
of le
g-lik
e
pa
ir of le
gs pe
r bod
y seg
ment.
S
ix leg
s and
thre
e bod
y par
ts.
visib
le fro
m ab
ove.
ap
pend
ages
.
U
suall
y hav
e wing
s.
Ord
er
Orde
r
O
rder
Ord
er
Orde
r
O
rder
Or
der
Ord
er
O
rder
Ord
er X
ipho
sura
S
corp
ioni
da
Acar
i
Ara
neae
Ci
rrip
edia
Dec
apod
a
Am
phip
oda
S
colo
pen-
Odo
nata
Col
eopt
era
Larg
e com
pared
Fron
t claw
s.
Tiny
head
.
Thin
wais
t.
Most
adult
s live
First
pair o
f legs
Sev
en pa
irs of
dro
mor
pha
L
arge c
ompo
und
H
ard, le
athery
to ot
her
H
ave a
tail w
ith
R
ound
ed bo
dy
S
tructu
res fo
r
fir
mly a
ttach
ed
usua
lly ha
s
le
g-like
2
1 or 2
3
eyes
. Fou
r clea
r
front
wing
s cov
er
arth
ropod
s.
a po
isono
us
w
ith no
spin
ning s
ilk
to a
n obje
ct
large
claw
s.
app
enda
ges.
pa
irs of
legs
.
or pa
tterne
d
memb
ranou
s L
ive in
salt w
ater.
st
inger.
waist
.
lo
cated
on
and u
se fe
athery
Mos
t live
in
wing
s. Lo
ng
(soft
er) hi
nd
The o
nly or
der
abd
omen
.
leg
s to f
ilter
s
alt w
ater.
abdo
men.
wi
ngs.
Chew
ing
in i
ts cla
ss.
fo
od fro
m wa
ter.
m
outhp
arts.
A
NSW
ER:
A
NSW
ER:
A
NSW
ER:
AN
SWER
:
ANS
WER
:
ANS
WER
:
ANS
WER
:
ANS
WER
:
ANS
WER
:
ANSW
ER:

EubacteriaThe eubacteria group contains most of the familiar typesof bacteria*. These organisms are single-celled and lack anucleus and organelles. Some of them obtain nutrients byabsorption of materials from living or dead organisms;some make their own food; and some decompose deadorganisms for food.
ArchaebacteriaArchaebacteria are associated with extreme habitats, suchas hot springs and thermal vents on the ocean floor. Likethe eubacteria, they do not have a nucleus or organelles,but genetically they are structured like the eukaryotes,those organisms that do have a nucleus. This very ancientgroup may be the ancestors to multicellular organisms.
Protista (or Protocista)The kingdom Protista consists of single-celled organisms.Protists have a nucleus as well as other cell structuresthat perform specific jobs. Protists include certain types ofalgae, slime molds, amoebas and diatoms.
FungiMost fungi are made of many cells. Mushrooms, molds,yeasts and mildews are examples of fungi. They are notable to make their own food. Instead, they get their foodenergy by digesting the organisms on which they grow(usually plants).
PlantaeAs you might guess, this is the kingdom of plants. Mostplants produce their own food energy through photo-synthesis—a chemical reaction involving sunlight, carbondioxide and water in the presence of chlorophyll. Floweringplants, mosses, ferns and certain types of algae aremembers of this kingdom.
AnimaliaMost animals are multicellular organisms that have special-ized tissues, organs and organ systems. Unlike plants,animals cannot make their own food, and their cells don’thave cell walls. Fishes, amphibians, reptiles, birds, mammalsand insects and other invertebrates are all part of theKingdom Animalia.
*The number of kingdoms is often under debate, depending on howscientists interpret current research.
29Illinois Biodiversity Basics
Illinois Department of Natural Resources, Chicago Wilderness, World Wildlife Fund
KINGDOMS