active transport strategy - cairns regional council
TRANSCRIPT

Active Transport Strategy

Table of Contents
1. Executive Summary 81.1 About the Strategy 9
1.2 How we developed the Strategy 9
1.3 What the community said 10
1.4 The opportunities 10
1.5 Vision 11
2. Strategy Context and Background 122.1 Purpose 12
2.2 Active transport in Cairns 12
2.3 Importance of cycling and walking in Cairns 12
2.4 Active Transport Expenditure 13
2.5 Methodology 14
2.6 Previous Strategic Outcomes 14
2.7 Key Policy Drivers 15
2.8 Benefits of Active Transport 16
3. Situational Analysis 183.1 Cairns Travel Patterns 18
3.2 Cairns Cycling Participation 19
3.3 Existing Active Transport Network 19
3.4 Existing Active Transport Network Usage 20
3.5 Opportunities 22
3.6 Constraints 24
3.7 Community Consultation 25
3.8 Target audience 28
4. Strategy 294.1 Vision 29
4.2 Strategic Actions 29
4.3 Strategy 1 – Action Plan 30
4.4 Signature Project 1 – Safe Routes to School 30
4.5 Action 1 – Deliver a prioritised program of works to achieve a safe, connected and attractive cycle network: 31
4.6 Action 2 – Deliver a prioritised program of works to achieve a safe, connected and attractive pedestrian network: 31
4.7 Action 3 – Review and maintain asset management 31
4.8 Bike parking in CBD 33
4.9 Bike parking principles 33
4.10 Strategy 2 – Action Plan 34
4.11 Signature Project 2 – Deliver active transport wayfinding for the network 34
4.12 Action 4 – Deliver mid-journey and end-of-trip facilities 34
4.13 Action 5 – Investigate and deliver urban cooling measures 34
4.14 Cycling for Tourism and Recreation 356

4.15 Strategy 3 – Action Plan 36
4.16 Signature Project 3 – Active School Travel Program 36
4.17 Action 6 – Promote and encourage active transport 36
4.18 Action 7 – Educate the community on walking and cycling to improve safety and increase user confidence. 37
4.19 Strategy 4 – Action Plan 38
4.20 Signature Project 4 – Incorporate best practice principles and revised active transport network plans into planning instruments 39
4.21 Action 8 – Integrate active transport into all planning and design 39
4.22 Action 9 – Incorporate best practice principles for walking and cycling future review of planning scheme 39
4.23 Action 10 – Monitor and review Active Transport Strategy 39
5. Network Implementation Plan 405.1 Elements of the Network Plan 40
5.2 Cycle Network 40
5.3 Cycle Network Hierarchy 41
5.4 Cycle Network Hierarchy and Requirements 42
5.5 Cycle Design Standards 44
5.6 Pedestrian Network 60
5.7 Pedestrian Network Design Standards 60
5.8 Pedestrian Network Hierarchy 61
5.9 Pedestrian Network Hierarchy and Requirements 62
5.10 Pedestrian Facility Types (hierarchy examples) 65
5.11 Prioritisation process 65
5.12 Network Implementation Plan 66
5.13 Cost estimates 67
6. Glossary 68
7. References 70Economic Benefits Infographic – References 72
8. Appendix A – Existing Network Maps 73
9. Appendix B – Community and Stakeholder Engagement Results 80
10. Appendix C – Proposed Network Maps (Cycle and Pedestrian) 81
11. Appendix D – Proposed Pedestrian Network Plans (by Division) 89
12. Appendix E – Cost Assumptions 99
13. Appendix F – Network Implementation Plan 104
7
ACTIVE TRANSPORT STRATEGY

1. Executive Summary
Since 2010, Council has implemented many elements of the active transport network plan including the Cairns to Aeroglen Bikeway, Cairns Northern Cycleway, Cairns Southern Cycleway, Freshwater Cycleway, Brinsmead Connection Path and the Mann Street Cycleway (some in partnership with the State Government).
Cairns is well known for its innovation in the delivery of cycling and walking with programs such as the Trinity Beach and Our Lady Help of Christian bike/walk bus supported by the Department of Transport and Main Rods’ travel smart program. Further, Cairns has adopted best practice for construction of infrastructure, including separated cycle tracks. These have all resulted in increases in people walking and cycling for many trip purposes in the Cairns local government area (LGA).
The Department of Transport and Main Roads undertook a Cairns Household Travel Survey in 2014. The results of the survey indicated that 11% of all travel trips are undertaken by active transport, consisting of approx. 2% by cycling and 9% by walking. This is the highest performing region in Queensland (Queensland Government Department of Transport and Main Roads, 2015).
The Cairns active transport network is extensive and already delivers a connected network, with major routes connecting from the south and west to the Cairns CBD. Overall, there are 664km of footpaths, shared paths and on-road bicycle lanes in Cairns. These facilities link major and local destinations, with the footpath networks forming 70% of the entire network.
In the latest National Cycling Participation Survey for Cairns, conducted by the Australian Bicycle Council stated 57% of riders felt that conditions for riding had improved in the last 12 months and 60% of cyclists felt comfortable or very comfortable when riding (Australian Bicycle Council, 2017).
8
1.1 About the StrategyThe Active Transport Strategy (the Strategy) has been developed to provide a clear, co- ordinated and strategic approach to guide Cairns Regional Council’s (CRC or Council) planning, development, management and promotion of future region-wide walking and cycling networks. These ‘active transport’ routes are increasing in popularity.
The Strategy identifies proposed future networks, and strategic missing links, to the existing active transport network. Since the development of the previous Cycling and Walking Strategy in 2010, cycling participation across the Cairns LGA has continued to outperform both the Queensland and regional Queensland averages. To ensure continual improvement, Council has developed a new strategy to guide Council’s decisions on walking and cycling development and infrastructure for the future.
The Strategy is informed by community needs, regional growth and new developments, combined with previously identified projects and extensive community consultation. It provides recommendations for achieving strategic directions as well as a framework for implementation.
The Strategy aligns with Council’s Local Government Infrastructure Plan (LGIP) for the trunk aspects of the networks. The LGIP integrates infrastructure planning with the land use planning identified in the planning scheme and provides transparency regarding Council’s intentions for the provision of trunk infrastructure for the Region. The LGIP enables Council to estimate the cost of infrastructure provision to assist its long term financial planning and ensure that trunk infrastructure is planned and provided in an efficient and orderly manner. The LGIP is also used to provide a basis for the imposition of conditions about infrastructure on development approvals.
1.2 How we developed the StrategyThe development of the Strategy included the following tasks:
� Review the previous Cycling and Walking Strategy and Network Plan outcomes.
� Review the LGIP in relation to regional planning assumptions and plans for trunk infrastructure for the pedestrian and cycle network.
� Conduct a literature review to understand trends in walking and cycling in Cairns and across Australia.
� Undertake comprehensive community engagement to establish issues and priorities in the community for consideration in the Strategy.
� Develop a vision, opportunities, barriers as well as strategies to achieve the vision.
� Prepare a Cairns Cycling and Walking Strategy with three key components being;
» an Active Transport Strategy, including separate pedestrian and cycling network plans;
» Council’s first Recreational Walking Trails Strategy; and
» a new Cairns Mountain Bike Strategy.
� Set out well-defined standards and priorities for active transport networks.
� Develop an implementation plan, including cost estimates, design standards and prioritisation for infrastructure investment.
9
ACTIVE TRANSPORT STRATEGY
1.3 What the community saidAn online community engagement survey was undertaken, allowing the community to place comments and feedback on cycling, walking and trail issues and opportunities on a map of the Cairns LGA utilising the Social Pinpoint platform. During the month long survey, the website received approximately 1,570 visits and 728 comments. These comments were analysed and utilised to develop the Strategy.
The majority of comments were concentrated around the Cairns CBD, followed by Freshwater and Stratford. This is where the majority of existing infrastructure is and therefore it makes sense that many comments were around these areas.
Other comments were associated with lack of connectivity of the Northern Beaches and across the Barron River, as well as connectivity between Edmonton and Gordonvale (across the Bruce Highway). Safety concerns at roundabouts, intersections and rail crossings as well as for school children were other major themes raised by the community.
A detailed summary of the consultation is contained in Appendix B.
1.4 The opportunitiesArising from the research and engagement undertaken as part of this study, a number of opportunities for encouraging more walking and cycling in the region have been identified:
� Cycling and walking has experienced significant increase in Cairns and there is an opportunity to support further increases in through the provision of network improvements.
� There is opportunity to capitalise on the extensive existing cycling and walking infrastructure in the region to encourage more people to use active transport facilities.
� Many students live within walking and cycling distance of schools, so there is considerable potential to boost the number of trips to school by cycling and walking.
� Half of all trips are under 5km - cycling or walking these distances (or less) can be achievable for much of the population and is therefore a key opportunity for active transport.
� Because women are already cycling more than in other regions, there is an opportunity to capitalise on existing (relatively) high cycling by females in Cairns by continuing to provide high quality separated walking and cycling infrastructure.
� Recreational cycling levels are high in Cairns. There is an opportunity to convert some of their other transport related trips to cycling as well (for example: cycling to work).
� Topography and climate are favourable to walking and cycling in the region.
10

1.5 VisionTo realise these opportunities and deliver Council’s Corporate Plan to “promote an environment which values and enhances our unique lifestyle, iconic natural assets, supports a sense of community and furthers our economic prosperity” a vision has been developed for cycling and walking within the region:
To develop a more active and connected community by supporting more people to walk and cycle, more often.
Four strategy areas have been identified, covering both infrastructure and non-infrastructure actions, that will help achieve the vision for walking and cycling in Cairns:
STRATEGY 2:Provision of supporting infrastructure
STRATEGY 3:Encouragement and promotion
STRATEGY 4:Planning walk and cycle friendly communities
STRATEGY 1:Development of a safe and connected network
11
ACTIVE TRANSPORT STRATEGY
2. Strategy Context and Background
2.1 PurposeThe new Cairns Cycling and Walking Strategy has been developed to provide a clear, co-ordinated and strategic approach to guide Council on planning, development, management and promotion of network of cycle and walking infrastructure for the future. The former strategy and network plan (Cycling and Walking Strategy 2010) will be superseded by this Strategy due to the expanding active transport network, the significant changes that have occurred in terms of new development and infrastructure, as well as changing demands for new infrastructure by the community and government.
2.2 Active transport in CairnsCouncil is responsible for the provision of walking and cycling infrastructure on local government owned roads, parks/open space areas. Additionally Council shares the responsibility with the Department of Transport and Main Roads (TMR), to provide the off-road component of state controlled roads with a focus on, but not exclusive to, delivering the Far North Queensland Principal Cycle Network Plan (FNQPCNP). Council’s role in regulating development via the Planning Scheme ensures growth and development in the Region integrates active transport infrastructure and supports this Strategy’s vison.
Since the development of the previous Cycling and Walking Strategy, Council has developed a (growing) network of walking and cycling paths which are increasing in popularity as more people choose active transport. From off-road footpaths and shared paths to separated cycleways and on-road bicycle lanes, there are now a range of options to choose from to walk or bike ride in Cairns.
2.3 Importance of cycling and walking in CairnsActive transport can provide many benefits to an individual, the Cairns community as a whole, and economic prosperity. Quality active transport provides safe, convenient linkages between community facilities and open spaces. They are associated with a range of benefits from improved health and wellbeing, increased physical activity, and tourism and economic opportunities.
The Cairns 2050 Shared Vision sets aspirations for the future of Cairns – Quality of Life and Liveability. Encapsulated within this aspiration are eight core pillars, a number of which can be benefited by the Cairns Active Transport Strategy.
This Strategy must allow for continued delivery of previously identified recommendations, as well as define the future of active transport across the LGA. It must be based on community input and respond to changing demands so as to achieve the following:
a) Improve active transport connectivity for recreation and transport purposes.
b) Prioritise and cost-out future active transport works.
c) Apply best-practice infrastructure standards and strategies from elsewhere, and adapt to local requirements.
d) Engage, and incorporate feedback, with stakeholders, local community, user groups and elected representatives.
12
2.4 Active Transport Expenditure
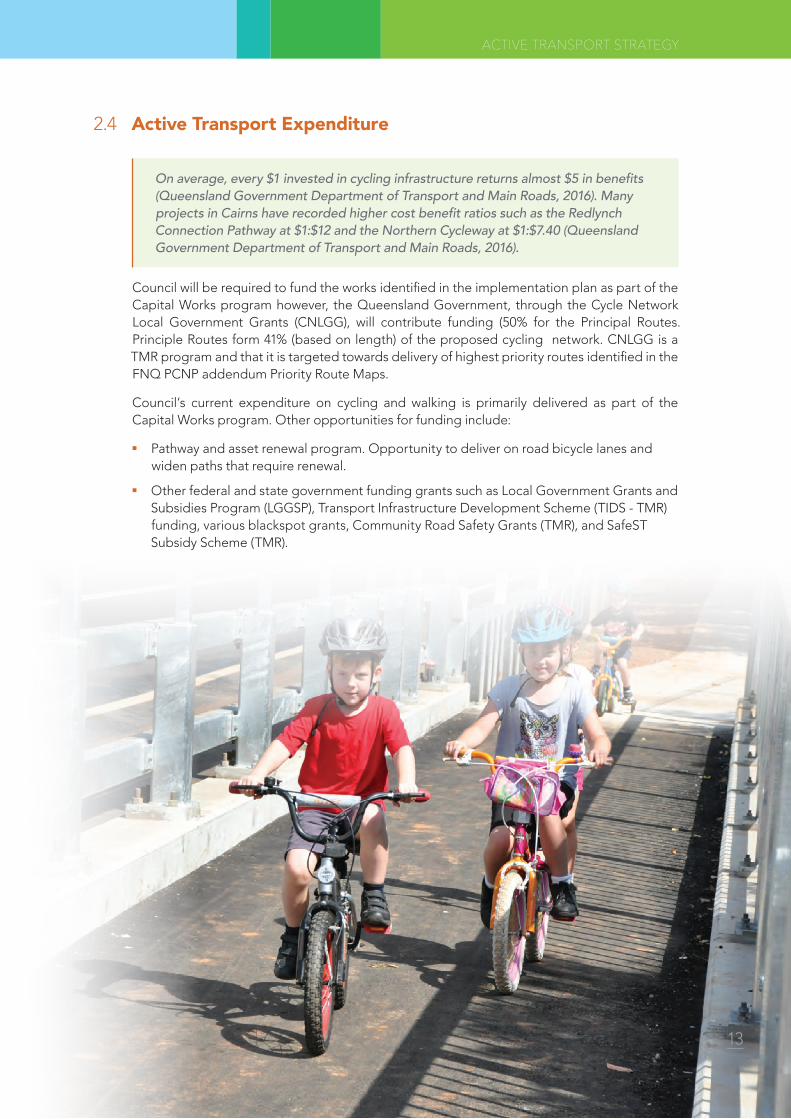
On average, every $1 invested in cycling infrastructure returns almost $5 in benefits (Queensland Government Department of Transport and Main Roads, 2016). Many projects in Cairns have recorded higher cost benefit ratios such as the Redlynch Connection Pathway at $1:$12 and the Northern Cycleway at $1:$7.40 (Queensland Government Department of Transport and Main Roads, 2016).
Council will be required to fund the works identified in the implementation plan as part of the Capital Works program however, the Queensland Government, through the Cycle Network Local Government Grants (CNLGG), will contribute funding (50% for the Principal Routes. Principle Routes form 41% (based on length) of the proposed cycling network. CNLGG is a TMR program and that it is targeted towards delivery of highest priority routes identified in the FNQ PCNP addendum Priority Route Maps.
Council’s current expenditure on cycling and walking is primarily delivered as part of the Capital Works program. Other opportunities for funding include:
� Pathway and asset renewal program. Opportunity to deliver on road bicycle lanes and widen paths that require renewal.
� Other federal and state government funding grants such as Local Government Grants and Subsidies Program (LGGSP), Transport Infrastructure Development Scheme (TIDS - TMR) funding, various blackspot grants, Community Road Safety Grants (TMR), and SafeST Subsidy Scheme (TMR).
13
ACTIVE TRANSPORT STRATEGY

2.5 MethodologyThe methodology used by Zwart Transport Planning and AECOM to develop the Strategy and network plan is:
2.6 Previous Strategic OutcomesCouncil has achieved the following outcomes in active transport since the commencement of the 2010 Cycling and Walking Strategy, including:
� Increased coverage of footpaths and cycleways:
» Constructed a network of high quality bikeway spines, including the Esplanade to Aeroglen / Stratford / Freshwater, the Redlynch, Spence Street bike paths and commencing the initial stages of the Northern Beaches Leisure Trail. There are now over 660km of paths across the region;
» in the latest National Cyclist Participation Survey, 57% of riders felt that conditions for riding had improved in the last 12 months and 60% of cyclists felt comfortable, or very comfortable, when riding (Australian Bicycle Council, 2017);
» delivered bicycle skill training workshops in 2018 aimed at women and children, with over 200 people attending the 23 classes held.
Ongoing Internal Consultation � Internal and external
stakeholder workshop
� Vision and objectives
� Strategies and actions
� Consider supporting elements
� Costings
� Priorities
� Capital works plan
� Responding to stakeholder and community input
DRAFT STRATEGY
STAGE 3Implamentation
Plan
STAGE 4Finalise
Network Plan and Strategy
Phase 2 Consultation � Exec team and Councillor
review of draft
� Display draft strategy and network plan
Phase 1 Consultation � One on one councillor
meetings
� Internal and external stakeholder workshop
� Community survey with issues mapping
� Relevant documents and strategies
� Define existing network
� Issues definition
� Update based on land use and infrastructure
� Review design standards
� Opportunities and constraints
STAGE 1Existing Situation Review
STAGE 2Draft
Network Plan
14

� Participated in the Healthy Active School Travel program between 2013-2014, in partnership with State Government and nine schools across the region. The program was a voluntary travel behaviour-change program aimed at primary school children to increase physical activity in children by encouraging them to use walking, cycling and public transport for their trips to/from school. As a result of the targeted activities, the participating schools have since experienced an increase of 11.2% of trips by active transport modes.
� Implemented Active Towns Pilot program (2012-2015) in association with the State Government, which combined targeted promotion and education programs with infrastructure provision to increase walking and cycling in the region (Deloitte for Department of Transport and Main Roads, 2016). Some of the key outcomes of this program for the community were;
» overall increase in the number of people who reported cycling more than in the previous year, 39% to 44%;
» 11.8km of new pathways (primarily the Southern Cycleway);
» 18% increase in use along existing CBD to Aeroglen Cycleway;
» coordinated delivery of infrastructure, policy and behaviour change projects ($3.3 million between 2012 – 2015).
2.7 Key Policy Drivers
National � Australian National Cycling Strategy 2011 – 2016
State � Queensland Cycling Strategy 2017 – 2027 (supported by 2 year Cycling Action Plan)
� Far North Queensland Principal Cycle Network Plan (FNQPCNP)
� Department of Transport and Main Roads Cycling Infrastructure Policy 2017
Local � Cairns Regional Council Corporate Plan 2017 - 2022
� Cairns Plan 2016
� Local Government Infrastructure Plan (LGIP)
� Cairns Shared Vision 2050
� Cairns Cycling and Walking Strategy 2018 - 2038
15
ACTIVE TRANSPORT STRATEGY

2.8 Benefits of Active TransportActive transport provides tangible health benefits by increasing daily physical activity levels. In addition to the health benefits associated with physical activity, active transport reduces motor vehicle travel while improving air quality, reducing noise pollution and greenhouse gas abatement and enhancing community liveability. The below infographics illustrate the benefits for Cairns:
$10Bn
BenefitsHealth
Social Environmental
64%
34%
5.9c/km
of Cairns residents18yrs + undertook no or little exercise
in the previous week.QLD average is 67.9%2
of household emissions are generated from motorised
transport.2 cycling and walking are zero-emission form of
transport
Car trips cost in CO2, air, water and
noise pollution.Cycling can reduce
this cost by replacing car trips7
Cycling 10km or 40 minutes each way to work would save 1500kg of greenhouse gas
emissions each year5
Walking or cycling to school can help achieve recommended exercise goal
of 60 minutes a day for children4
Walking or cycling to work can help achieve recommended
exercise goals of 30 minutes a day for adults and is an easy way to incorporate exercise
into your busy day4
Provides increased Travel Choicesby providing a cheap and independent mode of travel for those who might otherwise have their
travel options restricted by low rates of car ownership5
Cycling enables people to interact socially and feel more
at home in their local community. More people
cycling and walking provides additional opportunity for
social interaction on the streets and this enhances a sense of
community5
Cost to Australian businesses for sick days and poor work performance
associated with mental health.Cycling has been proven to be
an effective method for reducing depression and anxiety2
$32MThe direct cost of physical
inactivity to the Cairns health budget per year2
65.5%of Cairns residents18yrs + are overweight or obese.
QLD average is 64%3
41%Decreased risk of dying from chronic illness by commuting
on a cycle compared to driving or public transport1
1500kg
6.5% of households in Cairns don’t have
access to a car6
Refer to infographic references on page 7116

1%
Economic BenefitsFor the Individual
For everyone
For the region
The cost of buying and maintaining a bike is around 1% of the cost of buying and
maintaining a car1
Cycling for trips of less than 5km and walking for trips of less than 2km are the most
cost-effective transport options for individuals2
Cycling 10km or 40 minutes each way to work each day will save about $1,700 per year in transport costs (including all
running costs and depreciation)1
$ $1,700
On average $1 invested in cycling
infrastructure returns almost $5 in benefits3
Even higher returns have been found for
some of Cairns’ cycling projects
$12$1
$7.40$1
$5.40$1
COST BENEFIT
Brisbane: Veloway 1
Cairns: Northern Cycleway
Cairns: Redlynch Connection Path
$600,000Cycle Qld 2018
(Daintree to Cairns) injected
into the region5
$3.5 millionContribution to the state’s economy
from the 2014 UCI Mountain Bike World Cup which was held in Cairns4
$150,000Spent by Bicycle Queensland
in host towns
$40 Per person per day spent by Bicycle Queensland event
participants in those towns. 36% of the 624 participants
registered were from interstate or overseas
Walking and Cycling is good for business. More people walking and cycling can revitalise an area and bring increased economic dollars into the town5
Reduced cost of infrastructure due to space for walking and cycling being less than a car i.e. can move more people along a narrower corridor5
Cycle Events
Refer to infographic references on page 7217
ACTIVE TRANSPORT STRATEGY

3. Situational Analysis
3.1 Cairns Travel PatternsCompared to other regional areas of Queensland, Cairns performs well when it comes to walking and cycling trips. The 2014 Cairns Household Travel Survey results indicated that 11% of all trips are undertaken by active transport, consisting of approx. 2% by cycling and 9% by walking (Queensland Government Department of Transport and Main Roads, 2015).
This overall percentage for all trips is the highest performing region in Queensland with Cairns being the ninth highest LGA in Queensland for cycle trips to work.
The infographic below summaries Cairns active travel patterns:
Travel patterns
11% of all trips in Cairns are by walking (9%) and cycling (2%). (TMR, 2015)
One in five Cairns residents ride a bike in a typical week. (ABC, 2017)
3.9% of trips to work in Cairns are by foot. (ABS, 2016)
The most common purposes for cycling for transport are commuting, education and shopping. (ABC, 2017)
2.2% of trips to work in Cairns are by bike. (ABS, 2016)
62% of Cairns households have at least one working bicycle (compared to 56% of Queenslanders). (ABC, 2017)
Twice as many women ride to work in Cairns than the Queensland average. This increases to 6.5 times in central Cairns. (ABS, 2016)
7.2% of Cairns households don’t own a car. This increases to 16.6% in central Cairns. (ABS, 2016)
9% 2%
3.9%
2.2%62%
16.6%
18

3.2 Cairns Cycling ParticipationAccording to the 2017 National Cycling Participation Survey (NCPS) for Cairns, overall the LGA has higher weekly cycling participation rate of 20.2% compared to the Queensland average of 16.8%, which equates to approximately 34,200 residents riding their bike in a typical week (Australian Bicycle Council, 2017). The survey indicated there was a slight decline in the number of people riding compared to previous years, however this is pattern has been recognised nationally.
The below graph indicates cycling participation by age group in Cairns compared to regional Queensland and Queensland:
3.3 Existing Active Transport NetworkThe Cairns active transport network is extensive and already forms a connected network with major routes connecting from the south and west to the Cairns CBD. Overall, there are 664km of footpaths, shared paths and on-road bicycle lanes in Cairns linking major and local destinations, with the footpath-network contributing to 70% of the total network. The below table indicates the breakdown of the existing walking and cycling network by area and facility type.
Existing Active Travel Network (2017)
Description
Northern Suburbs (north of Barron River)
Central Suburbs (south of Barron River to Woree)
Southern Suburbs (south
of Woree) TOTAL
Footpaths – paths less than 2m
109.6km 257.6km 90.86km 458.1km
Shared Paths – paths greater than 2m
6.1km 59.8km 12.2km 78.2km
On Road Bicycle Lanes
18km 104.8km 4.5km 127.4km
TOTAL 133.7km 422.34km 107.6km 663.8km
The existing network maps, showing paths by width, are shown in Appendix A.
0%
20%
40%
60%
44%
Popu
latio
n pr
opor
tion
(%)
Sample: All persons, cycling participation in past week
53%
49%
0-9
39%
41%
38%
10-17
7% 5% 5%
18-29
17%
11%
11%
30-49
10%
5% 5%
50+
Cairns Regional Council Regional Qld Qld
19
ACTIVE TRANSPORT STRATEGY
Current Far North Queensland Regional Organisation of Councils (FNQROC) Design Manual standards indicate that 2m is the minimum width for new footpaths. The majority of paths in Cairns are between 1.2 and 2m wide, with wider provision found in the Cairns CBD. Minimum width for a new footpath in Cairns is 2.0m and a shared path is 2.5m (refer Austroads Guide to Road Design, Part 6A: Pedestrian and Cyclist Paths), and more recent principal network construction is often 3m or greater, which meets the desirable standards for shared paths in Austroads.
Cairns Regional Council has embraced International best practice by providing high quality cycle facilities such as separated pathways and cycle tracks along The Esplanade, Captain Cook Highway at Aeroglen and more recently the Redlynch, Spence Street (Southern) and Mann Street bikeways. Overall, there is approx. 20km of separated pathways and cycle tracks in Cairns.
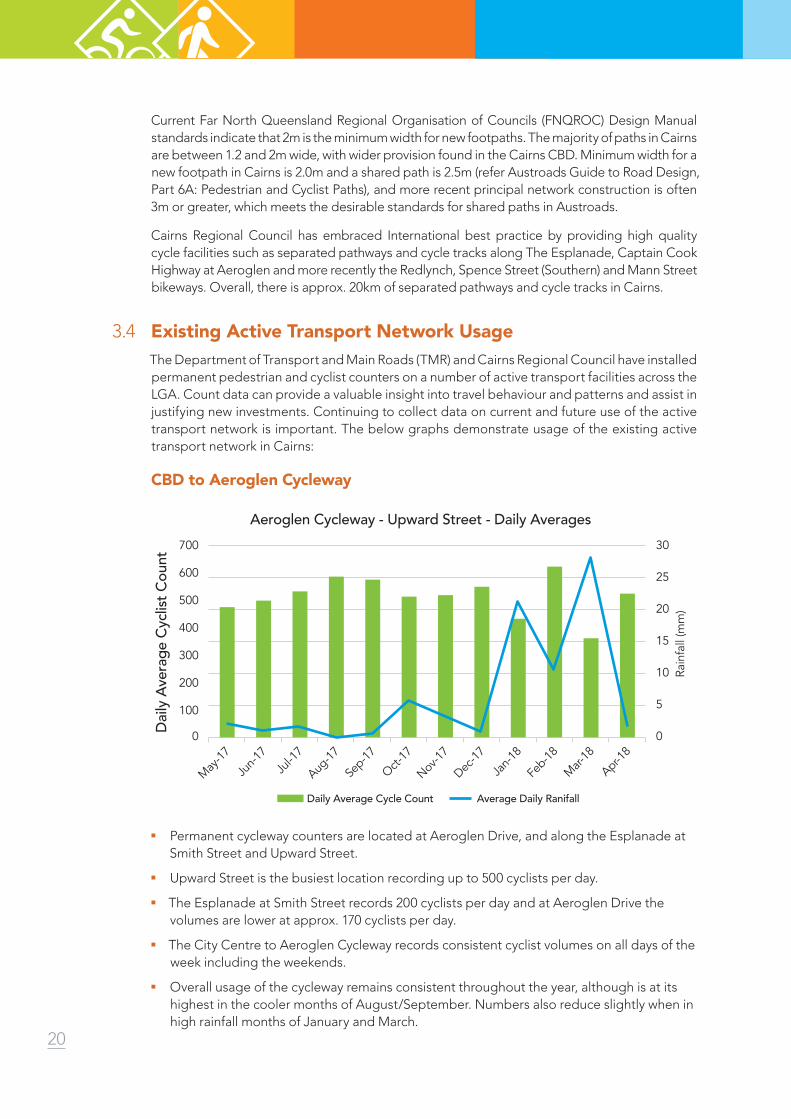
3.4 Existing Active Transport Network UsageThe Department of Transport and Main Roads (TMR) and Cairns Regional Council have installed permanent pedestrian and cyclist counters on a number of active transport facilities across the LGA. Count data can provide a valuable insight into travel behaviour and patterns and assist in justifying new investments. Continuing to collect data on current and future use of the active transport network is important. The below graphs demonstrate usage of the existing active transport network in Cairns:
CBD to Aeroglen Cycleway
� Permanent cycleway counters are located at Aeroglen Drive, and along the Esplanade at Smith Street and Upward Street.
� Upward Street is the busiest location recording up to 500 cyclists per day.
� The Esplanade at Smith Street records 200 cyclists per day and at Aeroglen Drive the volumes are lower at approx. 170 cyclists per day.
� The City Centre to Aeroglen Cycleway records consistent cyclist volumes on all days of the week including the weekends.
� Overall usage of the cycleway remains consistent throughout the year, although is at its highest in the cooler months of August/September. Numbers also reduce slightly when in high rainfall months of January and March.
May
-17
Jun-
17Ju
l-17
Aug-1
7
Sep-1
7
Oct-17
Nov-1
7
Dec-1
7
Jan-
18
Feb-1
8
Mar-
18
Apr-18
100
200
300
400
Dai
ly A
vera
ge C
yclis
t Cou
nt
Rain
fall
(mm
)
500
600
700
0
5
10
15
20
25
30
0
Daily Average Cycle Count Average Daily Ranifall
Aeroglen Cycleway - Upward Street - Daily Averages
20

Southern Cycleway
� Lower volumes of cyclists are found on the Southern Cycleway at Ogden Street, recording an average of 160 cyclists per day
� Volumes recorded are slightly less on weekends compared to week days.
� Seasonally volumes are higher during the cooler months but remain steady for the majority of the year with minor reductions in months with higher rainfall.
Brinsmead to Redlynch Valley Cycleway
� There are 3 permanent count locations on the Brinsmead to Redlynch Bikeway
� The busiest counter site records up to 320 walkers and cyclists per day, with pedestrians making up two thirds of the numbers. Numbers increase slightly on the weekend days recording up to 450 pedestrians and cyclists.
May
-17
Jun-
17Ju
l-17
Aug-1
7
Sep-1
7
Oct-17
Nov-1
7
Dec-1
7
Jan-
18
Feb-1
8
Mar-
18
Apr-18
20
40
60
80
Dai
ly A
vera
ge C
yclis
t Cou
nt
Rain
fall
(mm
)
180
160
140
120
100
200
0
5
10
15
20
25
30
0
Daily Average Cycle Count Average Daily Ranifall
Southern Cycleway - Daily Cycle Averages
Source: TMR/CRC Permanent Counter 2018
May
-17
Jun-
17Ju
l-17
Aug-1
7
Sep-1
7
Oct-17
Nov-1
7
Dec-1
7
Jan-
18
Feb-1
8
Mar-
18
Apr-18
20
40
60
80
Dai
ly A
vera
ge C
yclis
t Cou
nt
Rain
fall
(mm
)
100
120
140
0
5
10
15
20
25
30
0
Daily Average Cycle Count Average Daily Ranifall
Brinsmead to Redlynch Valley Cycleway - Daily Cycle Averages
21
ACTIVE TRANSPORT STRATEGY
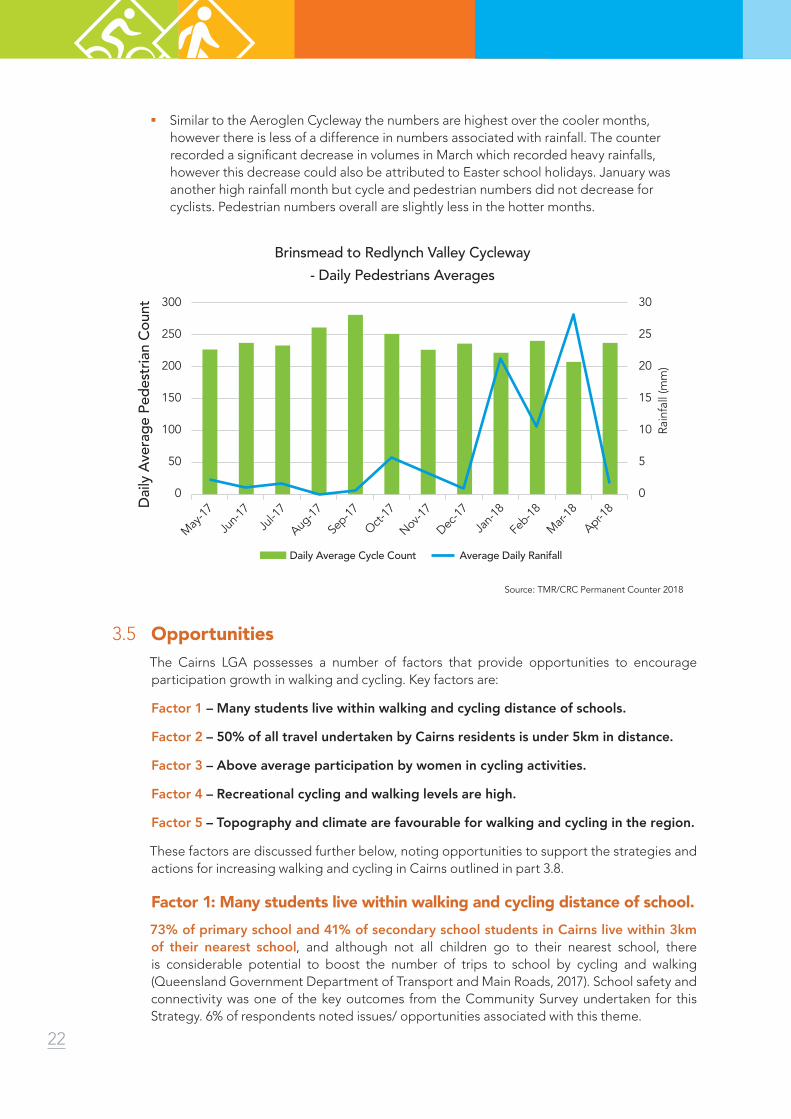
� Similar to the Aeroglen Cycleway the numbers are highest over the cooler months, however there is less of a difference in numbers associated with rainfall. The counter recorded a significant decrease in volumes in March which recorded heavy rainfalls, however this decrease could also be attributed to Easter school holidays. January was another high rainfall month but cycle and pedestrian numbers did not decrease for cyclists. Pedestrian numbers overall are slightly less in the hotter months.
3.5 OpportunitiesThe Cairns LGA possesses a number of factors that provide opportunities to encourage participation growth in walking and cycling. Key factors are:
Factor 1 – Many students live within walking and cycling distance of schools.
Factor 2 – 50% of all travel undertaken by Cairns residents is under 5km in distance.
Factor 3 – Above average participation by women in cycling activities.
Factor 4 – Recreational cycling and walking levels are high.
Factor 5 – Topography and climate are favourable for walking and cycling in the region.
These factors are discussed further below, noting opportunities to support the strategies and actions for increasing walking and cycling in Cairns outlined in part 3.8.
Factor 1: Many students live within walking and cycling distance of school.73% of primary school and 41% of secondary school students in Cairns live within 3km of their nearest school, and although not all children go to their nearest school, there is considerable potential to boost the number of trips to school by cycling and walking (Queensland Government Department of Transport and Main Roads, 2017). School safety and connectivity was one of the key outcomes from the Community Survey undertaken for this Strategy. 6% of respondents noted issues/ opportunities associated with this theme.
May
-17
Jun-
17Ju
l-17
Aug-1
7
Sep-1
7
Oct-17
Nov-1
7
Dec-1
7
Jan-
18
Feb-1
8
Mar-
18
Apr-18
50
100
Dai
ly A
vera
ge P
edes
tria
n Co
unt
Rain
fall
(mm
)
250
200
150
300
0
5
10
15
20
25
30
0
Daily Average Cycle Count Average Daily Ranifall
Brinsmead to Redlynch Valley Cycleway- Daily Pedestrians Averages
Source: TMR/CRC Permanent Counter 2018
22

Survey responses highlighted that 11% of all ‘trip purposes’ are for education, and only 14% of those trips are by active travel means (Queensland Government Department of Transport and Main Roads, 2011). Encouraging more children to cycle to school, can improve their mental and physical health, as well as contribute towards reducing traffic congestion on the road network.
The National Cycling Participation Survey 2017 for Cairns found that the highest cycling participation rate was among children aged under 17. This group, making up 83% of the population surveyed who had cycled within the past week (Australian Bicycle Council, 2017). However, these trips are for recreation purposes and are not children walking or cycling to school.
Additionally, cycling and walking are affordable modes of transport attractive to the adult student demographic. Opportunity exists to encourage students to adopt active transport methods as transport to James Cook University (JCU), Central Queensland University (CQU) and other adult education institutions such as TAFE and English language centres. Notably, the JCU Cairns campus offers casual short stay bicycle parking, secure bicycle parking and end of trip facilities to encourage trips by walking and cycling. Bicycle access, to many of the English language centres in the CBD, is already a popular travel mode choice, evidenced by the large demand for bike parking outside many of these centres.
Encouraging more students to walk or cycle to school and university is addressed in the strategies and actions section of the Strategy.
Factor 2: Short trips are suitable for walking and cyclingApproximately 62% of the Cairns population live within 10km of the Cairns CBD and 32% within 5km (approx. 50,000 people) (Australian Bureau of Statistics, 2016). Utilising active transport facilities, 5km is approximately a 20-minute cycle, 10km is a 30-40minute cycle and a 2km walk is approximately 30minutes. Cycling or walking these distances (or less) can be achievable for much of the population and thus provides a key opportunity. According to the Cairns Household Travel Survey, 50% of all travel taken in Cairns is a distance of 5km or less (Queensland Government Department of Transport and Main Road, 2015), with many of the shorter trips being for shopping/ personal reasons, or school pick-up/drop-off.
In Cairns, current travel distances by cycling average 4km, and by walking averages 1km (Queensland Government Department of Transport and Main Road, 2015). Ensuring appropriate infrastructure is provided within these catchment areas forms part of the strategies and actions of the Strategy.
Factor 3: Above average participation by women in cyclingCairns has higher cycling participation rates, for both males and females, then the Queensland average. The greatest difference can be found amongst females, with 17% of Cairns based female cyclists having cycled in the past week compared to 13% for the regional and Queensland averages (Australian Bicycle Council, 2017). The Super Tuesday bike commuter counts undertaken in the region reinforce this pattern, indicating that of all the counts undertaken 26% of riders were female, which was above the Queensland average of 22% (Bicycle Network, 2015).
Gil Penalosa, who runs Toronto-based consultancy 8-80 Cities, describes women cyclists as the “indicator species” for how bike-friendly a city is. “If there aren’t at least as many women as men, then usually it’s because cycling is not safe enough. It’s an indicator that you do not have enough good cycling infrastructure” (Slavin, 2015).
This highlights an opportunity to capitalise on existing (relatively) high female cycling participation in Cairns, by continuing to provide high quality separated walking and cycling infrastructure such as that provided along the Esplanade and Mann Street.
23
ACTIVE TRANSPORT STRATEGY
Physically separated cycling infrastructure such as off road paths and separated cycle tracks make it easier and more comfortable for people of all ages and abilities to ride as an everyday activity.
Factor 4: Recreational cycling and walking levels are highOf the residents who cycled in Cairns in the last month (at the time when respondents were surveyed), 84% cycled for recreation and 25% used a bicycle for transport. The proportion riding for transport is lower than for other areas of Queensland (Australian Bicycle Council, 2017).
An opportunity exists for those Cairns residents who are already on the bicycle, and are confident cyclists, to convert some of their other transport related trips to cycling as well.
One of five Queensland adults walk for recreation. Walking in the bush/walking trails and jogging/running form part of the top five physical activities for Queenslanders. Targeting these existing recreational walkers and cyclists in education and encouragement programs form part of the strategies and actions of the Strategy (Australian Bureau of Statistics , 2015).
Factor 5: Topography and climate favour walking and cycling The majority of the Cairns LGA is flat (with less than 3% grade) and therefore suitable for trips by bike or foot.
Cairns has much higher cycling participation rates compared to many of its southern counterparts, indicating that for many the weather is not a major barrier. Cairns cycling participation in a typical month was found to be 27% compared to the Queensland average of 24.4% (Australian Bicycle Council, 2017).
3.6 ConstraintsData from the 2017 National Cycling Participation Survey for Cairns found that despite approximately 62% of Cairns residents having access to a working bicycle, only 25% of those who had ridden in the previous month, had done so for transport purposes (i.e. to school/ education, work or shops) (Australian Bicycle Council, 2017).
The four most common reasons for not cycling as a means of transport were:
� It was too far
� They prefer another method
� They had too many items to carry
� Too dangerous.
Whilst the above barriers are based on people’s perceptions/personal circumstances, other major barriers to active transport are associated with the built / physical environment such as: urban design, land-use planning and walking/cycle trail infrastructure. The Heart Foundation/Cycling Promotion Fund (2014) identified some of the biggest infrastructure related barriers were:
� unsafe road conditions
� speed or volume of traffic
� safety
� the lack of bicycle lanes or trails (National Heart Foundation of Australia, 2014).
24
Strategies to encourage more people to cycle need to address these key barriers for existing and potential cyclists. Concerns about safety is a key barrier for cycling and is a priority to address if Council want to see more people cycling across Cairns.
“Riding a bicycle, should not require bravery. Yet, all too often, that is the perception among cyclists and non-cyclists alike” (Geller, 2009).
The safety fear is usually associated with vehicles and mixing with traffic.
Four general categories of cyclists, and their needs, should to be considered when designing and constructing a cycle network. Roger Geller’s report, Four Types of Cyclist, highlights the four categories of cyclists along with their approximate proportion of the local population:
� strong and fearless (<1%) – will ride no matter the weather/ road conditions,
� enthused and confident (7%) – comfortable sharing the road with traffic but prefer to cycle on dedicated cycling facilities,
� interested but concerned (60%) – like riding a bicycle but are afraid to share space with vehicles,
� no way, no how (33%) – not interested in cycling at all, for various reasons such as topography, inability or a complete lack of interest (Geller, 2009).
Whilst this analysis has been based in the city of Portland, USA various analyses have been undertaken in cities around the world that support this view.
The strategies and actions of this Strategy aim to address these barriers, through the provision of infrastructure that is safe. Other interventions such as traffic speed management and signal programming can also improve safety. This will address the community’s concerns for safety and connectivity, by the adoption of supportive policy and by undertaking promotion, education and marketing campaigns.
Creating supportive environments to support cycling, which addresses the community’s key barriers to cycling is important.
3.7 Community Consultation Between 19 February and 19 March 2018, an online community engagement survey was undertaken. The survey allowed the community to place comments and feedback on cycling, walking and walking trail issues and opportunities on a map of the Cairns LGA, utilising the Social Pinpoint platform. During the month-long survey, the website received approximately 1,570 visits and 728 comments, which were analysed and utilised as input into the Cairns Cycling and Walking Strategy. Appendix B contains the detailed community engagement results.
All comments received were tagged by issue category to understand the key themes raised by the respondents. A total of 1,435 tags were submitted. Based on this, main themes evolved on walking trails, pedestrian issues, cycling issues, pedestrian and cycle related issues, Northern Beaches link, school safety and mountain bike trails. The below graphs illustrates the breakdown of these themes by number of responses. Results indicate that the majority of issues/opportunities raised in the responses were cycling related. The more detailed issues associated with these can be found in the second graph.
25
ACTIVE TRANSPORT STRATEGY
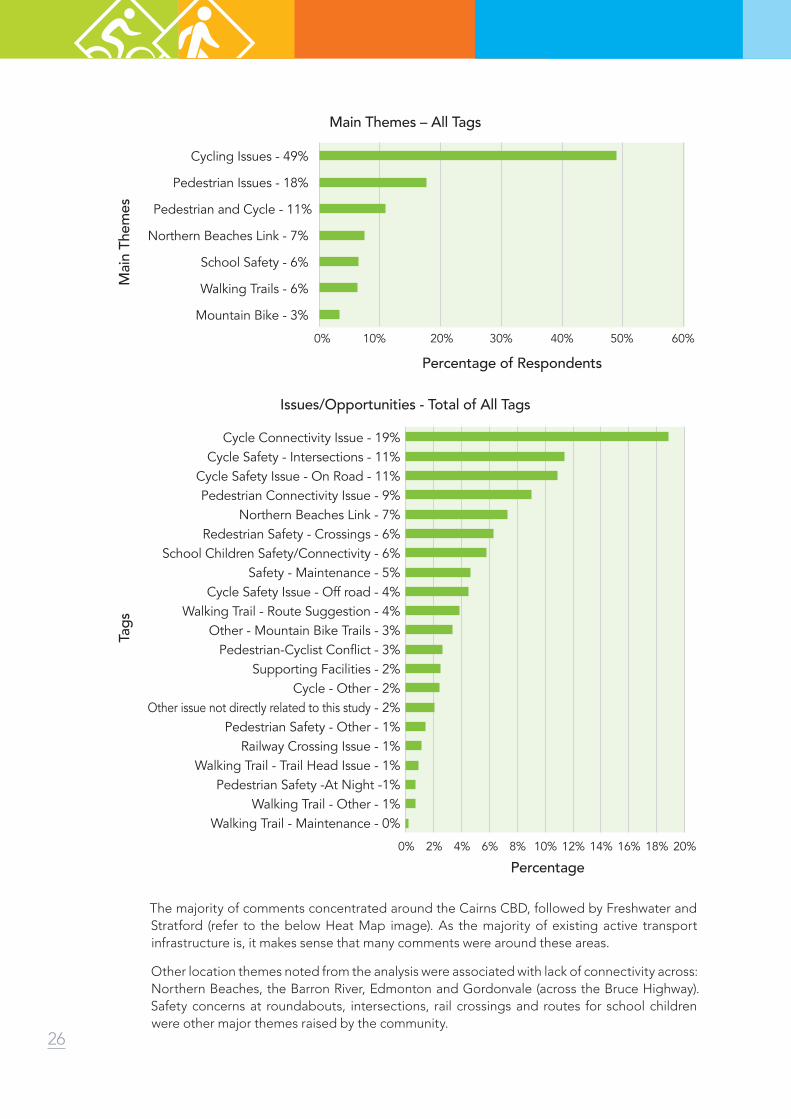
The majority of comments concentrated around the Cairns CBD, followed by Freshwater and Stratford (refer to the below Heat Map image). As the majority of existing active transport infrastructure is, it makes sense that many comments were around these areas.
Other location themes noted from the analysis were associated with lack of connectivity across: Northern Beaches, the Barron River, Edmonton and Gordonvale (across the Bruce Highway). Safety concerns at roundabouts, intersections, rail crossings and routes for school children were other major themes raised by the community.
Tags
Cycle Connectivity Issue - 19%Cycle Safety - Intersections - 11%
Cycle Safety Issue - On Road - 11%Pedestrian Connectivity Issue - 9%
Northern Beaches Link - 7%Redestrian Safety - Crossings - 6%
School Children Safety/Connectivity - 6%Safety - Maintenance - 5%
Cycle Safety Issue - Off road - 4%Walking Trail - Route Suggestion - 4%
Other - Mountain Bike Trails - 3%Pedestrian-Cyclist Conflict - 3%
Supporting Facilities - 2%Cycle - Other - 2%
Other issue not directly related to this study - 2%Pedestrian Safety - Other - 1%
Railway Crossing Issue - 1%Walking Trail - Trail Head Issue - 1%
Pedestrian Safety -At Night -1%Walking Trail - Other - 1%
Walking Trail - Maintenance - 0%
0% 2% 4% 6% 8% 10% 12% 14% 16% 18% 20%
Issues/Opportunities - Total of All Tags
Percentage
Mai
n Th
emes
Main Themes – All Tags
Percentage of Respondents0% 10% 20% 30% 40% 50% 60%
Cycling Issues - 49%
Pedestrian Issues - 18%
Pedestrian and Cycle - 11%
Northern Beaches Link - 7%
School Safety - 6%
Walking Trails - 6%
Mountain Bike - 3%
26

Cairns Cycling and Walking Strategy Survey Results Heatmap - Overall Results
27
ACTIVE TRANSPORT STRATEGY
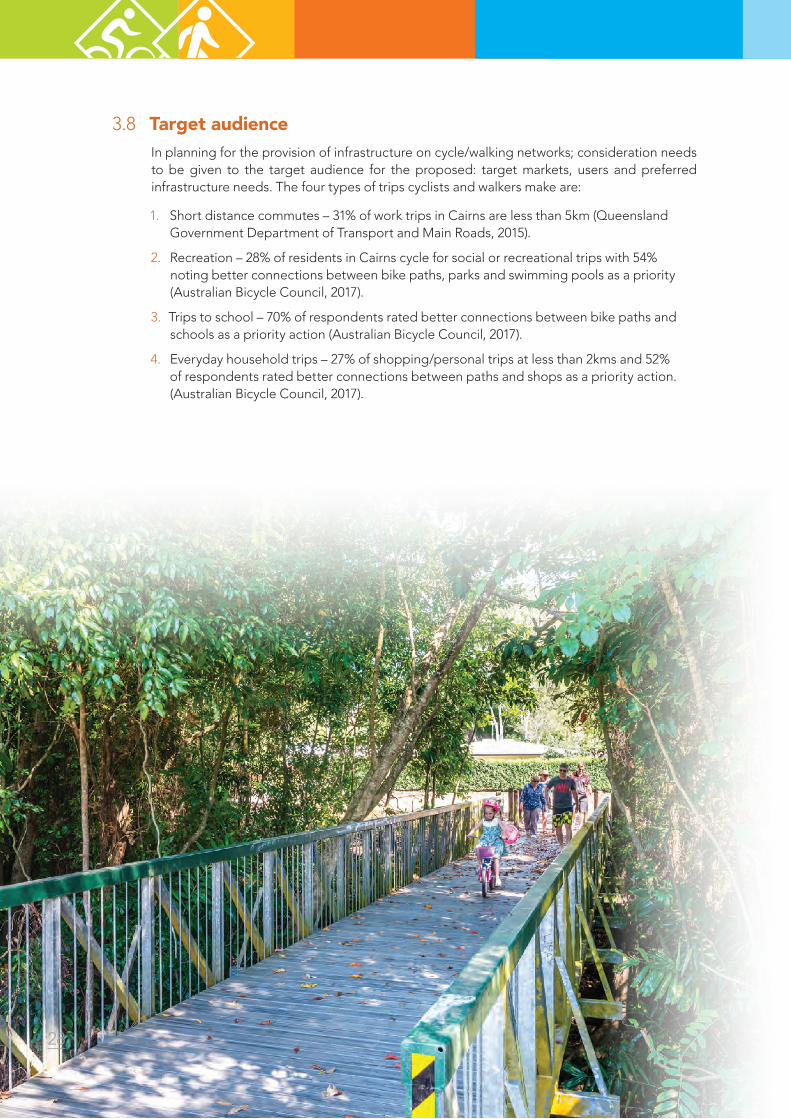
3.8 Target audienceIn planning for the provision of infrastructure on cycle/walking networks; consideration needs to be given to the target audience for the proposed: target markets, users and preferred infrastructure needs. The four types of trips cyclists and walkers make are:
1. Short distance commutes – 31% of work trips in Cairns are less than 5km (Queensland Government Department of Transport and Main Roads, 2015).
2. Recreation – 28% of residents in Cairns cycle for social or recreational trips with 54% noting better connections between bike paths, parks and swimming pools as a priority (Australian Bicycle Council, 2017).
3. Trips to school – 70% of respondents rated better connections between bike paths and schools as a priority action (Australian Bicycle Council, 2017).
4. Everyday household trips – 27% of shopping/personal trips at less than 2kms and 52% of respondents rated better connections between paths and shops as a priority action. (Australian Bicycle Council, 2017).
28
4. Strategy
4.1 VisionCouncil’s vision for active transport in Cairns is:
To develop a more active and connected community by supporting more people to walk and cycle, more often.
Council will achieve this by:
� Delivering a safe and attractive network that encourage new riders, families and vulnerable users;
� Creating a municipal-wide connected network, taking people to where they want to go;
� Informing the community, and visitors, about their travel choices; and
� Creating a strong community walking and cycling culture.
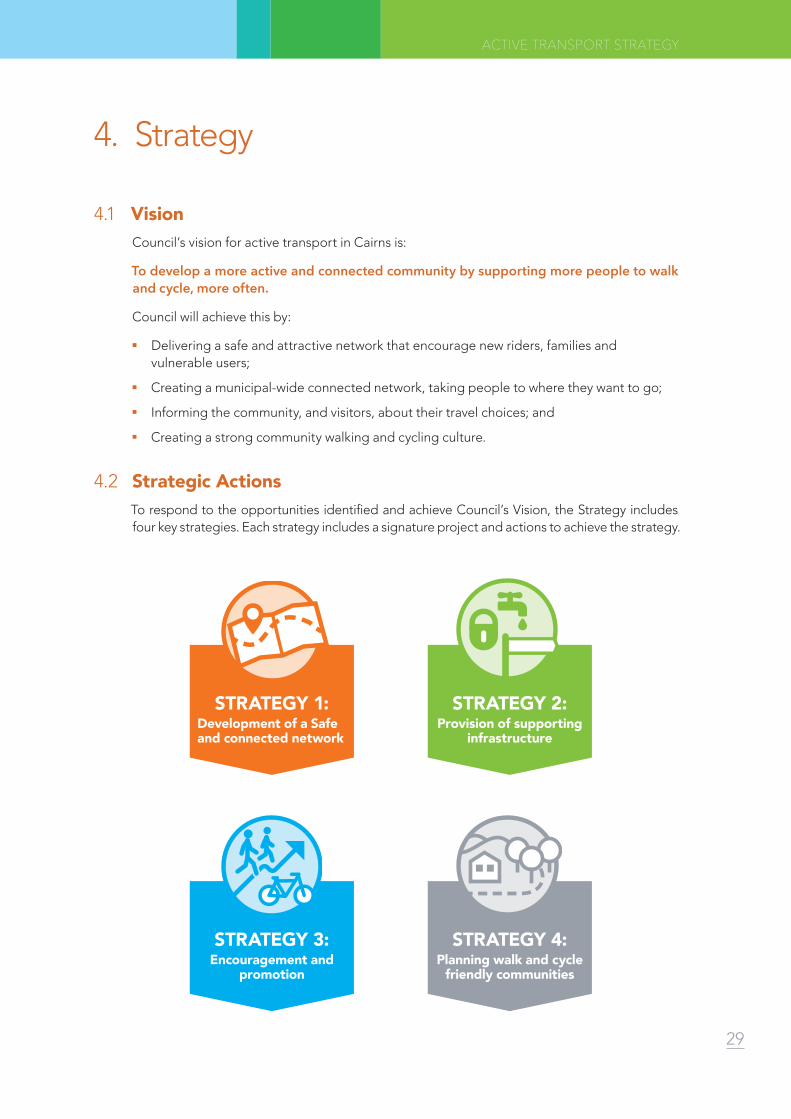
4.2 Strategic ActionsTo respond to the opportunities identified and achieve Council’s Vision, the Strategy includes four key strategies. Each strategy includes a signature project and actions to achieve the strategy.
STRATEGY 1:Development of a Safe and connected network
STRATEGY 2:Provision of supporting
infrastructure
STRATEGY 3:Encouragement and
promotion
STRATEGY 4:Planning walk and cycle
friendly communities
29
ACTIVE TRANSPORT STRATEGY
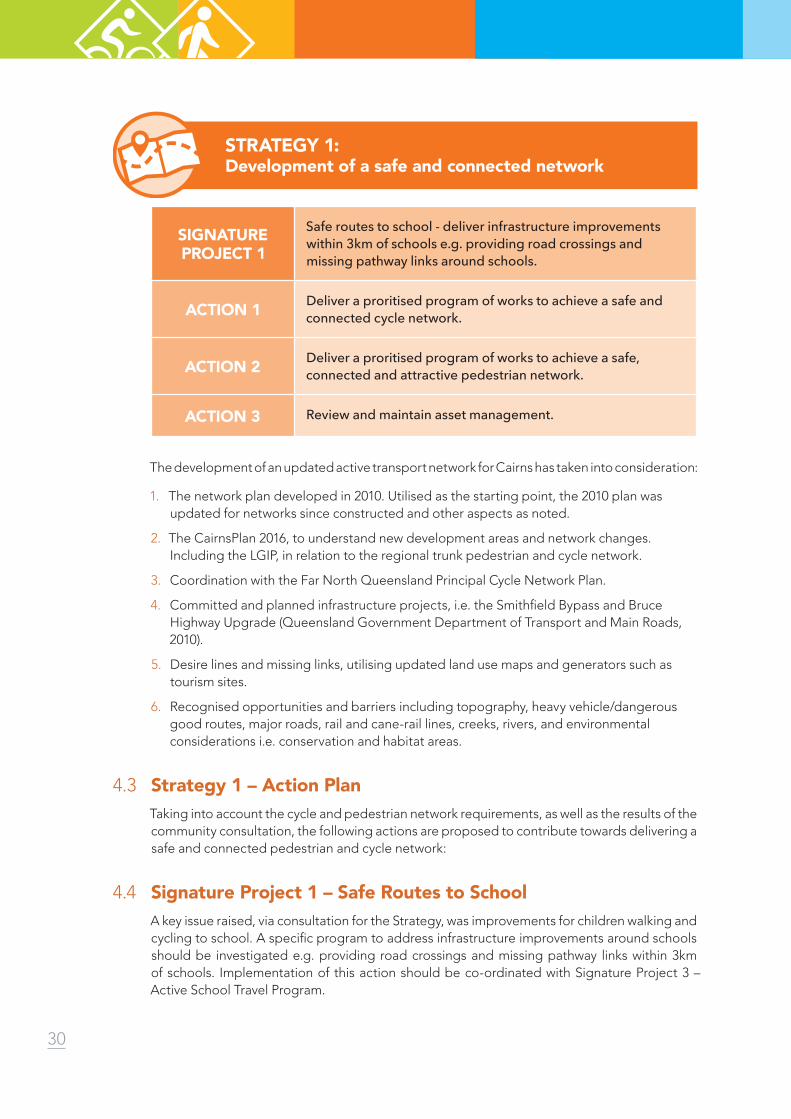
SIGNATURE PROJECT 1
Safe routes to school - deliver infrastructure improvements within 3km of schools e.g. providing road crossings and missing pathway links around schools.
ACTION 1 Deliver a proritised program of works to achieve a safe and connected cycle network.
ACTION 2 Deliver a proritised program of works to achieve a safe, connected and attractive pedestrian network.
ACTION 3 Review and maintain asset management.
The development of an updated active transport network for Cairns has taken into consideration:
1. The network plan developed in 2010. Utilised as the starting point, the 2010 plan was updated for networks since constructed and other aspects as noted.
2. The CairnsPlan 2016, to understand new development areas and network changes. Including the LGIP, in relation to the regional trunk pedestrian and cycle network.
3. Coordination with the Far North Queensland Principal Cycle Network Plan.
4. Committed and planned infrastructure projects, i.e. the Smithfield Bypass and Bruce Highway Upgrade (Queensland Government Department of Transport and Main Roads, 2010).
5. Desire lines and missing links, utilising updated land use maps and generators such as tourism sites.
6. Recognised opportunities and barriers including topography, heavy vehicle/dangerous good routes, major roads, rail and cane-rail lines, creeks, rivers, and environmental considerations i.e. conservation and habitat areas.
4.3 Strategy 1 – Action PlanTaking into account the cycle and pedestrian network requirements, as well as the results of the community consultation, the following actions are proposed to contribute towards delivering a safe and connected pedestrian and cycle network:
4.4 Signature Project 1 – Safe Routes to School A key issue raised, via consultation for the Strategy, was improvements for children walking and cycling to school. A specific program to address infrastructure improvements around schools should be investigated e.g. providing road crossings and missing pathway links within 3km of schools. Implementation of this action should be co-ordinated with Signature Project 3 – Active School Travel Program.
STRATEGY 1:Development of a safe and connected network
30

4.5 Action 1 – Deliver a prioritised program of works to achieve a safe, connected and attractive cycle network:
4.5.1 Prepare future network plans for cycling infrastructure, including priority infrastructure.
4.5.2 Ensure all infrastructure meets Australian and FNQROC design standards.
4.5.3 Review Council’s Access and Inclusion Action Plan and adopt appropriate targets for active transport infrastructure to ensure compliance with the Access and Inclusion Plan.
4.5.4 Incorporate design features aimed at increasing priority use by cyclists. Where appropriate design features could include: separation of cyclists and motor vehicles and prioritised treatments of the principal off-road shared-path network across low volume streets.
4.5.5 Investigate, develop safety measures / treatments for roundabouts and intersections and prepare an implementation plan to deliver the safety upgrades.
4.5.6 Review design standards in FNQROC Development Manual to ensure the design characteristics in 5.5 are adhered to.
4.6 Action 2 – Deliver a prioritised program of works to achieve a safe, connected and attractive pedestrian network:
4.6.1 Prepare corridor plans for priority pedestrian spines to identify and deliver improvements and works. Works could include footpath provision, shade/shelter, seating and improved crossings (e.g. reduced delays and crossing distances).
4.6.2 Review intersections in Cairns CBD to identify improvements for pedestrians such as; reduced delays, crossing distances, installation of timer countdowns for pedestrians and targeting pedestrian spines and activity streets. These improvements can link to Council’s recent implementation of a 40km/hr speed limit in the CBD.
4.6.3 Trial “Pop Up” pedestrian and cycle infrastructure and tie-in with community events to gather feedback and promotion (e.g. pedestrian squares, lunchtime closures of streets, scramble crossings).
4.6.4 Review design standards in FNQROC Development Manual to ensure the design characteristics in 5.7 are adhered to.
4.6.5 Undertake more detailed local area planning for cycling and walking to finalise connections to local destinations and opportunities.
4.7 Action 3 – Review and maintain asset management
4.7.1 Ensure asset management systems incorporate regular maintenance of cycle and pedestrian facilities, such as sweeping road shoulders of debris and trimming overhanging branches on pathways.
4.7.2 Promote existing processes for community members to report maintenance issues to Council.
4.7.3 When footpaths are replaced under renewal programs, ensure they are widened to meet current standards, where possible.
4.7.4 Undertake footpath renewal and maintenance based on the Level of Service star rating system detailed in Council’s Transport Asset Management Plan.
31
ACTIVE TRANSPORT STRATEGY

SIGNATURE PROJECT 2
Active transport wayfinding signage - Implement wayfinding signage as part of the delivery of major active transport corridors. Existing wayfinding signage on the active transport network will also be audited and locations requiring new signage identified.
ACTION 4 Deliver mid-journey and end-of-trip facilities.
ACTION 5 Investigate and deliver urban cooling measures.
In addition to providing a safe and connected network as discussed Strategy 1, it is also important to provide the networks’ attractive and comfortable supporting infrastructure. Appropriate infrastructure facilities can work to create a high-quality attractive network, which in turn should assist in getting more people cycling and walking. Supporting infrastructure can include wayfinding signage, mid and end of trip facilities, lighting and elements to improve aesthetics and comfort such as shade/shelter, seating, tables and water fountains.
Mid-trip facilities are those items which make people feel comfortable whilst on their journey such as water fountains, rest spots, shade and shelter. For longer recreational trips, mid-trip facilities can also include toilets. End of trip facilities include items that users need at the end of their journey such as bicycle parking, lockers and showers.
The need for supporting infrastructure was raised during the community and stakeholder consultation for the Strategy. Recommendations included: signage for improve legibility and navigation around the network, toilet facilities, water fountains, bins; trees to reduce heat islands, showers, lockers, secure bike parking in a central CBD location and practical visible bicycle parking.
“The more street trees along the footpath network, the more likely residents are to walk for 60 minutes each week” (Hooper, Knuiman, Foster, & Giles-Corti, 2015)
In the Cairns 2017 National Cycling Participation Survey, requested actions for Council to consider as ways to encourage bike riding were: more signs to highlight bicycle routes (53% nominated as high priority); and more bicycle parking (42% nominated as high priority) (Australian Bicycle Council, 2017).
STRATEGY 2:Provision of supporting infrastructure
32

4.8 Bike parking in CBD Council audited the locations of bike racks in the CBD in June 2019. The following map illustrates current locations of bike racks in the CBD, as well as proposed locations where demand may require future bike rack installations:
4.9 Bike parking principlesThe following principles apply to Council’s installation of short-term bicycle parking:
4.9.1 Close to user’s destinations – should be short distances to end destination i.e. at least within 100m but ideally within 30m. Locations to target should include areas with: high visitation, work places, community facilities, parks, sporting facilities, aquatic centres, foreshores, tourist attractors, shopping centres and educational facilities including English language centres, in a visible and obvious location e.g. close to entrances to building.
4.9.2 Crime Prevention through Environmental Design and safety – using safe locations, taking into account passive surveillance, lighting, and protection from motor vehicles.
4.9.3 Complimentary – functions with existing amenities. Usability takes into consideration landscaping, a well-maintained area, shelter from weather and racks to meet Australian Standards.
4.9.4 Accessibility – compliant with standards and easily accessible (e.g. has ramps to access from road) and does not impede on other users’ access.
4.9.5 Provision - adequate facilities to meet user demand, refer to Austroads for guidance (Blackett & van den Dool, 2016).
33
ACTIVE TRANSPORT STRATEGY

4.10 Strategy 2 – Action PlanIn response to best practice and requests from the community, Council will deliver mid-journey and end-of-trip facilities to support a comfortable and attractive active transport network.
4.11 Signature Project 2 – Deliver active transport wayfinding for the networkDirectional and wayfinding signs are a critical component of the network. This project will continue to implement wayfinding signage as part of the delivery of major active transport corridors, connecting major destinations. Existing wayfinding signage on the existing network will also be audited and locations requiring new signage identified and installed.
4.12 Action 4 – Deliver mid-journey and end-of-trip facilities
4.12.1 Investigate locations for Cairns CBD end-of-trip facilities. This could be co-located with existing shower/change facilities on the Esplanade, at the Lake Street bus station or other similar location.
The facilities required include: secure bicycle parking, showers, change rooms and lockers. Some end-of-trip facility centres are tied to bike shops who offer bike maintenance and servicing support. Identify opportunities to deliver this action in partnership with private sector.
4.12.2 Continued provision of short-term bicycle parking in the Cairns CBD to meet short-term user demand.
4.12.3 Commence an annual program to deliver bicycle-parking facilities at major destinations including activity centres, parks, sporting destinations, community facilities and schools.
4.12.4 Investigate the installation of lighting where shared paths carry a substantial number of cyclists during periods of darkness i.e. dawn, dusk and during the night.
4.12.5 Continue to provide mid-trip facilities as part of network delivery i.e. seating, water fountains, shade/shelter, toilets and rest areas.
4.13 Action 5 – Investigate and deliver urban cooling measures
4.13.1 Identify actions, suitable to the Cairns environment, to assist in reducing urban heat on the active transport network. Trees are the most successful urban cooling strategy and can reduce temperatures significantly; however, they can be incompatible with some parts of the network. Other options are awnings/shade structures, other plantings, grass, vertical walls, cool pavement materials, heat reducing colours, permeable paving, evaporative cooling and water features (Osmond & Sharifi, 2017).
4.13.2 Identify key corridors and locations for implementation of urban cooling measures and ensure recommended actions are carried over into new pathway design and construction.
34

SIGNATURE PROJECT 3
Active School Travel Project - deliver targeted program to support and encourage active travel to schools, coordinating with delivery of infrastructure identified in Signature Project 1.
ACTION 6 Promote and encourage active transport.
ACTION 7 Educate the community on walking and cycling to improve safety and increase user confidence.
Infrastructure is only one component of getting more people to use active transport. Promoting and encouraging people to use the infrastructure is just as important.
Council has had past successes with many promotional programs. Participation in the Healthy Active School Travel Program, and the Cairns Active Towns Pilot Program. The latter involved delivery of active transport infrastructure in association with a targeted promotion through events and education programs. More recently Council has conducted cycle training workshops targeting specific user groups (e.g. females of all ages), which have proven very popular with the community and successfully built skills and confidence in riders.
The key elements of this action include:
� Encouragement and Promotion – providing information on networks and promoting their use via events and activities.
� Education to improve safety and increase user confidence.
� Cultural change – primarily focussed on the education of drivers and cyclists that the road is for everyone, and all should be mindful of each other’s needs and rights.
4.14 Cycling for Tourism and RecreationCairns already possess strong base for cycling related tourism. Many existing regional events have high community participation as well as attracting interstate and international participants i.e. Mountain Bike World Championships, annual triathlons, Cairns to Cooktown Cardiac Challenge, Townsville to Cairns Bike Ride for Cancer, Cairns Ironman and Cairns to Karumba Bike Ride, the Croc Trophy, Reef to Reef and the RRR. Encouraging the community to participate in these events can introduce them to cycling and walking/running, which will build their confidence and potentially get them to consider cycling as a form of transport. Cycling as a tourism activity also has the potential for significant economic growth in the region.
Bicycle Queensland research into past events indicates that their annual Cycle Queensland tour significantly benefits local communities, with the tour injecting an estimated $600,000 into the host region. Bicycle Queensland spends approximately $150,000 in host-towns and tour participants spend on average a further $40 per person per day in those towns (Bicycle Queensland, 2017).
STRATEGY 3:Encouragement and promotion
35
ACTIVE TRANSPORT STRATEGY
“Evidence suggests bicycle tourists stay longer, spend more, and support smaller businesses. Qld is the perfect destination for bicycle tourism… About 20% of riders already registered in the eight-day Cycle Qld tour from the Daintree to Cairns in September this year are from interstate or overseas, demonstrating the strength of Qld’s credibility as an adventure and ecotourism drawcard” (Bicycle Queensland, 2018). Final data for this 2018 event found that 36% of the 624 participants were from interstate or overseas.
Similarly, the Mountain Bike World Championships in 2014 contributed $3.5 million to the state’s economy (Mason, 2016). The recently announced 76km Wangetti Trail linking Palm Cove and Port Douglas has the potential to be a significant tourist attraction for FNQ for walkers and mountain bike riders.
4.15 Strategy 3 – Action PlanThe delivery of travel behaviour-change and education programs can be a cost-effective method of inducing more people to walk and cycle, when compared to the high cost of infrastructure. Targeted programs can be delivered to encourage people to cycle more often for more trip purposes.
4.16 Signature Project 3 – Active School Travel ProgramDeliver a targeted program to support and encourage active travel to schools, co-ordinated with delivery of infrastructure identified in Signature Project 1.
Build on the success and the knowledge created via the HAST Program by implementing an Active School Travel program. Delivery of the promotion to schools via inclusion in existing events and activities such as national Walk2School day, Ride2School days, bike/walk buses and bike week. The program could be targeted to priority schools where infrastructure provision is identified in Signature Project 1 (Safe routes to school). Coordinate the promotion of new walking and cycling infrastructure with schools as part of the promotional activities undertaken for new infrastructure (see action 6.3).
4.17 Action 6 – Promote and encourage active transport
4.17.1 Prepare and implement a social media strategy to promote and inform the community on walking and cycling and to start community conversations on relevant issues. This could include specific messages to different target audiences based on age groups or purpose of walking/cycling trip (e.g. encouraging recreation cyclists to try trips to work)
4.17.2 Provide interactive maps on walking and cycling, incorporating up to date networks and interactive route planners. Support Council’s myCairns app to provide a route planner for cycling and walking in Cairns and on Council’s web site. Information can also be provided on walking trails, mountain bike trails, road racing routes and events such as community races, challenges and fun runs/rides/walks at the same location. Utilise local Visitor Information Centres and Tourism Organisations i.e. TTNQ, to leverage their domestic and international distribution channels on all offerings.
4.17.3 Build on the success of Active Towns by promoting new infrastructure, once complete, to ensure the benefits of infrastructure investments are realised and become popular travel choices for the community. Undertake targeted promotion of new facilities to the surrounding and broader community via mechanisms such as maps, newsletters, community events, media releases and social media strategies to start community conversations on cycling. Inclusion of behavioural change messaging such as “Did you
36

know it is only 5 minutes to walk to the shops from here?” could be used to encourage people to walk more often for short trips.
4.17.4 Participate and promote statewide and national events that promote cycling and walking. Similar to the Active School Travel Program, utilise existing events and activities to promote cycling in the LGA e.g. Bike Week festivities, National Ride2Work Day, Share the Road campaigns, Heart Foundation Walking program.
4.17.5 Continue to work with other agencies to deliver and promote recreation and tourist based walking and cycling events, destinations and opportunities in the region. Promote the economic and lifestyle benefits these events have for local residents.
4.17.6 Undertake a Ride to Work program for Council staff – lead by example and encourage staff to ride to work. Participate in State and National ride to work days, promote end-of-trip facilities to new and existing staff. Invite key council stakeholders and partners to ‘join in the fun’.
4.17.7 Investigate providing a bicycle fleet (including e-bikes) for Council staff to ride to CBD meetings and site visits.
4.18 Action 7 – Educate the community on walking and cycling to improve safety and increase user confidence.
4.18.1 Investigate mechanisms to deliver annual ‘BikeEd’ to schools in the LGA, in partnership with local community groups.
4.18.2 Continue to work with cycling groups on encouraging new participants via community education forums and annual bike rides. Target vulnerable and under-represented user groups i.e. children, women and seniors. Other engagement program activities could include bike buddy programs, cycle recycle days/bike swaps, community challenges and style over speed rides.
37
ACTIVE TRANSPORT STRATEGY

SIGNATURE PROJECT 4
Incorporate best practice principles and revised active transport network plans into planning instruments - incorporate revised bicycle and pedestrian network plans as overlays in the next planning scheme (CairnsPlan 2016) review and update Local Government Infrastructure Plan (LGIP) with priorities identified as part of this Strategy.
Action 8 Integrate active transport into all planning and design.
Action 9 Incorporate best practice principles for walking and cycling into next review of planning scheme.
New communities and developments are a key opportunity to ensure the environment created for active transport is high quality and enabling sustainable habits for new residents or businesses. There are elements of a built environment that can influence travel behaviour and achieve greater levels of physical activity in the community. Element characteristics include residential density, proximity to destinations, grid like street patterns and networks, which make it easier to walk and cycle around, rather than drive. The provision of appropriate infrastructure in these areas is also crucial.
There are a range that of concepts, such as ’15-minute compact neighbourhoods’, which offer multiple mixed-use destinations within walking and cycling distances, that allow for high quality public realm within its standards. These concepts ensure appropriate provisions for bicycle parking and end-of-trip facilities are included in new commercial and residential developments, and included in updates to the active transport network plan in future reviews of the planning scheme. New communities should be cyclable and walkable as a whole to reduce reliance on car travel.
Continuing to monitor and review the current walk and cycle strategy and network plan is also important to achieving high quality outcomes. Council and TMR already collect data on the use of the network via data counters (permanent and temporary), participation surveys, event attendance and community consultation on projects. It is recommended these activities continue so measuring the success of the Strategy can be considered at its next review.
4.19 Strategy 4 – Action PlanActive transport networks must be integrated into all levels of planning, delivery and approval of new developments, across all Council departments in order to achieve the vision. Ongoing monitoring of the strategy and its implementation should occur.
STRATEGY 4:Planning walk and cycle friendly communities
38
4.20 Signature Project 4 – Incorporate best practice principles and revised active transport network plans into planning instrumentsIncorporate revised bicycle and pedestrian network plans as overlays in the next planning scheme (CairnsPlan) review, and update Local Government Infrastructure Plan (LGIP) with priorities identified as part of this Strategy.
4.21 Action 8 – Integrate active transport into all planning and design
4.21.1 Incorporate walking and cycling infrastructure into all transport projects. Continue to deliver cycling and walking infrastructure as part of road/intersection upgrades and road resurfacing projects where they are part of the strategic cycling network.
4.21.2 Ensure active transport planning and infrastructure is considered in all Council and State Government projects in the region.
4.21.3 Partner with State Government to deliver regional planning which supports and encourages active transport, including walk and cycle friendly communities and infrastructure.
4.22 Action 9 – Incorporate best practice principles for walking and cycling future review of planning scheme
4.22.1 Review Council standards for cycling and walking infrastructure. Review existing on-road and pathway network standards to ensure they meet latest Austroads and Queensland Guidelines requirements.
4.22.2 Review bicycle parking and end-of-trip facility requirements for new developments, to ensure they meet best practice provisions.
4.22.3 Update overlays with new active transport network plans.
4.22.4 Promote active healthy communities design principles and resources to developers.
4.22.5 Update Local Government Infrastructure Plan (LGIP) with identified priorities from the Cairns Active Travel Strategy.
4.23 Action 10 – Monitor and review Active Transport Strategy
4.23.1 Collect and review regular active transport network and participation data for benchmarking.
4.23.2 Undertake a review of the Strategy including the action plans and network plans every five years to monitor and report on implementation successes.
39
ACTIVE TRANSPORT STRATEGY
5. Network Implementation Plan
In accordance with the provisions of this strategic plan as well as the insights gleaned from stakeholder and community engagement and the industry best practice review, a Network Plan has been developed. The Network Plan encompasses a number of elements and shall serve as a blueprint for a system of cycling and walking routes that may be integrated into the existing and proposed road network, land developments and transport schemes within the region. This will ensure active transport principles and infrastructure feature not only in local decision-making but also informs the broader regional and state wide planning perspectives.
5.1 Elements of the Network PlanThe Network Plan aims to connect people to where they want to go and with facilities that are safe and convenient. There are five key elements that comprise the Network Plan will ensure the fit-for-purpose cycling network is delivered:
1. Network Hierarchy – This modern classification system determines the function of the route based on the types of activities that take place along the network.
2. Standards – Defined “standards” inform planning, provision, development and management decisions and are aligned closely with the network hierarchy. In this Strategy, prescriptive standards have been articulated from both a technical and a customer perspective.
3. Costs – Adopting a consistent and strategic approach to the provision of the network has enabled standard costs/rates to be developed which will in turn lead to more accurate budgeting.
4. Priorities – The adopted framework enables equitable, consistent and transparent mechanism to rand and prioritise parts of the network.
5. Implementation – The Strategy culminates into an overall implementation plan, which will give direction and certainty for Council and the community.
5.2 Cycle NetworkAn updated cycle network is presented in the mapping within Appendix C and the schedules provided in Appendix F. The network has been grouped by function in a hierarchy after consideration of the general function of each route. The following tables document the hierarchy. The design considerations and ideal facility types discussed are indicative and may vary based on site specific constraints and opportunities.
40

5.3 Cycle Network HierarchyDescription Function
Principal � Connects major regional destinations including centres, employment, schools, universities, recreation destinations
� Incorporates the PCNP identified by State Government.
� Identifies potential principal connections where significant urban growth has been identified but land use /transport planning has not yet been finalised.
Local � Connects residential area to principal routes
� Connects to local destinations such as parks, community facilities, and local shops.
Strategic Investigation Routes
� These are opportunities for future cycle links but require further investigation before finalizing. Include opportunities such as disused rail lines or connections along or across creeks, which create a short direct link but further feasibility, investigation is required.
Training � Scenic cycle routes used by sport or touring cyclists.
41
ACTIVE TRANSPORT STRATEGY

5.4 Cycle Network Hierarchy and Requirements
Description Function CharacteristicsDesign Considerations
Ideal Facility Types*
Principal � Connects major regional destinations including centres, employment, schools, universities, recreation destinations
� Incorporates the PCNP identified by State Government
� Identifies potential principal connections where significant urban growth has been identified but land use /transport planning has not yet been finalised.
� Primary transport or recreational route between activity centres and other destinations
� Needs to cater for a variety of trip types with a focus on commuting, education and utility
� Provides connections to/from surrounding local governments
� Caters for higher speed commuter cyclists but also provides facility types, which encourage new and “interested but concerned” potential users.
� Longer distance connections
� Caters for higher volume of cyclists
� Most direct, convenient route
� Favourable topography
� Safe, continuous, visible and legible
� Continuous routes with limited interruptions i.e. limited delays, limited road crossings, free of barriers
� Caters for higher speed cyclists (20-40km/h)
� When on road, should ideally be separated from cars
� When off road, routes should be separated from pedestrians when demands warrant
� Wayfinding signage
� Mid and end of trip facilities
� Lighting on routes with high numbers of commuting cyclists
� Separated Cycle Tracks (preferred)
� Shared Paths (preferred)
� On road bicycle lanes (suitable)
� Cycle Streets and Bicycle Advisory Lanes (suitable)
42

Description Function CharacteristicsDesign Considerations
Ideal Facility Types*
Local � Connects residential area to principal routes
� Connects to local destinations such as parks, community facilities, local shops
� Distributes residential suburbs to the principal routes
� Feeder route to principal routes
� Needs to cater for a variety of trip types with a focus on commuting, education and utility
� Caters for medium to low volumes of cyclists
� Safe and convenient routes
� When on road, routes can be shared with motor vehicles but at low speeds and low traffic volumes
� Shared paths
� On road bicycle lanes
� Cycle Streets and Advisory Bicycle Lanes
Strategic Investigation Routes
� These are opportunities for future cycle links but require further investigation before finalizing. Include opportunities such as disused rail lines or connections along or across creeks which create a short direct link but further feasibility investigation is required
� Once identified will have same characteristics as Principal or Local (depending on their final hierarchy designation)
� Once identified will have same design considerations as Principal or Local (depending on their final hierarchy designation)
� Once identified will have same facility types as Principal or Local (depending on their final hierarchy designation)
Training � Scenic cycle routes used by sport or touring cyclists
� Caters for more confident and experienced cyclists
� Primarily scenic routes with challenging topography resulting in designated facilities difficult and costly to provide therefore sport safety improvements the priority
� Can take the form of loop training ride
� Safe continuous and visible
� Sport training signage
� Squeeze points/hazardous locations managed
� Caters for higher speed cyclists – 40km/h or higher
� Sport training signage
� Road shoulders
� Kerbside lanes
43
ACTIVE TRANSPORT STRATEGY

5.5 Cycle Design StandardsDesign standards were reviewed to ensure the recommended facility types are consistent with current standards. All relevant design standards are listed beside each of the facility types. The details provided in these updated standards have been used as part of the preparation for the Network Implementation Plan (Appendix F), as well as the unit rates to determine construction and ongoing maintenance costs. The following tables summarise the updated facility types:
FACILITY TYPE: SHARED PATH (SP)Facility Description and Application:
� Wide off-road path provided for shared use by cyclists, pedestrians, wheeled recreational devices (WRD’s) including skateboards, roller skates, roller blades as well as micro-electrics and wheelchairs.
� Cyclists must give way to pedestrians, while WRD’s must give way to bicycles and pedestrians.
Design Requirements (based on technical references):
Signage:
� Signage requirements at 500 m max intervals along length of path.
� Pavement symbols painted at 200 m intervals.
Widths:
� 2.0m – absolute minimum for local network
� 2.5 m – desirable minimum shared path width for local network, and absolute minimum for principal (trunk) network
� 3.0 m – frequent commuting (30 km/h), preferred width for principal (trunk) network
� 3.0 m – regular use recreation (20 km/h)
� 4.0 m – heavy major recreational
Intersections:
� Priority crossings to be a raised facility to the standards referenced below.
Indicative Capital Cost:
These unit rates include bicycle and pedestrian symbols, signage and 30% contingency.
� 2.0 m wide path = $318 / m
� 2.5 m wide path = $396 / m
� 3.0 m wide path = $476 / m
� 4.0 m wide path = $634 / m
Refer Appendix E for detailed breakdown of unit rates
Indicative Operational Cost*:
� 2m wide path = $9,800 per km / per annum
� 2.5m wide path = $12,500 per km / per annum
� 3m wide path = $14,900 per km / per annum
� 4m wide path = $19,400 per km / per annum
* these costs are indicative and to be used for planning purposes only. A mid-range price point has been used.
44

FACILITY TYPE: SHARED PATH (SP)Technical References: � Austroads Part 6A – Pedestrian & Cyclist Paths
� FNQROC Development Manual – Design guideline D1 Section D1.20
� RPDM, 2nd Edition. Part 6A Supplement
� TMR Guideline – Raised Priority Crossings for Pedestrians and Cycle Paths.
45
ACTIVE TRANSPORT STRATEGY

FACILITY TYPE: ON ROAD EXCLUSIVE BICYCLE LANE / ROAD SHOULDER BICYCLE LANE (EBL)
Facility Description and Application:
� Part of road space set aside for cyclists.
� Formally defined kerbside lane for dedicated use of cyclists, with full edge line marking.
� Motorists may only enter this lane to enter or exit a property or turn left.
� Parking in / over bicycle lane is not permitted.
Design Requirements (based on technical references):
Signage:
� Signage requirements at 500 m max intervals along length of path.
� Pavement symbols painted at 200 m intervals.
Bicycle Lane Widths:
� 1.5 m – For posted speed of 60 km/h.
� 2.0 m – For posted speed of 80 km/h.
Indicative Capital Cost:
� $22.42 / m – includes edge line (one side), painted cycle symbols and signs.
� $38.02 / m – includes edge lines (both sides) of path, painted cycle symbols and signs.
Refer Appendix E for detailed breakdown of unit rates
Indicative Operational Cost*:
� $1,350 per km / per annum - includes edge line (one side), painted cycle symbols and signs
� $1,700 per km / per annum - includes edge lines (both sides) of path, painted cycle symbols and signs.
* these costs are indicative and to be used for planning purposes only.
Technical References: � Austroads Part 3 – Geometric Design – Section 4.8
� FNQROC Development Manual – Design guideline D1 Section D1.10 & Table D1.1
� TMR Guideline – Fencing and edging treatments for cycling infrastructure.
46

47
ACTIVE TRANSPORT STRATEGY

FACILITY TYPE: ON ROAD BICYCLE/PARKING LANE (SBPL) – PARALLEL
Facility Description and Application:
� Shared kerbside lane, comprising formally designated bicycle lane and adjacent parallel on-street parking space.
� Facility formally defined with edge lines.
� Facility to be adequate width to cater for parked vehicles, bicycle design envelope and open car door.
This facility type is generally not recommended for higher volume routes as there are alternative facility types which are safer. The preferred facility type is an on-road cycle track adjacent to the kerb and channel.
Design Requirements (based on technical references):
� Green paint can be used as delineation but has not been included in the estimated costs.
� The SBPL configuration can only be achieved where the facility width is at least 4.5m including the through lanes. This comprises a parking lane of 2.5 m, safety strip of 0.5 m and bicycle lane of 1.5 m.
Signage:
� Signage requirements at 500 m max intervals along length of path.
� Pavement symbols painted white at 200 m intervals.
Bicycle lane widths (including car park space, safety strip and bicycle lane):
� 4.0 m for posted speed of 60 km/h.
Indicative Capital Cost:
� $22.42 / m – includes edge line (one side), painted cycle symbols and signs.
� $38.02 / m includes edge lines (both sides of path, painted cycle symbols and signs.
Refer Appendix E for detailed breakdown of unit rates
Indicative Operational Cost*:
� $1,350 per km / per annum - includes edge line (one side), painted cycle symbols and signs
� $1,700 per km / per annum - includes edge lines (both sides) of path, painted cycle symbols and signs.
* these costs are indicative and to be used for planning purposes only.
Technical References: � Austroads Part 3 – Geometric Design – Section 4.8
� FNQROC Development Manual – Design guideline D1
� RPDM. 2nd Edition. Volume 3 Supplement
48

49
ACTIVE TRANSPORT STRATEGY
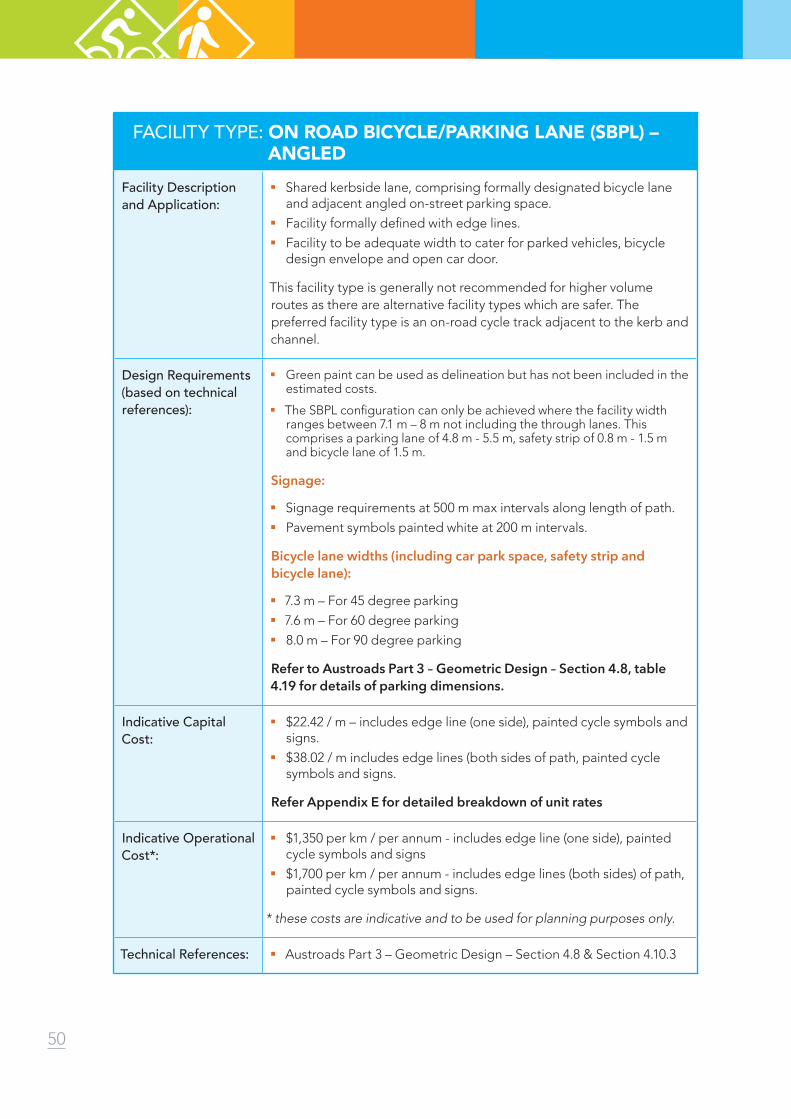
FACILITY TYPE: ON ROAD BICYCLE/PARKING LANE (SBPL) – ANGLED
Facility Description and Application:
� Shared kerbside lane, comprising formally designated bicycle lane and adjacent angled on-street parking space.
� Facility formally defined with edge lines.
� Facility to be adequate width to cater for parked vehicles, bicycle design envelope and open car door.
This facility type is generally not recommended for higher volume routes as there are alternative facility types which are safer. The preferred facility type is an on-road cycle track adjacent to the kerb and channel.
Design Requirements (based on technical references):
� Green paint can be used as delineation but has not been included in the estimated costs.
� The SBPL configuration can only be achieved where the facility width ranges between 7.1 m – 8 m not including the through lanes. This comprises a parking lane of 4.8 m - 5.5 m, safety strip of 0.8 m - 1.5 m and bicycle lane of 1.5 m.
Signage:
� Signage requirements at 500 m max intervals along length of path.
� Pavement symbols painted white at 200 m intervals.
Bicycle lane widths (including car park space, safety strip and bicycle lane):
� 7.3 m – For 45 degree parking
� 7.6 m – For 60 degree parking
� 8.0 m – For 90 degree parking
Refer to Austroads Part 3 – Geometric Design – Section 4.8, table 4.19 for details of parking dimensions.
Indicative Capital Cost:
� $22.42 / m – includes edge line (one side), painted cycle symbols and signs.
� $38.02 / m includes edge lines (both sides of path, painted cycle symbols and signs.
Refer Appendix E for detailed breakdown of unit rates
Indicative Operational Cost*:
� $1,350 per km / per annum - includes edge line (one side), painted cycle symbols and signs
� $1,700 per km / per annum - includes edge lines (both sides) of path, painted cycle symbols and signs.
* these costs are indicative and to be used for planning purposes only.
Technical References: � Austroads Part 3 – Geometric Design – Section 4.8 & Section 4.10.3
50

51
ACTIVE TRANSPORT STRATEGY
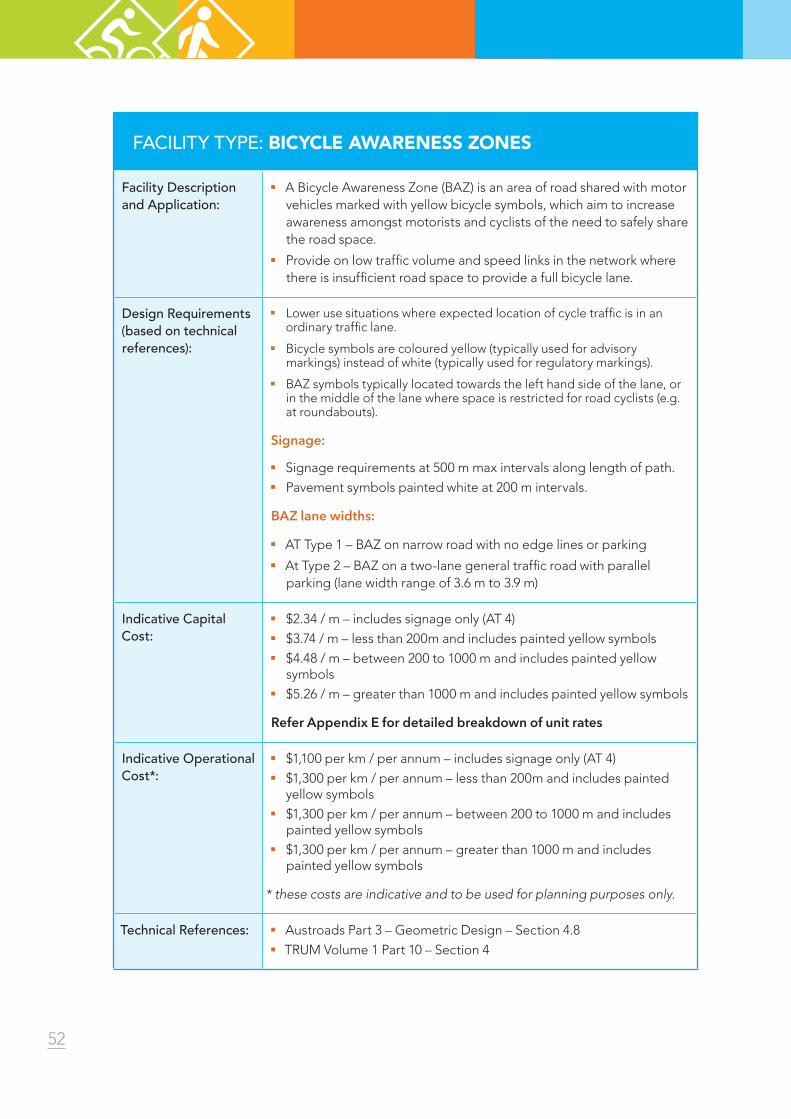
FACILITY TYPE: BICYCLE AWARENESS ZONES
Facility Description and Application:
� A Bicycle Awareness Zone (BAZ) is an area of road shared with motor vehicles marked with yellow bicycle symbols, which aim to increase awareness amongst motorists and cyclists of the need to safely share the road space.
� Provide on low traffic volume and speed links in the network where there is insufficient road space to provide a full bicycle lane.
Design Requirements (based on technical references):
� Lower use situations where expected location of cycle traffic is in an ordinary traffic lane.
� Bicycle symbols are coloured yellow (typically used for advisory markings) instead of white (typically used for regulatory markings).
� BAZ symbols typically located towards the left hand side of the lane, or in the middle of the lane where space is restricted for road cyclists (e.g. at roundabouts).
Signage:
� Signage requirements at 500 m max intervals along length of path.
� Pavement symbols painted white at 200 m intervals.
BAZ lane widths:
� AT Type 1 – BAZ on narrow road with no edge lines or parking
� At Type 2 – BAZ on a two-lane general traffic road with parallel parking (lane width range of 3.6 m to 3.9 m)
Indicative Capital Cost:
� $2.34 / m – includes signage only (AT 4)
� $3.74 / m – less than 200m and includes painted yellow symbols
� $4.48 / m – between 200 to 1000 m and includes painted yellow symbols
� $5.26 / m – greater than 1000 m and includes painted yellow symbols
Refer Appendix E for detailed breakdown of unit rates
Indicative Operational Cost*:
� $1,100 per km / per annum – includes signage only (AT 4)
� $1,300 per km / per annum – less than 200m and includes painted yellow symbols
� $1,300 per km / per annum – between 200 to 1000 m and includes painted yellow symbols
� $1,300 per km / per annum – greater than 1000 m and includes painted yellow symbols
* these costs are indicative and to be used for planning purposes only.
Technical References: � Austroads Part 3 – Geometric Design – Section 4.8
� TRUM Volume 1 Part 10 – Section 4
52
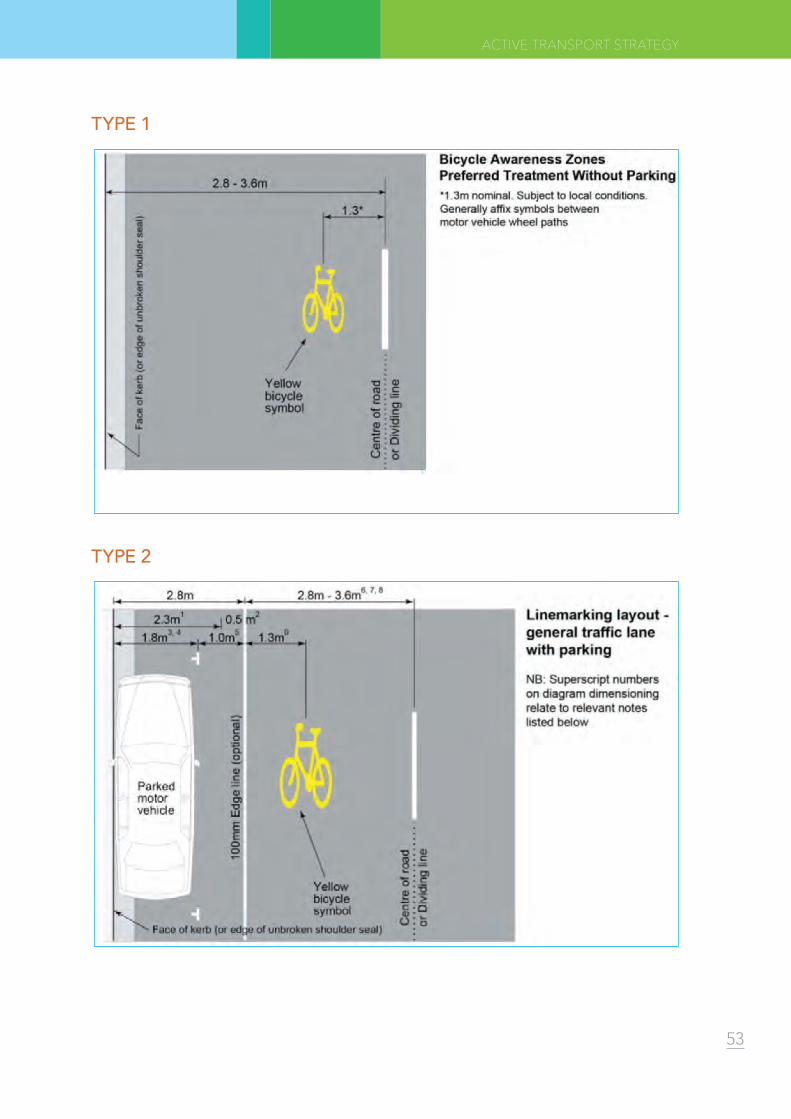
TYPE 1
TYPE 2
53
ACTIVE TRANSPORT STRATEGY
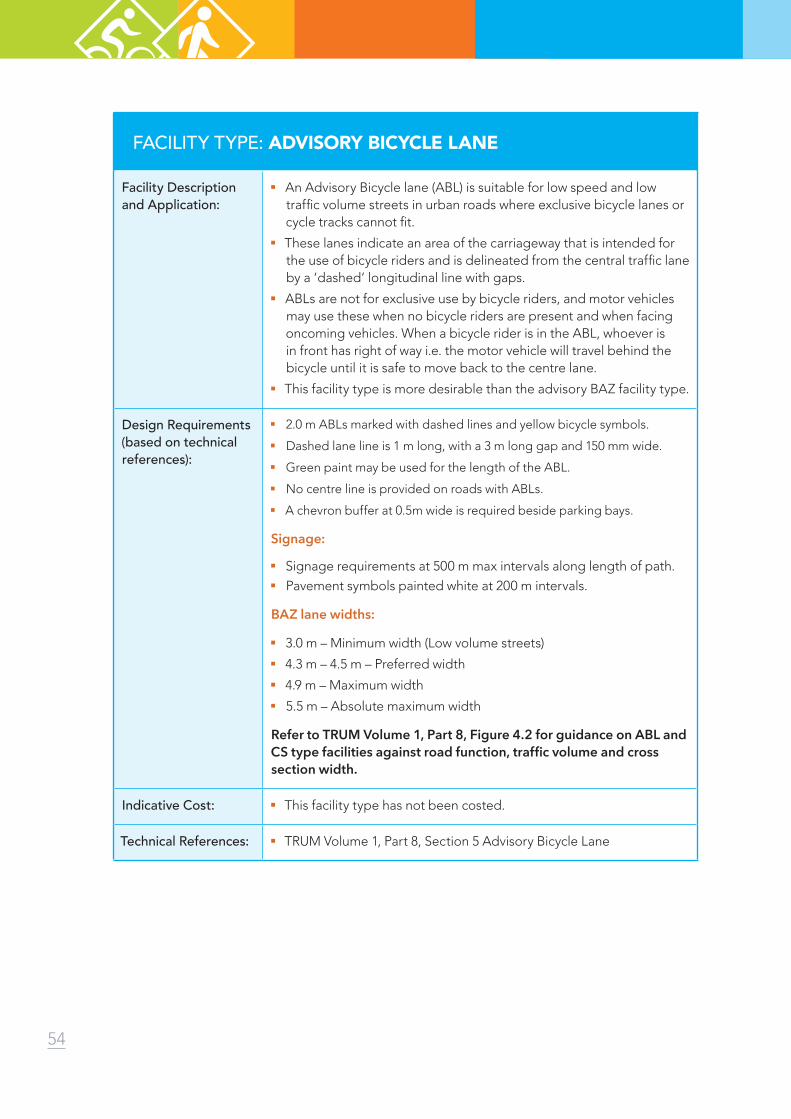
FACILITY TYPE: ADVISORY BICYCLE LANE
Facility Description and Application:
� An Advisory Bicycle lane (ABL) is suitable for low speed and low traffic volume streets in urban roads where exclusive bicycle lanes or cycle tracks cannot fit.
� These lanes indicate an area of the carriageway that is intended for the use of bicycle riders and is delineated from the central traffic lane by a ‘dashed’ longitudinal line with gaps.
� ABLs are not for exclusive use by bicycle riders, and motor vehicles may use these when no bicycle riders are present and when facing oncoming vehicles. When a bicycle rider is in the ABL, whoever is in front has right of way i.e. the motor vehicle will travel behind the bicycle until it is safe to move back to the centre lane.
� This facility type is more desirable than the advisory BAZ facility type.
Design Requirements (based on technical references):
� 2.0 m ABLs marked with dashed lines and yellow bicycle symbols.
� Dashed lane line is 1 m long, with a 3 m long gap and 150 mm wide.
� Green paint may be used for the length of the ABL.
� No centre line is provided on roads with ABLs.
� A chevron buffer at 0.5m wide is required beside parking bays.
Signage:
� Signage requirements at 500 m max intervals along length of path.
� Pavement symbols painted white at 200 m intervals.
BAZ lane widths:
� 3.0 m – Minimum width (Low volume streets)
� 4.3 m – 4.5 m – Preferred width
� 4.9 m – Maximum width
� 5.5 m – Absolute maximum width
Refer to TRUM Volume 1, Part 8, Figure 4.2 for guidance on ABL and CS type facilities against road function, traffic volume and cross section width.
Indicative Cost: � This facility type has not been costed.
Technical References: � TRUM Volume 1, Part 8, Section 5 Advisory Bicycle Lane
54

Typical implementation of Advisory Bicycle Lanes
55
ACTIVE TRANSPORT STRATEGY

FACILITY TYPE: CYCLE STREET
Facility Description and Application:
� Cycle Streets (CS) are an advisory facility type suitable for very low speed and low traffic volume streets in urban environments where exclusive bicycle lanes or tracks cannot fit.
� Designed for mixed traffic environment, encouraging bicycle riders to use the centre of the road.
� This facility type should not be considered outside of urban environments / access streets.
� Allows retrofitting in constrained locations.
Design Requirements (based on technical references):
� Typical carriageway widths on access streets / minor collector streets are between 7.5 m – 12.4 m and include on street parking.
� Shared 3.0 m – 3.5 m wide lane with yellow advisory bicycle symbols. The bicycle symbol should be located centrally to the travel lane.
� Clearly designate parking using indented 2.1m parking bays with landscaping placed in line with parking to delineate these areas. Parking can be located on one side or both sides.
� Overrun areas of at least 0.75 m are recommended on either side, constructed with a textured /contrasting surface (e.g. audible tactile marking)
� Variations to the overrun areas can be designed for one or two lanes with a 1.5 m – 2.0 m wide mountable median. This allows implementation on higher traffic volume routes.
Signage:
� Signage requirements at 500 m max intervals along length of path.
� Pavement symbols painted white at 200 m intervals.
Refer to TRUM Volume 1, Part 8, Figure 4.2 for guidance on ABL and CS type facilities against road function, traffic volume and cross section width.
Indicative Cost: � This facility type has not been costed.
Technical References: � TRUM Volume 1, Part 8, Section 6 Cycle Street
56

Typical implementation of Cycle Street
57
ACTIVE TRANSPORT STRATEGY
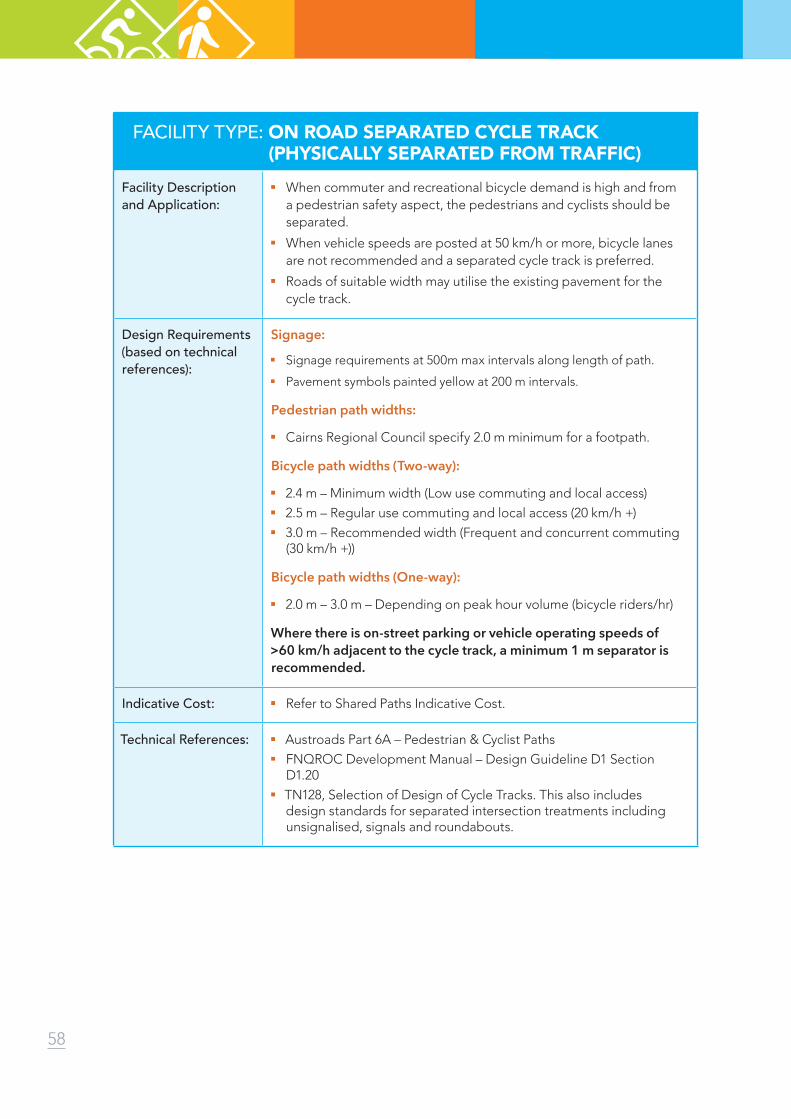
FACILITY TYPE: ON ROAD SEPARATED CYCLE TRACK (PHYSICALLY SEPARATED FROM TRAFFIC)
Facility Description and Application:
� When commuter and recreational bicycle demand is high and from a pedestrian safety aspect, the pedestrians and cyclists should be separated.
� When vehicle speeds are posted at 50 km/h or more, bicycle lanes are not recommended and a separated cycle track is preferred.
� Roads of suitable width may utilise the existing pavement for the cycle track.
Design Requirements (based on technical references):
Signage:
� Signage requirements at 500m max intervals along length of path.
� Pavement symbols painted yellow at 200 m intervals.
Pedestrian path widths:
� Cairns Regional Council specify 2.0 m minimum for a footpath.
Bicycle path widths (Two-way):
� 2.4 m – Minimum width (Low use commuting and local access)
� 2.5 m – Regular use commuting and local access (20 km/h +)
� 3.0 m – Recommended width (Frequent and concurrent commuting (30 km/h +))
Bicycle path widths (One-way):
� 2.0 m – 3.0 m – Depending on peak hour volume (bicycle riders/hr)
Where there is on-street parking or vehicle operating speeds of >60 km/h adjacent to the cycle track, a minimum 1 m separator is recommended.
Indicative Cost: � Refer to Shared Paths Indicative Cost.
Technical References: � Austroads Part 6A – Pedestrian & Cyclist Paths
� FNQROC Development Manual – Design Guideline D1 Section D1.20
� TN128, Selection of Design of Cycle Tracks. This also includes design standards for separated intersection treatments including unsignalised, signals and roundabouts.
58

One-way cycle tracks on two-lane undivided road with parking
Two-way cycle track on two-lane undivided roadwith parking
59
ACTIVE TRANSPORT STRATEGY

5.6 Pedestrian NetworkIn addition to the cycle network, consideration needs to be given to the diverse needs of pedestrians. As pedestrians needs differ from those of a cyclist, their suitable network needs to be planned and designed differently.
Every trip involves walking but walking can also be undertaken as a trip by itself.
Walking can be a means to get from point A to point B, but many people walk for no purpose or with no specific destination i.e. purely for health and leisure.
The Cairns Cycling and Walking Strategy concentrates on trips as a means of transport but acknowledges that creating attractive and vibrant routes can encourage more people walking for a variety trip purposes including; recreation, fitness and “promenading” i.e. going for a leisurely stroll.
5.7 Pedestrian Network Design StandardsThe hierarchy approach to the pedestrian network considers place and movement functions. The place function forms part of the destination that users want to access. Once at their destination the user may undertake a number of non-transport related activities such as sitting, visiting cafes, and people watching or promenading. Therefore, the place needs to incorporate urban design and public realm improvements. On the other hand, the movement function is more transport focussed, requiring efficient and safe access to a destination, whilst still being attractive and comfortable.
In reference to pedestrians, it has commonly been accepted that a 400m (5 min) walk is reasonable. Determining a reasonable distance can be affected by factors such as location, topography, weather, pedestrian facilities, trip purpose and cultural factors. Recent studies show that people are willing to walk much greater distances, if the walking environment is favourable e.g. an average of 1.2km in good conditions. Research undertaken by Griffith University of actual walking distances (based on Household Travel Survey in Brisbane) indicate that on average, people walked from their home to the shops - 810m, to primary schools – 920m, to work 1.17km, to bus stops 600m and to train stations 1.04km (Burke & Brown, 2007).
The Household Travel Survey for Cairns reinforces this data, indicating that average duration of walking trips for all purposes is 1km (Queensland Government Department of Transport and Main Road, 2015).
It is recommended that a staged approach to implementation should be considered in Cairns, e.g. complete access streets within 400m, then 800m, 1200m etc. Increasing the catchment sizes allows a more favourable environment to be provided, encouraging people to walk further. This also allows Council to concentrate on more proximate locations and build out from there.
In addition to the above, Council should continue to provide footpaths based on the following road hierarchy function and requirements:
� Arterial/Sub arterial roads – 2m footpath on both sides of the road
� Collector and access streets – 2m footpath on one side of the road
It is recommended that there a provision for footpaths on both sides of the street, on all street types, should be considered on any identified access street, within 400m of an identified generator. When the footpath is only to be on one side of the street, decisions associated with ‘which side’ should take into consideration location of generators, crossing points and connectivity to existing footpaths.
60

5.8 Pedestrian Network HierarchyThe pedestrian network as presented in the mapping within Appendix D and the Implementation Plan (Appendix F) was developed using the Pedestrian Network Hierarchy. The below table details the proposed hierarchy of links, with a focus on identifying: ‘activity’ streets in main-street style activity centres (place function), pedestrian spines and ‘access’ streets within 400m of the pedestrian generator (movement function).
The design considerations and ideal facility types discussed are indicative and may vary based on site specific constraints and opportunities:
Description Function
Pedestrian Activity Streets � Create attractive places which encourage people to stay and move about
Pedestrian Spine � Key street or link providing access to and between major destinations
� Supports efficient movement for transport related trips
� May also be utilised for recreation or fitness-based trips
Pedestrian Access Streets � High quality streets surrounding major pedestrian generators or feeder route from residential areas
� Mix of users
� Comfort and safety a priority
� May also be utilised for recreation or fitness-based trips
Strategic Investigation Routes
� Opportunities for future links identified but require further investigation. E.g. disused rail lines or connections along or across creeks to create a short cut but further feasibility investigation required
61
ACTIVE TRANSPORT STRATEGY

5.9 Pedestrian Network Hierarchy and Requirements
Description Function Characteristics Design Considerations Ideal Facility Types*
Pedestrian Activity Streets
� Create attractive places which encourage people to stay and move about
� Comfort and amenity a priority
� Primarily provide access to the land uses adjacent
� Mix of users including shoppers and people with no particular purpose or destination (wanderers, window shoppers, recreation)
� Can also form a movement function due to the uses it will access but this function will be secondary to creating an attractive pleasant place
� Safe, continuous, obstruction free, clear path to be provided within total width on both sides of the road
� An environment that is conducive to people lingering/enjoying, including activated shop frontages, variety and good passive surveillance
� Pedestrian priority signal phasing (i.e. sequential) to walking speed at intersections (especially during peak periods including mid-day period)
� Kerb/ pram ramps at all crossing points.
� High intersection capacity (i.e. storage whilst waiting e.g. kerb build outs, wider crossing areas on pavement)
� Ideally vehicle access points (driveways) to be minimised where possible
� Path protected from elements (e.g. shade, shelter). Covered walkaways are desired at least continuous for one side of street
� Shade trees, streetscape treatments, street furniture and seating nodes.
� udio cues at traffic signals and tactile paving (TGSI) at hazard points such as kerb ramps)
� Active street frontage and mixed-use development preferred
� Way-finding, distance and points of interest signage
� Need to balance public transport provision and pedestrian movements (Bus stop facilities located on the kerb)
� Footpaths
� Shared Zones or Malls
62

Description Function Characteristics Design Considerations Ideal Facility Types*
Pedestrian Spine
� Key street or link providing access to and between major destinations
� Supports efficient movement for transport related trips
� May also be utilised for recreation or fitness based trips
� Primary transport route focussing on commuters, education or utility trips
� Most direct logical and convenient route
� Comfort a priority
� May include a number of facilities or nodes along the spine
� May include scenic routes along spine to take advantage of existing features
� Safe, continuous, obstruction free, clear path, with provision on both sides of the road
� Pedestrian signal phasing coordinated for reduced delays and ideally sequential to walking speed at intersections (especially during peak periods)
� Pedestrian crossing phases on all legs at signalised intersections
� Kerb / pram ramps at all crossing points.
� Pedestrian priority at mid-block crossings
� Reduced crossing distances at intersections (i.e. by providing kerb build outs or pedestrian refuges)
� Intermittent shade and shelter. Ideally street trees for shade majority of length
� Audio cues at traffic signals and tactile paving at hazard points (e.g. kerb ramps)
� Active frontages preferred for surveillance (mixed use or residential frontage – no blank walls/fences)
� Way-finding and distance signage provided at key locations
� Bus stop areas provided with seating and shade, however clear route still provided for pedestrians
� Footpaths
� Shared Zones or Malls
63
ACTIVE TRANSPORT STRATEGY

Description Function Characteristics Design Considerations Ideal Facility Types*
Pedestrian Access Streets
� High quality streets surrounding major pedestrian generators or feeder route from residential areas
� Mix of users
� Comfort and safety a priority
� May also be utilised for recreation or fitness based trips
� Access links to major pedestrian generator or feeder route from residential areas
� Mix of users
� Comfort and safety a priority
� Safe, continuous, obstruction free, clear path
� Pedestrian signal phasing coordinated for reduced delays (especially during peak periods) and in centres
� Pedestrian crossing phases on all legs at signalised intersections, particularly in centres
� Pedestrian priority at mid-block crossings
� Reduced crossing distances at intersections (i.e. by providing kerb build outs or pedestrian refuges)
� Kerb/ pram ramps at all crossing points
� Wide path free of barriers, ideally both sides of the road particularly if greater than collector streets (urban areas). In Activity centres, paths on both sides of the streets on all road classifications may be appropriate.
� Intermittent shade and shelter. Ideally street trees for shade majority of length
� Footpaths
� Shared Zones or Malls
Strategic Investigation Routes
� Opportunities for future links identified but require further investigation. E.g. disused rail lines or connections along or across creeks to create a short cut but further feasibility investigation required
� Once identified will have same characteristics as Pedestrian Spine or Access Street (depending on their final hierarchy designation)
� Once identified will have same design considerations as Pedestrian Spine or Access Street (depending on their final hierarchy designation)
� Once identified will have same facility types as Pedestrian Spine or Access Street (depending on their final hierarchy designation)
64
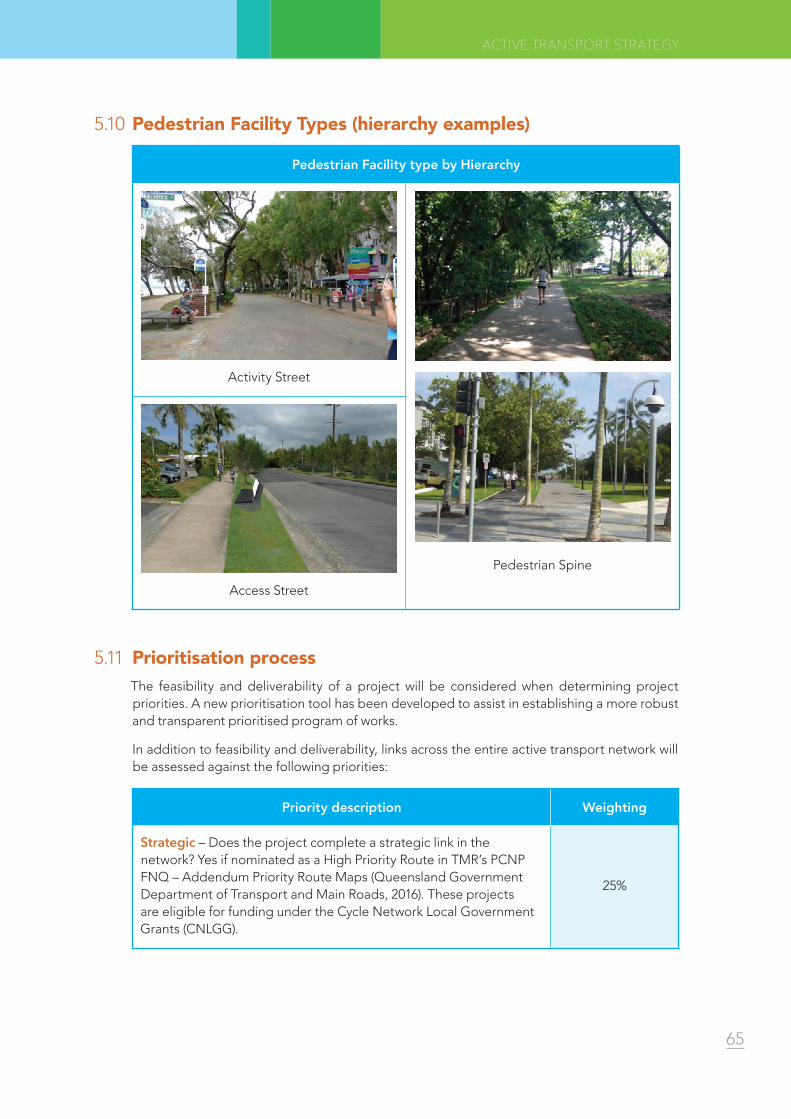
5.10 Pedestrian Facility Types (hierarchy examples)
Pedestrian Facility type by Hierarchy
Activity Street
Pedestrian Spine
Access Street
5.11 Prioritisation processThe feasibility and deliverability of a project will be considered when determining project priorities. A new prioritisation tool has been developed to assist in establishing a more robust and transparent prioritised program of works.
In addition to feasibility and deliverability, links across the entire active transport network will be assessed against the following priorities:
Priority description Weighting
Strategic – Does the project complete a strategic link in the network? Yes if nominated as a High Priority Route in TMR’s PCNP FNQ – Addendum Priority Route Maps (Queensland Government Department of Transport and Main Roads, 2016). These projects are eligible for funding under the Cycle Network Local Government Grants (CNLGG).
25%
65
ACTIVE TRANSPORT STRATEGY

Priority description Weighting
Safety – Does the link improve safety of the network? e.g. improves separation for cyclists and pedestrians on major roads, intersection improvements or provides a footpath on streets with high traffic volumes and speeds. Higher order streets such as Arterial and Sub-Arterial roads with no footpath have highest priority. Collector streets without any footpaths have second highest priority. Higher order streets such as arterial and sub-arterial roads with footpath on one side have priority. Then access streets and parks lowest priority.
25%
Connectivity – Does it provide connection to a key walk and cycle generator such as an activity centre, school or local shops? Yes – if project is within 1km of an activity centre or the link is within 400m from a generator.
20%
Demand – Is there demand for the link? Measured based on requests from the community via the Social Pinpoint engagement process undertaken for the project and other sources of requests.
15%
Network outcomes – Does it deliver walking and cycling outcomes? E.g., can serve a pedestrian and cycle route function.
10%
Opportunity – Can the project be delivered as part of other works, projects, or can it be implemented immediately? E.g. design complete and ready for delivery, can be delivered as part of a road or streetscape upgrade project
5%
NB – an assessment matrix will be used to score each route out of 100 to inform a priority list based on the above table.
Potential feasibility and deliverability of the project will always be considered when using the priority tool to create a detailed works program. Issues such as need for land acquisition, complex construction requirements, impacts on other users or environmental issues may impact the ease of which a project can be implemented and therefore should be considered in project staging.
The implementation plan developed has considered these challenges associated with staging when defining priorities to the specific project.
5.12 Network Implementation Plan The Network Implementation Plan (Appendix F) is a long term plan for the ultimate active transport network for Cairns, developed in collaboration with the community. Where previous strategies attempted to inform capital works program in a 10-20 year lifespan, this Network Implementation Plan is designed to allow Council the flexibility to deliver projects in a prioritised manner based on the funding available each year, until the ultimate network is achieved. The Network Implementation Plan will be reviewed every five years to ensure alignment with strategic outcomes and Council priorities.
The Network Implementation Plan (Appendix F) contains the following:
� Unique route identification number linked to GIS database allowing for ease of reference;66

� Route location, council division and approximate distance;
� Works category (new or renewal);
� Type of facility treatment recommended (off-road or on-road);
� Functional route hierarchy;
� Indicative cost;
� Responsible agency;
� Whether the route is part of the PCNP-FNQ; and
� Priority.
5.13 Cost estimatesThe ultimate active transport network for Cairns has been costed using rates from the Cairns Regional Council Local Government Infrastructure Plan which includes a contingency of 30% due to the strategic nature of this project. Full scoping of works and costs will be undertaken prior to implementation of any project and are subject to inflation. The unit rate costings have been updated and are contained in Appendix E.
A breakdown of costs according to each hierarchy category is below:
5.13.1 Indicative Overall Costs
Network Hierarchy Category Cost
Cycling Principal Route (eligible for CNLGG funding) $9,400,000*
Cycling Local Route $23,100,000
Cycling/ Pedestrian Strategic Investigation Route $23,300,000
Cycling Iconic Recreation Route $7,300,000
Pedestrian Access Street $60,000,000
Pedestrian Spine $6,700,000
Indicative Overall Cost $130,000,000
* 44% of principal routes are eligible for 50% TMR funding under CNLGG program, however funding is not guaranteed and therefore, costs are represented in full.
Council’s capital works program is subject to change and as such, this Strategy provides a framework to determine priorities on an objective level to allow alignment with budget variations. Renewal projects should ensure links meet the current design standards for construction (as detailed in 5.5) and new projects should be assessed at a regional level according to the priorisation process and the active transport outcomes they deliver. The advantage of the Network Implementation Plan is that it may be filtered by division providing elected members the information they require (e.g. costs) to inform decisions around discretionary budget expenditure and grant opportunities.
67
ACTIVE TRANSPORT STRATEGY
6. Glossary
Active Transport – a mode of travel for commuter, recreational or utility purposes by physically active means, such as walking, cycling, skating or scootering.
Bicycle – a vehicle with two or more wheels that is built to be propelled by human power through a belt, chain or gears.
Bicycle Awareness Zone (BAZ) – is a bicycle facility which is on the road carriageway and defined by the use of a yellow bicycle symbol to indicate bicycle riders may be in the area but does not provide exclusive space for bicycle riders.
Bicycle Lane – is an exclusive space for cyclists on the road carriageway, defined by white lines on either side, a white painted bicycle symbol and regulatory signage.
BikeEd – is a program that helps children to learn riding skills, road rules and how to identify hazards in the environment where they cycle in a safe and controlled learning environment.
Bikeway/Cycleway – a bicycle facility such as a shared path, bicycle only path or separated cycle track.
CRC – Cairns Regional Council.
Cyclist/bicycle rider – a person who is riding a bicycle.
Cycle Tourism – self-contained cycling trips for pleasure, adventure and autonomy rather than sport, commuting or exercise. Touring can range from single to multi day trips, even years. Tours may be planned by the participant or organised by a holiday business, a club or a charity as a fund-raising venture.
End of trip facilities – facilities located at the end of a journey that can encourage people to cycle or walk such as toilets, showers and lockers, as well as short term or longer-term secure bicycle parking.
FNQ – Far North Queensland.
Footpath – is a path which is off-road, generally in the road verge, which is provided for pedestrians. Footpaths are generally less than 2.5m wide. It is noted that in Queensland, bicycle riders are permitted to use the footpath.
LGA – Local Government Area.
Mid trip facilities – facilities that support users whilst undertaking their journey such as water fountains, rest spots, seating, shade, shelter and lighting.
Off-road – a bicycle facility is said to be off-road when it is located in the verge (i.e. road related area parallel to the road carriageway); through parks or reserves; or within public transport corridor or other public or private land not open to motor vehicle traffic.
On-road – a bicycle facility is said to be on-road when it forms part of the road carriageway such as a bicycle lane or a shoulder shared with parked vehicles.
Pedestrian – any person walking including a person driving a motorized wheelchair, a person in a non-motorised wheelchair, a person in or on a wheeled recreational device or wheeled toy.
QPWS – Queensland Parks and Wildlife Services.
68
Separated Cycle Track – is a bicycle facility for cyclists only which is physically separated from the motor vehicles either in the road verge (off road) or on the road carriageway (on road).
Separated Path – is a path which is off road and has separated space for pedestrians and cyclists, usually defined through line-marking and signage.
Shared Path – is a path which is off road and is shared space with pedestrians and cyclists. Min width for a shared path is 2.5m.
TMR – Department of Transport and Main Roads.
Walking Trail – for the purposes of this report, a walking trail is an unsurfaced track or trail in recreational or nature reserves, primarily used for walking but may be shared by mountain bike riders.
69
ACTIVE TRANSPORT STRATEGY
7. References
Australian Bicycle Council. (2017). National Cycling Participation Survey for Cairns.
Australian Bicycle Council. (2017). National Cycling Participation Survey for Cairns.
Australian Bureau of Statistics. (2016). Journey to Work.
Australian Government, Department of Infrastructure, Regional Development and Cities. (2017). Yearbook 2017, Progress in Australian Regions. Retrieved May 2019, from https://cancerqld.org.au/news/queensland-regions-hit-heavy-soaring-obesity-rates/
Bicycle Network. (2015, September). Super Tuesday Bike Commuter Count for Cairns Regional Council.
Bicycle Queensland. (2017). Cycle Queensland 2017 Adventure Tour.
Bicycle Queensland. (2018, February). Bike Boom Bring Massive Boost Tourism Dollars. Retrieved from https://bq.org.au/news/2018/02/bike-boom-bring-massive-boost-tourism-dollars/
Blackett, A., & van den Dool, D. (2016). Bicycle Parking Facilities: Updating the Austroads Guide to Traffic Management. Austroads Ltd. Retrieved from https://austroads.com.au/publications/active-travel/ap-r528-16/media/AP-R528-16-Bicycle_Parking_Facilities_Updating_Austroads_Guide_to_Traffi....pdf
Bureau of Infrastructure, Transport and Regional Economics. (March 2019). Australian Road Deaths Database: Fatalities. Retrieved from www.bitre.gov.au/statistics/safety/fatal_road_crash_database.aspx
Burke, M., & Brown, L. (2007). Distances People Walk for Transport, Road and Transport Research. Retrieved from Griffith University Research Repository: https://research-repository.griffith.edu.au/bitstream/handle/10072/17867/49100_1.pdf
Deloitte for Department of Transport and Main Roads. (2016). Active Towns Pilot Evaluation.
Fishman, E., Garrad, J., & Litman, T. (2011). Cost and Health Benefit of Active Transport in Queensland: Research and Review. Prepared by CATALYST for Health Promotion Queensland. Retrieved May 2019
Geller, R. (2009). Four Types of Cyclists. Portland Office of Transportation.
Hooper, P., Knuiman, M., Foster, S., & Giles-Corti, B. (2015). The building blocks of a ‘liveable neighbourhood’: Identifying the key performance for walking of an operaitonal planning policy in Perth, Western Australia. Heart Foundation - Healthy Active by Design.
Ipswich City Council. (2016, December). Active Transport Action Plan Technical Report. Retrieved from https://www.ipswich.qld.gov.au/__data/assets/pdf_file/0005/73706/iGO-Active-Transport-Action-Plan-Technical-Report.pdf
Mason. (2016). Cairns to reap over $3.5mil in benefits from mountain bike event. (C. Post, Interviewer)
National Heart Foundation of Australia. (2014). Move It - Australia’s Healthy Transport Options. Retrieved from https://www.heartfoundation.org.au/images/uploads/publications/Move-It-Australias-Healthy-Transport-Options.pdf70
Osmond, P., & Sharifi, E. (2017). Guide to Urban Cooling Strategies. Low Carbon Living CRS. Retrieved from http://www.lowcarbonlivingcrc.com.au/sites/all/files/publications_file_attachments/rp2024_guide_to_urban_cooling_strategies_2017_web.pdf
Queensland Government Department of Transport and Main Road. (2015). Household Travel Survey for Cairns.
Queensland Government Department of Transport and Main Roads. (2010). Cairns Bruce Highway Upgrade Master Plan. Retrieved from https://www.tmr.qld.gov.au/Projects/Name/C/Cairns-Bruce-Highway-Upgrade-master-plan
Queensland Government Department of Transport and Main Roads. (2015). Household Travel Survey for Cairns.
Queensland Government Department of Transport and Main Roads. (2016). Principal Cycle Network Plan Far North Queensland. Retrieved from https://www.tmr.qld.gov.au/Travel-and-transport/Cycling/Principal-Cycle-Network-Plans
Queensland Government Department of Transport and Main Roads. (2016). Qld Cycling Infrastructure Investment Strategy 2016-2026 and Business Case. Retrieved from https://blog.tmr.qld.gov.au/cycling/infographics
Queensland Government Department of Transport and Main Roads. (2017). Queensland Cycling Strategy 2017-2027.
Slavin, T. (2015, July 09). If there aren’t as many women cycling as men... you need better infrastructure. The Guardian.
Strategic Leisure Group for Cairns Regional Council. (2010). Cycling and Walking Strategy 2010-2030.
Benefits Infographic – ReferencesHealth
1. Source: https://ecf.com/news-and-events/news/how-cycling-makes-you-healthier-and-happier#_ftn1
2. Cycling Promotion Fund, Economic Benefits of Cycling for Australia, 2008 - data for 2006/07. Calculated using $198 per adult
3. Torrens University Australia, Social Health Atlases of Australia:Local Government Areas, 2018 (http://phidu.torrens.edu.au/social-health-atlases/data#social-health-atlases-of-australia-local-government-areas, published 2018 (based on 2016 ABS data)
4. Department Of Health, Australia’s Physical Activity and Sedentary Behaviour Guidelines, 2017 (Source: http://www.health.gov.au/internet/main/publishing.nsf/content/health-pubhlth-strateg-phys-act-guidelines)
Social
1. (Source: https://www.tmr.qld.gov.au/Travel-and-transport/Cycling/Benefits)
2. ABS Community Profile Cairns Regional Council 2016 (https://profile.id.com.au/cairns/car-ownership?BMID=10&WebID=150&SWebID=140)
Environmental
1. (Source: http://www.pedalpower.org.au/news/did-you-know-economic-overview-of-australian-cycling/) 71
ACTIVE TRANSPORT STRATEGY
Economic Benefits Infographic – ReferencesFor the individual
1. TMR, Qld Cycling Infrastructure Investment Strategy 2016-26 and Business Case, unpublished https://blog.tmr.qld.gov.au/cycling/infographics
2. Heart Foundation, 2014
For everyone
1. TMR, Qld Cycling Infrastructure Investment Strategy 2016-26 and Business Case, unpublished https://blog.tmr.qld.gov.au/cycling/infographics
For the region (through cycle tourism)
1. Mason, ‘Cairns to reap over $3.5mil in benefits from mountain bike event’ Cairns Post, 2016 https://www.cairnspost.com.au/news/cairns/cairns-to-reap-over-35-million-in-benefits-from-mountain-bike-event/news-story/73706b0489587e0a8f6cff70ebbfb22b
2. Bicycle Queensland, ‘Goondiwindi and western downs on show as 500 cyclists tour the region’, 2017 http://www.grc.qld.gov.au/documents/42283202/42625214/Goondiwinid%20and%20western%20downs%20on%20show%20as%20500%20riders%20tour%20the%20region.pdf
72