active rectifier in microgrid - ntnu · active rectifier in microgrid mini-project 15a 1 table ......
TRANSCRIPT

03.09.2012
Active Rectifier in Microgrid
- Developing a simulation model in SimPower
- Dimensioning the filter
- Current controller comparison
- Calculating average losses in the diodes and transistors
Kristiansen Baricuatro
Sergey Klyapovskiy
Umair Ashraf
Emmanuel Omede
MSc in Electric Power Engineering
TET4190 Power Electronics for Renewable Energy
Supervisors: Tore Undeland (NTNU)
Roy Nilsen (Wärtsilä)
Mini-project 15a
Project Group N
Faculty of IME

PREFACE
This report was written by four students from NTNU, for the mini-project for the course TET4190 Power Electronics for Renewable Energy. The report describes the project’s background, its objectives, the methods used to achieve these objectives and the results of these efforts. We chose this project because it tackles many interesting parts within the power electronic field. In addition to learning more about converters and control methods, the task gave us an opportunity to learn how to use a Simulink toolbox, SimPower. The project is carried out in the period September to October 2012. We wish to thank Wärtsilä and Roy Nilsen for giving us the opportunity to work with them, and be granted the guidance that we needed. At NTNU, we want to thank our supervisor, Professor Tore Undeland for his supervision and guidance during the project.
Trondheim, 03.09.2012

Active Rectifier in Microgrid
Mini-project 15a 1
Table of Contents
1 ABSTRACT ...................................................................................................................... 2
2 INTRODUCTION ............................................................................................................. 3
2.1 Structure and content of the report .................................................................................................................... 3 2.2 Problem formulation ................................................................................................................................................ 3 2.3 Why wartsila wants to work with the problem .............................................................................................. 3 2.4 Objectives of the project .......................................................................................................................................... 3
3 THEORY ......................................................................................................................... 4
3.1 Microgrid ....................................................................................................................................................................... 4 3.2 Inverter .......................................................................................................................................................................... 4 3.3 Current controller analysis .................................................................................................................................... 5
3.3.1 PI PWM Current Controller. ............................................................................................................................................... 5 3.3.2 Hysteresis Current Controller ........................................................................................................................................... 6
3.4 LCL Filter ....................................................................................................................................................................... 6
4 CALCULATIONS .............................................................................................................. 7
4.1 Dimensioning the filter ...................................................................................................................................... 7 4.2 Calculating average power loss in the diodes and the transistors .......................................................... 8
4.2.1 Switching losses ....................................................................................................................................................................... 8 4.2.2 Conduction losses ................................................................................................................................................................... 8
5 SIMULATION ................................................................................................................ 10
5.1 The model ................................................................................................................................................................... 10 5.2 Results .......................................................................................................................................................................... 13
5.2.1 PI PWM Current Controller with fs = 20 kHz ........................................................................................................... 13 5.2.2 Hysteresis Current Controller with fs = 20 kHz ...................................................................................................... 15 5.2.3 Comparisons ........................................................................................................................................................................... 17
6 CONCLUSION ............................................................................................................... 19
7 REFERENCES ................................................................................................................ 20
8 LISTS OF FIGURES, TABLES AND ABBREVIATIONS .......................................................... 20
9 APPENDIX .................................................................................................................... 21

Active Rectifier in Microgrid
Mini-project 15a 2
1 ABSTRACT
Renewable Energy sources are usually to be looked upon as Distributed Energy Resources (DER). They
have to be integrated into a local energy network; the Microgrid. An inverter (DC/AC-converter) is used
to connect this system to the utility grid.
Two simulation models of such an inverter have been made: One with a PI-current controller and the
other with a hysteresis current controller. Both current control techniques had been studied and analyzed
through theory and simulation.
Calculations had been made to dimension a LCL filter for the system and to find the average losses in the
diode and transistors.

Active Rectifier in Microgrid
Mini-project 15a 3
2 INTRODUCTION This chapter will present the objectives and requirements of the project.
2.1 STRUCTURE AND CONTENT OF THE REPORT
The report is based on theoretical presentations and simulations on two different kinds of current controllers. Introductory chapters present the task. Chapter 3 gives a theoretical presentation of inverters and current controllers. Chapter 4 deals with calculations. Chapter 5 deals with the main part of the project which is the simulations. The final chapter is devoted to conclusion. Attached zip-file or CD contains data sheet, simulation results, SimPower models and matlab files.
2.2 PROBLEM FORMULATION The desire for increasing their efficiency and reducing the harmful emissions lead to the widely spreading and applying of small-scale generators, which are commonly called distributed generation (DG) units. The attempt to realize the DG potential has led to the appearance of “Microgrid” concept. The main characteristics of Microgrid concept are: It is a local scale power system with DG units, which produces electrical or thermal energy to the local system demand. It can provide power supplies to the customers with multiple load locations. It creates the possibility of seamless crossing between grid-connected mode and autonomous operation (island mode). It increases the power quality and system reliability. In addition, it provides significant control capabilities over the network operation. Different types of DG units could have different output nature, than the network which they are supposed to work with. Since the existing Microgrids are operating as AC systems, we need to use power electronic interfaces in order to connect DG units.
2.3 WHY WARTSILA WANTS TO WORK WITH THE PROBLEM Wärtsilä is a global leader in complete lifecycle power solutions for the marine and energy
markets. Since Wärtsilä is integrating DG units on ships and their power plants are based on
renewable energy, they need to use power electronics to connect and control DG units.
2.4 OBJECTIVES OF THE PROJECT
During the Miniproject, a simulation model of Inverter for 230 Vac and 20 kW should be created
using SimPower. To keep voltage ripples on acceptable level, the parameters of LCL-filter should
be chosen. The project group will also compare the behavior of a PWM-modulator with a PI-
current controller with the behavior of a hysteresis current-controller and calculate the average
losses in the diode and transistors.
Active Rectifier in Microgrid
Mini-project 15a 4
3 THEORY
3.1 MICROGRID
A microgrid is power supply network which is designed to provide power to a certain area. It also can
provide the power to centralized grid. Generators and loads are connected at low voltage in micro grid.
Sources of power generation related to microgrid are usually renewable energy. The power we get from
the renewable energy sources is mostly DC power, so to operate our load which is AC driven we need
inverters. Inverters are thus essential part to get energy from renewable energy sources.
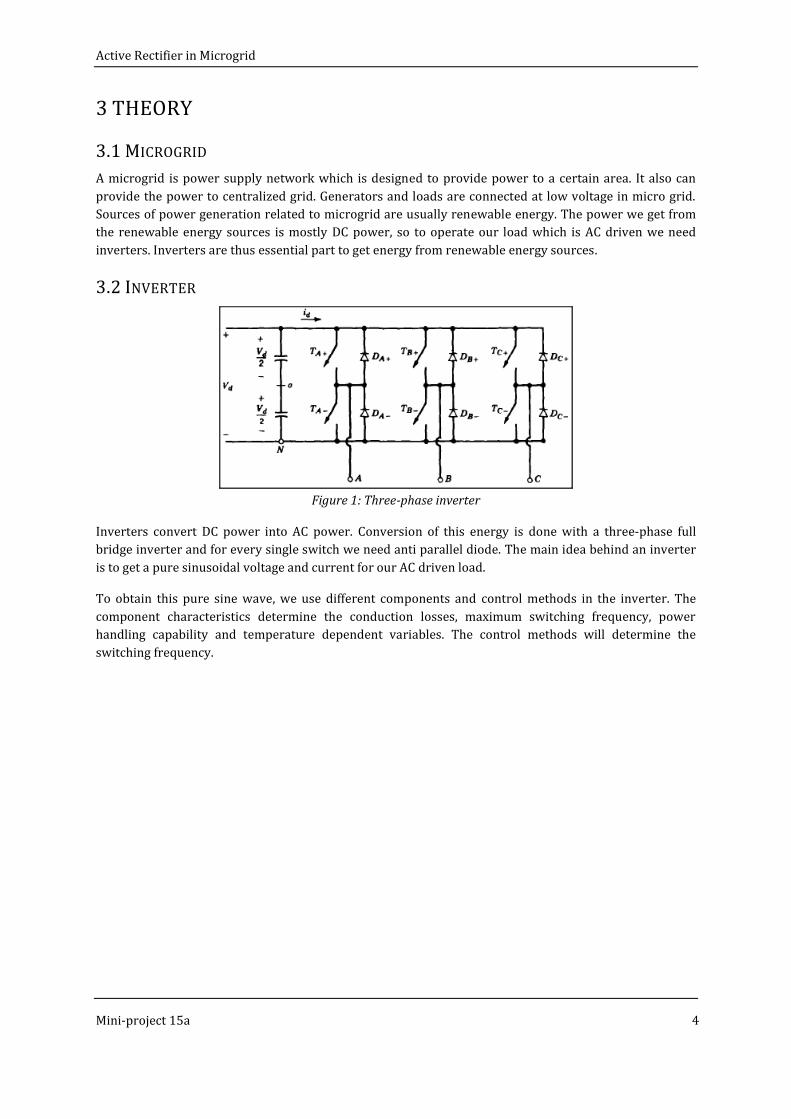
3.2 INVERTER
Figure 1: Three-phase inverter
Inverters convert DC power into AC power. Conversion of this energy is done with a three-phase full
bridge inverter and for every single switch we need anti parallel diode. The main idea behind an inverter
is to get a pure sinusoidal voltage and current for our AC driven load.
To obtain this pure sine wave, we use different components and control methods in the inverter. The
component characteristics determine the conduction losses, maximum switching frequency, power
handling capability and temperature dependent variables. The control methods will determine the
switching frequency.
Active Rectifier in Microgrid
Mini-project 15a 5
3.3 CURRENT CONTROLLER ANALYSIS
For high performing three phase AC drives, the current controlling technique is of great importance as the characteristics of the inverter such as the switching frequency, level of harmonic distortion and the measure of dynamics in the output response. Two techniques are discussed, PI PWM current controller (linear) and the Hysteresis PWM current controller (non-linear).
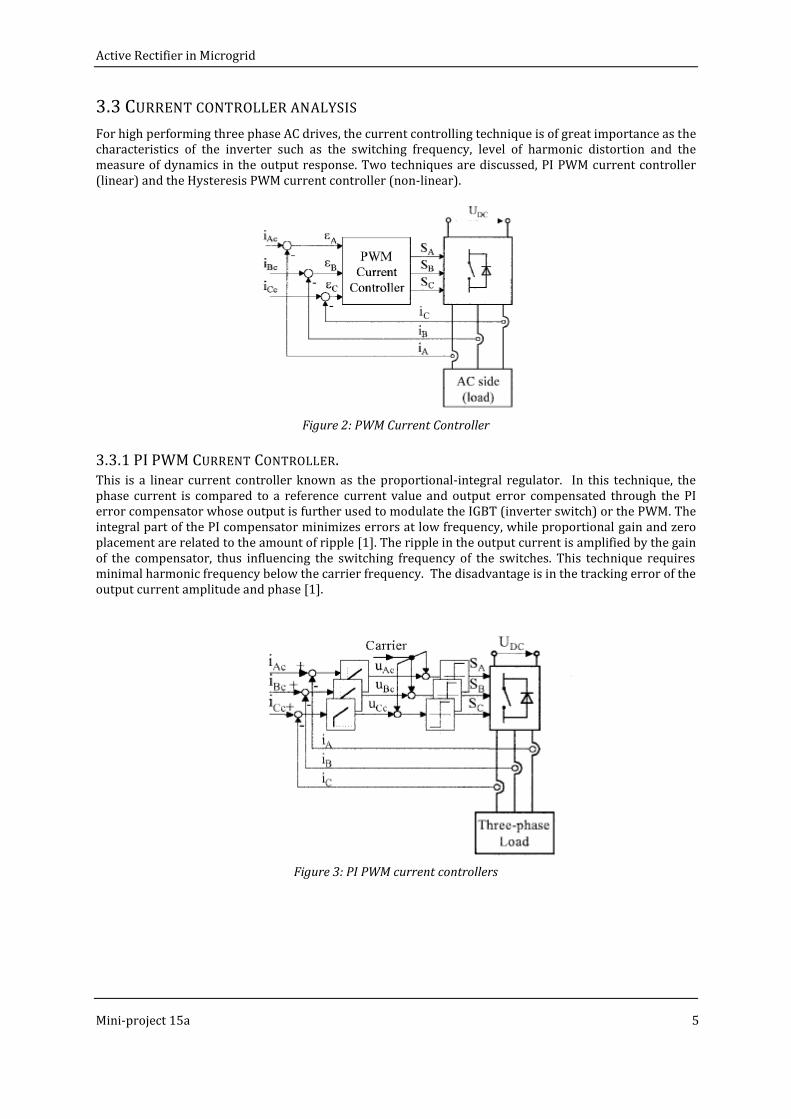
Figure 2: PWM Current Controller
3.3.1 PI PWM CURRENT CONTROLLER. This is a linear current controller known as the proportional-integral regulator. In this technique, the phase current is compared to a reference current value and output error compensated through the PI error compensator whose output is further used to modulate the IGBT (inverter switch) or the PWM. The integral part of the PI compensator minimizes errors at low frequency, while proportional gain and zero placement are related to the amount of ripple [1]. The ripple in the output current is amplified by the gain of the compensator, thus influencing the switching frequency of the switches. This technique requires minimal harmonic frequency below the carrier frequency. The disadvantage is in the tracking error of the output current amplitude and phase [1].
Figure 3: PI PWM current controllers
Active Rectifier in Microgrid
Mini-project 15a 6
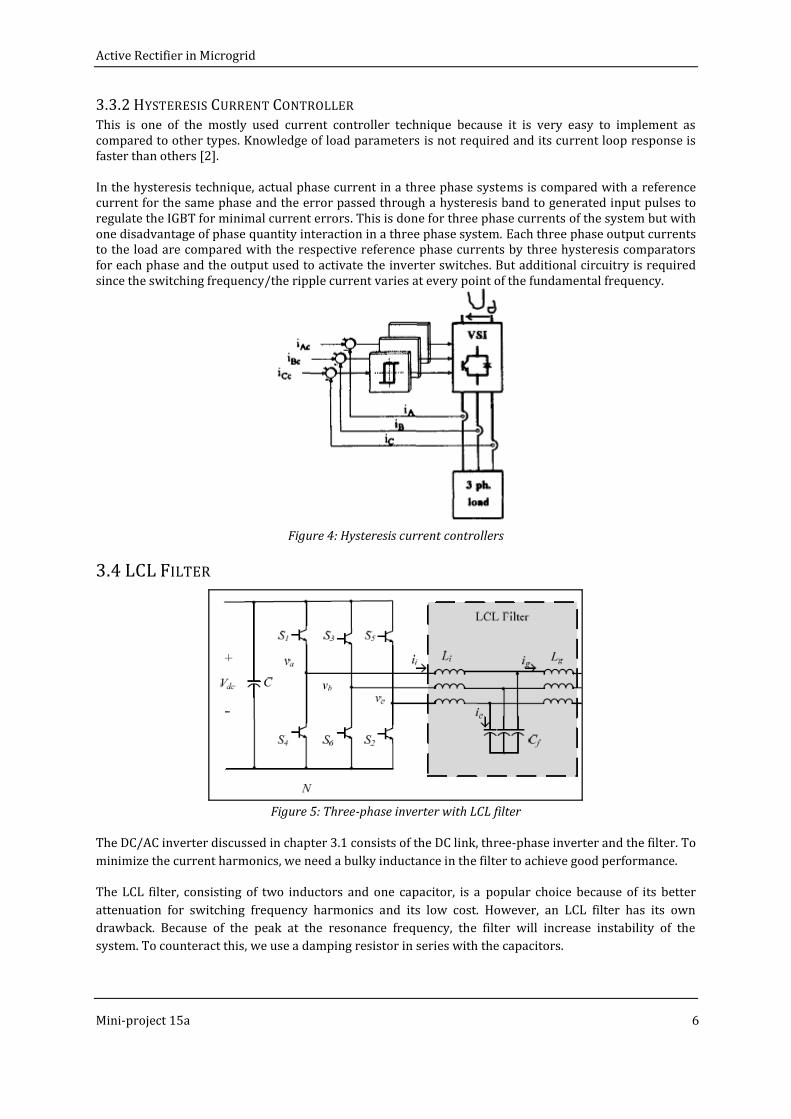
3.3.2 HYSTERESIS CURRENT CONTROLLER This is one of the mostly used current controller technique because it is very easy to implement as compared to other types. Knowledge of load parameters is not required and its current loop response is faster than others [2]. In the hysteresis technique, actual phase current in a three phase systems is compared with a reference current for the same phase and the error passed through a hysteresis band to generated input pulses to regulate the IGBT for minimal current errors. This is done for three phase currents of the system but with one disadvantage of phase quantity interaction in a three phase system. Each three phase output currents to the load are compared with the respective reference phase currents by three hysteresis comparators for each phase and the output used to activate the inverter switches. But additional circuitry is required since the switching frequency/the ripple current varies at every point of the fundamental frequency.
Figure 4: Hysteresis current controllers
3.4 LCL FILTER
Figure 5: Three-phase inverter with LCL filter
The DC/AC inverter discussed in chapter 3.1 consists of the DC link, three-phase inverter and the filter. To
minimize the current harmonics, we need a bulky inductance in the filter to achieve good performance.
The LCL filter, consisting of two inductors and one capacitor, is a popular choice because of its better
attenuation for switching frequency harmonics and its low cost. However, an LCL filter has its own
drawback. Because of the peak at the resonance frequency, the filter will increase instability of the
system. To counteract this, we use a damping resistor in series with the capacitors.

Active Rectifier in Microgrid
Mini-project 15a 7
4 CALCULATIONS
4.1 DIMENSIONING THE FILTER
When dimensioning the LCL filter, the following should be kept in mind. The total inductance should be
large to have lower harmonic distortion, but it will also slow down the system response. It is also
important to keep in mind that inductance size is proportional to the cost. To have a high power factor,
the capacitor should not be too large since it absorbs reactive power. The damping resistor should not be
too large since it would produce huge power loss.
First a suitable overall inductance value Ls is chosen: [3]
√
√
Where Em is the peak voltage of the grid, Im is the peak current of the grid, fsw is the switching frequency,
and iripple is the current ripple. Since we want a low value of Ls for cost reasons, we will use the minimum
boundary.
The capacitance Cf is then chosen: [3]
Where q is the percent reactive power we want absorbed, fn is the grid frequency, En is the rms value of
the phase voltage, and Pn is the rated power produced by the inverter.
The value of the two inductances L1 and L2 is dictated by a ratio r:
The resonance frequency fres should be check if it is suitable:
√( )
Lastly, the damping resistor is calculated: [3]
Active Rectifier in Microgrid
Mini-project 15a 8
4.2 CALCULATING AVERAGE POWER LOSS IN THE DIODES AND THE TRANSISTORS
The IGBT and Diode power losses (Pi), can be divided into two groups: the conduction losses (Pcond) and the switching losses (Psw).
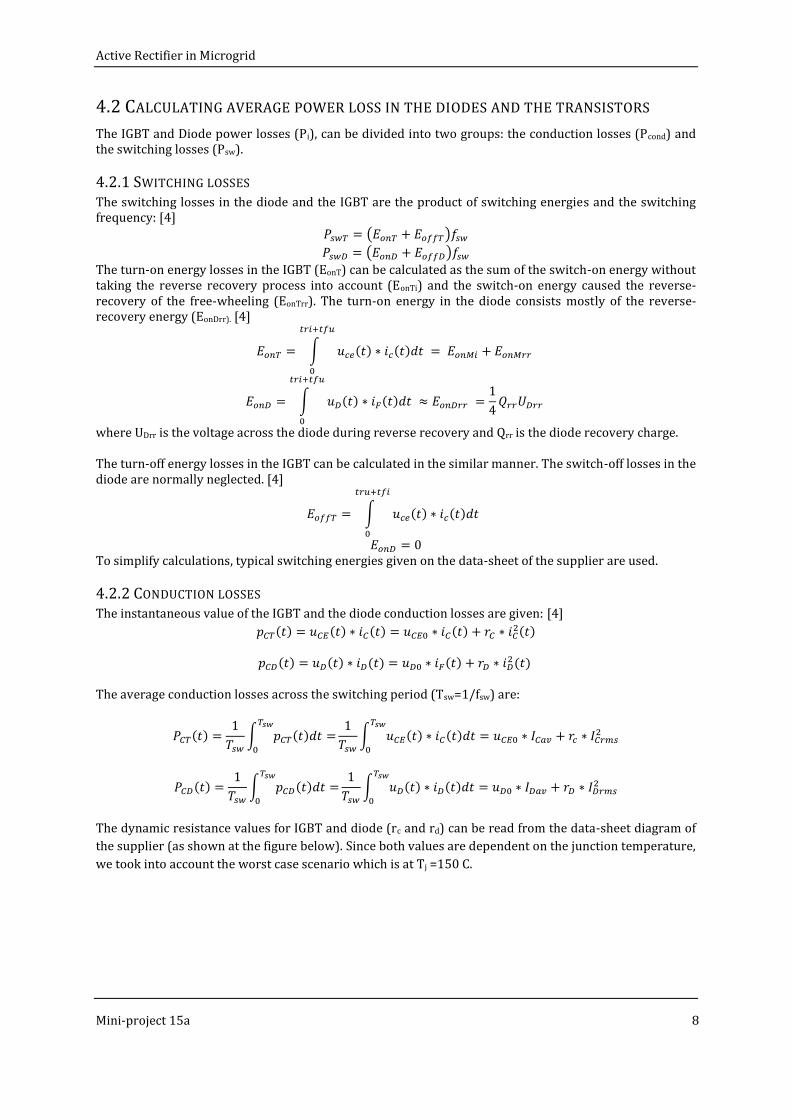
4.2.1 SWITCHING LOSSES The switching losses in the diode and the IGBT are the product of switching energies and the switching frequency: [4]
( )
( )
The turn-on energy losses in the IGBT (EonT) can be calculated as the sum of the switch-on energy without taking the reverse recovery process into account (EonTi) and the switch-on energy caused the reverse-recovery of the free-wheeling (EonTrr). The turn-on energy in the diode consists mostly of the reverse-recovery energy (EonDrr). [4]
∫ ( ) ( )
∫ ( ) ( )
where UDrr is the voltage across the diode during reverse recovery and Qrr is the diode recovery charge. The turn-off energy losses in the IGBT can be calculated in the similar manner. The switch-off losses in the diode are normally neglected. [4]
∫ ( ) ( )
To simplify calculations, typical switching energies given on the data-sheet of the supplier are used.
4.2.2 CONDUCTION LOSSES The instantaneous value of the IGBT and the diode conduction losses are given: [4]
( ) ( ) ( ) ( ) ( )
( ) ( ) ( ) ( ) ( )
The average conduction losses across the switching period (Tsw=1/fsw) are:
( )
∫ ( )
∫ ( ) ( )
( )
∫ ( )
∫ ( ) ( )
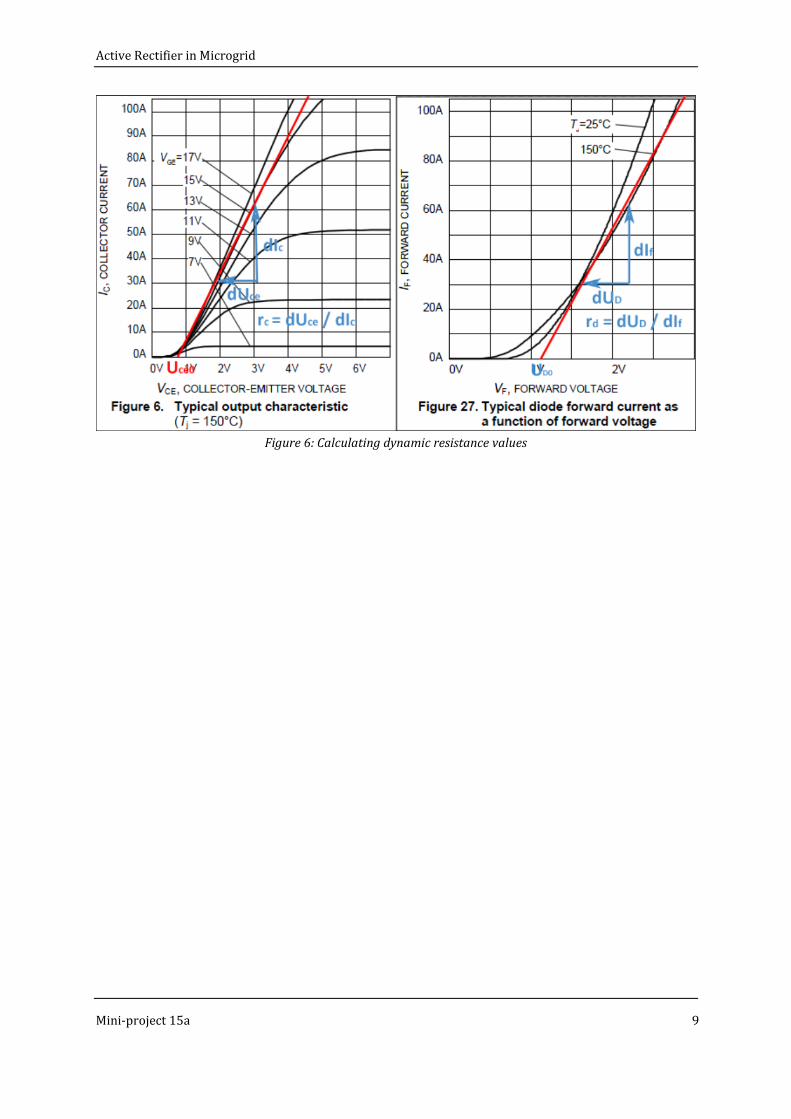
The dynamic resistance values for IGBT and diode (rc and rd) can be read from the data-sheet diagram of
the supplier (as shown at the figure below). Since both values are dependent on the junction temperature,
we took into account the worst case scenario which is at Tj =150 C.
Active Rectifier in Microgrid
Mini-project 15a 9
Figure 6: Calculating dynamic resistance values
Active Rectifier in Microgrid
Mini-project 15a 10
5 SIMULATION
5.1 THE MODEL
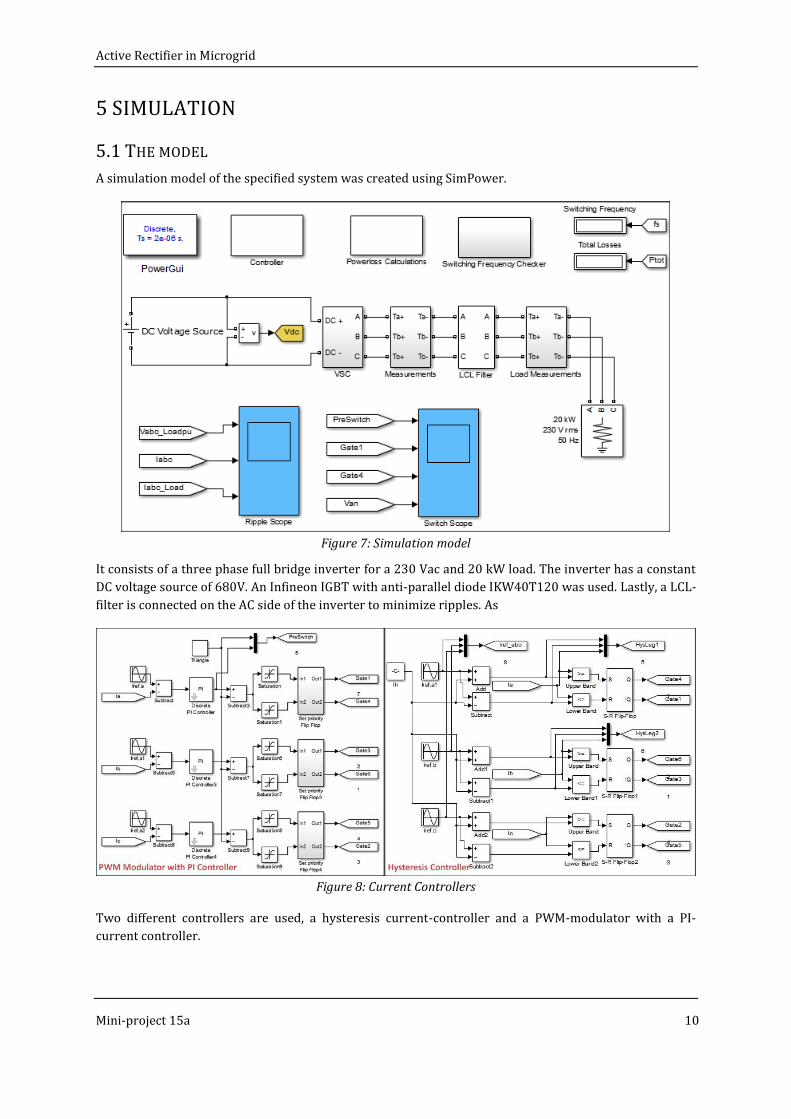
A simulation model of the specified system was created using SimPower.
Figure 7: Simulation model
It consists of a three phase full bridge inverter for a 230 Vac and 20 kW load. The inverter has a constant
DC voltage source of 680V. An Infineon IGBT with anti-parallel diode IKW40T120 was used. Lastly, a LCL-
filter is connected on the AC side of the inverter to minimize ripples. As
Figure 8: Current Controllers
Two different controllers are used, a hysteresis current-controller and a PWM-modulator with a PI-
current controller.
Active Rectifier in Microgrid
Mini-project 15a 11
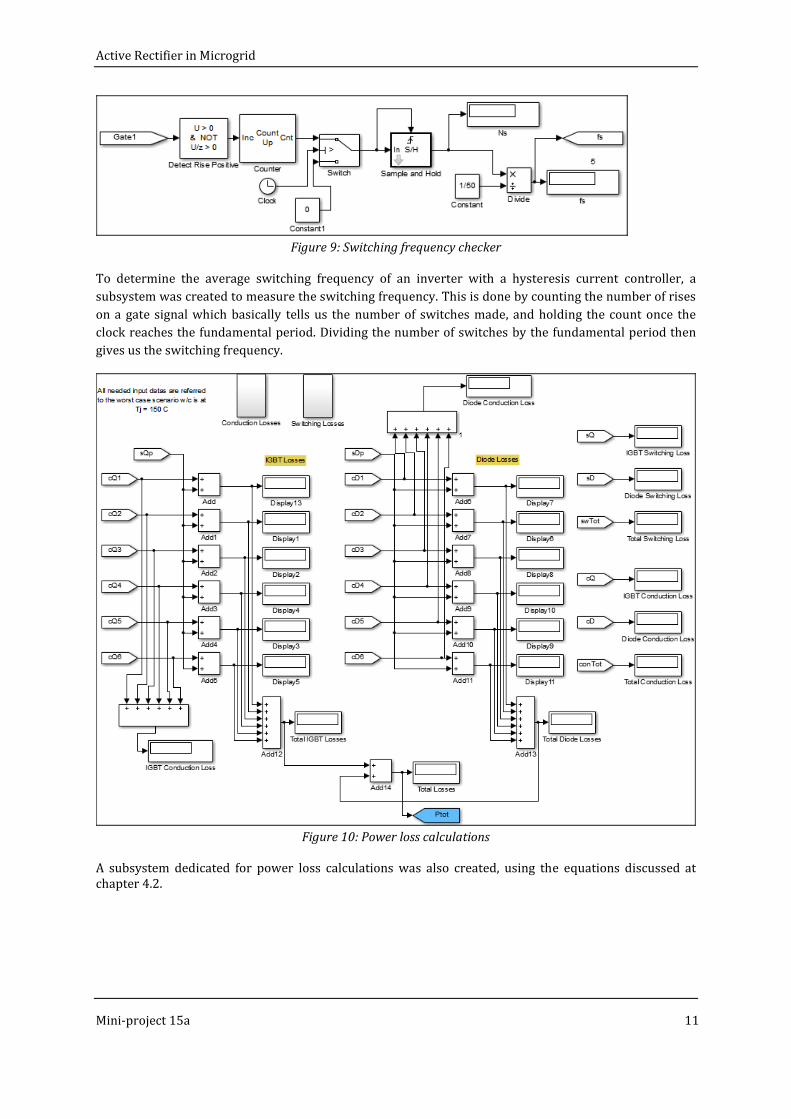
Figure 9: Switching frequency checker
To determine the average switching frequency of an inverter with a hysteresis current controller, a
subsystem was created to measure the switching frequency. This is done by counting the number of rises
on a gate signal which basically tells us the number of switches made, and holding the count once the
clock reaches the fundamental period. Dividing the number of switches by the fundamental period then
gives us the switching frequency.
Figure 10: Power loss calculations
A subsystem dedicated for power loss calculations was also created, using the equations discussed at chapter 4.2.
Active Rectifier in Microgrid
Mini-project 15a 12
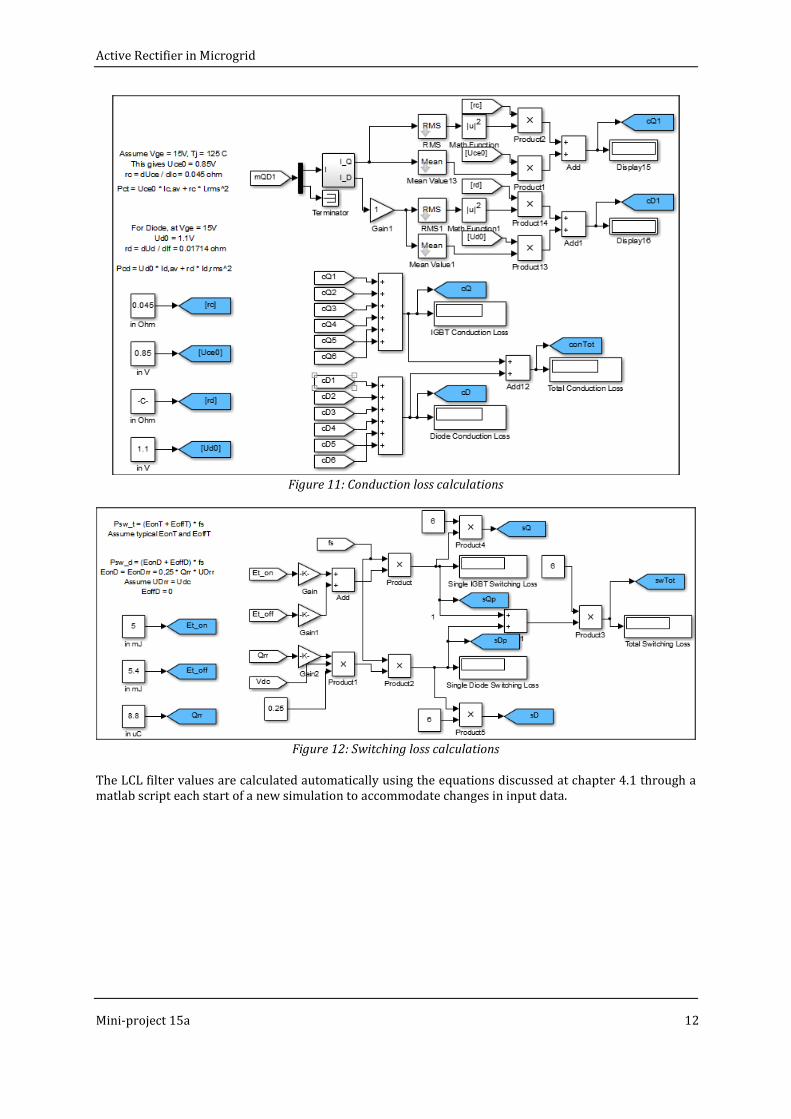
Figure 11: Conduction loss calculations
Figure 12: Switching loss calculations
The LCL filter values are calculated automatically using the equations discussed at chapter 4.1 through a matlab script each start of a new simulation to accommodate changes in input data.
Active Rectifier in Microgrid
Mini-project 15a 13
5.2 RESULTS
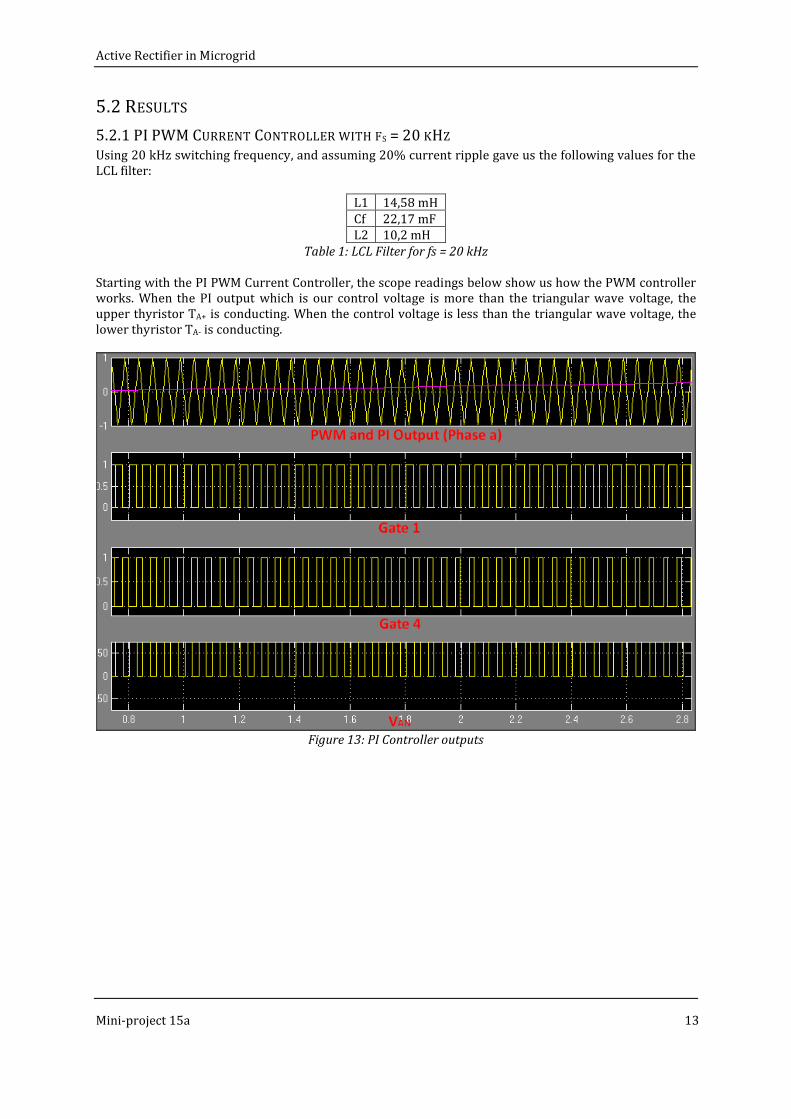
5.2.1 PI PWM CURRENT CONTROLLER WITH FS = 20 KHZ Using 20 kHz switching frequency, and assuming 20% current ripple gave us the following values for the LCL filter:
L1 14,58 mH Cf 22,17 mF L2 10,2 mH
Table 1: LCL Filter for fs = 20 kHz Starting with the PI PWM Current Controller, the scope readings below show us how the PWM controller works. When the PI output which is our control voltage is more than the triangular wave voltage, the upper thyristor TA+ is conducting. When the control voltage is less than the triangular wave voltage, the lower thyristor TA- is conducting.
Figure 13: PI Controller outputs
Active Rectifier in Microgrid
Mini-project 15a 14
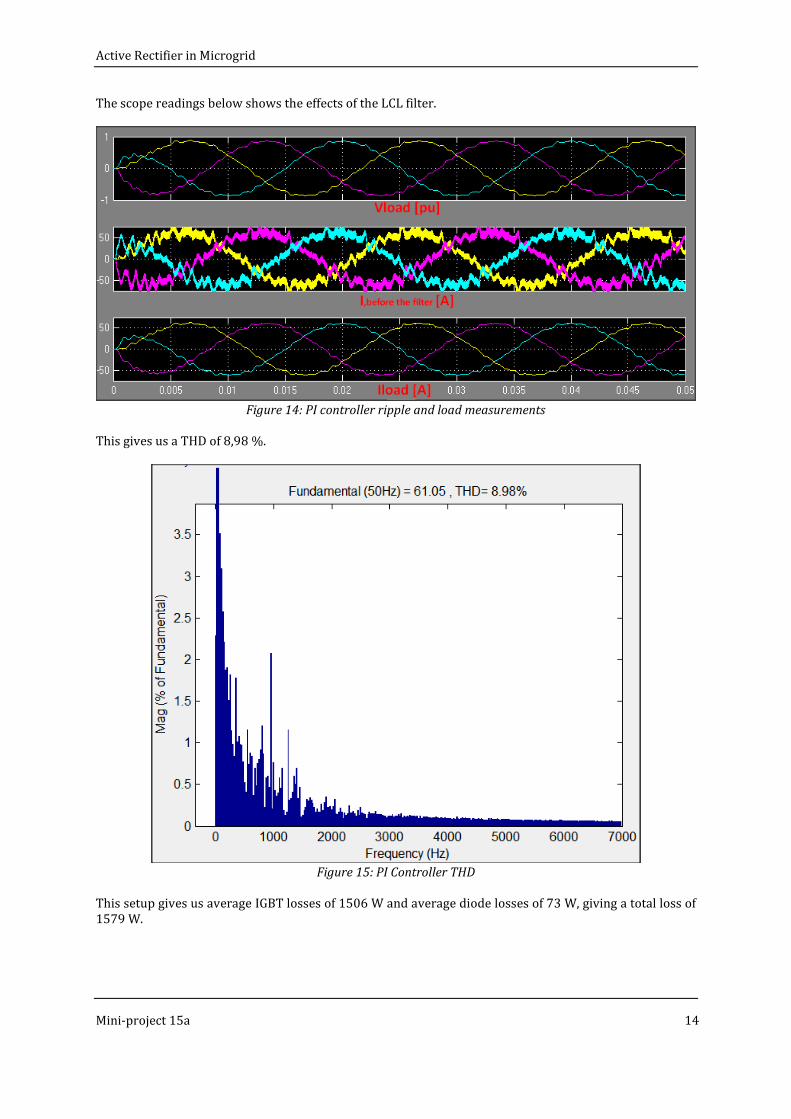
The scope readings below shows the effects of the LCL filter.
Figure 14: PI controller ripple and load measurements
This gives us a THD of 8,98 %.
Figure 15: PI Controller THD
This setup gives us average IGBT losses of 1506 W and average diode losses of 73 W, giving a total loss of 1579 W.
Active Rectifier in Microgrid
Mini-project 15a 15
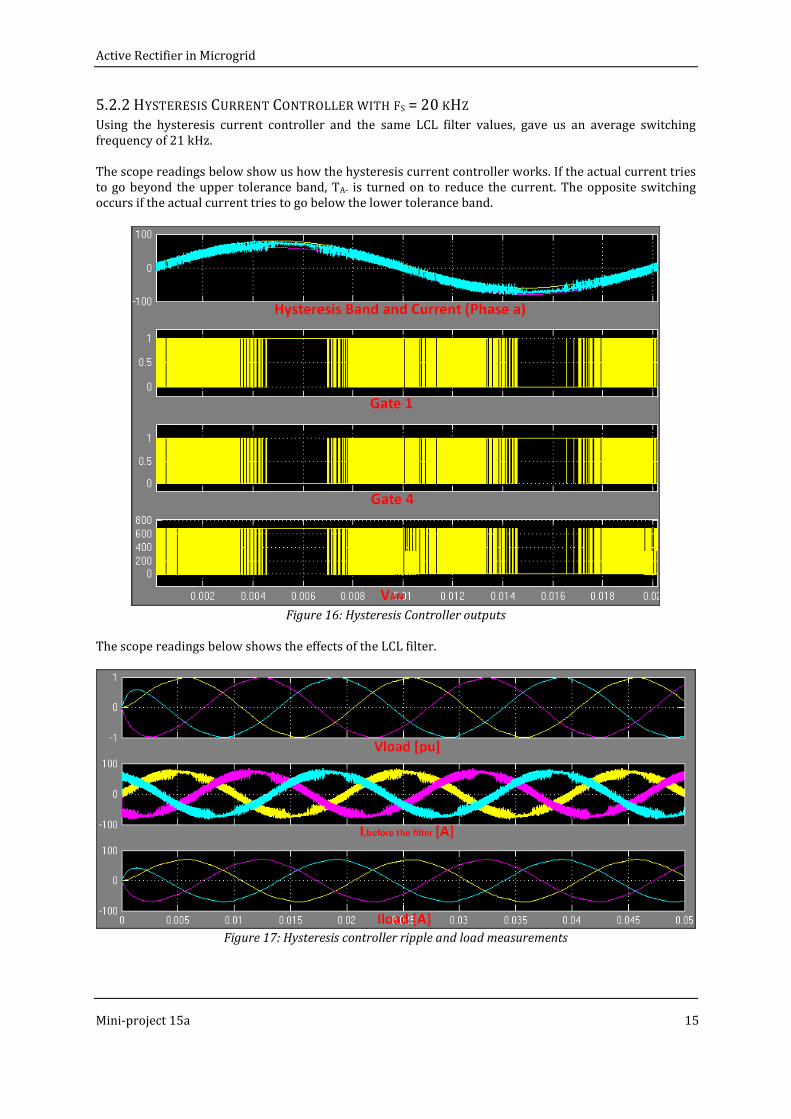
5.2.2 HYSTERESIS CURRENT CONTROLLER WITH FS = 20 KHZ Using the hysteresis current controller and the same LCL filter values, gave us an average switching frequency of 21 kHz. The scope readings below show us how the hysteresis current controller works. If the actual current tries to go beyond the upper tolerance band, TA- is turned on to reduce the current. The opposite switching occurs if the actual current tries to go below the lower tolerance band.
Figure 16: Hysteresis Controller outputs
The scope readings below shows the effects of the LCL filter.
Figure 17: Hysteresis controller ripple and load measurements
Active Rectifier in Microgrid
Mini-project 15a 16
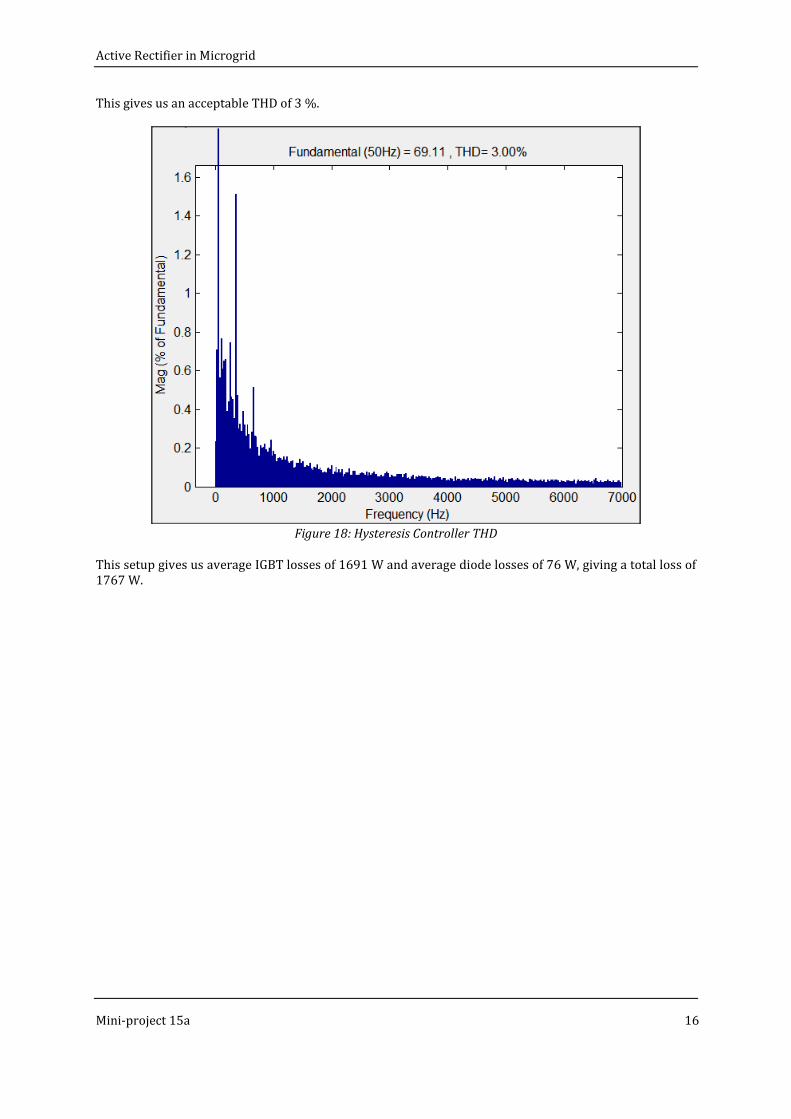
This gives us an acceptable THD of 3 %.
Figure 18: Hysteresis Controller THD
This setup gives us average IGBT losses of 1691 W and average diode losses of 76 W, giving a total loss of 1767 W.
Active Rectifier in Microgrid
Mini-project 15a 17
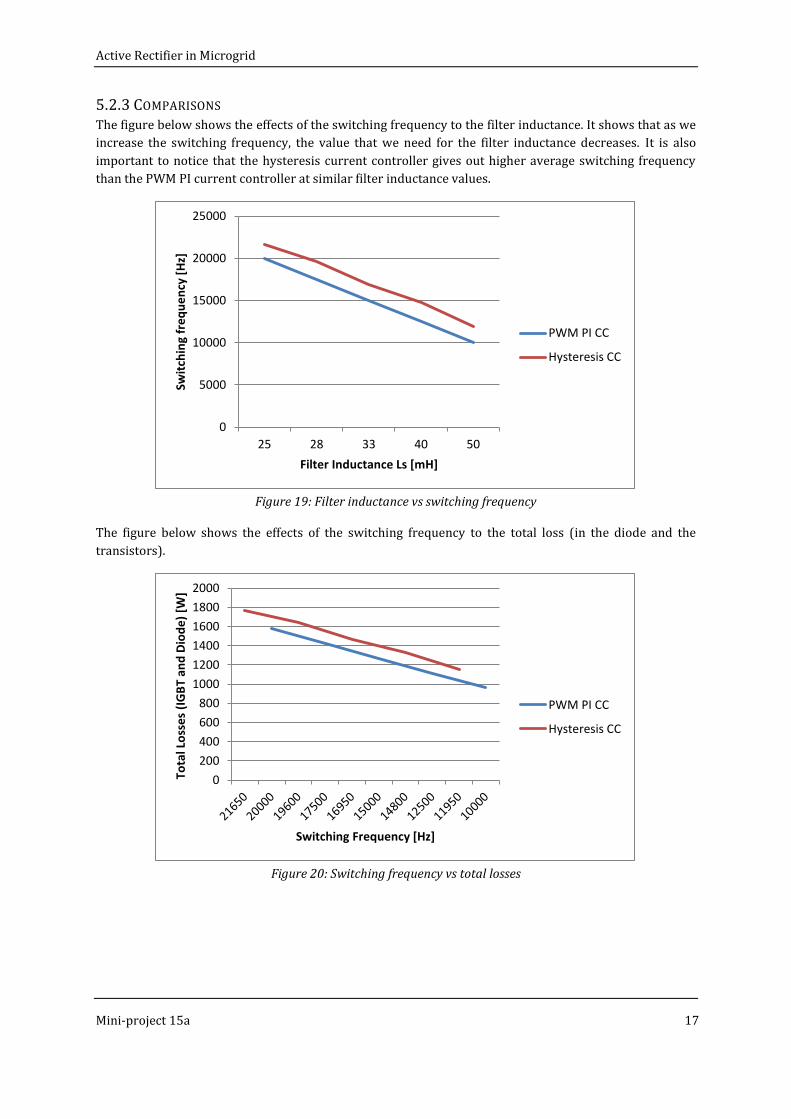
5.2.3 COMPARISONS The figure below shows the effects of the switching frequency to the filter inductance. It shows that as we
increase the switching frequency, the value that we need for the filter inductance decreases. It is also
important to notice that the hysteresis current controller gives out higher average switching frequency
than the PWM PI current controller at similar filter inductance values.
Figure 19: Filter inductance vs switching frequency
The figure below shows the effects of the switching frequency to the total loss (in the diode and the
transistors).
Figure 20: Switching frequency vs total losses
0
5000
10000
15000
20000
25000
25 28 33 40 50
Swit
chin
g fr
eq
ue
ncy
[H
z]
Filter Inductance Ls [mH]
PWM PI CC
Hysteresis CC
0
200
400
600
800
1000
1200
1400
1600
1800
2000
Tota
l Lo
sse
s (I
GB
T an
d D
iod
e)
[W]
Switching Frequency [Hz]
PWM PI CC
Hysteresis CC
Active Rectifier in Microgrid
Mini-project 15a 18
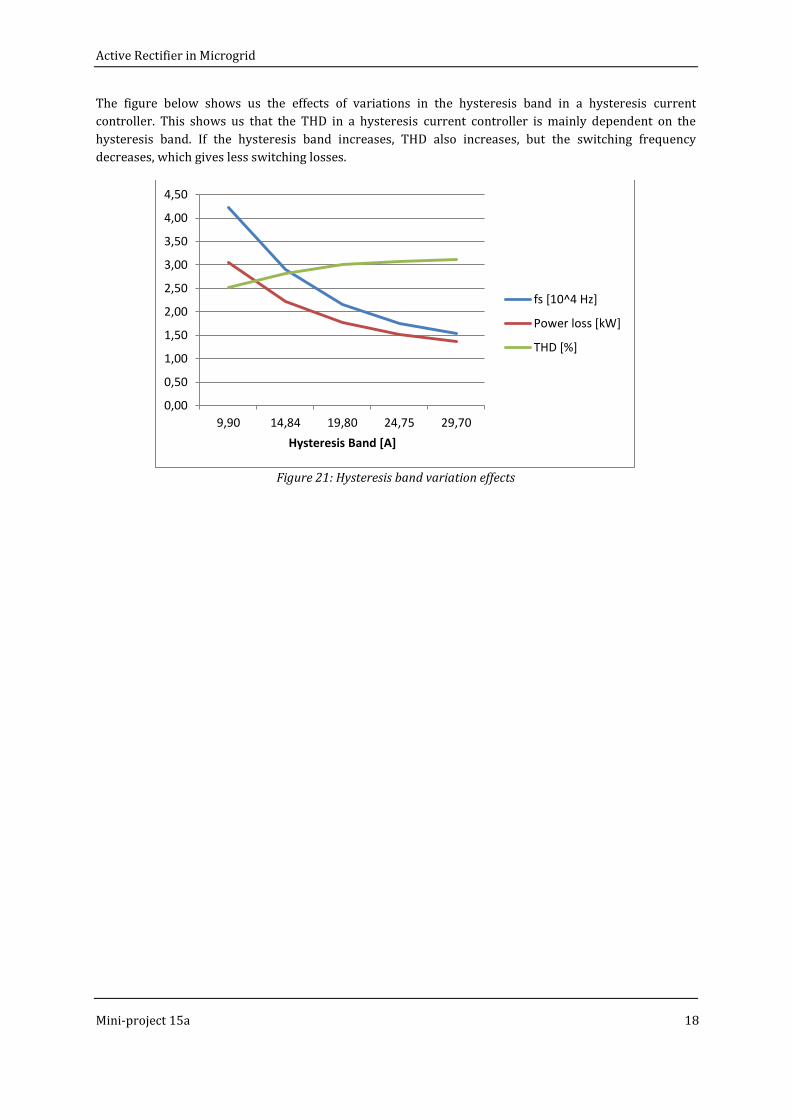
The figure below shows us the effects of variations in the hysteresis band in a hysteresis current
controller. This shows us that the THD in a hysteresis current controller is mainly dependent on the
hysteresis band. If the hysteresis band increases, THD also increases, but the switching frequency
decreases, which gives less switching losses.
Figure 21: Hysteresis band variation effects
0,00
0,50
1,00
1,50
2,00
2,50
3,00
3,50
4,00
4,50
9,90 14,84 19,80 24,75 29,70
Hysteresis Band [A]
fs [10^4 Hz]
Power loss [kW]
THD [%]

Active Rectifier in Microgrid
Mini-project 15a 19
6 CONCLUSION Current control techniques can be divided into two groups: linear (PI Controller) and non-linear
controllers (Hysteresis CC). The basic principles of these techniques have been described in the report.
Both have its advantages and limitations.
The advantage of the PI controller is that it gives out constant switching frequency, which provides a
stable operation of the inverter. The main disadvantage of this technique is an inherent tracking
(amplitude and phase) error.
The advantage of the hysteresis band controller lies in its simplicity and its providing of excellent
dynamic performance. On the other hand, the disadvantage is that the switching frequency varies,
providing irregular operation of the inverter. As a result the switching losses are increased.
In addition to studying the two current control techniques, the project group also studied how to
dimension a LCL filter and how to calculate power losses in the IGBT and the diode.

Active Rectifier in Microgrid
Mini-project 15a 20
7 REFERENCES
[1] Current Control Techniques for Three-Phase Voltage-Source PWM Converters: A Survey; Kazmierkowski and Malesani
[2] Performance Analysis of Differrent Current Control Techniques for VSI connected to R-L Load;
Ch.Nagarjuna Reddy, B.Vasanth Reddy, B.Chitti Babu
[3] “A method of tracking the peak power points for a variable speed wind energy conversion system,”; Datta and Ranganathan
[4] Power Electronics; Mohan, Undeland and Robbins
8 LISTS OF FIGURES, TABLES AND ABBREVIATIONS
LIST OF FIGURES AND TABLES:
Figure 1 Three-phase inverter p. 4 Figure 2 PWM Current Controller p. 5 Figure 3 PI PWM current controller p. 5 Figure 4 Hysteresis current controller p. 6 Figure 5 Three-phase inverter with LCL filter p. 6 Figure 6 Calculating dynamic resistance values p. 9 Figure 7 Simulation model p. 10 Figure 8 Current controllers p. 10 Figure 9 Switching frequency checker p. 11 Figure 10 Power loss calculations p. 11 Figure 11 Conduction loss calculations p. 12 Figure 12 Switching loss calculations p. 12 Figure 13 PI Controller outputs p. 13 Figure 14 PI controller ripple and load measurements p. 14 Figure 15 PI Controller THD p. 14 Figure 16 Hysteresis Controller outputs p. 15 Figure 17 Hysteresis controller ripple and load measurements p. 15 Figure 18 Hysteresis controller THD p. 16 Figure 19 Filter inductance vs switching frequency p. 17 Figure 20 Switching frequency vs total losses p. 17 Figure 21 Hysteresis band variation effects s. 3 Table 1 LCL Filter for fs = 20 kHz p. 13
LIST OF ABBREVIATIONS
THD: Total Harmonic Distortion IGBT: Insulated Gate Bipolar Transistor fs: switching frequency CC: Current Controller DG: Distributed Generation PWM: Pulse Width Modulation

Active Rectifier in Microgrid
Mini-project 15a 21
9 APPENDIX A: IGBT with anti parallel diode datasheet - Infineon IKW40T120
B: PI CC model (Simulink file)
C: PI CC data inputs for model (Matlab file)
D: Hysteresis CC model (Simulink file)
E: Hysteresis CC data inputs for model (Matlab file)