active interrogation of helicopter rotor faults using trailing edge flap actuation
DESCRIPTION
Active Interrogation of Helicopter Rotor Faults Using Trailing Edge Flap Actuation. Patricia Stevens Doctoral Candidate Mechanical Engineering Penn State University Doctoral Dissertation Defense April 2, 2001. Outline. Background & Motivation Objectives of Work Modeling Approach - PowerPoint PPT PresentationTRANSCRIPT

Active Interrogation of Helicopter Rotor Faults UsingTrailing Edge Flap Actuation
Patricia StevensDoctoral Candidate
Mechanical EngineeringPenn State University
Doctoral Dissertation DefenseApril 2, 2001

2
Outline
Background & MotivationObjectives of WorkModeling ApproachDamage IdentificationConclusions

3
Documented Rotor System Problems
CH-46 Sea Knight - Prior to Upgrade• Inspections as often as every 8
hours of flight time for some rotor components
AH-64 Apache - Early Blade Problems• Original aluminum blades pitted by
sand and disabled by hail• Composite blades suffered from
delamination
Civil• 1990-1996: 35 civil rotorcraft
accidents were caused by rotor system failures

4
What makes helicopter rotor damage detection so difficult?
CentrifugalStiffening
GyroscopicSystem
AerodynamicLoads
ComplexComponents
InaccessibleLocations
Noisy Environment

5
Previous work:Localized fault detection
• Acoustic Emission Schoess et al. (1997)– Passive Approach– Acoustic Emission sensor
“listens” for crack propagation
• Wave Mechanics Lakshamanan & Pines (1997) & Purekar et al. (1998)– Active approach– Scattering of structural waves
due to impedance changes
• Limitation: – Requires a priori knowledge of
fault location
Ultrasonicsensor
crackstress waves
Acoustic Emission
PZTactuator / sensor
flawscattered waves
Wave Mechanics

6
Previous work:Rotor Diagnostics using Fuselage Measurements
Azzam & Andrew (1992, 1995)Ganguli, Chopra & Haas (1995-98)• Passive generation of fixed
frame loads • Measurements
• relative blade position• fuselage vibration
• Measurements in hover and forward flight
• Limitations:• Limited detectability of small
faults• Neural net required to classify
faults• Forward flight condition
measurements required
Dissimilarblade model
Seed fault
Simulateresponse
Measuretip displacementhub loads (vibs)
Next flightcondition
Next fault
Fault profileat eachflight
condition
TrainNeural Net
7
Previous work:Application of Structural Damage Detection
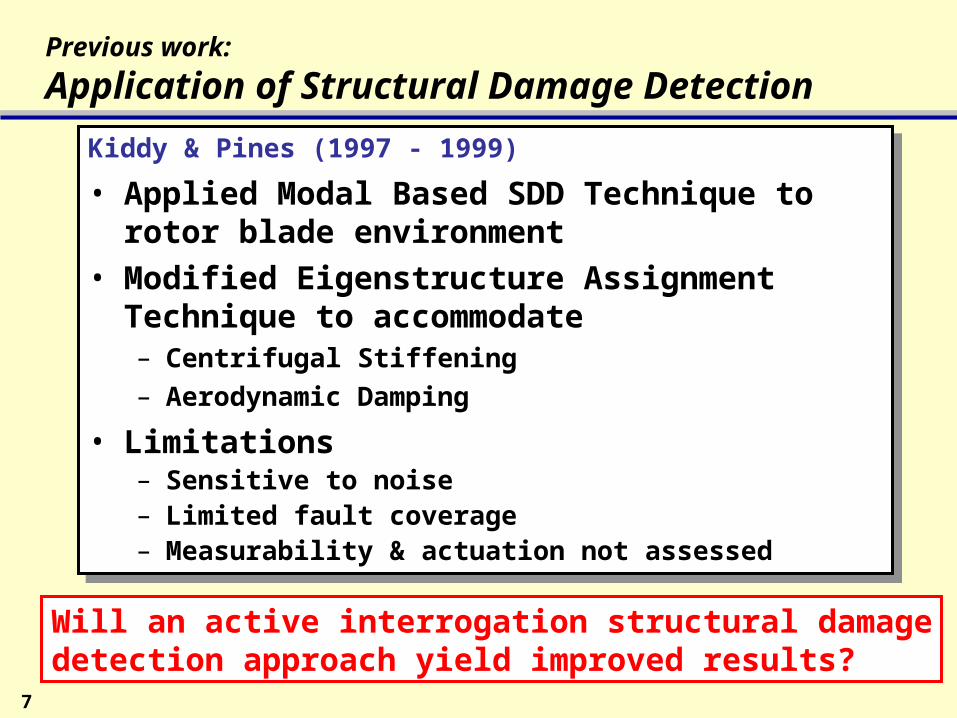
Kiddy & Pines (1997 - 1999)• Applied Modal Based SDD Technique to rotor
blade environment• Modified Eigenstructure Assignment Technique
to accommodate– Centrifugal Stiffening– Aerodynamic Damping
• Limitations– Sensitive to noise– Limited fault coverage– Measurability & actuation not assessed
Will an active interrogation structural damagedetection approach yield improved results?

8
Next Generation Rotorcraft…Active Trailing Edge Flaps
• Installed for vibration and noise control• Potential actuator for damage interrogation
Composite BladeAssembly
BearinglessHub
Tab ActuatorFlap Actuator
Active Control Flap,Noise and Vibration
Trim Tab, In-Flight Tracking
HH10 Airfoil Section
BLADE CROSS-SECTION
Tab ActuatorFlap Actuator
MD 900 blade with trailing edge flap

9
Goal: Design and Evaluate the Active Interrogation Concept
Interrogation signal
Damage EvaluationAlgorithms
Blade ResponseMeasured
trailing-edgeflap
sensors

10
Objectives
Determine if active interrogation of rotor faults using trailing edge flap actuators is a viable concept.
Develop active interrogation techniques appropriate for the rotor blade environment.
Demonstrate effective damage evaluation in hover.
Demonstrate damage evaluation in the presence of noise and modeling errors
Evaluate limitations of the approach.

11
Outline
Background & MotivationObjectives of WorkModeling Approach
RotorTrailing Edge FlapDamage
Damage IdentificationConclusions

12
Rotor Model - Bearingless Main Rotor
Cantileverboundarycondition
Nel = 10
Nodal Degreesof Freedom
Flexbeam Pitch LinkStiffness '
w
w
• Finite Element Approach– Flap, torsion– 10 beam elements
• Hingeless rotor - cantilever boundary condition
• Dissimilar blades
• Aeroelastic rotor in hover
• Response via time integration
• Response measured at each node
'
w
w

13
Trailing-Edge Flap Model
Physical Description• Size 10% of rotor radius• Location 80-90% rotor radius• Frequency 0 - 50 Hz.• Amplitude up to +/- 5 deg
(using +/- 2.5 deg)• Lift 120 lb/deg at 0 Hz
70 lb/deg at 50 Hz• Moment 25 ft-lb/deg
Aerodynamic Environment• Mach No. 0.45 - 0.6 in hover• Reduced Frequency up to 0.5
(k=c/2V)• Requires subsonic
compressible flow unsteady aerodynamic model(Leishman, et al)

14
Damage Models
• Flexbeam Degradation– Bending Stiffness– Torsional Stiffness
• Control System Stiffness• Flexbeam Crack• Outboard Stiffness Defect
– Bending– Torsional
• Outboard Crack• Ballistic Damage• Trim Mass

15
Flexbeam Degradation
• Distributed stiffness fault• Change in EI or GJ over flexbeam element
5% reduction in EI or GJ for 0.0-0.1R (flexbeam element)

16
Control System Stiffness
• Crack in pitch rod or fatiguefailure in connecting hardware
• 5% reduction in axial stiffness of pitch rod
5% effective reduction in torsional spring at end of flexbeam

17
Outboard Stiffness Defect
• Adopted from Ganguli, Chopra and Haas (1995-98)
• Manufacturing Defect • Delamination
5% reduction in EI or GJ for 0.6-0.7R

18
Ballistic Damage
• Experimental study of effects ofballistic damage (Robinson & Leishman, 97-98)
• Ballistic damage affects:– Cl, Clmax, Cd
– aerodynamic center location– mass
• “In some cases significant damage produced surprisingly mild effect on the aerodynamics”
• “Mild decreases in lift, but major increases in drag”
Ballistic Damage = 5% decrease in mass from 0.6-0.7R

19
Loss of Trim Mass
TrimMass
0
0.2
0.4
0.6
0.8
1
1.2
0 0.2 0.4 0.6 0.8 1
mas
sno
min
al m
ass
feather axis
x/Lel
Lel
Discrete change in mass of 0.6 lb at 95% radius

20
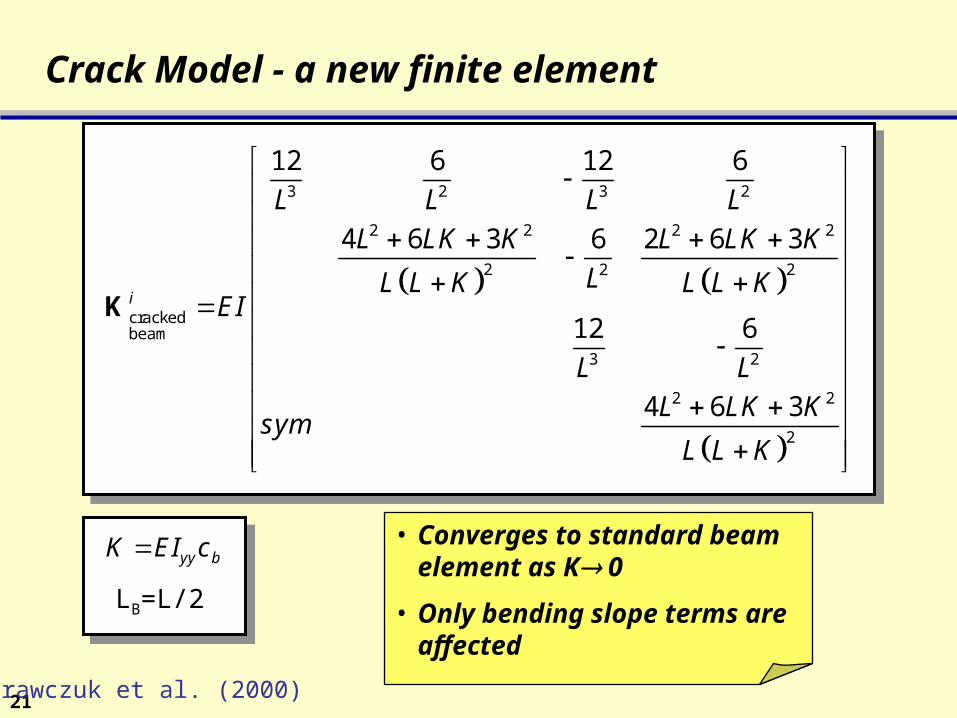
Crack Model - a new finite elementKrawczuk et al. (2000)
Boundary Conditions
a H
A
A
CRACK
cb=1/kb
I II
I II
w1(x)
1 (x)
w2 (x)
2 (x)
LB
L
x=0 x=LB x=LB x=L
q2
q1
q4
q3
1 2
1 1
1 2
2 3
2 4
1
2
2
1 2
1 2
0
0
" "
''
"
' '''
B B b B
B B
B B
B B
w q
q
w L q
L q
w L w L
w L w L
L L EIc w L
w L w L
From moment equilibrium
21
Crack Model - a new finite element
K
3 2 3 2
2 2 2 2
2 22
crackedbeam
3 2
2 2
2
12 6 12 6
4 6 3 6 2 6 3
12 6
4 6 3
i
L L L LL LK K L LK K
LL L K L L KEI
L LL LK Ksym
L L K
• Converges to standard beam element as K 0
• Only bending slope terms are affected
yy bK EI c
Krawczuk et al. (2000)
LB=L/2

22
0
0.5
1
1.5
2
2.5
0 0.1 0.2 0.3 0.4 0.5 0.6 0.7
Elastic Crack Model - Relating Crack Depth to Crack Constant
• Correction function, F(a/H), takes into account crack and body geometry (from stress intensity factor):
• Correction function governs flexibility(elastic crack)
• Flexibility determines constant, K
22 4
72A
c F adAEB H
4
0.93 01.99 1 sintan22
cos2 2
aaHHF a a
H H
yyK EI c
Effect of depth on crack constant
1
1
0, 0, 0
1, ,
a KHa KH
K/H
a/H

23
Crack Model - Validation
0.7
0.75
0.8
0.85
0.9
0.95
1
0 0.1 0.2 0.3 0.4 0.5 0.6
Analytical modelFEM modelExperimental data
Firs
t rel
ativ
e na
tura
l fre
quen
cy
Relative crack depth, a/H
[reproduced from Krawczuk et al. (2000)]

24
Outline
Background & MotivationObjectives of WorkModeling ApproachDamage Identification
Theory & ResultsEffect of Modeling ErrorsNoise & Noise MitigationAlternate Extent Quantification ApproachMeasurability
Conclusions

25
Structural Damage Detection Background
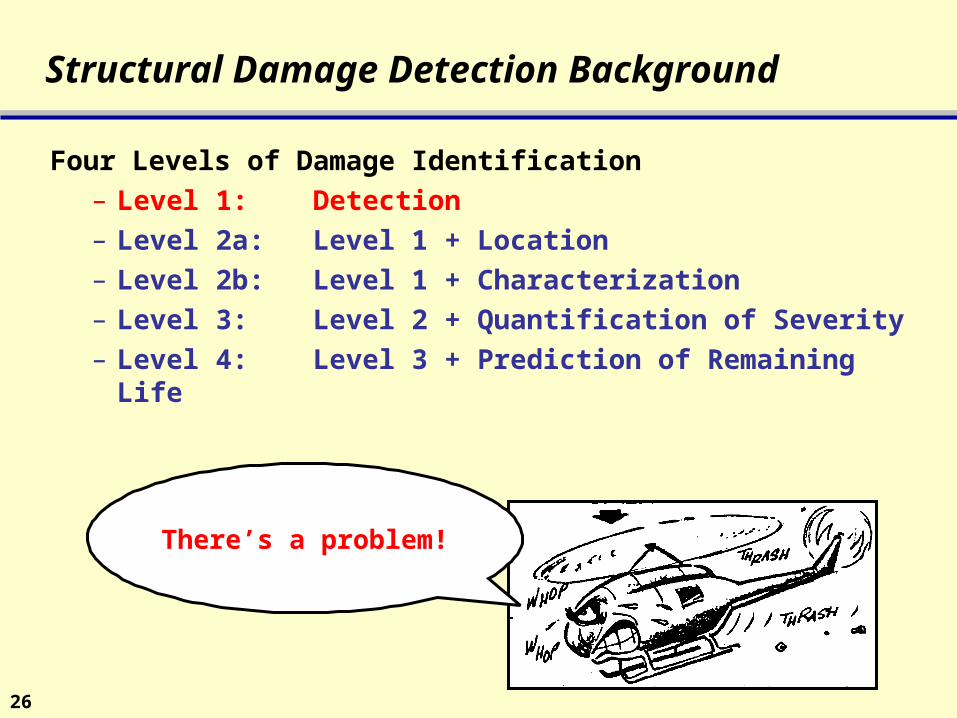
Four Levels of Damage Identification– Level 1: Detection– Level 2a: Level 1 + Location– Level 2b: Level 1 + Characterization– Level 3: Level 2 + Quantification of Severity– Level 4: Level 3 + Prediction of Remaining Life
(Modified from Rytter, 1993)
Can I safely completemy mission?
Can I safely completemy mission?
26
Structural Damage Detection Background
Four Levels of Damage Identification– Level 1: Detection– Level 2a: Level 1 + Location– Level 2b: Level 1 + Characterization– Level 3: Level 2 + Quantification of Severity– Level 4: Level 3 + Prediction of Remaining Life
There’s a problem!

27
Structural Damage Detection Background
Four Levels of Damage Identification– Level 1: Detection– Level 2a: Level 1 + Location– Level 2b: Level 1 + Characterization– Level 3: Level 2 + Quantification of Severity– Level 4: Level 3 + Prediction of Remaining Life
...in the pitch link!

28
Structural Damage Detection Background
Four Levels of Damage Identification– Level 1: Detection– Level 2a: Level 1 + Location– Level 2b: Level 1 + Characterization– Level 3: Level 2 + Quantification of Severity– Level 4: Level 3 + Prediction of Remaining Life
It’s a crack!

29
Structural Damage Detection Background
Four Levels of Damage Identification– Level 1: Detection– Level 2a: Level 1 + Location– Level 2b: Level 1 + Characterization– Level 3: Level 2 + Quantification of Severity– Level 4: Level 3 + Prediction of Remaining Life
It’s a small crack.

30
Structural Damage Detection Background
Four Levels of Damage Identification– Level 1: Detection– Level 2a: Level 1 + Location– Level 2b: Level 1 + Characterization– Level 3: Level 2 + Quantification of Severity– Level 4: Level 3 + Prediction of Remaining Life
Safe to completethe mission!

31
Damage Detection, Location & Characterization The "DAMAGE VECTOR"EOM of damaged system:
Rearranging results in two equivalent vector expressions -- d(jw) = the Residual Force or “Damage Vector”
(1)
(2)
2 ( ) dd j M j C K X j
2 ( ) h h h dd j M j C K X j F j
d(jw) has non-zero elements only at DOFs associated with damage
d(jw) can be calculated from known parameters
2 [ ] [ ] [ ]h h h d totalM M j C C K K X j F j
0 0 0 0 00 0 0 0 00 0 00 0 00 0 0 0 0
X XMX X
Damage is perturbation matrix: , , d h d h d hM M M C C C K K K
2d d d d totalM j C K X j F j

32
Interpretation of the Damage Vector
Physical interpretation: The harmonic amplitude of nodal forces required to force the healthy system model to respond as if damage were present
3
4
5
6
00
d =
0
0
dddd
00
1,2 3,4 5,6 7,8 9,10
fint
1,2 3,4 5,6 7,8 9,10
fint
healthy
damaged
degrees of freedom:
measurements:
d3d4
d5d6
2 h h h dM j C K X j F j d j
Ojalvo & Pilon (1988)

33
Results for ...
• Flexbeam Degradation– Torsional Stiffness
• Control System Stiffness• Outboard Stiffness Defect
– Bending Stiffness• Outboard Crack• Ballistic Damage
Need to •detect & locate•differentiate between similar faults
Does interrogation frequency affect the results?

00.050.1
0.150.2
0.25
00.050.1
0.150.2
0.25
00.050.1
0.150.2
0.25
00.050.1
0.150.2
0.25
1 2 3 4 5 6 7 8 9 10
Damage Vector for Flexbeam Torsional Stiffness
measurement location
displacementw
bendingslope
w'
mid-nodetwistM
end-nodetwistA
Damage is 5% decrease in GJ of element 1
50 Hz
10 Hz
K 0K
0 K
strwwstr
str
1
0K H H' '
Tstr GJ ds
1 200
K H H'' ''cos Tstr
ww w wEI ds
Torsional stiffness damage manifests as damage vector DOFs connected to damaged element

00.020.040.060.080.1
00.020.040.060.080.1
00.020.040.060.080.1
05
1015202530
1 2 3 4 5 6 7 8 9 10
Damage Vector for Pitch Link Stiffness
measurement location
Damage is 5% decrease in torsional spring representing pitch link
50 Hz
10 Hz
displacementw
bendingslope
w'
mid-nodetwistM
end-nodetwistA
Pitch link stiffness damage manifests as damage vector DOF connected to damaged element-- a single DOF
0
5
10
15
0
5
10
15
00.20.40.60.8
1
00.20.40.60.8
1
1 2 3 4 5 6 7 8 9 10
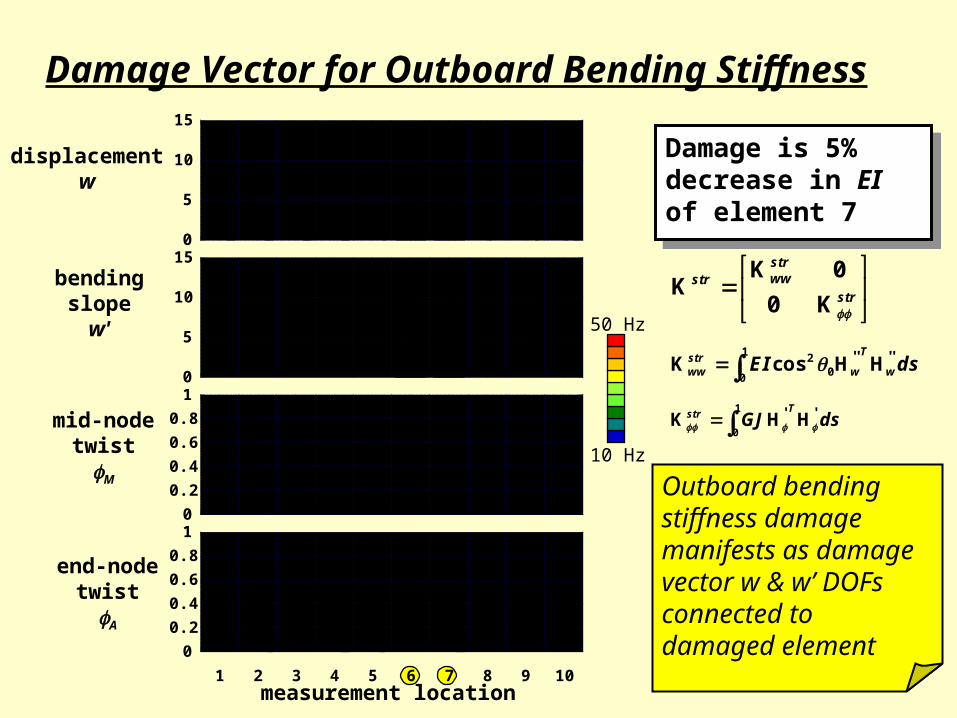
Damage Vector for Outboard Bending Stiffness
measurement location
Damage is 5% decrease in EI of element 7
50 Hz
10 Hz
displacementw
bendingslope
w'
mid-nodetwistM
end-nodetwistA
Outboard bending stiffness damage manifests as damage vector w & w’ DOFs connected to damaged element
K 0K
0 K
strwwstr
str
1
0K H H' '
Tstr GJ ds
1 200
K H H'' ''cos Tstr
ww w wEI ds

00.020.040.060.080.1
00.050.1
0.150.2
0.25
00.020.040.060.080.1
00.020.040.060.080.1
1 2 3 4 5 6 7 8 9 10
Damage Vector for Outboard Bending Crack
measurement location
Damage is crack of depth a/H=0.05 at midpoint of element #7
50 Hz
10 Hz
displacementw
bendingslope
w'
mid-nodetwistM
end-nodetwistA
Crack damage manifests as damage vector w' DOFs connected to damaged element

00.20.40.60.8
1
1 2 3 4 5 6 7 8 9 10
0
0.3
0.6
0.9
1.2
00.5
11.5
22.5
0
1
2
3
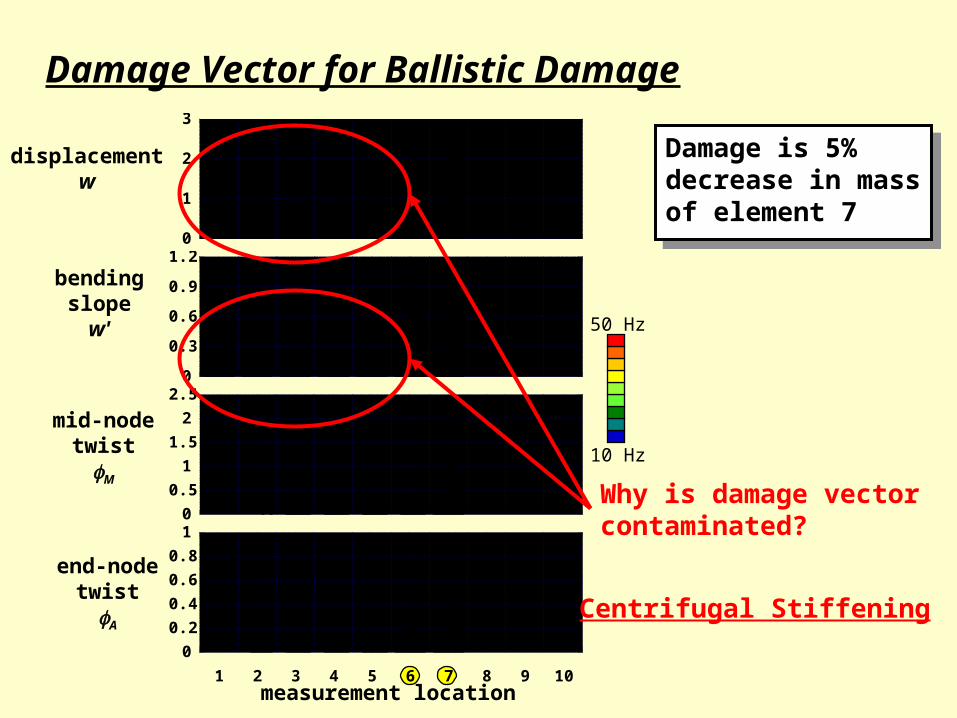
Damage Vector for Ballistic Damage
measurement location
Damage is 5% decrease in mass of element 7
50 Hz
10 Hz
displacementw
bendingslope
w'
mid-nodetwistM
end-nodetwistA
Ballisitic damage manifests as damage vector w, w’, and DOFs connected to damaged element
ww w ww
w
M M M 0M
M M 0 M
1
0
Tww A w wdsM H H
1
0
TA ds M H H
1
w 00cos T
w A g we ds M M H H
00.20.40.60.8
1
1 2 3 4 5 6 7 8 9 10
0
0.3
0.6
0.9
1.2
00.5
11.5
22.5
0
1
2
3
Damage Vector for Ballistic Damage
measurement location
Damage is 5% decrease in mass of element 7
50 Hz
10 Hz
displacementw
bendingslope
w'
mid-nodetwistM
end-nodetwistA
Why is damage vectorcontaminated?
Centrifugal Stiffening

Damage Vector for Compound Damage
measurement location
Damage is–Root bending stiffness
–Pitch link stiffness–Ballistic damage
Results show–Each damage type is identified
–Combined damage vector is equal to sum of individual damage vectors
0
10
20
30
1 2 3 4 5 6 7 8 9 10
pitch link damage
ballistic damage
0
1
2
3
ballistic damage
50 Hz
10 Hz
0
5
10
15root bending stiffness
ballistic damage
0
5
10
15
ballistic damage
root bending stiffness
displacementw
bendingslope
w'
mid-nodetwistM
end-nodetwistA

41
Damage Detection, Location & Characterization Summary
• Residual force vector (a.k.a. damage vector) requires– refined model of healthy system– measured response of damaged system– model or measurement of external force
• All fault types studied were detected and located viaresidual force vector
• Similar faults are distinguishable
• Compound fault damage vector = sum of individual damage vectors
• No clear frequency recommendation
• Requires a single interrogation frequency

42
Why are rotor system damage extentcalculations difficult?
• Aerodynamic Loads– Non-symmetric aerodynamic matrices– Damping
• Centrifugal Stiffening– large CF stiffening– mass / stiffness coupling
• Coriolis Forces– Skew symmetric
matrices
43
Damage Extent for Gyroscopic Systems
• Yap and Zimmerman (1999) solved the gyroscopic problem via the “Asymmetric Minimum Rank Perturbation Theory”– Modal based model update
– Find the perturbation matrix of minimum rank subject to constraint of null symmetry
• This modal analysis based approach was extended to a FRF based approach as part of the current work
44
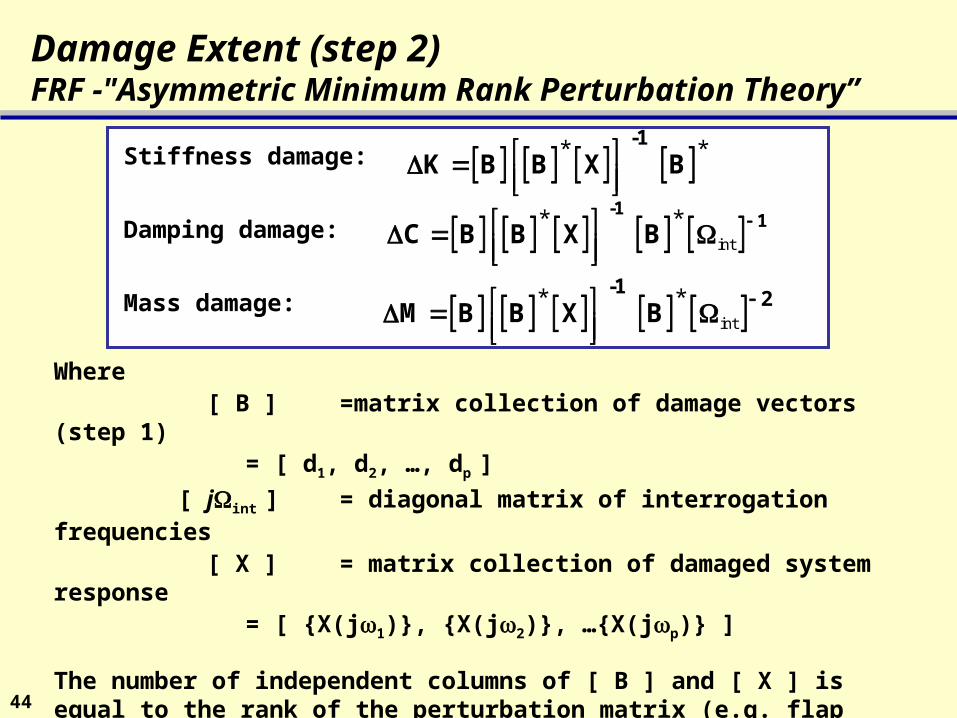
Damage Extent (step 2) FRF -"Asymmetric Minimum Rank Perturbation Theory”
-1 K B B X B* *Stiffness damage:
Damping damage:
Mass damage:
-1 1C B B X B int* *
-1 2M B B X B int* *
Where [ B ] =matrix collection of damage vectors (step 1)
= [ d1, d2, …, dp ] [ jint ] = diagonal matrix of interrogation frequencies [ X ] = matrix collection of damaged system response
= [ {X(j1)}, {X(j2)}, …{X(jp)} ]
The number of independent columns of [ B ] and [ X ] is equal to the rank of the perturbation matrix (e.g. flap only: mass=4, stiffness=2)
BUT! Must know nature (mass, damping, stiffness) a priori.

45
Calculation of Parameter Change
• AMRPT results in perturbation matrix of full dimension
• Non-zero terms describe change in elemental matrix
• For damage located in a single element, change in physical parameter is calculated using structure of elemental matrix
• e.g. kK
./
elstrstr wwww
nom
EIEI
5 10 15 20 25 30 35 40
5
10
15
20
25
30
35
40 -2.5
-2
-1.5
-1
-0.5
0
0.5
1
x 104
510152025303540
5 10 15 20 25 30 35 40
Exact K
DOFD
OF
x 104
1
0
-1
-2
46
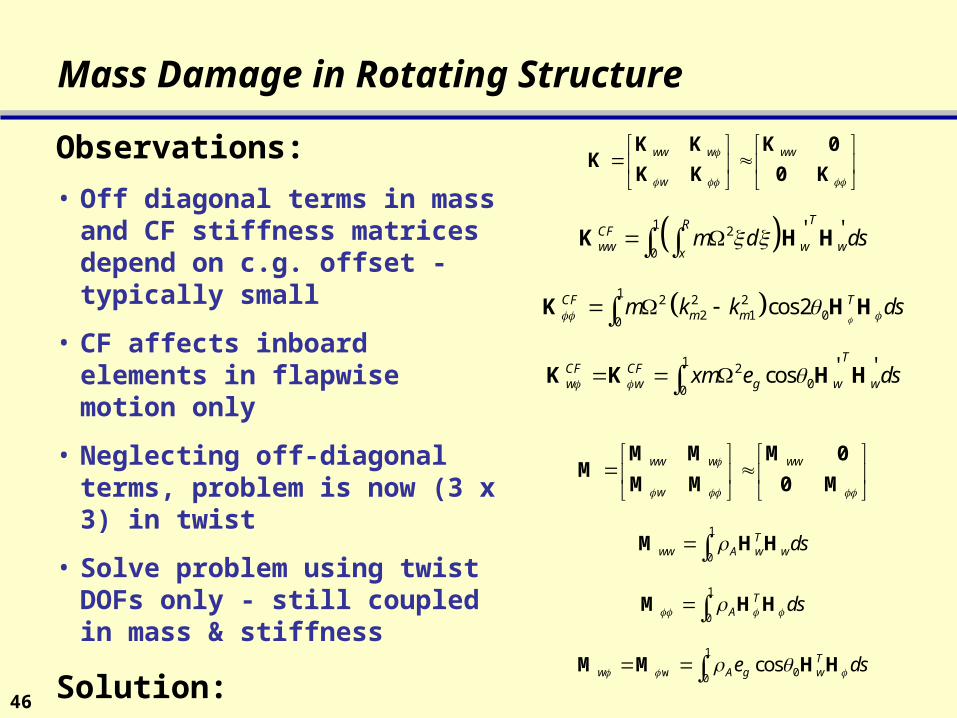
Mass Damage in Rotating Structure
Observations:• Off diagonal terms in mass and
CF stiffness matrices depend on c.g. offset - typically small
• CF affects inboard elements in flapwise motion only
• Neglecting off-diagonal terms, problem is now (3 x 3) in twist
• Solve problem using twist DOFs only - still coupled in mass & stiffness
Solution:• Iterate on coupled twist problem
1 2
0
' 'TRCFww w wx
m d ds K H H
1 2 2 22 1 00
cos2CF Tm mm k k ds
K H H
1 200
' 'cosT
CF CFw w g w wxm e ds K K H H
ww w ww
w
M M M 0M
M M 0 M
1
0
Tww A w wdsM H H
1
0
TA ds M H H
1
w 00cos T
w A g we ds M M H H
ww w ww
w
K K K 0K
K K 0 K

47
interrogation frequencyrangeDamage
10-50 Hz 30-50 Hzroot torsionalstiffness
0.00% -0.81%
pitch link 0.00% 0.00%
outboard bendingstiffness
4.91% -1.48%
outboard cracka/H=0.05
-0.05% -0.10%
ballisticdamage
-48.14 -38.5
Damage Extent Summary
AMRPT Damage Extent Quantification Error AMRPT results show improvementusing higher interrogation frequencies
exact avg
exact
x xerror
x
where x is damagedparameter (EI, GJ, A)
Errors stem from small errors in damage vector

48
Outline
Background & MotivationObjectives of WorkModeling ApproachDamage Identification
Theory & ResultsEffect of Modeling ErrorsNoise & Noise MitigationAlternate Extent Quantification ApproachMeasurability
Conclusions
49
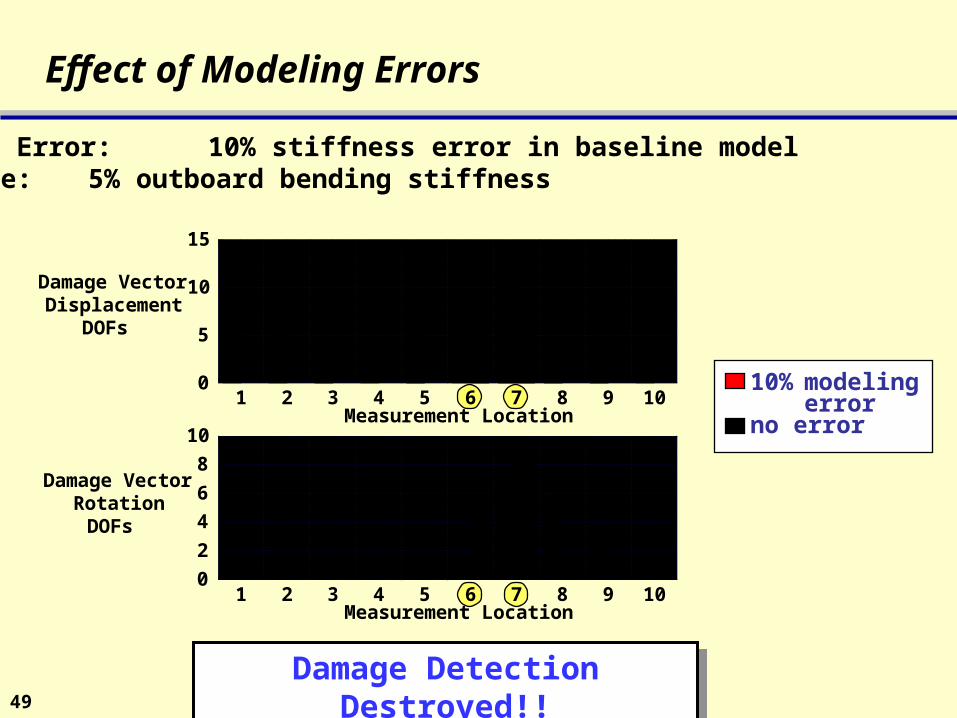
Effect of Modeling Errors
0
5
10
15
1 2 3 4 5 6 7 8 9 10
Damage VectorDisplacement
DOFs
Measurement Location
02468
10
1 2 3 4 5 6 7 8 9 10
Damage VectorRotation
DOFs
Measurement Location
10% modelingerror
no error
Model Error: 10% stiffness error in baseline modelDamage: 5% outboard bending stiffness
Damage Detection Destroyed!!
50
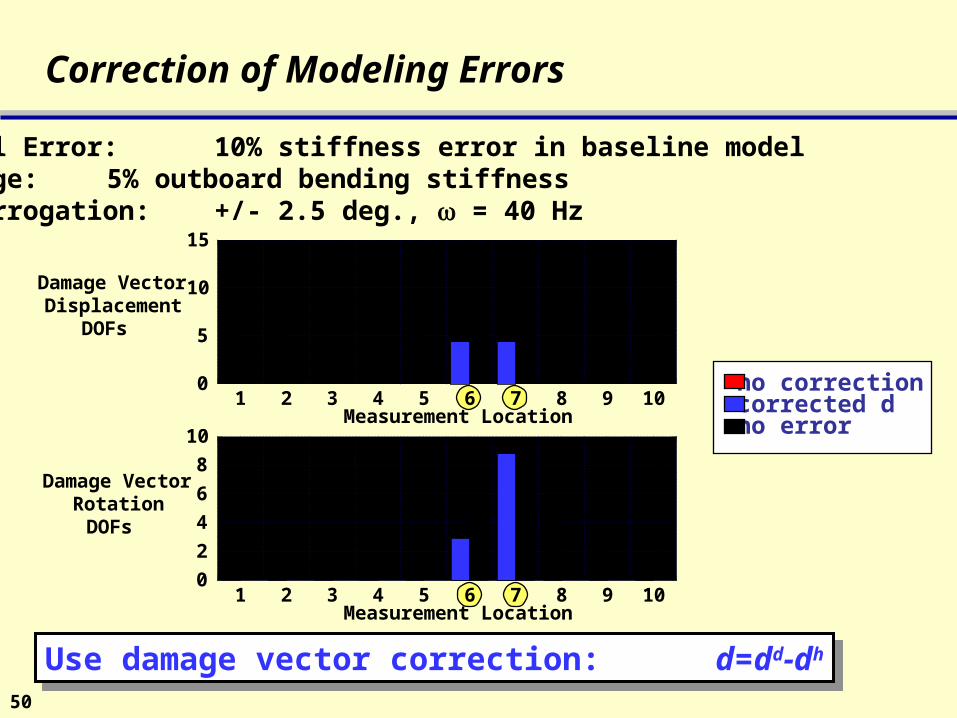
Correction of Modeling Errors
0
5
10
15
1 2 3 4 5 6 7 8 9 10
Damage VectorDisplacement
DOFs
Measurement Location
02468
10
1 2 3 4 5 6 7 8 9 10
Damage VectorRotation
DOFs
Measurement Location
no correctioncorrected dno error
Model Error: 10% stiffness error in baseline modelDamage: 5% outboard bending stiffnessInterrogation: +/- 2.5 deg., = 40 Hz
Use damage vector correction: d=dd-dh

51
Effect of Modeling Errors on Damage Extent CalculationsDamage: 5% outboard bending stiffnessInterrogation: +/- 2.5 deg., = 32 & 40 Hz
Case
10% Increase inBaseline Stiffness
10% Decrease inBaseline Mass
% Error
45.4
-17.22
AMRPT Extent Quantification Error
• Extent quantification error for perfect model = 0.04%• Damage vector correction d=dd-dh is utilized
Small errors in damage vector result inlarge errors in frequency domain AMRPT

52
Outline
Background & MotivationObjectives of WorkModeling ApproachDamage Identification
Theory & ResultsEffect of Modeling ErrorsNoise & Noise MitigationAlternate Extent Quantification ApproachMeasurability
Conclusions
53
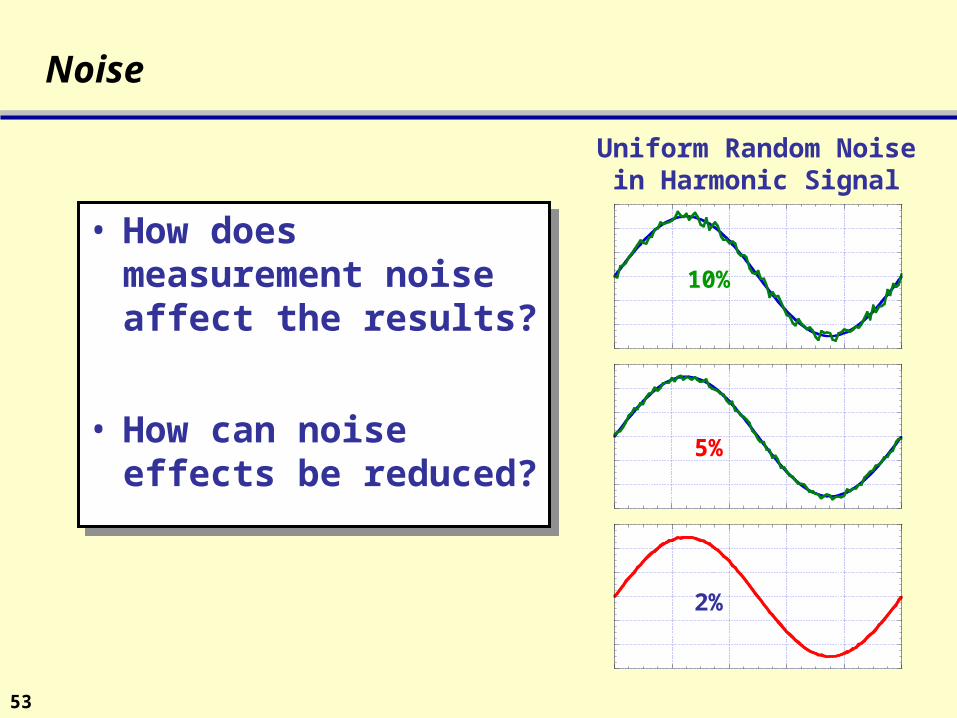
Noise
• How does measurement noise affect the results?
• How can noise effects be reduced?
Uniform Random Noisein Harmonic Signal
5%
2%
10%
54
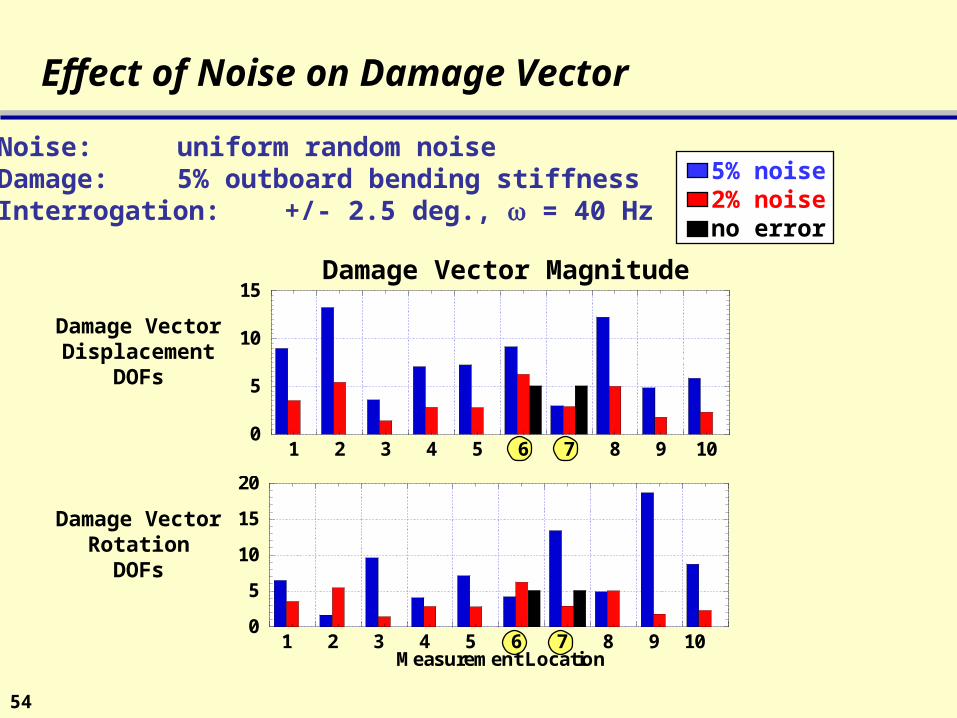
Effect of Noise on Damage Vector
0
5
10
15
1 2 3 4 5 6 7 8 9 10
0
5
10
15
20
1 2 3 4 5 6 7 8 9 10Measurement Location
Noise: uniform random noiseDamage: 5% outboard bending stiffnessInterrogation: +/- 2.5 deg., = 40 Hz
Damage VectorDisplacement
DOFs
Damage VectorRotation
DOFs
Damage Vector Magnitude
5% noise2% noiseno error

55
Noise Mitigation Procedure
Number of Cycles in Average
0
1
2
3
4
5
6
0 20 40 60 80 100
10% uniform random noise
5% uniform random noise
2% uniform random noise
1% uniform random noise
% RMSNoise
Cycle Averaging ofHarmonic Signal with Noise
56
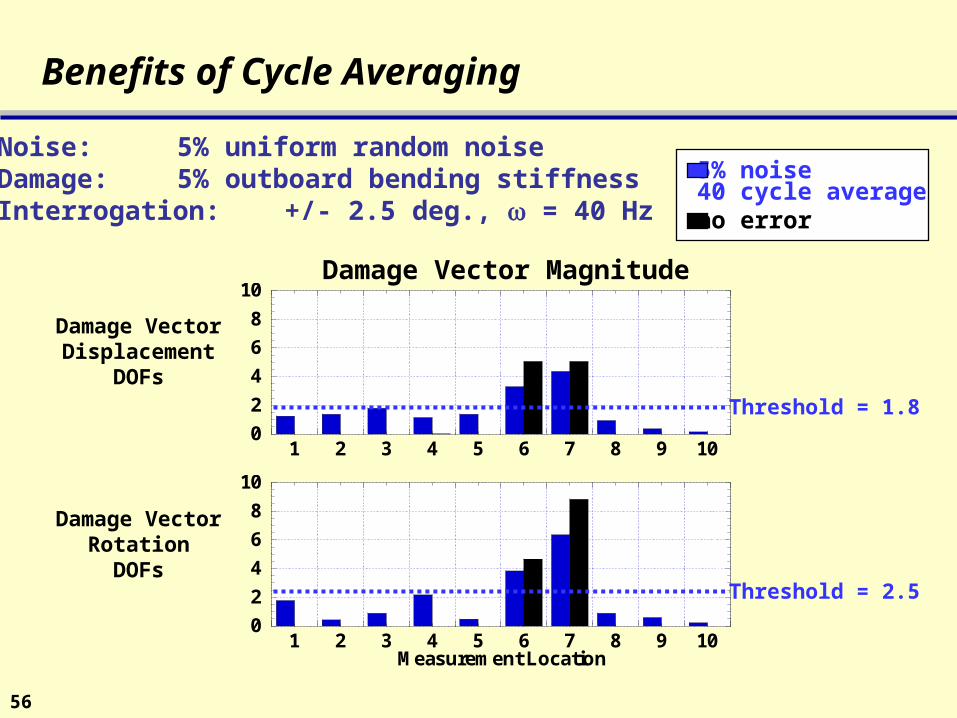
Benefits of Cycle Averaging
02468
10
1 2 3 4 5 6 7 8 9 10
02468
10
1 2 3 4 5 6 7 8 9 10Measurement Location
Damage VectorDisplacement
DOFs
Damage VectorRotation
DOFs
Noise: 5% uniform random noiseDamage: 5% outboard bending stiffnessInterrogation: +/- 2.5 deg., = 40 Hz
Damage Vector Magnitude
Threshold = 1.8
Threshold = 2.5
5% noise40 cycle averageno error

57
Effect of Noise on Damage Extent Calculations
Damage: 5% outboard bending stiffnessInterrogation: +/- 2.5 deg., = 32 & 40 Hz
Case
2% noise20 cycles
5% noise40 cycles
% Error
114%
130%
AMRPT Extent Quantification Error
• Extent quantification error for perfect model = 0.04%
Small errors in damage vector result inlarge errors in frequency domain AMRPT
58
Outline
Background & MotivationObjectives of WorkModeling ApproachDamage Identification
Theory & ResultsEffect of Modeling ErrorsNoise & Noise MitigationAlternate Extent Quantification ApproachMeasurability
Conclusions
59
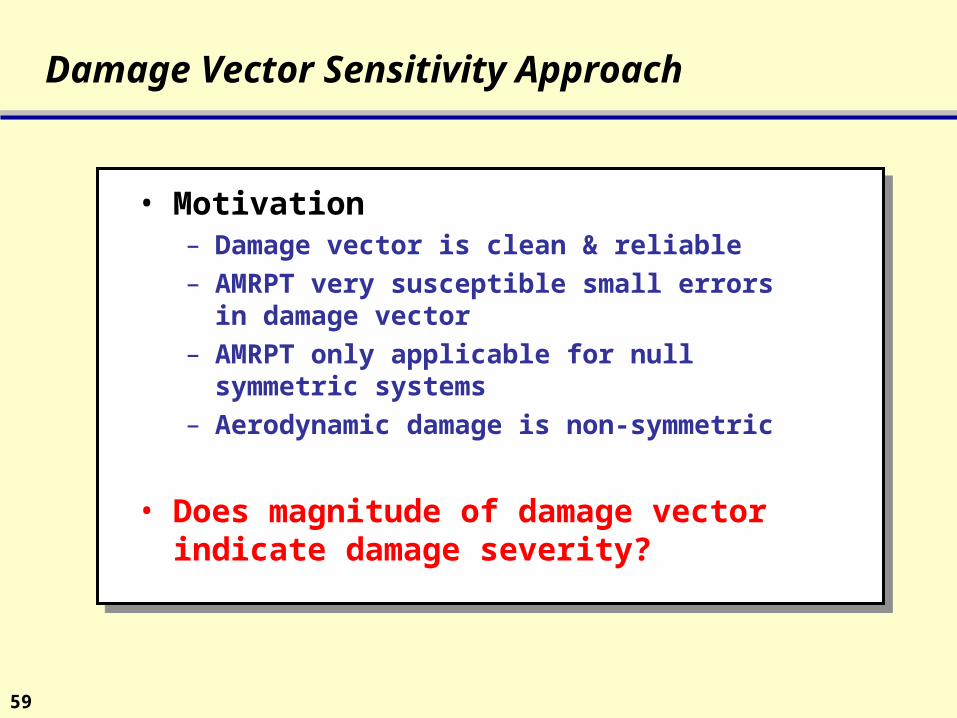
Damage Vector Sensitivity Approach
• Motivation– Damage vector is clean & reliable– AMRPT very susceptible small errors in
damage vector– AMRPT only applicable for null symmetric
systems– Aerodynamic damage is non-symmetric
• Does magnitude of damage vector indicate damage severity?

60
Damage Vector Sensitivity Approach
0
20
40
60
80
100{d(w
6)}
{d(w7)}
0
50
100
150
0 0.1 0.2 0.3 0.4 0.5
{d(w'6)}
{d(w'7)}
Bending Stiffness (EIyy
/EIyy
nominal)
Damage Vector Magnitude vs. Damage ExtentOutboard Bending Stiffness Fault
DamageVector
Magnitude
DamageVector
Magnitude
• Simple relationship relates damage severity to damage vector magnitude
• Nearly linear for small damage

61
Outline
Background & MotivationObjectives of WorkModeling ApproachDamage Identification
Theory & ResultsEffect of Modeling ErrorsNoise & Noise MitigationAlternate Extent Quantification ApproachMeasurability
Conclusions
62
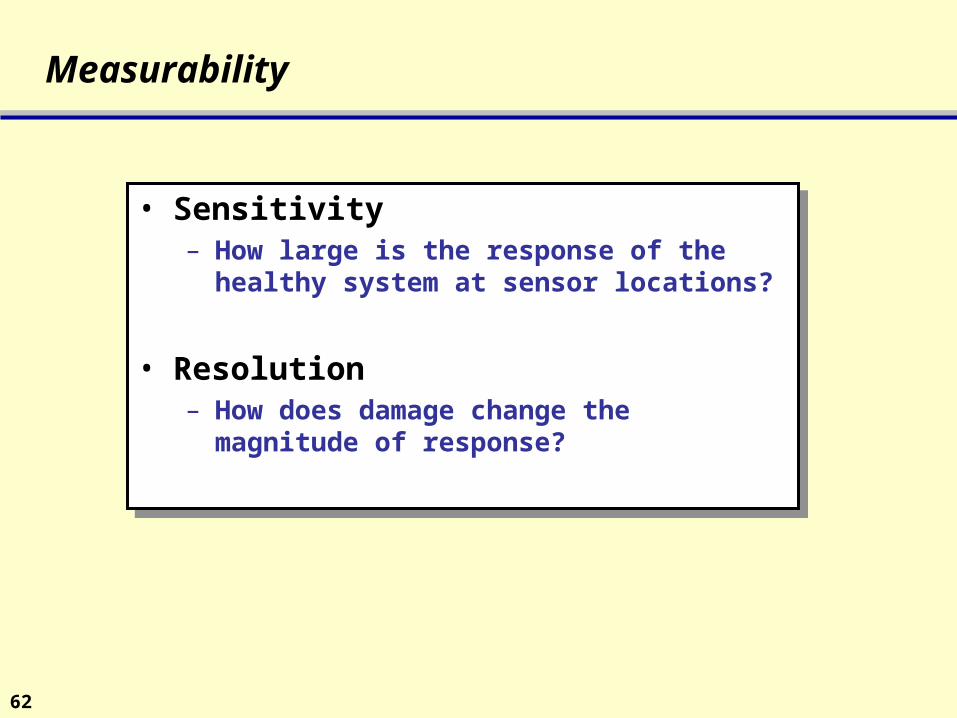
Measurability
• Sensitivity– How large is the response of the healthy
system at sensor locations?
• Resolution– How does damage change the magnitude of
response?
63
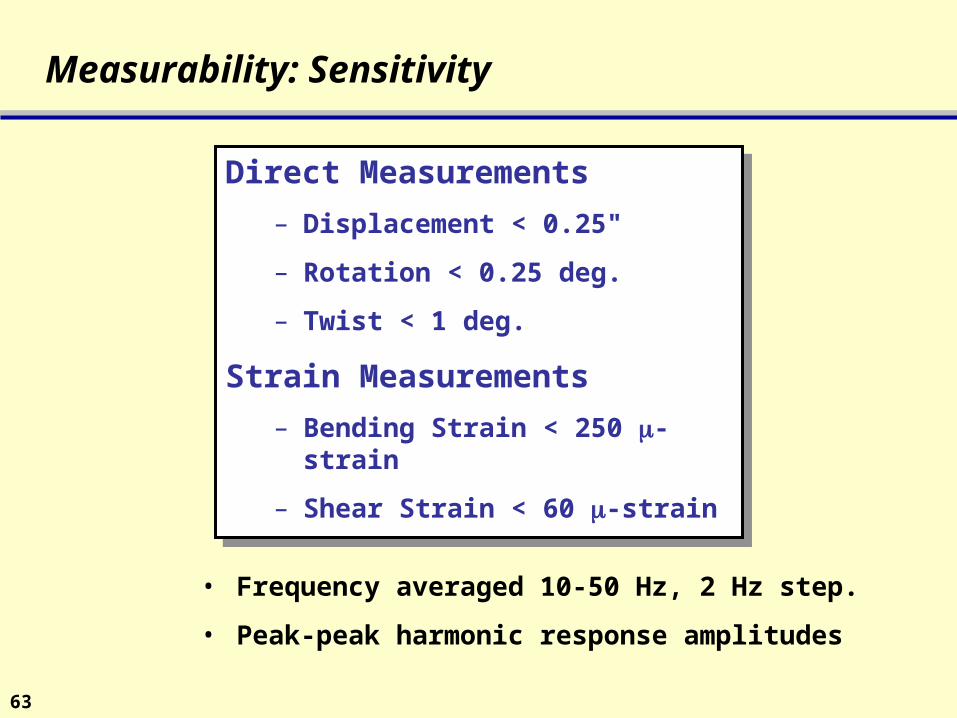
Measurability: Sensitivity
Direct Measurements– Displacement < 0.25"
– Rotation < 0.25 deg.
– Twist < 1 deg.
Strain Measurements– Bending Strain < 250 -strain
– Shear Strain < 60 -strain
• Frequency averaged 10-50 Hz, 2 Hz step.
• Peak-peak harmonic response amplitudes

64
Measurability:Change in Direct Measurement Response
root bending stiffnessroot torsional stiffness
root crack a/H=0.05root crack a/H=0.2
pitch linkoutboard bending stiffness
outboard torsional stiffnessoutboard crack a/H=0.05outboard crack a/H=0.2
ballistic damagetrim mass
* Results averaged over frequency and blade length
0 0.5 1 1.5 2 2.5
displacementbending slopetwist
% change from healthy system response

65
Outline
Background & MotivationObjectives of WorkModeling ApproachDamage IdentificationConclusions

66
Recommendations & Conclusions
Summary
– A unique active-interrogation damage evaluation approach for helicopter rotor systems using trailing-edge flap actuation has been designed and implemented in a numerical rotor code.
– Residual force vector and AMRPT adapted for active interrogation approach
– Residual force vector sensitivity approach formulated as alternative extent quantification approach
– Detection & Extent demonstrated in hover using trailing edge flap actuation within the bounds set by vibration control requirements (< 50 Hz, +/- 2.5 deg. deflection)
– Effects of noise & modeling errors assessed and mitigated
– Preliminary measurability study

67
Recommendations & Conclusions
Successes – Damage detection
• very clean for mass and stiffness faults• not sensitive to interrogation frequency• faults detected & characterized in the presence of 5%
noise with cycle averaging• faults detected & characterized with 10% baseline
model errors using damage vector correction– Damage extent measurement via AMRPT
• stiffness faults within 5% error (without noise or modeling errors)

68
Recommendations & Conclusions
Limitations– Damage extent very sensitive to noise & errors– AMRPT damage extent algorithm modified to account
for CF stiffening effects BUT sensitivity to errors in damage vector is severe
– AMRPT damage extent algorithm inappropriate for aerodynamic faults
– Measurability• Typical change in response = 1%• Change in response << 1% for cracks, flexbeam
torsional stiffness fault

69
Recommendations & Conclusions
Remarks– Damage detection in helicopter main rotor using active
interrogation with trailing edge flap is promising– Damage extent using frequency domain AMRPT is difficult
due to sensitivity to errors in damage vectors
Recommendations– Extent calculations using damage vector sensitivity– Optimize sensor placement– Optimize interrogation frequency – Implementation of strain-based approach– Investigate alternate detection and extent algorithms
• non-linear time series feature extraction (Todd et al, 2001)

70
Acknowledgments
This work was funded in part by – The ONR MURI in Integrated and Predictive
Diagnostics through the Penn State Applied Research Lab
– The ARO MURI in Active Noise and Vibration Control Technologies for Jet Smooth, Quiet Rotorcraft