active flow control at low reynolds numbers on a naca · pdf fileactive flow control at low...
TRANSCRIPT

Active Flow Control at Low Reynolds Numbers on
a NACA 0015 Airfoil
LaTunia Pack Melton∗, Judith Hannon†, Chung-Sheng Yao†, and Jerome Harris‡
NASA Langley Research Center, Hampton, Virginia, United States of America
Results from a low Reynolds number wind tunnel experiment on a NACA 0015 airfoilwith a 30% chord trailing edge flap tested at deflection angles of 0, 20, and 40 arepresented and discussed. Zero net mass flux periodic excitation was applied at the flapshoulder to control flow separation for flap deflections larger than 0. The primary objectiveof the experiment was to compare force and moment data obtained from integrating surfacepressures to data obtained from a 5-component strain-gage balance in preparation foradditional three-dimensional testing of the model. To achieve this objective, active flowcontrol is applied at an angle of attack of 6 where published results indicate that oscillatorymomentum coefficients exceeding 1% are required to delay separation. Periodic excitationwith an oscillatory momentum coefficient of 1.5% and a reduced frequency of 0.71 caused asignificant delay of separation on the airfoil with a flap deflection of 20. Higher momentumcoefficients at the same reduced frequency were required to achieve a similar level of flowattachment on the airfoil with a flap deflection of 40. There was a favorable comparisonbetween the balance and integrated pressure force and moment results.
Nomenclature
c airfoil chord (δf = 0), mCµ excitation momentum coefficient, ≡ < J
′> /cq
Cdp pressure drag coefficientCD total drag coefficientCL lift coefficientCL,max maximum lift coefficientCp pressure coefficient, ≡ (P − Ps)/qf frequency, HzF+ reduced frequency, ≡ (fxsp)/U∞h slot width, mmJ ′ oscillatory momentum at slot exit, ≡ ρhu′2
j
P pressurePs static pressureq free stream dynamic pressure,≡ 1/2ρU2
∞Rec chord Reynolds number, ≡ U∞c/νs airfoil span, mt time, sU, u average and fluctuating streamwise velocity, m/sx/c normalized streamwise locationxsp distance from actuator to trailing edgey spanwise locationα angle of attack, degδf flap deflection, degξ x rotated 6
∗Research Scientist, Flow Physics and Control Branch, MS 170, Senior Member AIAA†Research Scientist, Flow Physics and Control Branch, MS 170‡Optical Technician, Flow Physics and Control Branch, MS 170
1 of 18
American Institute of Aeronautics and Astronautics
https://ntrs.nasa.gov/search.jsp?R=20080033674 2018-05-10T14:06:24+00:00Z

ν kinematic viscosityζ y rotated 6
ρ densityφ phase of excitation cycle
A. Abbreviations
2D two-dimensional3D three-dimensionalAFC active flow controlBM burst modulationLE leading edgeTE trailing edge
B. Subscripts
j conditions at excitation slotM modulation∞ free stream conditions
C. Superscript
′ root mean square of fluctuating value
I. Introduction
Active separation control is considered one of the enabling technologies for the next generation of hybridwing body vehicles. For this reason, the National Aeronautics and Space Administration’s Subsonic FixedWing Project funds both internal and external research in this area. This research is fundamental, long-termresearch focused on obtaining a better understanding of the physics governing active separation control. Ourinternal research is focused on examining the effects of the excitation frequency and amplitude of periodicexcitation on two-dimensional (2D) and three-dimensional (3D) flowfields. This will be accomplished througha series of wind tunnel experiments on a model with a NACA 0015 cross-section.
One motivation for the use of periodic excitation as a method of controlling separation is the reduction inmomentum required to control separation when compared to steady momentum transfer methods. Seifertet al.1 reported a one to two order of magnitude reduction in momentum requirements at low Reynoldsnumbers when using periodic excitation as compared to steady blowing at the leading edge of a NACA 0015airfoil. Later, Seifert and Pack2 reported similar reductions in momentum requirements on a NACA 0015at flight Reynolds numbers. Periodic excitation is effective for controlling separation when introduced justupstream of the separation location. The vortical structures introduced by the 2D excitation are used toenhance the mixing between the high momentum fluid of the separated shear layer and the low momentumfluid in the separated region. Introduction of the excitation at frequencies that correspond to the naturalinstabilities in the separating shear layer is the reason for the efficiency of periodic excitation when comparedto steady methods of separation control. Periodic excitation applied near the leading edge of an airfoil delaysstall and increases the maximum lift (CL,max) generated by the airfoil. Periodic excitation applied at theflap shoulder delays or prevents separation on the deflected flap of the airfoil, resulting in improved flapefficiency. Additional information on the technology can be found in the review papers of Greenblatt andWygnanski3 and Seifert et al.4 .
The efficiency of periodic excitation as well as the perceived ease of implementation when compared tosteady blowing or suction are reasons for continued research to understand the effects of model geometry( i.e., flap deflection angle, slot location, and surface curvature) and excitation frequency and amplitude.
2 of 18
American Institute of Aeronautics and Astronautics

Efficiency is also important when controlling separation on an airfoil or wing with multiple slot locations.In reference 5, the authors report a sensitivity to phase when combining excitations from two closely spacedsources around the flap shoulder of a supercritical airfoil. The lift increment of the airfoil was maximizedwhen the relative phase between the excitations was ±30. The single frequency selected to combine thetwo excitations corresponded to the frequency that was most effective for separation control when eachactuator was operated individually. The optimal phase angle for combining excitations from two closelyspaced actuators was validated at a higher Reynolds number on a larger version of the airfoil.6 Recently,Greenblatt7 combined leading edge and flap shoulder excitations on a semi-span model with a NACA 0015cross-section and demonstrated that the maximum lift increment occurred when the relative phase betweenthe two excitations was approximately 210o. The two excitations were combined using the frequency thatwas most effective for leading edge separation control. Particle Image Velocimetry (PIV) data revealed thatat a phase angle of 210o, the oscillating shear layer was closer to the surface during the suction portionof the cycle of the flap shoulder excitation.7 Based on the two models studied, the optimal phase anglefor combining two excitations is dependent upon the distance between the excitation slots, the excitationfrequency, and the freestream velocity.
The semi-span model, with a NACA 0015 cross-section, designed and tested by Greenblatt7 was used for thecurrent investigation. While most of the research planned for this model will focus on the 3D configuration,the 2D experiments presented in this paper were performed to incorporate a balance into the system. The2D experiment also provided the opportunity to gather additional data that will be useful in selecting andlocating additional trailing edge flap actuators and to study the transients of flow separation and attachmentin preparation for planned closed-loop control research. The results of Greenblatt and Washburn8 suggestthat there is a need for additional and/or different actuators for improved control authority on the three-dimensional model configuration. The balance measurements will provide an independent measurement ofthe forces and moments for comparison to the surface pressure interpolation method described in reference9 and used on the 3D configuration. In this paper we focus on controlling separation on the deflected flap ofthe airfoil at an angle of attack, α, greater than 0 degrees where the momentum requirements for controllingseparation are considered relatively high compared to those required at lower angles of attack. Force andmoment data and Particle Image Velocimetery (PIV) data will be presented to illustrate the effects thatfrequency and amplitude have on separation control.
II. Experiment Description
A. Wind Tunnel Description
The experiments were conducted in the NASA Langley Research Center (LaRC) 2 Foot x 3 Foot Low SpeedWind Tunnel. The 10:1 contraction ratio closed-circuit tunnel has a test section that is 0.61 m high x 0.91m wide by 6.1 m long. The tunnel turbulence intensities are approximately 0.1% between 0.1 < f < 400 Hz.Additional information about the wind tunnel can be found in reference 10. The maximum velocity of thetunnel is approximately 45 m/s. The data that will be presented were acquired at a chord Reynolds numberof 0.25 x 10⁶, corresponding to a tunnel velocity of approximately 13 m/s.
B. Model Description
The model tested is a 0.3048 m chord (c), 0.6096 m span (s) airfoil that Greenblatt7 tested in a 3D configu-ration in the 0.711 m x 1.016 m test section of the LaRC Basic Aerodynamics Research Tunnel. The airfoilhas a 30% chord trailing edge flap divided into three sections that can be tested at flap deflections, δf , from-10 to 40 in 10 increments. The results presented are with all sections of the flap at the same deflectionangle (δf = 0o, 20, or 40). Internal chambers in the model connected to slots in the airfoil surface at theleading edge and flap shoulder of the model are used to introduce periodic excitation for separation control.The 0.5 mm wide leading edge slot and 0.76 mm wide flap shoulder slot were designed so that the air exitingthe slot would be nearly tangential to the model surface. In the case of the flap shoulder slot, the excitationis nearly tangential when δf = 0. The model has four rows of streamwise pressure taps at spanwise (y/s)locations of 0.17, 0.5, 0.83, and 0.99 and four rows of spanwise pressure taps at streamwise (x/c) locationsof 0.005, 0.3, 0.705, and 1.0. There are three unsteady pressure transducers in the model’s internal cavities
3 of 18
American Institute of Aeronautics and Astronautics

and 12 unsteady pressure transducers connected to orifices on the model upper surface located at x/c=0.005,0.30, 0.705, and 1.0 at y/s locations of 0.163, 0.496, and 0.829. The unsteady pressure voltage signals andbalance voltage signals were low-pass filtered at 5 kHz and sampled at a rate of 12.8 kHz.
(a) Vertical model installationlower surface view.
x
y
test section floor
test section ceiling
y/s=0.17
y/s=0.5
y/s=0.83
UPIV plane
LETE
0.3048
0.6096
flap slot
(b) Schematic of model upper sur-face.
(c) PIV region definition.
Figure 1. Model description for installation in NASA LaRC 2 Foot x 3 Foot Wind Tunnel.
The model is oriented vertically in the tunnel for this 2D test as shown in figures 1(a) and 1(b). In preparationfor additional testing of the 3D configuration of the model, the model was mounted to a 5-component externalstrain gage balance. The General Aviation Circulation Control (GACC) balance, with characteristics shownin Table 1, was designed for a vertically mounted model.11 To prevent fouling, there is a 2.5 mm gap betweenthe model and the ceiling of the tunnel. The balance chosen for the 2D tests limited the maximum Reynoldsnumber of the experiment. The balance that will be used for follow-on 3D testing has higher load andpitching moment limits so the Reynolds number range of the tests will not be limited by the balance.
Force/Moment Limit Accuracy, % Full Scale
Normal 100 lb 0.04Axial 5 lb 0.39Pitching Moment 400 in-lb 0.12Rolling Moment 1200 in-lb 0.07Yawing Moment 40 in-lb 1.64
Table 1. GACC Balance limits
C. AFC Actuators
Excitation is provided by two externally mounted electromagnetic actuators. The actuators are connectedto the model’s leading edge and flap shoulder slots by manifolds that attach to the turntable of the model.Bench-top calibrations using a hot-wire were performed prior to the wind tunnel test to determine thevelocity fluctuations produced by each actuator. A sine wave with a frequency in the range of 50 Hz to400 Hz is used to drive the actuators. Dynamic pressure transducers located in the leading and trailingedge slot cavities are used to correlate the velocity perturbations produced during bench-top testing to thoseproduced during wind tunnel testing. The actuators are capable of producing peak velocities in excess of50 m/s. External actuation introduced from one side of the model resulted in a reduction in the spanwiseuniformity of the excitation. The excitation was strongest near the model endplate and the non-uniformitywas more pronounced as the excitation frequency increased. Although the actuators and manifolds used forthis experiment differ from those used by Greenblatt and Washburn,8 the trends they observed in terms ofspanwise uniformity as a function of frequency are similar to the ones observed during this investigation. The
4 of 18
American Institute of Aeronautics and Astronautics

oscillatory momentum coefficient (Cµ) values that will be presented are based on the actuator calibrationsperformed at y/s=0.5.
D. Particle Image Velocimetry
A commercially available high speed Particle Image Velocimetry (PIV) system was used during the test. Thesystem consists of a high speed laser and a 1280 x 1024 camera with an internal intensifier. The maximumframe rate of the camera is approximately 1 kHz in single exposure mode and approximately 500 Hz indouble exposure mode. The internal memory of the camera limits an acquisition to a little more than 1600image pairs. A 105 mm macro lens was used with the camera, and the field of view was 135 mm x 107 mmfor the δf = 40 data and 98 mm x 78 mm for the δf = 20 data. For most of the data presented, a 32 pixelx 32 pixel (3.38 mm x 3.34 mm for δf = 40 and 2.45 mm x 2.44 mm for δf = 20) interrogation window isused with a maximum overlap in the horizontal and vertical direction of 50%. The PIV region for δf = 40
is shown in figure 1(c). The δf = 40 PIV data were acquired before the δf = 20 PIV data and the fieldof view was reduced after completing the measurements of the first configurations to improve the signal tonoise ratio near the flap shoulder. To avoid possible damage to the camera CCD, the laser was aligned sothat the light sheet was almost parallel to the flap of the model. This arrangement provides user control overthe intensity of the laser light sheet that is permitted to impinge the model, and therefore provides controlover the intensity of the light exposed to the camera sensor. The camera was located above the test sectionand was rotated to be at the same angle as the flap of the model to increase the amount of the flowfieldabove the flap surface included in each image. All of the PIV data were acquired at y/s=0.52 slightly abovethe centerline row of streamwise pressure taps as shown in figure 1(b). The flowfield was seeded with oliveoil using a single-jet atomizer that generated particles approximately a micron in size. The baseline datapresented were acquired at rates near 500 Hz and 1600 image pairs were used to compute the mean valuespresented. The data acquired when F+ = 0.71 were acquired phase locked to the excitation, i.e. 100 Hzsample rate, and 300 (δf = 40o) or 400 (δf = 20o) image pairs were averaged to compute the mean value ateach phase of the excitation cycle. The data presented when using the F+ = 0.36 excitation were acquiredat a sample rate of 400 Hz and each phase of the excitation is an average of 200 image pairs. The datapresented when using burst modulation is an average of 200 image pairs that were sampled at a rate eighttimes the modulation frequency. A cross-correlation algorithm was used to process the PIV data. Additionalanalysis of the PIV results is required before quantitative information can be obtained from the data.
E. Wake Rake
A wake rake located 4.5 chord lengths downstream of the midchord of the model was used to survey thewake. Most of the wake surveys were performed using a rake at a fixed spanwise location, y/s=0.5, that has31 total probes with a probe spacing of 17.78 mm. Two pressure orifices on opposite tunnel walls, alignedwith the wake rake total probes, were averaged to determine wake static pressure. This type of wake rakeenabled the wake to be surveyed with only a few moves of the wake rake. However, the total drag valuescomputed from data using this wake rake were lower than the total drag from balance data and the pressuredrag computed from surface static pressures. Based on the recommendations in reference 12 and results froma recent experiment13 in the facility, a second wake rake was used during the experiment. This wake rakewith six total probes spaced 25.4 mm apart in the spanwise direction, y, enabled the spanwise variations intotal drag to be measured and enabled the static pressure in the wake to be measured. The time requiredto acquire a wake survey increased because the wake rake had to be moved across the entire wake of themodel. A limited amount of data will be presented from this wake rake.
F. Experimental Uncertainty
The method described in reference 14 is used to compute uncertainties of the data. The chord Reynoldsnumber, Rec is accurate to within 3%. The oscillatory momentum coefficient, Cµ, is accurate to within25% (partly due to slot width uncertainties and partly due to the calibration uncertainties). The dynamicpressure is accurate to within ±0.65 Pa.
5 of 18
American Institute of Aeronautics and Astronautics

III. Discussion
A. Baseline Flow Field
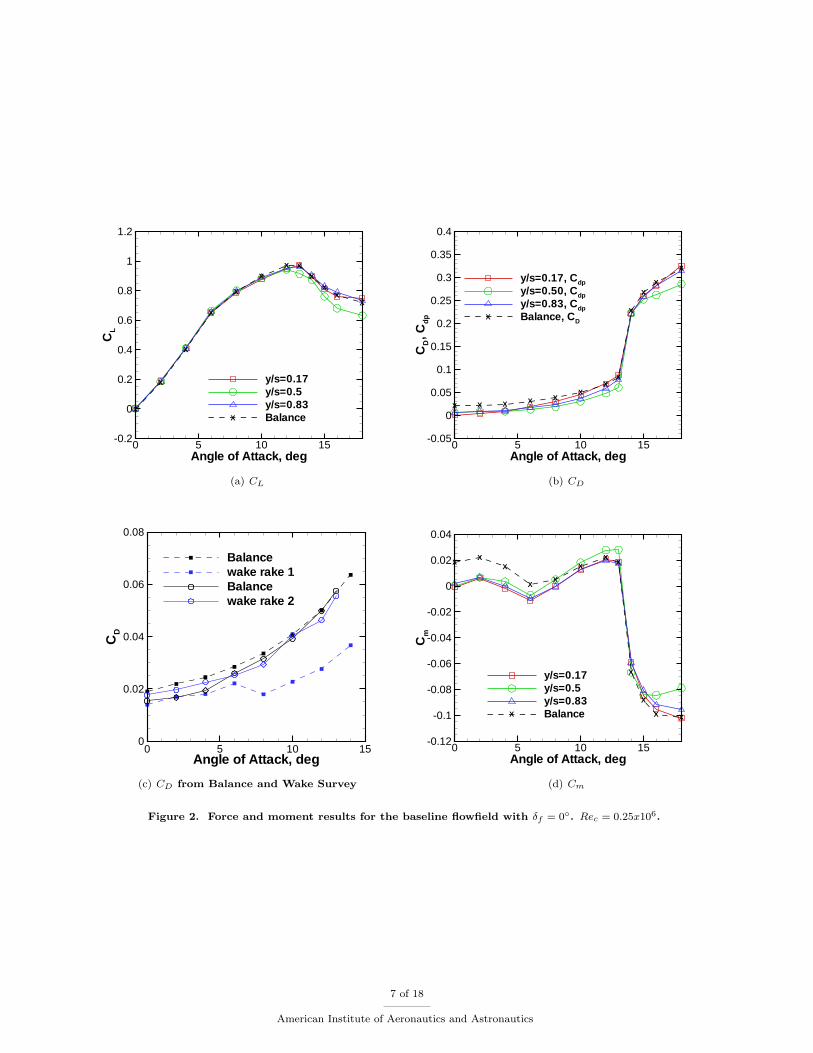
Prior to the application of active flow control from either excitation slot, the baseline flow field was examined.Since a primary objective of the test is to compare balance force and moment data with integrated valuesfrom surface pressures, data are presented comparing the two methods. Figure 2(a) presents the variation oflift with angle of attack data for the straight airfoil (δf = 0). The lift curves for the three inboard spanwise(y/s) locations where nominally 2D flow is expected are shown. The pressure taps located at y/s=0.99 (notshown) are near the gap between the airfoil and the tunnel ceiling and 3D effects are evident in the pressuredistributions. The values of CL calculated by integrating surface pressures are uniform between y/s=0.17and y/s=0.83 prior to stall. As stall is approached, some differences are observed in the stall characteristics ofthe flowfield. Lift data obtained using the pressure taps at y/s=0.5 indicate at that location the airfoil has alower CL,max, stalls sooner, and has lower lift values post stall compared to the other two spanwise locationsand the balance data. The values of CL obtained by integrating pressures at different spanwise locationsare similar prior to stall. For the other flap deflections (δf = 20 and δf = 40 not shown) considered, thebalance lift results compare reasonably well with the lift values obtained by integrating the surface pressures.There is slightly more variation in lift as a function of span for the δf = 20 and δf = 40 cases prior tostall, probably due to the separated flow on the flap of the model.
Pressure drag computed by integrating surface pressures and total drag measured by the balance are com-pared in Fig. 2(b). The total drag measured by the balance is higher than Cdp because of the skin frictiondrag that is also measured by the balance. There is fairly good agreement between the pressure drag forthe three spanwise locations provided in figure 2(b). Prior to airfoil stall, the largest differences in Cdpvalues occurs between α = 6 and α = 13. Post stall trends are similar to the lift data of figure 2(a). Thecomparisons of drag performed at flap deflections of 20o and 40o (not shown) are similar to the comparisonat δf = 0. Wake surveys were also performed to determine total drag. The data of figure 2(c) illustratesthat using the wake rake at a fixed y/s location with static pressure measured on the tunnel sidewall resultedin drag measurements for angles of attack above 6 that were not comparable to the total drag measuredby the balance. The wake rake (wake rake 2 in figure 2(c)) that enabled static pressures to be measuredwithin the wake did a better job of measuring total drag. The spanwise variation of CD was also obtainedusing this wake rake and illustrated that for the Reynolds numbers of this test, wake surveys at more thanone y location improved the accuracy of the drag measurements using the wake survey method. The CDvalues, obtained using wake rake 2, shown in figure 2(c) were computed from data acquired with the wakerake fixed at a single y/s location. Note, wake rake 2 has six total probes with a 25.4 mm spacing in y. Thedata presented is the average total drag in the interval 0.42 < y/s < 0.63.
Figure 2(d) illustrates the differences in pitching moment between balance and integrated pressure mea-surements. The largest difference between balance and integrated pressure results occurs when comparingpitching moment. Some of the differences are due to the higher uncertainty in the measurement of pitchingmoment using the balance.
The post-stall Cp data (not shown) for the airfoil with δf = 0 as well as the higher flap deflections indicatethe model stalled as a result of laminar leading edge (LE) separation rather than trailing edge separation.For this reason, the results presented focus on trailing edge flap separation control at angle of attack settingsbelow CL,max. The flowfield where the excitation is being introduced should be turbulent and thus reducethe contributions of transitional effects to the overall effectiveness of the control. Leading edge control wasrevisited later in the experiment and a transition strip comprised of tape was added near the stagnationpoint to prevent laminar LE separation. These data are not presented in the paper, however some of thetrailing edge flap results included are with this strip on the model.
Streamwise velocity contours from PIV measurements acquired along the flap of the model at y/s=0.52 arepresented in figure 3 for δf = 20 and δf = 40 to illustrate the differences in the baseline flowfields that willbe controlled. These figures indicate that the separation region is much larger with the larger flap deflection.Note that the PIV data is in airfoil coordinates and is normalized by the maximum velocity determined fromthe PIV data. The data of figure 3 are the mean values computed from 1600 image pairs acquired at samplerates of 500 Hz and 474 Hz for the δf = 20 and δf = 40 data, respectively.
6 of 18
American Institute of Aeronautics and Astronautics
X
X
X
X
X
XX X
X
XX
X
Angle of Attack, deg
CL
0 5 10 15-0.2
0
0.2
0.4
0.6
0.8
1
1.2
y/s=0.17y/s=0.5y/s=0.83BalanceX
(a) CL
X X X X XX
XX
X
XX
X
Angle of Attack, deg
CD,C
dp
0 5 10 15-0.05
0
0.05
0.1
0.15
0.2
0.25
0.3
0.35
0.4
y/s=0.17, Cdp
y/s=0.50, Cdp
y/s=0.83, Cdp
Balance, CDX
(b) CD
Angle of Attack, deg
CD
0 5 10 150
0.02
0.04
0.06
0.08
Balancewake rake 1Balancewake rake 2
(c) CD from Balance and Wake Survey
XX
X
XX
XX
X
X
X
X X
Angle of Attack, deg
Cm
0 5 10 15-0.12
-0.1
-0.08
-0.06
-0.04
-0.02
0
0.02
0.04
y/s=0.17y/s=0.5y/s=0.83BalanceX
(d) Cm
Figure 2. Force and moment results for the baseline flowfield with δf = 0. Rec = 0.25x10⁶.
7 of 18
American Institute of Aeronautics and Astronautics

(a) δf = 20. (b) δf = 40.
Figure 3. Normalized velocity contours comparing δf = 20 and δf = 40 flowfields. Rec = 0.25x10⁶, α = 6.
B. Controlled Trailing Edge Flap Flowfield
In this section, we present trailing edge flap separation control results for δf = 20 and δf = 40o. The twoflap deflections, δf = 20 and δf = 40o, studied were chosen because they represent a moderate and highflap deflection angle and there is existing data in the literature for comparison. With the exception of thelift as a function of angle of attack data presented, the model is at an angle of attack of 6 degrees. Thisangle of attack is a more difficult case for separation control because the larger adverse pressure gradientand lower momentum flow require larger momentum additions for flow reattachment than angles of attacknear α = 0, as noted in reference 15.
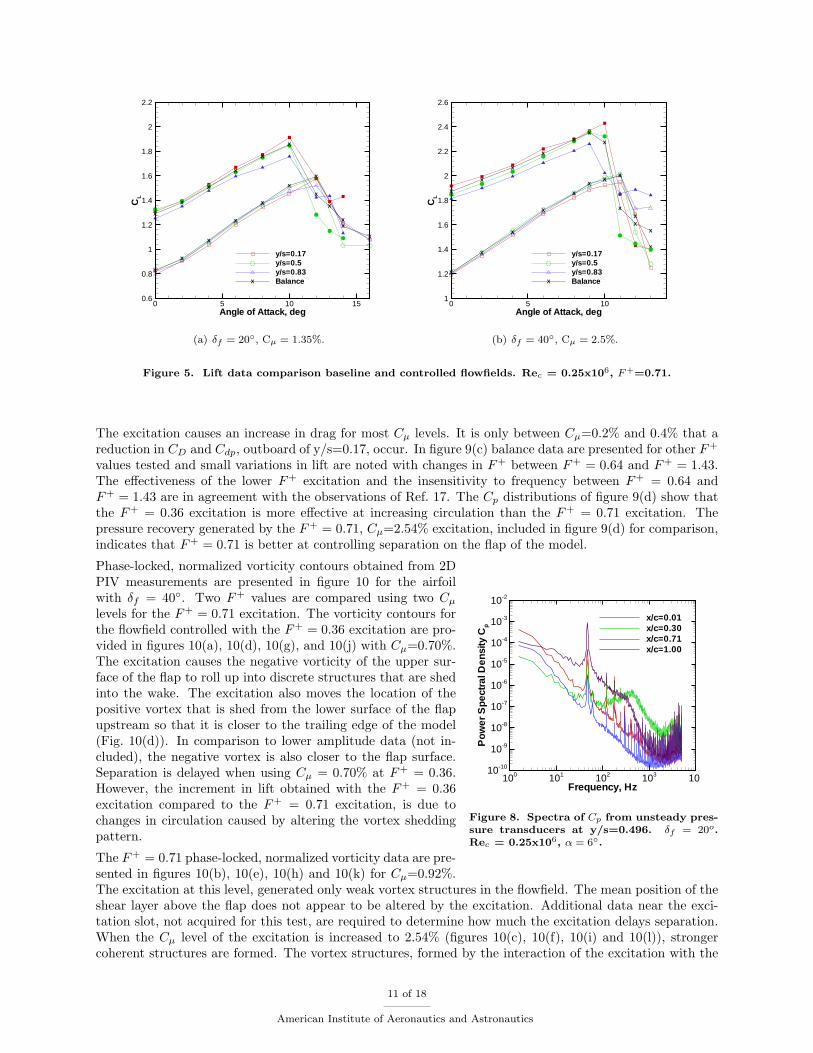
The lift increments obtained when applying F+ = 0.71 control with α = 6 and Rec = 0.25x10⁶ are shownin figure 4 for the two flap deflection angles. Integrated lift data at three spanwise locations are comparedwith balance data. The lift increment, obtained when excitation is introduced at the flap shoulder, decreasesas y/s increases. The spanwise variations in lift increment observed in figures 4(a) and 4(b) agree with theactuator bench-top calibration data that showed excitation slot velocity decreases as y/s increases. The dataalso indicate that CL increases as the excitation amplitude, Cµ, increases. The comparison of the balance liftdata with the integrated lift data reveals that the balance data agree well with the y/s = 0.5 integral dataand both appear to represent the average lift of the model. If one then uses the balance data for comparingperformance improvements, to obtain a lift increment of 0.4, requires Cµ=1.3% for δf = 20o and Cµ=2.1%for δf = 40. Drag results presented in figures 4(c) and 4(d) are not as straightforward to interpret. Controlincreases Cdp at y/s=0.17 whereas Cdp at y/s=0.5 and y/s=0.83 remain below the baseline value. TheCdp data shown in figure 4(c), reaches a minimum below Cµ ≈ 0.5% at y/s=0.50 and y/s=0.83, thereafterCdp increases. The balance results indicate that total drag decreases as excitation amplitude, Cµ increases.Similar trends in CD and Cdp were observed for other excitation frequencies. The variation of lift with angleof attack is shown in figures 5 comparing the baseline and controlled flowfields. The lift increment betweenbaseline and controlled flowfields indicates, as expected, that the application of control results in a moreeffective flap.
The Cp distributions for δf = 20 presented in figure 4(e) and δf = 40 presented in figure 4(f) obtainedalong the centerline (y/s=0.5) of the model indicate that the zero mass flux excitation introduced at the flapshoulder increases circulation upstream of the excitation slot and delays separation on the trailing edge flap.The flow over the baseline flap is separated over the entire flap for both flap deflection angles, evidencedby the plateau in pressures on the flap. As noted in other active separation control studies2 using a NACA0015, control at the flap shoulder results in a more positive trailing edge pressure making the trailing edgepressure an indicator of the effectiveness of the applied excitation for controlling flap separation. Separation
8 of 18
American Institute of Aeronautics and Astronautics

is almost completely eliminated for δf = 20 with Cµ=1.50%. The trailing edge Cp values for δf = 40 infigure 4(f) indicate that the Cµ=2.54% excitation does not delay separation significantly, but there is somepressure recovery (pressure increases as x/c increases for x/c > 0.75) for this excitation level compared tothe baseline and Cµ=0.92% Cp distributions.
C. PIV Results
In the following sections, phase-locked vorticity data from PIV measurements will be presented to determinehow the excitation introduced at the flap shoulder interacts with the separating shear layer for the two flapdeflections. Results will be presented for the δf = 20 airfoil followed by the δf = 40 airfoil.
1. TE AFC with δf = 20
A reduced frequency in the range of 0.3 < F+ < 4.03 is considered the most effective frequency for controllingseparation on a 2D airfoil. Data acquired but not presented indicated an insensitivity to frequency withinthe frequency range of the actuator when considering lift increment. Drag was observed to decrease withincreasing frequency as noted in reference 16. The δf = 20 PIV data was obtained at F+=0.71 correspondingto an excitation frequency of 100 Hz due to the insensitivity of ∆CL to frequency and the improved spanwiseuniformity at lower actuation frequencies. The Cp distributions at y/s=0.5 presented in figure 4(e) indicatethat as Cµ increases the extent of separated flow over the trailing edge flap surface is reduced. Mean vorticity(Ω∗c/U∞) contours for the baseline flowfield are presented in figure 6 and the negative vorticity data indicatethe mean location of the separated shear layer relative to the flap surface.
Figure 6. Baseline vorticity con-tours. δf = 20o. Rec = 0.25x10⁶,α = 6.
Phase-locked vorticity contours are presented in figure 7 for the Cµ levelsof figure 4(e). In each phase of the excitation cycle when using Cµ = 0.42%(Fig. 7(a), 7(d), 7(g), and 7(j)), distinct vortex structures are observedin the flowfield. These coherent structures introduced into the flowfieldare incapable of bringing the shear layer to the flap surface. The vortic-ity contours for the Cµ = 0.89% excitation, shown in figures 7(b), 7(e),7(h),and 7(k), indicate that this level of excitation is capable of deflectingthe shear layer towards the flap surface. In comparison to the Cµ = 0.42%data of figures 7(a), 7(a), 7(g), and 7(j), the additional momentum resultsin a significant improvement in airfoil performance. The Cµ = 1.58% ex-citation data of figures 7(c), 7(f), 7(i), and 7(l) indicate that the shearlayer is at the flap surface over most of the flap chord. There is a vortexthat begins to form at φ = 270 (7(l)), rolls up at φ = 0 (7(c)), hastraveled almost out of the field of view of the data at φ = 90 (7(f)), andis out of the field of view at φ = 180 (7(i)). A question that comes tomind when looking at the data in terms of a more efficient approach toseparation control, is whether locating a second actuator on the flap near ξ/c=0.8 would reduce the totalmomentum requirement for complete flow reattachment to the flap.
2. TE AFC with δf = 40
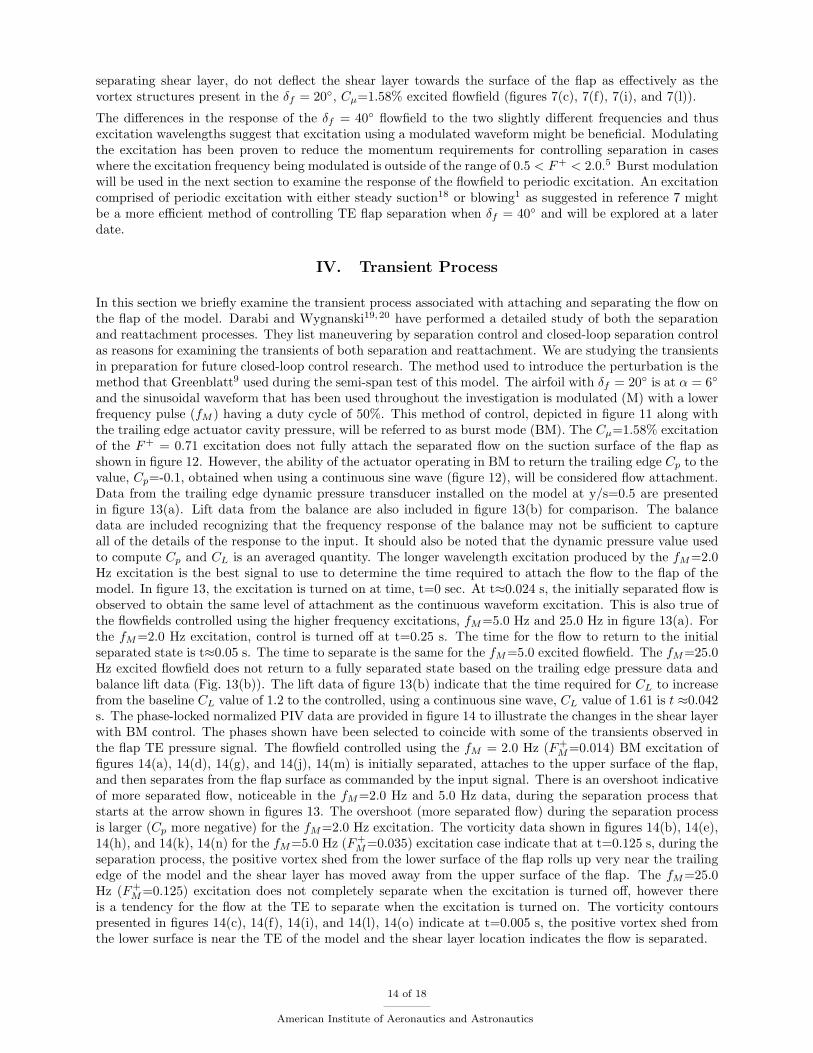
The δf = 20 vorticity data of figure 7 illustrated how the F+ = 0.71 periodic excitation introduced into theseparated shear layer interacted with the separated shear layer to delay the average separation location onthe upper surface of the flap. Similar data will be presented in this section for the airfoil when δf = 40. Theairfoil angle of attack is fixed at α = 6. One of the most noticeable differences between the δf = 20 andthe δf = 40 baseline flowfields is the presence of a dominant frequency in the voltage signal of practicallyevery dynamic pressure transducer on the model for the δf = 40 case. For the freestream velocity of thistest, U≈13 m/s, the frequency is f=47 Hz as shown in figure 8. Since the actuators used for control werecalibrated between the range of 50 Hz and 400 Hz, we excited the flow at a frequency of 50 Hz correspondingto F+ = 0.36 to determine the response of the flowfield to this F+ as well as at F+ = 0.71. The variationsof CL, CD and Cdp with Cµ are presented in figure 9(a) and figure 9(b). The momentum requirementsfor a given lift increment are reduced compared to the δf = 40, F+ = 0.71 excitation of figure 4(b).
9 of 18
American Institute of Aeronautics and Astronautics

x
xx
x
x
x
x
x
x
Cµ, %
∆CL
0 0.5 1 1.5 2 2.5 30
0.1
0.2
0.3
0.4
0.5
0.6
0.7
y/s=0.17y/s=0.5y/s=0.83Balancex
(a) δf = 20, ∆CL.
xx
xx
x
x
x
x
x
x
Cµ, %
∆CL
0 0.5 1 1.5 2 2.5 30
0.1
0.2
0.3
0.4
0.5
0.6
0.7
y/s=0.17y/s=0.5y/s=0.83Balancex
(b) δf = 40, ∆CL.
x
x
x
x
xx x x
x
Cµ, %
∆CD,∆
Cdp
0 0.5 1 1.5 2 2.5 3
-0.02
0
0.02y/s=0.17, ∆Cdp
y/s=0.50, ∆Cdp
y/s=0.83, ∆Cdp
Balance, ∆CDx
(c) δf = 20, F+ = 0.71, ∆CD, dp.
xx
x
xx
x
xx x x
Cµ, %
∆CD,∆
Cdp
0 0.5 1 1.5 2 2.5 3-0.06
-0.04
-0.02
0
0.02
0.04
0.06
y/s=0.17, ∆Cdp
y/s=0.50, ∆Cdp
y/s=0.83, ∆Cdp
Balance, ∆CDx
(d) δf = 40, ∆CD, dp.
x/c
Cp
0 0.2 0.4 0.6 0.8 1
-6
-5
-4
-3
-2
-1
0
1
Cµ=0.0%Cµ=0.40%Cµ=.85%Cµ=1.50%
(e) δf = 20, Cp.
x/c
Cp
0 0.2 0.4 0.6 0.8 1
-7
-6
-5
-4
-3
-2
-1
0
1
Cµ=0.0%Cµ=0.92%Cµ=2.54%
(f) δf = 40, Cp.
Figure 4. Lift increment due to trailing edge flap control. Rec = 0.25x10⁶, F+ = 0.71.
10 of 18
American Institute of Aeronautics and Astronautics
X
X
X
X
X
X
X
X
X
X
X
X
X
X
X
X
X
X
Angle of Attack, deg
CL
0 5 10 150.6
0.8
1
1.2
1.4
1.6
1.8
2
2.2
y/s=0.17y/s=0.5y/s=0.83BalanceX
(a) δf = 20, Cµ = 1.35%.
X
X
X
X
X
XX
X
X
X
X
X
X
X
XX
X
X
XX
Angle of Attack, deg
CL
0 5 101
1.2
1.4
1.6
1.8
2
2.2
2.4
2.6
y/s=0.17y/s=0.5y/s=0.83BalanceX
(b) δf = 40, Cµ = 2.5%.
Figure 5. Lift data comparison baseline and controlled flowfields. Rec = 0.25x10⁶, F+=0.71.
The excitation causes an increase in drag for most Cµ levels. It is only between Cµ=0.2% and 0.4% that areduction in CD and Cdp, outboard of y/s=0.17, occur. In figure 9(c) balance data are presented for other F+
values tested and small variations in lift are noted with changes in F+ between F+ = 0.64 and F+ = 1.43.The effectiveness of the lower F+ excitation and the insensitivity to frequency between F+ = 0.64 andF+ = 1.43 are in agreement with the observations of Ref. 17. The Cp distributions of figure 9(d) show thatthe F+ = 0.36 excitation is more effective at increasing circulation than the F+ = 0.71 excitation. Thepressure recovery generated by the F+ = 0.71, Cµ=2.54% excitation, included in figure 9(d) for comparison,indicates that F+ = 0.71 is better at controlling separation on the flap of the model.
Frequency, Hz
Po
wer
Sp
ectr
alD
ensi
tyC
p
100 101 102 103 1010-10
10-9
10-8
10-7
10-6
10-5
10-4
10-3
10-2
x/c=0.01x/c=0.30x/c=0.71x/c=1.00
Figure 8. Spectra of Cp from unsteady pres-sure transducers at y/s=0.496. δf = 20o.Rec = 0.25x10⁶, α = 6.
Phase-locked, normalized vorticity contours obtained from 2DPIV measurements are presented in figure 10 for the airfoilwith δf = 40. Two F+ values are compared using two Cµlevels for the F+ = 0.71 excitation. The vorticity contours forthe flowfield controlled with the F+ = 0.36 excitation are pro-vided in figures 10(a), 10(d), 10(g), and 10(j) with Cµ=0.70%.The excitation causes the negative vorticity of the upper sur-face of the flap to roll up into discrete structures that are shedinto the wake. The excitation also moves the location of thepositive vortex that is shed from the lower surface of the flapupstream so that it is closer to the trailing edge of the model(Fig. 10(d)). In comparison to lower amplitude data (not in-cluded), the negative vortex is also closer to the flap surface.Separation is delayed when using Cµ = 0.70% at F+ = 0.36.However, the increment in lift obtained with the F+ = 0.36excitation compared to the F+ = 0.71 excitation, is due tochanges in circulation caused by altering the vortex sheddingpattern.
The F+ = 0.71 phase-locked, normalized vorticity data are pre-sented in figures 10(b), 10(e), 10(h) and 10(k) for Cµ=0.92%.The excitation at this level, generated only weak vortex structures in the flowfield. The mean position of theshear layer above the flap does not appear to be altered by the excitation. Additional data near the exci-tation slot, not acquired for this test, are required to determine how much the excitation delays separation.When the Cµ level of the excitation is increased to 2.54% (figures 10(c), 10(f), 10(i) and 10(l)), strongercoherent structures are formed. The vortex structures, formed by the interaction of the excitation with the
11 of 18
American Institute of Aeronautics and Astronautics

(a) φ=0, Cµ=0.42%. (b) φ=0, Cµ=0.89%. (c) φ=0, Cµ=1.58%.
(d) φ=90, Cµ=0.42%. (e) φ=90, Cµ=0.89%. (f) φ=90, Cµ=1.58%.
(g) φ=180, Cµ=0.42%. (h) φ=180, Cµ=0.89%. (i) φ=180, Cµ=1.58%.
(j) φ=270, Cµ=0.42%. (k) φ=270, Cµ=0.89%. (l) φ=270, Cµ=1.58%.
Figure 7. Phase-locked, normalized vorticity (Ω ∗ c/U∞) contours from PIV measurements with δf = 20. Rec= 0.25x10⁶, α = 6, F+=0.71.
12 of 18
American Institute of Aeronautics and Astronautics

xx x
x
x
x
x
x
Cµ, %
∆CL
0 0.2 0.4 0.6 0.80
0.1
0.2
0.3
0.4
0.5
0.6
0.7
y/s=0.17y/s=0.5y/s=0.83Balancex
(a) Cµ effect on lift for F+ = 0.36.
xx
xx
x
xx x
Cµ, %∆C
D,∆
Cdp
0 0.2 0.4 0.6-0.06
-0.04
-0.02
0
0.02
0.04
0.06
y/s=0.17, ∆Cdp
y/s=0.50, ∆Cdp
y/s=0.83, ∆Cdp
Balance, ∆CDx
(b) Cµ effect on drag for F+ = 0.36.
XX
X
X
Cµ, %
CL
0 0.5 1 1.5 2 2.5 3-0.1
0
0.1
0.2
0.3
0.4
0.5
0.6
F+=0.36F+=0.64F+=0.71F+=0.79F+=0.89F+=1.43
X
(c) Cµ effect on lift, F+ varied.
x/c
Cp
0 0.2 0.4 0.6 0.8 1
-7
-6
-5
-4
-3
-2
-1
0
1
Cµ=0.0%Cµ=0.36%Cµ=0.70%F+=0.71, Cµ=2.54%
(d) Cp distributions for F+ = 0.36.
Figure 9. Lift increment, lift, and Cp results for the δf = 40o flowfield. Rec = 0.25x10⁶.
13 of 18
American Institute of Aeronautics and Astronautics
separating shear layer, do not deflect the shear layer towards the surface of the flap as effectively as thevortex structures present in the δf = 20, Cµ=1.58% excited flowfield (figures 7(c), 7(f), 7(i), and 7(l)).
The differences in the response of the δf = 40 flowfield to the two slightly different frequencies and thusexcitation wavelengths suggest that excitation using a modulated waveform might be beneficial. Modulatingthe excitation has been proven to reduce the momentum requirements for controlling separation in caseswhere the excitation frequency being modulated is outside of the range of 0.5 < F+ < 2.0.5 Burst modulationwill be used in the next section to examine the response of the flowfield to periodic excitation. An excitationcomprised of periodic excitation with either steady suction18 or blowing1 as suggested in reference 7 mightbe a more efficient method of controlling TE flap separation when δf = 40 and will be explored at a laterdate.
IV. Transient Process
In this section we briefly examine the transient process associated with attaching and separating the flow onthe flap of the model. Darabi and Wygnanski19,20 have performed a detailed study of both the separationand reattachment processes. They list maneuvering by separation control and closed-loop separation controlas reasons for examining the transients of both separation and reattachment. We are studying the transientsin preparation for future closed-loop control research. The method used to introduce the perturbation is themethod that Greenblatt9 used during the semi-span test of this model. The airfoil with δf = 20 is at α = 6
and the sinusoidal waveform that has been used throughout the investigation is modulated (M) with a lowerfrequency pulse (fM ) having a duty cycle of 50%. This method of control, depicted in figure 11 along withthe trailing edge actuator cavity pressure, will be referred to as burst mode (BM). The Cµ=1.58% excitationof the F+ = 0.71 excitation does not fully attach the separated flow on the suction surface of the flap asshown in figure 12. However, the ability of the actuator operating in BM to return the trailing edge Cp to thevalue, Cp=-0.1, obtained when using a continuous sine wave (figure 12), will be considered flow attachment.Data from the trailing edge dynamic pressure transducer installed on the model at y/s=0.5 are presentedin figure 13(a). Lift data from the balance are also included in figure 13(b) for comparison. The balancedata are included recognizing that the frequency response of the balance may not be sufficient to captureall of the details of the response to the input. It should also be noted that the dynamic pressure value usedto compute Cp and CL is an averaged quantity. The longer wavelength excitation produced by the fM=2.0Hz excitation is the best signal to use to determine the time required to attach the flow to the flap of themodel. In figure 13, the excitation is turned on at time, t=0 sec. At t≈0.024 s, the initially separated flow isobserved to obtain the same level of attachment as the continuous waveform excitation. This is also true ofthe flowfields controlled using the higher frequency excitations, fM=5.0 Hz and 25.0 Hz in figure 13(a). Forthe fM=2.0 Hz excitation, control is turned off at t=0.25 s. The time for the flow to return to the initialseparated state is t≈0.05 s. The time to separate is the same for the fM=5.0 excited flowfield. The fM=25.0Hz excited flowfield does not return to a fully separated state based on the trailing edge pressure data andbalance lift data (Fig. 13(b)). The lift data of figure 13(b) indicate that the time required for CL to increasefrom the baseline CL value of 1.2 to the controlled, using a continuous sine wave, CL value of 1.61 is t ≈0.042s. The phase-locked normalized PIV data are provided in figure 14 to illustrate the changes in the shear layerwith BM control. The phases shown have been selected to coincide with some of the transients observed inthe flap TE pressure signal. The flowfield controlled using the fM = 2.0 Hz (F+
M=0.014) BM excitation offigures 14(a), 14(d), 14(g), and 14(j), 14(m) is initially separated, attaches to the upper surface of the flap,and then separates from the flap surface as commanded by the input signal. There is an overshoot indicativeof more separated flow, noticeable in the fM=2.0 Hz and 5.0 Hz data, during the separation process thatstarts at the arrow shown in figures 13. The overshoot (more separated flow) during the separation processis larger (Cp more negative) for the fM=2.0 Hz excitation. The vorticity data shown in figures 14(b), 14(e),14(h), and 14(k), 14(n) for the fM=5.0 Hz (F+
M=0.035) excitation case indicate that at t=0.125 s, during theseparation process, the positive vortex shed from the lower surface of the flap rolls up very near the trailingedge of the model and the shear layer has moved away from the upper surface of the flap. The fM=25.0Hz (F+
M=0.125) excitation does not completely separate when the excitation is turned off, however thereis a tendency for the flow at the TE to separate when the excitation is turned on. The vorticity contourspresented in figures 14(c), 14(f), 14(i), and 14(l), 14(o) indicate at t=0.005 s, the positive vortex shed fromthe lower surface is near the TE of the model and the shear layer location indicates the flow is separated.
14 of 18
American Institute of Aeronautics and Astronautics

(a) φ=0, F+ = 0.36, Cµ=0.70% . (b) φ=0, F+ = 0.71, Cµ=0.92% . (c) φ=0, F+ = 0.71, Cµ=2.54%.
(d) φ=90, F+ = 0.36, Cµ=0.70%. (e) φ=90, F+ = 0.71, Cµ=0.92%. (f) φ=90, F+ = 0.71, Cµ=2.54%.
(g) φ=180, F+ = 0.36, Cµ=0.70% . (h) φ=180, F+ = 0.71, Cµ=0.92%. (i) φ=180, F+ = 0.71, Cµ=2.54%.
(j) φ=270, F+ = 0.36, Cµ=0.70% . (k) φ=270, F+ = 0.71, Cµ=0.92%. (l) φ=270, F+ = 0.71, Cµ=2.54%.
Figure 10. Phase-locked, normalized vorticity contours from PIV measurements with δf = 40o. Rec = 0.25x10⁶,α = 6o.
15 of 18
American Institute of Aeronautics and Astronautics

Time, s
cavi
typr
essu
re,p
/q
0 0.25 0.5
0
1
2
-3
-2
-1
0
1
2cavity p/qactuator input
Figure 11. Actuator input signal and TE actuator cav-ity pressure response. Rec = 0.25x10⁶, α = 6, fM=2.0Hz.
x/c
Cp
0 0.2 0.4 0.6 0.8 1
-6
-5
-4
-3
-2
-1
0
1
BaselineF+=0.71
Figure 12. Effect of F+ = 0.71, Cµ = 1.46% on Cp at y/s= 0.5. Rec = 0.25x10⁶, α = 6.
Time, s
-Cp
0 0.05 0.1 0.15 0.2 0.25 0.3 0.35 0.4 0.45 0.5
0
1
2
fM=2.0 Hz
Time, s
-Cp
0 0.01 0.02 0.03 0.04
0
1
2
fM=25.0 Hz
Time, s
-Cp
0 0.05 0.1 0.15
0
1
2
fM=5.0 Hz
(a) TE pressure fluctuations.
Time, s
CL,balance
0 0.05 0.1 0.15 0.2 0.25 0.3 0.35 0.4 0.45 0.5
1
2fM=2.0 Hz
Time, s
CL,balance
0 0.05 0.1 0.15
1
2fM=5.0 Hz
Time, s
CL,balance
0 0.01 0.02 0.03 0.04
1
2fM=25.0 Hz
(b) Balance CL.
Figure 13. TE Cp and balance CL time histories illustrating response of δf = 20 flowfield to burst modeexcitation. Rec = 0.25x10⁶, α = 6. The arrows indicate time when excitation switched off.
V. Summary
As part of a series of planned wind tunnel experiments aimed at examining the flow physics of activeseparation control, periodic excitation was applied at the flap shoulder of a NACA 0015 airfoil and the effectsof amplitude and frequency were examined. The primary objective of the experiment was to compare theresults obtained using a 5-component strain gage balance to those obtained by integrating surface pressures.The research is performed in preparation for additional three-dimensional testing of the model where thebalance measurements will complement the pressure measurements. We focused on controlling separationon the trailing edge flap at an angle of attack of α = 6. This angle was chosen because the degree of adversepressure gradient on the flap required oscillatory momentum coefficients (Cµ) greater than 1% to completelyattach the flow to the surface of the deflected flap. The model, previously used for three-dimensional testing,has several rows of streamwise pressures that were used to compute lift and drag and compare to the balancemeasurements. There was good agreement between the lift values of the two measurement techniques. Twodimensional high speed Particle Image Velocimetry (PIV) data were also presented and provided insight
16 of 18
American Institute of Aeronautics and Astronautics

(a) t=0.0 s, F+M = 0.014. (b) t=0.0 s, F+
M = 0.035. (c) t=0.0 s, F+M = 0.18.
(d) t=0.063 s, F+M = 0.014. (e) t=0.025 s, F+
M = 0.035. (f) t=0.005 s, F+M = 0.18.
(g) t=0.250 s, F+M = 0.014. (h) t=0.10 s, F+
M = 0.035. (i) t=0.02 s, F+M = 0.18.
(j) t=0.31 s, F+M = 0.014. (k) t=0.125 s, F+
M = 0.035. (l) t=0.025 s, F+M = 0.18.
(m) t=0.438 s, F+M = 0.014. (n) t=0.175 s, F+
M = 0.035. (o) t=0.035 s, F+M = 0.18.
Figure 14. Vorticity contours illustrating response of δf = 20 flowfield to burst mode excitation. Rec =0.25x10⁶, α = 6. 17 of 18
American Institute of Aeronautics and Astronautics

into the interaction of the perturbations introduced at the flap shoulder with the separating shear layer forflap deflection angles (δf ) of 20 and 40. The surface pressure data and PIV data will aid in determiningthe appropriate location and type of actuation to add to the existing actuators available for controllingseparation on the trailing edge flap of the model. Preliminary results presented of the transients associatedwith separation and attachment of the flow to the trailing edge flap will be useful for upcoming closed-loopcontrol active separation control research.
Acknowledgments
The authors would like to thank the Subsonic Fixed Wing program for funding the research and the followingindividuals for their support Anthony Washburn, Catherine McGinley, Norman Schaeffler, Steve Wilkinson,Greg Jones, Luther Jenkins, Charlie Debro, and Marie Lane.
References
1Seifert, A., Darabi, A., and Wygnanski, I., “On the Delay of Airfoil Stall by Periodic Excitation,” Journal of Aircraft , Vol. 33,No. 4, 1996, pp. 691–699.2Seifert, A. and Pack, L. G., “Oscillatory Control of Separation at High Reynolds Numbers,” AIAA Journal , Vol. 37, No. 9,
1999, pp. 1062–1071.3Greenblatt, D. and Wygnanski, I., “The Control of Flow Separation by Periodic Excitation,” Progress in Aerospace Sciences,
Vol. 36, 2004, pp. 487–545.4Seifert, A., Greenblatt, D., and Wygnanski, I., “Active Separation Control: an Overview of Reynolds and Mach Number
Effects,” Aerospace Science and Technology, Vol. 8, 2004, pp. 569–582.5Melton, L. P., Yao, C. S., and Seifert, A., “Application of Excitation from Multiple Locations on a Simplified High-Lift
System,” AIAA Paper 2004–2324, June 2004.6Melton, L. P., Schaeffler, N. W., and Lin, J. C., “High-Lift System for a Supercritical Airfoil: Simplified by Active Flow
Control,” AIAA Paper 2007–0707, Jan. 2007.7Greenblatt, D., “Dual Location Separation Control on a Semispan Wing,” AIAA Journal , Vol. 45, No. 8, 2007, pp. 1848–1860.8Greenblatt, D. and Washburn, A., “Influence of Finite Span and Sweep on Active Flow Control Efficacy,” AIAA Journal ,
Vol. 46, No. 7, 2008, pp. 1675–1694.9Greenblatt, D., “Management of Vortices Trailing Flapped Wings via Separation Control,” AIAA Paper 2005–0061, Jan.
2005.10King, R. A. and Breuer, K. A., “Acoustic Receptivity of a Blasius Boundary Layer with 2-D and Oblique Surface Waviness,”AIAA Paper 2000–2538, June 2000.11Jones, G. S., Viken, S. A., Washburn, A. E., Jenkins, L. N., and Cagle, C. M., “An Active Flow Circulation Controlled FlapConcept for General Aviation Aircraft Applications,” AIAA Paper 2002–3157, June 2002.12Barlow, J. B., W. H. Rae, J., and Pope, A., Low Speed Wind Tunnel Testing, John Wiley and Son, 3rd ed., 1999.13Youngren, H., Kroninger, C., Chang, M., and Jameson, S., “Low Reynolds Number Testing of the AG38 Airfoil for theSAMARAI Nano Air Vehicle,” AIAA Paper 2008–417, Jan. 2008.14Coleman, H. W. and Steele, W. G., Experimentation and Uncertainty Analysis for Engineers, John Wiley and Son, 2nd ed.,1999.15Greenblatt, D., Nishri, B., Darabi, A., and Wygnanski, I., “Some Factors Affecting Stall Control with Particular Emphasison Dynamic Stall,” AIAA Paper 1999–3504, June 1999.16Melton, L. P., Yao, C., and Seifert, A., “Active Control of Separation from the Flap of a Supercritical Airfoil,” AIAA Journal ,Vol. 44, No. 1, 2006, pp. 34–41, previously AIAA paper 2003–4005.17Wygnanski, I., “The Variables Affecting the Control of Separation by Periodic Excitation,” AIAA Paper 2004–2505, June2004.18Seifert, A. and Pack, L. G., “Active Flow Separation Control on Wall-Mounted Hump at High Reynolds Numbers,” AIAAJournal , Vol. 40, No. 7, 2002, pp. 1363–1372.19Darabi, A. and Wygnanski, I., “Active Management of Naturally Separated Flow Over a Solid Surface. Part 1. The ForcedReattachment Process,” Journal of Fluid Mechanics, Vol. 510, 2004, pp. 105–129.20Darabi, A. and Wygnanski, I., “Active Management of Naturally Separated Flow Over a Solid Surface. Part 2. The SeparationProcess,” Journal of Fluid Mechanics, Vol. 510, 2004, pp. 131–144.
18 of 18
American Institute of Aeronautics and Astronautics